the Creative Commons Attribution 4.0 License.
the Creative Commons Attribution 4.0 License.
Long-term observation of midlatitude quasi 2-day waves by a water vapor radiometer
Klemens Hocke
Niklaus Kämpfer
A mesospheric water vapor data set obtained by the middle atmospheric water vapor radiometer (MIAWARA) close to Bern, Switzerland (46.88∘ N, 7.46∘ E) during October 2010 to September 2017 is investigated to study the long-term evolution and variability of quasi 2-day waves (Q2DWs). We present a climatological overview and an insight on the dynamical behavior of these waves with the occurring spectrum of periods as seen from a midlatitude observation site. Such a large and nearly continuous measurement data set as ours is rare and of high scientific value. The core results of our investigation indicate that the activity of the Q2DW manifests in burst-like events and is higher during winter months (November–February) than during summer months (May–August) for the altitude region of the mesosphere (up to 0.02 hPa in winter and up to 0.05 hPa in summer) accessible for the instrument. Single Q2DW events reach at most about 0.8 ppm in the H2O amplitudes. Further, monthly mean Q2DW amplitude spectra are presented and reveal a high-frequency variability between different months. A large fraction of identified Q2DW events (20 %) develop periods between 38 and 40 h. Further, we show the temporal evolution of monthly mean Q2DW oscillations continuously for all months and separated for single months over 7 years. The analysis of autobicoherence spectra gives evidence that Q2DWs are sometimes phase coupled to diurnal oscillations to a high degree and to waves with a period close to 18 h.
- Article
(13629 KB) - Full-text XML
- BibTeX
- EndNote
The middle atmosphere is the part of Earth's atmosphere that extends from about 10 to 110 km of altitude. The upper part (60–110 km) is referred to as the MLT (mesosphere lower thermosphere), which is dominated by the interplay of atmospheric waves, including tides and gravity and planetary waves. Important source regions for atmospheric waves seen in the MLT are often found lower in the atmosphere. With decreasing pressure and air density, upward-propagating waves are forced to increase their amplitudes (Andrews et al., 1987). This increase in amplitudes can lead to wave breaking and the deposition of momentum, which in turn supplies the driving force for large-scale residual circulations like the Brewer–Dobson circulation (Brewer, 1949; Dobson, 1956). Besides the diurnal and semi-diurnal waves, the quasi 2-day wave (Q2DW) is among the strongest wave phenomena within the middle atmosphere. Quasi 2-day waves originate primarily from baroclinic instabilities, which can be found in the vicinity of jet streams such as the summertime mesospheric easterly jet. Many studies indicate that these atmospheric regions produce fast-emerging instabilities coupling to the zonal wave number 3 global Rossby gravity mode (Salby, 1981; Lieberman, 1999; Rojas and Norton, 2007). Q2DW structures in middle atmospheric temperature observations were first discovered by Rodgers and Prata (1981). Before that time quasi 2-day oscillations were only found in wind data at meteor heights (Muller and Nelson, 1978; Salby and Roper, 1980). Q2DWs manifest not only in wind or temperature fields. Teitelbaum et al. (1981) analyzed one of the first observations of 2-day planetary wave signatures in atmospheric airglow. A recent numerical GCM (general circulation model) investigation by Egito et al. (2017) brought new insights on the planetary-wave-induced airglow variability in the mesosphere and lower thermosphere. In regard to the 2-day variability, prominent oscillations were found in this simulation during summer at a northern hemispheric midlatitude (43∘ N, 143∘ E). Usually the Q2DW gets amplified in temporal proximity to the solstices (Wu et al., 1996). For the Northern Hemisphere (NH) the months July and August (after summer solstice) are favored to build up strong Q2DW signs in the MLT. One reason is likely associated with a strengthening of the summer easterly jet in the extratropical upper mesosphere, favoring a nonlinear interaction with the migrating diurnal tide (McCormack et al., 2010). The mesospheric easterly jet itself undergoes a not insignificant variability throughout the years, mainly due to the variation of gravity wave activity as reported in Ern et al. (2013). These circumstances imply the overall complex interactions related to Q2DW activity.
The Q2DW has been studied for decades via ground-based and space-borne observations (e.g., Lima et al., 2004; Limpasuvan et al., 2005; Tunbridge et al., 2011; Gu et al., 2013). All of these techniques have their individual advantages and disadvantages. Analysis from satellites is required to get a global view of Q2DW activity. Compared with ground-based techniques the temporal resolution of local observations is poor for satellites. To perform long-term studies of, e.g., the interannual variability of the Q2DW, ground-based measurement sites can provide an excellent source of data. Moreover a high temporal resolution offers the possibility of investigating nonlinear wave–wave interactions between Q2DW and atmospheric waves with even shorter periods, like diurnal or semi-diurnal tides (Pancheva, 2001; Kumar et al., 2008; Guharay et al., 2015). Both observation types, global and local, complement each other and are required to study the Q2DW in all its facets within the Earth's atmosphere.
One main temporal feature of the quasi 2-day wave is its appearance in burst-like events, meaning that the amplitude strength is highly discontinuous in time. As shown in other studies (Harris and Vincent, 1993; McCormack et al., 2014; Tschanz and Kämpfer, 2015) and in our presented results (Sect. 3), the Q2DW signatures can manifest in a high degree of interannual as well as intra-seasonal variability.
Apart from wind measurements as a proxy for dynamical patterns in the middle atmosphere, it is common to use dynamical tracer observations such as water vapor. In the mesosphere H2O is photochemically stable for weeks (Brasseur and Solomon, 2006) and this circumstance is used to investigate middle atmospheric wave dynamics from ground-based observations (Scheiben et al., 2014; Tschanz and Kämpfer, 2015; Lainer et al., 2016, 2017). In this study we present quite continuous observations of the Q2DW signature in middle atmospheric water vapor for 7 years (84 months) by the middle atmospheric water vapor radiometer MIAWARA at Bern–Zimmerwald (46.88∘ N, 7.46∘ E). Such investigations, especially from passive remote sensing observations in the midlatitudes, are rare and will provide new insights on Q2DW variability at mesospheric altitudes. Section 2 is dedicated to water vapor radiometric measurements in the middle atmosphere and the corresponding millimeter wave radiometer MIAWARA. Further, the H2O data set of MIAWARA underlaying this study is presented. Section 3 focuses on the most important results and observed features of the Q2DW above the location of Bern. In particular, we put the focus on three subareas that include climatological features such as averaged monthly mean Q2DW amplitudes, temporal evolution and observed variability, and some explored features indicating nonlinear wave–wave interactions based on an autobicoherence analysis. A conclusion is given in Sect. 4.
Ground-based microwave radiometry offers a technique to continuously measure the amount of atmospheric trace gases, such as water vapor, at altitudes between roughly 30 and 80 km under most environmental conditions. Measurements are possible during day, night and under cloudy conditions. As demonstrated by Kämpfer et al. (2012), microwave radiometry is widely used to study the middle atmosphere.
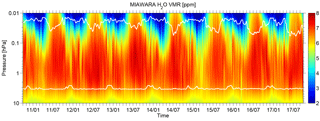
Figure 1Water vapor volume mixing ratio (ppm) time series as measured by the MIAWARA microwave radiometer between October 2010 and September 2017. The horizontal white lines indicate at which pressure levels the measurement response drops below 50 %. Clearly seen is the annual cycle in the mesosphere with an H2O maximum in summer. The measurement response is affected by tropospheric opacity, which is higher in summer and leads to the observed variation in time.
The middle atmospheric water vapor radiometer MIAWARA was built in 2002 at the University of Bern (Deuber et al., 2004). The front end of the radiometer receives emissions from the pressure-broadened rotational transition line of the H2O molecule at the center frequency of 22.235 GHz. The retrieval of water vapor from the integrated raw spectra is based on the optimal estimation method (OEM) as presented in Rodgers (2000). We use the ARTS/QPACK software (Eriksson et al., 2005, 2011), with which OEM is used to perform the inversion of the atmospheric radiative transfer model ARTS. A fast Fourier transform (FFT) spectrometer analyses the received microwave signals. The FFT has a spectral resolution of 60 kHz and the retrieval makes use of an overall spectrum bandwidth of 80 MHz around the center frequency. A monthly mean zonal mean Aura MLS climatology provides the a priori water vapor profile and additionally Aura MLS is used to set the pressure, temperature and geopotential height in the retrieval part. MIAWARA is part of NDACC (Network for the Detection of Atmospheric Composition Change) and has been continuously probing middle atmospheric H2O from the Atmospheric Remote Sensing observatory in Zimmerwald (46.88∘ N, 7.46∘ E; 907 m a.s.l.) close to Bern since 2006. In the stratosphere the vertical resolution of the water vapor profiles is 11 km and degrades to about 14 km in the mesosphere (Deuber et al., 2005). Due to the mediocre vertical resolution of the MIAWARA radiometer quantitative conclusions on the vertical Q2DW structure are avoided.
A recent validation against the Aura MLS v4.2 water vapor product (Livesey et al., 2015) revealed that for most months and altitudes the relative differences between MIAWARA and Aura MLS are below 5 % (Lainer et al., 2016). The MIAWARA water vapor data set used during this study has a temporal resolution of 6 h. This is useful to study not only the Q2DW but also possible interactions with waves of shorter periods like tides. Compared to an even higher temporally resolved H2O data set like the one used in Lainer et al. (2017) with a 3 h time interval, the 6 h interval ensures usability also during summer when the measurement sensitivity is lower.
The MIAWARA H2O time series between October 2010 and September 2017 is shown in Fig. 1. The corresponding measurement response of 50 % is marked by the white horizontal lines and represents a typical value up to which the data can be considered as reliable in regard to the sensitivity to the a priori profile. The measurement response can be obtained from the averaging kernel matrix of the retrieval (Rodgers, 2000). Based on the variability of the measurement response, we consider different upper measurement limits between the pressure level range of 0.02 and 0.05 hPa dependent on the actual month for the whole H2O data set of 7 years. The approach of the numerical data analyses is explained in the upcoming section.
The spectral decomposition of the water vapor measurement time series uses a wavelet-like approach as explained in Studer et al. (2012). In particular, a digital band-pass filter (non-recursive finite impulse response) with a Hamming window with a size 3 times the central period setting (35–65 h) is applied to the data time series. The H2O measurements of each retrieval pressure level are handled as distinct data time series. The application of a windowing method to individual measurement time series ensures that the data end points fit together. Thus a smoothing out of short-term data fluctuations is characteristic and ensures a good mapping of oscillations with longer periods. Overall the spectral leakage can be reduced by using numerical windowing methods (Harris, 1978). We define the absolute amplitude of the wave as the peak-to-peak filtered signal and the relative amplitude as relative to the time-averaged amount of water vapor measured at the respective pressure level.
A long-term investigation of Q2DWs was done by Huang et al. (2013), who analyzed the behavior of summertime quasi 2-day waves between 2002 and 2011 in the upper mesosphere in the temperature data set of the TIMED/SABER satellite instrument. A Q2DW lifetime evolution by different stages (growing, maturation and attenuation phase) has been proposed. Key results indicated that the average Q2DW amplitudes are almost twice as large in the Southern Hemisphere than in the Northern Hemisphere. The predominant modes are westward propagating with zonal wave numbers 3 and 4. However, no wintertime analyses of quasi 2-day wave activity have been shown by Huang et al. (2013).
Beyond observations of summertime Q2DWs, high Q2DW activity near winter solstices has occasionally been reported from high-latitude observations (Nozawa et al., 2003; Tunbridge and Mitchell, 2009; Tschanz and Kämpfer, 2015). A recent study by Madhavi et al. (2015) analyzed COSMIC (Constellation Observing System for Meteorology, Ionosphere, and Climate) GPS RO (Radio Occultation) measurements at middle and high latitudes in regard to the seasonal, latitudinal and interannual variability of the westward-propagating Q2DW in temperature fields. They found pronounced oscillations with monthly mean amplitudes up to about 8 K during NH fall and winter in the altitude range 20–60 km. It is of particular interest to investigate Q2DWs observations through the whole year. Scientific reports about Q2DW activity at midlatitudes in both winter and summer mesospheric conditions are sparse and our study contributes with such observations.
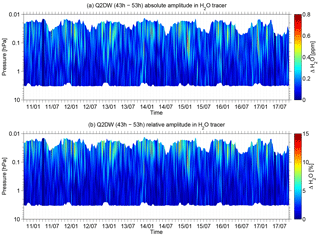
Figure 2Evolution of absolute (a) and relative (b) Q2DW amplitude in water vapor data from the middle atmospheric water vapor radiometer MIAWARA in the time period from 1 October 2010 to 30 September 2017. The data product is shown in the altitude region where it can be regarded as reliable according to Fig. 1.
The amplitude analysis of the Q2DW in the period range 43–53 h of our H2O data set is shown in Fig. 2. The plot is only drawn for the H2O data considered as reliable by means of measurement response values greater than 50 %. Both the absolute and relative Q2DW amplitudes are shown. From the overall view, the Q2DW activity is stronger above 52 km (0.5 hPa) of altitude than below and shows a highly developed temporal variability. Nevertheless, a regular yearly cycle of the 2-day oscillation signatures in water vapor, which is a recurring feature over the 7 investigated years, can be identified. For the location of Bern there is a clear observable enhancement of Q2DW activity during winter. During the summer months we find also Q2DWs but not as pronounced as during winter. This might be related to the lower measurement limit of the H2O radiometer in summer (see Fig. 1). The typical altitudes at which the W3 or W4 Q2DW summer activity maximizes at midlatitudes (like Bern) are above 80 km (McCormack et al., 2014), at which our instrument is not capable of retrieving information.
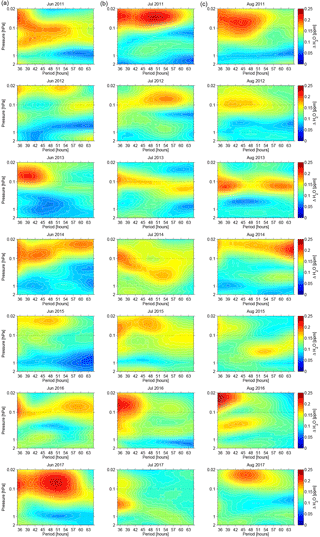
Figure 3Monthly averaged water vapor wave amplitude spectra with periods between 35 and 65 h in units of ppm. Presented are the months June (a), July (b) and August (c) for the years from 2011 to 2017.
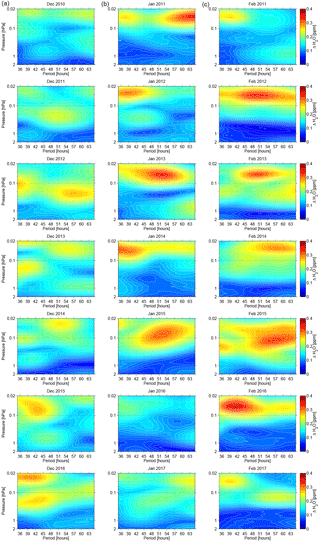
Figure 4Same representation as in Fig. 4, but for the months December (a), January (b) and February (c) between 2010 and 2016 and between 2011 and 2017.
The appearance of the Q2DW can be described as burst-like events that rapidly emerge. The highest amplitude in our data set reached 0.8 ppm (14.4 %) in late January 2015 (around 25 January 2015), peaking at around 0.1 hPa, and could be related to a minor sudden stratospheric warming (SSW) event in early January. Manney et al. (2015) reported about this event, which had a large impact on transport and the chemical composition of the lower stratosphere in the following weeks and months. Another recurring feature of the wintertime Q2DW over Bern is not only the prevailing high amplitudes in the upper mesosphere but also an activity across all altitude levels down to the stratopause level (1–2 hPa). Another event with Q2DW amplitudes as high as 0.77 ppm (14.6 %) took place at the end of November 2016 at pressure levels above 0.1 hPa. As it can be seen in Fig. 2, Q2DWs are not very persistent in time and single burst-like events only last for a couple of days to 2 weeks at most. From local profile observations of water vapor alone, the direction of wave propagation, horizontal and vertical wavelengths, and zonal wave numbers cannot be derived. Therefore, additional simultaneous measurements of at least meridional and zonal wind would be required. An excellent possibility in regard to deriving such information is global reanalysis models.
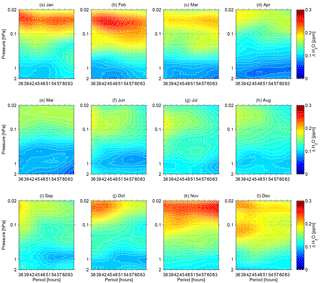
Figure 5Monthly climatology (January to December, a–l) of wave amplitude spectra for periods between 35 and 65 h over a period of 7 years derived from MIAWARA H2O data. The covered altitude range in terms of pressure levels goes from 2 to 0.01 hPa.
Pancheva et al. (2016) looked into the global distribution and variability of the Q2DW in the NOGAPS–ALPHA (Navy Operational Global Atmospheric Prediction System–Advanced Level Physics with High Altitude) reanalysis model. At middle and high latitudes two different types of waves could be identified: (1) eastward-traveling waves with zonal wave numbers 2 and 3 (E2, E3) during winter time and (2) westward-traveling waves with zonal wave numbers 2, 3 and 4 (W2, W3, W4) predominantly during the summer months. The same model system was recently used to study a nonlinear interaction between the migrating diurnal tide and the W2–W3 waves (Lieberman et al., 2017). The outcome of this interplay of wave forces is split into a westward-traveling wave component W4 with a period of around 16 h and an eastward-traveling wave component E2 with a period of 2 days. The W4 wave shows the largest amplitudes in the midlatitude winter mesosphere and reminds one of an inertia-gravity wave in its behavior. We reported about possible W4 wave observations with a period close to 18 h in one of our previous papers (Lainer et al., 2017). In Sect. 3.3 we show four examples of autobicoherence spectra calculated from 2 months of MIAWARA H2O data. With this approach we intend to reveal nonlinear wave–wave couplings and show the complexity of middle atmospheric water vapor dynamics.
3.1 Monthly climatological overview
The spectral decomposition of 7 years of mesospheric H2O offers a climatological view of Q2DW activity. Overall 84 months are available to calculate monthly mean wave spectra. Some of those are presented in Figs. 3 and 4. For simplicity, we only present 21 plots per figure focusing on three winter months (December, January, February) and summer months (June, July, August), which gives in total 42 monthly mean wave spectra of Q2DW amplitudes within the period range 35–65 h. By comparing Figs. 3 and 4 it is important to take note of the different color bar scales. During the summer months the monthly mean water vapor amplitude maxima do not exceed 0.2–0.25 ppm, but during the winter months these values can be higher by 0.1 ppm (∼50 %).
Overall, a high variability of Q2DW periods from one month to another and from year to year is found for the three summer and winter months. By comparing December, January and February a preference for stronger quasi 2-day wave amplitudes can be attributed to January and February, except for the year 2017. The selected summer months (June, July and August) show an indifferent situation with no obvious preference for stronger Q2DW activity. Relatively strong events occurred in July and August 2011, June 2013 and June 2017. The H2O amplitudes exceeded 0.2 ppm and the central periods of maximal Q2DW mean amplitudes are found between 38 and 50 h. In several Januaries and Februaries between 2010–2011 and 2016–2017 mean Q2DW amplitudes manifest in much higher values above 0.3 ppm (February 2012, January 2013, February 2013 and February 2016) with periods between 40 and 52 h. The altitude region where the highest Q2DW amplitudes can be found in all investigated months is somewhere above the stratopause level (1 hPa). Some monthly averaged H2O Q2DW spectra have an interesting feature. At a certain altitude range two different period modes of Q2DWs with rather low (close to 36 h) and high (higher than 60 h) periods are present. Examples in Fig. 3 include August 2013, July 2014 and June 2016. In Fig. 4 such a feature is observable (on a monthly perspective) in January 2011, December 2012 and February 2017. Wave periods close to 36 h (harmonics of the semi-diurnal tide) are not considered to be within the Q2DW spectrum. The same pertains to wave periods beyond 64 h, for which an influence of ultrafast Kelvin waves with periods in the range 3–5 days (England et al., 2012) cannot be excluded. In our data analysis a clear 3-day wave signature is seen, for example in November 2010 and 2011.
Averaging Q2DW spectra over all seven Januaries (Fig. 5a), for instance, leads to a similar signature of high amplitudes at the lower and upper branch of Q2DW periods at 0.03–0.04 hPa. Figure 5 clearly shows independently on a certain period band like for Fig. 2, in which the Q2DW was constraint to 43–53 h, that for a typical midlatitude observation site as Bern strong quasi 2-day oscillations preferably develop during winter months (October to March) rather then summer months (April to September). The most sharp and distinct Q2DW periods are found during February, October and to some extent also December (Fig. 5b, j and l), meaning that the frequency variability of the wave oscillations is much lower than, for example, during January, March or November when a horizontal amplitude band indicates a quite high variability (Fig. 5a, c and k). The climatology for December (Fig. 5l) reveals it as the only month with two peaks of quasi 2-day wave activity at different altitude regions (0.02–0.03 and 0.1–0.2 hPa) with periods near 38 h. December 2016 has an especially pronounced Q2DW signature as seen in the first subplot of the last row in Fig. 4. The vertical distance between the two-wave maxima is about 11 km and the structure could be related to the vertical propagation of planetary waves, which is what Q2DWs are. The derivation of wave propagation characteristics would require additional observations of wind or the study of model data that could represent the dynamics of water vapor as we observe it with our instrument. From Fig. 5 we get the core message of when it is most likely to see strong Q2DW activity up to altitudes of 70 km and 0.05 hpa (summer) and 75 km and 0.02 hPa (winter), and this could be relevant to other measurement campaigns aiming at measuring quasi 2-day wave oscillations in the midlatitude MLT.
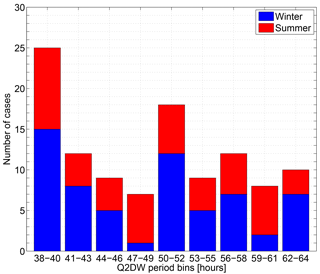
Figure 6Histogram of Q2DW periods observed with the MIAWARA water vapor radiometer. Shown are the number of cases versus period bins with 3 h width in which Q2DW events could be identified. The selected criterion of a Q2DW event was a localized maximum in a monthly averaged H2O wave spectrum exceeding 0.15 ppm. The bar plots are stacked, which divides them into winter (blue) and summer (red) groups.
A view from a different perspective can be obtained with the histogram plot provided in Fig. 6. There the periods of localized primary and secondary Q2DW events (observed in a monthly mean wave spectrum, as in Figs. 3 and 4) are binned and color separated by season. Summer is shown in red and winter in blue bars. A primary Q2DW is characterized in our definition as the wave with the strongest amplitude in the altitude versus period wave spectrum. In addition, one or more secondary Q2DWs can be present with different periods and/or occurrence at other pressure levels. Both primary and secondary Q2DWs have to exceed 0.15 ppm to enter the histogram statistics. The pressure range at which the amplitude peaks are valid is set between 0.02 and 2 hPa. The classical 2-day wave periods (50–52 h) occur in 18 cases out of 110 and show a predominance during winter. The largest amount of Q2DWs have periods in the range 38–40 h (15 in winter, 10 in summer). In total about 20 % of all 110 identified Q2DWs fall into the first bin. Regarding the normal Rossby wave mode W3 with central periods between 50 and 52 h (Tunbridge et al., 2011) we find a corresponding local maximum of events. The remaining wave periods are ambiguously spread between summer and winter months.
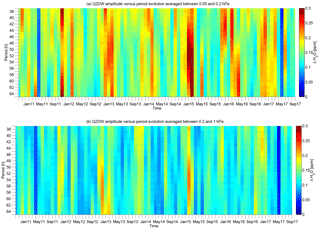
Figure 7Matrix plots of the temporal evolution of monthly mean Q2DW amplitudes in units of ppm with a dependency on the period (38–64 h). The top plot shows the pressure-layer-averaged wave amplitudes between 0.05 and 0.2 hPa, while the bottom plot shows those between 0.2 and 1 hPa.
Gu et al. (2013) analyzed the Q2DW behavior (for January and July in 16 years) in the zonal and meridional wind obtained from the medium-frequency radar at Kauai (Hawaii; 22∘ N, 160∘ W). For January they find most Q2DW periods at 48 h in the case of the meridional wind or 48 and 51 h in the case of the zonal wind. Below 42 and above 54 h no periods were detected that could be attributed to a Q2DW. A slight displacement towards shorter periods in July is recognizable in their histogram data. Most wind oscillations have either 46 h (meridional) or 43 h (zonal) periods.
Afterwards (Sect. 3.2) we restrict the analyses to pressure-layer-averaged data products and focus more specifically on the monthly mean temporal development of Q2DWs for the whole studied time period of 84 months (7 years) in the resolved period spectrum between 38 and 64 h.
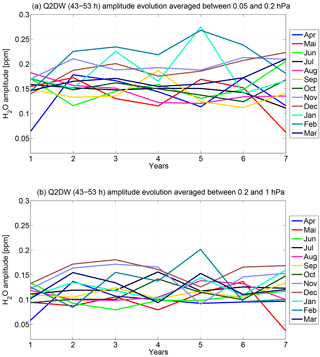
Figure 8Monthly breakdown of Q2DW (43–53 h) amplitude development over the 7 investigated years. The H2O pressure-layer-averaged amplitudes are 0.05–0.2 hPa (a) and 0.2–1 hPa (b). The years range depending on the month from either 2010 to 2016 (October to December) or from 2011 to 2017 (January to September).
3.2 Temporal evolution and variability
From the histogram plot (Fig. 6) we got an overview of the distribution of Q2DW periods in which the H2O amplitudes peaked. However, it is not less interesting to see how the Q2DW periods evolve in time. In order to emphasize the temporal development we came up with an amplitude matrix plot (Fig. 7) presenting Q2DW period versus time on monthly steps. For both sub-figures different pressure layers are defined in which the monthly mean Q2DW amplitudes are further averaged. Figure 7a represents the pressure layer from 0.05–0.2 hPa, whereas Fig. 7b covers the data from 0.2–1 hPa. The layer depths in terms of spatial dimensions are 9.6 km and 11.2 km. In both pressure layers a yearly cycle of enhanced quasi 2-day oscillations of various periods is apparent. The two plots complement the analysis provided with Fig. 2 in which only the mean Q2DW (43–53 h) evolution is shown. Now we focus on the hourly resolved monthly mean amplitude of the respective Q2DW frequency. Higher amplitudes are found towards shorter periods in the summer months in the upper pressure layer, which is consistent with Fig. 6. In general the upper pressure layer is the one in which the Q2DW oscillations are more pronounced. Occasionally, the lower pressure layer shows monthly mean H2O amplitudes slightly higher than 0.2 ppm (December 2012, February 2015), but values as high as 0.3 ppm never arise as they do at the higher investigated pressure layer. The wintertime maxima of mean amplitudes has a quite high-frequency variability. The strongest events exhibit periods above 50 h (January and February 2015) in the upper mesosphere (Fig. 7a). The two blue columns (May 2011 and May 2017) in each plot are the consequence of larger measurement gaps in the MIAWARA instrument.
The last graphical display (Fig. 8) of this section highlights the temporal development of monthly averaged Q2DW amplitudes (43–53 h) separately for each month of the year. This results in seven data points per month according to the length of the data set, which is 7 years. The months are distinguished by the given color code. A pressure layer averaging is applied in agreement with the data presented in Fig. 7. January and February 2015 reveal the highest amplitudes of the 43–53 h quasi 2-day wave within our water vapor data set. The amplitudes reach values around 0.27 ppm in the upper mesospheric pressure layer. These high monthly means could be related to SSW dynamics and an enhanced gravity wave activity. Another possibility could be a signature of the maximum phase of the 11-year solar cycle 24. For example, Gu et al. (2013) showed that the January Q2DW in zonal and meridional wind has an in-phase behavior related to the solar irradiance with a leading solar maximum of about 1 year. In the region above the stratopause (lower mesosphere) only February 2015 shows a significant peak related to the surrounding years (Fig. 8b). We find no clear trend in the temporal evolution of Q2DW activity within the two pressure layers. As was the outcome before, the winter months tend to have the highest monthly mean quasi 2-day wave H2O amplitudes and all months indicate higher Q2DW activity in the upper investigated pressure layer between 0.05 and 0.2 hPa.
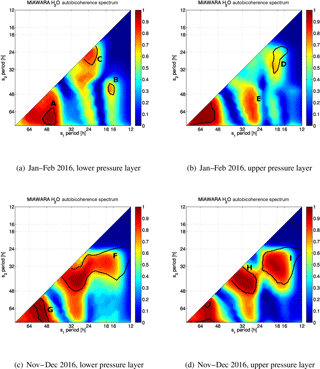
Figure 9Wavelet-based autobicoherence spectrum from pressure-layer-averaged MIAWARA water vapor time series with individual lengths of 2 months. The chosen pressure layers are 0.05–0.2 and 0.2–1 hPa. Thick contours enclose regions of 80 % point-wise confidence after controlling the FDR (false detection rate). The diagonal line separates the two-dimensional spectrum into two symmetric regions. Interesting features on the plots are labeled with capital letters (A–H).
3.3 Autobicoherence analysis
With a bicoherence analysis a wave coupling between two or three waves can be determined. The degree of local quadratic nonlinearity gets high when the phase between the waves at periods s1 and s2 (two-wave example) is nearly constant over a significant number of realizations. A two-wave bicoherence analysis is used to estimate the contribution of second-order nonlinearities to the power of the two frequencies (bifrequencies) and periods.
In a two-dimensional bicoherence graph as presented in Fig. 9 one usually finds two types of structures: localized point-like or elongated line-like areas stretching over a bunch of frequencies. The first ones indicate sharply defined and locked frequencies, while the latter are likely due to a single frequency mode interacting with a broader range of different frequencies (van Milligen et al., 1995). The peaks in general represent the phase coupling between different wave periods. A significant peak located near the diagonal slice of the spectrum indicates a phase coupling of the primary frequency mode with its harmonic. Monte Carlo simulations are used to find regions of normalized wavelet power in the autobicoherence spectrum that are significant with respect to a selected confidence interval. In our case a confidence interval of 80 % is applied with a total number of 100 iterations within the Monte Carlo simulations. An in-depth view on the methodical and computational details of the autobicoherence analysis is given in Schulte (2016) and Grinsted et al. (2004).
Figure 9 presents four autobicoherence spectra from 2 months of pressure-layer-averaged MIAWARA water vapor time series. Figure 9a and b focus on January and February 2016, while Fig. 9c and d show results for November and December 2016. In the case of January and February 2016 significant phase coupling can be found between a quasi 18 h (16–18 h) wave and the Q2DW with a period slightly below 48 h (Fig. 9a, label B) in the lower pressure layer and a coupling of 18 h oscillations to diurnal periodicities in the upper pressure layer (Fig. 9b, label D). Between 0.2 and 1 hPa the diurnal tide is to a high degree (power: 0.8) phase coupled to the semi-diurnal tide (12 h period), as the red area at coordinate point (24, 24) shows (Fig. 9a, label C). In the upper mesosphere this tidal wave behavior is lost, but here a tidal period s1 manifests in a line-like area across s2 periods (not significant within the 80 % confidence interval) in the Q2DW period range below 48 to above 64 h (Fig. 9b, label E). In Fig. 9a the highest wavelet power (label A) is found at coordinates (48, >64) and could be related to an interference of the Q2DW with the quasi 18 h wave, which itself is likely to originate from a nonlinear wave–wave coupling between the diurnal tide and the westward-traveling quasi 2-day wave (W2) (Lieberman et al., 2017). A recent study by Lainer et al. (2016) revealed dominant oscillations in mesospheric water vapor profiles with a period close to 18 h in Northern Hemispheric winter months. However, such oscillations within a sub-diurnal period spectrum in the MLT can also be related to low-frequency inertia-gravity waves, as shown by Li et al. (2007) with measurements from a sodium lidar system over Fort Collins, Colorado (41∘ N, 105∘ W).
The MIAWARA autobicoherence spectra for November and December show for both altitude regions similar quadratic phase coupling signatures. High common wavelet power is found between 18 and 32 h (Fig. 9c and d, labels F and I). The red spot (label H) at coordinate (32, 32) also indicates a coupling between the harmonic of the 32 h oscillations and the primary frequency. At s1 Q2DW periods have a significant phase coupling to even longer periods (up to 80 h) as can be seen in Fig. 9c near label G. Even though we only made use of a single mesospheric H2O data set, atmospheric wave patterns and interactions can be studied. Evidence was found that wave–wave interactions between Q2DWs, diurnal tides and quasi 18 h waves occur in the winter midlatitude mesosphere shown by high nonlinear phase couplings in the autobicoherence spectra of MIAWARA H2O data.
The study of quasi 2-day planetary waves in the MLT is of importance to improve the understanding of the Earth's atmosphere. The dissipation of atmospheric waves in the MLT induces rapid changes to the background dynamics, which in turn affects the composition of the atmosphere through turbulent mixing or the general alternating of the circulation. This Q2DW-driven variability can be seen in long-living trace gases like water vapor.
The MIAWARA radiometer has provided reliable, long-term observations of middle atmospheric water vapor since 2007. Here we made use of data since October 2010 right after the instrument was essentially improved by a hardware update resulting in shorter integration times of the 22 GHz H2O spectra and thus a higher temporal resolution. A temporal data resolution of 6 h was the starting point for the long-term analyses of Q2DW activity above the stratopause up to an altitude of 75 km (0.02 hPa) during winter and 70 km (0.05 hPa) during summer months when the increase in atmospheric opacity reduces the upper measurement limit.
Our key results regarding the long-term Q2DW behavior above the midlatitude observation site at Bern are briefly summarized.
-
Q2DW (43–53 h) activity as observed by MIAWARA H2O profiles is strongest in the upper mesosphere and during winter months; it emerges in burst-like events. We note the altitude limitation of the MIAWARA instrument during summer, which is limited to about 70 km.
-
The highest individual Q2DW amplitudes reach 0.8 ppm and are likely related to SSW activity.
-
Monthly mean Q2DW amplitude spectra show a broad variability of periods between 38 and 64 h.
-
A monthly climatological overview for 7 years indicates that in January, February and November the amplitude peaks of Q2DWs are highest (up to 0.3 ppm) in the observed altitude region.
-
A significant fraction (about 20 %) of observed Q2DW events in summer and winter manifest periods between 38 and 40 h.
-
The evolution of different Q2DW periods (monthly average) over 84 months revealed a yearly signature of enhanced wave activity during winter months.
-
Nonlinear quadratic phase coupling is detected between Q2DW, diurnal and quasi 18 h H2O oscillations.
In this study we refrained from a comparison between our results and model data like ECMWF because there is a well-known large dry model bias within the stratosphere and mesosphere. For instance, during the LAUTLOS campaign in the arctic a relative bias between the ECMWF analysis and FLASH-B Lyman–Alpha hygrometer measurements of up to 20 % was detected in the lower stratosphere (Maturilli et al., 2006). However, a future study could use other model parameters like temperature to analyze Q2DW behavior in regard to our H2O-based results or other results from ground-based observation methods like radar observations (Lilienthal and Jacobi, 2015).
We showed that measurements from ground-based microwave radiometers can be used to assess the quasi 2-day wave activity at local observation sites. Even if data sets from satellite measurement platforms like Aura MLS (operational since July 2004) can provide a global perspective of Q2DWs (Pancheva et al., 2018), observations from the ground can be used for validation purposes and more importantly for long-term monitoring of wave activity. In the case of Q2DWs they can capture the interaction with shorter periodical waves like tides or semi-diurnal oscillations, which cannot be resolved by Aura MLS because it is a sun-synchronized satellite.
Data from the ground-based microwave radiometer MIAWARA are publicly available from the NDACC database as monthly files with a diurnal temporal resolution (ftp://ftp.cpc.ncep.noaa.gov/ndacc/station/bern, last access: August 2018). Data with a higher temporal resolution are only available upon request.
ML was responsible for the ground-based water vapor measurements, performed the data analysis and prepared the manuscript. KH designed the filter algorithm and contributed to the interpretation of the results. NK led the project group.
The authors declare that they have no conflict of interest.
This work is supported by Swiss National Science Foundation grant
200020-160048 and MeteoSwiss in the frame of the GAW project
“Fundamental GAW parameters measured by microwave
radiometry”. Further, we thank Aslak Grinsted for providing
wavelet coherence software
(http://www.glaciology.net/wavelet-coherence, last access: June 2018).
Edited by: Bernd Funke
Reviewed by: three anonymous referees
Andrews, D. G., Holton, J. R., and Leovy, C. B.: Middle atmosphere dynamics, 40, Academic press, San Diego, 1987. a
Brasseur, G. and Solomon, S.: Aeronomy of the Middle Atmosphere: Chemistry and Physics of the Stratosphere and Mesosphere, vol. 32, Springer, the Netherlands, 2006. a
Brewer, A. W.: Evidence for a world circulation provided by measurements of helium and water vapor distribution in the stratosphere, Q. J. Roy. Meteor. Soc., 75, 351–363, 1949. a
Deuber, B., Kämpfer, N., and Feist, D. G.: A new 22-GHz Radiometer for Middle Atmospheric Water Vapour Profile Measurements, IEEE T. Geosci. Remote, 42, 974–984, https://doi.org/10.1109/TGRS.2004.825581, 2004. a
Deuber, B., Haefele, A., Feist, D. G., Martin, L., Kämpfer, N., Nedoluha, G. E., Yushkov, V., Khaykin, S., Kivi, R., and Vomel, H.: Middle Atmospheric Water Vapour Radiometer – MIAWARA: Validation and first results of the LAUTLOS/WAVVAP campaign, J. Geophys. Res., 110, D13306, https://doi.org/10.1029/2004JD005543, 2005. a
Dobson, G. M. G.: Origin and distribution of polyatomic molecules in the atmosphere., Proc. R. Soc. Lon. Ser.-A., 236, 187–193, 1956. a
Egito, F., Takahashi, H., and Miyoshi, Y.: Effects of the planetary waves on the MLT airglow, Ann. Geophys., 35, 1023–1032, https://doi.org/10.5194/angeo-35-1023-2017, 2017. a
England, S. L., Liu, G., Zhou, Q., Immel, T. J., Kumar, K. K., and Ramkumar, G.: On the signature of the quasi-3-day wave in the thermosphere during the January 2010 URSI World Day Campaign, J. Geophys. Res.-Space Phys., 117, a06304, https://doi.org/10.1029/2012JA017558, 2012. a
Eriksson, P., Jiménez, C., and Buehler, S. A.: Qpack, a general tool for instrument simulation and retrieval work, J. Quant. Spectrosc. Ra., 91, 47–64, https://doi.org/10.1016/j.jqsrt.2004.05.050, 2005. a
Eriksson, P., Buehler, S., Davis, C., Emde, C., and Lemke, O.: ARTS, the atmospheric radiative transfer simulator, version 2, J. Quant. Spectrosc. Ra., 112, 1551–1558, https://doi.org/10.1016/j.jqsrt.2011.03.001, 2011. a
Ern, M., Preusse, P., Kalisch, S., Kaufmann, M., and Riese, M.: Role of gravity waves in the forcing of quasi two-day waves in the mesosphere: An observational study, J. Geophys. Res.-Atmos., 118, 3467–3485, https://doi.org/10.1029/2012JD018208, 2013. a
Grinsted, A., Moore, J. C., and Jevrejeva, S.: Application of the cross wavelet transform and wavelet coherence to geophysical time series, Nonlin. Processes Geophys., 11, 561–566, https://doi.org/10.5194/npg-11-561-2004, 2004. a
Gu, S.-Y., Li, T., Dou, X., Wang, N.-N., Riggin, D., and Fritts, D.: Long-term observations of the quasi two-day wave by Hawaii MF radar, J. Geophys. Res.-Space Phys., 118, 7886–7894, https://doi.org/10.1002/2013JA018858, 2013JA018858, 2013. a, b, c
Guharay, A., Batista, P., and Clemesha, B.: On the variability of the diurnal tide and coupling with planetary waves in the MLT over Cachoeira Paulista (22.7∘ S, 45∘ W), J. Atmos. Sol.-Terr. Phys., 133, 7–17, https://doi.org/10.1016/j.jastp.2015.07.016, 2015. a
Harris, F. J.: On the use of windows for harmonic analysis with the discrete Fourier transform, Proc. IEEE, 66, 51–83, https://doi.org/10.1109/PROC.1978.10837, 1978. a
Harris, T. J. and Vincent, R. A.: The quasi-two-day wave observed in the equatorial middle atmosphere, J. Geophys. Res.-Atmos., 98, 10481–10490, https://doi.org/10.1029/93JD00380, 1993. a
Huang, Y. Y., Zhang, S. D., Yi, F., Huang, C. M., Huang, K. M., Gan, Q., and Gong, Y.: Global climatological variability of quasi-two-day waves revealed by TIMED/SABER observations, Ann. Geophys., 31, 1061–1075, https://doi.org/10.5194/angeo-31-1061-2013, 2013. a, b
Kämpfer, N., Nedoluha, G., Haefele, A., and De Wachter, E.: Microwave Radiometry, vol. 10 of ISSI Scientific Report Series, Springer, New York, https://doi.org/10.1007/978-1-4614-3909-7, 2012. a
Kumar, K. K., Deepa, V., Antonita, T. M., and Ramkumar, G.: Meteor radar observations of short-term tidal variabilities in the low-latitude mesosphere-lower thermosphere: Evidence for nonlinear wave-wave interactions, J. Geophys. Res.-Atmos., 113, D16108, https://doi.org/10.1029/2007JD009610, 2008. a
Lainer, M., Hocke, K., and Kämpfer, N.: Variability of mesospheric water vapor above Bern in relation to the 27-day solar rotation cycle, J. Atmos. Sol.-Terr. Phy., 143–144, 71–87, https://doi.org/10.1016/j.jastp.2016.03.008, 2016. a, b, c
Lainer, M., Hocke, K., Rüfenacht, R., and Kämpfer, N.: Quasi 18 h wave activity in ground-based observed mesospheric H2O over Bern, Switzerland, Atmos. Chem. Phys., 17, 14905–14917, https://doi.org/10.5194/acp-17-14905-2017, 2017. a, b, c
Li, T., She, C.-Y., Liu, H.-L., Leblanc, T., and McDermid, I. S.: Sodium lidar-observed strong inertia-gravity wave activities in the mesopause region over Fort Collins, Colorado (41∘ N, 105∘ W), J. Geophys. Res.-Atmos., 112, d22104, https://doi.org/10.1029/2007JD008681, 2007. a
Lieberman, R. S.: Eliassen–Palm Fluxes of the 2-Day Wave, J. Atmos. Sci., 56, 2846–2861, https://doi.org/10.1175/1520-0469(1999)056<2846:EPFOTD>2.0.CO;2, 1999. a
Lieberman, R. S., Riggin, D. M., Nguyen, V., Palo, S. E., Siskind, D. E., Mitchell, N. J., Stober, G., Wilhelm, S., and Livesey, N. J.: Global observations of 2 day wave coupling to the diurnal tide in a high-altitude forecast-assimilation system, J. Geophys. Res.-Atmos., 122, 4135–4149, https://doi.org/10.1002/2016JD025144, 2017. a, b
Lilienthal, F. and Jacobi, Ch.: Meteor radar quasi 2-day wave observations over 10 years at Collm (51.3∘ N, 13.0∘ E), Atmos. Chem. Phys., 15, 9917–9927, https://doi.org/10.5194/acp-15-9917-2015, 2015. a
Lima, L., Batista, P., Takahashi, H., and Clemesha, B.: Quasi-two-day wave observed by meteor radar at 22.7∘ S, J. Atmos. Sol.-Terr. Phy., 66, 529–537, https://doi.org/10.1016/j.jastp.2004.01.007, 2004. a
Limpasuvan, V., Wu, D. L., Schwartz, M. J., Waters, J. W., Wu, Q., and Killeen, T. L.: The two-day wave in EOS MLS temperature and wind measurements during 2004–2005 winter, Geophys. Res. Lett., 32, l17809, https://doi.org/10.1029/2005GL023396, 2005. a
Livesey, N. J., Read, W. G., Wagner, P. A., Froidevaux, L., Lambert, A., Manney, G. L., Millán Valle, L. F., Pumphrey, H. C., Santee, M. L., Schwartz, M. J., Wang, S., Fuller, R. A., Jarnot, R. F., Knosp, B. W., and Martinez, E.: Version 4.2x Level 2 data quality and description document, Tech. rep., Jet Propulsion Laboratory, California Institute of Technology, Pasadena, CA 91109, USA, 2015. a
Madhavi, G., Kishore, P., Rao, S., Velicogna, I., and Basha, G.: Two-day wave observations over the middle and high latitudes in the NH and SH using COSMIC GPSRO measurements, Adv. Space Res., 55, 722–731, https://doi.org/10.1016/j.asr.2014.09.032, 2015. a
Manney, G. L., Lawrence, Z. D., Santee, M. L., Read, W. G., Livesey, N. J., Lambert, A., Froidevaux, L., Pumphrey, H. C., and Schwartz, M. J.: A minor sudden stratospheric warming with a major impact: Transport and polar processing in the 2014/2015 Arctic winter, Geophys. Res. Lett., 42, 7808–7816, https://doi.org/10.1002/2015GL065864, 2015. a
Maturilli, M., Fierli, F., Yushkov, V., Lukyanov, A., Khaykin, S., and Hauchecorne, A.: Stratospheric water vapour in the vicinity of the Arctic polar vortex, Ann. Geophys., 24, 1511–1521, https://doi.org/10.5194/angeo-24-1511-2006, 2006. a
McCormack, J. P., Eckermann, S. D., Hoppel, K. W., and Vincent, R. A.: Amplification of the quasi-two day wave through nonlinear interaction with the migrating diurnal tide, Geophys. Res. Lett., 37, l16810, https://doi.org/10.1029/2010GL043906, 2010. a
McCormack, J. P., Coy, L., and Singer, W.: Intraseasonal and interannual variability of the quasi 2 day wave in the Northern Hemisphere summer mesosphere, J. Geophys. Res.-Atmos., 119, 2928–2946, https://doi.org/10.1002/2013JD020199, 2014. a, b
Muller, H. and Nelson, L.: A travelling quasi 2-day wave in the meteor region, J. Atmos. Terr. Phys., 40, 761–766, https://doi.org/10.1016/0021-9169(78)90136-8, 1978. a
Nozawa, S., Iwahashi, H., Brekke, A., Hall, C. M., Meek, C., Manson, A., Oyama, S., Murayama, Y., and Fujii, R.: The quasi 2-day wave observed in the polar mesosphere: Comparison of the characteristics observed at Tromsø and Poker Flat, J. Geophys. Res.-Atmos., 108, 4748, https://doi.org/10.1029/2002JD003221, 2003. a
Pancheva, D.: Non-linear interaction of tides and planetary waves in the mesosphere and lower thermosphere: observations over Europe, Phys. Chem. Earth Pt. C, 26, 411–418, https://doi.org/10.1016/S1464-1917(01)00022-8, 2001. a
Pancheva, D., Mukhtarov, P., Siskind, D. E., and Smith, A. K.: Global distribution and variability of quasi 2 day waves based on the NOGAPS-ALPHA reanalysis model, J. Geophys. Res.-Space Phys., 121, 11422–11449, https://doi.org/10.1002/2016JA023381, 2016. a
Pancheva, D., Mukhtarov, P., and Siskind, D. E.: Climatology of the quasi-2-day waves observed in the MLS/Aura measurements (2005–2014), J. Atmos. Sol.-Terr. Phy., 171, 210–224, https://doi.org/10.1016/j.jastp.2017.05.002, 2018. a
Rodgers, C. D.: Inverse methods for atmospheric sounding: theory and practice, vol. 2, World Scientific Publishing Co Pte. Ltd., Tokyo, 2000. a, b
Rodgers, C. D. and Prata, A. J.: Evidence for a traveling two-day wave in the middle atmosphere, J. Geophys. Res.-Oceans, 86, 9661–9664, https://doi.org/10.1029/JC086iC10p09661, 1981. a
Rojas, M. and Norton, W.: Amplification of the 2-day wave from mutual interaction of global Rossby-gravity and local modes in the summer mesosphere, J. Geophys. Res.-Atmos., 112, d12114, https://doi.org/10.1029/2006JD008084, 2007. a
Salby, M. L.: The 2-day wave in the middle atmosphere: Observations and theory, J. Geophys. Res.-Oceans, 86, 9654–9660, https://doi.org/10.1029/JC086iC10p09654, 1981. a
Salby, M. L. and Roper, R. G.: Long-Period Oscillations in the Meteor Region, J. Atmos. Sci., 37, 237–244, https://doi.org/10.1175/1520-0469(1980)037<0237:LPOITM>2.0.CO;2, 1980. a
Scheiben, D., Tschanz, B., Hocke, K., Kämpfer, N., Ka, S., and Oh, J. J.: The quasi 16-day wave in mesospheric water vapor during boreal winter 2011/2012, Atmos. Chem. Phys., 14, 6511–6522, https://doi.org/10.5194/acp-14-6511-2014, 2014. a
Schulte, J. A.: Wavelet analysis for non-stationary, nonlinear time series, Nonlin. Processes Geophys., 23, 257–267, https://doi.org/10.5194/npg-23-257-2016, 2016. a
Studer, S., Hocke, K., and Kämpfer, N.: Intraseasonal oscillations of stratospheric ozone above Switzerland, J. Atmos. Sol.-Terr. Phy., 74, 189–198, https://doi.org/10.1016/j.jastp.2011.10.020, 2012. a
Teitelbaum, H., Massebeuf, M., Fellous, J. L., Petitdidier, M., Christophe, J., and Blanco, F.: Simultaneous measurements of meteor winds and green line intensity variations: Gravity waves and planetary waves, J. Geophys. Res.-Space Phys., 86, 7767–7770, https://doi.org/10.1029/JA086iA09p07767, 1981. a
Tschanz, B. and Kämpfer, N.: Signatures of the 2-day wave and sudden stratospheric warmings in Arctic water vapour observed by ground-based microwave radiometry, Atmos. Chem. Phys., 15, 5099–5108, https://doi.org/10.5194/acp-15-5099-2015, 2015. a, b, c
Tunbridge, V. M. and Mitchell, N. J.: The two-day wave in the Antarctic and Arctic mesosphere and lower thermosphere, Atmos. Chem. Phys., 9, 6377–6388, https://doi.org/10.5194/acp-9-6377-2009, 2009. a
Tunbridge, V. M., Sandford, D. J., and Mitchell, N. J.: Zonal wave numbers of the summertime 2 day planetary wave observed in the mesosphere by EOS Aura Microwave Limb Sounder, J. Geophys. Res.-Atmos., 116, d11103, https://doi.org/10.1029/2010JD014567, 2011. a, b
van Milligen, B. P., Sánchez, E., Estrada, T., Hidalgo, C., Brañas, B., Carreras, B., and García, L.: Wavelet bicoherence: A new turbulence analysis tool, Phys. Plasmas, 2, 3017–3032, https://doi.org/10.1063/1.871199, 1995. a
Wu, D. L., Fishbein, E. F., Read, W. G., and Waters, J. W.: Excitation and Evolution of the Quasi-2-Day Wave Observed in UARS/MLS Temperature Measurements, J. Atmos. Sci., 53, 728–738, https://doi.org/10.1175/1520-0469(1996)053<0728:EAEOTQ>2.0.CO;2, 1996. a


