the Creative Commons Attribution 4.0 License.
the Creative Commons Attribution 4.0 License.
 | 09 Aug 2018
Technical note: Use of an atmospheric simulation chamber to investigate the effect of different engine conditions on unregulated VOC-IVOC diesel exhaust emissions
Kelly L. Pereira
Rachel Dunmore
James Whitehead
M. Rami Alfarra
James D. Allan
Mohammed S. Alam
Roy M. Harrison
Gordon McFiggans
Jacqueline F. Hamilton
Diesel exhaust emissions were introduced into an atmospheric simulation chamber and measured using thermal desorption (TD) comprehensive two-dimensional gas chromatography coupled to a flame ionisation detector (GC × GC-FID). An extensive set of measurements were performed to investigate the effect of different engine conditions (i.e. load, speed, “driving scenarios”) and emission control devices (with or without diesel oxidative catalyst, DOC) on the composition and abundance of unregulated exhaust gas emissions from a light-duty diesel engine, fuelled with ultra-low sulfur diesel (ULSD). A range of exhaust dilution ratios were investigated (range = 1 : 60 to 1 : 1158), simulating the chemical and physical transformations of the exhaust gas from near to downwind of an emission source. In total, 16 individual and 8 groups of compounds (aliphatics and single-ring aromatics) were measured in the exhaust gas ranging from volatile to intermediate volatility (VOC-IVOC), providing both detailed chemical speciation and groupings of compounds based on their structure and functionality. Measured VOC-IVOC emission rates displayed excellent reproducibility from replicate experiments using similar exhaust dilution ratios. However, at the extremes of the investigated exhaust dilution ratios (comparison of 1 : 60 and 1 : 1158), measured VOC-IVOC emission rates displayed some disagreement owing to poor reproducibility and highlighted the importance of replicate sample measurements. The investigated DOC was found to remove 43±10 % (arithmetic mean ± experimental uncertainty) of the total speciated VOC-IVOC (∑SpVOC-IVOC) emissions. The compound class-dependant removal efficiencies for the investigated DOC were 39±12 % and 83±3 % for the aliphatics and single-ring aromatics, respectively. The DOC aliphatic removal efficiency generally decreased with increasing carbon chain length. The ∑SpVOC-IVOC emission rates varied significantly with different engine conditions, ranging from 70 to 9268 mg kg−1 (milligrams of mass emitted per kilogram of fuel burnt). ∑SpVOC-IVOC emission rates generally decreased with increasing engine load and temperature, and to a lesser degree, engine speed. The exhaust gas composition changed considerably as a result of two influencing factors: engine combustion and DOC hydrocarbon (HC) removal efficiency. Increased engine combustion efficiency resulted in a greater percentage contribution of the C7 to C12 n-alkanes to the ∑SpVOC-IVOC emission rate. Conversely, increased DOC HC removal efficiency resulted in a greater percentage contribution of the C7 to C12 branched aliphatics to the ∑SpVOC-IVOC emission rate. At low engine temperatures (<150 ∘C, below the working temperature of the DOC), the contribution of n-alkanes in the exhaust gas increased with increasing combustion efficiency and may be important in urban environments, as n-alkanes are more efficient at producing secondary organic aerosol (SOA) than their branched counterparts. At very high engine temperatures (maximum applied engine speed and load, engine temperature = 700 ∘C), the n-alkane contribution increased by a factor of 1.6 times greater than that observed in the cold-start experiment (most similar to unburnt fuel) and may suggest liquid-fuel-based estimates of SOA yields may be inconsistent with exhaust SOA yields, particularly at high engine speeds and loads (i.e. high engine temperatures). Emission rates were found to be 65 times greater from a cold-start experiment than at maximum applied engine speed and load. To our knowledge, this is the first study which uses an atmospheric simulation chamber to separate the effects of the DOC and combustion efficiency on the exhaust gas composition.
- Article
(2088 KB) - Full-text XML
-
Supplement
(299 KB) - BibTeX
- EndNote


Urban air pollution is detrimental to human health, adversely effects air quality, and results in increased morbidity and mortality rates (Han and Naeher, 2006; Cohen et al., 2005; Prüss-Üstün and Corvalán, 2006). The World Health Organisation attributed 1.34 million premature deaths to urban air pollution in 2008 (WHO, 2006; Krzyzanowski and Cohen, 2008). Of these deaths, 1.09 million could have been prevented if the air quality guidelines had been met (WHO, 2006; Krzyzanowski and Cohen, 2008). Over half of the world's population now live in urban areas (Prüss-Üstün and Corvalán, 2006; United Nations, 2014). By 2050, this population is expected to grow to 6.34 billion people, with an estimated 66 % of the world's population living in urban environments (Prüss-Üstün and Corvalán, 2006; United Nations, 2014). Road transport emissions are a dominant source of urban air pollution (DEFRA, 1993; Colvile et al., 2001; HEI, 2010) with common road-traffic pollutants including gaseous hydrocarbons (including volatile organic compounds, VOCs), nitrogen oxides (sum of NO+NO2), carbon oxides (CO and CO2), and particulate matter (PM), with secondary reaction processes resulting in the formation of ozone and secondary aerosol (WHO, 2006; HEI, 2010). Exposure to road-traffic air pollutants, both primary and secondary, are of a major health concern (United Nations, 2014; WHO, 2006; HEI, 2010). Secondary aerosol formation from diesel and gasoline-powered motor vehicles has received considerable attention in recent years (Gentner et al., 2017). There is currently considerable debate as to whether diesel or gasoline powered motor vehicles are more important for secondary organic aerosol (SOA) formation and which precursors are the most efficient at forming SOA (Gentner et al., 2017). In Europe, almost half of all new passenger cars are diesel (49.5 %), with petrol (45.8 %), electric hybrids (2.1 %), electric (1.5 %), and alternative fuels (1.2 %) accounting for the remaining fraction (ACEA, 2016). Diesel exhaust emissions vary considerably with vehicle type, age, operation conditions, fuel, lubricant oil, and emission control devices, among other factors (HEI, 2010). Emission regulations of nitrogen oxides, carbon monoxide, PM, and total hydrocarbon mass has resulted in the reduction of exhaust emissions (HEI, 2010). However, this “blanket approach” for the reduction of total hydrocarbon mass has, in-part, resulted in few studies investigating the detailed chemical composition of exhaust emissions with varying engine conditions (Yamada et al., 2011). Another contributing factor is the difficulty in exhaust gas measurement (Yamada et al., 2011; Rashid et al., 2013). On-road measurements of exhaust gas are difficult, due to the continually evolving chemical composition, requiring techniques capable of providing detailed chemical speciation in real time or near-real time. Furthermore, the vast number of gaseous compounds in exhaust emissions often involves lengthy quantification processes. The detailed chemical characterisation of exhaust gas with varying engine conditions, however, can considerably aid emission inventories and provide a greater understanding of exhaust emissions on local air quality. In addition, this information could serve to influence the design of emission control devices, reducing the emission rates of potentially harmful unregulated exhaust gas components.
On-road measurements of unregulated exhaust gas emissions are often performed in tunnels, on roadsides, or motorways (e.g. Gentner et al., 2013; Liu et al., 2015; Ježek et al., 2015; Zavala et al., 2006; Jiang et al., 2005; Kristensson et al., 2004; Fraser et al., 1998; Miguel et al., 1998; Staehelin et al., 1998). These measurements provide a compositional overview of the exhaust emissions from the on-road vehicular fleet, consisting of a vast range of vehicle types (e.g. light-duty, heavy-duty), emission control devices (e.g. with or without exhaust gas recirculation), and fuel composition (e.g. ultra-low sulfur diesel, ULSD; super unleaded petrol; premium unleaded petrol; biofuel; among others). These measurements, however, do not allow the effect of different engine conditions or emission control devices on the exhaust gas composition to be investigated. Dynamometer engines or chassis dynamometers can afford compositional insight into exhaust emissions with varying engine conditions, providing a high degree of control and reproducibility (Tadano et al., 2014; Louis et al., 2016). Several studies have used dynamometers to investigate compositional changes in unregulated exhaust gas emissions with the use of different transient driving cycles, for petrol engines (Pang et al., 2014; Baldauf et al., 2005), diesel (Yamada et al., 2011; Cross et al., 2015; Schauer et al., 1999; Zhao et al., 2015; Ballesteros et al., 2014; Nelson et al., 2008; Siegl et al., 1999; Westerholm et al., 1991), or both (Alves et al., 2015; Chirico et al., 2014; Alkurdi et al., 2013; Caplain et al., 2006; Schmitz et al., 2000; Louis et al., 2016). Driving cycles (often performed with chassis dynamometers) are designed to simulate real-world driving conditions, allowing the exhaust emissions from individual vehicles to be investigated. However, these driving cycles offer limited information on the effect of combustion or specific engine conditions (e.g. engine load, speed) on unregulated exhaust emissions, due to the averaging of emissions over entire driving cycles and the lack of steady-state engine conditions (Cross et al., 2015), compositional information which is easily obtained with the use of a single-engine dynamometer rig (Chin et al., 2012; Cross et al., 2015; Zhu et al., 2013; Schulz et al., 1999; Machado Corrêa and Arbilla, 2008). Recent studies have focused on the measurement of intermediate-VOCs (IVOCs) in diesel exhaust emissions, primarily due to advances in instrumentation to allow the detection of these species. IVOCs have an effective saturation concentration (C∗) of 103 to 106 µg m−3 and reside almost exclusively in the gas-phase at atmospheric conditions (Donahue et al., 2006). IVOCs comprise a considerable fraction of diesel exhaust emissions, with studies attributing ∼20 to 60 % of the non-methane organic gases to IVOCs (Schauer et al., 1999; Siegl et al., 1999; Zhao et al., 2015; Gordon et al., 2014). IVOC diesel exhaust emissions are relatively poorly characterised, yet contribute significantly to SOA formation (Gentner et al., 2017). Recently, Cross et al. (2015) investigated IVOC diesel exhaust emissions using a dynamometer rig. It was found that IVOC diesel exhaust emissions were highly dependent on engine power. At low engine loads, the exhaust gas composition was dominated by saturated hydrocarbons from unburnt fuel. At high engine loads, however, the exhaust gas composition changed, including newly formed unsaturated hydrocarbons and oxidised compounds from incomplete combustion (Cross et al., 2015). Furthermore, Chin et al. (2012) found the composition of VOC and IVOC diesel exhaust emissions (generated under steady-state engine conditions) depended on engine load, fuel type (ULSD and biodiesel), and emission control devices.
Table 1List of experiments performed, including the experimental dates, descriptions, chamber conditions, and engine operating parameters.
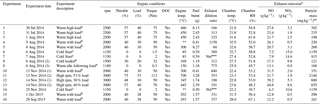
Superscript letters a, b, and c highlight replicate experiments using the same
engine conditions. Fuel batch A used in experiments 1 to 9 and fuel batch B
used in experiments 10 to 16, see Sects. 2.3 and 3.1.1 for further
information.
∗ is the sequence of engine conditions performed, see
Sect. 2.1 and Fig. S1. No engine temperature measurement (engine
thermocouple non-responsive). Estimated exhaust dilution
ratio based on pneumatic valve introduction
time. ⋆ Expressed as
emission rates (i.e. mass of emission per kg of fuel burnt). Wall-loss
corrected.
This study investigates the compositional changes of unregulated exhaust emissions with varying engine conditions (i.e. engine load, speed, and “driving scenarios”) and emission control devices (with or without a diesel oxidative catalyst, DOC) using a dynamometer rig. In contrast to previous studies, this work combines both detailed chemical speciation and groupings of VOC-IVOCs based on their structure and functionality, providing a more detailed compositional overview of the effect of different engine conditions on exhaust gas emissions. This work also investigates the effect of different exhaust dilution ratios on the exhaust gas composition, simulating the chemical and physical transformations of the exhaust gas emissions at varying ambient dilutions (i.e. near to downwind of an emission source). The emissions from a light-duty 1.9 L Volkswagen diesel engine were investigated. Exhaust emissions from different engine conditions were introduced into an atmospheric chamber which was used as a “holding-cell” for sampling, allowing lower time resolution techniques to be used. In total, 16 individual and 8 groups of compounds were measured in the exhaust gas using thermal desorption comprehensive two-dimensional gas chromatography coupled to a flame ionisation detector (TD-GC × GC-FID). The effect of different engine conditions and emission control devices on the composition and abundance of the speciated VOC-IVOCs is discussed, along with the reproducibility of the engine exhaust emissions/chamber sampling system and the potential impacts of our findings.
2.1 Experiments
A series of experiments were performed in July to August 2014, November 2014, and September to October 2015, as a part of the project COMbustion PARTicles in the atmosphere (Com-Part). Experiments were designed to systematically characterise the chemical and physical transformations of primary and secondary particles emitted from a light-duty diesel engine under a range of atmospheric dilution and oxidation conditions. The results shown here focus on the effect of different engine conditions on the composition and abundance of VOC-IVOCs in the raw exhaust emissions, which formed a subset of the total number of experiments performed. The experimental descriptions and engine operating parameters discussed here can be found in Table 1. A range of engine conditions were studied, including (i) engine speed, ranging from 1150 rpm (idle) to 3000 rpm (maximum engine output); (ii) engine load, ranging from 0 % (no load) to 53 % (the maximum load which could be safely applied to by the dynamometer in the experimental setup); (iii) emission control devices (with and without the DOC) and; (iv) “driving scenarios” (see below for further details). Exhaust dilution ratios were varied to represent a range of ambient conditions from near to downwind of an emission source, capturing the chemical and physical transformations of semi-volatiles in the exhaust emissions with varying ambient dilutions.
The majority of experiments focused on steady-state engine conditions, where selected engine running parameters were applied to the engine and the engine temperature allowed to stabilise, prior to the introduction of the exhaust emissions into the Manchester Aerosol Chamber (MAC). The MAC was filled with clean air prior to the introduction of the exhaust emissions. Steady-state engine conditions are defined here as a constant engine temperature within ±10 % of the steady-state average. Steady-state engine conditions were not performed for the cold-start (exps. 6, 7, and 14; Table 1) and “driving-scenario” (exps. 8 and 9; see Table 1) experiments, with the cold-start experiments requiring exhaust injection into the MAC after ∼1 to 2 min of engine start-up (i.e. cold-engine). The driving scenario experiments involved a sequence of engine conditions, with the injection of the exhaust emissions into the MAC after the completion of the sequence, but prior to achieving steady-state engine conditions. The sequence of engine conditions used in the driving scenario experiments are discussed in Sect. 3.3 and shown in Fig. S1 in the Supplement. All experiments except experiment 3 (see Table 1) were performed with the DOC. This allowed the combined effect of the DOC and different engine conditions on the exhaust emissions to be observed, i.e. engine conditions most representative of on-road diesel vehicles.
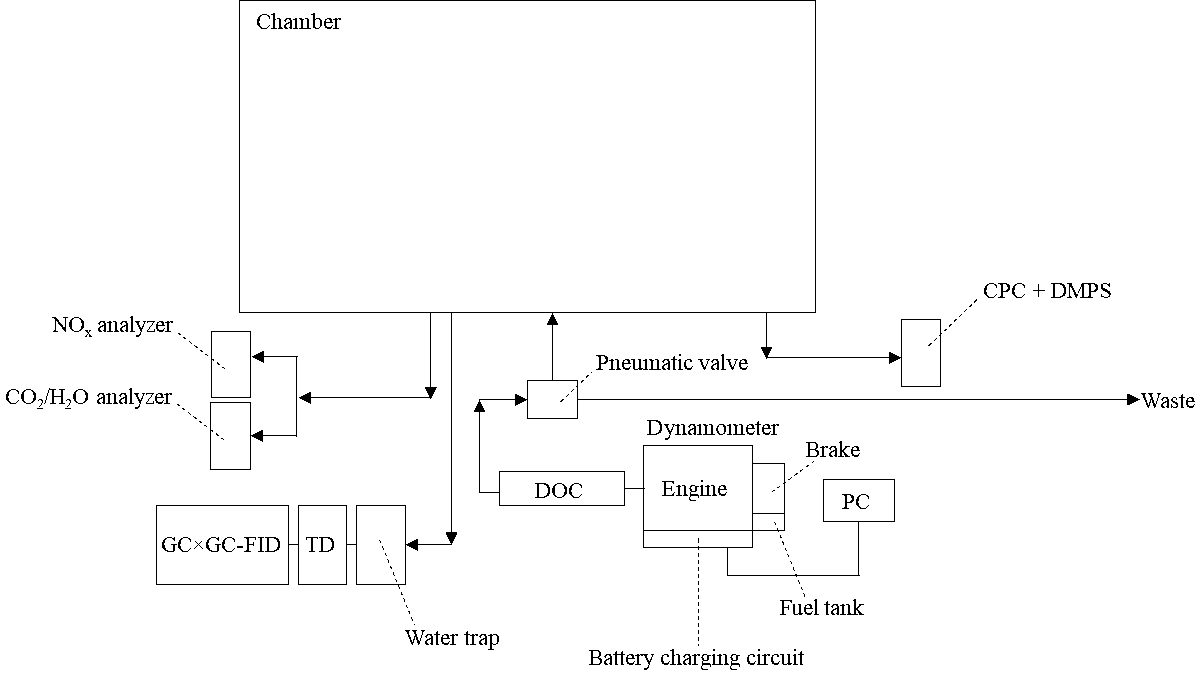
Figure 1Schematic of dynamometer and sampling system. Arrows display air flow direction. CPC is the condensation particle counter. DMPS is the differential mobility particle sizer. DOC is the diesel oxidative catalyst. TD is the thermal desorption unit. GC × GC-FID is the comprehensive two-dimensional gas chromatography flame ionisation detector. See Sect. 2.3 for further information.
2.2 Chamber setup
Experiments were performed in the MAC located within the University of Manchester, UK. The MAC consists of an 18 m3 fluorinated ethylene propylene Teflon bag with the following dimensions; 3 m (L) × 3 m (W) × 2 m (H). The chamber is supported by three rectangular aluminium frames, two of which are free moving, allowing the chamber to expand and collapse as sample air flow is introduced or extracted. Purified air is used within the chamber and is humidified prior to introduction. A suite of instruments was used to measure chamber temperature (series of cross-calibrated thermocouples), relative humidity (Dewmaster chilled mirror hygrometer, Edgetech Instruments, USA), CO2 (model 6262, Li-Cor Biosciences, USA), NOx (model 42i, Thermo Scientific, MA, USA), O3, (model 49C, Thermo Scientific, MA, USA), and VOC-IVOCs (GC × GC-FID, see below for further details). Particle number, mass, and diameter were measured using a differential mobility particle sizer (DMPS; Williams et al., 2007) consisting of a differential mobility analyser (DMA; Winklmayr et al., 1991) and a condensation particle counter (CPC; model 3010, TSI Inc., USA). Further technical information regarding the chamber design can be found in Alfarra et al. (2012).
2.3 Engine and exhaust sampling system
The emissions from a light-duty Volkswagen (VW) 1.9 L diesel engine were investigated. A schematic of the dynamometer and exhaust sampling system is shown in Fig. 1. The engine had 4 cylinders with a capacity of 1896 cm3 and a compression ratio of 19.5 : 1. The engine was mounted on an eddy current dynamometer rig (CM12, Armfield Ltd., Hampshire, UK) and the exhaust connected to a new (0 mileage hours) retrofitted DOC. The DOC was purchased from a local garage (Oldham Tyre and Exhaust, Oldham, UK) and consisted of a mix of platinum and rhodium. No diesel particulate filter was used, conforming to Euro 4 emission control regulations. The auto-equivalent version of this engine has been used in several VW Polo and Jetta models in the early 2000's and was chosen as an example of a light-duty diesel engine. The after-treatment was selected to meet Euro 4 emission control regulations required for such models. Engine running parameters (i.e. speed, load, and throttle) were controlled using a dedicated software package (Armfield Ltd., Hampshire, UK) on a separate PC. Engine load is the amount of breaking force (mechanical resistance) applied to the engine during operation, simulating weight (i.e. load) and/or resistance. Engine throttle controls the amount of fuel injected into the combustion chamber required for speed (rate of movement, measured in rpm) and load. Engine torque (force generated in the crankshaft of the engine) was not controlled but is included in Table 1 for reference. The engine temperature was measured via an in-built thermocouple located inside the engine exhaust pipe, next to the engine. The DOC temperature has been inferred from the measured exhaust temperature. The DOC temperature will be lower than the measured exhaust temperature due to the DOC being located further down the exhaust pipe. A 2 m long, 2-inch bore, stainless steel tube with a computer-controlled pneumatic valve was used to allow the engine emissions to be introduced into the MAC or diverted to waste. The timed control of the pneumatic valve allowed for a proportion of the exhaust emissions to be introduced into the chamber, controlling dilution. The final exhaust dilution ratios were calculated from the measured CO2 concentration prior to and after the introduction of the exhaust emissions. The exhaust dilution calculations will be discussed in further detail in a separate publication. The engine was fuelled with standard European (EN590 specifications, Euro 5 compliant) ULSD obtained from a local fuelling station. Two batches of fuel were obtained, the first in June 2014 (batch A) and the second in November 2014 (batch B). A second batch of fuel was required due to a considerable increase in the number of planned experiments. The fuel batches were of the same specification and obtained from the same local fuelling station. Batch A was used in experiments 1 to 9 and batch B in experiments 10 to 16 (see Table 1 and Sect. 3.1.1). The sulfur content was <10 ppm. Further information regarding the standard European ULSD fuel specifications can be found in the EU directive 2009/30/EC (EU, 2009).
2.4 TD-GC × GC-FID
VOC-IVOC exhaust emissions were measured using thermal desorption comprehensive two-dimensional gas chromatography with a flame ionisation detector (TD-GC × GC-FID) operating at 200 Hz. A TT24-7 thermal desorption unit (Markes International, Llantrisant, UK) with an air server attachment was used for sample collection. The inlet of the TD unit was connected to MAC using ∼2.5 m of heated stainless steel tubing. The stainless steel tubing was heated to ∼70 ∘C to reduce condensational losses of VOCs. An in-line unheated particulate filter prevented sampled particles from entering the TD unit. The in-line filter was replaced prior to each experiment to minimise particulate loadings. A clean air diaphragm pump (model PM25602-86, KNF Neuberger, Oxfordshire, UK) was used to extract an overflow of sample air from the MAC, a proportion of which was sampled into the TD unit. Two sequential glass traps cooled to −20 ∘C in an ethylene glycol bath were used to remove water vapour from the sampled air. No significant VOC losses have been found using this method of water vapour removal (Lidster, 2012). Air samples were trapped onto Tenax sorbent tubes (Markes International, Llantrisant, UK) held at −10 ∘C during sampling (26 min sampling duration) and heated to 230 ∘C upon desorption.
An Agilent 7890 GC (Agilent Technologies, Wilmington, USA) with a modified modulation valve, consisting of a 6-port, 2-way diaphragm valve (Valco Instruments, Texas, USA) and 50 µL sample loop (Thames Resteck, UK) was used (see Lidster et al., 2011, for further information). Cryogenic cooling (liquid CO2, BOC, UK) was used to refocus the sample on the head of the primary column upon desorption. Compound separation was achieved using a primary 25 m 5 % phenyl polysilphenylene-siloxane column (BPX5, SGE, Ringwood, Australia) with a 0.15 mm internal diameter and 0.4 µm film thickness, and a secondary 7 m polyethylene glycol column (BP20 SGE, Ringwood, Australia) with a 0.25 mm internal diameter and 0.25 µm film thickness. Helium (CP grade, BOC, UK) was used as the carrier gas. Primary and secondary column pressures were controlled using an electronic pneumatic control (Agilent 7890 EPC) and were set at 50 and 23 psi, respectively. The modulator was heated to 120 ∘C with a 5 s cycle time, comprising of 0.3 s injection and a 4.7 s sample introduction. The oven temperature programme consisted of a two-stage ramp; holding at 70 ∘C for 1 min, increasing to 160 ∘C at 16 min (6 ∘C min−1), then 200 ∘C at 20 min (10 ∘C min−1) with an additional 2 min hold, giving a total runtime of 22 min. The FID heater was set to 300 ∘C with a hydrogen flow of 30 mL min−1 (CP grade, BOC, UK) and an air flow of 300 mL min−1 (BTCA 178 grade, BOC UK).
A National Physical Laboratory (NPL30, Teddington, UK) gas standard was used to monitor instrument variability over the course of the experiments. VOC-IVOC concentrations were determined using either the NPL gas standard or the relative response factors (RRF) of liquid standards (see Supplement for further information). Calibrations were performed weekly using the NPL gas standard, or more frequently during instrument maintenance periods. The instrument detection limits for the investigated compounds can be found in the Supplement of Dunmore et al. (2015). Compounds with carbon numbers greater than C15 were not measured due to instrument temperature constraints; the boiling points of these compounds are too high to be removed from the column at the maximum operating temperature of the modulator. The exhaust injection times into the MAC, GC × GC-FID exhaust sampling start and end times, and the number of replicate measurements performed in each experiment, is shown in Table S2 in the Supplement. Only samples where no changes had been made to the chamber conditions were analysed. The exhaust emissions were blank subtracted using the chamber background measurement/s prior to the introduction of the exhaust emissions. The average sampling start time was 13 min after the injection of the exhaust emissions into the MAC. No apparent losses of the VOC-IVOCs were observed during sampling; the average relative standard deviation from replicate measurements of the investigated VOC-IVOCs over the longest sampling duration (∼2 h) was 6.4 % (exp. 6, see Table 1 and Table S2 in the Supplement).
2.5 Liquid fuel analysis
The two batches of ULSD fuel (see Sects. 2.3 and 3.1.1) were analysed using comprehensive two-dimensional gas chromatography (model 6890N, Agilent Technologies, UK) coupled to a time-of-flight mass spectrometer (Pegasus 4D, Leco, MI, USA) (GC × GC-TOFMS). Compound separation was achieved using a primary 15 m 5 % phenyl polysilphenylene-siloxane column (BPX5, SGE, Ringwood, Australia) with a 0.25 mm film thickness and 0.25 mm internal diameter, and a secondary 2 m 50 % phenyl polysilphenylene-siloxane column (BPX50, SGE, Ringwood, Australia) with a 0.25 mm film thickness and 0.25 mm internal diameter. Neat ULSD fuel was introduced into the GC × GC-TOFMS using a Gerstel multipurpose sampler (MPS 2, Gerstel, USA) with dedicated controller (model C506, Gerstel, USA). A 1 µL injection volume was used with a split ratio of 100 : 1. The transfer line was set to 270 ∘C. Cryo-jet modulation cooling was used to achieve comprehensive two-dimensional separation. Helium (CP grade, BOC, UK) was used as the carrier gas with a constant flow rate of 1.5 mL min−1. The oven starting temperature was set to 65 ∘C with a 0.2 min hold, followed by a temperature ramp of 4 ∘C min−1 to 240 ∘C, with a further 10 min hold. The modulator and secondary oven temperature was set to 15 and 20 ∘C above the oven temperature, respectively. The TOFMS acquisition rate was set to 50 spectra per second, with a scan range of mass-to-charge (m∕z) 35 to 500. The data were analysed using Leco ChromaTOF software version 4.51.6 (Leco, MI, USA). Compounds were identified using the National Institute of Standard and Technology (NIST) standard reference database (version 11).
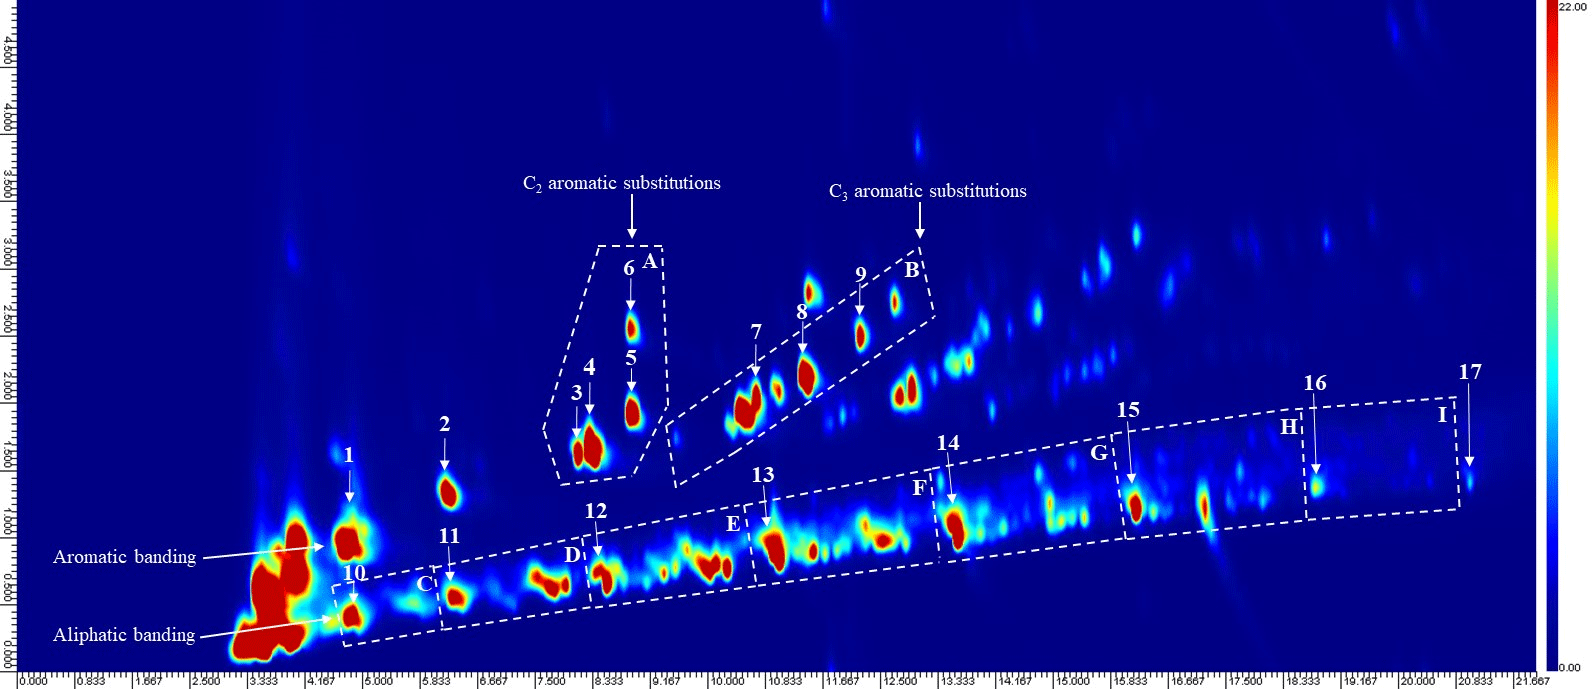
Figure 2An annotated chromatogram displaying the speciated VOC-IVOCs. Chromatogram axis, x is the first dimension separation (boiling point, increasing from left-to-right), y is the second dimension separation (polarity, increasing from bottom-to-top). Colour scale represents peak intensity, increasing from blue to red. Letters refer to compound groupings; A is the single-ring aromatics with two carbon substitutions, B is the single-ring aromatics with three carbon substitutions, C to I is the C7 to C13 aliphatics grouped by carbon number (i.e. C is the C7 aliphatics, D is the C8 aliphatics etc.). Numbers refer to individual compounds; 1 is benzene, 2 is toluene, 3 is ethyl benzene, 4 is meta/para-xylene (co-elution), 5 is ortho-xylene, 6 is styrene, 7 is 1,3,5-trimethyl benzene, 8 is 1,2,4-trimethyl benzene, 9 is 1,2,3-trimethyl benzene, 10 is heptane, 11 is octane, 12 is nonane, 13 is decane, 14 is undecane, 15 is dodecane, 16 is tridecane, and 17 is tetradecane (not quantified). Aromatic and aliphatic banding often observed with this technique are shown (cf. Hamilton and Lewis, 2003, and Dunmore et al., 2015). The start and end of each aliphatic grouping is marked by the lower and higher carbon number n-alkane (i.e. nonane marks the start of the C9 aliphatic grouping, decane marks the end of this group).
The effect of different engine loads, speeds, “driving scenarios”, and emission control devices (i.e. with or without DOC) on the VOC-IVOC emission rates from a light-duty diesel engine fuelled with USLD is discussed. In total, 16 individual and 8 groups of VOC-IVOCs were speciated in the exhaust gas using TD-GC × GC-FID. The individual compounds included 9 single-ring aromatics: benzene, toluene, ethyl benzene, meta- and para-xylene (grouped), ortho-xylene, styrene, 1,3,5-TMB, 1,2,4-TMB, and 1,2,3-TMB, and 7 n-alkanes from n-heptane to n-tridecane. Grouped compounds consisted of C7 to C13 branched aliphatics grouped by carbon number and single-ring aromatics with three carbon substitutions (i.e. those in addition to the trimethylbenzene isomers above). The emission rates of n-tridecane and the C13 branched aliphatic grouping were not measured in some experiments due to a shift in the instrument retention time, resulting in these species not being observed. The saturation concentration (C∗, µg m−3, Donahue et al., 2006) of the speciated compounds ranged between 105 and 108 µg m−3, classifying these species as intermediate to volatile organic compounds (VOC-IVOCs). The most abundant volatility fraction of IVOCs from diesel exhaust emissions were measured, see Zhao et al. (2015) for further information. An annotated chromatogram displaying the speciated compounds is shown in Fig. 2. The use of two different stationary phases in GC × GC allows compounds to be separated by two physical properties, such as boiling point and polarity, as shown here (see Fig. 2). This two-dimensional separation creates a characteristic space where compounds are grouped by similar physical properties (e.g. aromatic and aliphatic banding) (see Fig. 2, cf. Hamilton and Lewis, 2003; Dunmore et al., 2015), aiding in the identification of unknowns. This characteristic space, in combination with the use of commercially available standards and the elution patterns observed in previous work using this instrument (Dunmore et al., 2015) allowed 8 compound groupings to be identified. The identification of all the individual compounds (except styrene, see Supplement) were confirmed using commercially available standards. The emission rates of the individual and grouped compounds and their percentage contribution to the total speciated VOC-IVOC emission rate (hereafter referred to as ∑SpVOC-IVOC) are shown in Tables S3 to S6. No corrections have been made for gas-phase absorption to PM in this work. Gas-phase absorption to PM is negligible due to the relatively high vapour pressures of the compounds speciated, low VOC-IVOC mixing ratios, and the small amount of aerosol mass present after exhaust dilution.
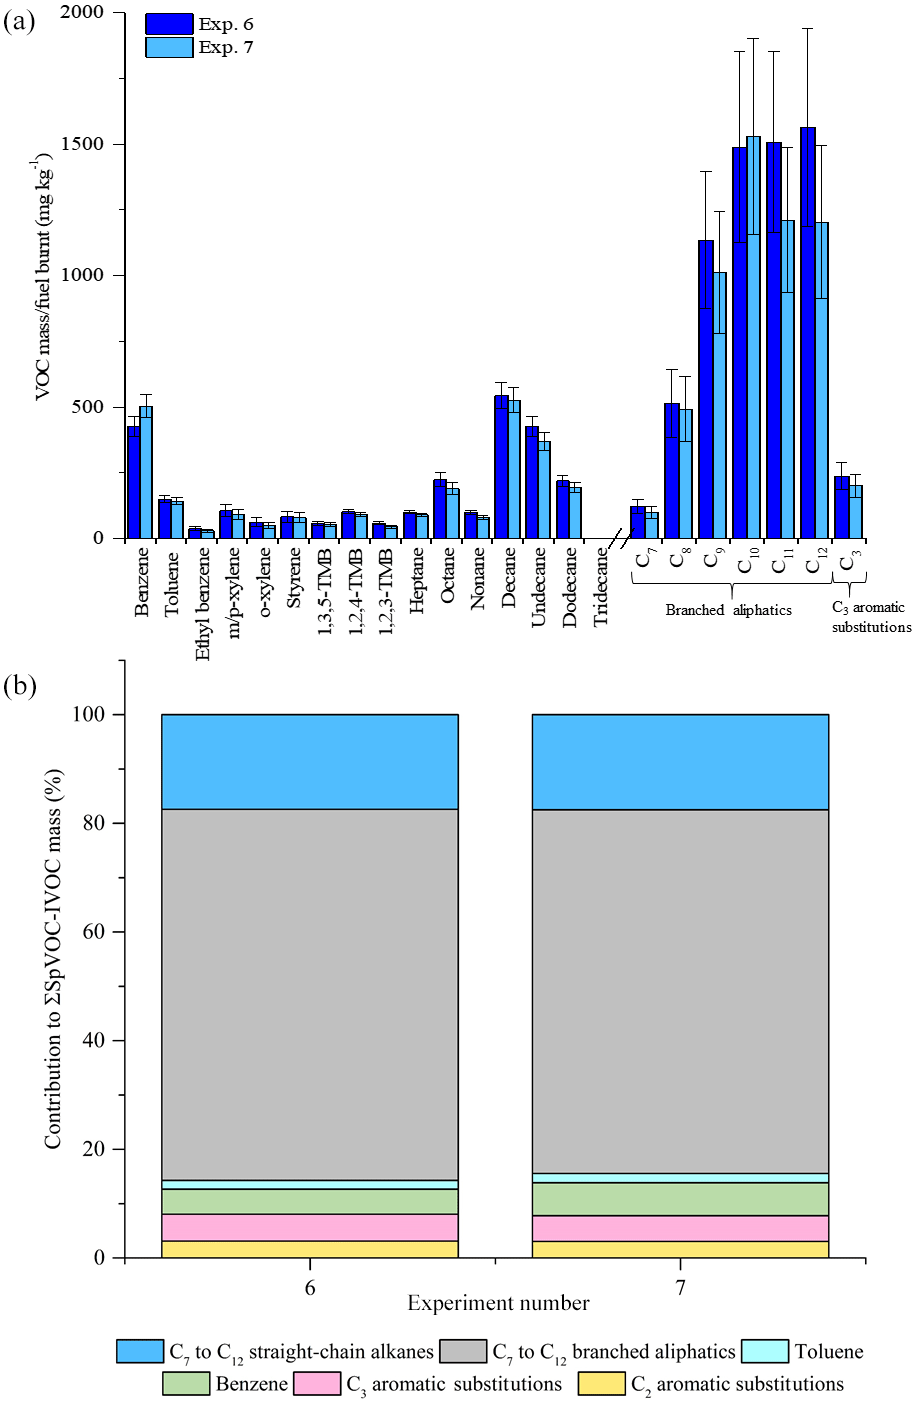
Figure 3Comparison of measured VOC-IVOC emission rates in replicate cold-start experiments (exps. 6 and 7) (a). Comparison of the percentage contribution of the individual and grouped compounds to the ∑SpVOC-IVOC emission rates in exps. 6 and 7 (b). The emission rates of tridecane and the C13 branched aliphatic grouping has not been included in (b) to allow direct comparison between other experiments where these species were not measured. Error bars represent the calculated uncertainty in the measured emission rates, see Sect. S1.1 in the Supplement for further information.
3.1 Experimental reproducibility
The reproducibility of the measured VOC-IVOC emission rates with different engine conditions and exhaust dilution ratios were investigated and are discussed below. The emission rates from two replicate cold-start experiments (1150 rpm, 0 % load, exps. 6 and 7, see Table 1) and two replicate warm with load (WWL) experiments (2000 rpm, 30 % load, exps. 15 and 16, see Table 1) are shown in Figs. 3 and 4, respectively. Both replicate experiments were performed with similar exhaust dilution ratios. The emission rates from the replicate cold-start and WWL experiments displayed excellent reproducibility, considering the vast number of variables in these experiments (e.g. combustion and DOC hydrocarbon, HC, removal efficiency). All emission rates, except styrene in one experiment (< limit of detection), were observed to be within the calculated uncertainty (see Supplement). The emission rates from two replicate warm high-load experiments (2500 rpm, 40 % load, exps. 1 and 2, see Table 1) with different exhaust dilution ratios is shown in Fig. 5. The exhaust dilution ratios in these experiments were 166 and 313 in experiments 1 and 2 (see Table 1), respectively. The emission rates in these experiments are relatively comparable. Only one measurement of the exhaust emissions was performed in each experiment. The majority of experiments had a minimum of two replicate measurements of the exhaust emissions (see Table S2), possibly accounting for slight differences observed in the measured VOC-IVOC emission rates.

Figure 4Comparison of measured VOC-IVOC emission rates in replicate WWL experiments (exps. 15 and 16, 2000 rpm, 30 % load) (a). Comparison of the percentage contribution of the individual and grouped compounds to the ∑SpVOC-IVOC emission rates in exps. 15 and 16 (b). The emission rates of tridecane and the C13 branched aliphatic grouping has not been included in (b) to allow direct comparison between other experiments where these species were not measured. Error bars represent the calculated uncertainty in the measured emission rates, see Sect. S1.1 for further information.
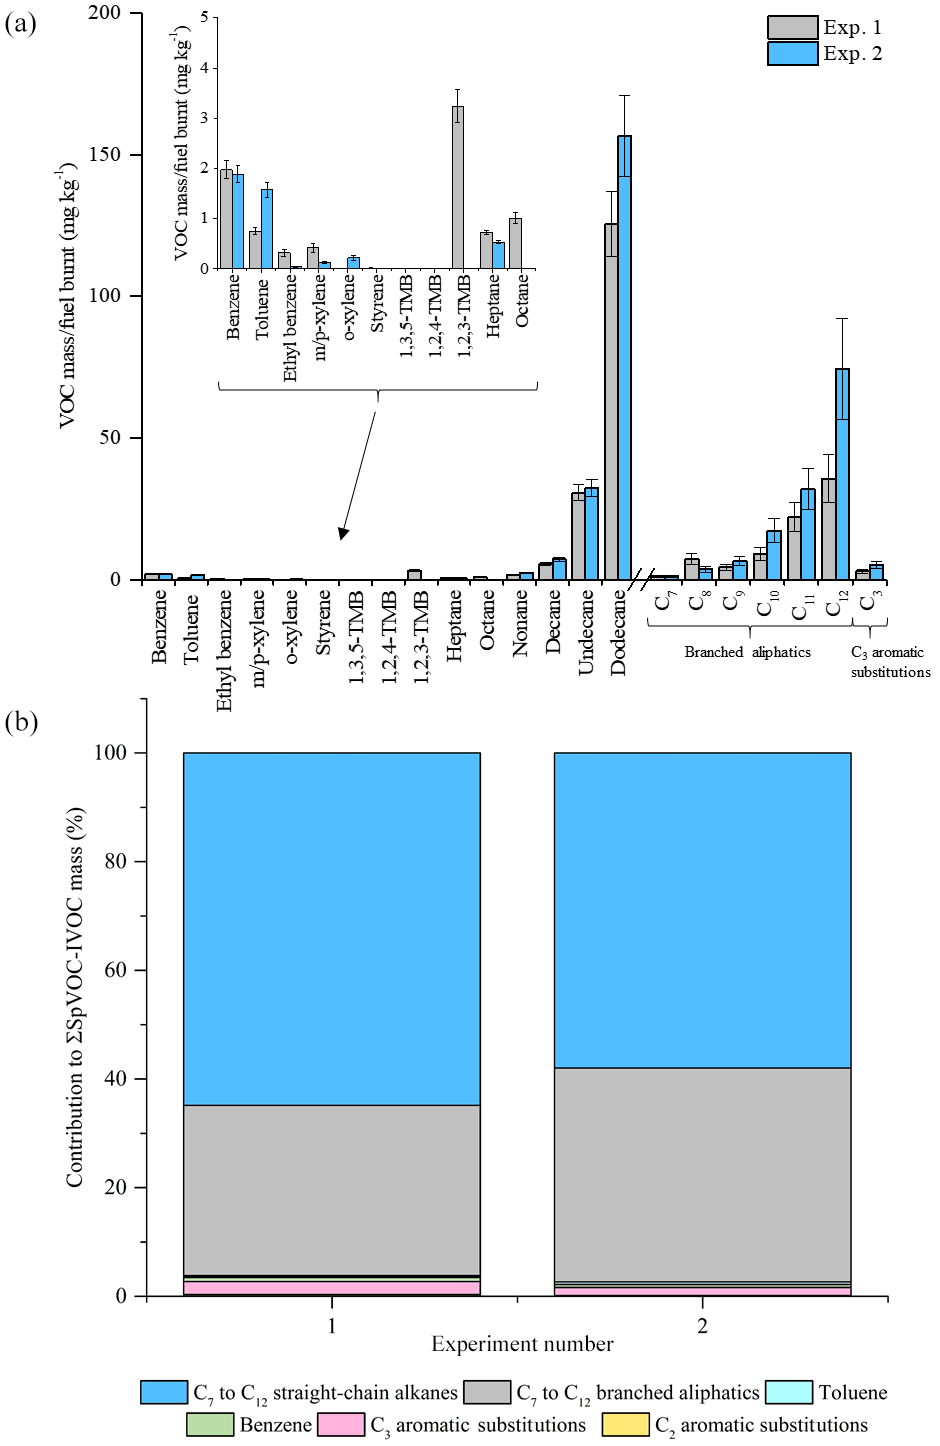
Figure 5Comparison of measured VOC-IVOC emission rates in replicate warm high-load experiments 1 and 2 (exps. 1 and 2, 2500 rpm, 40 % load) (a). Comparison of the percentage contribution of the individual and grouped compounds to the ∑SpVOC-IVOC emission rates in exps. 1 and 2 (b). The emission rates of tridecane and the C13 branched aliphatic grouping has not been included in (b) to allow direct comparison between other experiments where these species were not measured. Error bars represent the calculated uncertainty in the measured emission rates, see Sect. S1.1 for further information.
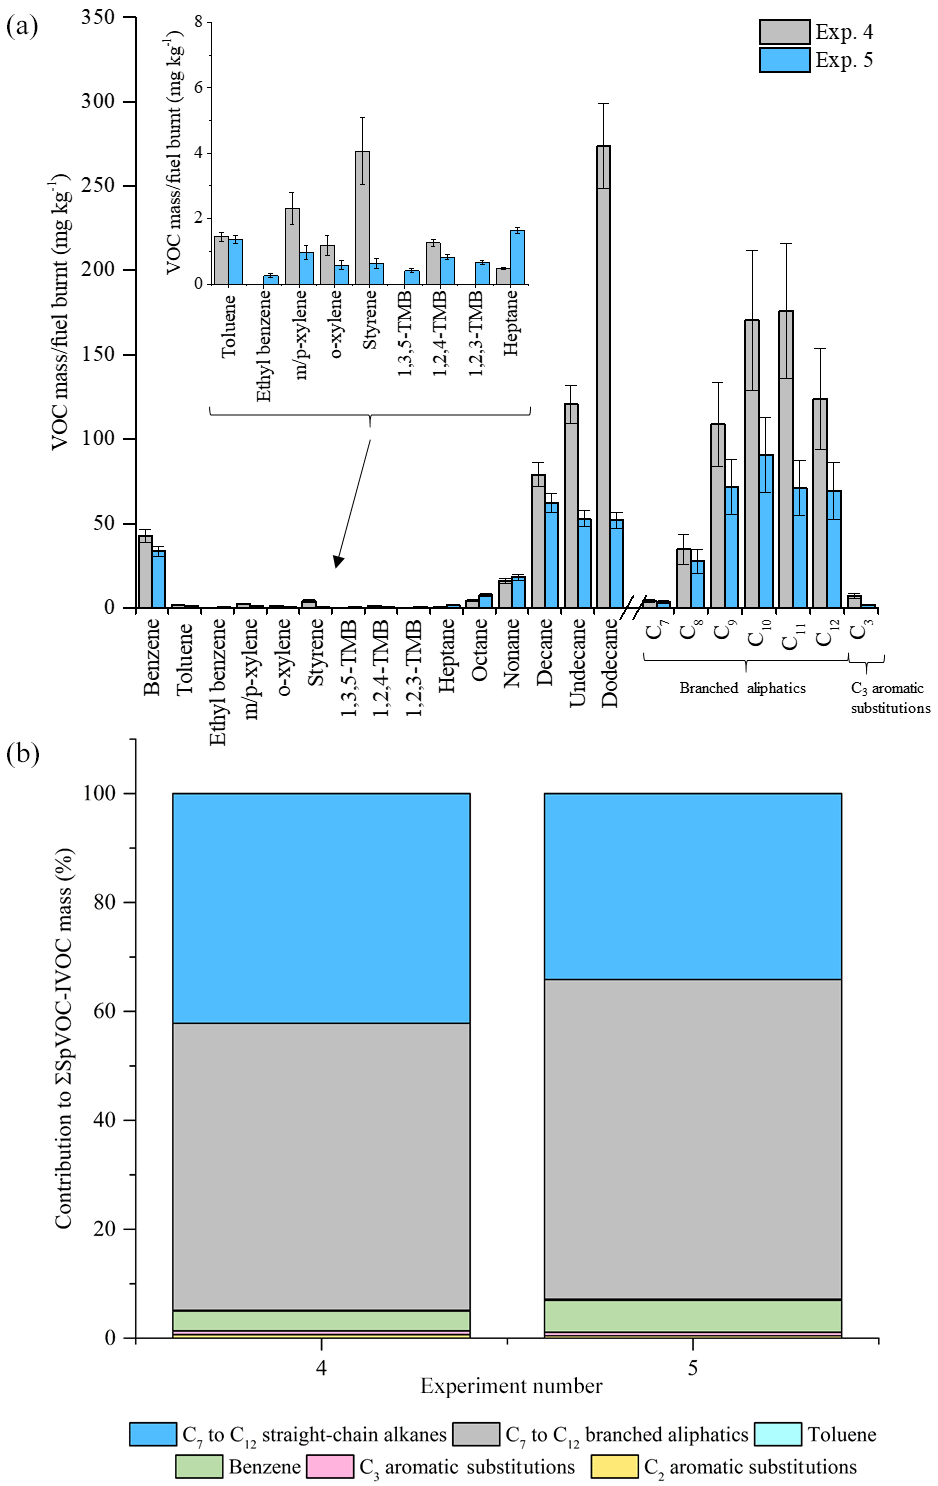
Figure 6Comparison of measured VOC-IVOC emission rates in replicate warm with load experiments 4 and 5 (2000 rpm, 30 % load) (a). Comparison of the percentage contribution of the individual and grouped compounds to the ∑SpVOC-IVOC emission rates in exps. 4 and 5 (b). The emission rates of tridecane and the C13 branched aliphatic grouping has not been included in (b) to allow direct comparison between other experiments where these species were not measured. Error bars represent the calculated uncertainty in the measured emission rates, see Sect. 1.1 for further information.
The emission rates from two replicate WWL experiments (2000 rpm, 30 % load, exps. 4 and 5, see Table 1) at the extremes of the investigated exhaust dilution ratios are shown in Fig. 6. The exhaust dilution ratios were 1158 and 60 in experiments 4 and 5, respectively. The emission rates in these experiments displayed some disagreement. The engine thermocouple was unresponsive during one of these experiments (exp. 4, see Table 1). Consequently, it is not known if steady-state engine conditions were achieved prior to the introduction of the exhaust emissions into the MAC and whether the engine temperature upon injection was comparable to the replicate experiment, possibly accounting for the observed differences in the VOC-IVOC emission rates. Nevertheless, no experiments with such large differences in the exhaust dilution ratios have been directly compared in the following work and where engine conditions are compared, experiments with similar exhaust dilution ratios and engine temperatures have been used. These experiments highlight the importance of replicate measurements and the comparison of VOC-IVOC emission rates from experiments with similar engine temperatures. A propagation of errors was calculated to determine the experimental uncertainty in the measured emission rates and is discussed in detail in the Supplement. Briefly, the experimental uncertainty includes, (i) the standard deviation in the replicate measurements of the calibration standard and the reported uncertainty in the standard mixing ratios (where applicable), (ii) a 5 % standard deviation in the chamber volume, and (iii) an additional 20 % error in the emission rates of compounds integrated using the GC Image software package, see the Supplement for further information. The experimental uncertainty in the measured emission rates for the investigated VOC-IVOCs ranged from 6 to 50 % with an average of 22 %.
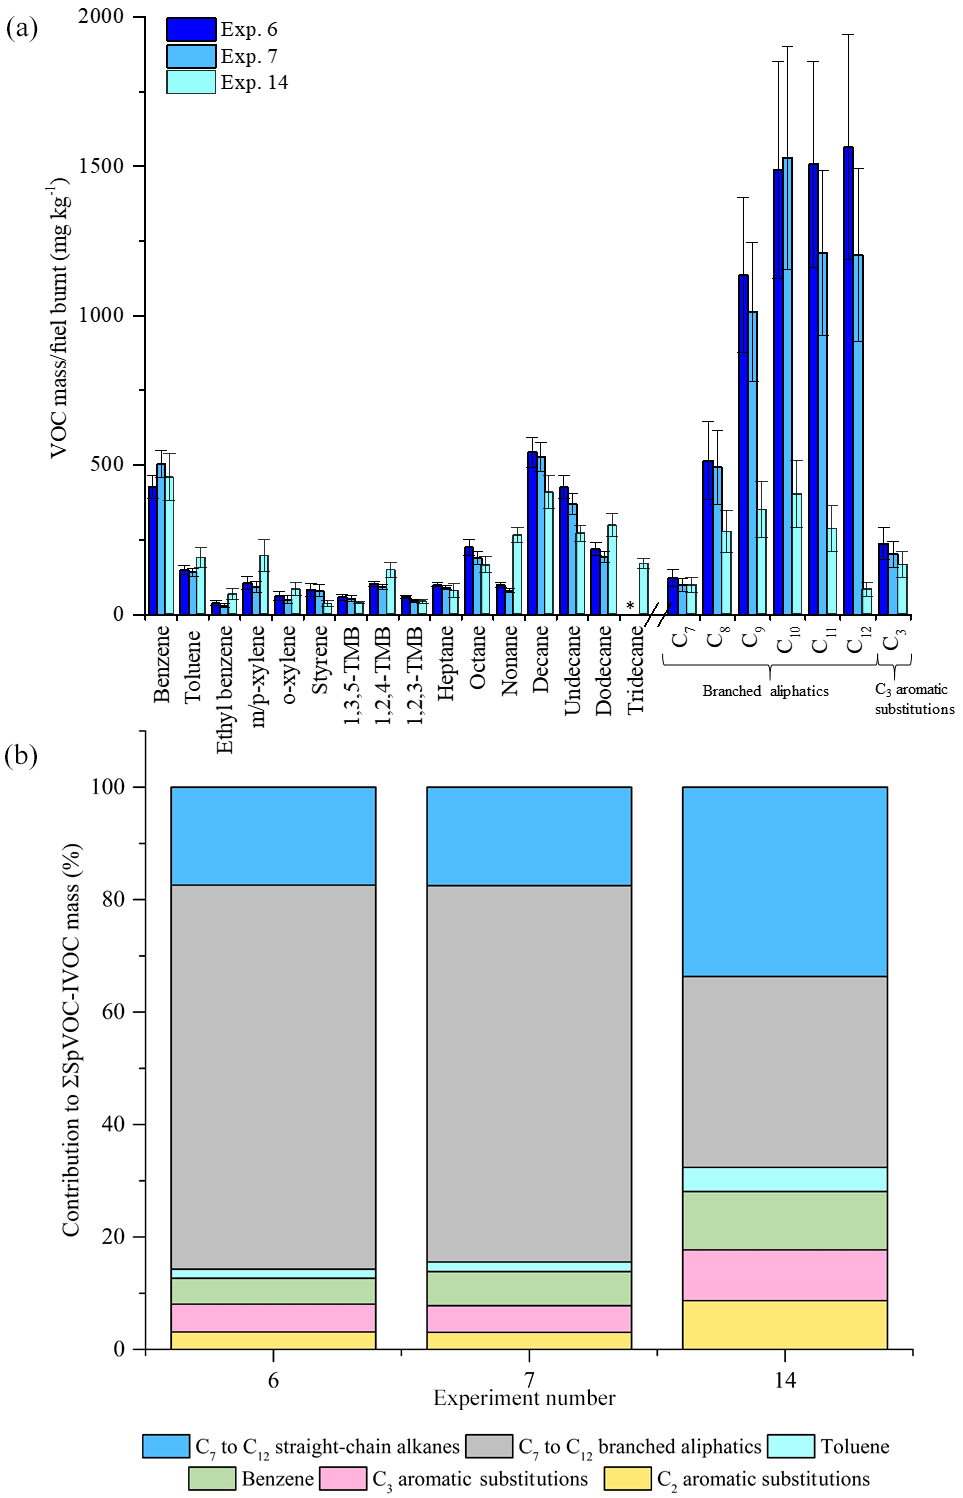
Figure 7Comparison of measured VOC-IVOC emissions rates in replicate cold-start experiments 6 and 7 (fuel batch A) with cold-start experiment 14 (fuel batch B) (a). Comparison of the percentage contribution of the individual and grouped compounds to the ∑SpVOC-IVOC emission rates in experiments 6, 7, and 14 (b). The emission rates of tridecane and the C13 branched aliphatic grouping has not been included in (b) to allow direct comparison between other experiments where these species were not measured. Error bars represent the calculated uncertainty in the measured emission rates, see Sect. S1.1 for further information.
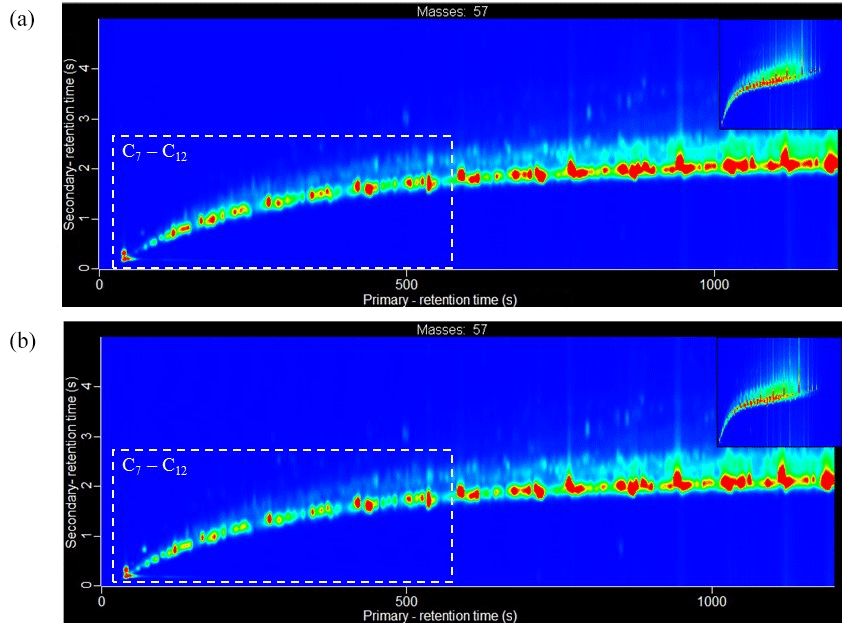
Figure 8Extracted ion chromatogram of m∕z 57 (dominate aliphatic fragment ion) for the liquid diesel fuel samples analysed using GC × GC-TOFMS. (a) Fuel batch A (see Sect. 3.1.1 for further information). (b) Fuel batch B. Chromatogram axes: x is the primary column, first dimension separation (boiling point, increasing from left-to-right) and y is the secondary column, second dimension separation (polarity, increasing from bottom-to-top). Colour scale represents peak intensity, increasing from blue to red. Chromatograms have been normalised to allow direct comparison of peak intensity between chromatograms. Dashed box highlights an approximate carbon number range of C7 to C12, determined from the NIST library identification of individual compounds.
Table 2Calculated diesel oxidative catalyst (DOC) hydrocarbon removal efficiency for the speciated VOC-IVOCs. Determined from measured emission rates of the speciated VOC-IVOCs in two replicate experiments with (exp. 2, see Table 1) and without (exp. 3) a DOC.
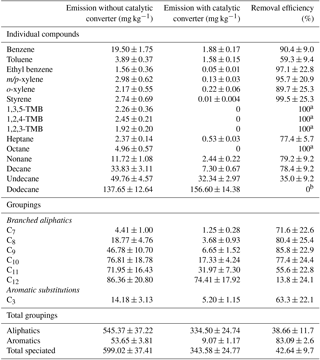
a Compound not observed (< instrument limit of detection). b No observed decrease in concentration. TMB is trimethyl benzene. Errors represent the calculated experimental uncertainty, see the Supplement for further information.
ULSD fuel: batch A and B
Two batches of ULSD fuel were used in the experiments (see Sect. 2.3). The emission rates from three replicate cold-start experiments, two using fuel batch A (exps. 6 and 7, see Table 1) and one using fuel batch B (exp. 14), are shown in Fig. 7. From Fig. 7, it can be observed that there is a considerable difference in the emission rates of the C7 to C12 branched aliphatics between replicate experiments 6 and 7, and experiment 14. The emission rates of the C7 to C12 branched aliphatics decreased by a factor of ∼4 with the use of fuel batch B (exp. 14). The excellent agreement of the emission rates between replicate cold-start experiments 6 and 7 suggests the compositional differences observed in experiment 14 is the result of a slight difference in the fuel composition between batches A and B. GC × GC-TOFMS was used to further investigate any compositional differences between the fuel batches. An extensive analysis of the diesel fuel was not performed. The aim of this analysis was to investigate whether there were any apparent differences in the fuel composition that would prevent a direct comparison of the emission rates from fuel batches A and B. Extracted ion chromatograms for m∕z 57 (dominant aliphatic fragment ion) from fuel batches A and B are shown in Fig. 8a and b, respectively. The chromatograms were normalised to the total peak area to allow direct comparison of peak intensity between the chromatograms. The highlighted regions in Fig. 8 display straight- and branched-chain aliphatics with a carbon number range of approximately C7 to C12 (determined from the NIST library). The peak intensities in the chromatograms from fuel batches A and B are largely comparable, except for the highlighted regions, where a slightly lower peak intensity is observed in fuel batch B. As a result, the emission rates from fuel batches A and B have not been directly compared in the following work. The reason for the observed compositional differences between fuel batches A and B is unclear, although it suggests a possible change in the refining process between the purchase of both fuel batches.
3.2 DOC removal efficiency
The HC removal efficiency of the DOC was investigated by performing two replicate experiments (exps. 2 and 3, Table 1) with and without the DOC. The additional back pressure created due to the in-line DOC appeared to have no effect on engine operation, allowing a direct comparison between both experiments. The engine speed and load were set to 2500 rpm and 40 % load, respectively. The DOC HC removal efficiency is strongly dependant on working temperature. Below 200 ∘C the DOC HC removal efficiency is close to 0 %, rising sharply to near 100 % HC removal efficiency at ∼430 ∘C (Korin et al., 1999; Roberts et al., 2014; Majewski and Khair, 2006; Russell and Epling, 2011). The steady-state engine temperature in both experiments was 450 ∘C. Thus, the DOC was near maximum HC removal efficiency. The HC removal efficiency was calculated using the equation shown in Roberts et al. (2014). The removal efficiency of the investigated DOC for the speciated compounds is shown in Table 2. The DOC removed 43±10 % (arithmetic mean ± experimental uncertainty; see Sect. 3.1 and the Supplement for further information) of the ∑SpVOC-IVOC emissions. The compound class-dependant removal efficiencies for the investigated DOC were 39±12 % and 83±3 % for the aliphatics (branched and straight-chain) and single-ring aromatics, respectively. A typical DOC is expected to remove 50 to 70 % of the total HC emissions (Johnson, 2001; Alam et al., 2016). For the investigated compounds, the total DOC HC removal efficiency is at the lower limit of this expectation. The DOC removal efficiency for styrene; meta-, para-, and ortho-xylene; ethylbenzene (C2 aromatic substitution grouping); and benzene was greater than 90 %. In addition, the trimethylbenzenes (TMB) were not observed with the use of the DOC (∼100 % removal efficiency). This high HC removal efficiency, however, was not observed for all the single-ring aromatics. Toluene had a relatively poor removal efficiency in comparison, at 59±9 %. Furthermore, the removal efficiency of the unspeciated C3 aromatic substitution grouping (i.e. less branched aromatic isomers of TMB) was determined to be 63±22 %, suggesting the isomeric structure influences removal efficiency, possibly the result of reactivity and/or adsorption to the metal binding sites in the DOC (cf. Salge et al., 2005; Russell and Epling, 2011).
Generally, the HC removal efficiency decreased with increasing carbon chain length. This was particularly evident with the branched aliphatics, with the removal efficiency decreasing from 72 % to 14 % from C7 to C12, with a sharp decrease in the removal efficiency from C10 to C12. Analogous to the branched aliphatics, the n-alkanes displayed the same rapid decrease in the HC removal efficiency between n-decane and n-dodecane, with the DOC observed to have no effect on the emission of n-dodecane. The removal of n-alkanes in the DOC have been found to decrease with increasing carbon chain length, a result of the greater number of adjacent sites in the DOC required to achieve absorption (Yao, 1980; Russell and Epling, 2011), supporting the results shown here. However, recently Alam et al. (2016) investigated the HC removal efficiency of a similar specification DOC (i.e. mixed platinum and rhodium) for C12 to C33 n-alkanes, among other species. It was found that the DOC HC removal efficiency did not continue to decrease with increasing carbon chain length, rather decreasing from C12 to C16, followed by an increase from C17 to C23 and further decrease from C24 to C32. Few studies have investigated the HC removal efficiency of individual species and grouped counterparts, expressing DOC HC removal efficiency as total HC, with no reference to possible compositional and structural effects, which based on the results shown in this work and Alam et al. (2016), require further study.
3.3 Driving scenarios
The VOC-IVOC emission rates from several “driving scenarios” were investigated. The driving scenarios included either (i) a single applied engine load and speed, and injection before a steady-state engine temperature had been achieved, or (ii) a sequence of different engine loads and speeds, during which steady-state engine temperature was achieved. These experiments were performed to gain a greater insight into the factors controlling VOC-IVOC emission rates. Three experiments were performed, cold-start (exp. 6), cold loaded (exp. 8), and warm idle following load (WIFL, exp. 9). The engine conditions used in each of these experiments can be found in Fig. S1. Cold-start included a cold-engine start (idling speed and 0 % load) with the injection of the exhaust emissions into the MAC after ∼1–2 min. Cold loaded included a cold-engine start followed by the immediate application of 1500 rpm and 20 % load, with a 1 min hold before injection. Steady-steady engine temperatures were not achieved during the cold-start or cold-loaded experiments. WIFL included a cold-engine start, followed by the immediate application of 2000 rpm and 28–30 % load with a 7 min hold (during which a steady-state engine temperature was achieved), followed by 1 min of idling speed (1150 rpm) and 0 % load before injection. The ∑SpVOC-IVOC emission rates in each experiment were 9268±699, 2902±199, and 1438±96 mg kg−1 in the cold-start, cold-loaded, and WIFL experiments, respectively. The application of 1500 rpm and 20 % load for 1 min (cold loaded) resulted in a decrease in the ∑SpVOC-IVOC emissions by a factor of ∼3, in comparison to the cold-start engine conditions; highlighting the importance of engine combustion efficiency on VOC-IVOC emission rates. The VOC-IVOC compositional profiles and emission rates in the driving scenario experiments can be observed in Fig. 9.
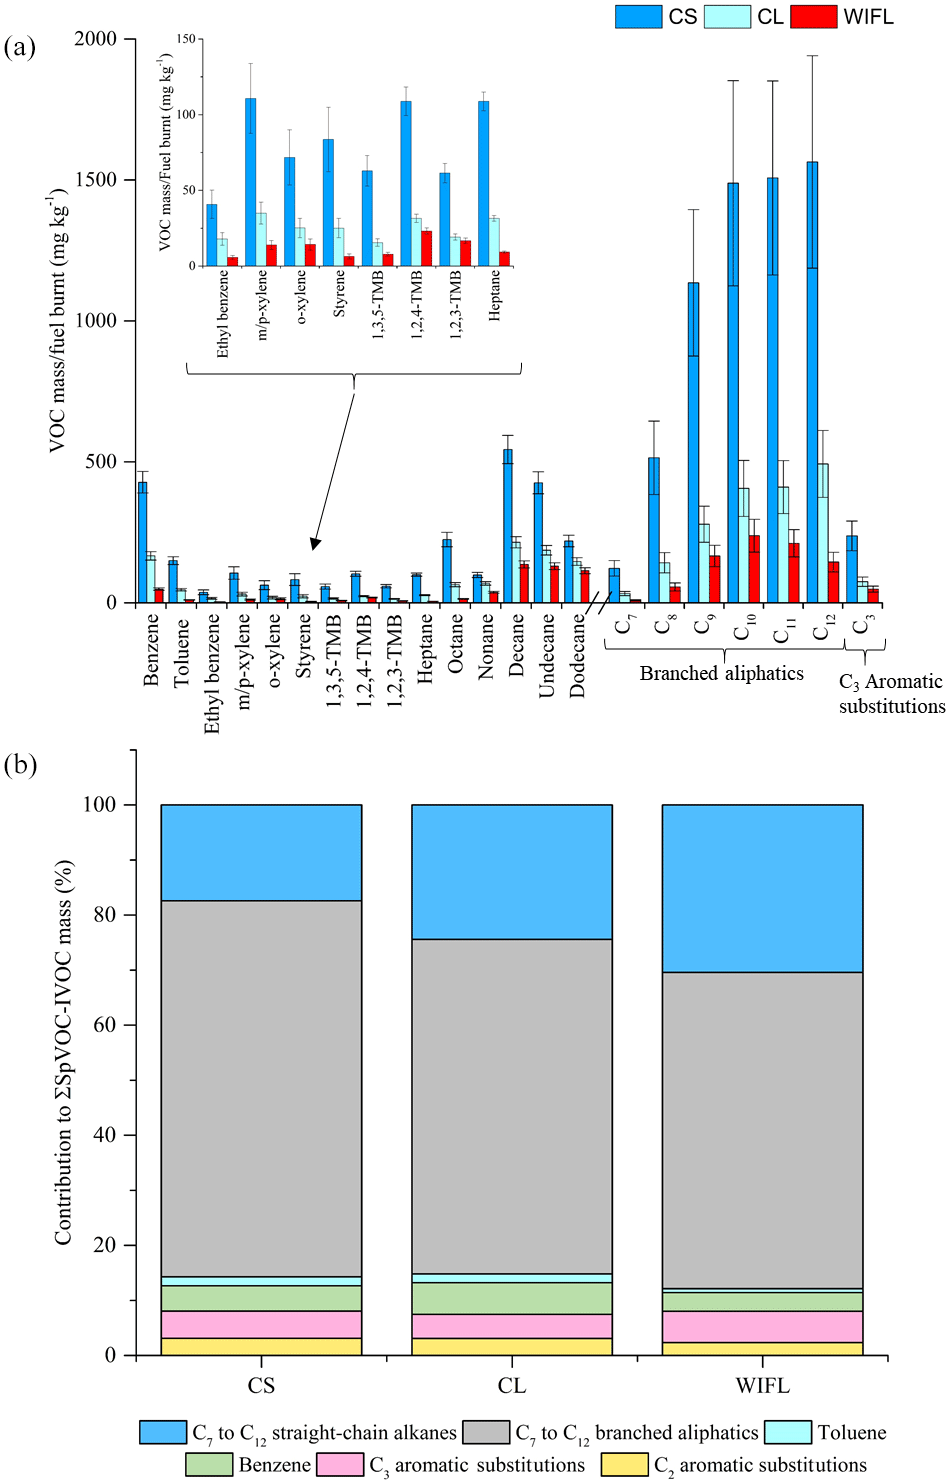
Figure 9Effect of different driving scenarios on measured VOC-IVOC emission rates (a) and the contribution of the individual and grouped compounds to the ∑SpVOC-IVOC emission rate (b). CS is the cold start (exp. 6), CL is the cold loaded (exp. 8), and WIFL is the warm idle following load (exp. 9, see text for further information). The emission rates of tridecane and the C13 branched aliphatic grouping have not been included in (b) to allow direct comparison between other experiments where these species were not measured. Error bars represent the calculated uncertainty in the measured emission rates, see Sect. S1.1 for further information.
The engine temperature in the cold-start and cold-loaded experiments was 85 and 169 ∘C, respectively. In the WIFL experiment, the engine temperature reached 290 ∘C during steady-state, decreasing to 150 ∘C upon injection. The ∑SpVOC-IVOC emission rate was lower in the WIFL experiment than observed in the cold-loaded experiment, where a higher engine temperature was measured upon injection. The HC removal efficiency of the DOC below 200 ∘C is close to zero (Korin et al., 1999; Roberts et al., 2014; Majewski and Khair, 2006; Russell and Epling, 2011), suggesting the lower ∑SpVOC-IVOC emission rate observed in the WIFL experiment is the result of increased combustion efficiency from the higher engine speed and load applied before idling conditions. Engine “warm-up” increases the temperature of the lubricant, coolant, and engine components, reducing friction and increasing combustion efficiency, thus resulting in less unburnt fuel emissions in the exhaust gas (cf. Roberts et al., 2014). This increased combustion efficiency in the WIFL experiment is also supported by the exhaust gas composition (see Fig. 9b). The engine temperatures in all three experiments were below 200 ∘C and consequently the DOC had a minimal effect on HC removal in these experiments. Therefore, the observed compositional changes in exhaust gas is the result of increasing combustion efficiency from the cold-start to WIFL experiments. Straight-chain alkanes are more easily fragmented during combustion than branched aliphatics (Fox and Whitesell, 2004). The sequential increase in the abundance of the C7 to C12 n-alkanes in the exhaust gas from the cold-start to WIFL experiment suggests higher molecular weight n-alkanes which have not been measured (>C13, abundant in diesel fuel and lubricate oil) undergo increasing fragmentation with increasing combustion efficiency, resulting in a higher percentage contribution of smaller n-alkanes (i.e. C7 to C12) to the ∑SpVOC-IVOC emission rates. The relationship between internal combustion efficiency and engine temperature is relatively linear (e.g. Mikalsen and Roskilly, 2009), with the exception of high engine loads and relatively low speeds (not performed here), where the engine combustion efficiency and temperature eventually plateau due to a too lean air to fuel ratio, resulting in incomplete combustion (see Heywood, 1988, for further information). The percentage contribution of the C3 aromatic substitution grouping to the ∑SpVOC-IVOC emission rates displayed no obvious change with increasing combustion efficiency (within the calculated uncertainty). However, the abundance of the C2 aromatic substitution grouping and toluene generally decreased with increasing combustion efficiency, with the percentage contribution observed to plateau in the cold-start and cold-loaded experiments, followed by a decrease in the WIFL experiment.
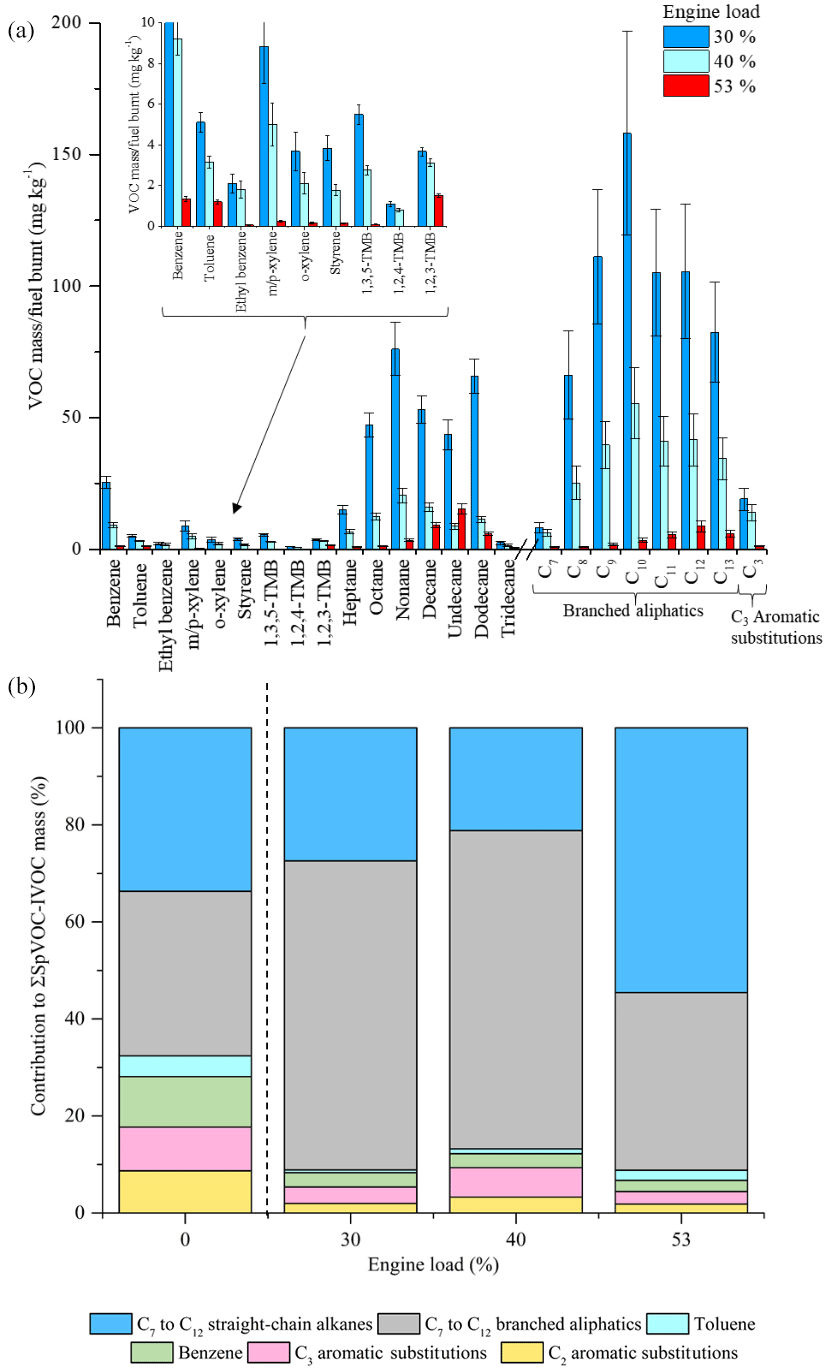
Figure 10Effect of different engine loads on measured VOC-IVOC emission rates (a) and the percentage contribution of the individual and grouped compounds to the ∑SpVOC-IVOC emission rate at 0 (exp. 14), 30 (exp. 12), 40 (exp. 13, and 53 % (exp. 11) engine load (b). The emission rates of tridecane and the C13 branched aliphatic grouping have not been included in (b) to allow direct comparison between other experiments where these species were not measured. For comparison, the percentage contribution of the individual and grouped compounds to the ∑SpVOC emission rate in a cold idle experiment (exp. 14) has been included on the left of (b), see text for further details. Error bars represent the calculated uncertainty in the measured emission rates, see Sect. S1.1 for further information.
3.4 Engine load
The effect of different engine loads, at a constant speed, on the VOC-IVOC emission rates is discussed below. Three experiments were performed at 30, 40, and 53 % engine load (exps. 12, 13, and 11, respectively; see Table 1). The GC × GC-FID was not operational during lower engine load experiments (not presented here). The ∑SpVOC-IVOC emissions were observed to decrease with increasing engine load, with ∑SpVOC-IVOC emission rates of 1019±65, 365±24, and 70±4 mg kg−1 at 30, 40, and 53 % load, respectively (see Table S7). This trend of decreasing VOC emission rates with increasing engine load has been observed in a number of previous studies for light-duty and medium-duty diesel vehicles (Cross et al., 2015; Shirneshan, 2013; Chin et al., 2012; Yamada et al., 2011) and can be explained by considering the engine operation. At low engine temperatures (i.e. low engine loads and idling conditions), the fuel flow is increased to provide easily combustible conditions within the engine cylinder. This additional fuel flow creates a rich fuel to air ratio, where there is insufficient oxygen to burn the fuel, resulting in incomplete combustion and higher VOC-IVOC emission rates from the unburnt fuel. As the engine temperature increases (e.g. with increasing engine load), the in-cylinder oxidation rate increases as the fuel components become more easily combustible at higher temperatures, increasing combustion efficiency and decreasing VOC-IVOC emission rates (Heywood, 1988). The effect of different engine loads, at a constant speed, on the VOC-IVOC emission rates is shown in Fig. 10a. The carbon number distribution of the n-alkanes and branched aliphatics at 30 % and 40 % engine load are comparable. Branched aliphatics display an increase in abundance from C7, reaching peak concentration at C10, followed by a decrease to C13, similar to that observed in Bohac et al. (2006). Straight-chain alkanes do not display the same increase and decrease in abundance, with the emission rates of n-nonane and n-dodecane greater than n-undecane, displaying no obvious trend. At 53 % engine load, the emission profile changes. The most abundant n-alkane and branched aliphatic grouping shifts to higher carbon numbers at higher loads, changing from n-nonane to n-undecane and from C10 to C12 branched aliphatics. The n-alkanes now display a sequential increase and decrease in their emission factors, as observed with the branched aliphatics. This compositional shift to higher carbon number species under higher engine loads has also been observed in Chin et al. (2012) for n-alkanes from an Isuzu 1.7 L diesel engine fuelled with ULSD. Whilst no explanation was provided for this observation, Chin et al. (2012) found the most abundant n-alkane shifted from n-nonane at idling conditions (800 rpm) with no load to n-tridecane at 2500 rpm with maximum applied engine load (900 brake mean effective pressure, kPa).
The percentage contribution of the individual and grouped VOC-IVOCs to the ∑SpVOC-IVOC emission rate in each experiment is shown in Fig. 10b. The percentage composition from a cold-start experiment (exp. 14) has also been included on the left of Fig. 10b to provide a comparison between cold idle engine conditions (which has a compositional profile most similar to unburnt fuel) and different engine loads. The percentage contribution of the individual and grouped VOC-IVOCs to the ∑SpVOC-IVOC emission rate changed considerably with different engine loads. All aromatics, except benzene, displayed a non-monotonic behaviour with increasing engine load; their percentage contribution is high at cold idle and 40 % load, with a smaller contribution at 30 % and 53 % load. This non-monotonic behaviour has also been observed in Cross et al. (2015). Cross et al. (2015) investigated the load-dependant emissions from a 5.9 L medium-duty diesel engine fuelled with ULSD. It was found that the fractional contribution of oxidised species and aromatics (not explicitly mentioned but shown in the data) varied inconsistently with increasing engine load. The reason for this non-monotonic behaviour is currently unclear. The percentage contribution of benzene generally decreased with increasing engine load. Interestingly, the percentage contribution of the n-alkanes continued to decrease from cold idle to 40 % load, followed by a considerable increase at 53 % load. At 53 % load, the n-alkanes represented 55 % of the ∑SpVOC-IVOC emission rate, 1.6 times greater than observed in the cold-start experiment. Conversely, branched aliphatics displayed the opposite trend. The percentage contribution of the branched aliphatics continued to increase from cold idle to 40 % load, followed by a considerable decrease at 53 % load, to approximately the same percentage contribution observed in the cold-start experiment.
This change in the percentage contribution of the n-alkanes and branched aliphatics at 53 % engine load, can be explained by considering the DOC HC removal efficiency and the internal combustion temperature. From cold idle to 40 % engine load, the engine temperature increased from <100 ∘C at cold idle to 445 ∘C at 40 % load. The DOC HC removal efficiency is thus increasing from near zero at cold idle to near maximum at 40 % load. At 53 % load, the steady-state engine temperature reached 700 ∘C. The DOC HC removal efficiency was near maximum at 40 % load and it is therefore unlikely that the DOC would account for such a considerable shift in the percentage contribution of the n-alkanes and branched aliphatics at 53 % load. This shift in the composition is most likely the result of the considerably higher engine temperature, resulting in the fragmentation of higher molecular weight n-alkanes from increased internal combustion efficiency, as observed with the driving scenario experiments, resulting in a higher percentage contribution of C7 to C12 n-alkanes to the ∑SpVOC-IVOC emission rate at 53 % load in comparison to cold idle. The compositional profiles from 0 to 40 % engine load display the combined effect of increasing engine combustion efficiency and DOC HC removal efficiency, possibly explaining why the percentage contribution of C7 to C12 n-alkanes do not increase with increasing engine combustion efficiency (i.e. the DOC is likely masking the effect of increasing combustion efficiency on ∑SpVOC-IVOC emissions). These experiments also provide additional information on the effect of the DOC on the exhaust gas composition. The observation of increasing n-alkane abundance with increasing engine combustion efficiency suggests that the increase in the abundance of the branched aliphatics at cold idle (exp. 14), 30 % (exp. 12), and 40 % engine load (exp. 13), respectively, is the result of the DOC fragmenting higher molecular weight branched aliphatics with increasing HC removal efficiency; indicating that the branched aliphatics are more easily fragmented in the DOC than n-alkanes, possibly the result of the fewer binding sites required in the DOC for adsorption.
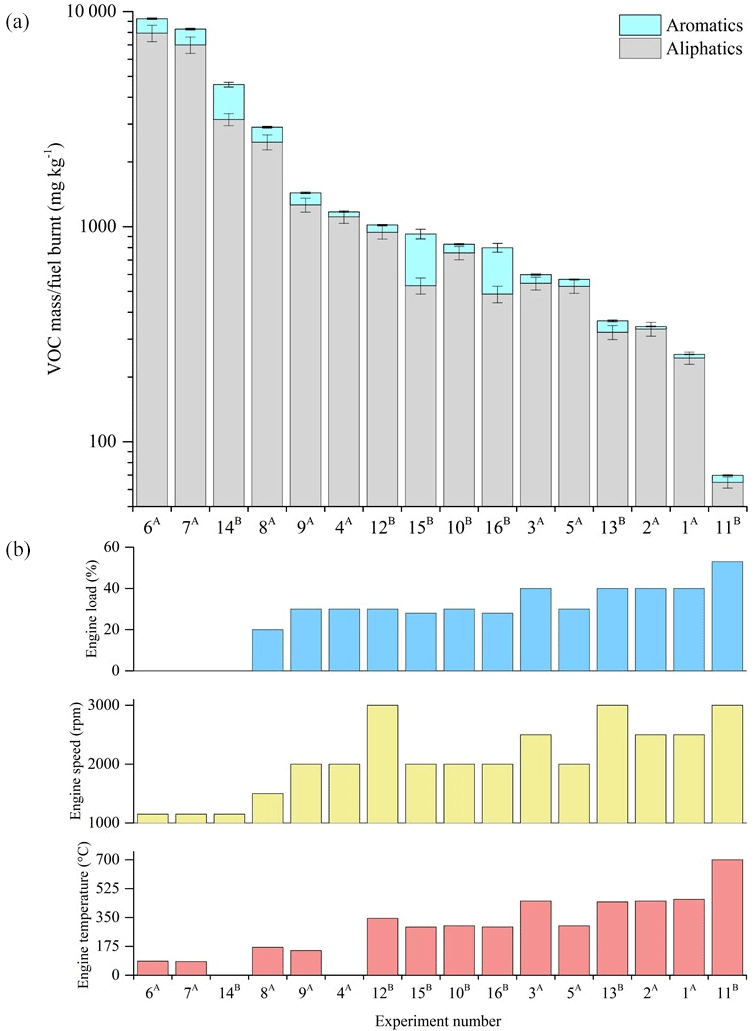
Figure 11Total speciated VOC-IVOC emission rate measured in each experiment (refer to Table 1) divided into aliphatic and aromatic emissions rates (a). Experiments ordered from left-to-right by decreasing VOC-IVOC emission rates. Engine temperature, speed, and load in each corresponding experiment are shown in (b). (a) Fuel batch A used (see Sects. 2.3 and 3.1.1). (b) Fuel batch B used. No DOC in exp. 3. Sequence of engine conditions performed in exps. 9 and 8 (see Sect. 2.1 and Fig. S1). No engine temperature measurement for exps. 4 and 14 (engine thermocouple unresponsive). Error bars represent the calculated uncertainty in the measured emission rates, see Sect. S1.1 for further information.
3.5 Combustion and DOC removal efficiency
The measured ∑SpVOC-IVOC emission rates in each experiment (ordered from highest to lowest) are shown in Fig. 11, along with the corresponding engine load, speed, and temperature. The ∑SpVOC-IVOC emission rates varied significantly with different engine conditions, ranging from 70 to 9268 mg kg−1. The aliphatics represented 56 to 97 % of the ∑SpVOC-IVOC emission rates, with the single-ring aromatics accounting for the remainder. The highest ∑SpVOC-IVOC emissions were observed in a cold-start experiment (exp. 6) with no applied load and idling speed (1150 rpm). Conversely, the lowest ∑SpVOC-IVOC emissions were observed in the experiment with highest applied engine load and speed (exp. 11, 3000 rpm, 53 % load). The ∑SpVOC-IVOC emission rates were observed to decrease with increasing engine load and temperature, and to a lesser degree engine speed. This result is consistent with increased combustion efficiency and DOC HC removal efficiency with increasing engine temperature, similar to that observed in previous studies (e.g. Cross et al., 2015; Chin et al., 2012).
Urban driving conditions are characterised by low engine speed, load, and exhaust gas temperatures (cf. Franco et al., 2014; EEA, 2016). Conversely, motorway or highway driving typically result in higher engine temperatures, due to increased engine speed and load. The results from this study show that at low engine loads and speeds, the emission rates of unregulated VOC-IVOCs per kilogram of fuel burnt are considerably greater than emitted at higher engine speeds and loads (emission rates were 65 times greater from a cold-start than at maximum applied engine speed and load). Furthermore, it was found that the exhaust gas composition varied with combustion efficiency and DOC HC removal efficiency, both which are strongly dependent on working temperature (Korin et al., 1999; Roberts et al., 2014; Majewski and Khair, 2006; Russell and Epling, 2011). The effect of combustion efficiency on the exhaust gas composition was observed at engine temperatures below ∼150 ∘C (below the working temperature of the DOC) and at the maximum applied engine speed and load (700 ∘C), where combustion efficiency dominated over the effect of the DOC on the exhaust gas composition. At engine temperatures ranging from 150 to 450 ∘C, the combined effect of engine combustion and DOC HC removal efficiency on the exhaust gas composition was observed.
3.6 Discussion
Diesel exhaust emissions contain thousands of compounds ranging from ∼C5 to C22, with contributions of up to C33 from lubricant oil (Alam et al., 2016; Gentner et al., 2017). Only a proportion of these emissions were speciated in this study. Of the measured compounds, branched aliphatics generally dominated the exhaust gas composition. An increasing contribution of branched aliphatics in the exhaust gas was observed with increasing engine temperature from ∼150 to 450 ∘C and is likely due to increasing DOC HC removal efficiency. However, below the working temperature of the DOC (<150 ∘C), the proportion of n-alkanes in the exhaust gas were observed to increase with increasing combustion efficiency and could be important in urban environments; straight-chain alkanes are more efficient at producing SOA than their branched counterparts (Presto et al., 2010; Tkacik et al., 2012; Lim and Ziemann, 2009). Previous studies have suggested that liquid-fuel-based emission factors are consistent with unburnt fuel in diesel exhaust emissions. For example, Gentner et al. (2013) showed the majority of VOC and IVOC diesel exhaust emissions were within 70 % uncertainty of liquid-fuel-based emission factors. This work shows that as combustion efficiency increases, the contribution of smaller, more volatile (C7 to C13) n-alkanes in the exhaust gas also increases, the result of increased fragmentation of higher molecular weight n-alkanes (>C13, not measured) likely from the fuel and lubricating oil. This may suggest diesel liquid-fuel-based estimates of SOA yields may be inconsistent with diesel exhaust SOA yields, particularly at high engine temperatures (i.e. high engine loads and speeds).
Table 3Literature emission rates (expressed as mass emitted per kg of fuel burnt) from diesel exhaust emissions using different vehicle types and engine conditions.
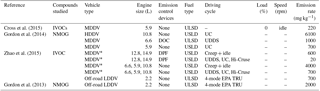
* is the average emission rate of multiple experiments and
vehicles with similar engine and driving cycle conditions, see Zhao et
al. (2015) for further information. UC is the unified
driving
cycle. UDDS is the urban dynamometer driving schedule. EPA TRU is the
Environment Protection Agency transportation refrigeration unit, see Gordon
et al. (2013) for
further information. NMOG – nonmethane
organic gases. LDDV – light duty diesel vehicle. MDDV – medium duty diesel
vehicle. HDDV – heavy duty diesel vehicle.
DOC – diesel
oxidative catalyst. DPF – diesel particulate filter. ULSD – ultra-low
sulfur diesel.
The comparison of emission rates is difficult between studies due to the vast number of differences (types of speciated compounds and volatility range, vehicular types, emission control devices, etc.). Furthermore, few studies have investigated the effect of different engine conditions on the exhaust gas composition. The majority of studies have investigated diesel exhaust emissions using chassis dynamometers, averaging emissions over entire driving cycles and often reporting emission rates as mass emitted per distance travelled; emissions and units which are not directly comparable with the emission rates shown in this work. The different types of instruments used to measure diesel exhaust emissions and the difficulties in the measurement of low volatility species has, in-part, resulted in considerable variation in the types of “speciated” compounds between studies, further compounding the difficultly in the direct comparison of emission rates. For example, Zhao et al. (2015) reported speciated and unspeciated IVOC emission rates from both medium-duty and heavy-duty diesel vehicles. In their study, speciated IVOCs included straight- and branched-chain alkanes, alkylcyclohexanes, unsubstituted and substituted polycyclic aromatic hydrocarbons, and alkylbenzenes with a volatility range of C∗ 102 to 106 µg m−3. Similarly, Cross et al. (2015) measured IVOC emission rates from a medium-duty diesel engine. The emission rates reported in their study were based on compounds with a volatility range of C∗ ∼ 103 to 107 µg m−3 and included cycloalkanes, bicycloalkanes, tricycloalkanes, straight and branched-chain aliphatics, and groupings of “aromatics”, “oxidised” and “remainder”. Gordon et al. (2014) measured the emission rates of non-methane organic gases from medium-duty and heavy-duty diesel engines. In their study, speciated compounds included single-ring aromatics, straight- and branched-chain aliphatics, cycloalkanes and non-aromatic carbonyls with a volatility range of C∗ ∼106 to 109 µg m−3. In this study, the emission rates from a light-duty diesel engine were reported, based on the emissions of straight and branched-chain aliphatics and single-ring aromatics with two and three carbon substituents, with a carbon range of C6 to C13 and a volatility range of C∗ ∼105 to 108 µg m−3. The investigated chemical composition and volatility range can have a considerable impact on the reported emission rates (e.g. Zhao et al., 2015). The emission rates from comparable experiments in the studies discussed above can be observed in Table 3. However, a direct comparison of these emission rates with the results shown here has not been performed due to the differences in vehicular type (medium-duty and heavy-duty vs. light-duty vehicles) and the volatility and chemical composition of the speciated compounds. Further studies are required, providing emission rates of individually speciated compounds (where possible) to facilitate direct comparison.
Tailpipe sampling requires instruments capable of providing instantaneous measurements of the chemical composition. This rapid analysis time comes at the expense of detailed chemical speciation. The use of an atmospheric simulation chamber in this study allowed instruments requiring longer sampling times to be used, such as the GC × GC-FID. The chamber allowed detailed chemical speciation of the exhaust gas composition to be instantaneously measured under specific ambient temperatures and engine conditions, which would not have been possible with direct tailpipe sampling. Thus, the chamber sampling method is complimentary to tailpipe measurements, allowing a more thorough characterisation of the exhaust gas composition through the identification of individual hydrocarbon components. The emission control devices used in this study were Euro 4 compliant. Euro 4 emission control regulations were first implemented for all new vehicles from approximately January 2006, with Euro 5 emission control regulations starting after January 2011. Currently ∼20 % of the European Union diesel fleet are Euro 4 compliant (ACEA, 2017). The emission rates from only one diesel engine were investigated in this study. However, several compositional changes in the exhaust gas were comparable with previous studies, suggesting the effect of engine combustion and DOC HC removal efficiency on the exhaust gas composition are relatively consistent between studies. In recent years, emission regulations have focused on reducing NOx emissions from diesel vehicles with the introduction of emission control technologies, such as exhaust gas recirculation, lean-burnt NOx traps, and selective catalytic reduction (Yang et al., 2015). However, to our knowledge there are no further emission control technologies planned for the reduction of total hydrocarbon mass or unregulated VOCs. To reduce the effect of diesel exhaust emissions on local air quality, further technologies must be developed to reduce emission rates, specifically from cold engine conditions (i.e. poor combustion efficiencies) and below the working temperature of DOCs. The experimental approach and results presented in this work will support further studies investigating the effect of different combustion engines, emission control devices, and atmospheric conditions on the composition and evolution of exhaust gas emissions. To our knowledge, this is the first study using an atmospheric simulation chamber to separate the effects of the DOC and combustion efficiency on the exhaust gas composition.
The data are provided in the Supplement.
The supplement related to this article is available online at: https://doi.org/10.5194/acp-18-11073-2018-supplement.
KLP maintained and operated the TD-GC × GC-FID, analysed the data, and wrote the manuscript. RD developed the TD-GC × GC-FID method and aided in the setup and maintenance of the instrument. MRA and JW operated the engine and designed the experiments with contributions from GM, JDA, KLP, JFH, and RMH. MRA operated the MAC. JFH and GM supervised the York and Manchester component of this work, respectively. All co-authors contributed to the manuscript and project discussions.
The authors declare that they have no conflict of interest.
The Manchester Aerosol Chamber previously received funding from the European
Union's FP7 EUROCHAMP2 network and the Horizon 2020 research and innovation
programme through the EUROCHAMP-2020 Infrastructure Activity under grant
agreement no. 730997. The authors gratefully acknowledge the assistance of
mechanical technicians Barry Gale and Lee Paul at the University of
Manchester. This work was supported by NE/K012959/1 and
NE/K014838/1.
Edited by: Ulrich
Pöschl
Reviewed by: three anonymous referees
ACEA: ACEA Report: Vehicles in use Europe 2016, available at: https://www.acea.be/statistics/article/trends-in-fuel-type-of-new-cars-between-2015-and-2016-by-country (last access: 2 August 2018), 2016.
ACEA: ACEA Report: Vehicles in use Europe 2017, available at: http://www.acea.be/uploads/statistic_documents/ACEA_Report_Vehicles_in_use-Europe_2017.pdf (last access: 2 August 2016), 2017.
Alam, M. S., Zeraati-Rezaei, S., Stark, C. P., Liang, Z., Xu, H., and Harrison, R. M.: The characterisation of diesel exhaust particles – composition, size distribution and partitioning, Faraday Discuss., 189, 69–84, https://doi.org/10.1039/C5FD00185D, 2016.
Alfarra, M. R., Hamilton, J. F., Wyche, K. P., Good, N., Ward, M. W., Carr, T., Barley, M. H., Monks, P. S., Jenkin, M. E., Lewis, A. C., and McFiggans, G. B.: The effect of photochemical ageing and initial precursor concentration on the composition and hygroscopic properties of beta-caryophyllene secondary organic aerosol, Atmos Chem Phys, 12, 6417-6436, 2012.
Alkurdi, F., Karabet, F., and Dimashki, M.: Characterization, concentrations and emission rates of polycyclic aromatic hydrocarbons in the exhaust emissions from in-service vehicles in Damascus, Atmos. Res., 120–121, 68–77, https://doi.org/10.1016/j.atmosres.2012.08.003, 2013.
Alves, C. A., Lopes, D. J., Calvo, A. I., Evtyugina, M., Rocha, S., and Nunes, T.: Emissions from light-duty diesel and gasoline in-use vehicles measured on chassis dynamometer test cycles, Aerosol Air Qual. Res., 15, 99–116, 2015.
Baldauf, R. W., Gabele, P., Crews, W., Snow, R., and Cook, J. R.: Criteria and Air-Toxic Emissions from In-Use Automobiles in the National Low-Emission Vehicle Program, J. Air Waste Manage., 55, 1263–1268, https://doi.org/10.1080/10473289.2005.10464722, 2005.
Ballesteros, R., Guillén-Flores, J., and Martínez, J. D.: Carbonyl emission and toxicity profile of diesel blends with an animal-fat biodiesel and a tire pyrolysis liquid fuel, Chemosphere, 96, 155–166, https://doi.org/10.1016/j.chemosphere.2013.10.017, 2014.
Bohac, S. V., Han, M., Jacobs, T. J., López, A. J., Assanis, D. N., and Szymkowicz, P. G.: Speciated Hydrocarbon Emissions from an Automotive Diesel Engine and DOC Utilizing Conventional and PCI Combustion, 2006.
Caplain, I., Cazier, F., Nouali, H., Mercier, A., Déchaux, J.-C., Nollet, V., Joumard, R., André, J.-M., and Vidon, R.: Emissions of unregulated pollutants from European gasoline and diesel passenger cars, Atmos. Environ., 40, 5954–5966, https://doi.org/10.1016/j.atmosenv.2005.12.049, 2006.
Chin, J.-Y., Batterman, S. A., Northrop, W. F., Bohac, S. V., and Assanis, D. N.: Gaseous and Particulate Emissions from Diesel Engines at Idle and under Load: Comparison of Biodiesel Blend and Ultralow Sulfur Diesel Fuels, Energ. Fuel., 26, 6737–6748, https://doi.org/10.1021/ef300421h, 2012.
Chirico, R., Clairotte, M., Adam, T. W., Giechaskiel, B., Heringa, M. F., Elsasser, M., Martini, G., Manfredi, U., Streibel, T., Sklorz, M., Zimmermann, R., DeCarlo, P. F., Astorga, C., Baltensperger, U., and Prevot, A. S. H.: Emissions of organic aerosol mass, black carbon, particle number, and regulated and unregulated gases from scooters and light and heavy duty vehicles with different fuels, Atmos. Chem. Phys. Discuss., 14, 16591–16639, https://doi.org/10.5194/acpd-14-16591-2014, 2014.
Cohen, A. J., Ross Anderson, H., Ostro, B., Pandey, K. D., Krzyzanowski, M., Künzli, N., Gutschmidt, K., Pope, A., Romieu, I., Samet, J. M., and Smith, K.: The Global Burden of Disease Due to Outdoor Air Pollution, J. Toxicol. Env. Heal. A, 68, 1301–1307, https://doi.org/10.1080/15287390590936166, 2005.
Colvile, R., Hutchinson, E., Mindell, J., and Warren, R.: The transport sector as a source of air pollution, Atmos. Environ., 35, 1537–1565, 2001.
Cross, E. S., Sappok, A. G., Wong, V. W., and Kroll, J. H.: Load-Dependent Emission Factors and Chemical Characteristics of IVOCs from a Medium-Duty Diesel Engine, Environ. Sci. Technol., 49, 13483–13491, https://doi.org/10.1021/acs.est.5b03954, 2015.
DEFRA (Department for environment, food and rural affairs): Diesel Vehicle Emissions and Urban Air Quality, available at: https://uk-air.defra.gov.uk/library/reports?report_id=56 (last access: 2 August 2018), 1993.
Donahue, N., Robinson, A., Stanier, C., and Pandis, S.: Coupled partitioning, dilution, and chemical aging of semivolatile organics, Environ. Sci. Technol., 40, 2635–2643, 2006.
Dunmore, R. E., Hopkins, J. R., Lidster, R. T., Lee, J. D., Evans, M. J., Rickard, A. R., Lewis, A. C., and Hamilton, J. F.: Diesel-related hydrocarbons can dominate gas phase reactive carbon in megacities, Atmos. Chem. Phys., 15, 9983–9996, https://doi.org/10.5194/acp-15-9983-2015, 2015.
EEA: Explaining road transport emissions, available at: https://www.eea.europa.eu/publications/explaining-road-transport-emissions (last access: 2 August 2018), 2016.
EU: Offical Journal of the European Union: Directive 2009/30/EC, L 140/88, available at: http://www.ebb-eu.org/legis/FQD2009-30-EC_EN.pdf (last access: 2 August 2018), 2009.
Fox, M. and Whitesell, J.: Organic Chemistry, 3rd Edn., Jones and Bartlett, London, 1140 pp., 2004.
Franco, V., Sánchez, F. P., German, J., and Mock, P.: Real-world exhaust emissions from modern diesel cars, available at: https://www.theicct.org/sites/default/files/publications/ICCT_PEMS-study_diesel-cars_20141013_0.pdf (last access: 2 August 2018), 2014.
Fraser, M. P., Cass, G. R., and Simoneit, B. R. T.: Gas-Phase and Particle-Phase Organic Compounds Emitted from Motor Vehicle Traffic in a Los Angeles Roadway Tunnel, Environ. Sci. Technol., 32, 2051–2060, https://doi.org/10.1021/es970916e, 1998.
Gentner, D. R., Worton, D. R., Isaacman, G., Davis, L. C., Dallmann, T. R., Wood, E. C., Herndon, S. C., Goldstein, A. H., and Harley, R. A.: Chemical Composition of Gas-Phase Organic Carbon Emissions from Motor Vehicles and Implications for Ozone Production, Environ. Sci. Technol., 47, 11837–11848, https://doi.org/10.1021/es401470e, 2013.
Gentner, D. R., Jathar, S. H., Gordon, T. D., Bahreini, R., Day, D. A., El Haddad, I., Hayes, P. L., Pieber, S. M., Platt, S. M., de Gouw, J., Goldstein, A. H., Harley, R. A., Jimenez, J. L., Prévôt, A. S. H., and Robinson, A. L.: Review of Urban Secondary Organic Aerosol Formation from Gasoline and Diesel Motor Vehicle Emissions, Environ. Sci. Technol., 51, 1074–1093, https://doi.org/10.1021/acs.est.6b04509, 2017.
Gordon, T. D., Tkacik, D. S., Presto, A. A., Zhang, M., Jathar, S. H., Nguyen, N. T., Massetti, J., Truong, T., Cicero-Fernandez, P., Maddox, C., Rieger, P., Chattopadhyay, S., Maldonado, H., Maricq, M. M., and Robinson, A. L.: Primary Gas- and Particle-Phase Emissions and Secondary Organic Aerosol Production from Gasoline and Diesel Off-Road Engines, Environ. Sci. Technol., 47, 14137–14146, 2013.
Gordon, T. D., Presto, A. A., Nguyen, N. T., Robertson, W. H., Na, K., Sahay, K. N., Zhang, M., Maddox, C., Rieger, P., Chattopadhyay, S., Maldonado, H., Maricq, M. M., and Robinson, A. L.: Secondary organic aerosol production from diesel vehicle exhaust: impact of aftertreatment, fuel chemistry and driving cycle, Atmos. Chem. Phys., 14, 4643–4659, https://doi.org/10.5194/acp-14-4643-2014, 2014.
Hamilton, J. F. and Lewis, A. C.: Monoaromatic complexity in urban air and gasoline assessed using comprehensive GC and fast GC-TOF/MS, Atmos. Environ., 37, 589–602, 2003.
Han, X. and Naeher, L. P.: A review of traffic-related air pollution exposure assessment studies in the developing world, Environ. Int., 32, 106–120, https://doi.org/10.1016/j.envint.2005.05.020, 2006.
HEI: Panel on the Health Effects of Traffic-Related Air Pollution, Traffic-Related Air Pollution: A Critical Review of the Literature on Emissions, Exposure, and Health Effects. HEI Special Report 17, Health Effects Institute, Boston, MA, 2010.
Heywood, J. B.: Internal combustion engine fundamentals, Mcgraw-Hill, New York, 1988.
Ježek, I., Katrašnik, T., Westerdahl, D., and Močnik, G.: Black carbon, particle number concentration and nitrogen oxide emission factors of random in-use vehicles measured with the on-road chasing method, Atmos. Chem. Phys., 15, 11011–11026, https://doi.org/10.5194/acp-15-11011-2015, 2015.
Jiang, M., Marr, L. C., Dunlea, E. J., Herndon, S. C., Jayne, J. T., Kolb, C. E., Knighton, W. B., Rogers, T. M., Zavala, M., Molina, L. T., and Molina, M. J.: Vehicle fleet emissions of black carbon, polycyclic aromatic hydrocarbons, and other pollutants measured by a mobile laboratory in Mexico City, Atmos. Chem. Phys., 5, 3377–3387, https://doi.org/10.5194/acp-5-3377-2005, 2005.
Johnson, T. V.: Diesel Emission Control in Review, SAE Int. J. Fuels Lubr., 2, 1–12, 2009.
Korin, E., Reshef, R., Tshernichovesky, D., and Sher, E.: Reducing cold-start emission from internal combustion engines by means of a catalytic converter embedded in a phase-change material, P. I. Mech. Eng. D-J. Aut., 213, 575–583, https://doi.org/10.1243/0954407991527116, 1999.
Kristensson, A., Johansson, C., Westerholm, R., Swietlicki, E., Gidhagen, L., Wideqvist, U., and Vesely, V.: Real-world traffic emission factors of gases and particles measured in a road tunnel in Stockholm, Sweden, Atmos. Environ., 38, 657–673, https://doi.org/10.1016/j.atmosenv.2003.10.030, 2004.
Krzyzanowski, M. and Cohen, A.: Update of WHO air quality guidelines, Air Qual. Atmos. Hlth., 1, 7–13, https://doi.org/10.1007/s11869-008-0008-9, 2008.
Lidster, R. T.: Development of comprehensive two-dimensional gas chromatography for the analysis of volatile organic compounds in the atmosphere, University of York, UK, 2012.
Lidster, R. T., Hamilton, J. F., and Lewis, A. C.: The application of two total transfer valve modulators for comprehensive two-dimensional gas chromatography of volatile organic compounds, J. Sep. Sci., 34, 812–821, https://doi.org/10.1002/jssc.201000710, 2011.
Lim, Y. B. and Ziemann, P. J.: Effects of Molecular Structure on Aerosol Yields from OH Radical-Initiated Reactions of Linear, Branched, and Cyclic Alkanes in the Presence of NOx, Environ. Sci. Technol., 43, 2328–2334, https://doi.org/10.1021/es803389s, 2009.
Liu, Y., Gao, Y., Yu, N., Zhang, C., Wang, S., Ma, L., Zhao, J., and Lohmann, R.: Particulate matter, gaseous and particulate polycyclic aromatic hydrocarbons (PAHs) in an urban traffic tunnel of China: Emission from on-road vehicles and gas-particle partitioning, Chemosphere, 134, 52–59, https://doi.org/10.1016/j.chemosphere.2015.03.065, 2015.
Louis, C., Liu, Y., Tassel, P., Perret, P., Chaumond, A., and André, M.: PAH, BTEX, carbonyl compound, black-carbon, NO2 and ultrafine particle dynamometer bench emissions for Euro 4 and Euro 5 diesel and gasoline passenger cars, Atmos. Environ., 141, 80–95, https://doi.org/10.1016/j.atmosenv.2016.06.055, 2016.
Machado Corrêa, S. and Arbilla, G.: Carbonyl emissions in diesel and biodiesel exhaust, Atmos. Environ., 42, 769–775, https://doi.org/10.1016/j.atmosenv.2007.09.073, 2008.
Majewski, W. A. and Khair, M. K.: Diesel Emissions and Their Control, SAE International, Warrendale, 2006.
Miguel, A. H., Kirchstetter, T. W., Harley, R. A., and Hering, S. V.: On-Road Emissions of Particulate Polycyclic Aromatic Hydrocarbons and Black Carbon from Gasoline and Diesel Vehicles, Environ. Sci. Technol., 32, 450–455, https://doi.org/10.1021/es970566w, 1998.
Mikalsen, R. and Roskilly, A.: The fuel efficiency and exhaust gas emissions of a low heat rejection free-piston diesel engine, SAGE, 233, 4, https://doi.org/10.1243/09576509JPE653, 2009.
Nelson, P. F., Tibbett, A. R., and Day, S. J.: Effects of vehicle type and fuel quality on real world toxic emissions from diesel vehicles, Atmos. Environ., 42, 5291–5303, https://doi.org/10.1016/j.atmosenv.2008.02.049, 2008.
Pang, Y., Fuentes, M., and Rieger, P.: Trends in the emissions of Volatile Organic Compounds (VOCs) from light-duty gasoline vehicles tested on chassis dynamometers in Southern California, Atmos. Environ., 83, 127–135, https://doi.org/10.1016/j.atmosenv.2013.11.002, 2014.
Presto, A. A., Miracolo, M. A., Donahue, N. M., and Robinson, A. L.: Secondary Organic Aerosol Formation from High-NOx Photo-Oxidation of Low Volatility Precursors: n-Alkanes, Environ. Sci. Technol., 44, 2029–2034, https://doi.org/10.1021/es903712r, 2010.
Prüss-Üstün, A. and Corvalán, C.: Preventing disease through healthy environments, World Health Organization, Geneva, 2006.
Rashid, G., Hekmat, R., Nejat, L. A., Payam, J., and Farzad, J.: Comparative analysis of exhaust gases from MF285 and U650 tractors under field conditions, Agricultural Engineering International, CIGR Journal, 15, 101–107, 2013.
Roberts, A., Brooks, R., and Shipway, P.: Internal combustion engine cold-start efficiency: A review of the problem, causes and potential solutions, Energ. Convers. Manage., 82, 327–350, https://doi.org/10.1016/j.enconman.2014.03.002, 2014.
Russell, A. and Epling, W. S.: Diesel Oxidation Catalysts, Cataly. Rev., 53, 337–423, https://doi.org/10.1080/01614940.2011.596429, 2011.
Salge, J., Deluga, G., and Schmidt, L.: Catalytic partial oxidation of ethanol over noble metal catalysts, J. Catal., 235, 69–78, 2005.
Schauer, J. J., Kleeman, M. J., Cass, G. R., and Simoneit, B. R. T.: Measurement of Emissions from Air Pollution Sources. 2. C1 through C30 Organic Compounds from Medium Duty Diesel Trucks, Environ. Sci. Technol., 33, 1578–1587, https://doi.org/10.1021/es980081n, 1999.
Schmitz, T., Hassel, D., and Weber, F.-J.: Determination of VOC-components in the exhaust of gasoline and diesel passenger cars, Atmos. Environ., 34, 4639–4647, https://doi.org/10.1016/S1352-2310(00)00303-4, 2000.
Schulz, H., Bandeira De Melo, G., and Ousmanov, F.: Volatile organic compounds and particulates as components of diesel engine exhaust gas, Combust. Flame, 118, 179–190, https://doi.org/10.1016/S0010-2180(98)00146-1, 1999.
Shirneshan, A.: HC, CO, CO2 and NOx Emission Evaluation of a Diesel Engine Fueled with Waste Frying Oil Methyl Ester, Procd. Soc. Behv., 75, 292–297, https://doi.org/10.1016/j.sbspro.2013.04.033, 2013.
Siegl, W. O., Hammerle, R. H., Herrmann, H. M., Wenclawiak, B. W., and Luers-Jongen, B.: Organic emissions profile for a light-duty diesel vehicle, Atmos. Environ., 33, 797–805, https://doi.org/10.1016/S1352-2310(98)00209-X, 1999.
Staehelin, J., Keller, C., Stahel, W., Schläpfer, K., and Wunderli, S.: Emission factors from road traffic from a tunnel study (Gubrist tunnel, Switzerland). Part III: Results of organic compounds, SO2 and speciation of organic exhaust emission, Atmos. Environ., 32, 999–1009, https://doi.org/10.1016/S1352-2310(97)00339-7, 1998.
Tadano, Y. S., Borillo, G. C., Godoi, A. F. L., Cichon, A., Silva, T. O. B., Valebona, F. B., Errera, M. R., Penteado Neto, R. A., Rempel, D., Martin, L., Yamamoto, C. I., and Godoi, R. H. M.: Gaseous emissions from a heavy-duty engine equipped with SCR aftertreatment system and fuelled with diesel and biodiesel: Assessment of pollutant dispersion and health risk, Sci. Total Environ., 500–501, 64–71, https://doi.org/10.1016/j.scitotenv.2014.08.100, 2014.
Tkacik, D. S., Presto, A. A., Donahue, N. M., and Robinson, A. L.: Secondary Organic Aerosol Formation from Intermediate-Volatility Organic Compounds: Cyclic, Linear, and Branched Alkanes, Environ. Sci. Technol., 46, 8773–8781, https://doi.org/10.1021/es301112c, 2012.
United Nations: World Urbanization Prospects: The 2014 Revision, Highlights, Department of Economic and Social Affairs, Population Division, United Nations, available at: https://esa.un.org/unpd/wup/Publications/Files/WUP2014-Highlights.pdf (last access: 2 August 2018), 2014.
Westerholm, R. N., Almen, J., Li, H., Rannug, J. U., Egebaeck, K. E., and Graegg, K.: Chemical and biological characterization of particulate-, semivolatile-, and gas-phase-associated compounds in diluted heavy-duty diesel exhausts: a comparison of three different semivolatile-phase samplers, Environ. Sci. Technol., 25, 332–338, https://doi.org/10.1021/es00014a018, 1991.
WHO: World Health Organization Air quality guidelines for particulate matter, ozone, nitrogen dioxide and sulfur dioxide: global update 2005: summary of risk assessment, Geneva, Switzerland, 2006.
Williams, P. I., McFiggans, G., and Gallagher, M. W.: Latitudinal aerosol size distribution variation in the Eastern Atlantic Ocean measured aboard the FS-Polarstern, Atmos. Chem. Phys., 7, 2563–2573, https://doi.org/10.5194/acp-7-2563-2007, 2007.
Winklmayr, W., Reischl, G. P., Lindner, A. O., and Berner, A.: A new electromobility spectrometer for the measurement of aerosol size distributions in the size range from 1 to 1000 nm, J. Aerosol Sci., 22, 289–296, https://doi.org/10.1016/S0021-8502(05)80007-2, 1991.
Yamada, H., Misawa, K., Suzuki, D., Tanaka, K., Matsumoto, J., Fujii, M., and Tanaka, K.: Detailed analysis of diesel vehicle exhaust emissions: Nitrogen oxides, hydrocarbons and particulate size distributions, P. Combust. Inst., 33, 2895–2902, https://doi.org/10.1016/j.proci.2010.07.001, 2011.
Yang, L., Franco, V., Mock, P., Kolke, R., Zhang, S., Wu, Y., and German, J.: Experimental Assessment of NOx Emissions from 73 Euro 6 Diesel Passenger Cars, Environ. Sci. Technol., 49, 14409–14415, https://doi.org/10.1021/acs.est.5b04242, 2015.
Yao, Y.-F. Y.: Oxidation of Alkanes over Noble Metal Catalysts, Ind. Eng. Chem. Prod. RD, 19, 293–298, https://doi.org/10.1021/i360075a003, 1980.
Zavala, M., Herndon, S. C., Slott, R. S., Dunlea, E. J., Marr, L. C., Shorter, J. H., Zahniser, M., Knighton, W. B., Rogers, T. M., Kolb, C. E., Molina, L. T., and Molina, M. J.: Characterization of on-road vehicle emissions in the Mexico City Metropolitan Area using a mobile laboratory in chase and fleet average measurement modes during the MCMA-2003 field campaign, Atmos. Chem. Phys., 6, 5129–5142, https://doi.org/10.5194/acp-6-5129-2006, 2006.
Zhao, Y., Nguyen, N. T., Presto, A. A., Hennigan, C. J., May, A. A., and Robinson, A. L.: Intermediate Volatility Organic Compound Emissions from On-Road Diesel Vehicles: Chemical Composition, Emission Factors, and Estimated Secondary Organic Aerosol Production, Environ. Sci. Technol., 49, 11516–11526, https://doi.org/10.1021/acs.est.5b02841, 2015.
Zhu, L., Cheung, C. S., Zhang, W. G., Fang, J. H., and Huang, Z.: Effects of ethanol–biodiesel blends and diesel oxidation catalyst (DOC) on particulate and unregulated emissions, Fuel, 113, 690–696, https://doi.org/10.1016/j.fuel.2013.06.028, 2013.