the Creative Commons Attribution 4.0 License.
the Creative Commons Attribution 4.0 License.
 | 03 Aug 2018
Does afforestation deteriorate haze pollution in Beijing–Tianjin–Hebei (BTH), China?
Xin Long
Naifang Bei
Jiarui Wu
Xia Li
Tian Feng
Li Xing
Shuyu Zhao
Junji Cao
Xuexi Tie
Zhisheng An
Guohui Li
Although aggressive emission control strategies have been implemented recently in the Beijing–Tianjin–Hebei area (BTH), China, pervasive and persistent haze still frequently engulfs the region during wintertime. Afforestation in BTH, primarily concentrated in the Taihang and Yan Mountains, has constituted one of the controversial factors exacerbating the haze pollution due to its slowdown of the surface wind speed. We report here an increasing trend of forest cover in BTH during 2001–2013 based on long-term satellite measurements and the impact of the afforestation on the fine-particle (PM2.5) level. Simulations using the Weather Research and Forecast model with chemistry reveal that afforestation in BTH since 2001 has generally been deteriorating the haze pollution in BTH to some degree, enhancing PM2.5 concentrations by up to 6 % on average. Complete afforestation or deforestation in the Taihang and Yan Mountains would increase or decrease the PM2.5 level within 15 % in BTH. Our model results also suggest that implementing a large ventilation corridor system would not be effective or beneficial to mitigate the haze pollution in Beijing.
- Article
(8321 KB) - Full-text XML
-
Supplement
(7475 KB) - BibTeX
- EndNote


Heavy haze with extremely high levels of fine particles (PM2.5), caused by rapid growth of industrialization, urbanization, and transportation, frequently covers northern China during wintertime, particularly in the Beijing–Tianjin–Hebei area (BTH). The haze pollution in BTH remarkably impairs visibility and potentially causes severe health defects (Lim et al., 2013; Wang and Hao, 2012). The Chinese State Council issued the “Air Pollution Prevention and Control Action Plan” (APPCAP) in September 2013 with the aim of improving China's air quality within 5 years and reducing PM2.5 by up to 25 % by 2017 relative to 2012 levels. Although aggressive emission control strategies have been undertaken since the initiation and implementation of the Action Plan, widespread and persistent haze still often engulfs BTH.
Aside from emissions, meteorological conditions play a key role in the haze pollution, affecting the formation, transformation, diffusion, transport, and removal of PM2.5 in the atmosphere (Bei et al., 2012, 2017). Multifarious measurements have provided cumulative evidence that the widespread slowdown of surface wind speeds has occurred globally and in China since the 1980s (Chen et al., 2013; McVicar et al., 2012), which facilitates the pollutant accumulation to deteriorate air quality (Zhao et al., 2013; Sun et al., 2016). An increase in the surface roughness induced by increased vegetative biomass has been proposed to be responsible for the surface-level stilling to some degree (Wu et al., 2016b; Vautard et al., 2010). Consequently, there has been ongoing debate in China on whether the afforestation program contributes enough to mitigate the haze formation in BTH (China Forestry Network, 2016a, 2017).
Deforestation and its potential to severe droughts and massive floods has raised serious concerns in China since the 1970s, fostering the largest afforestation project in the world (Liu et al., 2008). Six key afforestation programs have been implemented since 2001, and “the Green Great Wall” of China has been established in northern China (Duan et al., 2011). A remarkable forest growth has been reported in the northwest of BTH from 2000 to 2010 (Li et al., 2016), which has the potential to increase the surface roughness and decrease the surface wind speed (Wu et al., 2016a; Bichet et al., 2012), and could potentially aggravate the haze pollution. In addition, previous studies have shown that the afforestation is beneficial for the atmosphere to remove O3, NOx, SO2, and PM2.5 through the dry deposition process (Zhang et al., 2015, 2017; Huang et al., 2016). Hence, a large artificial ventilation corridor system has been proposed, highly anticipated to ventilate Beijing (China Forestry Network, 2014, 2016b, c).
In the present study, we report an analysis of long-term satellite measurements of the land cover change in BTH and quantitatively evaluate the impacts of the afforestation on the haze pollution in BTH using the WRF-CHEM model. We have further evaluated the effect of the proposed large artificial ventilation corridor system on the haze mitigation in Beijing. The model configuration and methodology are provided in Sect. 2. Data analysis and model results are presented in Sect. 3, and conclusions are given in Sect. 4.
2.1 MODIS data
The data utilized in the study are the annual land cover product, MCD12Q1, derived from the Terra and Aqua Moderate Resolution Imaging Spectroradiometer (MODIS) observations since 2001 (Friedl et al., 2002). The product has been widely used in studies of atmospheric science, hydrology, ecology, and land change science (Gerten et al., 2004; Guenther et al., 2006; Reichstein et al., 2007; Turner et al., 2007). Wu et al. (2008) have compared four global land cover datasets across China, concluding that the MODIS land cover product is the most representative over China with the minimal bias from the China's National Land Cover Dataset. The MCD12Q1 (Version 5.1) IGBP (International Geosphere-Biosphere Programme) scheme with a spatial resolution of 500 m is utilized to explore the variability of the land cover fraction (LCF) from 2001 to 2013 in BTH and assimilated into the WRF-CHEM model. The high-resolution land cover product is generated using a supervised classification algorithm in conjunction with a revised database of high-quality land cover training sites (Friedl et al., 2002). The accuracy of the IGBP layer of MCD12Q1 is estimated to be 72.3–77.4 % globally, with a 95 % confidence interval (Friedl et al., 2002, 2010). Great efforts have been made to evaluate the accuracies of the global land cover datasets over China. The overall accuracy of MCD12Q1 in China is estimated to be 55.9–68.9 % (Bai et al., 2015; Yang et al., 2017), which could be increased to about 70 % when ignoring the differences of five forests.
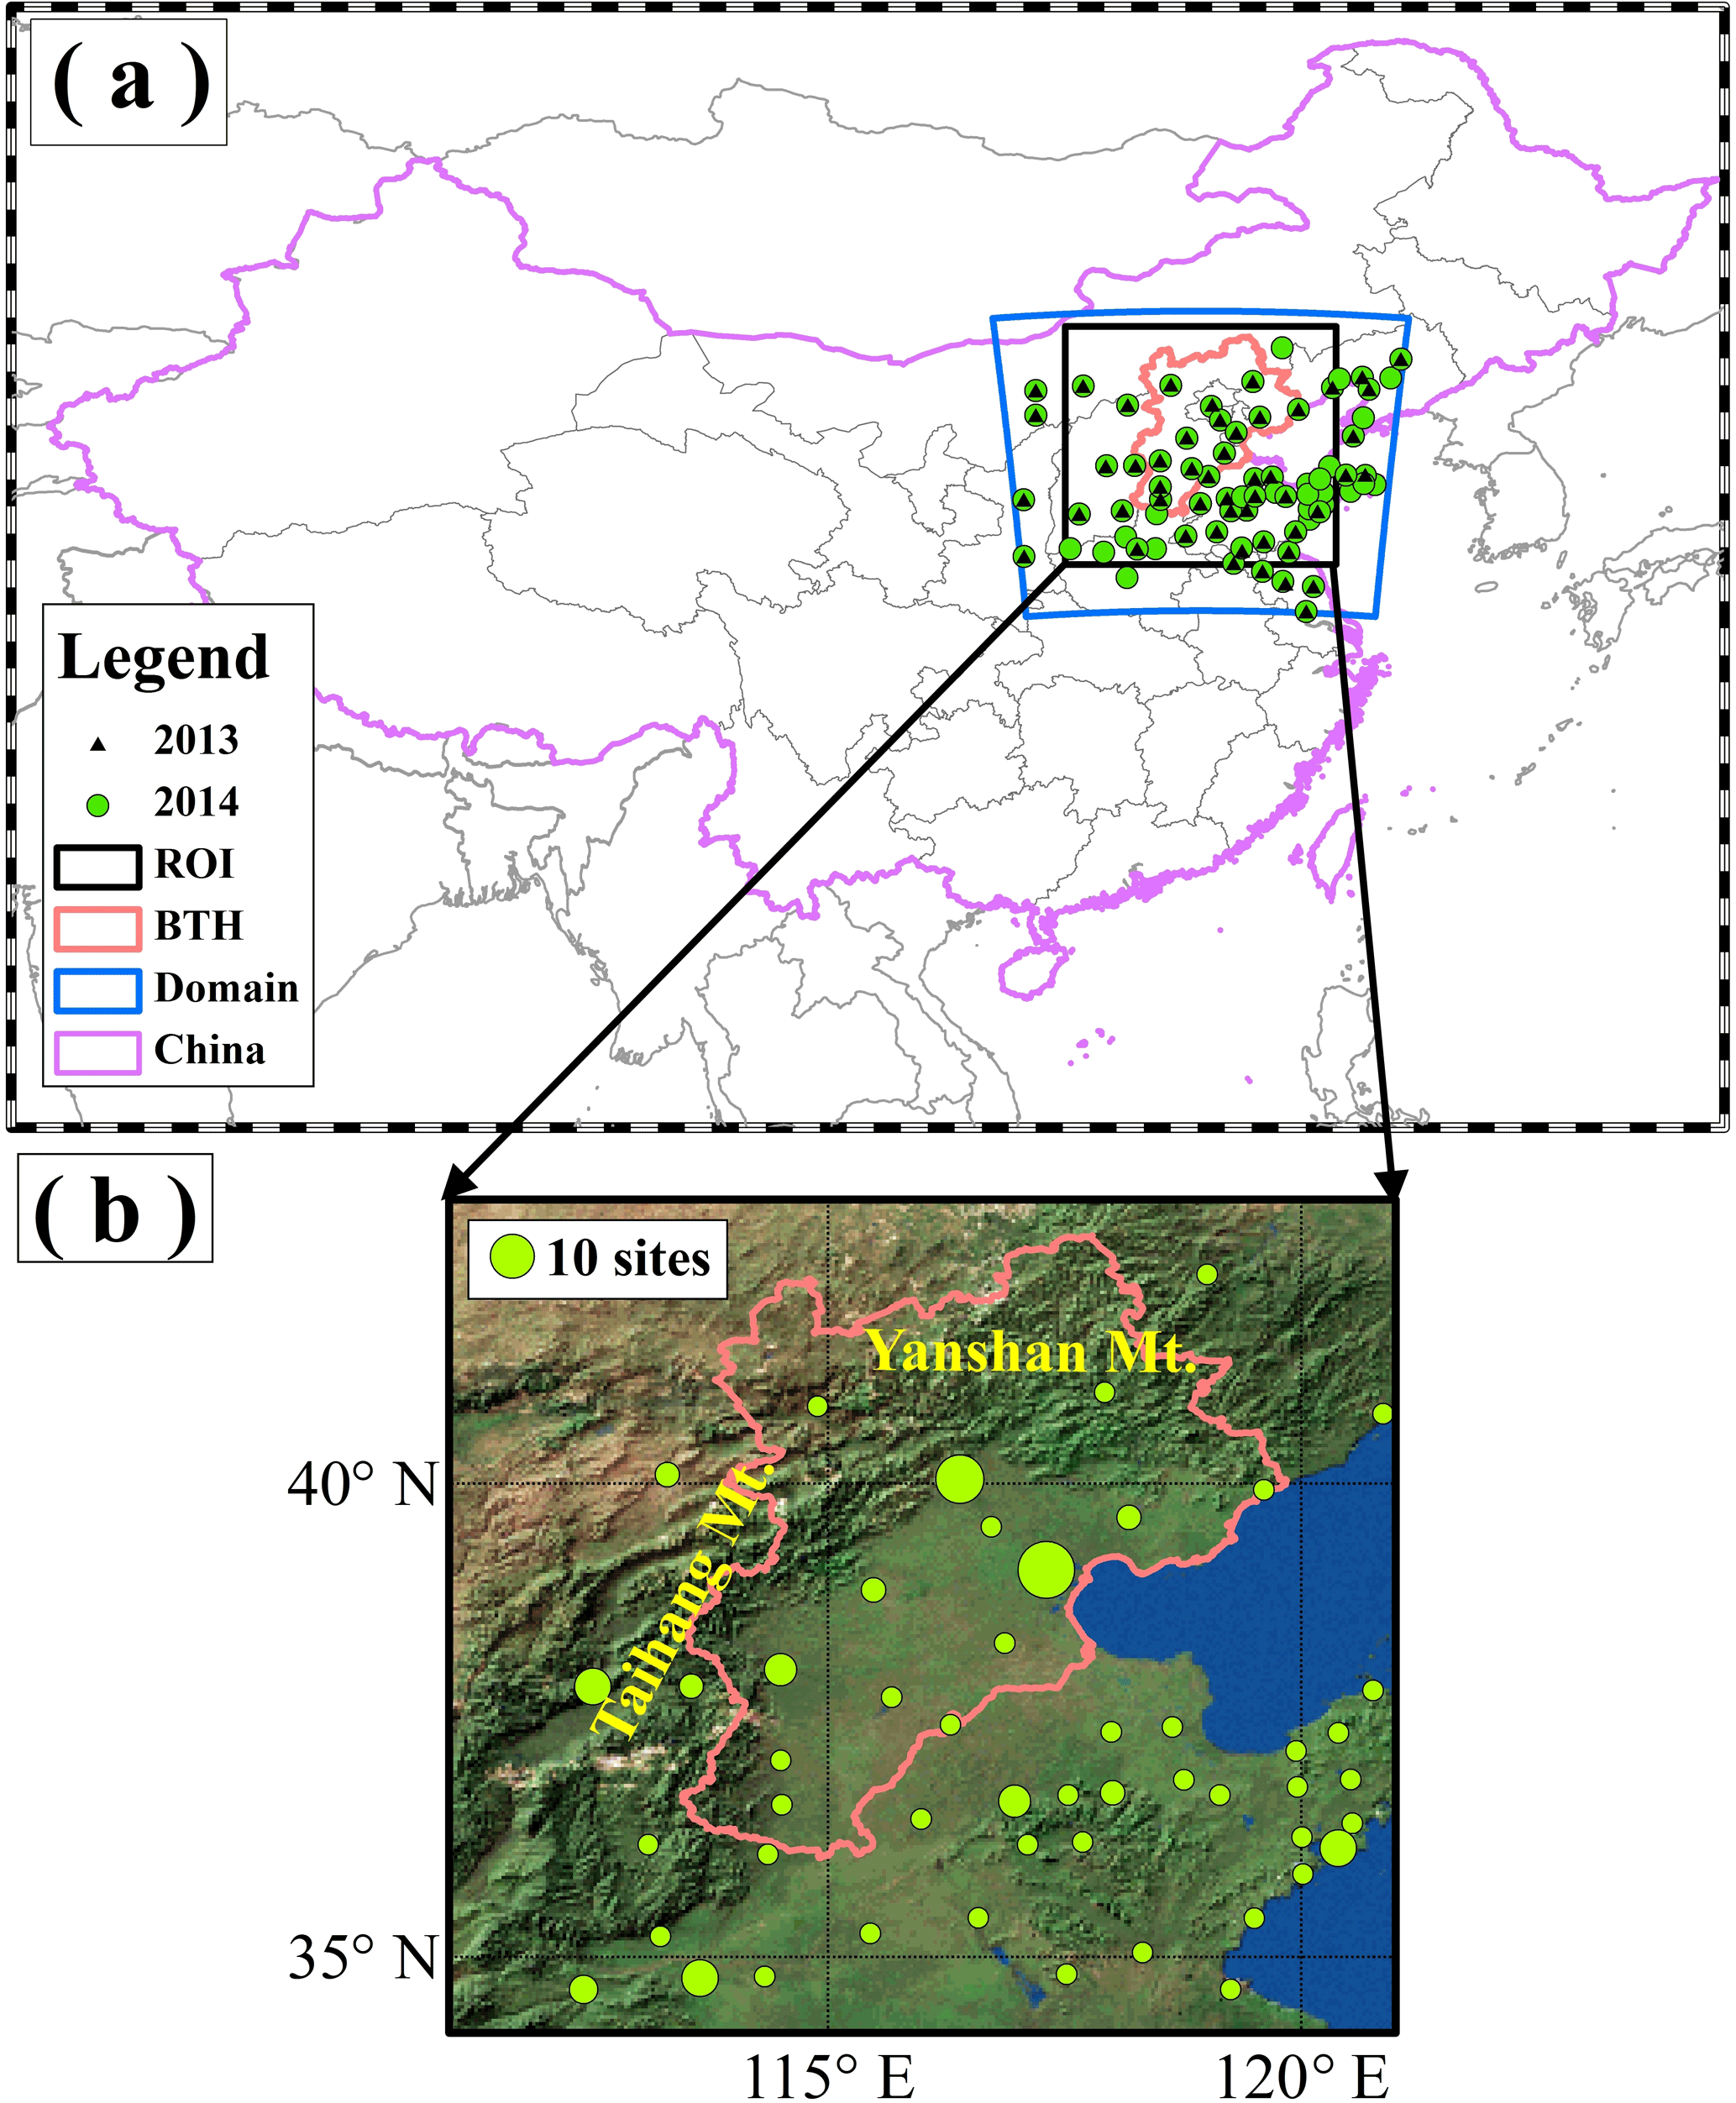
Figure 1(a) The model domain, region of interest (ROI), and monitoring sites. (b) The topography and monitoring sites in January 2014. The circles represent the centers of cities with ambient monitoring sites, and the size of circles denotes the number of monitoring sites in the cities. The boundary of BTH region is highlighted with bright lines. The Yan (Yanshan Mt.) and Taihang Mountains are also displayed.
2.2 WRF-CHEM model and configurations
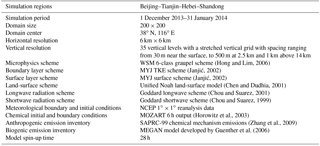
We use a specific version of the WRF-CHEM model (Grell et al., 2005) to investigate the impacts of the afforestation on the haze pollution in BTH. The model includes a new flexible gas phase chemical module and the CMAQ/Models3 aerosol module developed by US EPA (Binkowski and Roselle, 2003). The wet deposition of chemical species follows the CMAQ method. The dry deposition parameterization follows Wesely (1989), and the dry deposition velocity of aerosols and trace gases is calculated as a function of the local meteorology and land use. The photolysis rates are calculated by an FTUV (fast radiation transfer model) (Li et al., 2005). The inorganic aerosols are predicted using ISORROPIA Version 1.7 (http://nenes.eas.gatech.edu/ISORROPIA/, last access: 30 June 2018) (Nenes et al., 1998). The secondary organic aerosol (SOA) is predicted using a non-traditional SOA module, including the VBS (volatility basis set) modeling approach and SOA contributions from glyoxal and methylglyoxal. Detailed information about the WRF-CHEM model can be found in previous studies (Li et al., 2010, 2011a, b, 2012).
High PM2.5 pollution episodes from 1 December 2013 to 31 January 2014 in the North China Plain (NCP) have been simulated using the WRF-CHEM model. The model simulation domain is shown in Fig. 1, and detailed model configurations can be found in Table 1. The chemical initial and boundary conditions are interpolated from the 6 h output of MOZART-4 (Emmons et al., 2010; Horowitz et al., 2003). MOZART-4 is driven by meteorology fields from the NASA GMAO GEOS-5 model, using anthropogenic emissions based on the Streets et al. (2006) inventory and fire emissions from FINN-v1 (Wiedinmyer et al., 2011). The model has been evaluated comprehensively with several sets of observations, reproducing the tropospheric chemical composition well (Emmons et al., 2010). The model results have been successfully and widely used as the initial and lateral boundary conditions for chemical transport models. The anthropogenic emission inventory used in the present study is developed by Zhang et al. (2009), with the base year of 2013, including contributions from agriculture, industry, power, residential, and transportation sources. Figure S1 shows the emission distribution of OC (organic carbon), VOCs (volatile organic compounds), NOx, and SO2 in the simulation domain. The high emissions of OC, VOCs, NOx, and SO2 are generally concentrated in the plain region of BTH and Shandong province, the downwind area of afforestation.
The hourly near-surface CO, SO2, NO2, O3, and PM2.5 mass concentrations released by China's Ministry of Environmental Protection are used to validate the model simulations and are accessible from the following website: http://www.aqistudy.cn/ (last access: 30 June 2018).
We use the normalized mean bias (NMB), the index of agreement (IOA), and the correlation coefficient (R) to assess the WRF-CHEM model performance in simulating air pollutants against measurements.
where Pi and Oi are the calculated and observed air pollutant concentrations, respectively. N is the total number of the predictions used for comparisons, and and represent the average of predictions and observations, respectively. The IOA ranges from 0 to 1, with 1 showing perfect agreement of the prediction with the observation. The R ranges from −1 to 1, with 1 implicating perfect spatial consistency of observations and predictions.
2.3 MCD12Q1 data assimilation to the WRF-CHEM model
The IGBP layer in MCD12Q1 is suitable for the WRF-CHEM IGBP land cover scheme, which consists of 11 natural vegetation classes, 3 developed and mosaicked land classes, and 3 non-vegetated land classes. Table S1 displays the comparison of land cover classification between the WRF-CHEM model and MCD12Q1. We use the gridded LCF of each category to assimilate the MCD12Q1 satellite data to the WRF-CHEM model.
where i and j are grid cell indices of the WRF-CHEM model domain, Area stands for the total area of each land cover category k within grid cell (i,j), and Areai,j is the area of grid cell (i,j). The LCF ranges from 0 to 1.
To evaluate the afforestation impacts on the haze pollution in BTH, we have used and modified the coupled unified Noah land-surface model (LSM), which was developed based on Oregon State University LSM (Chen and Dudhia, 2001). Noah is able to reasonably reproduce the observed diurnal variation of sensible heat fluxes and surface skin temperature. Also, it is capable of capturing the diurnal and seasonal evolution in evaporation and soil moisture (Chen et al., 1996). Despite some remaining issues, Noah has been chosen for further refinement and implementation in NCEP regional and global coupled weather and climate models because of its relative simplicity and adequate performance (Mitchell, 2005, update 2017). The surface roughness length (SFz0) in Noah is calculated based on the dominant land cover category (https://ral.ucar.edu/solutions/products/unified-noah-lsm/, last access: 30 June 2018).
where SFz0min and SFz0max are the minimum and maximum SFz0 for each category. Gf is the area fractional coverage of green vegetation, and GT, Gmin, and Gmax are the threshold, minimal, and maximal value of Gf, respectively. GT, SFz0min, and SFz0max are listed in Table S2.
In order to more precisely simulate surface stress within the sub-grid scale in heterogeneous terrain, the effective roughness length has been extensively studied, especially in the 1990s. Claussen (1990) has defined the effective roughness length as a value of the area average of the roughness length in heterogeneous terrain. The effective roughness length relies upon the blending height (Wieringa, 1986; Mason, 1988; Wood and Mason, 1991; Philip, 1996; Mahrt, 1996), at which the flow is approximately in equilibrium with underlying surface conditions and independent of horizontal position (Ma and Daggupaty, 1998). We have modified the Noah SFz0 calculation using the spatial average of the vegetation roughness length.
SFz0k denotes the gridded area fraction of land cover category k and is alculated by Eq. (5).
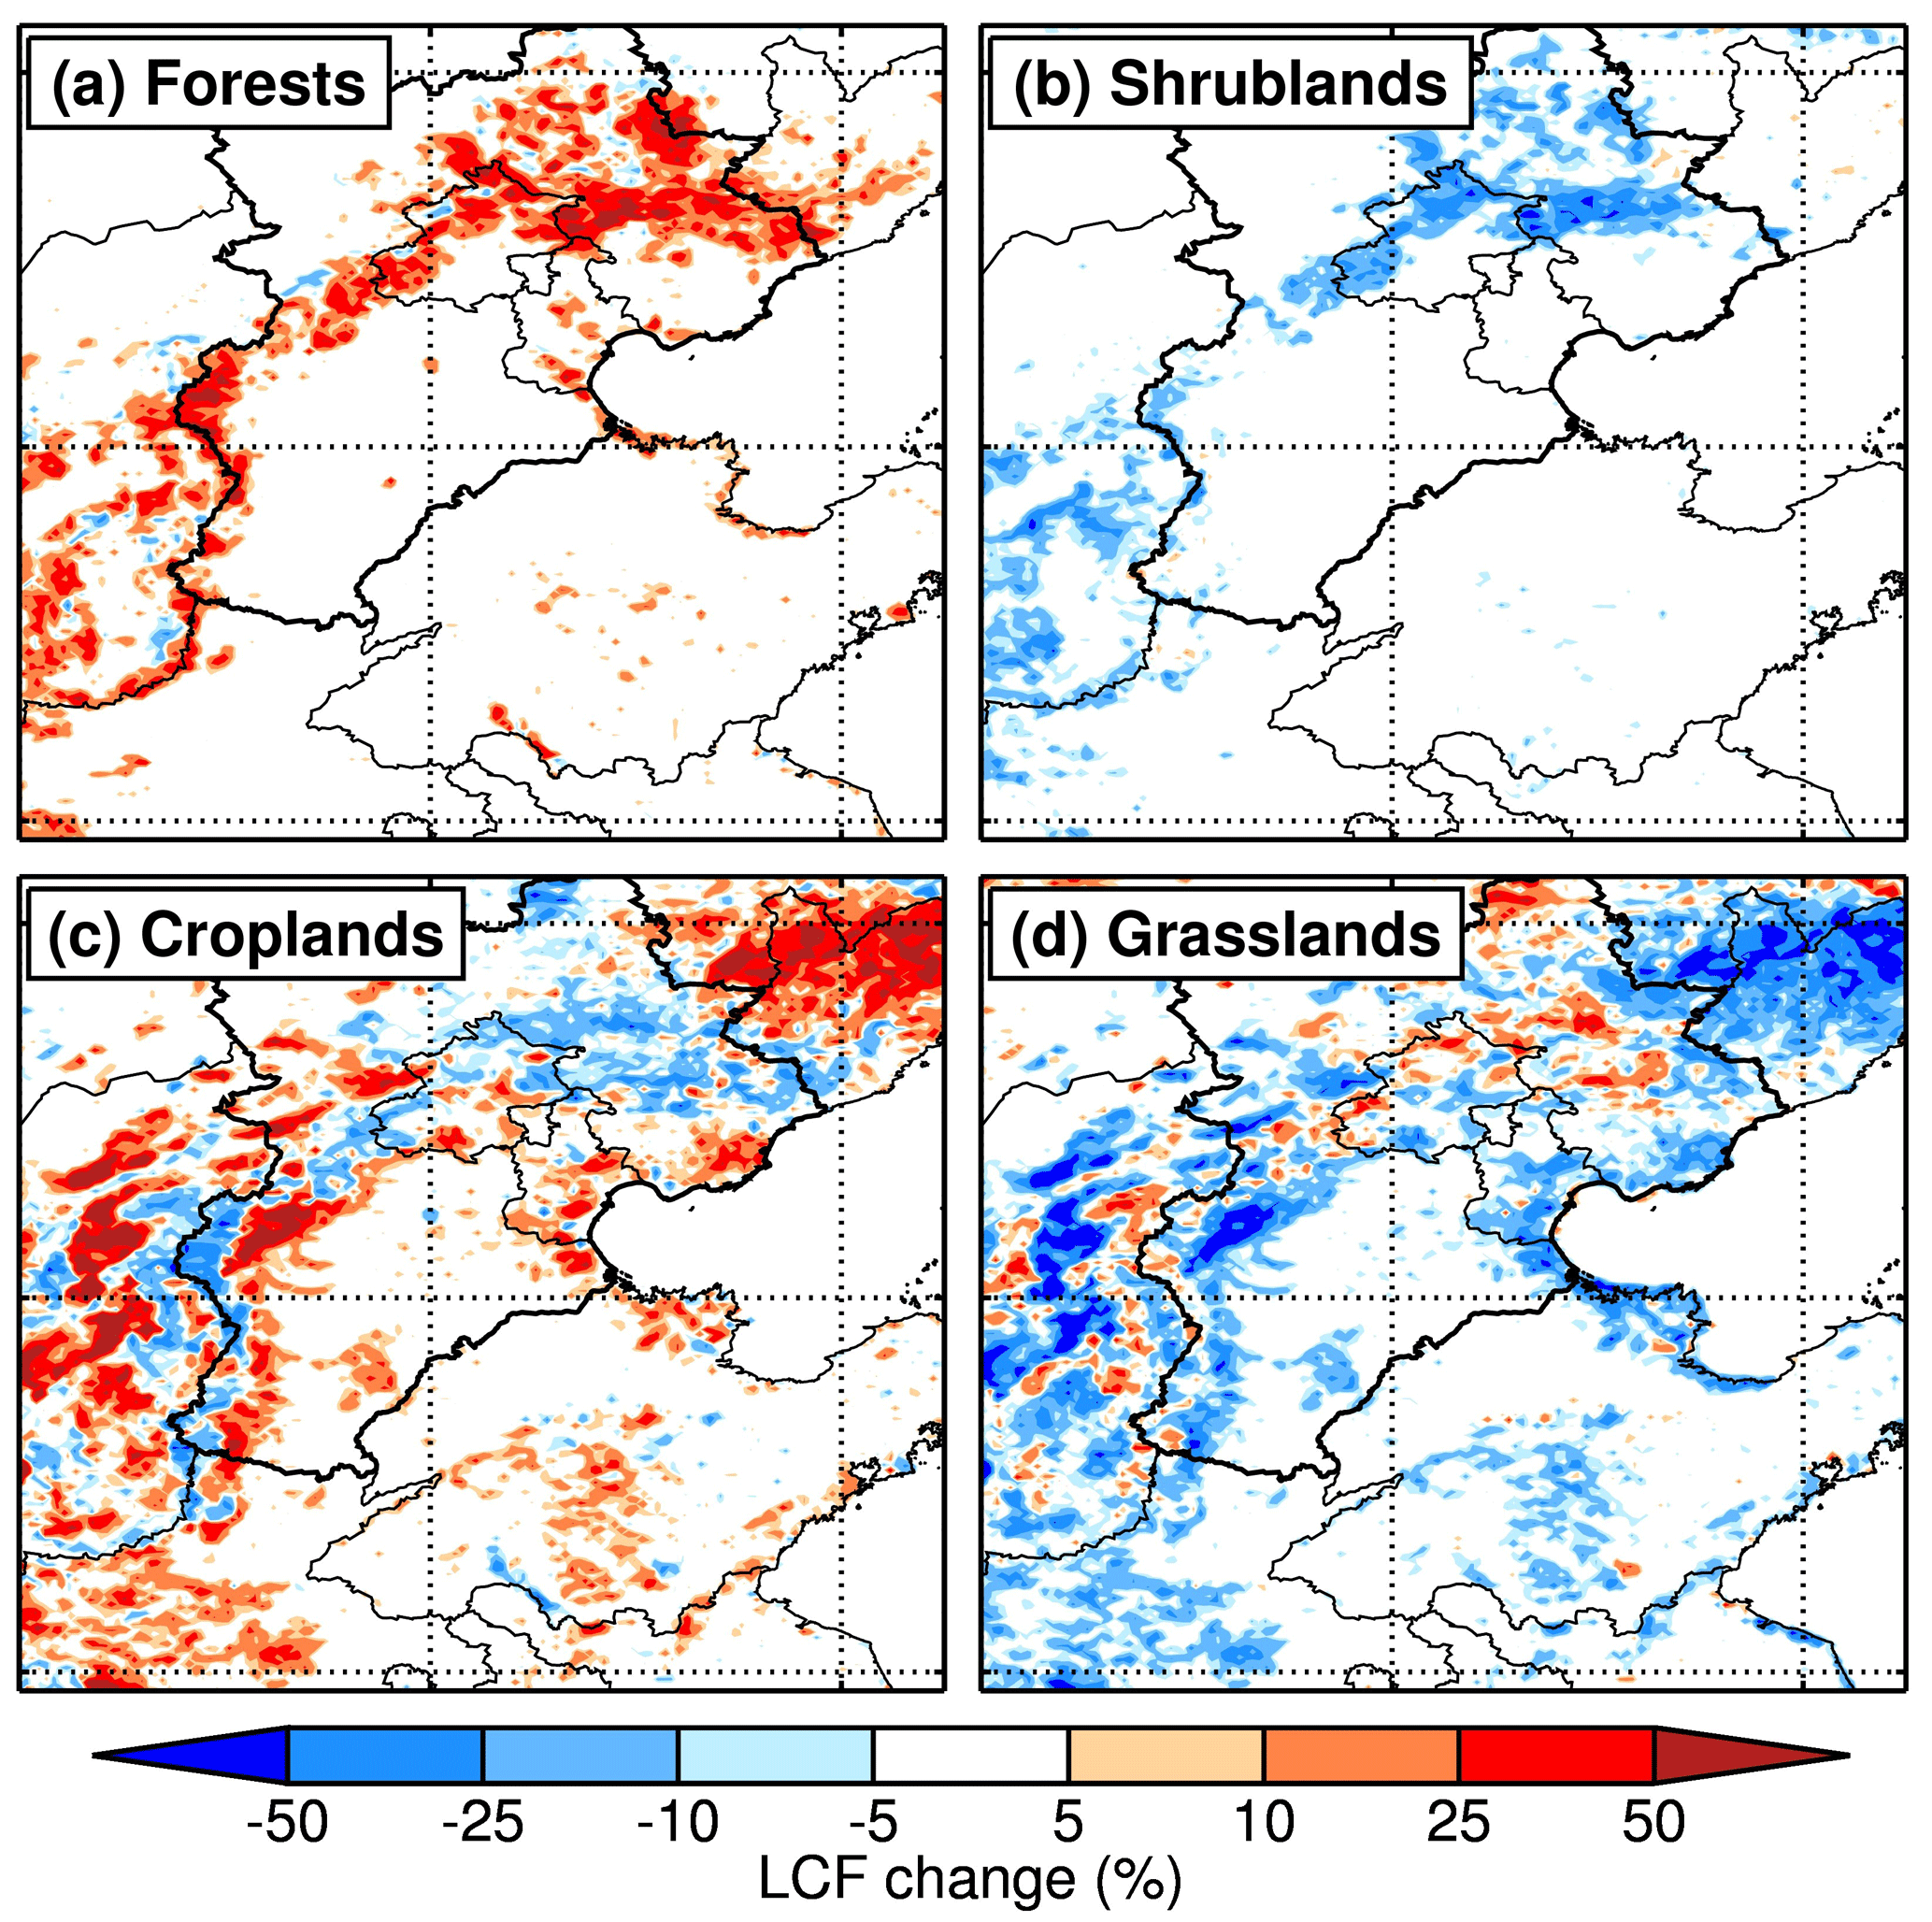
Figure 2Land cover change from 2001 to 2013. Spatial distributions of (a) forests, (b) shrublands, (c) croplands, and (d) grasslands.
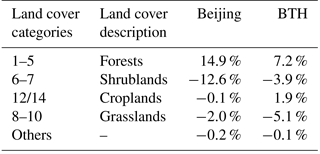
Table 2Land cover change over Beijing and BTH from 2001 to 2013.
3.1 Land cover change in BTH
The land cover in BTH and Beijing exhibits appreciable variation from 2001 to 2013 (Fig. 2 and Table 2). In BTH, forests and croplands have increased by 7.2 % and 1.9 %, while shrublands and grasslands/savannas have decreased by 3.9 % and 5.1 %, respectively. In Beijing, forests have increased by 14.9 %, while shrublands have decreased by 12.6 %. Apparently, the forest LCF has increased substantially in western and northern BTH, concentrated in the Taihang and Yan Mountains, with an increase up to 50 %. This result is consistent with the previous study of Li et al. (2016), which has reported a remarkable forest growth in the northwest of NCP from 2000 to 2010. As such, a “Green Great Wall” has been established (Fig. 2a), which has reportedly protected the southeastern BTH from the dust pollution (Liu et al., 2008; Duan et al., 2011; Parungo et al., 2013). The land cover change, particularly the evident forest growth, is primarily attributed to China's national afforestation programs aiming to increase the forest coverage and to conserve soil and water, including the Grain for Green Project, the Three-North Shelter Forest System Project (Phase IV), and the Natural Forest Conservation Program (Yin et al., 2010; Cao et al., 2011).
3.2 Model performance
We have first assimilated into the WRF-CHEM model the MCD12Q1 product of 2013 and performed the numerical simulation of haze pollution episodes from 1 December 2013 to 31 January 2014. To enable discussion, we have defined the simulation with the 2013 land cover as the reference case (hereafter referred to as REF case), and results from the reference simulation are compared to observations in BTH.
Considering the key role of meteorological fields in determining the formation, transformation, diffusion, transport, and removal of the air pollutants (Bei et al., 2017), Fig. S2 presents the comparison of the simulated wind speed and direction, and planetary boundary layer height with the reanalysis data from ECMWF (European Centre for Medium-range Weather Forecasts) at monitoring sites. The predicted temporal variations of the three meteorological parameters are generally in agreement with the reanalysis data, with the IOAs exceeding 0.80 and the absolute NMB less than 25 %.
Figure 3 presents the calculated and observed temporal profiles of near-surface air pollutant concentrations averaged at monitoring sites in BTH during the simulation period, including PM2.5, O3, NO2, SO2, and CO. The WRF-CHEM model generally reproduces the haze pollution episodes well. For example, all the haze events during the period are captured successfully (Fig. 3a), with an IOA of 0.90 and a NMB of 2.1 % for PM2.5 mass concentrations. The model reasonably yields O3 variations compared to observations, with an IOA of 0.80, but underestimates O3 concentrations, with a NMB of −15.9 % (Fig. 3b). In winter, the insolation is weak in the north of China, unfavorable for the O3 photochemical production, so the O3 level is substantially influenced by the boundary conditions (Li et al., 2017; Wu et al., 2017). Hence, one of possible reasons for the O3 underestimation might be from the uncertainty in the O3 boundary conditions. The simulated temporal variations of NO2 mass concentrations are well consistent with the observation, and the IOA and NMB are 0.91 and 0.6 %, respectively. The SO2 and CO temporal variations are also reasonably replicated against observations, with IOAs of 0.82 and 0.84, respectively.
Figure 4 shows the spatial comparison of calculated and observed PM2.5 concentrations. Generally, the average predicted PM2.5 spatial patterns agree well with the observations at the monitoring sites in BTH during the whole period (Fig. 4b) and each month (Fig. 4c and d), with R values exceeding 0.85, indicating good agreement of simulations with observations. The observed PM2.5 concentrations frequently exceed 150 µg m−3 in BTH, showing the frequent occurrence of heavy haze pollution events. The model generally yields the observed high PM2.5 concentrations in BTH and their surrounding areas, although the model underestimation or overestimation still exists. Additionally, compared to observations, the model also performs well in simulating the spatial pattern of haze episodes with various timescales ranging from 8 to 16 days (Fig. S3).
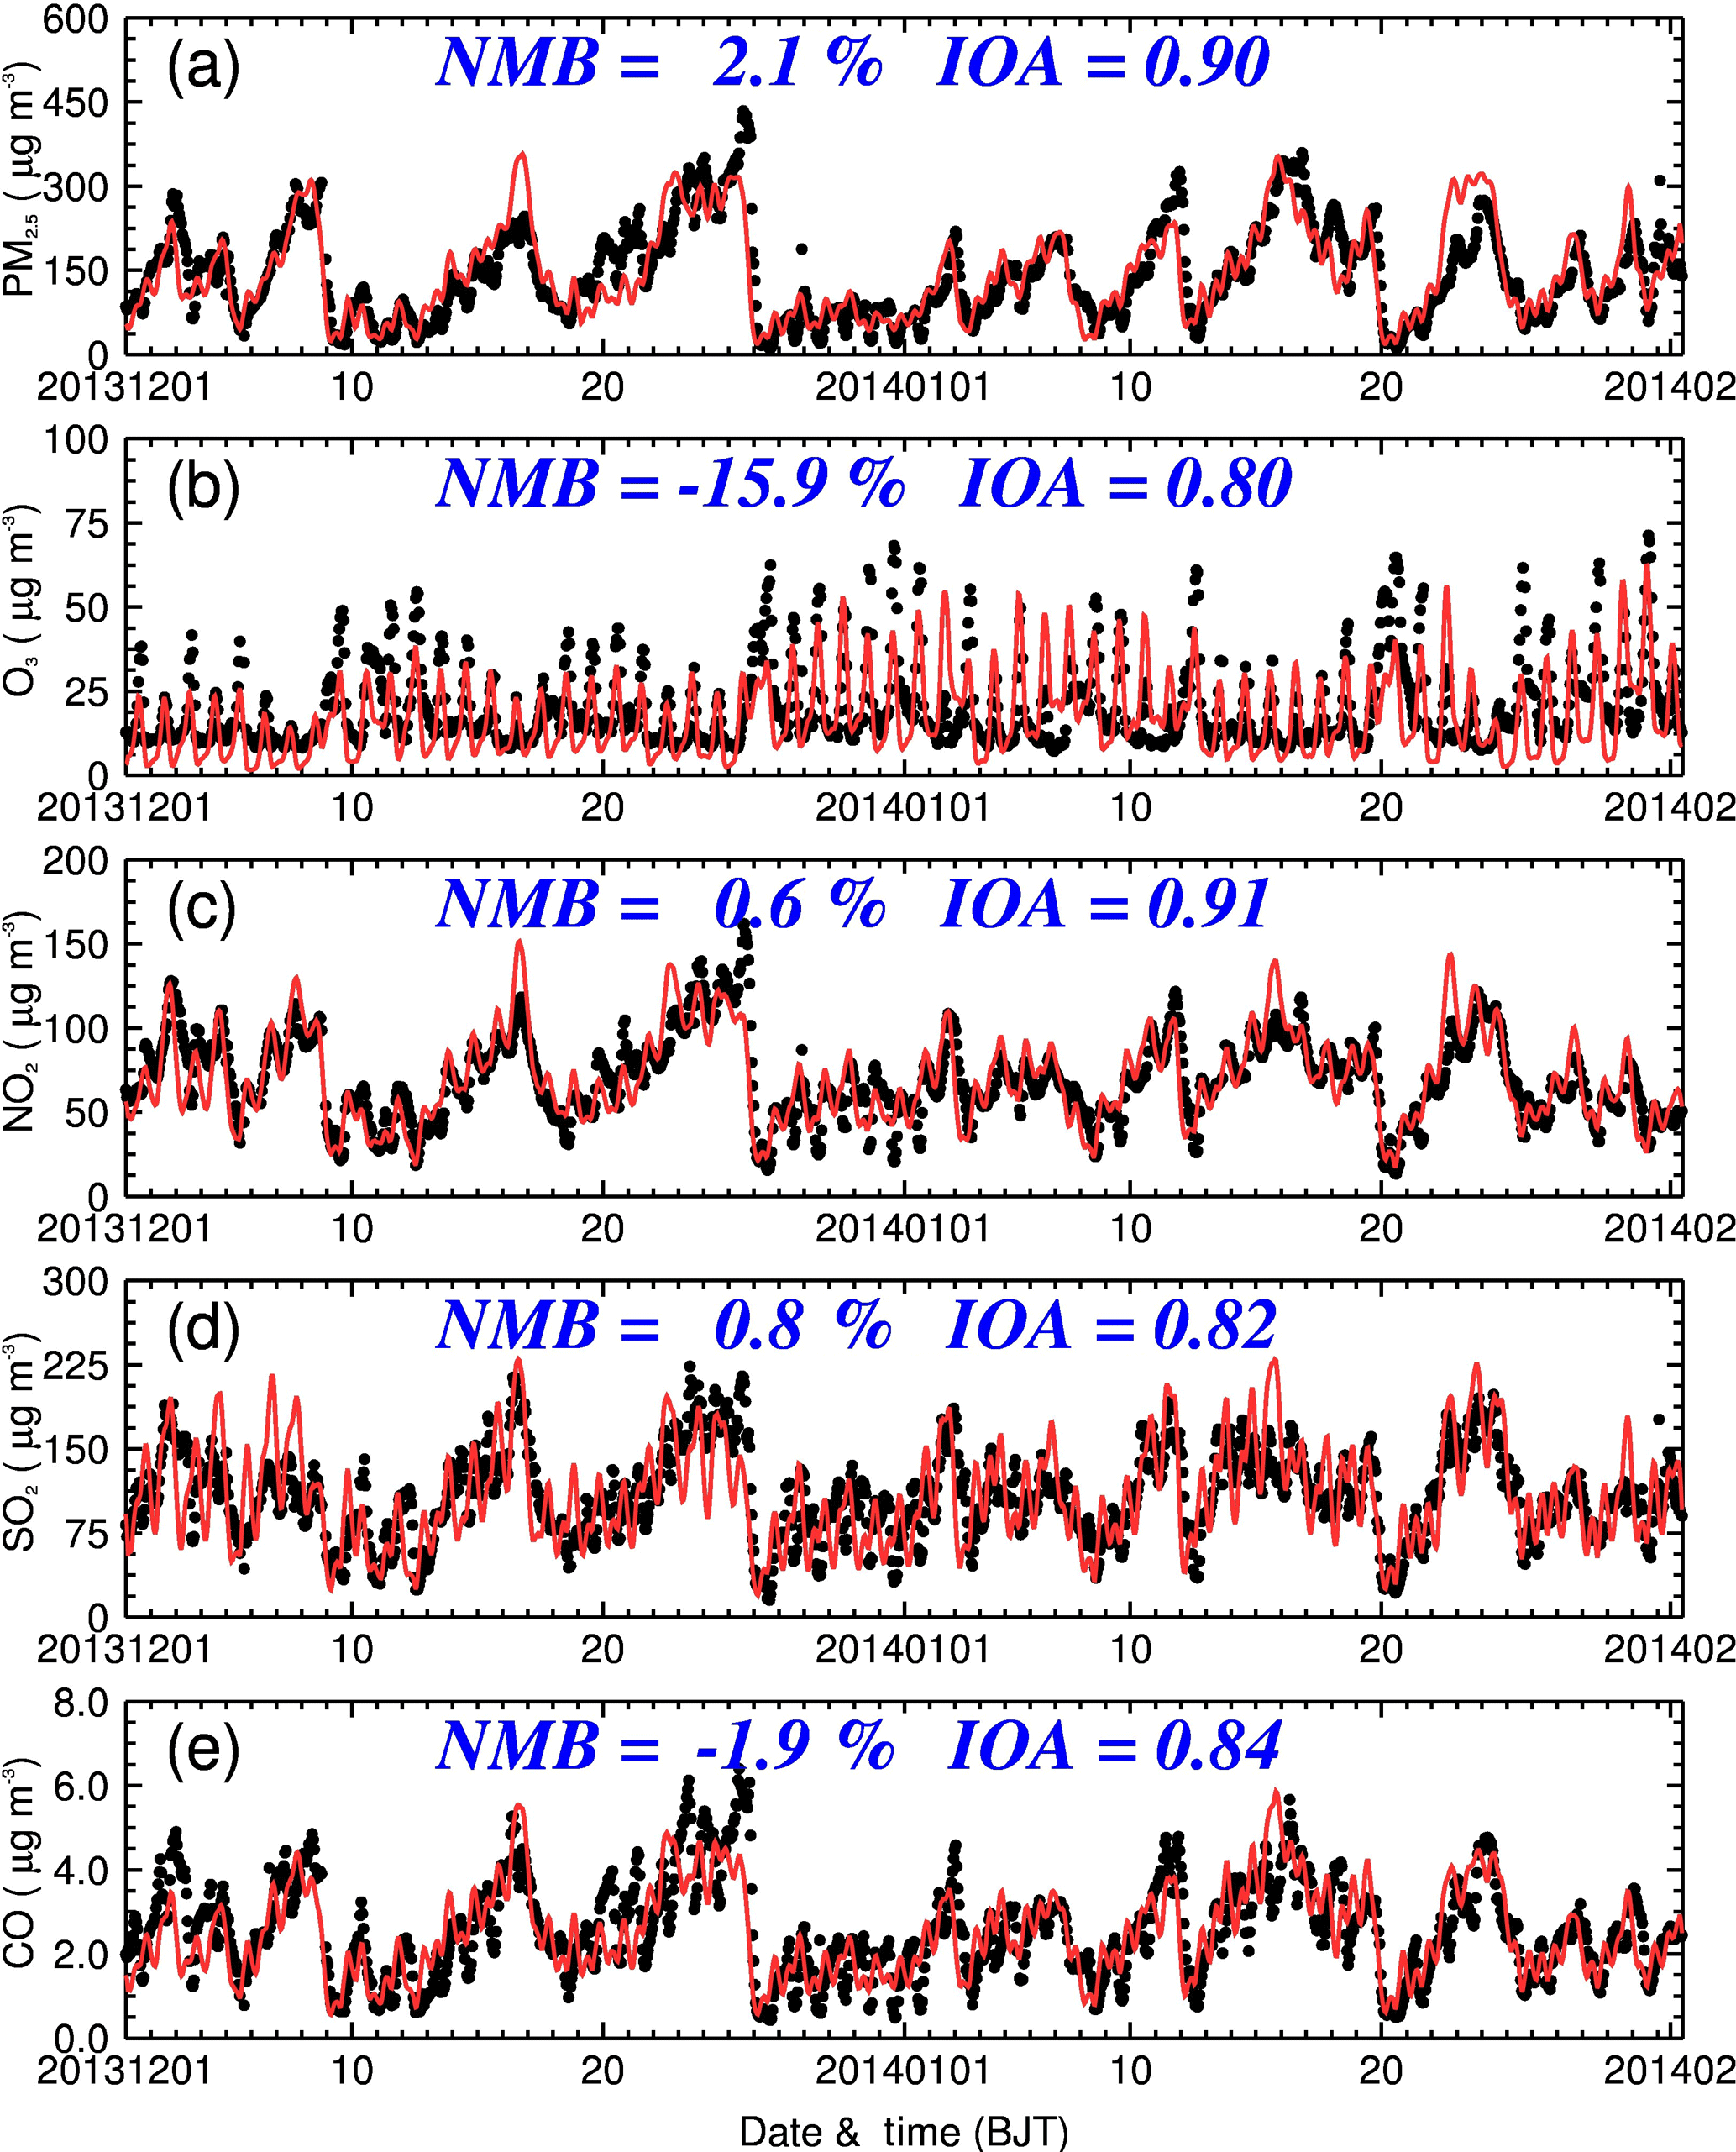
Figure 3Comparisons of observed (black dots) and simulated (solid red lines) diurnal profiles of near-surface hourly mass concentrations of (a) PM2.5, (b) O3, (c) NO2, (d) SO2, and (d) CO averaged at monitoring sites in BTH from 1 December 2013 to 31 January 2014.
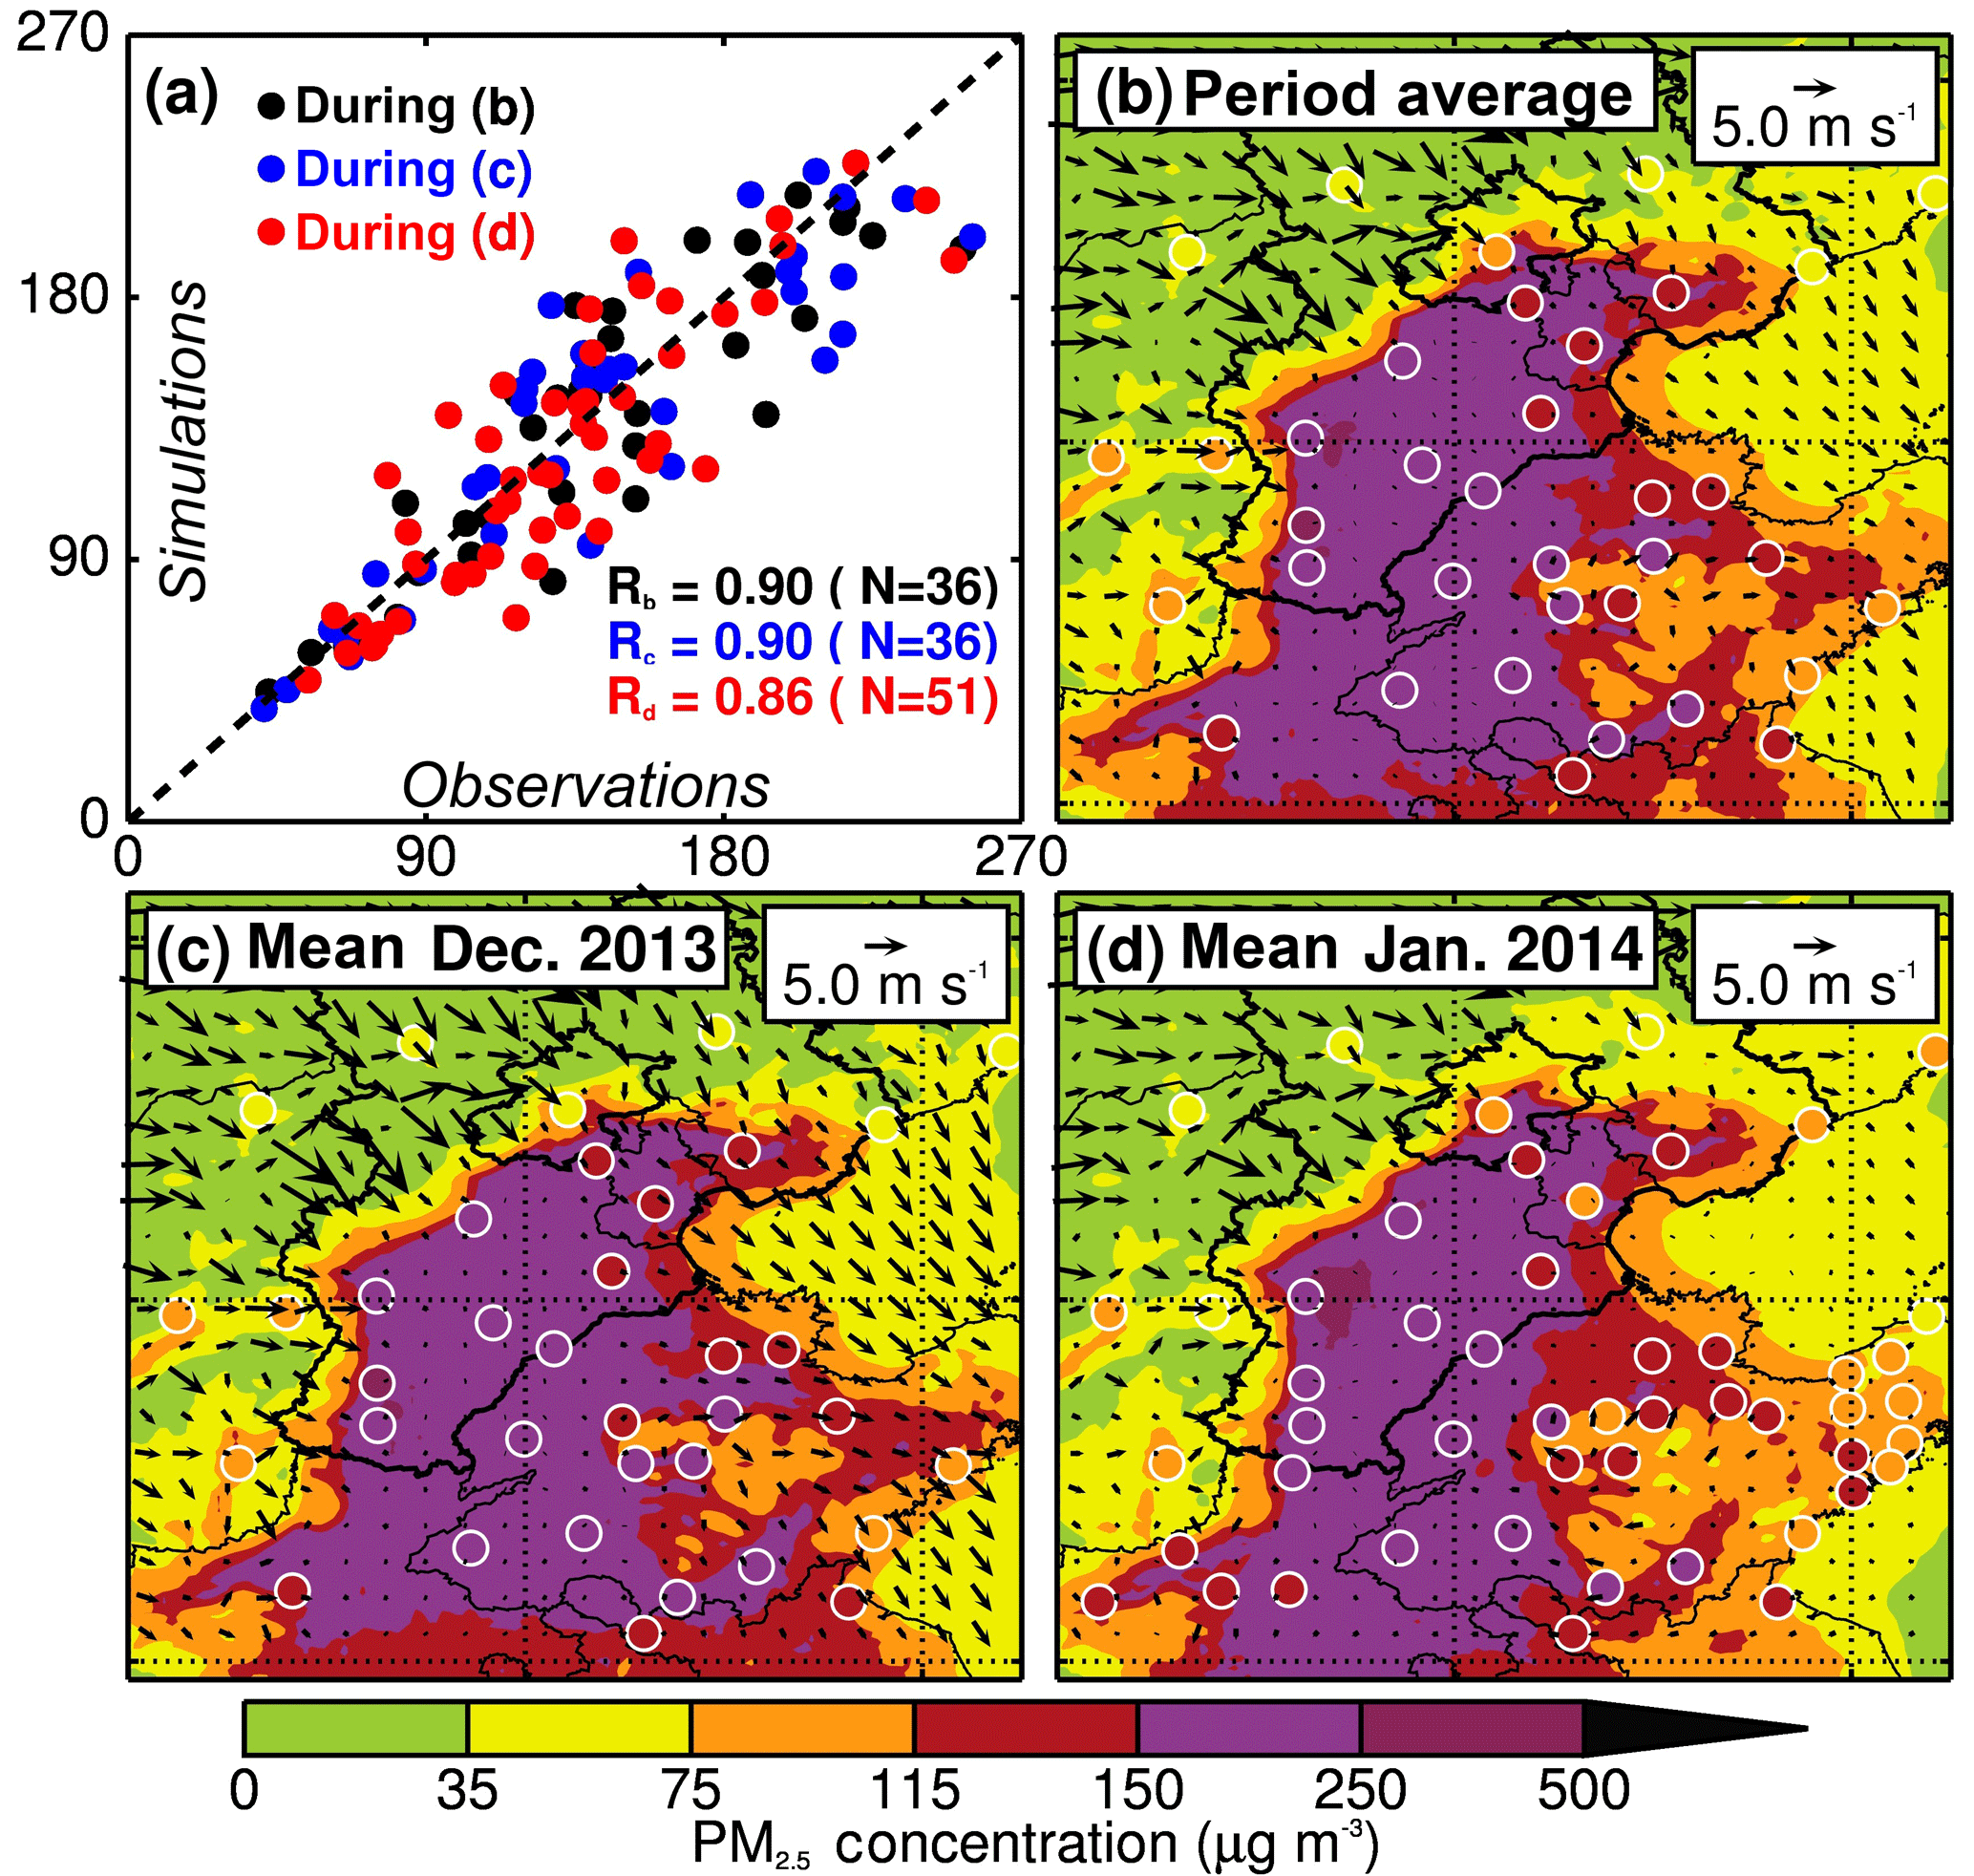
Figure 4Pattern comparisons of calculated and observed near-surface PM2.5 mass concentrations. (a) Spatial correlation between calculated and observed PM2.5 concentrations during each month and the whole simulation period. Horizontal distribution of calculated (color contour) and observed (colored circles) average PM2.5 concentrations during (b) the whole simulation period, (c) December 2013, and (d) January 2014, along with the simulated wind fields (black arrows).
The good agreements of the simulated mass concentrations of air pollutants with observations at monitoring sites in BTH show that the emission inventory used in the present study and simulated wind fields are generally reasonable, providing a reliable base for the further assessment. It is worth noting that, although the predicted meteorological parameters are generally consistent with the reanalysis data from ECMWF at monitoring sites, other factors still affect the meteorological field simulations and cause biases to compensate some of the deficiencies of the WRF-CHEM model, such as overestimation of surface wind speeds.
3.3 Effect of afforestation on haze pollution in BTH
Change in the land cover alters the surface roughness height (SFz0) that plays an important role in determining the surface level wind speed and energy exchange between the atmosphere and the land surface. Numerous studies have demonstrated that increasing SFz0 tends to decelerate the surface wind (Wu et al., 2016a, b), obstructing the dispersion of air pollutants (Sun et al., 2016; Zhao et al., 2013; Tie et al., 2015). In order to evaluate the impact of the afforestation-induced SFz0 change and resultant dynamical change (e.g., wind field) on the haze formation, a sensitivity experiment is designed, in which the MCD12Q1 product of 2001 is assimilated into the WRF-CHEM model to represent the land cover situations before the afforestation (hereafter referred to as SEN-AFF case).
Figure 5a and b display the SFz0 change and its correlation with forest LCF change from 2001 to 2013, respectively. The land cover change considerably alters the SFz0, particularly in the afforestation area, with a SFz0 increase ranging from 0.1 to 0.3 m. Apparently, the SFz0 exhibits a distinct increasing trend in western and northern BTH, concentrated in the Taihang and Yan Mountains, which is well consistent with the increase of the forest LCF. The SFz0 change is highly correlated with the forest LCF change, with a correlation coefficient of 0.91. Generally, the SFz0 is mainly dependent upon the LCF (Eq. 6) and sensitive to the forest change (Table S2). Therefore, afforestation constitutes the most important factor for the increase in the SFz0 in BTH.
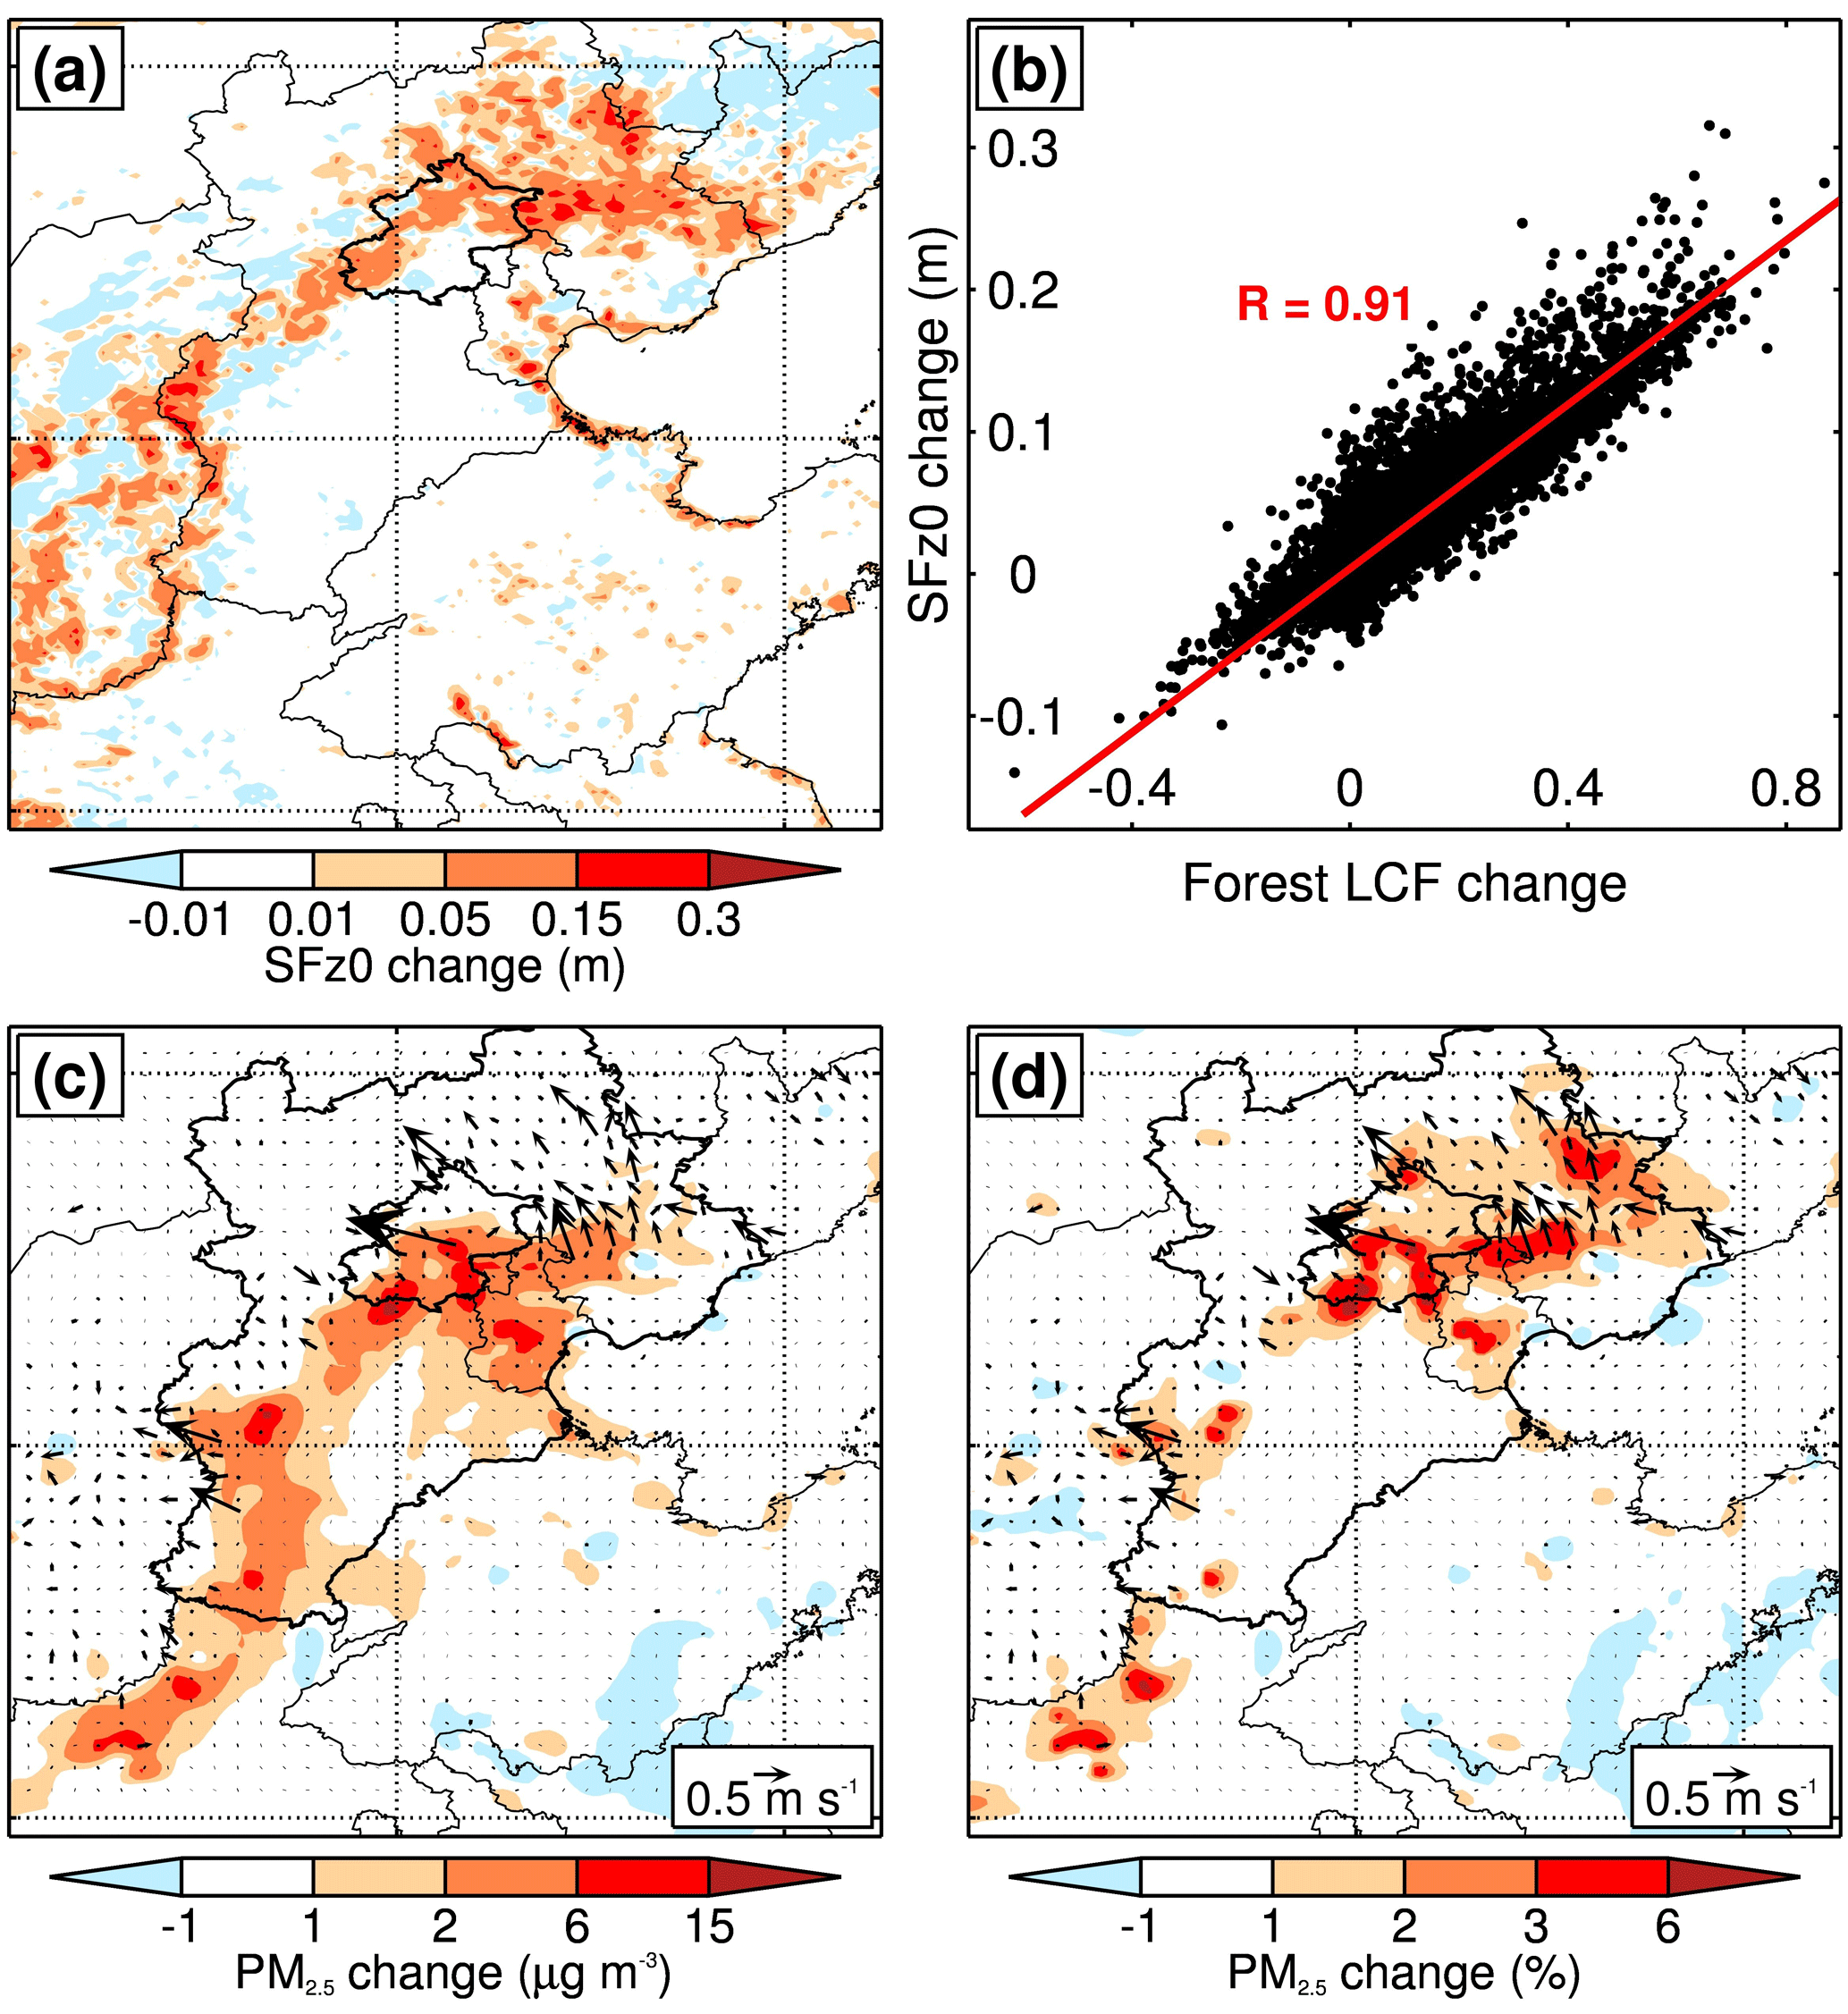
Figure 5(a) SFz0 change from 2001 to 2013, and (b) its correlation with the forest LCF change; horizontal distribution of (c) absolute and (d) relative near-surface PM2.5 mass concentration changes caused by the afforestation. The wind field changes are shown in black arrows in (c) and (d).
It is worth noting that Jiménez and Dudhia (2012) have point out that there still exist large uncertainties in parameterizing the air land interaction over complex terrain. Besides the vegetation effect on the roughness length, drag of subgrid features of topography needs to be considered. The parameterization of orographic flow over complex terrain is a challenging problem at the mesoscale numerical simulation. In early versions of the WRF model, a large bias in predicting surface winds over complex terrain has occurred due to the drag exerted by unresolved topography (Cheng and Steenburgh, 2005). Great efforts have been made to improve the simulation of orographic flow over complex terrain. The new parameterization scheme introduced in the WRF model since version 3.4.1 has corrected this high wind speed bias over plains and valleys (Mughal et al., 2017), and it has also corrected the low wind speed bias found over the mountains and hills (Jiménez and Dudhia, 2012).
Figure 5c and d illustrate the influence of the afforestation on the surface PM2.5 and wind field averaged during the simulation period (defined as (REF − SEN-AFF)). The prevailing westerly or northerly wind is decelerated in the western and northwestern BTH due to the increased SFz0 caused by the afforestation, with the wind speed decrease ranging from 0.3 to 1.5 m s−1. The afforestation tends to deteriorate the haze pollution in BTH, particularly in the downwind area of the afforestation, with the period average PM2.5 enhancement reaching about 6–15 µg m−3, or 3–6 %. The PM2.5 enhancement in Beijing is the most evident, corresponding to the rapid growth of forests in the west and in the north of Beijing. Furthermore, during each episode, the afforestation generally tends to deteriorate the haze pollution in BTH, enhancing the PM2.5 concentration by about up to 3–6 %, particularly in the downwind area of the afforestation (Fig. S4). On average, the difference of the simulated air pollutants and meteorological parameters between the REF and SEN-AFF case is not significant (Fig. 5c and d).

Figure 6Horizontal distribution of (a) the average near-surface PM2.5 mass concentration and (b) its change due to the afforestation during an intensified northerly/northwesterly event from 00:00 to 10:00 Beijing time on 18 January 2014. The wind field and its change are shown in black arrows.
The occurrence of heavy haze pollution in BTH is generally associated with the weakening of northerly or northwesterly winds, which facilitates the accumulation of air pollutants in BTH. The afforestation in the western and northwestern BTH increases SFz0, further decelerating northerly or northwesterly winds and deteriorating the haze pollution. However, the afforestation only plays a marginal role in worsening the haze pollution and does not constitute the main cause of the heavy haze formation.
Apparently, during the haze development, when the northerly or northwesterly wind is weak or becomes calm, the SFz0 increase due to the afforestation contributes negligibly to the haze deterioration in BTH. However, once the northerly or northwesterly wind commences to strengthen but is not strong enough to evacuate the air pollutants in BTH, the SFz0 increase would play an appreciable role in sustaining high PM2.5 levels in the downwind area of the afforestation. Figure 6 presents the PM2.5 contribution of the afforestation during the occurrence of a northerly gust on 18 January 2014. The intensified northerly wind cleanses the northern BTH, but the haze pollution is still very severe in the southern BTH. The afforestation considerably elevates the PM2.5 concentration in southeastern BTH, particularly in Beijing and Tianjin, with the PM2.5 contribution exceeding up to 15 % (Fig. 6b).

Figure 7Impacts of complete deforestation/afforestation over Taihang and Yanshan Mountains on (a)–(c) SFz0 and (b)–(d) average near-surface PM2.5 mass concentrations from 1 December 2013 to 31 January 2014, along with the wind field change (black arrows).
It is worth noting that the aerosol species (organic aerosol, sulfate, nitrate, ammonium, and elemental carbon) exhibit the same variation trend as the PM2.5 due to the afforestation (Fig. S5). Apparently, the organic aerosol is the major contributor to the PM2.5 variation due to the afforestation, followed by the sulfate and ammonium aerosol. The afforestation also increases emissions of the biogenic SOA (BSOA) precursors, such as isoprene and monoterpenes. However, due to the very low emissions of BSOA precursors during wintertime (Guenther et al., 2006, 2012), the BSOA contribution to PM2.5 concentrations is insignificant, less than 3 µg m−3 on average during the whole episodes (Fig. S6a). The average BSOA enhancement due to the afforestation is less than 0.5 % (Fig. S6b). Furthermore, in general, the afforestation has little effect on the boundary layer height, upward sensible heat flux (associated with turbulent mixing), and moisture (related to clouds) in BTH (Fig. S7).
To assess the upper limit of impacts of the afforestation on the PM2.5 level in BTH, two additional experiments are conducted and compared to the REF case. The two experiments are one with complete deforestation and the other with complete afforestation in the Taihang and Yan Mountains (Fig. 7a and c). In the complete deforestation sensitivity case, the barren surface with SFz0 of 0.01 m is used to replace other land cover categories. In the complete afforestation case, the deciduous broadleaf forest category with SFz0 of 0.5 m is used to replace other land cover categories. As shown in Fig. 7, complete deforestation considerably decreases the PM2.5 level in BTH, with the period average PM2.5 reduction ranging from 5 to 18 µg m−3 generally, and in particular the PM2.5 concentration in Beijing is reduced by more than 10 µg m−3, due to the intensified northerly or northwesterly wind caused by the decrease of SFz0 in the Taihang and Yan Mountains. Complete afforestation deteriorates the haze pollution in BTH, and the haze pollution remains in the Taihang and Yan Mountains due to the weakened northerly or northwesterly wind. Additionally, the enhancement of PM2.5 concentrations in the foothills of the Taihang and Yan Mountains is obvious, varying from 10 to 25 µg m−3 (Fig. 7d).
Interestingly, the afforestation deteriorates most of the haze pollution in Beijing (see Fig. 5). So it is anticipated that the proposed large ventilation corridor system could alleviate the haze pollution in Beijing (China Forestry Network, 2014, 2016b, c). Originally, the ventilation corridor system was devised to relieve the urban heat island effect and improve the thermal environmental conditions in urbanized regions. With the frequent occurrence of heavy haze in Beijing, the debatable system is expected to blow away the haze and bring blue skies to Beijing. In order to examine the effects of the wind corridor system, a sensitivity experiment is conducted based on the base case, in which three artificial ventilation corridors are designed in the northwest, north, and northeast of Beijing, with a width of 6 km (Fig. 8a). For all the grid cells within the corridors, the barren surface with SFz0 of 0.01 m is used to replace other land cover categories. In contrast to the expectation, our sensitivity results show that the PM2.5 reduction due to the designed ventilation corridor system is less than 1 % in Beijing (Fig. 8b). Note that the width of the ventilation corridor in the sensitivity study is 12 times the proposed one. Hence, the proposed large ventilation corridor system is not effective or beneficial to mitigate the haze pollution in Beijing.
The annual land cover product, MCD12Q1, derived from the MODIS observations since 2001 has been used to analyze the land cover change in BTH. A considerable increasing trend of forests in the western and northwestern BTH has been identified, which is caused by China's national afforestation programs. Forests in BTH and Beijing have increased by 7.2 % and 14.9 %, respectively, from 2001 to 2013. The fast forest expansion has increased the surface roughness height, particularly in Beijing and its surrounding areas.
The MCD12Q1 product of 2013 has been assimilated into the WRF-CHEM model to represent the current land cover condition. Persistent haze pollution episodes in BTH from 1 December 2013 to January 2014 are simulated using the WRF-CHEM model. Generally, the WRF-CHEM model reproduces the temporal variations and spatial distributions of air pollutants reasonably well compared to observations at monitoring sites in BTH.
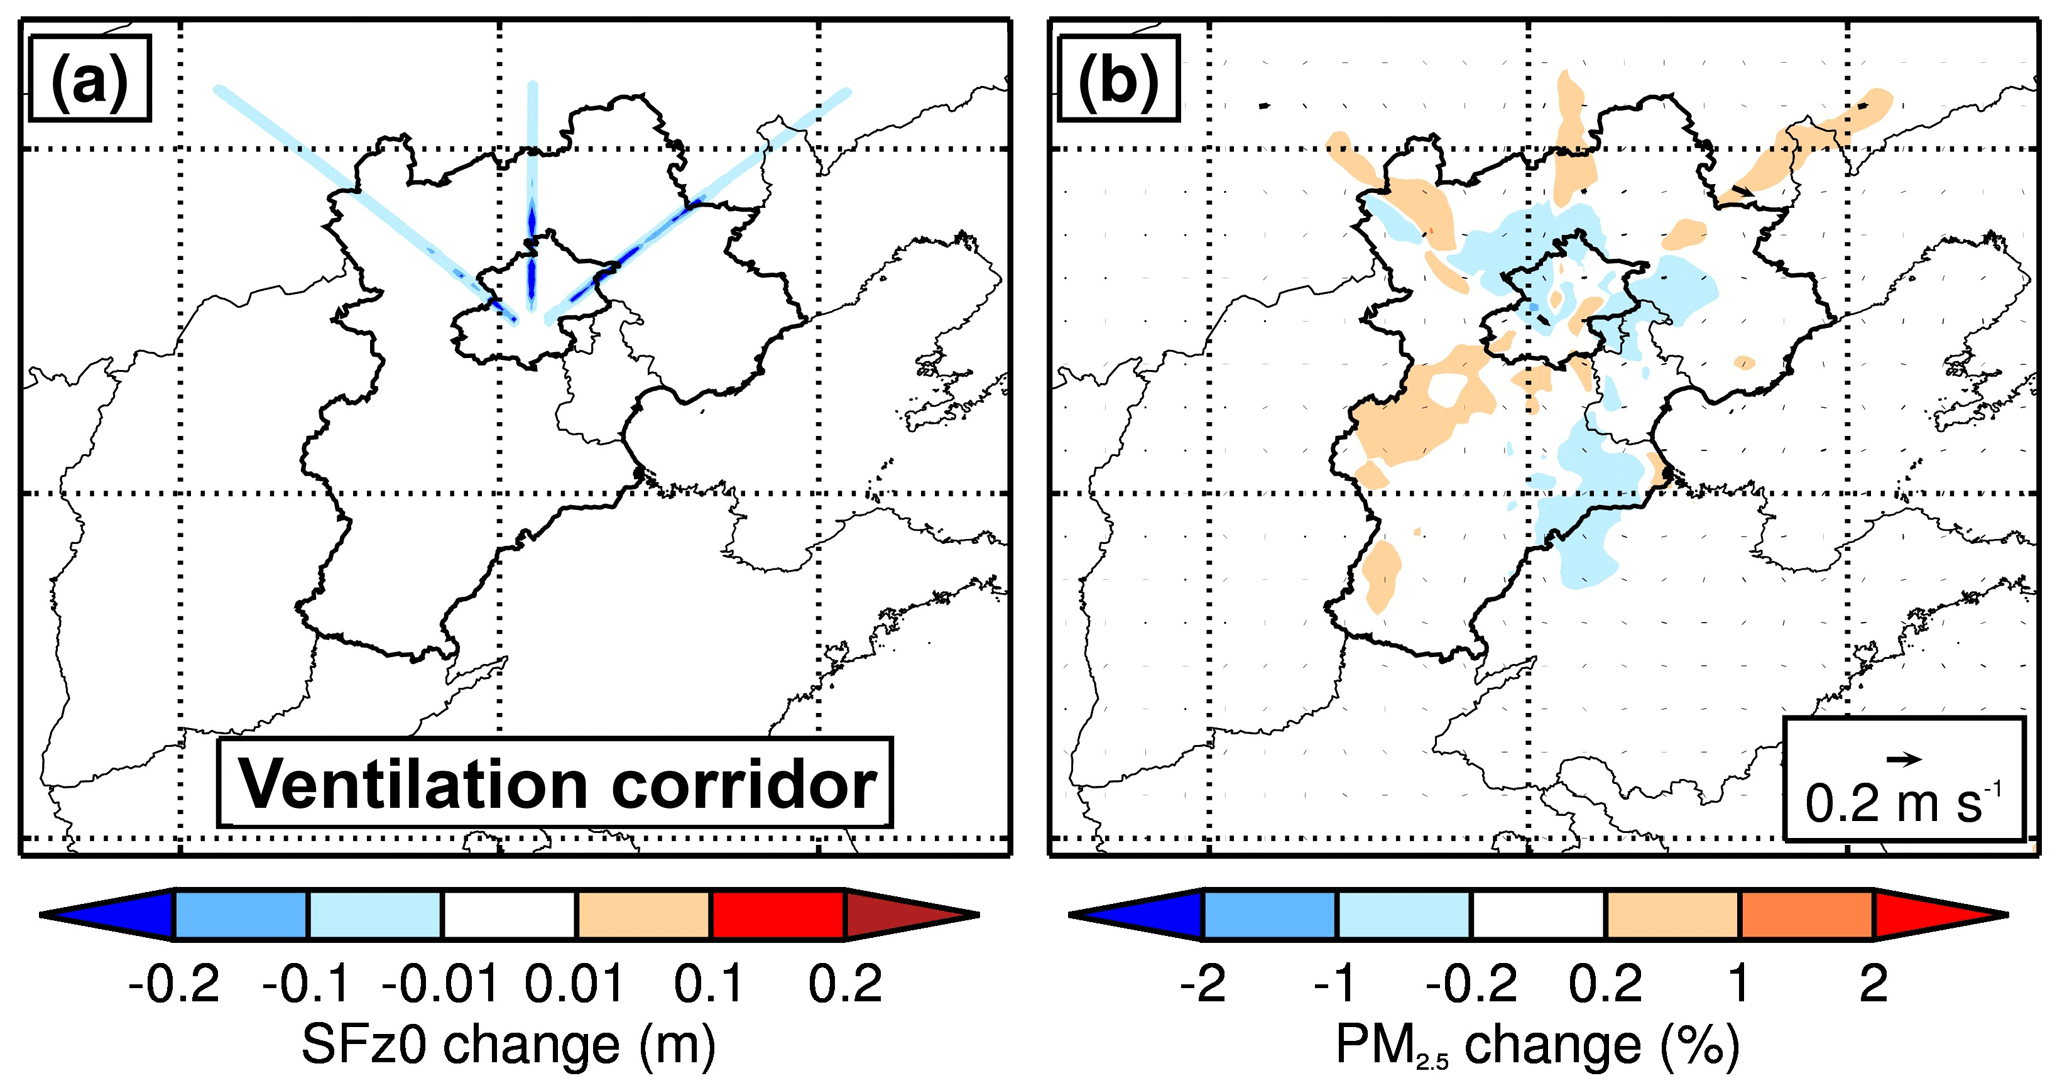
Figure 8Impacts of an artificial large ventilation corridor system on (a) SFz0 and (b) average near-surface PM2.5 mass concentrations from 1 December 2013 to 31 January 2014, along with the wind field (black arrows).
Sensitivity studies have demonstrated that the increase of the surface roughness height decreases the northwesterly or northerly wind speed in the western and northwestern BTH by about 0.3–1.5 m s−1. The haze pollution is deteriorated in BTH to some degree, and PM2.5 concentrations are generally enhanced by less than 6 % due to the afforestation. The heavy haze formation in BTH is generally associated with meteorological conditions when the northerly or northwesterly wind is weak. Once the northerly or northwesterly wind is strengthened during the haze development in BTH, afforestation plays a considerable role in maintaining high PM2.5 concentrations in the downwind of the afforestation area. Complete afforestation or deforestation in the Taihang and Yan Mountains would increase or decrease the PM2.5 level within 15 % in BTH.
Additionally, our model results do not support that the proposed large ventilation corridor system is beneficial to alleviate the haze pollution in Beijing. Under the unfavorable synoptic situations, emissions mitigation is the sole optimum approach to mitigate the haze pollution in BTH.
It is worth noting that, in the present study, contributions of the surface roughness change induced by afforestation to the haze pollution are primarily evaluated using the WRF-CHEM model, but many other factors which directly or indirectly influence air quality are also modified by the land cover change, including surface moisture, terrestrial erosion, pollutants' dry deposition, planetary boundary layer thermal stability, etc. For example, changes in surface moisture and surface erosion impact the emissions of natural particles; changes in dry deposition directly influence the air quality in situ and indirectly the air quality downwind with occurrence of recirculation. Therefore, when changes in all those factors caused by land cover change are accounted for, the role of afforestation in air quality in situ might be uncertain. In the online WRF-CHEM model, besides the surface roughness, the impacts of afforestation on the heat flux, surface moisture, surface erosion, and dry deposition of air pollutants have also been considered. Considering that afforestation in BTH is mainly distributed in the mountain region, the surface roughness increases induced by afforestation obviously decrease surface wind speeds, facilitating accumulation of air pollutants in the downwind region and further deteriorating the haze pollution.
The real-time O3 and PM2.5 observations are accessible for the public on the website http://106.37.208.233:20035/ (China MEP, 2013a). One can also access the historic profile of observed ambient pollutants through visiting http://www.aqistudy.cn/ (China MEP, 2013b). The MODIS Land Cover products (MOD12Q1) are accessible for the public on the website https://lpdaac.usgs.gov/dataset_discovery/modis/modis_products_table.
The supplement related to this article is available online at: https://doi.org/10.5194/acp-18-10869-2018-supplement.
GL designed the study. XL and GL wrote the paper. XL, NB, JW, and XL performed model simulations. TF, SZ, JC, and ZA analyzed the data. All authors reviewed and commented on the paper.
The authors declare that they have no conflict of interest.
This article is part of the special issue “Regional transport and transformation of air pollution in eastern China”. It is not associated with a conference.
This work was financially supported by National Key R&D Plan (Quantitative
Relationship and Regulation Principle between Regional Oxidation Capacity of
Atmospheric and Air Quality (2017YFC0210000)). Long Xin was supported by the
Fundamental Research Funds for the Central Universities, a project
funded by China Postdoctoral Science Foundation (no. 2016M602886), and the
Shaanxi Postdoctoral Science Foundation (no. 2017BSHYDZZ27). Guohui Li is
supported by “Hundred Talents Program” of the Chinese Academy of Sciences
and the National Natural Science Foundation of China (no.
41661144020).
Edited by: Zhanqing
Li
Reviewed by: three anonymous referees
Bai, Y., Feng, M., Jiang, H., Wang, J., and Liu, Y.: Validation of land cover maps in China using a sampling-based labeling approach, Remote Sens.-Basel, 7, 10589–10606, 2015.
Bei, N., Li, G., and Molina, L. T.: Uncertainties in SOA simulations due to meteorological uncertainties in Mexico City during MILAGRO-2006 field campaign, Atmos. Chem. Phys., 12, 11295–11308, https://doi.org/10.5194/acp-12-11295-2012, 2012.
Bei, N., Wu, J., Elser, M., Feng, T., Cao, J., El-Haddad, I., Li, X., Huang, R., Li, Z., Long, X., Xing, L., Zhao, S., Tie, X., Prévôt, A. S. H., and Li, G.: Impacts of meteorological uncertainties on the haze formation in Beijing–Tianjin–Hebei (BTH) during wintertime: a case study, Atmos. Chem. Phys., 17, 14579–14591, https://doi.org/10.5194/acp-17-14579-2017, 2017.
Bichet, A., Wild, M., Folini, D., and Schar, C.: Causes for decadal variations of wind speed over land: Sensitivity studies with a global climate model, Geophy. Res. Lett., 39, L11701, https://doi.org/10.1029/2012GL051685, 2012.
Binkowski, F. S. and Roselle, S. J.: Models-3 Community Multiscale Air Quality (CMAQ) model aerosol component: 1. Model description, J. Geophys. Res., 108, 4183, https://doi.org/10.1029/2001JD001409, 2003.
Cao, S., Chen, L., Shankman, D., Wang, C., Wang, X., and Zhang, H.: Excessive reliance on afforestation in China's arid and semi-arid regions: lessons in ecological restoration, Earth-Sci. Rev., 104, 240–245, 2011.
Chen, F. and Dudhia, J.: Coupling an advanced land surface–hydrology model with the Penn State–NCAR MM5 modeling system, Part II: Preliminary model validation, Mon. Weather Rev., 129, 587–604, 2001.
Chen, F., Mitchell, K., Schaake, J., Xue, Y., Pan, H. L., Koren, V., Duan, Q. Y., Ek, M., and Betts, A.: Modeling of land surface evaporation by four schemes and comparison with FIFE observations, J. Geophys. Res.-Atmos., 101, 7251–7268, 1996.
Chen, L., Li, D., and Pryor, S. C.: Wind speed trends over China: quantifying the magnitude and assessing causality, Int. J. Climatol., 33, 2579–2590, 2013.
Cheng, W. Y. Y. and Steenburgh, W. J.: Evaluation of surface sensible weather forecasts by the WRF and the Eta Models over the western United States, Weather Forecast., 20, 812–821, https://doi.org/10.1175/waf885.1, 2005.
China Forestry Network: The Beijing's ventilation corridor system would promote the PM2.5 concentration to reach the standard, available at: http://www.forestry.gov.cn/portal/main/s/2103/content-686660.html, last access: 27 November 2014.
China Forestry Network: Chinese State Forestry Bureau: It is lack of scientific basis between the shelter forest and severe haze pollution and surface-level stilling, available at: http://www.forestry.gov.cn/thw/1807/content-834072.html, last access: 27 November 2016a.
China Forestry Network: Could the urban ventilation corridor system blow away severe haze pollution?, available at: http://www.forestry.gov.cn/main/2103/content-857797.html, last access: 27 November 2016b.
China Forestry Network: Scientists analyzed the effect of ongoing Beijing's ventilation corridor system on blowing away Beijing's haze pollution, available at: http://www.forestry.gov.cn/main/2103/content-872159.html, last access: 27 November 2016c.
China Forestry Network: Ecological controlling: The Three North Shelter Forest helps to mitigate heavy pollution weather conditions, available at: http://www.forestry.gov.cn/zlszz/4253/content-936157.html, last access: 27 November 2017.
Chou, M.-D. and Suarez, M. J.: A solar radiation parameterization for atmospheric studies, NASA Tech. Memo, 15, 40 pp., 1999.
Chou, M.-D., Suarez, M. J., Liang, X.-Z., Yan, M. M.-H., and Cote, C.: A thermal infrared radiation parameterization for atmospheric studies, Tech. Rep. NASA/TM-2001-104606, 19, 55 pp., 2001.
Claussen, M.: Area-averaging of surface fluxes in a neutrally stratified, horizontally inhomogeneous atmospheric boundary layer, Atmos. Environ., 24, 1349–1360, 1990.
Duan, H., Yan, C., Tsunekawa, A., Song, X., Li, S., and Xie, J.: Assessing vegetation dynamics in the Three-North Shelter Forest region of China using AVHRR NDVI data, Environ. Earth Sci., 64, 1011–1020, 2011.
Emmons, L. K., Walters, S., Hess, P. G., Lamarque, J.-F., Pfister, G. G., Fillmore, D., Granier, C., Guenther, A., Kinnison, D., Laepple, T., Orlando, J., Tie, X., Tyndall, G., Wiedinmyer, C., Baughcum, S. L., and Kloster, S.: Description and evaluation of the Model for Ozone and Related chemical Tracers, version 4 (MOZART-4), Geosci. Model Dev., 3, 43–67, https://doi.org/10.5194/gmd-3-43-2010, 2010.
Friedl, M. A., McIver, D. K., Hodges, J. C., Zhang, X., Muchoney, D., Strahler, A. H., Woodcock, C. E., Gopal, S., Schneider, A., and Cooper, A.: Global land cover mapping from MODIS: algorithms and early results, Remote Sens. Environ., 83, 287–302, 2002.
Friedl, M. A., Sulla-Menashe, D., Tan, B., Schneider, A., Ramankutty, N., Sibley, A., and Huang, X.: MODIS Collection 5 global land cover: Algorithm refinements and characterization of new datasets, Remote Sens. Environ., 114, 168–182, 2010.
Gerten, D., Schaphoff, S., Haberlandt, U., Lucht, W., and Sitch, S.: Terrestrial vegetation and water balance – hydrological evaluation of a dynamic global vegetation model, J. Hydrol., 286, 249–270, 2004.
Grell, G. A., Peckham, S. E., Schmitz, R., McKeen, S. A., Frost, G., Skamarock, W. C., and Eder, B.: Fully coupled “online” chemistry within the WRF model, Atmos. Environ., 39, 6957–6975, 2005.
Guenther, A., Karl, T., Harley, P., Wiedinmyer, C., Palmer, P. I., and Geron, C.: Estimates of global terrestrial isoprene emissions using MEGAN (Model of Emissions of Gases and Aerosols from Nature), Atmos. Chem. Phys., 6, 3181–3210, https://doi.org/10.5194/acp-6-3181-2006, 2006.
Guenther, A. B., Jiang, X., Heald, C. L., Sakulyanontvittaya, T., Duhl, T., Emmons, L. K., and Wang, X.: The Model of Emissions of Gases and Aerosols from Nature version 2.1 (MEGAN2.1): an extended and updated framework for modeling biogenic emissions, Geosci. Model Dev., 5, 1471–1492, https://doi.org/10.5194/gmd-5-1471-2012, 2012.
Hong, S.-Y. and Lim, J.-O. J.: The WRF Single-Moment 6-Class Microphysics Scheme (WSM6), Asia-Pac., J. Atmos. Sci., 42, 129–151, 2006.
Horowitz, L. W., Walters, S., Mauzerall, D. L., Emmons, L. K., Rasch, P. J., Granier, C., Tie, X. X., Lamarque, J. F., Schultz, M. G., Tyndall, G. S., Orlando, J. J., and Brasseur, G. P.: A global simulation of tropospheric ozone and related tracers: Description and evaluation of MOZART, version 2, J. Geophys. Res.-Atmos., 108, 4784, https://doi.org/10.1029/2002jd002853, 2003.
Huang, T., Zhang, X., Ling, Z., Zhang, L., Gao, H., Tian, C., Guo, J., Zhao, Y., Wang, L., and Ma, J.: Impacts of Large-Scale Land-Use Change on the Uptake of Polycyclic Aromatic Hydrocarbons in the Artificial Three Northern Regions Shelter Forest Across Northern China, Environ. Sci. Technol., 50, 12885, https://doi.org/10.1021/acs.est.6b04835, 2016.
Jiménez, P. A. and Dudhia, J.: Improving the representation of resolved and unresolved topographic effects on surface wind in the WRF Model, J. Appl. Meteorol. Clim., 51, 300–316, 2012.
Janjić, Z. I.: Nonsingular implementation of the Mellor–Yamada level 2.5 scheme in the NCEP Meso model, NCEP office note, 437, 61 pp., 2002.
Li, G., Zhang, R., Fan, J., and Tie, X.: Impacts of black carbon aerosol on photolysis and ozone, J. Geophys. Res., 110, D23206, https://doi.org/10.1029/2005JD005898, 2005.
Li, G., Lei, W., Zavala, M., Volkamer, R., Dusanter, S., Stevens, P., and Molina, L. T.: Impacts of HONO sources on the photochemistry in Mexico City during the MCMA-2006/MILAGO Campaign, Atmos. Chem. Phys., 10, 6551–6567, https://doi.org/10.5194/acp-10-6551-2010, 2010.
Li, G., Bei, N., Tie, X., and Molina, L. T.: Aerosol effects on the photochemistry in Mexico City during MCMA-2006/MILAGRO campaign, Atmos. Chem. Phys., 11, 5169–5182, https://doi.org/10.5194/acp-11-5169-2011, 2011a.
Li, G., Zavala, M., Lei, W., Tsimpidi, A. P., Karydis, V. A., Pandis, S. N., Canagaratna, M. R., and Molina, L. T.: Simulations of organic aerosol concentrations in Mexico City using the WRF-CHEM model during the MCMA-2006/MILAGRO campaign, Atmos. Chem. Phys., 11, 3789–3809, https://doi.org/10.5194/acp-11-3789-2011, 2011b.
Li, G., Lei, W., Bei, N., and Molina, L. T.: Contribution of garbage burning to chloride and PM2.5 in Mexico City, Atmos. Chem. Phys., 12, 8751–8761, https://doi.org/10.5194/acp-12-8751-2012, 2012.
Li, G., Bei, N., Cao, J., Wu, J., Long, X., Feng, T., Dai, W., Liu, S., Zhang, Q., and Tie, X.: Widespread and persistent ozone pollution in eastern China during the non-winter season of 2015: observations and source attributions, Atmos. Chem. Phys., 17, 2759–2774, https://doi.org/10.5194/acp-17-2759-2017, 2017.
Li, X., Wang, H., Zhou, S., Sun, B., and Gao, Z.: Did ecological engineering projects have a significant effect on large-scale vegetation restoration in Beijing-Tianjin Sand Source Region, China? A remote sensing approach, Chinese Geogr. Sci., 26, 216–228, 2016.
Lim, S. S., Vos, T., Flaxman, A. D., Danaei, G., Shibuya, K., Adair-Rohani, H., AlMazroa, M. A., Amann, M., Anderson, H. R., and Andrews, K. G.: A comparative risk assessment of burden of disease and injury attributable to 67 risk factors and risk factor clusters in 21 regions, 1990–2010: a systematic analysis for the Global Burden of Disease Study 2010, The lancet, 380, 2224–2260, 2013.
Liu, J. G., Li, S. X., Ouyang, Z. Y., Tam, C., and Chen, X. D.: Ecological and socioeconomic effects of China's policies for ecosystem services, P. Natl. Acad. Sci. USA, 105, 9477–9482, 2008.
Ma, J. and Daggupaty S. M.: Stability Dependence of Height Scales and Effective Roughness Lengths of Momentum and Heat Transfer Over Roughness Changes, Bound.-Lay. Meteorol., 88, 145–160, 1998.
Mahrt, L.: The bulk aerodynamic formulation over heterogeneous surfaces, Bound.-Lay. Meteorol., 78, 87–119, 1996.
Mason, P. J.: The formation of area-averaged roughness lengths, Q. J. Roy. Meteor. Soc., 114, 399-420, 1988.
McVicar, T. R., Roderick, M. L., Donohue, R. J., Li, L. T., Van Niel, T. G., Thomas, A., Grieser, J., Jhajharia, D., Himri, Y., Mahowald, N. M., Mescherskaya, A. V., Kruger, A. C., Rehman, S., and Dinpashoh, Y.: Global review and synthesis of trends in observed terrestrial near-surface wind speeds: Implications for evaporation, J. Hydrol., 416, 182–205, 2012.
Ministry of Environmental Protection, China (China MEP): Air Quality Observation Real-time Release Platform of MEP Data Center, available at: http://106.37.208.233:20035/ (last access: 30 June 2018), 2013a.
Ministry of Environmental Protection, China (China MEP): Online Monitoring and Analysis Platform of China Air Quality, available at: http://www.aqistudy.cn/ (last access: 30 June 2018), 2013b.
Mitchell, K.: The Community Noah Land-Surface Model (LSM), User's Guide, Public Release Version 2.7.1, available at: https://ral.ucar.edu/sites/default/files/public/product-tool/unified-noah-lsm/Noah_LSM_USERGUIDE_2.7.1.pdf (last access: 30 June 2018), 2005 (updated 2017).
Mughal, M. O., Lynch, M., Yu, F., Mcgann, B., Sutton, J., and Sutton, J.: Wind modelling, validation and sensitivity study using Weather Research and Forecasting model in complex terrain, Environ. Modell. Softw., 90, 107–125, 2017.
Nenes, A., Pandis, S. N., and Pilinis, C.: ISORROPIA: A new thermodynamic equilibrium model for multiphase multicomponent inorganic aerosols, Aquat. Geochem., 4, 123–152, 1998.
Parungo, F., Li, Z., Li, X., Yang, D., and Harris, J.: Gobi dust storms and The Great Green Wall, Geophy. Res. Lett., 21, 999–1002, 2013.
Philip, J. R.: Two-dimensional checkerboards and blending heights, Bound. Lay. Meteorol., 80, 1–18, 1996.
Reichstein, M., Ciais, P., Papale, D., Valentini, R., Running, S., Viovy, N., Cramer, W., Granier, A., Ogee, J., and Allard, V.: Reduction of ecosystem productivity and respiration during the European summer 2003 climate anomaly: a joint flux tower, remote sensing and modelling analysis, Glob. Change Biol., 13, 634–651, 2007.
Sun, Y., Chen, C., Zhang, Y., Xu, W., Zhou, L., Cheng, X., Zheng, H., Ji, D., Li, J., and Tang, X.: Rapid formation and evolution of an extreme haze episode in Northern China during winter 2015, Sci. Rep.-UK, 6, 27151, https://doi.org/10.1038/srep27151, 2016.
Streets, D. G., Zhang, Q., Wang, L., He, K., Hao, J., Wu, Y., Tang, Y., and Carmichael, G. R.: Revisiting China's CO emissions after the Transport and Chemical Evolution over the Pacific (TRACE-P) mission: Synthesis of inventories, atmospheric modeling, and observations, J. Geophys. Res.-Atmos., 111, D14306, https://doi.org/10.1029/2006JD007118, 2006.
Tie, X., Zhang, Q., He, H., Cao, J., Han, S., Gao, Y., Li, X., and Jia, X. C.: A budget analysis of the formation of haze in Beijing, Atmos. Environ., 100, 25–36, 2015.
Turner, B. L., Lambin, E. F., and Reenberg, A.: The emergence of land change science for global environmental change and sustainability, P. Natl. Acad. Sci. USA, 104, 20666–20671, 2007.
Vautard, R., Cattiaux, J., Yiou, P., Thépaut, J.-N., and Ciais, P.: Northern Hemisphere atmospheric stilling partly attributed to an increase in surface roughness, Nat. Geosci., 3, 756–761, 2010.
Wang, S. and Hao, J.: Air quality management in China: Issues, challenges, and options, J. Environ. Sci., 24, 2–13, 2012.
Wesely, M.: Parameterization of surface resistances to gaseous dry deposition in regional-scale numerical models, Atmos. Environ., 23, 1293–1304, 1989.
Wiedinmyer, C., Akagi, S. K., Yokelson, R. J., Emmons, L. K., Al-Saadi, J. A., Orlando, J. J., and Soja, A. J.: The Fire INventory from NCAR (FINN): a high resolution global model to estimate the emissions from open burning, Geosci. Model Dev., 4, 625–641, https://doi.org/10.5194/gmd-4-625-2011, 2011.
Wieringa, J.: Roughness-dependent geographical interpolation of surface wind speed averages, Q. J. Roy. Meteorol. Soc., 112, 867–889, 1986.
Wood, N. and Mason, P.: The influence of static stability on the effective roughness lengths for momentum and heat transfer, Q. J. Roy. Meteorol. Soc., 117, 1025–1056, 1991.
Wu, J., Zha, J., and Zhao, D.: Evaluating the effects of land use and cover change on the decrease of surface wind speed over China in recent 30 years using a statistical downscaling method, Clim. Dynam., 1–19, 2016a.
Wu, J., Zha, J., and Zhao, D.: Estimating the impact of the changes in land use and cover on the surface wind speed over the East China Plain during the period 1980–2011, Clim. Dynam., 46, 847–863, 2016b.
Wu, J., Li, G., Cao, J., Bei, N., Wang, Y., Feng, T., Huang, R., Liu, S., Zhang, Q., and Tie, X.: Contributions of trans-boundary transport to summertime air quality in Beijing, China, Atmos. Chem. Phys., 17, 2035–2051, https://doi.org/10.5194/acp-17-2035-2017, 2017.
Wu, W., Shibasaki, R., Ongaro, L., Ongaro, L., Zhou, Q., and Tang, H.: Validation and comparison of 1 km global land cover products in China, Int. J. Remote Sens., 29, 3769–3785, 2008.
Yang, Y., Xiao, P., Feng, X., and Li, H.: Accuracy assessment of seven global land cover datasets over China, ISPRS J. Photogramm., 125, 156–173, 2017.
Yin, R. S., Yin, G. P., and Yin, R.: China's primary programs of terrestrial ecosystem restoration: initiation, implementation, and challenges, Environ. Manage., 45, 429–441, 2010.
Zhang, Q., Streets, D. G., Carmichael, G. R., He, K. B., Huo, H., Kannari, A., Klimont, Z., Park, I. S., Reddy, S., Fu, J. S., Chen, D., Duan, L., Lei, Y., Wang, L. T., and Yao, Z. L.: Asian emissions in 2006 for the NASA INTEX-B mission, Atmos. Chem. Phys., 9, 5131–5153, https://doi.org/10.5194/acp-9-5131-2009, 2009.
Zhang, X., Huang, T., Zhang, L., Gao, H., Shen, Y., and Ma, J.: Trends of deposition fluxes and loadings of sulfur dioxide and nitrogen oxides in the artificial Three Northern Regions Shelter Forest across northern China, Environ. Pollut., 207, 238–247, 2015.
Zhang, X., Du, J., Huang, T., Zhang, L., Gao, H., Zhao, Y., and Ma, J.: Atmospheric removal of PM2.5 by man-made Three Northern Regions Shelter Forest in Northern China estimated using satellite retrieved PM2.5 concentration, Sci. Total Environ., 593–594, 713, 2017.
Zhao, X. J., Zhao, P. S., Xu, J., Meng,, W., Pu, W. W., Dong, F., He, D., and Shi, Q. F.: Analysis of a winter regional haze event and its formation mechanism in the North China Plain, Atmos. Chem. Phys., 13, 5685–5696, https://doi.org/10.5194/acp-13-5685-2013, 2013.