
the Creative Commons Attribution 4.0 License.
the Creative Commons Attribution 4.0 License.
 | 13 Jul 2026
Relaxed Eddy Accumulation based Flux Measurement of Atmospheric Inorganic Acidic Species over Cropland under the Long-Term Exposure to Chemical Industry Emissions in a Chinese Megacity
Jingya Hua
Xinyu Wang
Yulian Wei
Jieya Sun
Zongjun Li
Zhongliang Huang
Qiongqiong Wang
Industrial emissions in China's densely populated regions turn surrounding lands into high-deposition-load hotspots, alter physicochemical properties of soils and vegetation, and lead to complex sink-source transitions of land surface. The lack of local flux data impedes integrated air-soil pollution control. We developed a Relaxed Eddy Accumulation (REA) system capable of simultaneous flux measurements of eight inorganic species (HNO3, HONO, SO2, HCl, nitrate, nitrite, sulfate, chloride). System characterization showed detection limits of 6.1 × 10⁻⁴–2.4 × 10⁻¹ µg m−2 s−1 and flux precisions of 5.4 %–32.3 %, with uncertainties dominated by mass analysis, lag time error, and sonic-temperature-derived proportionality coefficient β. Flux measurements conducted in winter at a vegetable cropland adjacent to chemical industry facilities revealed that HONO and nitrate fluxes at this site were 1–2 orders of magnitude higher than those reported in the literature. Bidirectional fluxes of the species indicate the cropland acts as both source and sink; but winter averages showed net emission fluxes only for HONO and nitrite (mean daily 2.49 and 0.53 mg m−2 d−1). Gross upward emission fluxes of HNO3 and HONO were 1.1 ± 0.9 and 0.4 ± 0.4 µg m−2 s−1, respectively, with HNO3 emissions enhanced by turbulence and HONO promoted at low temperatures. Such emissions are expected to enhance atmospheric nitrate aerosol formation and atmospheric oxidative capacity. These results provide critical observational constraints for acidic species exchange parameterization in industrial-influenced regions, advancing understanding of reactive nitrogen cycling and supporting air pollution control and agro-ecological protection strategies.
- Article
(3278 KB) - Full-text XML
-
Supplement
(3998 KB) - BibTeX
- EndNote


Atmospheric inorganic acidic species mainly include gaseous sulfur dioxide (SO2), nitric acid (HNO3), nitrous acid (HONO), and hydrogen chloride (HCl), as well as their particulate-phase counterparts: sulfate (SO), nitrate (NO), nitrite (NO), and chloride (Cl−). Dry deposition is a key removal pathway for these acidic pollutants, reducing their ambient concentrations and attenuating regional transport. Atmospheric dry deposition of sulfur and nitrogen species provides a pivotal nutrient supply for crop growth and ecosystems (Galloway, 1995; Poor et al., 2001; Shen et al., 2018; Vitousek and Howarth, 1991). However, high deposition flux induces physiological stress in crops (Aber et al., 1998), disrupts their normal metabolism, photosynthesis and respiration. Furthermore, the deposition of acidic species may exacerbate soil acidification and trigger eutrophication of surface water and groundwater (van Breemen and van Dijk, 1988).
Most existing measurements on dry deposition fluxes of atmospheric inorganic acidic species were conducted in forest (Xu et al., 2021; Nguyen et al., 2015; Hansen et al., 2015; Farmer et al., 2011, 2013; Meyers et al., 1989; Sievering et al., 2001; Pryor et al., 2001, 2002; Gordon et al., 2011; Zhou et al., 2011; Zhang et al., 2012; Ren et al., 2011), grassland (Nemitz et al., 2009; Myles et al., 2007; Huebert and Robert, 1985; Huebert et al., 1988; von der Heyden et al., 2022; Rumsey and Walker, 2016; Nemitz et al., 2004; Rattray and Sievering, 2001), and agricultural ecosystems (Meyers et al., 1998, 2006; Shaw et al., 1998; Laufs et al., 2017; Meng et al., 2022). Wuhan, a megacity in central China, hosts a large number of iron, steel and petrochemical industry facilities in its urban and suburban areas, which are closely interspersed with extensive farmland. Industrial processes discharge large amounts of pollutants, rendering adjacent farmlands high-deposition-load zones of acidic species. In addition to potential adverse human health risks from dietary and respiratory exposures, long-term exposure to industrial emissions may alter the physicochemical properties of vegetation and soil, making deposition pathways and resistances of atmospheric acidic species differ from those over natural farmlands. With long-term exposure to industrial emissions, farmlands may shift from sinks to potential emission sources of acidic species, e.g., fugitive dust from farmlands and widely known HONO release from soil (Su et al., 2011). The co-occurrence of deposition, surface emissions and possible near-ground chemical reactions complicates the sink and source dynamics of acidic species in farmlands and brings large uncertainties to the development of deposition resistance parameterizations for this type of ecosystem. To date, no quantitative measurement on acidic species fluxes has been conducted in this specific habitat. The lack of relevant flux data constrains the development of effective air pollution control strategies and agro-ecological protection practices in such regions.
Eddy covariance (EC) (Farmer et al., 2013; Nguyen et al., 2015), relaxed eddy accumulation (REA) (Matsuda et al., 2015; Xu et al., 2021; Hansen et al., 2015; von der Heyden et al., 2022), gradient measurement (Rumsey and Walker, 2016; Nemitz et al., 2009), and flux chamber methods (Scharko et al., 2015) are widely used for atmospheric inorganic acidic species flux determination. The REA is a conditional sampling technique to measure trace atmospheric components for which fast response sensors (> 10 Hz) required for EC are not available. The REA has notable advantages for field applications: simultaneous multi-species flux measurements and lower cost than the EC method. In this study, we developed an REA system and conducted a flux measurement campaign in a cropland immediately adjacent to an urban chemical industrial park in winter, the typical haze season of Wuhan. The main objectives of this study were: (1) to characterize the flux measurement uncertainty and detection limit and precision of the REA system; (2) to determine the flux of atmospheric acidic species over the farmland ecosystem under the long-term influence of chemical industry emissions; (3) to estimate the gross emission fluxes of HONO and HNO3 from the farmland based on mass conservation and dry deposition resistance model.
2.1 Relaxed eddy accumulation technique
First proposed by Businger and Oncley (1990), the REA method measures the vertical flux of atmospheric species by separating air into updraft and downdraft sampling reservoirs based on high-frequency vertical wind velocity measurements. Flux is derived from the difference of average concentrations between the two reservoirs and the bulk weighting of two turbulence statistics that can be stably measured over a sampling interval:
where Cup andCdown are the average concentrations in updraft and downdraft, σw is the standard deviation of vertical wind speed (w) and β is a dimensionless proportionality coefficient universal for scalars, which can be calculated from sonic anemometer measurements of sensible heat flux . This framework enables stable and controllable flux calculations, with results highly consistent with EC measurements(Karl et al., 2005; Gaman et al., 2004; Lee et al., 2005; Pryor et al., 2007).
We built an REA sampling system for simultaneous sampling of gaseous and particulate inorganic acidic species (Fig. 1). High-frequency (10 Hz) w was measured by a 3D sonic anemometer (CSAT3B, Campbell Scientific Inc., Logan, Utah, USA). Each of three sampling channels (updraft, downdraft, dead-band) was equipped with an annular denuder (URG-2000-30 × 242-3CSS, URG, Chapel Hill, North Carolina, USA) for gaseous HNO3, HONO, SO2 and HCl collection and a filter cartridge with a 2 µm PTFE filter (Whatman 7592-104, 46.2 mm, PP ring-supported) installed downstream for particulate NO, NO, SO, and Cl− collection. The three sampling channels shared a single PM2.5 cyclone inlet (URG-2000-30EH, URG, Chapel Hill, North Carolina, USA), a 1.35 m stainless steel inlet tube and a sampling pump (KNF N026.1ANE, KNF Neuberger GmbH, Freiburg, Germany). Notably, the system features expandable sorbent tube channels for simultaneous VOC flux measurements, but only its performance for inorganic acidic species is reported herein. The sampling flow rate was set to a nominal 10 standard liters per minute with a mass flow controller (MFC, No. 12 in Fig. 1) mounted on the inlet side of the pump. The flow in the inlet tube was in the laminar regime (the Reynolds number ∼ 200), which is essential for the denuders to work properly (i.e., efficient gas-particle separation). The lag time for air to travel from the inlet to the sampling filter membrane was calculated according to total internal volume of air tubing and volumetric flow rate at the onset of each sampling run. For example, it was 3.1 s at ambient temperature 15 °C.
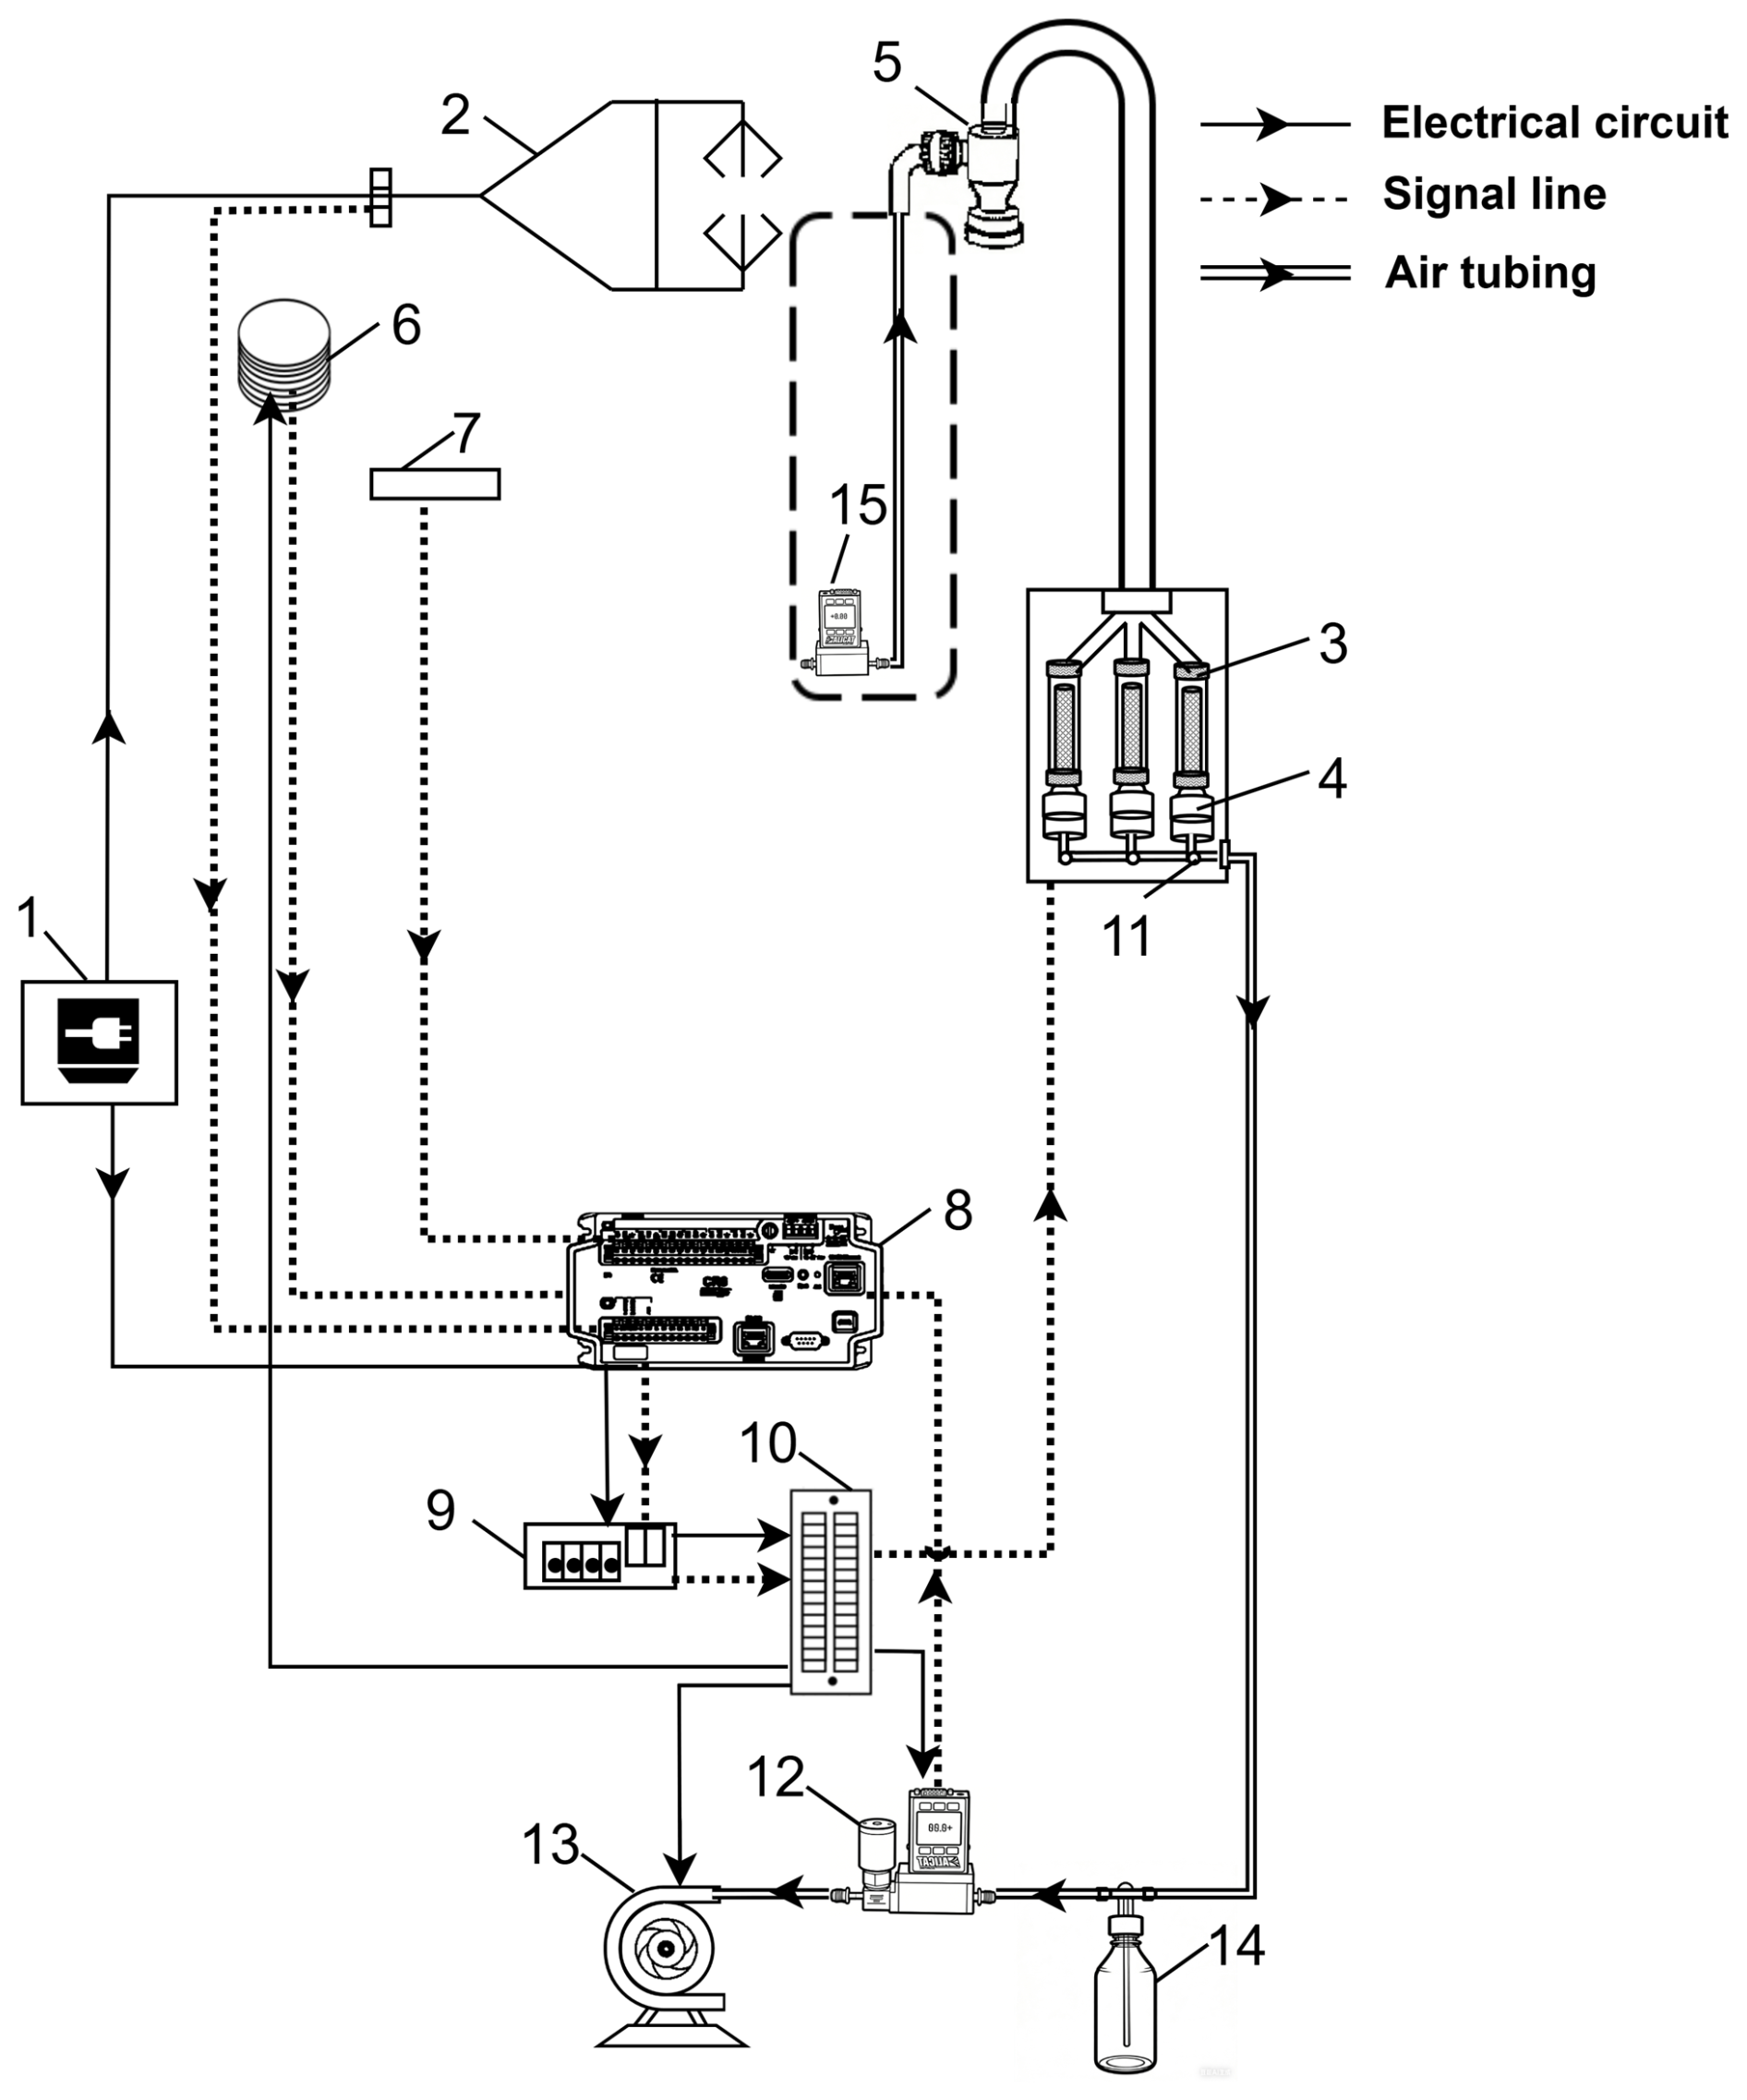
Figure 1Schematic diagram of the REA flux sampling device for atmospheric inorganic gas and particles. (1) Power supply; (2) 3D sonic anemometer; (3) Denuder tube; (4) Filter-pack cartridge; (5) Cyclone inlet; (6) Vaisala Weather Transmitter; (7) Thermocouple; (8) Data logger; (9) Relay; (10) Terminal block for signal and power distribution; (11) Fast switching valves; (12) Mass flow controller (MFC); (13) Pump; (14) 500 ml buffer bottle; (15) Mass flow meter (MFM) used in test runs only.
A CR1000X data logger (Campbell Scientific Inc., Logan, Utah, USA) served as the system central controller, responsible for data acquisition, storage, and conditional sampling logic execution. Conditional switching between the sampling channels was checked at 2 Hz to balance high-frequency flux loss and perturbations to the laminar flow in the denuders. Three-minute running mean () and standard deviation of w (σw) were calculated in real time to trigger the actuation of three solenoid valves (Numatics LS02M6F00B, Emerson Electric Co., St. Louis, Missouri, USA): updraft sampling at w > 0.6σw, downdraft sampling at w < 0.6σw, and dead-band airflow within the w±0.6σw range. Wind speed triggering threshold selection involves a trade-off between the precision of Cup−Cdown measurements and sample representativeness. As an empirical threshold commonly used in REA studies, 0.6σw has been demonstrated to provide reliable flux estimates (Bowling et al., 1998; Desjardins, 1977; Velentini et al., 1997; Businger and Oncley, 1990).
Lag time was taken into account to determine the precise timing of solenoid valve switching. The CSAT3B sonic anemometer had a minimum response time of 0.7 ms, with effectively zero signal latency to the data logger. The total end-to-end system time delay was 17.9 ms, including 10–15 ms for solenoid valve response, 1.4 ms for relay actuation, and 4 ms for real-time calculation and command execution. This short delay time minimized temporal misalignment between wind measurements and the sampling, reducing updraft/downdraft mixing and flux result distortion.
The REA device was mounted on a 4 m high flux tower. The sonic anemometer was installed at the tower top, oriented due north (the prevailing local winter wind direction). The inlet of the PM2.5 cyclone was vertically aligned with the anemometer, with a horizontal separation of 0.3 m. The sampling enclosure housing the sampling unit and solenoid valves was fixed on the tower 0.7 m below the anemometer to minimize airflow disturbance around the anemometer. A Vaisala Weather Transmitter WXT536 was also installed near the top of tower to provide supporting measurements of air pressure, air temperature, relative humidity, precipitation, wind speed, and wind direction. The pump and other REA components were mounted at the tower base.
2.2 Sample collection and chemical analysis
The Wuhan Chemical Industrial Park (WCIP) is located northeast to the urban area of Wuhan. The WCIP covers 71.64 km2 and hosts petrochemical, fine chemical, and building material industries. Since its full operation in 2013, the WCIP has been identified as a major industrial emission source influencing atmospheric composition in the surrounding region. The flux tower (114.53° E, 30.65° N) was installed at the center of a vegetable cropland within the 7.3 km2 Beihu Farm, which is immediately adjacent to the WCIP. The nearest petrochemical emission source lies approximately 1.0 km north of the tower (Fig. S1 in the Supplement). The cropland was cultivated with Raphanus sativus L. var. longipinnatus (white radish), a typical cold-season vegetable in this region. The tower is situated on flat terrain with no obstructing buildings or trees within a 500 m radius of the tower, ensuring undisturbed airflow measurements.
Field sampling was performed from 29 October to 30 December 2025, with 11 valid sampling days in cloudy or sunny rain-free weather. Each sampling day included three 4 h sampling periods (morning: 08:00–12:00; afternoon: 12:30–16:30; early night: 17:00–21:00; all times are UTC+8). The sampling was conducted during the vegetative growth and harvest periods of R. sativus, and no fertilization activities were conducted throughout the sampling period. Flux footprints were calculated using the FFP online tool developed by (Kljun et al., 2015). Input wind and site information for the model included sampling time, measurement height, zero-plane displacement, wind speed, wind direction, Obukhov length, and friction velocity. The cumulative flux footprint over the entire sampling campaign is presented in Fig. S1.
One set of denuders and filter samples, plus field blanks, was collected per one sampling period. The annular denuders were freshly coated with a sorbent layer for inorganic acidic gases collection prior to sampling, in accordance with the U.S. EPA standard protocol (Fitz, 2002). The coating solution 1 % () sodium carbonate in water and 1 % () glycerol in a methanol-water mixture (1:1, ) was prepared fresh immediately before use. For coating, 10 mL of the solution was injected into the denuder, which was then sealed at both ends, inverted and rotated repeatedly to ensure uniform inner-wall coating, and purged with 99.999 % high-purity nitrogen until complete methanol and water evaporation. Theoretically, the sodium carbonate sorbent layer has an absorption capacity of 6 mg SO2, even assuming that only 10 % of the sodium carbonate solution was effectively coated onto the inner wall of the annular denuder. The total cumulative ambient air volume sampled by each denuder during a 4 h measurement was 0.6 m3, which would contain a maximum of only 5 µg SO2 based on the highest ambient SO2 concentration documented in local air monitoring records. Even when accounting for coexisting acidic gaseous species, the 0.6 m3 sampling volume is still well below the breakthrough volume of the denuder. Coated denuders were sealed with PTFE caps until use.
After each 4 h sampling run, annular denuders and filters were disassembled for subsequent offline chemical composition analysis. The inorganic salts formed by absorbed acidic gases in the denuder sorbent layer were eluted with 10 mL of 0.05 % (v/v) H2O2 aqueous solution, which oxidizes sulfite (SO, the product of SO2 absorption) to the more stable SO. Particulate-phase inorganic ions collected on the filters were ultrasonically extracted into 10 mL of ultrapure deionized water. Then, the inorganic ions were analyzed with ion chromatography (Dionex, ICS-1100, Thermo Scientific, Massachusetts, USA). Before running analysis, the system was calibrated using standard solutions. Inorganic ions in a sample solution were identified by comparing with the chromatographic peaks of the known standards and quantified using calibration curves after field blank substraction.
3.1 Uncertainties and detection limit of flux measurement
High-frequency flux losses may occur from two sources: (1) valve switching frequency below 10 Hz, and (2) laminar flow in the inlet tubing. These two effects combine to cause non-negligible mixing between consecutive air samples. However, the β coefficient was explicitly determined using temperature measurements from the sonic anemometer (No. 14 in Fig. 1), calculated as , whereTup and Tdown were derived from sonic temperatures sampled under the same switching frequency and 0.6σw dead-band conditions. This empirically derived β calibration approach provided a correction for high-frequency losses (Skov et al. 2006). The β coefficients for 33 4 h sampling periods fell within the typical range of 0.47 to 0.62. While a single β coefficient was used for each 4 h sampling period, β exhibited intra-period variability. We therefore calculated β at 30 min intervals, and used within each 4 h period as the relative uncertainty of the corresponding period-averaged β. The relative uncertainties of β for the 33 sampling periods ranged from 2.80 % to 26.14 % (Table S1).
The remaining source of uncertainty in REA flux measurements arises from the potential biases of the concentration difference of target species between updraft and downdraft samples (Cup−Cdown), the core term in Eq. (1). Concentrations are calculated as and , where M and V denote the collected analyte mass and the total air sample volume, respectively, for each reservoir. Next, we evaluated the uncertainties associated with M and V determination, from which the precisions and detection limits of flux measurement were derived for each species.
3.1.1 Uncertainty in air sample volume
The stability of the sampling flow rate is critical for accurate sampling control of the REA system. Rapid solenoid valve switching between updraft and downdraft sampling inevitably caused transient flow fluctuations. A buffer bottle (No. 14 in Fig. 1) was installed to mitigate such fluctuations, and a calibrated mass flow meter (MFM) was added temporarily for 6 replicate 60 min tests at the sampling inlet to measure actual flow rates through the denuders/filters. Flow rate fluctuations at switching frequencies of 10, 2, and 1 Hz were evaluated, showing that higher switching frequencies induced stronger transient flow disturbances, but all transient flow rate fluctuations recorded by the MFM were within ±3 % of the MFC reading (Fig. S2).
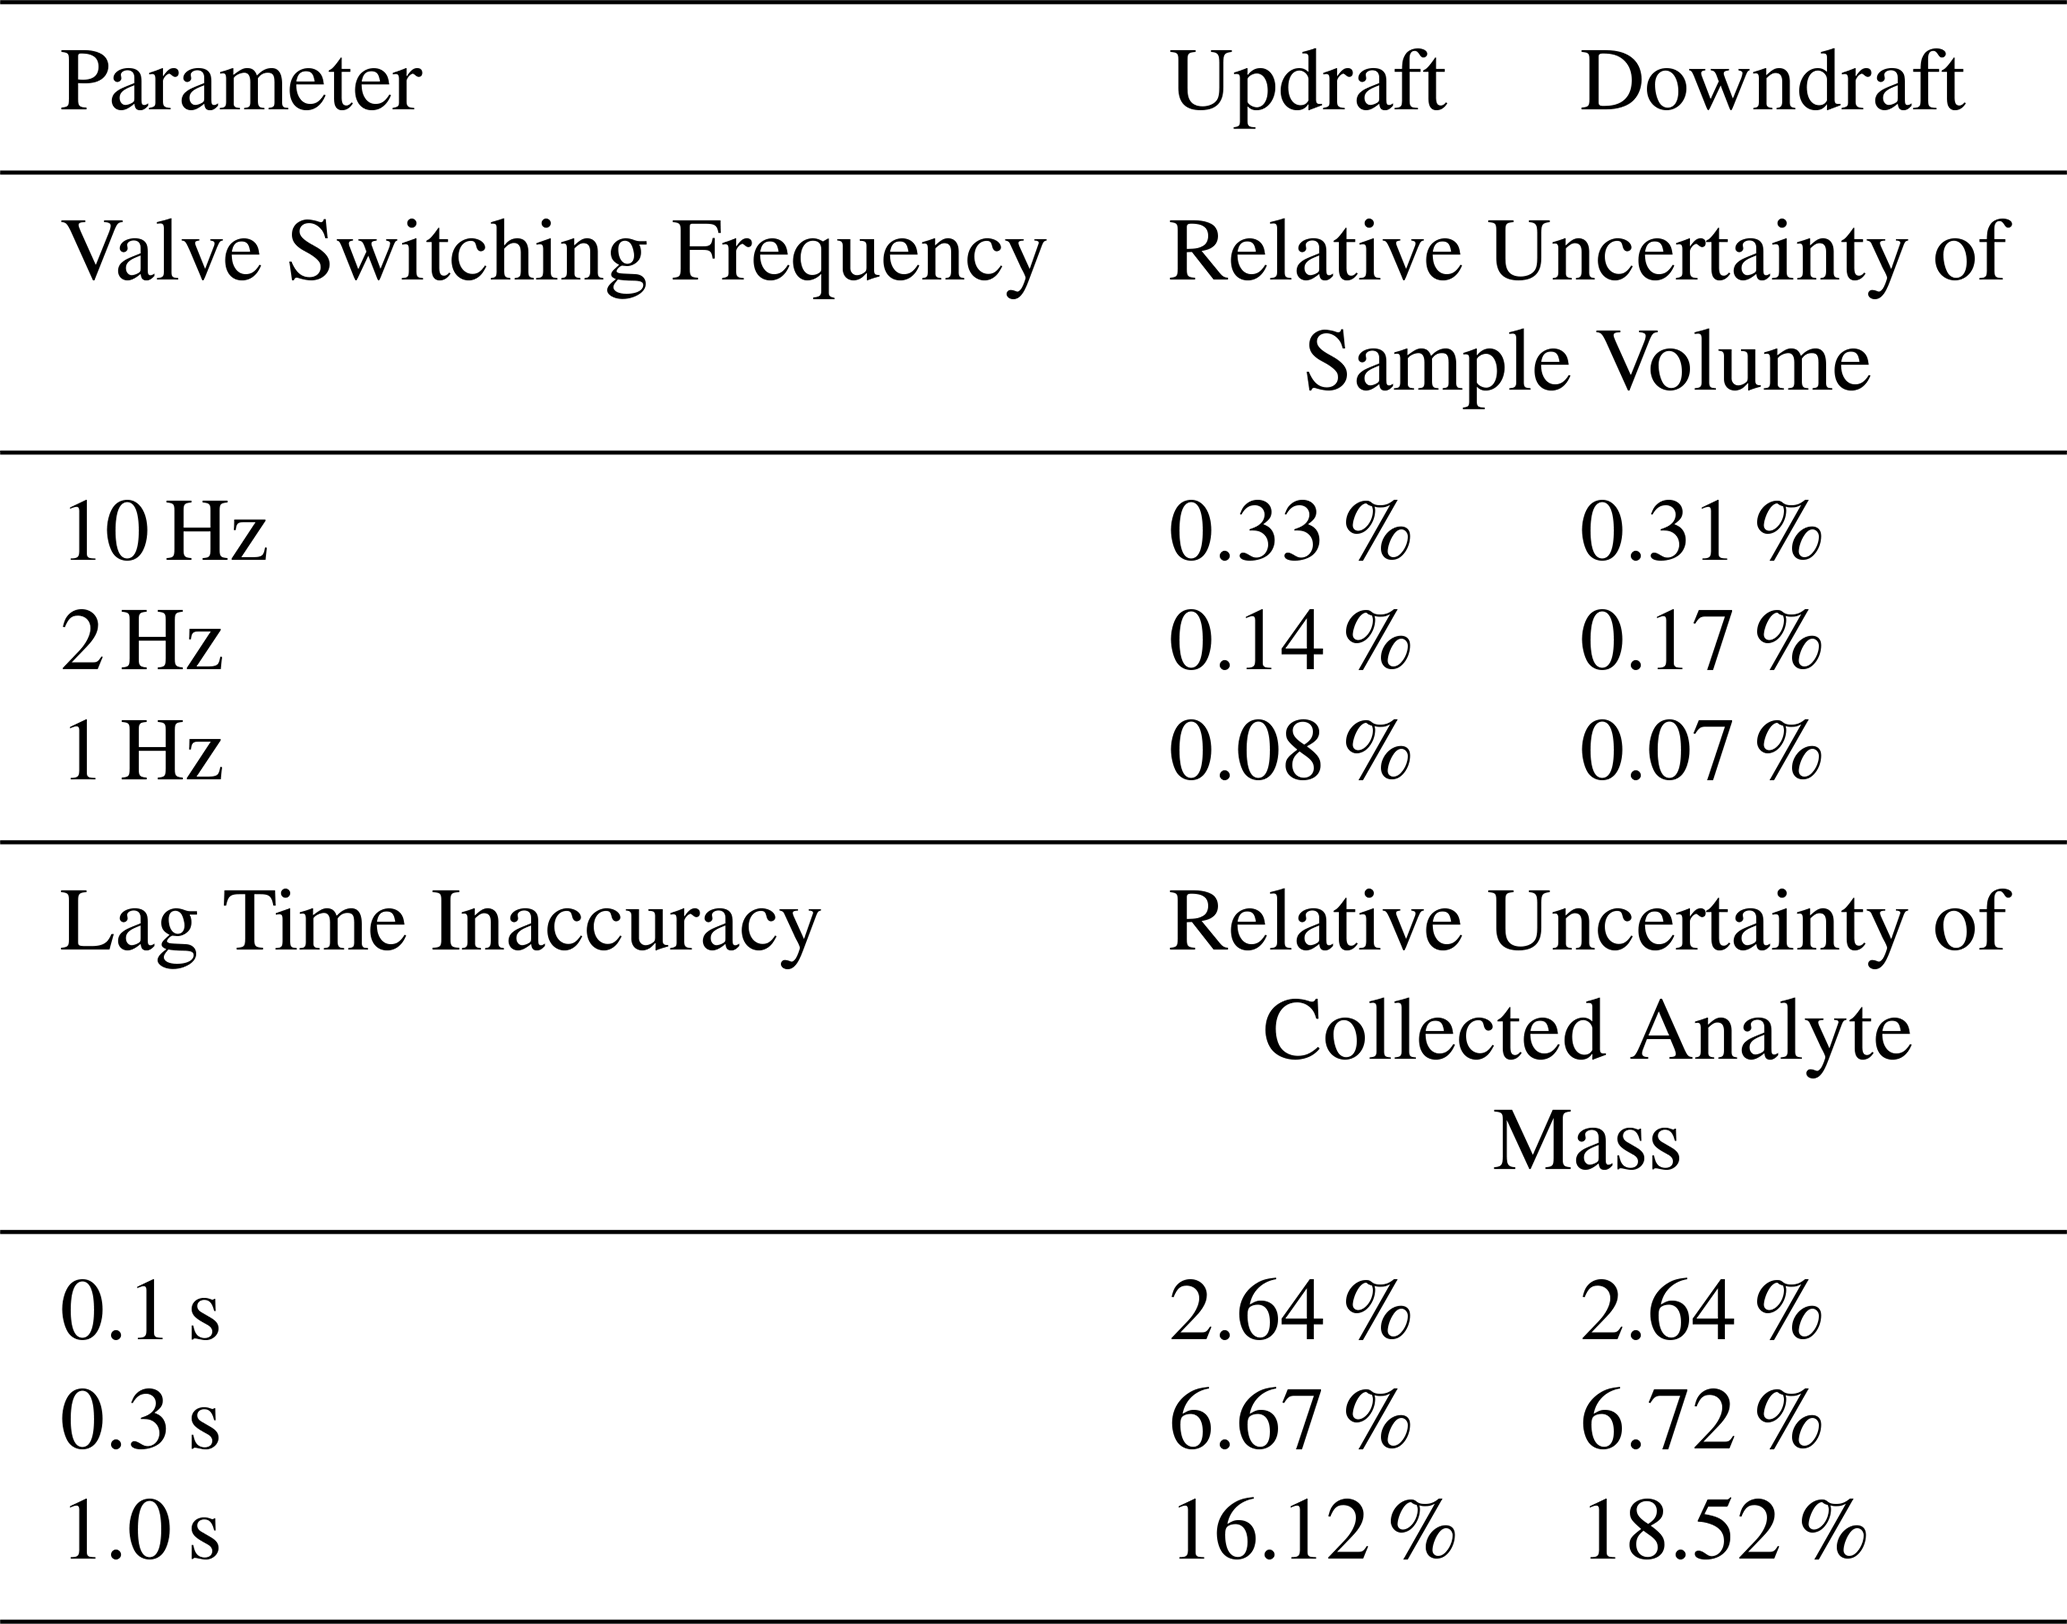
To quantify the overall error in MFC-derived sample volumes, we calculated the standard deviation (SD) of the relative deviation , where VMFC is the sample volume calculated from flow rate readings recorded by the on-board MFC, while VMFM is the actual sample volume calculated from actual flow rates recorded by the calibrated MFM. This metric corresponds to the relative uncertainty of the sample volume, accounting for both the precision of MFC readings and their accuracy relative to actual sample volume. Values were 0.32 % at 10 Hz, 0.16 % at 2 Hz, and 0.08 % at 1 Hz (Table 1), confirming that the buffer bottle effectively reduced the impact of flow fluctuations on sample volume accuracy. The 2 Hz switching frequency used in our field sampling yields a final sample volume relative uncertainty of 0.14 % (updraft) and 0.17 % (downdraft).
Table 1Relative uncertainty of air sample volume induced by valve switching flow fluctuations and relative uncertainty of collected analyte mass induced by lag time inaccuracy
3.1.2 Uncertainty in Collected Analyte Mass Induced by Lag Time Inaccuracy
The lag time, a key parameter for REA sampling, was pre-calculated prior to each sampling run at the onset of the sampling run. Flow rate variations during sampling (e.g., due to ambient temperature changes) induce a time offset Δt between the pre-set and actual lag time, which results in a mass mismatch ΔM of the target analyte between the updraft events and the updraft reservoir (or between the downdraft events and the downdraft reservoir). The relative deviation represents the random error in collected analyte mass induced by lag time inaccuracy, which propagates directly into final flux results. The magnitude of increases with larger updraft-downdraft concentration difference (Cup−Cdown), longer time offset Δt, and more valve switching cycles during sampling.
To quantify the relative deviation induced by lag time inaccuracy, a 4 h time series of HNO3 concentration and vertical wind was obtained from simultaneous measurements of an iodide-adduct chemical ionization mass spectrometer (I-CIMS) and the sonic anemometer at the site. The I-CIMS recorded HNO3 at 10 Hz resolution, while the anemometer was used to classify updraft/downdraft events at 10 Hz. We uniformly scaled updraft and downdraft HNO3 concentrations to match the average updraft-downdraft concentration differences observed in the 33 sampling runs in the campaign, generating 33 HNO3 concentration time series for the simulation. A time offset Δt was then introduced between reservoir sampling windows and actual vertical flow events (updraft or downdraft) to determine for each reservoir. Simulation results of at Δt= 0.1 , 0.3, and 1.0 s for the 33 runs are showed in Table S1. The SD of was calculated to quantify the relative uncertainty of collected analyte mass induced by lag time inaccuracy and presented in Table 2. The maximum ambient temperature variation recorded in a sample run was 8 °C, corresponding to a maximum Δt of 0.1 s; thus, the relative uncertainty at Δt=0.1 s (2.64 % for both updraft and downdraft) were adopted for the final flux uncertainty estimation. The above simulation was performed using HNO3 data only due to the lack of 10 Hz measurements for other species, and we assumed the lag time-induced relative deviations are identical for all target acidic species. This assumption is valid because all target species are sampled through identical tubing and valve systems, so their lag time errors are dominated by the same flow dynamics.
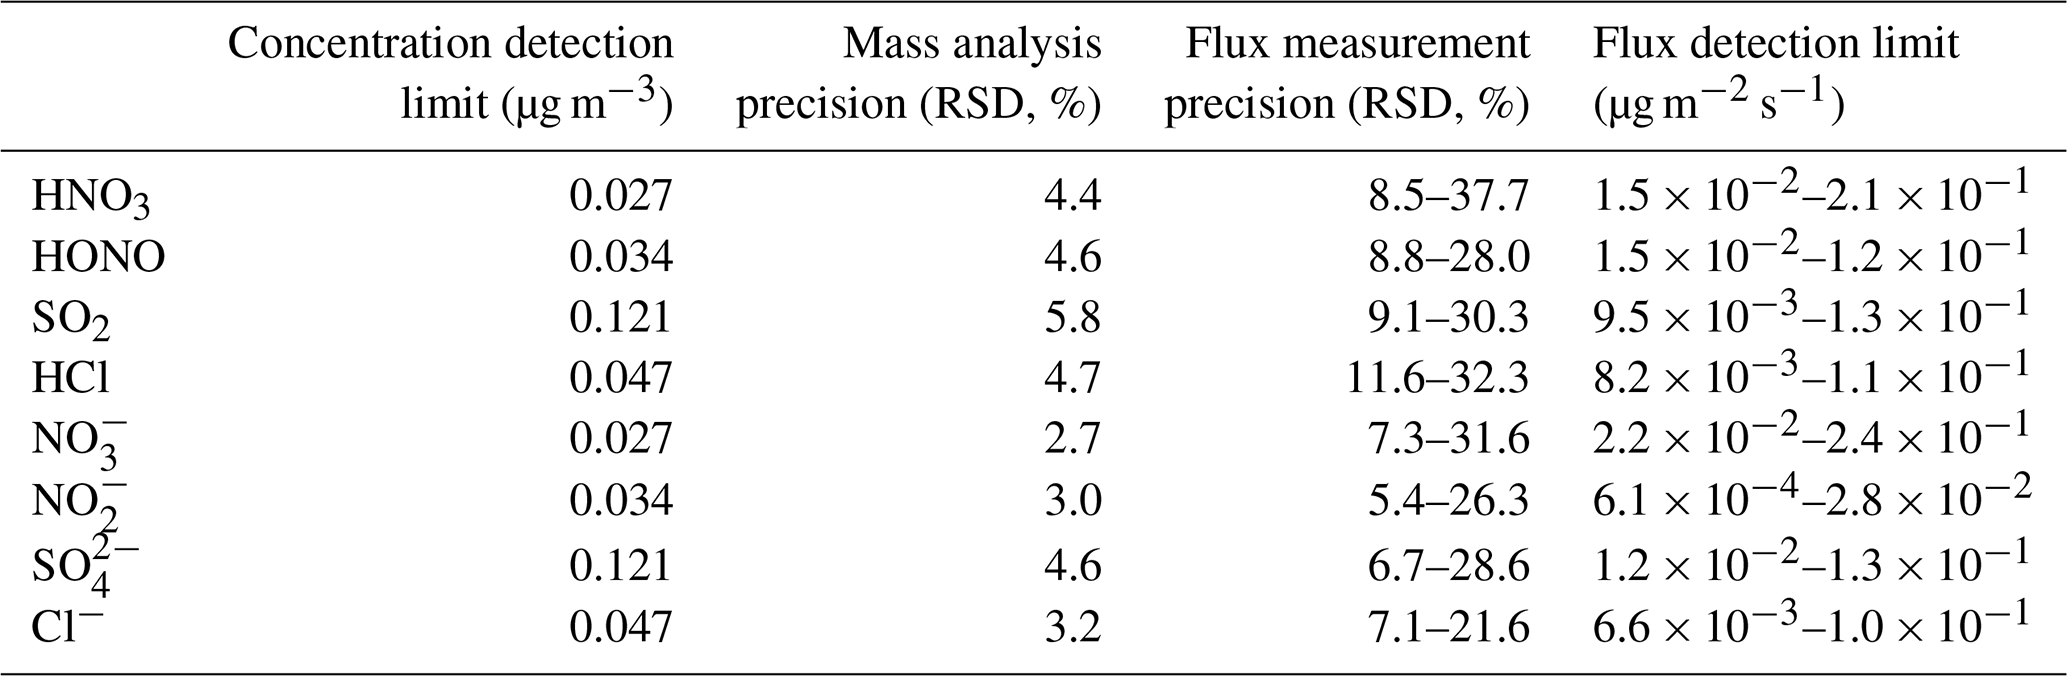
Table 2Concentration and flux detection limits, mass analysis precision and flux measurement precision of the acidic species.
3.1.3 Uncertainty in mass analysis
The overall uncertainty in mass analysis of gaseous target species (HNO3, HONO, SO2, HCl) consists of two components: the random error in ion chromatography (IC) analysis and the uncertainty associated with denuder collection efficiency.
For SO2, the uncertainty in mass analysis was determined from six replicate tests using a 2 ppbv SO2 calibration gas standard, under sampling conditions identical to those used for ambient sampling (e.g., sampling flow rate, sampling duration, and denuder coating). All replicate samples were pretreated and analyzed in a single IC batch, giving a mean recovery of 92 % and a relative standard deviation (RSD, ) of 5.8 %. The measured mass of SO2 collected by the denuder was corrected using the recovery. The IC analytical precision (denoted RSDIC) was determined to be 4.6 % from six replicate injections of a sulfate standard solution with a concentration matching that of typical ambient sample eluents. The RSDdenuder component arising from variability in denuder collection efficiency was then calculated to be 3.5 % via Gaussian error propagation RSD2= RSD RSD.
Certified standard gases for HNO3, HONO, and HCl were not readily available, so the SO2-derived mean recovery and RSDdenuder of 3.5 % were adopted to these species. The IC analytical precisions RSDIC for HNO3, HONO, and HCl were determined from six replicate injections of NO, NO, and Cl− standard solutions, yielding values of 2.7 %, 3.0 %, and 3.2 %, respectively. The overall mass analysis precisions (RSD) of HNO3, HONO, and HCl were calculated to be 4.4 %, 4.6 %, and 4.7 %, respectively, via Gaussian error propagation.
For the four particulate ionic species (NO, NO, SO, Cl−), the variability in filter collection efficiency was deemed sufficiently small to be negligible. Therefore, the IC analytical precision RSDIC was used to quantify the overall uncertainty of mass analysis. The final precisions (RSD) of mass analysis for all eight gaseous and particulate species are summarized in Table 2.
3.1.4 Flux measurement precision and detection limit
Uncertainties in the derived flux were quantified via the Gaussian error propagation. For both updraft and downdraft, the relative variance of concentration was calculated as:
where σM M is the total relative uncertainty of analyte mass measurements, incorporating contributions from lag time inaccuracy and mass analysis, and σV V is the relative uncertainty of air sample volume induced by transient flow fluctuations during valve switching. The variance of the updraft-downdraft concentration difference (ΔC) was then derived as for each measurement. The SD of flux was calculated for each measurement and presented as error bars of flux values in Fig. S3.
The Method Detection Limit (MDL) of single-measurement flux was calculated via t-test method. The total effective degree of freedom (dfeff) of the combined uncertainty was calculated using the Welch-Satterthwaite equation. Combined with the pre-set significance level of α= 0.05 (two-tailed test), the corresponding critical value was obtained from the t-distribution table. The minimum detectable concentration difference was calculated as , which was then substituted into Eq. (1) to obtain the single-measurement flux detection limit: . The flux measurement precision was therefore calculated only for those measurements with F > FLOD. The ranges of FLOD and precisions for the eight species are shown in Table 2. For a given analyte, FLOD and precision vary with atmospheric concentration and flux in the sampling periods.
3.2 Concentrations of acidic species during the campaign
The diurnal variations of inorganic acidic gases (HNO3, HONO, SO2, HCl) and particulate ions (NO, NO, SO, Cl−) in morning, afternoon and early night during the observation campaign are shown in Fig. 2 (top two rows). In this study, diurnal variation is defined as changes occurring during photochemically active daytime and fully dark early nighttime. At the sampling site, the mean concentration of total nitrogen-containing acidic species (gaseous + particulate) was 8.4 ± 8.0 µg m−3 (mean ± standard deviation; the same applies hereinafter). This value was higher than that of sulfur-containing (3.1 ± 1.5 µg m−3) and chlorine-containing acidic species (2.0 ± 0.8 µg m−3), indicating that atmospheric acidic species at the site were dominated by nitrogen species.
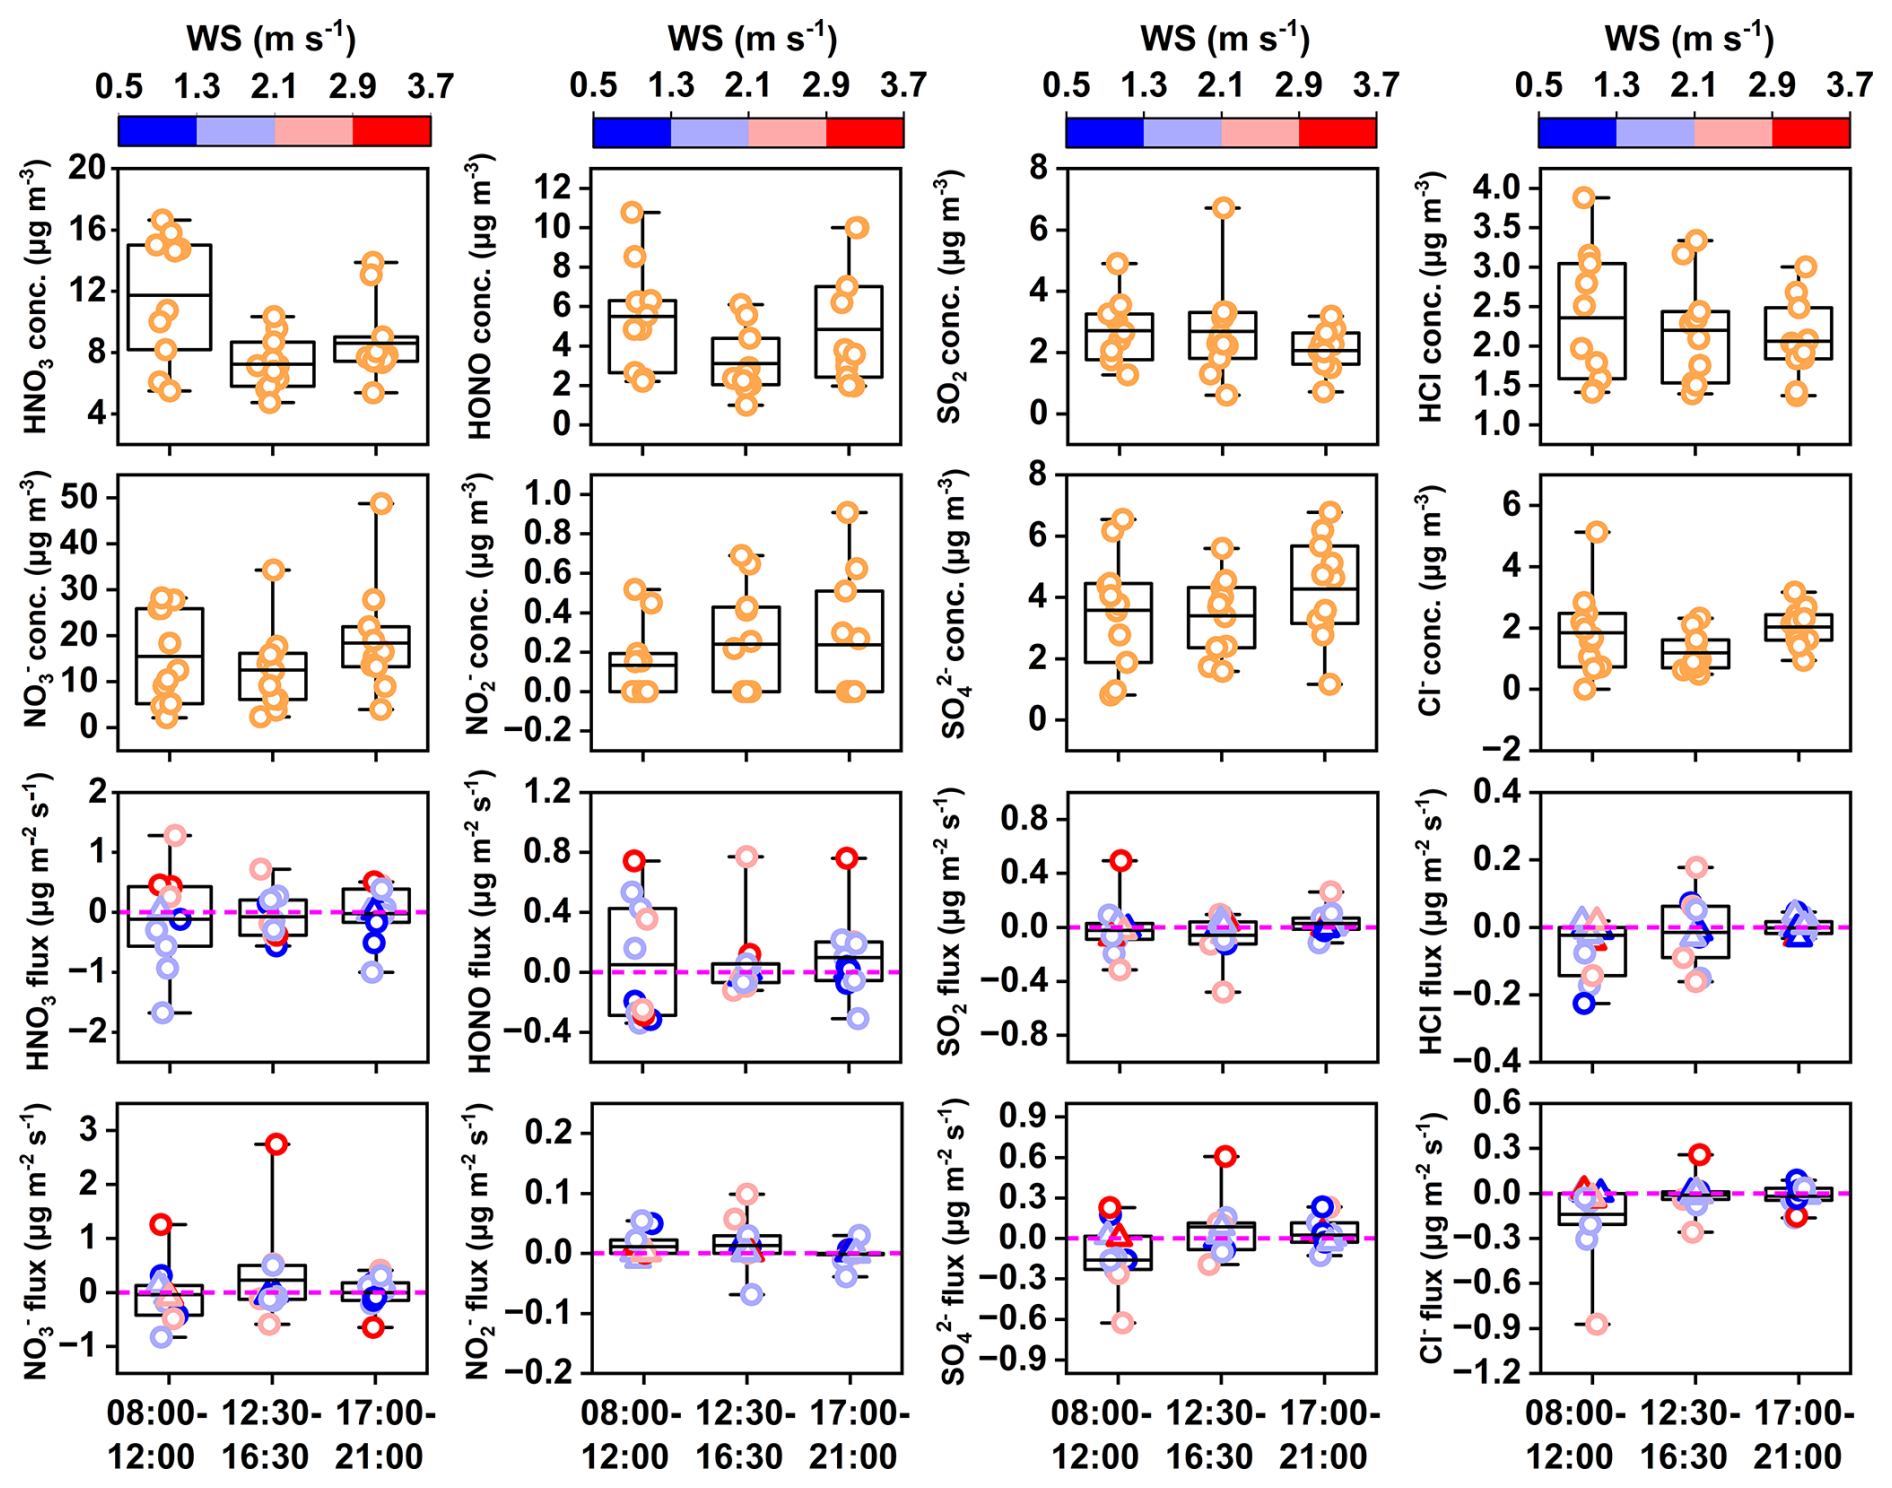
Figure 2Box-and-whisker plots with overlaid data points for eight inorganic species, grouped by diurnal time intervals. Top two rows: diurnal concentration variations of gaseous (HNO3, HONO, SO2, HCl) and particulate (NO, NO, SO, Cl−) species. Bottom two rows: REA-measured fluxes of the same species, with flux points color-coded by horizontal wind speed. Horizontal lines mark means, and boxes denote interquartile ranges.
Gaseous HNO3 and HONO showed similar diurnal patterns of higher concentrations in morning and nighttime than at noon. The diurnal pattern is mainly driven by the diurnal evolution of the atmospheric boundary layer (Finlayson-Pitts and Pitts, 1999; Lin et al., 2006). HONO has multiple sources including combustion (Nie et al., 2015) and soil emissions (Su et al., 2011), as well as secondary formation from gas-phase NO + OH reaction and heterogeneous NO2 reaction on moist surfaces (Villena et al., 2011; Wong et al., 2012; Liu et al., 2014; Baergen and Donaldson, 2016). Its low noontime levels are mainly due to rapid daytime photolytic loss. In contrast, SO2 and HCl showed slightly higher daytime mean concentrations (SO2: 2.7 ± 1.3 µg m−3; HCl: 2.3 ± 0.7 µg m−3) than nighttime (SO2: 2.1 ± 0.7 µg m−3; HCl: 2.0 ± 0.5 µg m−3), being likely related to daytime industrial emissions, as both species are mainly emitted from the combustion of sulfur- and chlorine-containing coal and wastes.
Particulate NO, SO and Cl− showed higher concentrations in the morning (15.5 ± 10.1, 3.6 ± 1.9, 1.8 ± 1.4 µg m−3) and nighttime (18.4 ± 11.9, 4.3 ± 1.7, 2.0 ± 0.6 µg m−3), and lower levels in afternoon (12.5 ± 8.9, 3.4 ± 1.2, 1.2 ± 0.6 µg m−3). This pattern is mainly controlled by their formation pathways and diurnal boundary layer variation, consistent with previous studies (Chang et al., 2011; Trebs et al., 2004; Young et al., 2022). Particulate NO had the lowest concentration (0.1–0.2 µg m−3) among the four ions, with lower concentrations in the morning (0.13 ± 0.19 µg m−3) than afternoon (0.24 ± 0.27 µg m−3) and nighttime (0.24 ± 0.32 µg m−3).
3.3 Observed flux of acidic species during the campaign
Bottom two rows of Fig. 2 shows the diurnal variations and horizontal wind speed (WS) dependence of REA-measured fluxes for the eight acidic inorganic species, grouped by three diurnal time intervals. Figure 3a summarizes the flux detection rate (the percentage of flux events above the detection limit relative to the total number of measurements) and the mean ± standard deviation (SD) of flux values above the detection limits for each target species. The flux detection rates of the acidic species, ranked from highest to lowest, were 88 % for HNO3 and HONO, 82 % for NO, 79 % for SO, 61 % for SO2 and Cl−, 48 % for HCl, and 36 % for NO. All investigated species showed bidirectional flux behavior, which were also observed in nearly all prior REA measurements from remote forest to urban grassland (Fig. 4). If this is not an intrinsic artifact of the REA method, this demonstrates that surfaces across all atmospheric environments and land types in these studies are capable of emitting these inorganic acidic species into the atmosphere, rather than only serving as a deposition sink. The observed apparent fluxes presented here are modulated by deposition, emission, and probably chemical production/loss and the storage change below the 4 m measurement height, therefore cannot be simply regarded as emission flux from the cropland or directly used to derive dry deposition velocity. HNO3 recorded the highest count of downward flux events (48 % of the measurements) and the largest downward flux values (−7.5 ± 6.7 nmol m−2 s−1, equivalent to −0.47 ± 0.42 µg m−2 s−1) across all species, whereas NO had the lowest count (9 %) and smallest values of downward flux (−0.87 ± 0.65 nmol m−2 s−1, equivalent to −0.040 ± 0.030 µg m−2 s−1). The downward fluxes of HONO (−0.19 ± 0.11 µg m−2 s−1) and NO (−0.29 ± 0.24 µg m−2 s−1) at our site were 1–2 orders of magnitude higher than all prior measurements at rural/remote forest or grassland sites, while the negative fluxes of HNO3, SO2, SO are comparable with prior reports (Fig. 4). This points to substantial nitrogen deposition (specifically, HONO and NO) at this site, driven by industrial emissions in the surrounding area.
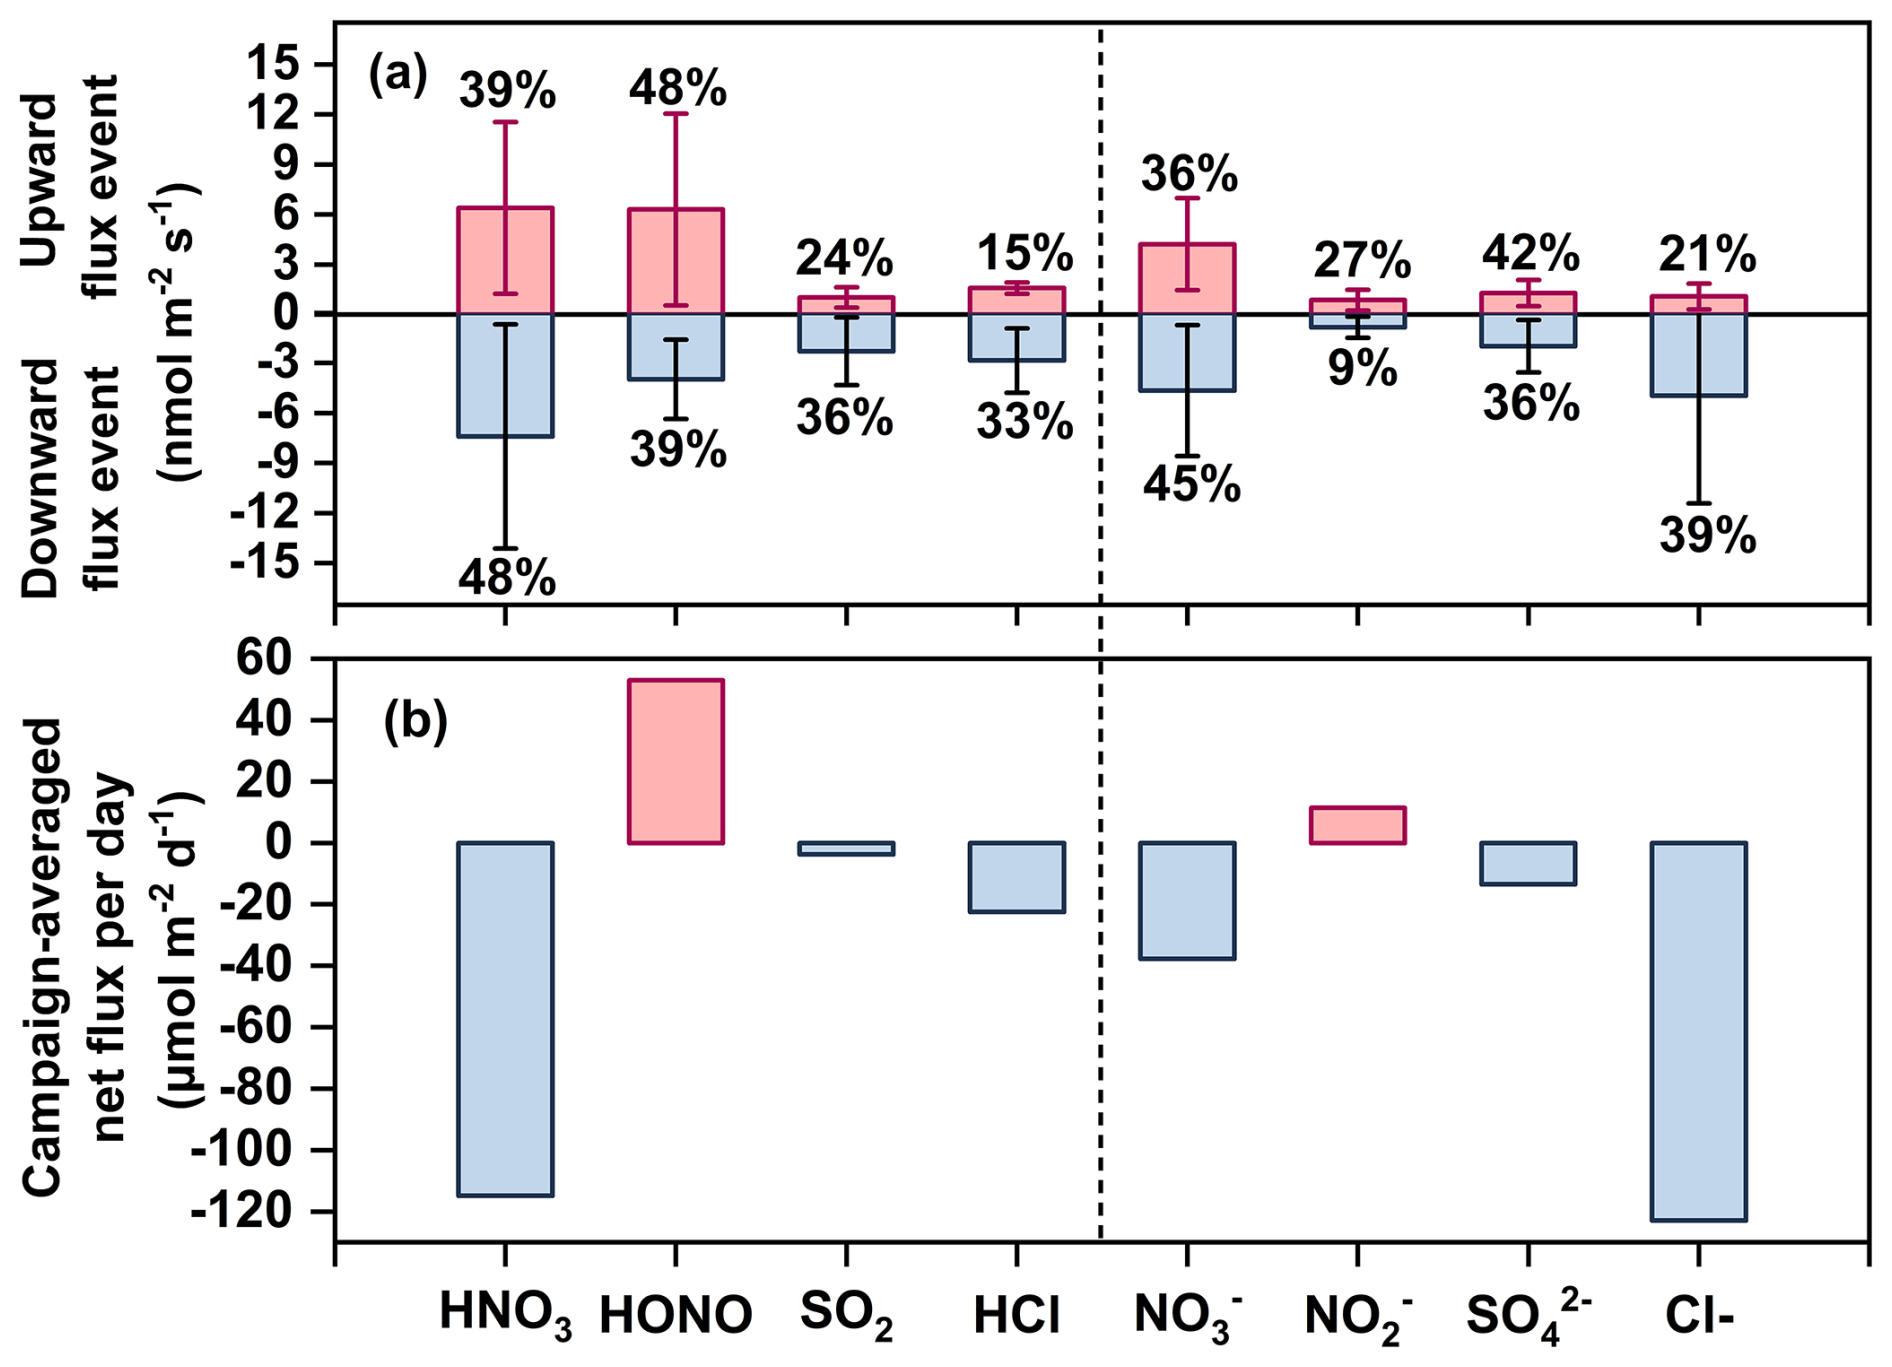
Figure 3(a) Flux detection rates (percentages of measurement above the detection limit) and mean ± standard deviation of flux values for the eight target species. (b) Campaign-averaged net flux per day for the eight target species. Fluxes are presented in molar units to facilitate direct cross-species comparisons.
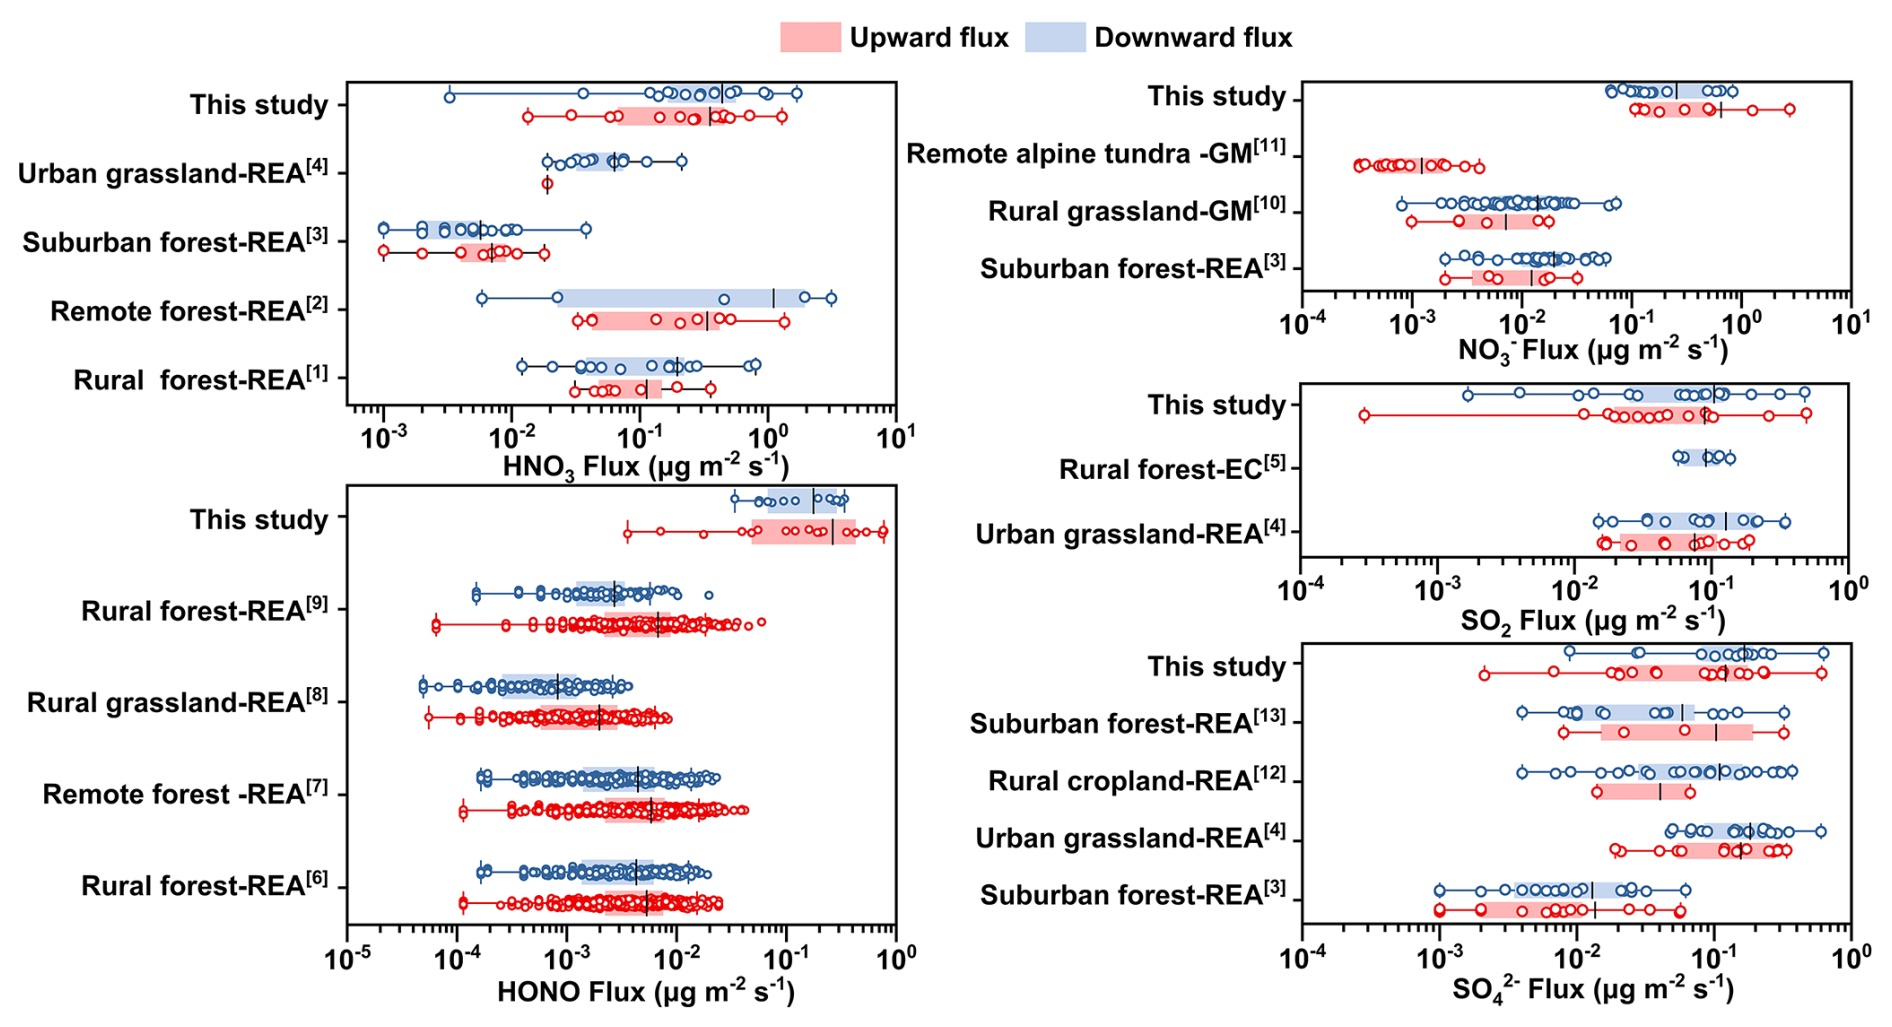
Figure 4The comparison of the fluxes observed in this study and those reported in the literature. We primarily compiled REA-measured fluxes from the literature, supplementing with EC and GM measurements due to the limited availability of REA flux data for NO and SO2. Downward fluxes are represented as positive values in blue to simplify plotting, while upward fluxes are shown in red. (1) Pryor et al. (2002), (2) Hansen et al. (2015), (3) Xu et al. (2021), (4) Myles et al. (2007), (5) Meyers et al. (1998), (6) Zhou et al. (2011), (7) Ren et al. (2011), (8) von der Heyden et al. (2022), (9) Zhang et al. (2012), (10) Huebert et al. (1988), (11) Rattray and Sievering (2001), (12) Meyers et al. (2006), (13) Matsuda et al. (2015).
We focus specifically on the upward fluxes showing emissions of atmospheric acidic species from this cropland under the long-term influence of chemical industrial emissions. Key findings are summarized below: (1) HNO3 and HONO recorded far more upward flux events (39 % and 48 %) and upward flux values (6.4 ± 5.2 and 6.3 ± 5.7 nmol m−2 s−1, equivalent to 0.40 ± 0.33 and 0.30 ± 0.27 µg m−2 s−1) than SO2 and HCl, indicating significant production of both species below the measurement height. Furthermore, their counts of upward flux events and flux values were higher in the morning than in the afternoon and night (Fig. 2). This pattern points to strong nocturnal production pathways for both species: HNO3 and HONO accumulate in the surface layer overnight under weak turbulent mixing, and result in pronounced upward fluxes in the next morning as turbulence intensifies. (2) In terms of particulate species, NO had more upward flux events (36 %) and higher upward flux values (4.2 ± 2.8 nmol m−2 s−1, equivalent to 0.26 ± 0.17 µg m−2 s−1) than other three species. The most likely NO sources are in-situ formation of ammonium nitrate near the surface layer from ammonia emitted by the cropland or wind-blown particles from agricultural soils. (3) Like downward flux, upward fluxes of HONO (0.30 ± 0.27 µg m−2 s−1) and NO (0.26 ± 0.17 µg m−2 s−1) are again one or two orders of magnitude higher at our site than all prior measurements, while those of HNO3, SO2, SO are comparable with prior reports (Fig. 4).
On the windy day of 24 December (highest mean horizontal wind speed 3.8 m s−1 in the campaign), exceptionally high upward fluxes of HNO3, HONO, NO, and SO were recorded, exceeding those from all other measurement days by one order of magnitude. After excluding this outlier, net fluxes over the entire observation period were upward for HONO and NO (mean daily 2.49 and 0.53 mg m−2 d−1, respectively), and negative for all other species: HNO3 (−7.24 mg m−2 d−1), Cl− (−4.36 mg m−2 d−1), NO (−2.34 mg m−2 d−1), SO (−1.29 mg m−2 d−1), SO2 (−0.24 mg m−2 d−1), and HCl (−0.817 mg m−2 d−1), which are shown in Fig. 3b as molar units to facilitate direct cross-species comparisons.
Analysis of wind speed (WS), ambient temperature (Ta), relative humidity (RH), and ultraviolet-A radiation (UV-A) meteorological parameters (Fig. S4) identified wind speed as a key regulator of flux magnitude. Under low wind speeds, all target species exhibited predominantly downward or weak upward fluxes (Fig. 2), while pronounced upward fluxes occurred almost exclusively at wind speeds > 2.1 m s−1. Notably, apparent deposition velocity () was correlated with friction velocity (u∗) for both upward and downward fluxes (Fig. 5), demonstrating that turbulence intensity directly drives flux magnitude.
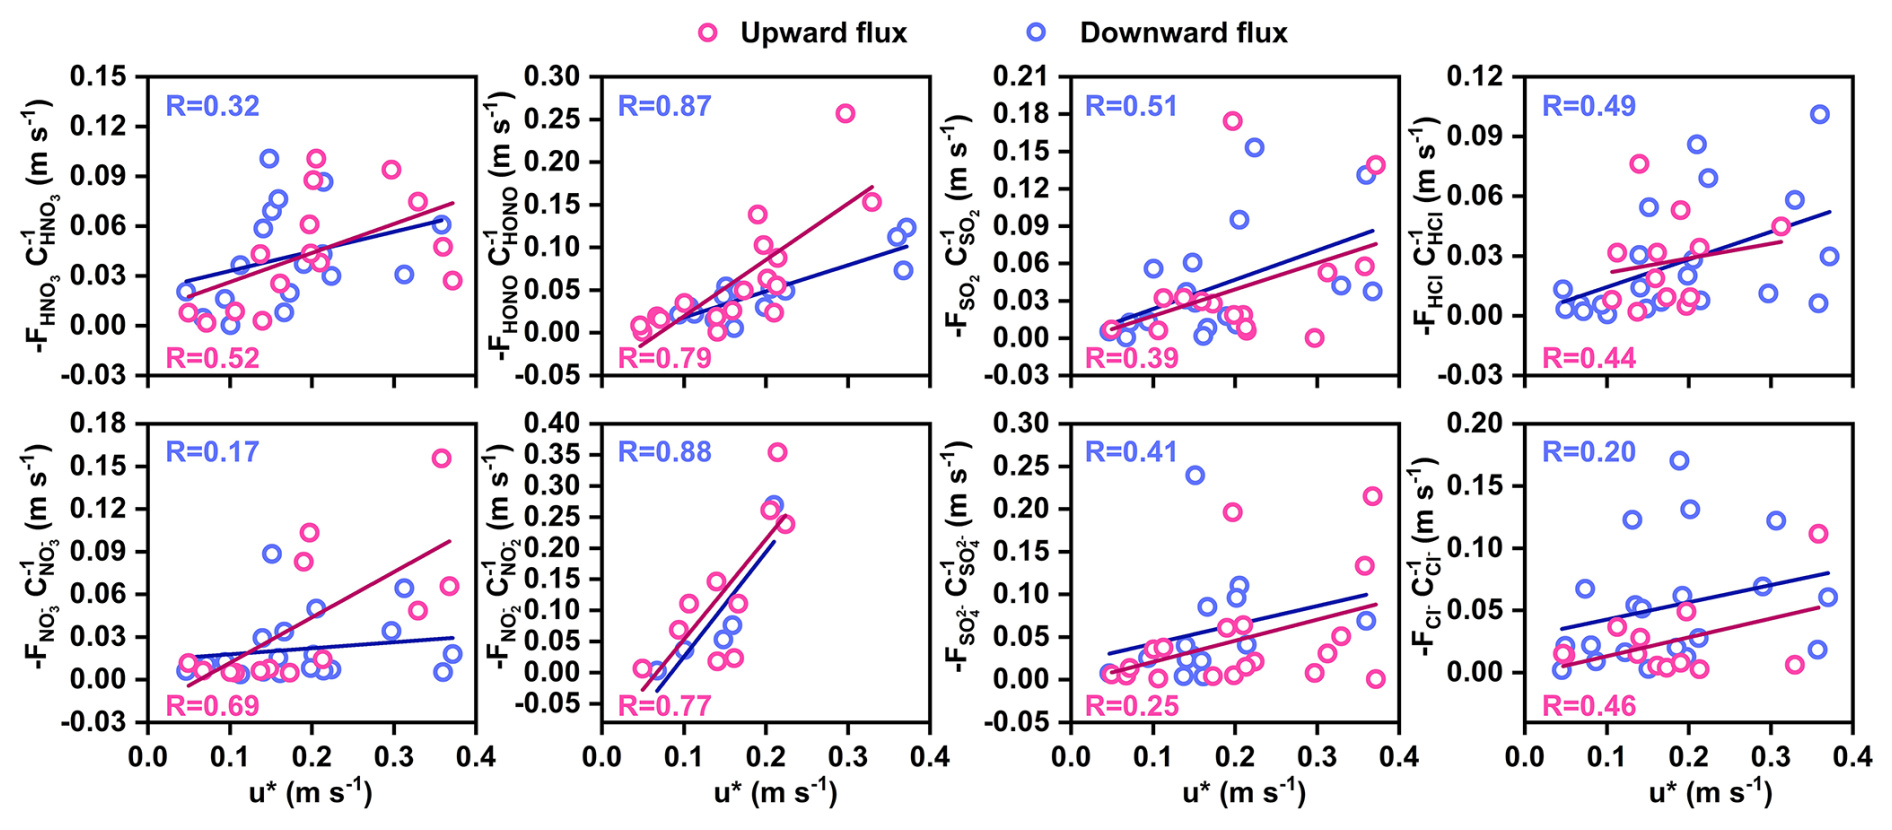
Figure 5Apparent deposition velocities (calculated as for downward fluxes and for upward fluxes) of inorganic acidic gases and particles versus friction velocity (u∗). Red and blue symbols denote upward and downward fluxes, respectively.
3.4 Gross upward fluxes of HNO3 and HONO
The land surface is a well-documented source of HONO, which could originate from direct soil emission, heterogeneous NO2 reactions on diverse wet surfaces (e.g., bare ground, building exteriors, urban grime, aerosol particles), and the photolysis of nitric acid/nitrate on leaf surfaces (Zhou et al., 2011). Upward HNO3 emissions have been widely observed over forests and grasslands (Hansen et al., 2015; Myles et al., 2007; Xu et al., 2021; Pryor et al., 2002; Nemitz et al., 2009). For example, Hansen et al. (2015) reported that about 70 % of the total samples showed HNO3 emission during late summer/autumn in a mixed deciduous forest site in the USA. Xu et al. (2021) showed about 30 % of the total samples showed apparent HNO3 emissions at a suburban forest site in Japan. HNO3 is thought to deposit with a zero resistance even over slightly wet surfaces, where it can also be formed via NO2+ H2O(surface) → HONO + HNO3 and N2O5+ H2O(surface) → 2HNO3. Potential upward HNO3 fluxes probably arise from decomposition of NH4NO3 aerosols near warm surfaces and deposited NH4NO3 on the ground or leaf surfaces as water layers evaporate.
The gross upward flux (Fgross) can be calculated from the apparent flux observed at the measurement height (F) and the surface deposition (D) via (Schobesberger et al., 2016). Unlike the apparent flux that is confounded by concurrent atmospheric deposition, Fgross reflects more accurately the actual emission from the near-surface layer to the atmosphere. In this study, we estimated Fgross for HNO3 and HONO, owing to not only the pronounced positive apparent fluxes of these two species (Fig. 3) but also the feasibility of approximating their dry deposition velocities given their relatively high water solubility.
According to Wesely (2007) resistance model, physical deposition velocity of a molecule from the atmosphere to the surface is calculated as , where Ra, Rb, and Rc are aerodynamic resistance, molecular diffusion resistance and surface resistance, respectively. For highly water-soluble HNO3, Rc is near zero; for water-soluble HONO, Rc over slight wet surfaces (like vegetable surface in the cropland) is also far smaller than Ra (Harrison et al., 1996). Thus, Vd for both species can be simplified to . Substituting the standard formulations and into the simplified Vd equation yields
where k is the von Karman constant, u∗ is friction velocity, z is measurement height, z0 is roughness length, which is constant at a winter underlying surface, ψm is the Businger dimensionless momentum stability function, and Sc is the Schmidt number. Our sampling conditions (4 m measurement height, cloudy winter days, 5–20 °C temperature range) resulted in only 3 %–4 % diurnal variation in Sc and ∼ 1.0–1.1 variation in ψm. The corresponding 10 %–14 % relative variation in the denominator of Eq. (3) justifies a linear approximation , where a is an empirical constant. Substituting surface deposition into the Fgross definition gives
From Eq. (4), is equal to , which is the slopes of the data points in Fig. 5. We calculated the empirical constant a, for HNO3 and HONO separately, from the maximum slope of the downward-flux data points in Fig. 5, when Fgross= 0 (that is, no upward emission and apparent flux equals deposition). a was then substituted into Eq. (4) to calculate Fgross for all the sampling periods. Please note that according to the mass balance equation (), Fgross includes joint contributions from surface emission (E), net chemical production below the measurement height (P−L) and the storage change flux below the measurement height (S, ), which are not distinguishable in our estimation of Fgross
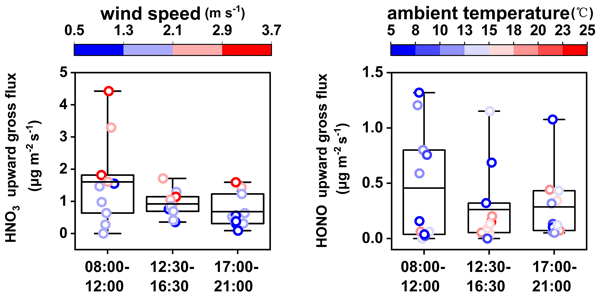
Based on the calculation from Eq. (4), the diurnal variations in upward gross fluxes of HNO3 and HONO, along with their dependence on horizontal wind speed or ambient temperature, are presented in Fig. 6. Overall, HNO3 gross fluxes (1.1 ± 0.9 µg m−2 s−1) were higher than those of HONO (0.4 ± 0.4 µg m−2 s−1). HNO3 gross fluxes were higher in the morning (1.6 ± 1.4 µg m−2 s−1) than in the afternoon (0.9 ± 0.4 µg m−2 s−1) and nighttime (0.7 ± 0.5 µg m−2 s−1). Fluxes under high wind speeds (WS > 2.1 m s−1, 1.8 ± 1.1 µg m−2 s−1) were significantly greater than those under low wind speeds (0.6 ± 0.4 µg m−2 s−1), indicating that upward gross fluxes of HNO3 below the measurement height were accelerated under elevated wind speed.
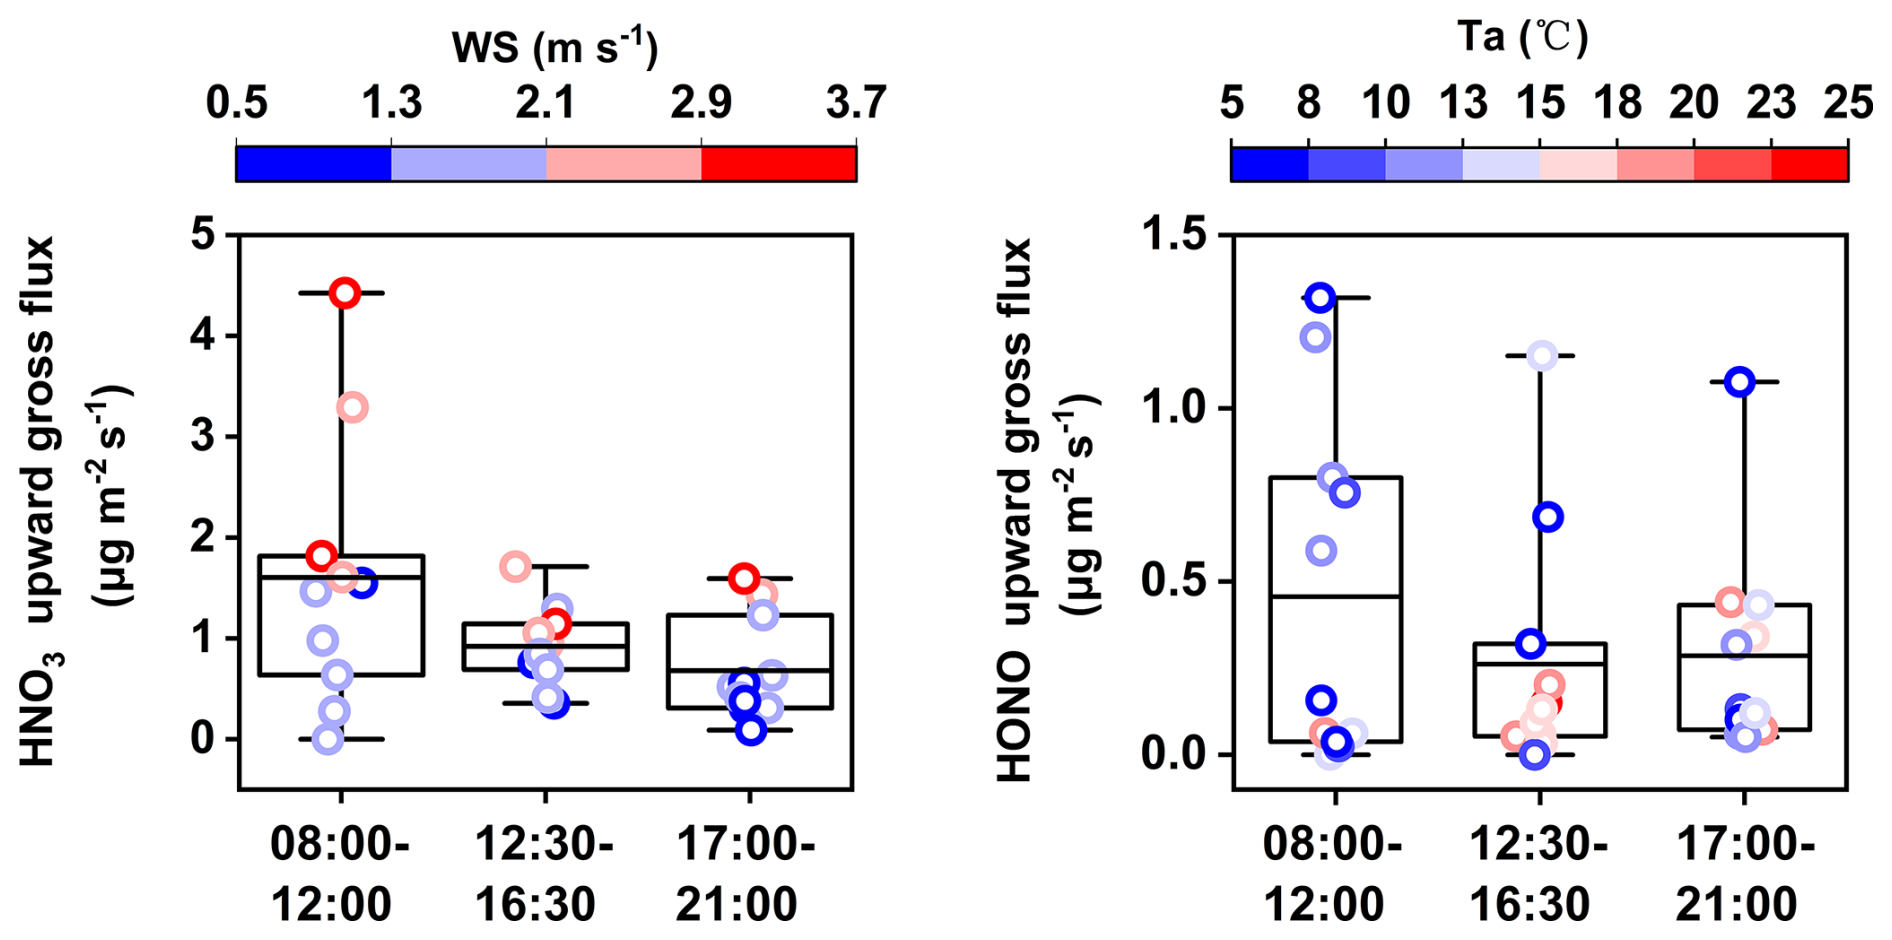
Figure 6Box-and-whisker plots overlaid with individual data points (coded by horizontal wind speed and ambient temperature) showing upward gross fluxes of HNO3 and HONO, grouped by diurnal time intervals. Horizontal lines mark medians, and boxes denote interquartile ranges.
Similar to HNO3, HONO gross fluxes were higher in the morning (0.5 ± 0.5 µg m−2 s−1) than in the afternoon (0.3 ± 0.3 µg m−2 s−1) and nighttime (0.3 ± 0.3 µg m−2 s−1). In contrast to HNO3, HONO emission fluxes showed no significant correlation with wind speed, solar radiation, or relative humidity (Fig. S5); instead, the fluxes were significantly higher under low temperatures (Ta < 15 °C, 0.4 ± 0.5 µg m−2 s−1) than under high temperatures (0.1 ± 0.1 µg m−2 s−1), as further illustrated by the scatter plots of temperature dependence for both HONO and HNO3 fluxes (Fig. S6). This behavior is likely attributed to the dependence of HONO surface production from aqueous-phase reactions in soil pore water or surface water films (Wu et al., 2019; Ren et al., 2020). High temperatures reduce soil and surface moisture, thereby suppressing HONO production.
In this study, we developed a Relaxed Eddy Accumulation system capable of simultaneous flux measurement of eight gaseous and particulate inorganic acidic species, targeting urban cropland under long-term exposure to chemical industry emissions. The system achieved a relative uncertainty of air sample volume < 0.2 %, a lag time-induced analyte mass uncertainty of 2.64 %, and a relative uncertainty of mass analysis ranging from 2.7 % to 5.8 %. Using Gaussian error propagation and the t-test method, we determined that the flux measurement precision of the system ranges from 5.4 % to 32.3 %, and the flux detection limits span from 6.1 × 10⁻⁴ to 2.4 × 10⁻¹ µg m−2 s−1, depending on the chemical species, ambient atmospheric concentrations and flux magnitudes during the sampling periods.
Our results provide critical observational data and mechanistic insights into acidic species exchange over cropland under the long-term influence of chemical industrial emissions in an urban environment. All inorganic acidic species exhibited bidirectional fluxes, demonstrating that cropland can act as a source of atmospheric inorganic acidic species rather than solely a deposition sink. Such bidirectional fluxes are not unique to this industrial-zone cropland, as they have been documented in nearly all prior REA measurements across sites from remote forests to urban grasslands. However, the notable difference is that the fluxes of HONO and NO at our site, both upward and downward, were 1–2 orders of magnitude higher than those values reported in the literature, while the fluxes of HNO3, SO2, SO are comparable with prior reports. This magnitude difference reveals a previously underquantified HONO and nitrate flux hotspot in peri-industrial regions, which has been missing in regional flux inventories.
The discrepancy with prior field observations is largely attributable to the long-term cumulative effect of adjacent industrial NOX emissions that elevate surface nitrogen loading and alter surface exchange properties. Under high NOX conditions, upward HNO3 fluxes may arise from heterogeneous surface reactions of NO2, decomposition of NH4NO3 aerosols near warm surfaces or deposited NH4NO3 on the ground or leaf surfaces as water layers evaporate. These processes render cropland an HNO3 emission source that contributes to atmospheric nitrate aerosol formation. HONO emissions from cropland stem from direct soil release, heterogeneous NO2 reactions on wet surfaces, and nitric acid/nitrate photolysis on leaf surfaces, thus enhancing atmospheric oxidative capacity.
The diurnal pattern points to strong nocturnal production in the surface layer overnight under weak turbulent mixing, and pronounced upward fluxes in the next morning as turbulence intensifies. The apparent deposition velocities of all species were positively correlated with friction velocity for both upward and downward fluxes, highlighting the key regulatory role of turbulent mixing in acidic species exchange. Based on the mass balance equation and resistance in-series model, we estimated the gross upward fluxes of water-soluble HNO3 and HONO. The gross flux of HNO3 was accelerated under elevated turbulence, while HONO gross flux was enhanced at lower ambient temperatures, likely due to elevated soil and surface moisture. The quantified fluxes offer empirical constraints for improving deposition and emission parameterizations in chemical transport models, a scientific basis for formulating targeted industrial emission control and farmland ecological protection policies in densely populated industrial megacities.
Some limitations should be noted. First, measurements were conducted only in winter. Seasonal variations in flux magnitudes and driving mechanisms will be characterized in our future measurement. Second, the gross flux estimation cannot distinguish between direct surface emissions, near-surface chemical production, and storage changes, requiring further fine-scale vertical profiling to partition these contributions. Third, the results are based on a single vegetable cropland site, and generalizability to other crop types and industrial contexts requires additional multi-site observations.
The data used in this article are available from the corresponding author Huan Yu (yuhuan@cug.edu.cn) on request.
The supplement related to this article is available online at https://doi.org/10.5194/acp-26-9779-2026-supplement.
HY designed the study. HY, XW, and JS built the REA system. JH, XW, and HY characterized the system. JH, XW, YW, ZL, ZH, and QW contributed to field measurement. JH and HY analyzed the data and wrote the manuscript.
The contact author has declared that none of the authors has any competing interests.
Publisher's note: Copernicus Publications remains neutral with regard to jurisdictional claims made in the text, published maps, institutional affiliations, or any other geographical representation in this paper. The authors bear the ultimate responsibility for providing appropriate place names. Views expressed in the text are those of the authors and do not necessarily reflect the views of the publisher.
This research was supported by the National Key Research and Development Program of China (grant no. 2023YFC3709801), the National Natural Science Foundation of China (grant no. 42175131), and the Fundamental Research Funds for the Central Universities, China University of Geosciences (Wuhan) (grant no. G1323523063).
This paper was edited by Chiara Giorio and reviewed by two anonymous referees.
Aber, J., McDowell, W., Nadelhoffer, K., Magill, A., Berntson, G., Kamakea, M., McNulty, S., Currie, W., Rustad, L., and Fernandez, I.: Nitrogen Saturation in Temperate Forest Ecosystems, Bioscience, 48, 921–934, https://doi.org/10.2307/1313296, 1998.
Baergen, A. M. and Donaldson, D. J.: Formation of reactive nitrogen oxides from urban grime photochemistry, Atmos. Chem. Phys., 16, 6355–6363, https://doi.org/10.5194/acp-16-6355-2016, 2016.
Bowling, D. R., Turnipseed, A. A., Delany, A. C., Baldocchi, D. D., Greenberg, J. P., and Monson, R. K.: The use of relaxed eddy accumulation to measure biosphere-atmosphere exchange of isoprene and other biological trace gases, Oecologia, 116, 306–315, https://doi.org/10.1007/s004420050592, 1998.
Businger, J. A. and Oncley, S. P.: Flux Measurement with Conditional Sampling, J. Atmos. Ocean. Technol., 7, 349–352, https://doi.org/10.1175/1520-0426(1990)007<0349:FMWCS>2.0.CO;2, 1990.
Chang, L. T.-C., Tsai, J.-H., Lin, J.-M., Huang, Y.-S., and Chiang, H.-L.: Particulate matter and gaseous pollutants during a tropical storm and air pollution episode in Southern Taiwan, Atmos. Res., 99, 67–79, https://doi.org/10.1016/j.atmosres.2010.09.002, 2011.
Desjardins, R. L.: Description and evaluation of a sensible heat flux detector, Bound.-Layer Meteor., 11, 147–154, https://doi.org/10.1007/BF02166801, 1977.
Farmer, D. K., Kimmel, J. R., Phillips, G., Docherty, K. S., Worsnop, D. R., Sueper, D., Nemitz, E., and Jimenez, J. L.: Eddy covariance measurements with high-resolution time-of-flight aerosol mass spectrometry: a new approach to chemically resolved aerosol fluxes, Atmos. Meas. Tech., 4, 1275–1289, https://doi.org/10.5194/amt-4-1275-2011, 2011.
Farmer, D. K., Chen, Q., Kimmel, J. R., Docherty, K. S., Nemitz, E., Artaxo, P. A., Cappa, C. D., Martin, S. T., and Jimenez, J. L.: Chemically Resolved Particle Fluxes Over Tropical and Temperate Forests, Aerosol Sci. Technol., 47, 818–830, https://doi.org/10.1080/02786826.2013.791022, 2013.
Finlayson-Pitts, B. J. and Pitts, J. J. N.: Chemistry of the Upper and Lower Atmosphere: Theory, Experiments and Applications, Elsevier, https://doi.org/10.1016/b978-0-12-257060-5.x5000-x, 1999.
Fitz, D. R.: Evaluation of diffusion denuder coatings for removing acid gases from ambient air, US Environmental Protection Agency, Office of Air Quality Planning and Standards, Emissions, Monitoring, and Analysis Division, 2002.
Galloway, J. N.: Acid deposition: Perspectives in time and space, Water, Air, Soil Pollut., 85, 15-24, https://doi.org/10.1007/BF00483685, 1995.
Gaman, A., Rannik, Ü., Aalto, P., Pohja, T., Siivola, E., Kulmala, M., and Vesala, T.: Relaxed Eddy Accumulation System for Size-Resolved Aerosol Particle Flux Measurements, J. Atmos. Ocean. Technol., 21, 933–943, https://doi.org/10.1175/1520-0426(2004)021<0933:REASFS>2.0.CO;2, 2004.
Gordon, M., Staebler, R. M., Liggio, J., Vlasenko, A., Li, S.-M., and Hayden, K.: Aerosol flux measurements above a mixed forest at Borden, Ontario, Atmos. Chem. Phys., 11, 6773–6786, https://doi.org/10.5194/acp-11-6773-2011, 2011.
Hansen, K., Pryor, S. C., Boegh, E., Hornsby, K. E., Jensen, B., and Sørensen, L. L.: Background concentrations and fluxes of atmospheric ammonia over a deciduous forest, Agric. For. Meteorol., 214–215, 380–392, https://doi.org/10.1016/j.agrformet.2015.09.004, 2015.
Harrison, R. M., Peak, J. D., and Collins, G. M.: Tropospheric cycle of nitrous acid, J. Geophys. Res., 101, 14429–14439, https://doi.org/10.1029/96JD00341, 1996.
Huebert, B. J. and Robert, C. H.: The dry deposition of nitric acid to grass, J. Geophys. Res.: Atmos., 90, 2085–2090, https://doi.org/10.1029/JD090iD01p02085, 1985.
Huebert, B. J., Luke, W. T., Delany, A. C., and Brost, R. A.: Measurements of concentrations and dry surface fluxes of atmospheric nitrates in the presence of ammonia, J. Geophys. Res., 93, https://doi.org/10.1029/JD093iD06p07127, 1988.
Karl, T., Harley, P., Guenther, A., Rasmussen, R., Baker, B., Jardine, K., and Nemitz, E.: The bi-directional exchange of oxygenated VOCs between a loblolly pine (Pinus taeda) plantation and the atmosphere, Atmos. Chem. Phys., 5, 3015–3031, https://doi.org/10.5194/acp-5-3015-2005, 2005.
Kljun, N., Calanca, P., Rotach, M. W., and Schmid, H. P.: A simple two-dimensional parameterisation for Flux Footprint Prediction (FFP), Geosci. Model Dev., 8, 3695–3713, https://doi.org/10.5194/gmd-8-3695-2015, 2015.
Laufs, S., Cazaunau, M., Stella, P., Kurtenbach, R., Cellier, P., Mellouki, A., Loubet, B., and Kleffmann, J.: Diurnal fluxes of HONO above a crop rotation, Atmos. Chem. Phys., 17, 6907–6923, https://doi.org/10.5194/acp-17-6907-2017, 2017.
Lee, A., Schade, G. W., Holzinger, R., and Goldstein, A. H.: A comparison of new measurements of total monoterpene flux with improved measurements of speciated monoterpene flux, Atmos. Chem. Phys., 5, 505–513, https://doi.org/10.5194/acp-5-505-2005, 2005.
Lin, Y.-C., Cheng, M.-T., Ting, W.-Y., and Yeh, C.-R.: Characteristics of gaseous HNO2, HNO3, NH3 and particulate ammonium nitrate in an urban city of Central Taiwan, Atmos. Environ., 40, 4725–4733, https://doi.org/10.1016/j.atmosenv.2006.04.037, 2006.
Liu, Z., Wang, Y., Costabile, F., Amoroso, A., Zhao, C., Huey, L. G., Stickel, R., Liao, J., and Zhu, T.: Evidence of Aerosols as a Media for Rapid Daytime HONO Production over China, Environ. Sci. Technol., 48, 14386–14391, https://doi.org/10.1021/es504163z, 2014.
Matsuda, K., Watanabe, I., Mizukami, K., Ban, S., and Takahashi, A.: Dry deposition of PM2.5 sulfate above a hilly forest using relaxed eddy accumulation, Atmos. Environ., 107, 255–261, https://doi.org/10.1016/j.atmosenv.2015.02.050, 2015.
Meng, F., Qin, M., Fang, W., Duan, J., Tang, K., Zhang, H., Shao, D., Liao, Z., Feng, Y., Huang, Y., Ni, T., Xie, P., Liu, J., and Liu, W.: Measurement of HONO flux using the aerodynamic gradient method over an agricultural field in the Huaihe River Basin, China, J. Environ. Sci., 114, 297–307, https://doi.org/10.1016/j.jes.2021.09.005, 2022.
Meyers, T. P., Huebert, B. J., and Hicks, B. B.: HNO3 deposition to a deciduous forest, Bound.-Layer Meteor., 49, 395–410, https://doi.org/10.1007/BF00123651, 1989.
Meyers, T. P., Finkelstein, P., Clarke, J., Ellestad, T. G., and Sims, P. F.: A multilayer model for inferring dry deposition using standard meteorological measurements, J. Geophys. Res., 103, 22645–22661, https://doi.org/10.1029/98JD01564, 1998.
Meyers, T. P., Luke, W. T., and Meisinger, J. J.: Fluxes of ammonia and sulfate over maize using relaxed eddy accumulation, Agric. For. Meteorol., 136, 203–213, https://doi.org/10.1016/j.agrformet.2004.10.005, 2006.
Myles, L., Meyers, T. P., and Robinson, L.: Relaxed eddy accumulation measurements of ammonia, nitric acid, sulfur dioxide and particulate sulfate dry deposition near Tampa, FL, USA, Environ. Res. Lett., 2, 034004, https://doi.org/10.1088/1748-9326/2/3/034004, 2007.
Nemitz, E., Sutton, M. A., Wyers, G. P., Otjes, R. P., Mennen, M. G., van Putten, E. M., and Gallagher, M. W.: Gas-particle interactions above a Dutch heathland: II. Concentrations and surface exchange fluxes of atmospheric particles, Atmos. Chem. Phys., 4, 1007–1024, https://doi.org/10.5194/acp-4-1007-2004, 2004.
Nemitz, E., Dorsey, J. R., Flynn, M. J., Gallagher, M. W., Hensen, A., Erisman, J. W., Owen, S. M., Dämmgen, U., and Sutton, M. A.: Aerosol fluxes and particle growth above managed grassland, Biogeosciences, 6, 1627–1645, https://doi.org/10.5194/bg-6-1627-2009, 2009.
Nguyen, T. B., Crounse, J. D., Teng, A. P., St Clair, J. M., Paulot, F., Wolfe, G. M., and Wennberg, P. O.: Rapid deposition of oxidized biogenic compounds to a temperate forest, Proc. Natl. Acad. Sci. USA., 112, E392–E401, https://doi.org/10.1073/pnas.1418702112, 2015.
Nie, W., Ding, A. J., Xie, Y. N., Xu, Z., Mao, H., Kerminen, V.-M., Zheng, L. F., Qi, X. M., Huang, X., Yang, X.-Q., Sun, J. N., Herrmann, E., Petäjä, T., Kulmala, M., and Fu, C. B.: Influence of biomass burning plumes on HONO chemistry in eastern China, Atmos. Chem. Phys., 15, 1147–1159, https://doi.org/10.5194/acp-15-1147-2015, 2015.
Poor, N., Pribble, R., and Greening, H.: Direct wet and dry deposition of ammonia, nitric acid, ammonium and nitrate to the Tampa Bay Estuary, FL, USA, Atmos. Environ., 35, 3947–3955, https://doi.org/10.1016/S1352-2310(01)00180-7, 2001.
Pryor, S. C., Barthelmie, R. J., Sørensen, L. L., and Jensen, B.: Ammonia concentrations and fluxes over a forest in the midwestern USA, Atmos. Environ., 35, 5645–5656, https://doi.org/10.1016/S1352-2310(01)00259-X, 2001.
Pryor, S. C., Barthelmie, R. J., Jensen, B., Jensen, N. O., and Sørensen, L. L.: HNO3 fluxes to a deciduous forest derived using gradient and REA methods, Atmos. Environ., 36, 5993–5999, https://doi.org/10.1016/S1352-2310(02)00765-3, 2002.
Pryor, S. C., Larsen, S. E., Sørensen, L. L., Barthelmie, R. J., Grönholm, T., Kulmala, M., Launiainen, S., Rannik, Ü., and Vesala, T.: Particle fluxes over forests: Analyses of flux methods and functional dependencies, J. Geophys. Res., 112, https://doi.org/10.1029/2006JD008066, 2007.
Rattray, G. and Sievering, H.: Dry deposition of ammonia, nitric acid, ammonium, and nitrate to alpine tundra at Niwot Ridge, Colorado, Atmos. Environ., 35, 1105–1109, https://doi.org/10.1016/S1352-2310(00)00276-4, 2001.
Ren, X., Sanders, J. E., Rajendran, A., Weber, R. J., Goldstein, A. H., Pusede, S. E., Browne, E. C., Min, K.-E., and Cohen, R. C.: A relaxed eddy accumulation system for measuring vertical fluxes of nitrous acid, Atmos. Meas. Tech., 4, 2093–2103, https://doi.org/10.5194/amt-4-2093-2011, 2011.
Ren, Y., Stieger, B., Spindler, G., Grosselin, B., Mellouki, A., Tuch, T., Wiedensohler, A., and Herrmann, H.: Role of the dew water on the ground surface in HONO distribution: a case measurement in Melpitz, Atmos. Chem. Phys., 20, 13069–13089, https://doi.org/10.5194/acp-20-13069-2020, 2020.
Rumsey, I. C. and Walker, J. T.: Application of an online ion-chromatography-based instrument for gradient flux measurements of speciated nitrogen and sulfur, Atmos. Meas. Tech., 9, 2581–2592, https://doi.org/10.5194/amt-9-2581-2016, 2016.
Scharko, N. K., Schütte, U. M. E., Berke, A. E., Banina, L., Peel, H. R., Donaldson, M. A., Hemmerich, C., White, J. R., and Raff, J. D.: Combined Flux Chamber and Genomics Approach Links Nitrous Acid Emissions to Ammonia Oxidizing Bacteria and Archaea in Urban and Agricultural Soil, Environ. Sci. Technol., 49, 13825–13834, https://doi.org/10.1021/acs.est.5b00838 2015.
Schobesberger, S., Lopez-Hilfiker, F. D., Taipale, D., Millet, D. B., D'Ambro, E. L., Rantala, P., Mammarella, I., Zhou, P., Wolfe, G. M., Lee, B. H., Boy, M., and Thornton, J. A.: High upward fluxes of formic acid from a boreal forest canopy, Geophys. Res. Lett., 43, 9342–9351, https://doi.org/10.1002/2016GL069599, 2016.
Shaw, W. J., Spicer, C. W., and Kenny, D. V.: Eddy correlation fluxes of trace gases using a tandem mass spectrometer, Atmos. Environ., 32, 2887–2898, https://doi.org/10.1016/S1352-2310(98)00036-3, 1998.
Shen, Jianlin, Chen, Deli, Bai, Mei, Sun, Jianlei, Lam, and Shu: Spatial variations in soil and plant nitrogen levels caused by ammonia deposition near a cattle feedlot, Atmos. Environ., https://doi.org/10.1016/j.atmosenv.2017.12.022, 2018.
Sievering, H., Kelly, T., McConville, G., Seibold, C., and Turnipseed, A.: Nitric acid dry deposition to conifer forests:: Niwot Ridge spruce–fir–pine study, Atmos. Environ., 35, 3851–3859, https://doi.org/10.1016/S1352-2310(01)00156-X, 2001.
Su, H., Cheng, Y., Oswald, R., Behrendt, T., Trebs, I., Meixner, F. X., Andreae, M. O., Cheng, P., Zhang, Y., and Pöschl, U.: Soil Nitrite as a Source of Atmospheric HONO and OH Radicals, Science, 333, 1616–1618, https://doi.org/10.1126/science.1207687, 2011.
Trebs, I., Meixner, F. X., Slanina, J., Otjes, R., Jongejan, P., and Andreae, M. O.: Real-time measurements of ammonia, acidic trace gases and water-soluble inorganic aerosol species at a rural site in the Amazon Basin, Atmos. Chem. Phys., 4, 967–987, https://doi.org/10.5194/acp-4-967-2004, 2004.
van Breemen, N. and van Dijk, H. F. G.: Ecosystem effects of atmospheric deposition of nitrogen in The Netherlands, Environ. Pollut., 54, 249–274, https://doi.org/10.1016/0269-7491(88)90115-7, 1988.
Velentini, R., Greco, S., Seufert, G., Bertin, N., Ciccioli, P., Cecinato, A., Brancaleoni, E., and Frattoni, M.: Fluxes of biogenic VOC from Mediterranean vegetation by trap enrichment relaxed eddy accumulation, Atmos. Environ., 31, 229–238, https://doi.org/10.1016/S1352-2310(97)00085-X, 1997.
Villena, G., Kleffmann, J., Kurtenbach, R., Wiesen, P., Lissi, E., Rubio, M. A., Croxatto, G., and Rappenglück, B.: Vertical gradients of HONO, NOX and O3 in Santiago de Chile, Atmos. Environ., 45, 3867–3873, https://doi.org/10.1016/j.atmosenv.2011.01.073, 2011.
Vitousek, P. M. and Howarth, R. W.: Nitrogen limitation on land and in the sea: How can it occur?, Biogeochemistry, 13, 87–115, https://doi.org/10.1007/BF00002772, 1991.
von der Heyden, L., Wißdorf, W., Kurtenbach, R., and Kleffmann, J.: A relaxed eddy accumulation (REA) LOPAP system for flux measurements of nitrous acid (HONO), Atmos. Meas. Tech., 15, 1983–2000, https://doi.org/10.5194/amt-15-1983-2022, 2022.
Wesely, M. L.: Parameterization of surface resistances to gaseous dry deposition in regional-scale numerical models, Atmos. Environ., 41, 52–63, https://doi.org/10.1016/j.atmosenv.2007.10.058, 2007.
Wong, K. W., Tsai, C., Lefer, B., Haman, C., Grossberg, N., Brune, W. H., Ren, X., Luke, W., and Stutz, J.: Daytime HONO vertical gradients during SHARP 2009 in Houston, TX, Atmos. Chem. Phys., 12, 635–652, https://doi.org/10.5194/acp-12-635-2012, 2012.
Wu, D., Horn, M. A., Behrendt, T., Müller, S., Li, J., Cole, J. A., Xie, B., Ju, X., Li, G., Ermel, M., Oswald, R., Fröhlich-Nowoisky, J., Hoor, P., Hu, C., Liu, M., Andreae, M. O., Pöschl, U., Cheng, Y., Su, H., Trebs, I., Weber, B., and Sörgel, M.: Soil HONO emissions at high moisture content are driven by microbial nitrate reduction to nitrite: tackling the HONO puzzle, ISME J., 13, 1688–1699, https://doi.org/10.1038/s41396-019-0379-y, 2019.
Xu, M., Kasahara, K., Sorimachi, A., and Matsuda, K.: Nitric acid dry deposition associated with equilibrium shift of ammonium nitrate above a forest by long-term measurement using relaxed eddy accumulation, Atmos. Environ., 256, 118454, https://doi.org/10.1016/j.atmosenv.2021.118454, 2021.
Young, L.-H., Hsiao, T.-C., Griffith, S. M., Huang, Y.-H., Hsieh, H.-G., Lin, T.-H., Tsay, S.-C., Lin, Y.-J., Lai, K.-L., Lin, N.-H., and Lin, W.-Y.: Secondary inorganic aerosol chemistry and its impact on atmospheric visibility over an ammonia-rich urban area in Central Taiwan, Environ. Pollut., 312, 119951, https://doi.org/10.1016/j.envpol.2022.119951, 2022.
Zhang, N., Zhou, X., Bertman, S., Tang, D., Alaghmand, M., Shepson, P. B., and Carroll, M. A.: Measurements of ambient HONO concentrations and vertical HONO flux above a northern Michigan forest canopy, Atmos. Chem. Phys., 12, 8285–8296, https://doi.org/10.5194/acp-12-8285-2012, 2012.
Zhou, X., Zhang, N. TerAvest, M., Tang, D., Hou, J., Bertman, S., Alaghmand, M., Shepson, P. B., Carroll, M. A., Griffith, S., Dusanter, S., and Stevens. P. S.: Nitric acid photolysis on forest canopy surface as a source for tropospheric nitrous acid, Nat. Geosci., https://doi.org/10.1038/ngeo1164, 2011.