the Creative Commons Attribution 4.0 License.
the Creative Commons Attribution 4.0 License.
 | 21 Jan 2026
The relative importance of wind and hydroclimate drivers in modulating the interannual variability of dust emissions in Earth system models
Xinzhu Li
Xin Xi
Windblown dust emissions are controlled by near-surface wind speed and sediment erodibility, the latter modulated by hydroclimate and land-use conditions. Accurate representations of these drivers are critical for reproducing historical dust variability and projecting future dust changes in Earth system models (ESMs). This study examines the discrepancies among 21 ESMs in the relative importance of wind speed versus five hydroclimate drivers in explaining the historical (1980–2014) variability of dust emissions from global drylands. In hyperarid areas, models show poor agreement in the simulated dust variability, with only 9 % out of 210 inter-model comparisons exhibiting significant positive correlations. In contrast, arid and semiarid areas exhibit a dual pattern driven by a “double-edged sword” effect of land surface memory: models with coherent hydroclimate variability show better agreement, whereas those with divergent hydroclimate representations show larger disagreement. While the ESMs capture the dominant role of wind speed in hyperarid areas, they diverge markedly in the relative contributions of wind and hydroclimate drivers in arid and semiarid areas. Replacing the Zender et al. (2003) dust scheme with the Kok et al. (2014) scheme in CESM and E3SM generally strengthens hydroclimate influences while reducing wind speed contributions to simulated dust variability. MERRA-2 reanalysis produces stronger wind influences than most ESMs across all dryland regions. These results underscore the need for improved near-surface wind simulations in hyperarid areas and more realistic land surface and hydroclimate representations in arid and semiarid areas to reduce uncertainties in global dust emission simulations.
- Article
(8118 KB) - Full-text XML
- BibTeX
- EndNote


Windblown dust emission is modulated by near-surface wind speed and the supply and erodibility of fine-grain sediments, which collectively determine the timing, location, duration, and intensity of dust events. The most abundant sediment supply is typically found in low-relief regions with thick layers of unconsolidated materials produced by weathering, fluvial, and/or aeolian processes (Bullard and Livingstone, 2002; Bullard et al., 2011). The erodibility of these fine materials depends on environmental conditions such as surface soil moisture and armoring (e.g., vegetation, soil crusts) which determine the minimum or threshold wind velocity that must be reached to initiate the saltation-sandblasting process (e.g., Zender and Kwon, 2005; Shao et al., 2011; Xi and Sokolik, 2015b). The environmental controls of dust emission have been incorporated into Earth system models (ESMs) via parameterizations of dust emission fluxes as a function of various atmospheric, land surface, and soil parameters, many of which are interactively determined within the models. For example, the horizontal saltation dust flux is calculated as a function of the third or fourth power of wind velocity, reflecting the dominant role of infrequent, high-wind events in dust production (e.g., Owen, 1964; Bagnold, 1974; White, 1979; Kok et al., 2012). Early parameterizations in ESMs use static dust source functions to represent the spatially varying sediment supply, with large values associated with low-relief regions where elevated dust burden has been frequently detected by satellite observations (e.g., Ginoux et al., 2001; Prospero et al., 2002; Zender et al., 2003). The sediment supply is typically assumed to be unlimited in ESMs without accounting for depletion or replenishment over time. In addition, the sediment erodibility is closely connected with hydroclimate and land surface processes in ESMs. For example, surface soil moisture, which is simulated by the land model component, is often used to account for increases in erosion thresholds due to enhanced soil particle cohesion under wet conditions (Fécan et al., 1999). Many ESMs also use the bare soil fraction to adjust dust emissions from areas partially covered by snow, ice, or vegetation. Vegetation also acts to increase the aerodynamic surface roughness and reduce the available wind shear stress exerting on erodible surfaces, which can be represented by drag partitioning schemes but is currently not considered in most ESMs (Raupach et al., 1993; Marticorena and Bergametti, 1995; Shao, 2001).
Numerous studies have evaluated the consistency and performance of current ESMs in simulating the global dust cycle under the Aerosol Comparisons between Observations and Models (AeroCom) initiative and Coupled Model Intercomparison Project (CMIP) (Textor et al., 2006; Huneeus et al., 2011; Kim et al., 2014; Wu et al., 2020; Gliß et al., 2021; Zhao et al., 2022; Kim et al., 2024). Overall, these studies suggest that modern-day dust aerosol column burden is reasonably constrained by ground- and satellite-based aerosol optical depth (AOD) retrievals, leading to better inter-model agreement than those in dust emission and deposition estimates. Knippertz and Todd (2012) pointed out that model tuning to match satellite observations, e.g., via the use of dust source functions, induces a compensational effect between dust emission and deposition, both of which lack direct observational constraints at the global scale. Indeed, previous AeroCom and CMIP model intercomparisons reported substantial discrepancies in global dust emission estimates, with differences spanning an order of magnitude, as well as persistent difficulties in reproducing historical dust variability and its relationships with key driving factors (Huneeus et al., 2011; Evan et al., 2014; Evan, 2018; Pu and Ginoux, 2018; Wu et al., 2020; Gliß et al., 2021; Zhao et al., 2022). Kok et al. (2023) further suggested that current ESMs failed to capture the increase of global dust burden since preindustrial times, likely due to inaccurate model representations of the climate and land-use drivers of dust emissions, and/or the dust sensitivity to these driving factors.
The model discrepancies can be partly explained by the choice of dust emission schemes. Earlier schemes rely on static dust source functions to shift emissions towards satellite-observed hot spot regions (e.g., Ginoux et al., 2001; Zender et al., 2003), whereas newer parameterizations replace prescribed dust source functions with more explicit formulations of sediment erodibility that increase the dust emission sensitivity to soil-moisture-dependent erosion thresholds (e.g., Kok et al., 2014b; Leung et al., 2023). Dust schemes also differ in how they represent the sandblasting efficiency, defined as the ratio of the vertical dust flux to the saltation flux: some schemes assume a global constant (e.g., Ginoux et al., 2001; Volodin and Kostrykin, 2016), whereas more sophisticated schemes account for the dependence of sandblasting efficiency on soil properties and wind speed (e.g., Zender et al., 2003; Kok et al., 2014b). The choice of wind speed also varies: while some dust schemes use 10-m winds, others use friction velocity which more accurately represents the wind shear stress acting on erodible surfaces but requires specification of surface roughness length. In general, more sophisticated schemes, which are derived based on small-scale wind tunnel experiments, require more extensive input parameters which are often poorly constrained at climate model grid levels, necessitating assumptions and empirical tunings. For instance, due to limited data availability, surface aerodynamic roughness is often prescribed as a global constant or based on static satellite-derived maps (e.g., Peng et al., 2012; Tegen et al., 2019). ESM-simulated soil water content may lack the accuracy or dynamic range required by dust emission parameterizations. As a result, some models apply additional tunings or alternative treatments of soil moisture effects (e.g., Zender et al., 2003; Volodin and Kostrykin, 2016), while others disable the soil moisture dependence entirely (e.g., Noije et al., 2021; Shevliakova et al., 2024).
Even when using the same dust emission scheme, ESMs can still diverge in dust emission simulations due to differences in model configurations (e.g., horizontal resolution, vertical levels), input datasets, parameter tunings, and coupled physical processes. For instance, the bare soil fraction is determined from land cover type, vegetation fraction, and snow/ice area extent, all of which may differ across ESMs. Vegetation cover itself may be prescribed from satellite climatology or simulated interactively. ESMs also differ in their representations of soil properties (e.g., hydraulic conductivity), soil column structure (e.g., number and thickness of layers), and land surface hydrologic formulations (e.g., precipitation, runoff, evaporation), which collectively determine the surface soil moisture needed by dust emission schemes. The soil moisture effects may be treated inconsistently, e.g., in how models define the residue moisture level below which dust emission is assumed to be independent on soil water content (e.g., Ginoux et al., 2001; Evans et al., 2016; Volodin and Kostrykin, 2016). Moreover, ESMs employ different planetary boundary layer and surface flux parameterizations, which influence the simulation of near-surface winds and extreme wind events pertinent to dust mobilization and transport. Given the inherent differences in dust process representations and the lack of direct observational constraints, it is thus not surprising that ESM-simulated dust emission fluxes exhibit substantial discrepancies, as documented in previous AeroCom and CMIP intercomparison studies. Therefore, ESM-simulated dust emission fluxes are best viewed as an unconstrained, model-specific quantity characterized by a dynamic range defined by the parameterizations, configurations, and parameter tunings of individual models, similar to Koster et al. (2009)'s view on root-zone soil moisture.
While model discrepancies in global dust emission estimates are well documented, a key remaining question is how consistently and accurately current ESMs represent the temporal variability of dust emission and its sensitivity to underlying physical drivers. Addressing this question is essential for understanding and reducing model uncertainties in predicting dust responses to climate and land-use changes. In this study, we focus on the interannual variability of ESM-simulated dust emissions from global drylands and apply a statistical framework to diagnose the physical controls of dust emissions. Based on fully-coupled historical simulations from a suite of ESMs and two aerosol reanalysis products, we examine the extent of inter-model agreement in simulating the interannual dust variability across different climate aridity regimes and quantify the relative importance of a common set of physical drivers in explaining the simulated dust variability within individual models. Although satellite-derived dust AOD and in-situ dust measurements provide valuable constraints on dust variability (e.g., Prospero and Lamb, 2003; Voss and Evan, 2020), they integrate the effects of emission, transport, and deposition, making it difficult to isolate the emission process itself. Also, due to lack of global validation data, we focus on diagnosing inter-model inconsistency in representing the dust emission variability and its physical controls, rather than validating individual model performance against observations.
The remainder of this paper is organized as follows. Section 2 describes the ESMs and aerosol reanalysis datasets and the dominance analysis technique. Section 3 presents results on comparing model-simulated dust emission fluxes and the relative influences of wind speed versus hydroclimate drivers. Section 4 summarizes the main findings of this study.
2.1 ESMs and aerosol reanalysis
We consider a total of 21 ESMs as summarized in Table 1, including 18 models from the CMIP6 fully coupled historical experiment (1980–2014). For each model, we use the first ensemble member (r1i1p1f1) unless otherwise stated. Two CESM variants use the same dust emission scheme of Zender et al. (2003) (hereafter the Zender scheme) but different atmospheric components: the Community Atmosphere Model (CESM2-CAM-Zender) versus the Whole Atmosphere Community Climate Model (CESM2-WACCM-Zender). In addition, we conducted a CESM experiment (2004–2013) using the dust emission scheme of Kok et al. (2014b) (hereafter the Kok scheme; CESM2-CAM-Kok) (Li et al., 2022). We further conduct two E3SM model experiments (1980–2014) coupled with the Zender (E3SM2-Zender) and Kok (E3SM3-Kok) schemes, respectively (Feng et al., 2022; Xie et al., 2025). A key difference between the two schemes is that, the Zender scheme relies on a prescribed, time-invariant dust source function that shifts emissions towards contemporary dust source regions, whereas the Kok scheme applies more physically based parameterizations of soil erosion thresholds, thereby improving dust simulations without using prescribed dust source functions (Kok et al., 2014a). The paired CESM and E3SM experiments allow us to examine how the choice of dust emission schemes or host models affects the simulated dust variability and sensitivity to driving factors. Nonetheless, it is important to note that comparing these experiments is complicated by additional model differences. For example, CESM2-CAM-Zender does not account for dust mineralogy, whereas CESM2-CAM-Kok simulates dust as mineral components with observationally constrained mineral optical properties (Li et al., 2024). This may lead to inconsistent radiative feedback on meteorology and dust emissions. Similarly, E3SM3 incorporates extensive model updates relative to E3SM2, which may affect near-surface meteorological and land surface conditions relevant to dust emissions (Xie et al., 2025).
Zender et al. (2003)Gettelman et al. (2019)Zender et al. (2003)Albani et al. (2015)Kok et al. (2014b)Li et al. (2022)Zender et al. (2003)Feng et al. (2022)Kok et al. (2014b)Xie et al. (2025)Peng et al. (2012)Swart et al. (2019)Peng et al. (2012)Sigmond et al. (2023)Tegen et al. (2002)Séférian et al. (2019)Tegen et al. (2002)Noije et al. (2021)Miller et al. (2006)Miller et al. (2021)Miller et al. (2006)Miller et al. (2021)Miller et al. (2006)Rind et al. (2020)Woodward (2011)Roberts et al. (2019)Woodward (2001)Woodward et al. (2022)Volodin and Kostrykin (2016)Volodin (2022)Balkanski et al. (2004)Lurton et al. (2020)Shao et al. (1996)Yukimoto et al. (2019)Takemura et al. (2009)Tatebe et al. (2019)Takemura et al. (2009)Hajima et al. (2020)Tegen et al. (2019)Mauritsen et al. (2019)Zender et al. (2003)Seland et al. (2020)Ginoux et al. (2001)Randles et al. (2017)Shao et al. (1996)Yumimoto et al. (2017)Table 1Summary of Earth system models and aerosol reanalysis datasets considered in this study. Dust source function (DSF) indicates whether a static dust source function is used. Leaf area index (LAI) indicates whether LAI is treated as a prognostic variable. Dm is the dust particle diameter upper limit. u* is friction velocity. u10 is 10 m wind velocity.
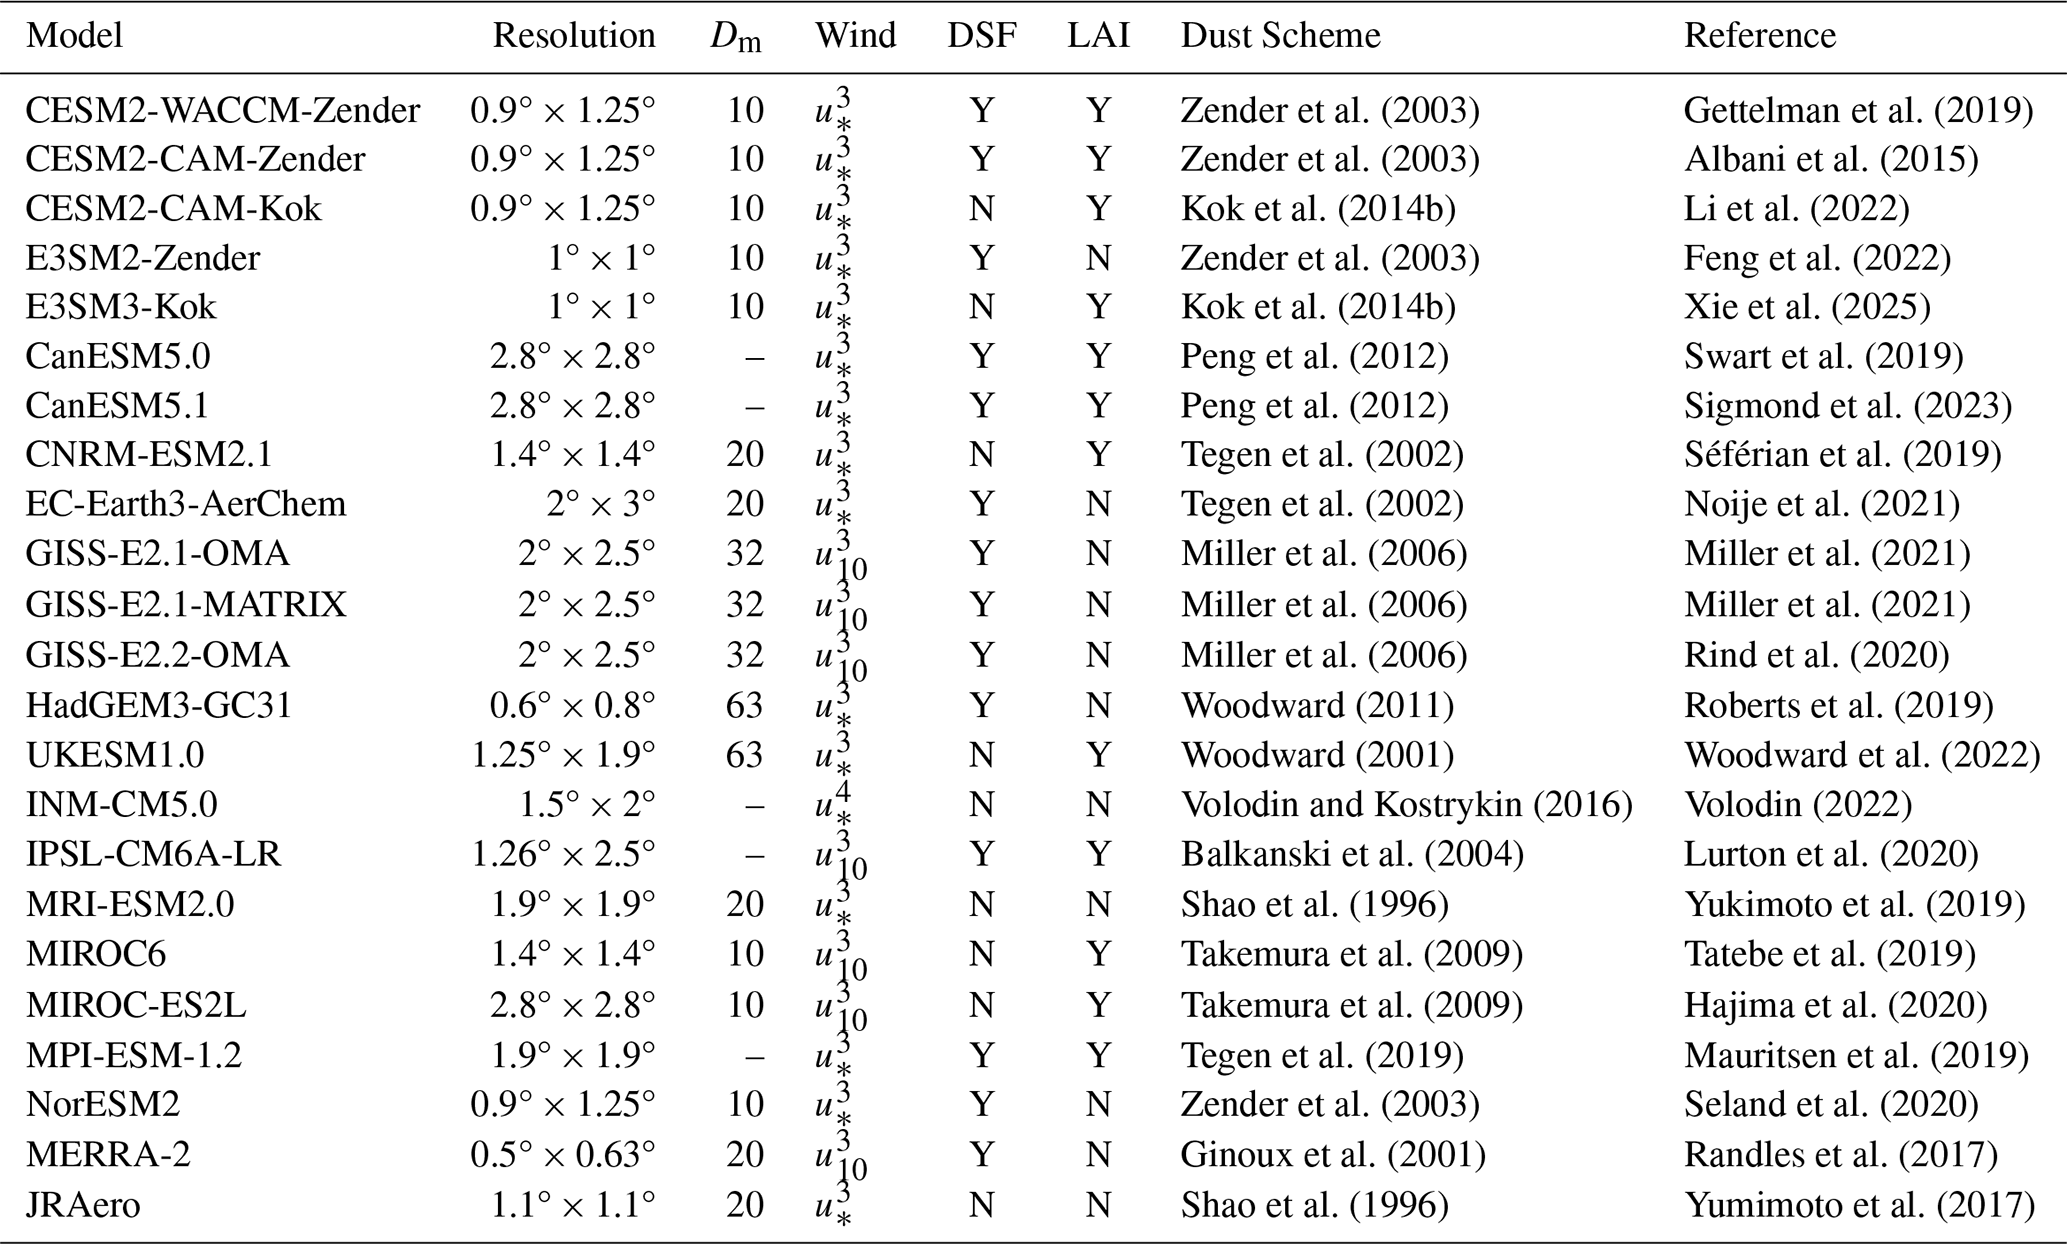
Several other model families share common heritage but differ in physics options and configurations. For example, CanESM5.1 incorporated physics and technical changes that improved mean climate and dust simulations relative to CanESM5.0 (Sigmond et al., 2023). Three GISS-E2 models use the same dust scheme from Miller et al. (2006) but differ in model version (2.1 vs. 2.2) and aerosol microphysics scheme: One-Moment Aerosol (OMA; ensemble member r1i1p3f1) versus Multiconfiguration Aerosol TRacker of mIXing state (MATRIX; ensemble member r1i1p5f1) (Rind et al., 2020; Miller et al., 2021). UKESM1.0 is developed based on the HadGEM3-GC3.1 general circulation model. They use the same dust scheme from Woodward (2001) but employ different parameter tunings and dust source representations (Woodward et al., 2022). MIROC-ES2L builds upon the MIROC general circulation model version 5.2 (MIROC5) (Hajima et al., 2020), while MIROC6 incorporates physics updates that improved the mean climate state and internal variability compared to MIROC5 (Tatebe et al., 2019). Both MIROC-ES2L and MIROC6 use the dust scheme from the SPRINTARS model (Takemura et al., 2009).
The ESMs are further compared with two aerosol reanalysis products with dust emission flux output: Modern-Era Retrospective Analysis for Research and Applications Version 2 (MERRA-2, 1980–2014) (Gelaro et al., 2017), and Japanese Reanalysis for Aerosol (JRAero, 2011–2017) (Yumimoto et al., 2017). Dust emission in MERRA-2 is simulated using the Ginoux et al. (2001) parameterization within the GOCART aerosol module of GEOS-5 model. In JRAero, dust emission is simulated using the Shao et al. (1996) energy-based scheme (same as in MRI-ESM2.0) within the Japan Meteorological Agency MASINGAR mk-2 global aerosol transport model (Yumimoto et al., 2017; Yukimoto et al., 2019). In both MERRA-2 and JRAero, the meteorological inputs for dust emission calculations are constrained via data assimilation of in situ and remote sensing observations (including surface and upper-air wind measurements), which improves near-surface wind simulations compared to CMIP6 models (Gelaro et al., 2017; Yumimoto et al., 2017). The surface soil moisture in MERRA-2 also benefits from assimilation of observation-corrected precipitation. While both reanalyses assimilate bias-corrected total AOD from satellites, the AOD assimilation is expected to have limited influence on dust emission simulations.
To facilitate the comparison among the ESMs and reanalysis products, we classify global drylands into three climate zones–hyperarid, arid, and semiarid–based on the aridity index (AI), defined as the ratio of climatological mean precipitation to potential evapotranspiration for 1970–2000 following (Zomer et al., 2022). Dry subhumid areas are not considered due to their negligible dust contributions. The hyperarid climate zone is defined as AI ≤ 0.05, arid zone as 0.05 < AI ≤ 0.2, and semiarid zone as 0.2 < AI ≤ 0.5. As shown in Fig. 1, hyperarid areas primarily cover North Africa, Arabian Peninsula, Iranian Plateau, and Tarim Basin. Arid and semiarid areas cover other major dust sources, including the Sahel (North Africa), Turan Depression (Central Asia), Gobi Desert (East Asia), Thar Desert (South Asia), Kalahari Desert (Southern Africa), Chihuahua Desert (North America), Patagonia steppe (South America), and the Great Sandy and Simpson Deserts (Australia). Generally, hyperarid areas are dominated by permanently dry, barren surfaces with very low hydroclimate variability, such that dust emission is expected to be primarily controlled by wind speed. In contrast, arid and semiarid areas experience greater precipitation and hydroclimate fluctuations, which are expected to exert stronger influence on sediment erodibility and dust emissions.
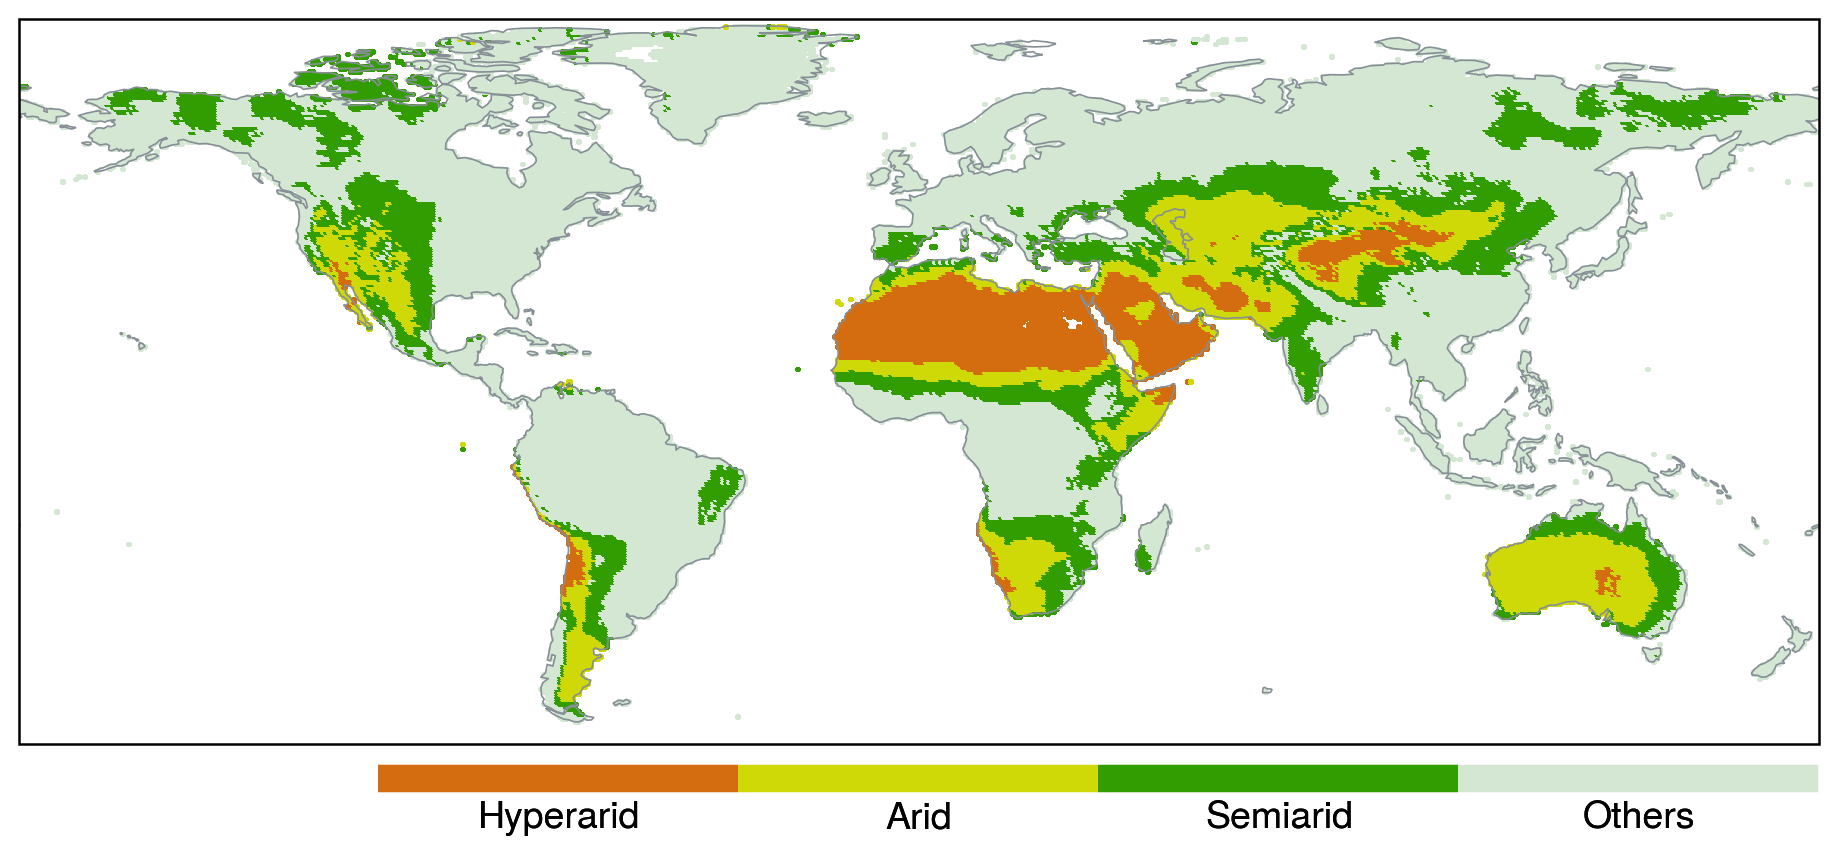
Figure 1Definitions of climate aridity zones for model intercomparisons.
2.2 Dominance analysis technique
Previous studies commonly used linear regression coefficients to quantify the dust sensitivity to its physical drivers (e.g., Pu and Ginoux, 2016; Aryal and Evans, 2021; Zhao et al., 2022). In multiple linear regression, a regression coefficient represents the mean change in the response variable (e.g., dust emission flux or AOD) associated with a unit change in a given predictor, while holding all other predictors constant. This interpretation assumes mutual independence among predictors, an assumption that is often violated by strong correlations among dust emission drivers. Consequently, linear regression coefficients can cause misleading inference of the relative importance of predictors. In addition, regression coefficients, standardized or not, may not provide a consistent basis for comparing predictor importance across different ESMs, due to their inconsistent dynamic ranges.
In this study, we use the dominance analysis technique to quantify the relative importance of multiple correlated predictors in explaining the variability of monthly total dust emission fluxes simulated by individual ESMs and the MERRA-2 reanalysis. JRAero is excluded from this analysis due to missing predictor data. Although the ESMs differ in how they partition total emissions into discrete size modes or bins, the size partitioning has minor effects on diagnosing the emission process itself. The predictors considered here operate upstream of the size partitioning, and control the initiation and magnitude of total dust emissions rather than its size-resolved characteristics. Here we consider a common set of six predictors from each model: 10 m wind speed, total precipitation (including liquid and solid phases), water content in the uppermost soil layer, 2 m specific humidity, 2 m air temperature, and leaf area index (LAI). Among them, 10 m wind speed represents the wind shear stress driving dust mobilization, while the remaining variables collectively represent the hydroclimate controls on sediment erodibility. The selected predictors are either directly used in dust emission parameterizations or strongly correlated with dust emission intensity, as shown in numerous studies (e.g., Engelstaedter et al., 2003; Ravi et al., 2006; Zou and Zhai, 2004; Cowie et al., 2015; Kim and Choi, 2015; Xi and Sokolik, 2015b, a). Note that we donot not include all the physical drivers represented in each model because of limited data availability in the CMIP6 online archive, and because some models incorporate additional drivers not used by others. Hence we focus on a common set of six readily available predictors to provide a consistent and fair comparison across the ESMs and MERRA-2 reanalysis.
Dominance analysis is applied to the ESMs and MERRA-2 over grid cells with nonzero dust emissions. The dust emission fluxes and predictors are first deseasonalized by subtracting month-wise climatological means and then normalized to 0–1 range via min-max scaling. Dominance analysis quantifies the marginal contribution of each predictor to the total explained variance (R2) by evaluating all possible subset models (2p−1 subsets for p predictors) in a multiple linear regression framework (Budescu, 1993; Azen and Budescu, 2003). The approach first calculates the average incremental contribution of each predictor to the total R2 across all subset models of the same size (i.e., models with the same number of predictors). These incremental R2 values are then averaged to obtain the predictor’s overall contribution to the total R2. A key feature of this approach is that the sum of individual predictor contributions equals the total R2 of the full model (i.e., with all predictors included), thereby allowing the partitioning of total explained variance among correlated predictors. The resulting grid-level predictor R2 values from the ESMs and MERRA-2 are used to assess the spatial variability of predictor influences over different climate zones within each model, as well as the inter-model consistency in representing the relative importance of wind speed versus five hydroclimate drivers.
3.1 Climatological distribution
Figure 2 displays the climatological mean annual dust emission fluxes from the 21 ESMs, their ensemble mean, and the MERRA-2 and JRAero reanalyses during 2005–2014 (2004–2013 for CESM2-CAM-Kok and 2011–2017 for JRAero). All datasets capture the global dust belt stretching from West Africa across the Middle East to East Asia, as well as weaker sources in the Americas and Australia. Among the ESMs, E3SM3-Kok and HadGEM2-GC31 simulate the most extensive dust-emitting areas extending to high-latitude and subhumid areas. CESM2-CAM-Zender, CESM2-WACCM-Zender and NorESM2 restrict emissions to regions where the dust source function exceeds 0.1, resulting in discrete and spatially limited emission patterns. Conversely, E3SM2-Zender employs the original dust source function of Zender et al. (2003), producing a more spatially continuous emission pattern (Fig. 2e).
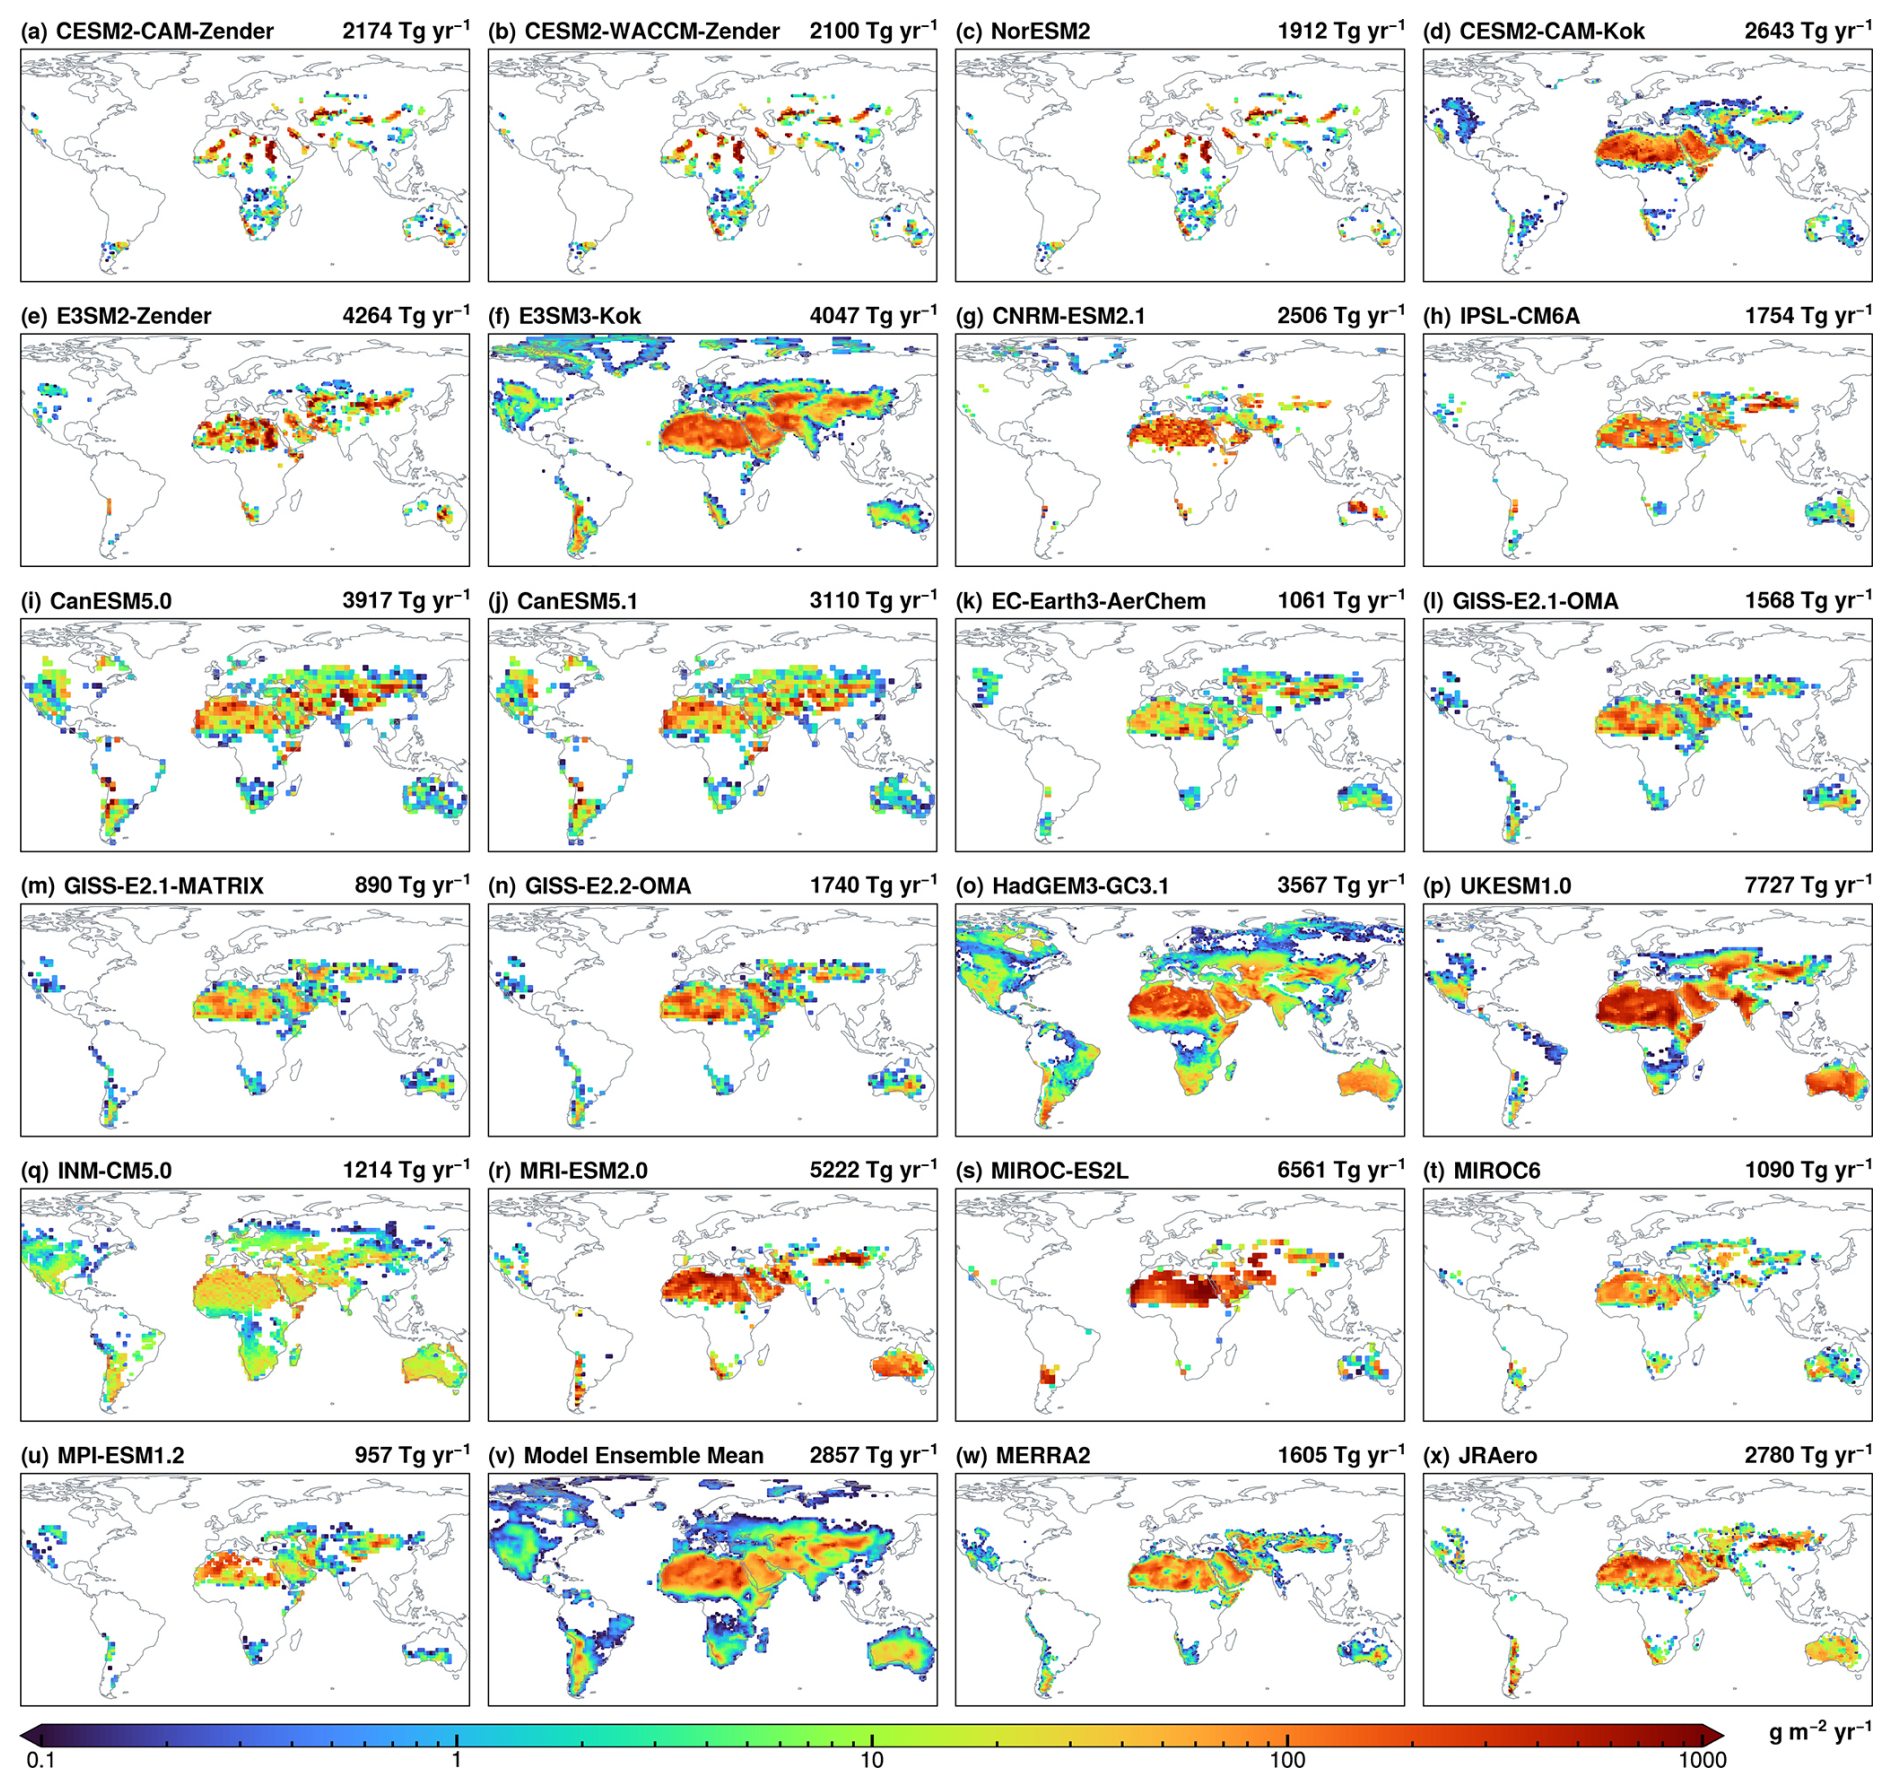
Figure 2Climatological mean dust emission fluxes from (a–u) 21 Earth system models , (v) model ensemble mean, (w) MERRA-2 reanalysis, and (x) JRAero reanalysis. Global annual total emissions are displayed on each panel.
Global annual dust emissions simulated by the ESMs vary greatly, ranging from 890 to 7727 Tg yr−1 with nearly an order of magnitude difference (Fig. 2a–u). The ensemble mean estimate (Fig. 2v) is 2857 Tg yr−1 with a standard deviation of 1835 Tg yr−1, corresponding to a diversity of 64 % (defined as the ratio of standard deviation to ensemble mean). Based on models with an upper particle size limit of 20 µm, global dust emissions vary from 1061 to 6561 Tg yr−1, with a mean of 3048 Tg yr−1 and diversity of 55 %. The ensemble mean is close to JRAero (2780 Tg yr−1, Fig. 2x), but considerably higher than MERRA-2 (1605 Tg yr−1, Fig. 2w). Also, the ensemble mean exhibits a more spatially homogeneous pattern over North Africa and the Arabian Peninsula, whereas MERRA-2 and JRAero display more heterogeneous and localized emission patterns.
The model discrepancies in dust emission magnitude are consistent with previous assessments. For example, Huneeus et al. (2011) compared 14 AeroCom Phase I models and reported a global dust emission range of 500–4400 Tg yr−1 (diversity = 58 %), of which seven using a 20 µm upper size limit yielded 980–4300 Tg yr−1 (diversity = 46 %). Similarly, Gliß et al. (2021) compared 14 AeroCom Phase III models and reported a range of 850–5650 Tg yr−1 with a diversity of 64 %. Based on 15 CMIP5 models, Wu et al. (2020) reported a range of 740–8200 Tg yr−1 (diversity = 66 %), with seven models using particle diameters up to 20 µm producing 740–3600 Tg yr−1 (diversity = 43 %). More recently, Zhao et al. (2022) examined 15 CMIP6 AMIP models and reported a range of 1400–7600 Tg yr−1 with a diversity of 61 %. Collectively, these studies, along with our results, demonstrate persistent large model uncertainties in global dust emission estimates despite advances in model resolutions and physics parameterizations, which reflects the unconstrained, model-specific nature of dust emission fluxes.
Figure 3 displays the contributions of different climate zones to global dust emissions. Based on the model ensemble mean, global dust emissions are partitioned as 61 % from hyperarid, 27 % from arid, and 5 % from semiarid zones. In comparison, MERRA-2 and JRAero allocate the majority of dust emissions to hyperarid and arid zones, with negligible contributions from the semiarid zone.
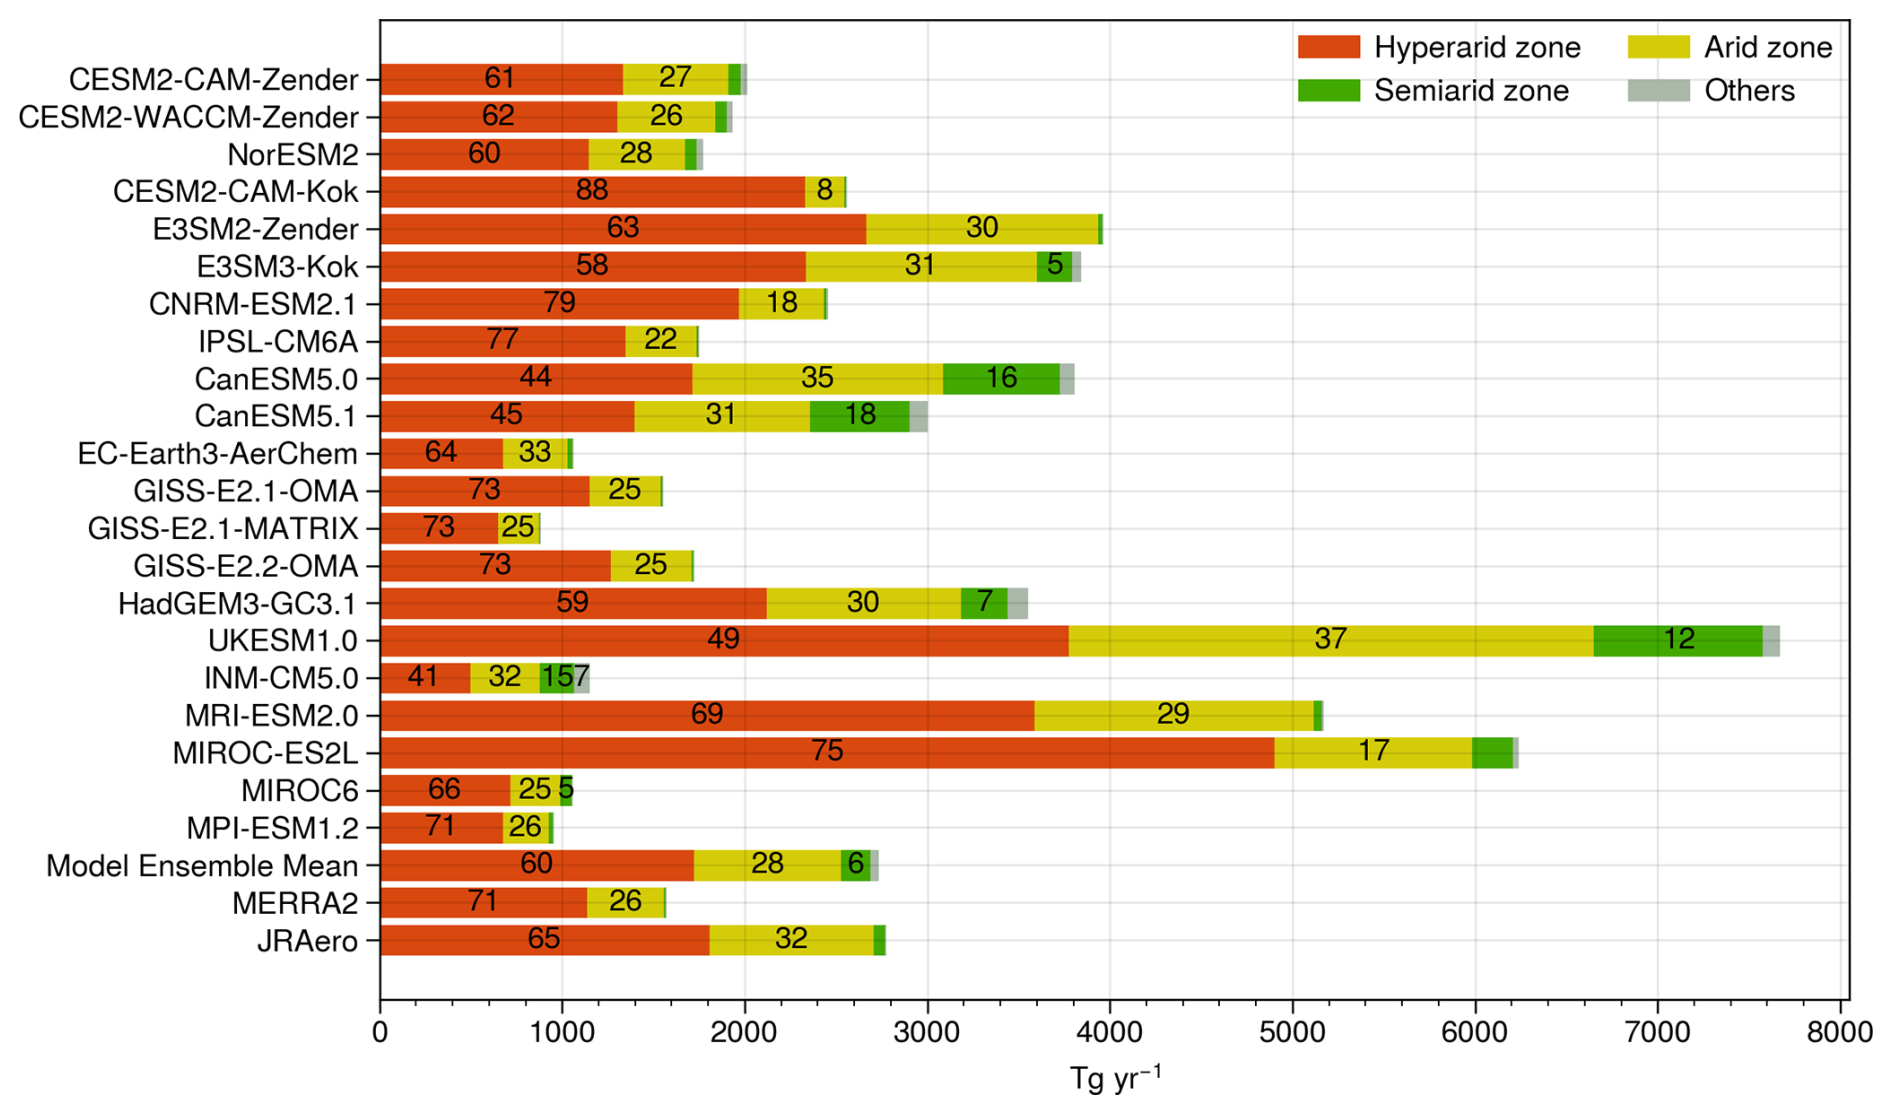
Figure 3Contributions of different climate zones to global annual dust emissions. Numbers indicate percentages above 5 %.
The hyperarid zone accounts for more than half of global emissions in all ESMs except CanESM5.0, CanESM5.1, and INM-CM5.0. These models simulate relatively uniform emission patterns with less than 50 % from hyperarid areas, possibly related to their dust emission parameterizations. As noted in Sigmond et al. (2023), parameter tunings related to the hybridization of dust tracers caused spurious dust events in CanESM5.0. An interpolation error in the bare soil fraction also contributed to dust simulation biases in CanESM5.0 and CanESM5.1 compared to other CMIP6 models and satellite aerosol observations (Sigmond et al., 2023). The newer CanESM5.1 simulates 20 % less dust globally but similar spatial distributions compared to CanESM5.0. In INM-CM5.0, the vertical dust flux is calculated as a function of wind speed alone, without accounting for land surface effects on the threshold wind velocity (Volodin and Kostrykin, 2016; Volodin, 2022). While this simplification may be appropriate for hyperarid areas, it can overestimate emissions over arid and semiarid areas where increased soil wetness and vegetation cover suppress dust mobilization.
Contributions of the arid zone range from 8 % (CESM2-CAM-Kok) to 37 % (UKESM-1.0), indicating substantial model discrepancies compared to the hyperarid zone. The discrepancies become even larger over the semiarid zone, where the emission fraction ranges from less than 1 % to 18 %. Particularly, four models allocate more than 10 % to the semiarid zone: CanESM5.0 (16 %), CanESM5.1 (18 %), INM-CM5.0 (15 %), and UKESM1.0 (12 %). Overall, as the climate regime transitions from hyperarid to semiarid, model-estimated dust source strengths become less consistent, revealing increasing uncertainty in how ESMs represent dust sensitivity to hydroclimate conditions.
Among the ESMs, CESM2-CAM-Zender and CESM2-WACCM-Zender produce nearly identical total emissions and spatial patterns, suggesting that the choice between CAM and WACCM atmospheric components has minimal effect. The paired CESM and E3SM experiments, however, show opposite tendencies: contributions of the hyperarid zone increase from 61 % in CESM2-CAM-Zender to 88 % in CESM2-CAM-Kok, but slightly decrease from 63 % in E3SM2-Zender to 58 % in E3SM3-Kok. The GISS-E2 models produce consistent distributions across different climate zones, although total emissions are about 40 % lower when using the MATRIX aerosol scheme, possibly due to parameter tunings or underrepresentation of coarse dust (diameter > 5 µm) in the MATRIX modal size distribution, as noted in Bauer et al. (2022).
UKESM1.0 emits nearly twice as much dust as HadGEM3-GC3.1, and exhibits slightly more uniform spatial distributions. As described in Woodward et al. (2022), UKESM1.0 is built upon HadGEM3-GC3.1 but applies parameter tunings that enhance friction velocity and suppress soil moisture, effectively increasing the wind gustiness and soil aridity, leading to more emissions in UKESM1.0. The three Japanese models (MRI-ESM2.0, MIROC-ES2L, and MIROC6) also differ markedly in total emissions and, to a lesser extent, spatial distributions. MRI-ESM2.0 produces similar regional fractions to JRAero but nearly doubles the total amount. Despite using the same dust parameterization, MIROC-ES2L emits roughly five times more dust than MIROC6. This discrepancy can be largely explained by stronger winds in MIROC-ES2L, which produces 50 % higher global mean wind speed than MIROC6. Moreover, MIROC6 prescribes non-zero LAI even in hyperarid areas, likely further suppressing dust generation relative to MIROC-ES2L (Hiroaki Tatebe, personal communications, 2025).
3.2 Interannual variability
This section examines the consistency of ESMs in simulating the interannual variability of dust emissions. Monthly dust emission fluxes from all ESMs are first regridded to a common resolution of 0.9° × 1.25° (the native grid of CESM2). To remove the influence of annual cycles, month-wise climatological means are subtracted from each grid cell to calculate deseasonalized dust emission flux anomalies. Spearman’s rank correlation coefficients are then calculated between the monthly anomalies for every possible model pair. With 21 ESMs, this results in 210 pairwise comparisons. To quantify the overall model agreement, we calculate the percentage of model pairs exhibiting statistically significant (p≤0.1), positive correlations. A higher percentage indicates stronger model agreement in simulating the dust variability, and vice versa. The results are displayed in Fig. 4.
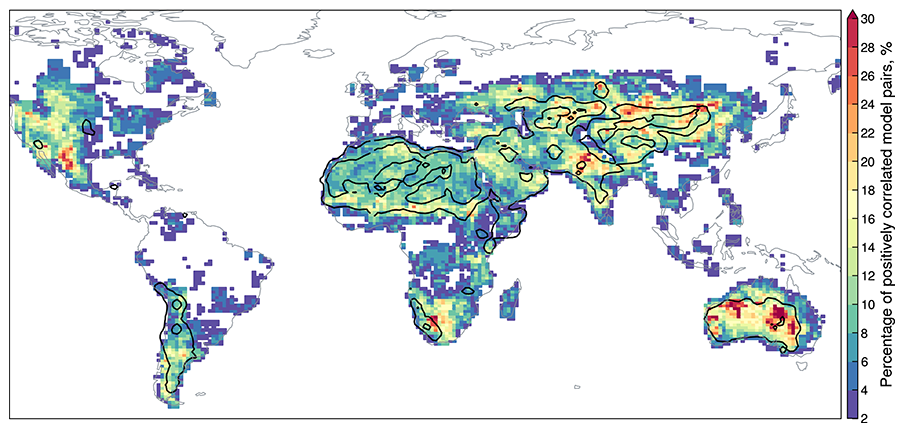
Figure 4Percentage of statistically significant (p≤0.1), positive correlations out of 210 pairwise comparisons of deseasonalized monthly dust emission fluxes from 21 Earth system models. Black contours indicate the model ensemble mean emission flux of 10 and 100 Tg yr−1.
Despite its dominant contribution to global dust emissions, the hyperarid zone exhibits poor model agreement, with generally less than 10 % of pairwise comparisons showing statistically significant positive correlations. Because dust emissions from hyperarid areas are predominantly controlled by near-surface wind speed, this poor agreement reflects inconsistent wind simulations among the ESMs. Indeed, we find that only 10 % of model pairs produce positively correlated monthly mean wind speed anomalies. Similarly, Evan (2018) reported that dust-producing winds over the Sahara Desert are driven by large-scale meteorological processes and that most CMIP5 models failed to capture the near-surface wind variability. These results suggest that improving near-surface wind simulations can potentially reduce discrepancies in simulating the dust emission variability over hyperarid regions.
In contrast to the hyperarid zone, arid and semiarid zones – such as the Sahel, South Asia, East and Central Asia, Australia, and North America – exhibit significantly better agreement. To further assess how model consistency varies with aridity, Fig. 5 presents pairwise correlation matrices based on dust emission flux anomalies averaged over hyperarid, arid, and semiarid zones. The percentage of statistically significant, positively correlated model pairs increases from 9 % in the hyperarid zone to 13 % in the arid zone and 16 % in the semiarid zone. Meanwhile, the semiarid zone shows a larger percentage of negatively correlated model pairs (16 %) than the hyperarid (6 %) and arid (7 %) zones. This dual pattern suggests that as the climate regime transitions from hyperarid to semiarid, the ESMs exhibit both stronger agreement and heightened disagreement in simulating the interannual variability of dust emissions.
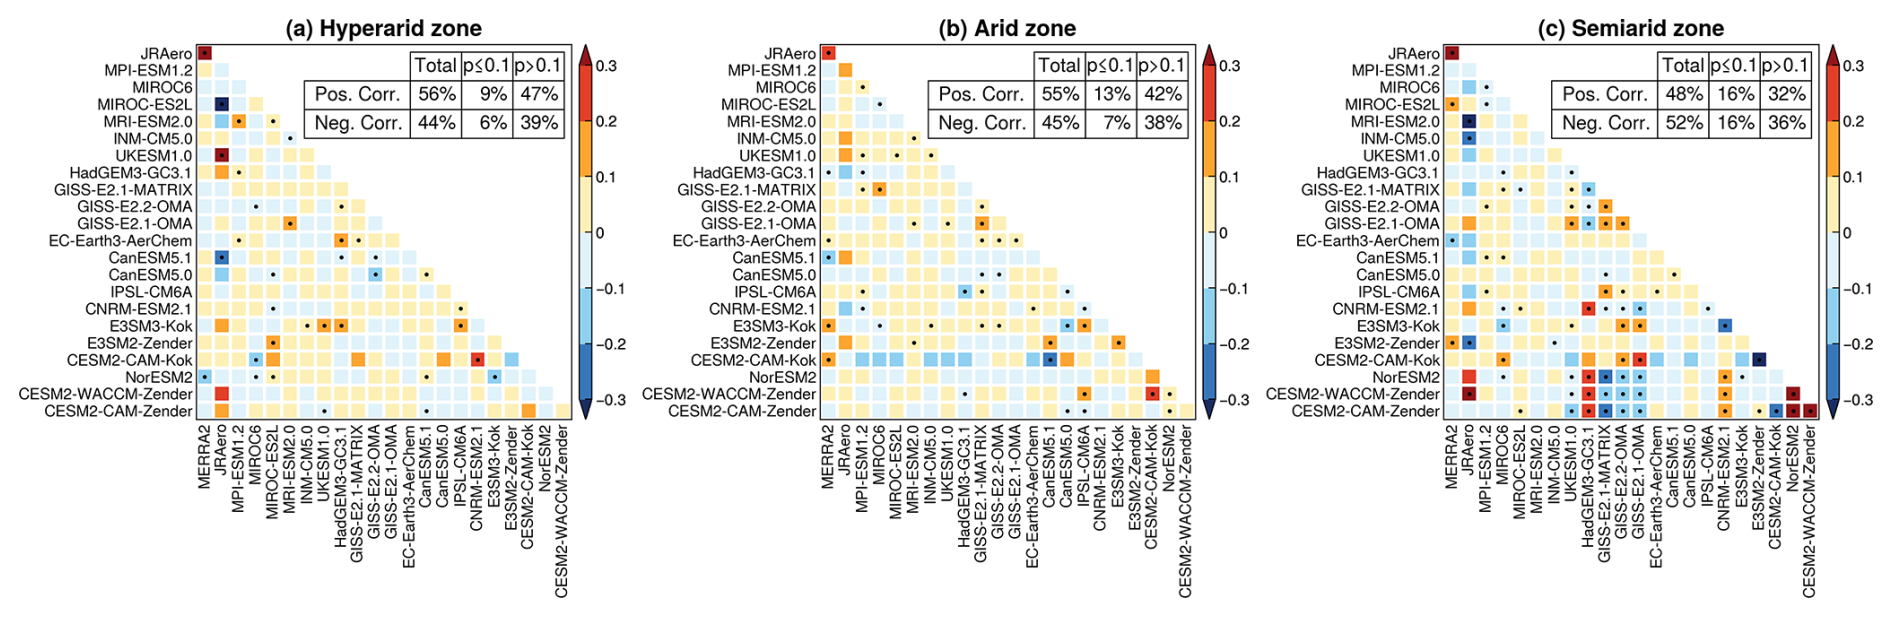
Figure 5Spearman's rank correlation coefficients between dust emission flux anomalies averaged over hyperarid, arid, and semiarid climate zones. Dots indicate statistically significant correlations (p≤0.1). Summary tables are based on Earth system models only (MERRA-2 and JRAero not included).
This behavior can be explained by the influence of antecedent land surface conditions on sediment erodibility in semiarid environment such as temperate grasslands and steppes (Shinoda and Nandintsetseg, 2011; Nandintsetseg and Shinoda, 2015). In these regions, factors such as precipitation, soil moisture, and vegetation growth–decay cycles have lagged and long-lasting effects on sediment erodibility. For example, dry anomalies during the wet season, such as reduced rainfall or earlier snowmelt, can reduce soil inter-particle cohesion and suppress vegetation growth, thereby prolonging bare soil exposure and increasing the wind erosion risk. This delayed response exemplifies the land surface memory effect, in which the slow adjustment of soil and vegetation conditions over weeks to months influences subsequent dust emission potentials long after the initial hydroclimate forcing (e.g., drought). Therefore, we hypothesize that the simultaneous increase in both model agreement and disagreement from hyperarid to semiarid zones reflects a “double-edged sword” effect of land surface memory: models with coherent representations of hydroclimate variability tend to converge in the simulated dust variability (i.e., more positive correlations), whereas those with divergent hydroclimate representations diverge in the dust variability (i.e., more negative correlations).
To verify this hypothesis, we examine the statistical association between pairwise model correlations in dust emissions and those in hydroclimate variability. Specifically, we perform a principal component analysis (PCA) of the five hydroclimate variables (i.e., precipitation, soil moisture, specific humidity, air temperature, LAI) separately for the hyperarid, arid, and semiarid zones. The leading principal component (PC1), which explains at least 40 % of the total variance in all zones, is used as a proxy for the dominant hydroclimate variability. Spearman’s rank correlation coefficients are then computed for all pairwise comparisons of deseasonalized monthly PC1 values, following the same approach as in Fig. 5.
Figure 6 compares the correlation coefficients for model pairs with the same sign (i.e., both positive or both negative) in dust emission fluxes and hydroclimate PC1. The regression slope and coefficient of determination (r2) quantify the degree of statistical association between inter-model correlations in dust emission and hydroclimate variability. The positive relationships across all climate zones suggest that ESMs with stronger consensus in hydroclimate variability also tend to produce more consistent dust variability. More importantly, the number of significantly correlated model pairs (N) and correlation strength (slope and r2) show significant increases from hyperarid to semiarid zones. This finding supports our hypothesis on the dual role of land surface memory: it tends to improve agreement among ESMs with coherent hydroclimate representations, while simultaneously amplifying disagreement among those with divergent hydroclimate variability.
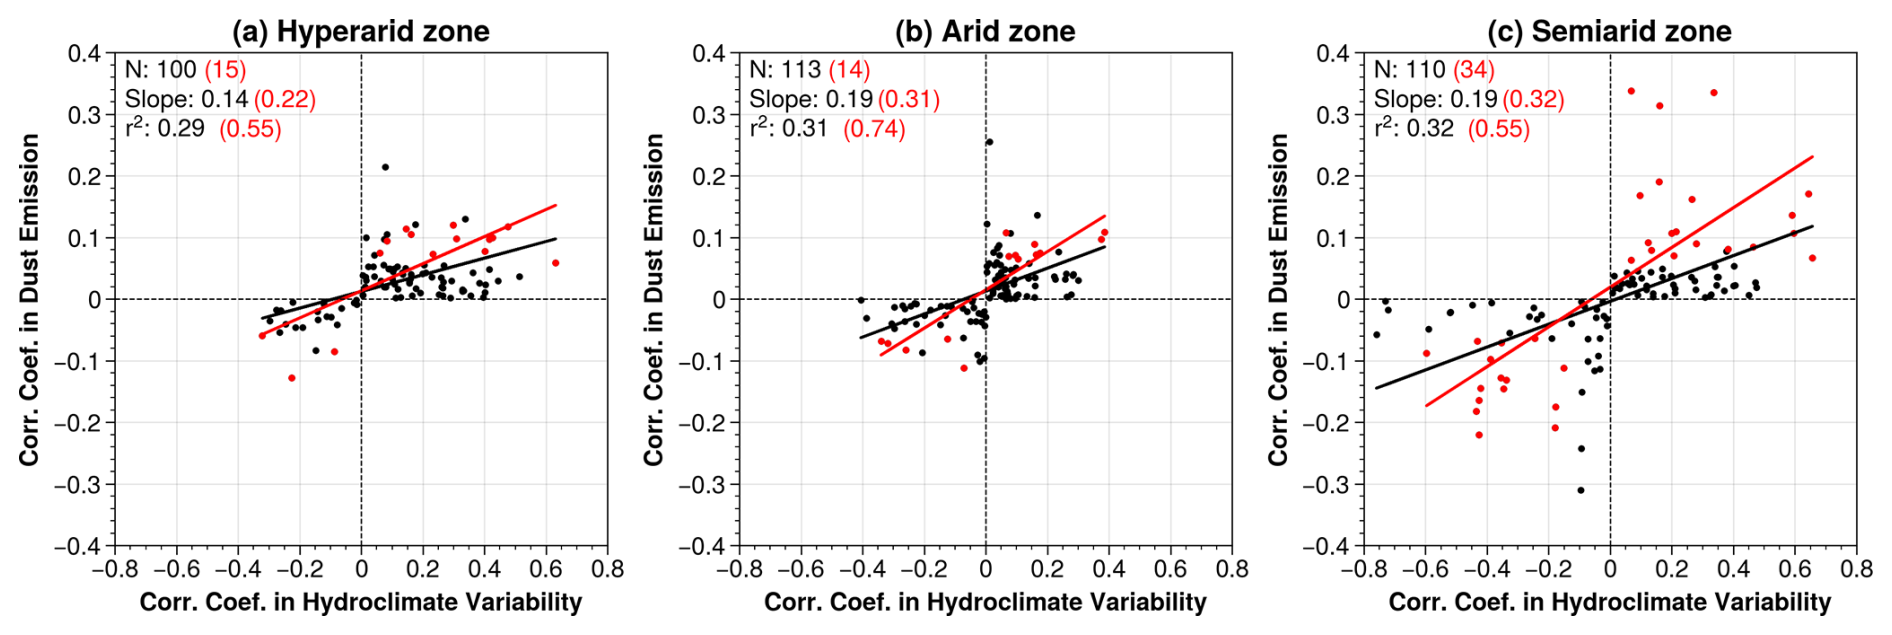
Figure 6Statistical associations between pairwise model correlation coefficients (p≤0.1 shown in red) in dust emission fluxes and hydroclimate variability over (a) hyperarid, (b) arid, and (c) semiarid climate zones.
3.3 Relative importance of wind speed versus hydroclimate drivers
In this section, we present dominance analysis results on the joint and relative influences of wind speed and hydroclimate drivers on the simulated dust variability within individual ESMs. Figure 7 shows the total R2 by the six predictors combined. Results for CESM2-WACCM-Zender and NorESM2 are very similar to those for CESM2-CAM-Zender and thus not shown. The ESMs show large discrepancies in the total R2, reflecting inherent differences in the coupling strength between dust emission and the selected predictors. When ranked by the global mean R2, CanESM5.0 and CanESM5.1 show the lowest explanatory power of the selected predictors, followed by MPI-ESM1.2, MIROC6, and EC-Earth3-AerChem. The low total R2 can be explained by several factors. We only consider six common predictors and may omit other predictors that are specific to some models (such as stem area index). Model biases (see Sect. 3.1) may weaken or distort the relationship between dust emission and its physical drivers. Using simplified parameterizations and/or static land surface input can reduce the dust sensitivity to hydroclimate conditions. In addition, because dust emission is governed by highly nonlinear threshold processes, its dependence on the predictors may deviate from the linear assumption underlying dominance analysis. As shown in Fig. 7, total R2 values are generally lower in arid and semiarid areas than in hyperarid areas, likely due to increased nonlinearity between dust emission and hydroclimate variables that diminishes the explanatory power of multilinear regression.
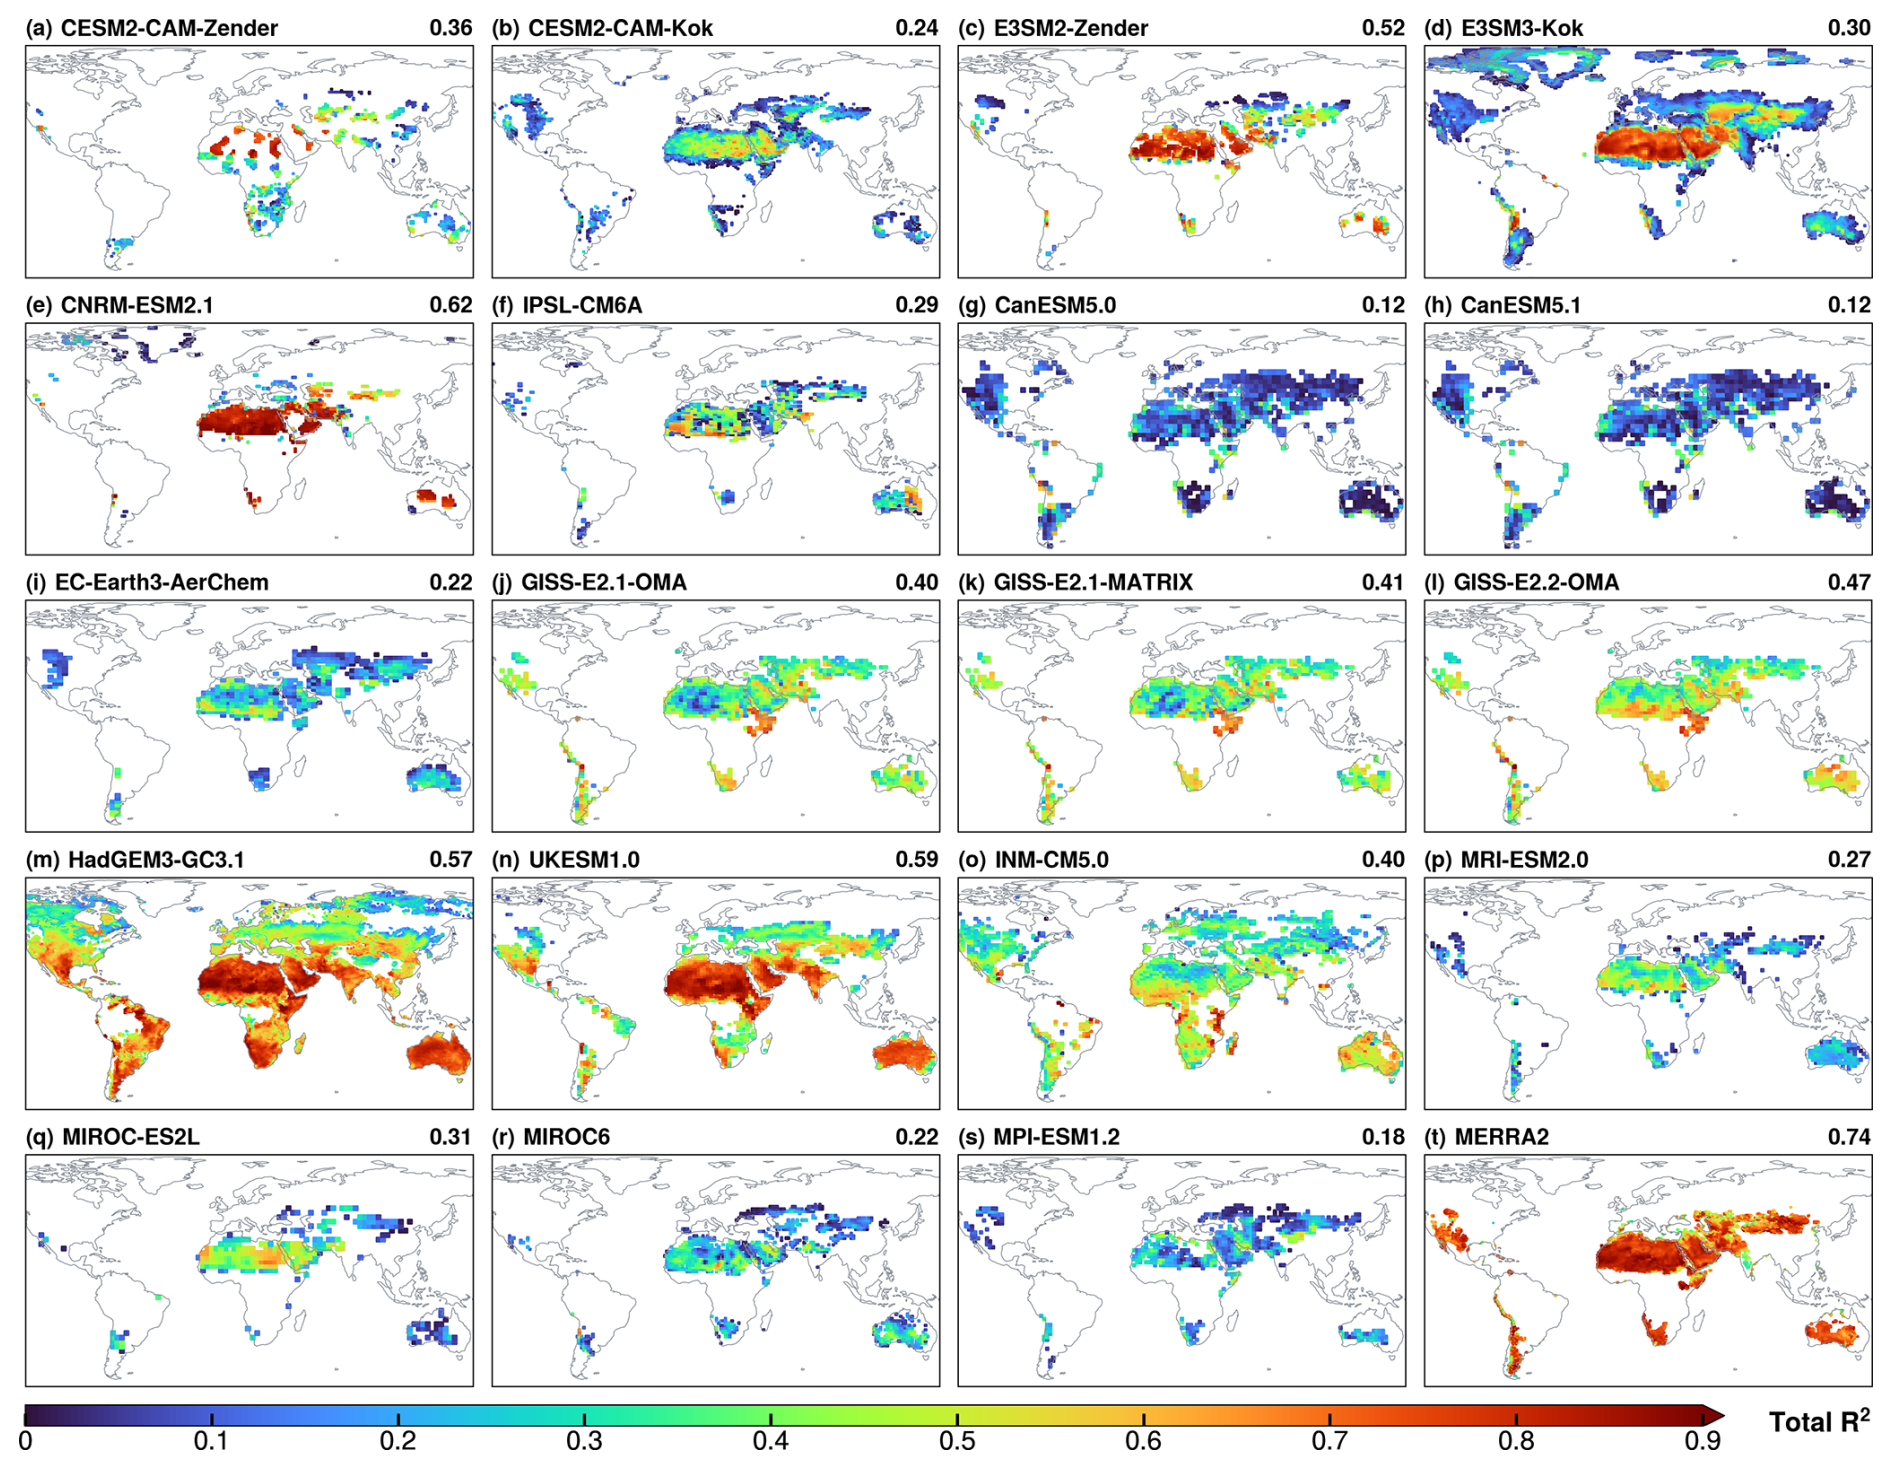
Figure 7Total explained variance (R2) in dust emission fluxes by six near-surface predictors (wind speed, precipitation, soil moisture, specific humidity, air temperature, and LAI) in Earth system models and MERRA-2. Global mean R2 values are shown on each panel.
Despite these limitations, most ESMs produce significant total R2 values, especially in hyperarid areas with R2 generally above 0.5. Replacing the Zender with the Kok dust scheme generally reduces the total R2 in both CESM and E3SM (Fig. 7a–d). GISS-E2 models show little differences between the OMA and MATRIX aerosol schemes, and a modest increase from version 2.1 to 2.2. UKESM1.0 and HadGEM3-GC3.1 show minimal differences, both showing high R2 values globally. MIROC6 yields lower R2 than MIROC-ES2L, particularly in hyperarid areas. MERRA-2 produces higher R2 than most ESMs, especially in arid and semiarid zones, indicating stronger coupling between dust emission and the selected predictors.
Figure 8 presents the ratio of the wind-associated R2 to the combined R2 of five hydroclimate variables (precipitation, soil moisture, specific humidity, air temperature, and LAI). In all ESMs, the wind-to-hydroclimate R2 ratio is well above 1 over hyperarid areas, which is consistent with the parameterization of vertical dust flux as a power-law function of wind speed in all models, and the expectation that dust emission from permanently dry and sparsely vegetated surfaces is primarily controlled by wind speed. In contrast, arid and semiarid areas exhibit much larger inconsistency, with ratios either above or below 1 depending on the model. This behavior may be due to inconsistent representations of hydroclimate controls on sediment erodibility, which in turn leads to disagreement in the relative importance of wind versus hydroclimate drivers. For example, most ESMs incorporate soil moisture as a correction to the erosion threshold velocity albeit using different formulations, while INM-CM5.0 treats soil moisture as a simple threshold above which dust emission is switched off. Such inconsistencies inevitably produce varying coupling strengths between dust emission and hydroclimate variables across models.
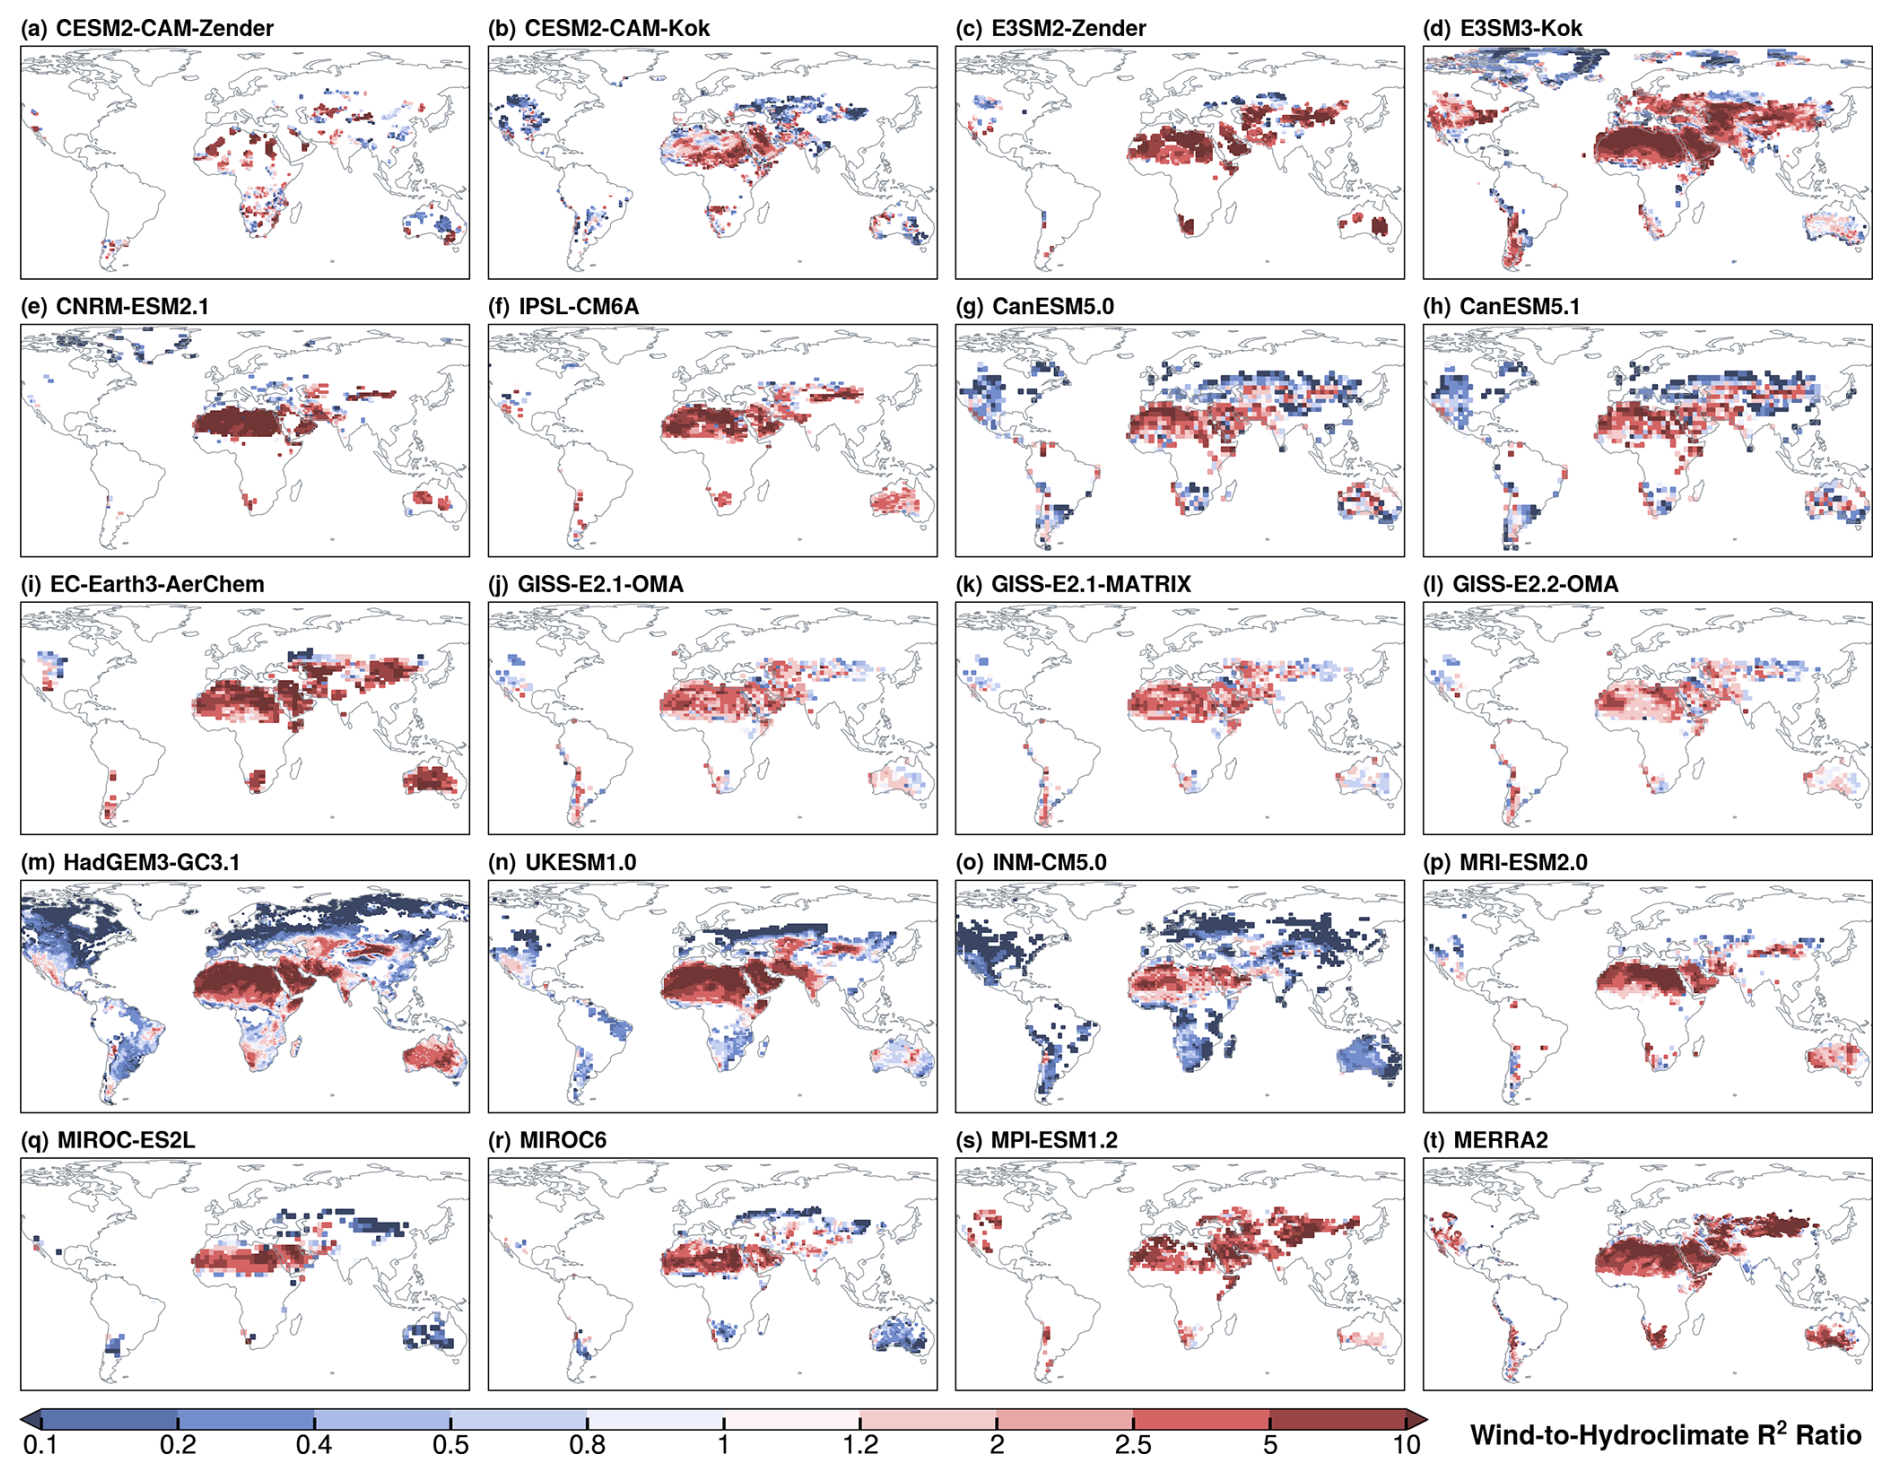
Figure 8The ratio of wind-associated R2 to the combined R2 of five hydroclimate variables (precipitation, soil moisture, specific humidity, air temperature, and LAI) in Earth system models and MERRA-2.
Based on the wind-to-hydroclimate R2 ratios, we classify global dust-emitting areas into three regimes: wind-dominated (ratio > 1.2), hydroclimate-dominated (ratio < 0.8), and equally-important (0.8–1.2). Then we calculate the fractions of dust emissions from these regimes within each model. The results are displayed in Fig. 9. The ESMs show general agreement in the “equally-important” regime, with most models simulating less than 10 % from regions where wind and hydroclimate drivers have nearly equal contributions.
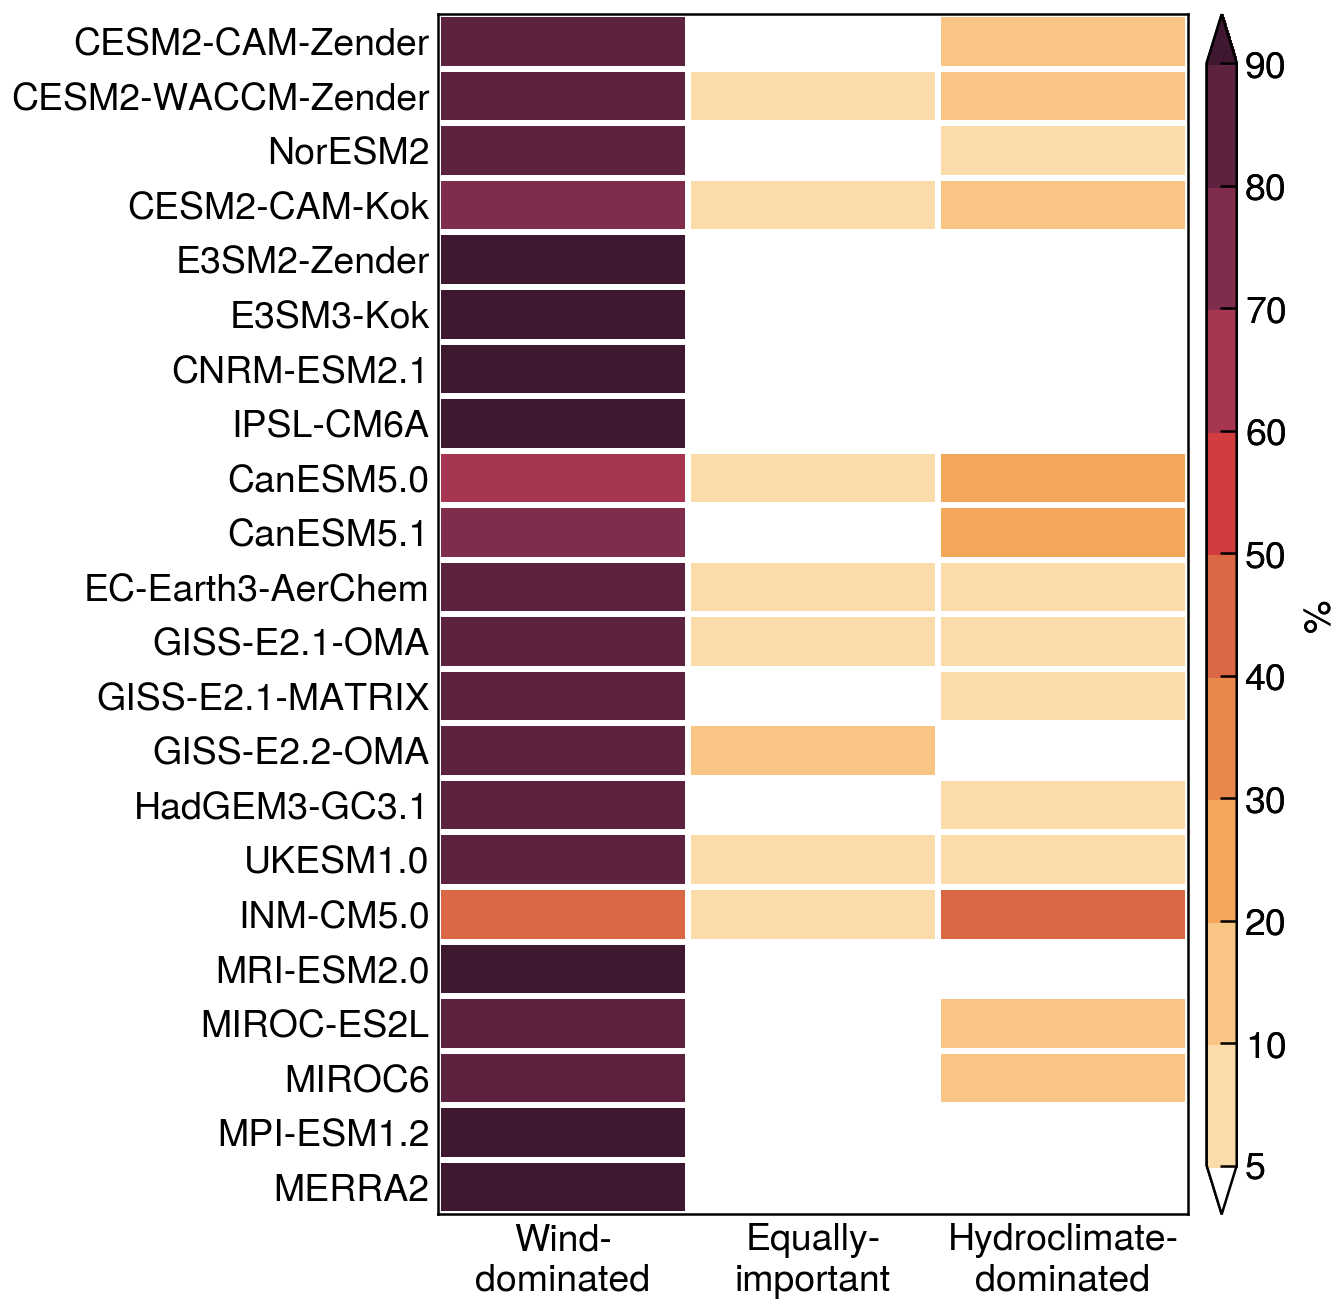
Figure 9Fractional contributions of wind-dominated, equally-important, and hydroclimate-dominated regimes to global dust emissions in Earth system models and MERRA-2.
The wind-dominated regime accounts for more than 80 % dust emissions in most ESMs, consistent with the dominant contribution of the hyperarid zone (Fig. 3). Two models yield significantly lower estimates: INM-CM5.0 (43 %) and CanESM5.0 (65 %). As shown in Fig. 3, these models simulate relatively homogeneous emission patterns, which consequently diminishes the relative contributions from wind-dominated regions compared with other models. For CESM and E3SM, replacing the Zender with Kok dust scheme slightly reduces the wind-dominated dust fraction: from 85 % to 79 % in CESM, and from 99 % to 96 % in E3SM. The three GISS-E2 models yield similar results, with 87 %–90 % dust from the wind-dominated regime. Likewise, UKESM1.0 and HadGEM3-GC3.1 yield nearly identical estimates, with 90 % of dust from wind-dominated regions. MERRA-2 simulates 98 % emissions from wind-dominated areas, higher than most ESMs. Three models produce significantly higher contributions from semiarid areas than others: CanESM5.0 (29 %), CanESM5.1 (21 %), and INM-CM5.0 (49 %).
To further assess the relative importance of wind speed versus hydroclimate drivers, we compute the fractional contributions of wind speed to the total R2 at each model grid cell. The statistical distributions of grid-level wind-associated R2 fractions are displayed in Fig. 10. In Fig. 10, if the median wind-associated R2 fraction exceeds 50 %, it indicates that wind speed dominates dust variability at more than half of the grid cells within a climate zone. Conversely, if the median falls below 50 %, hydroclimate drivers exert dominant control over the majority of grid cells.
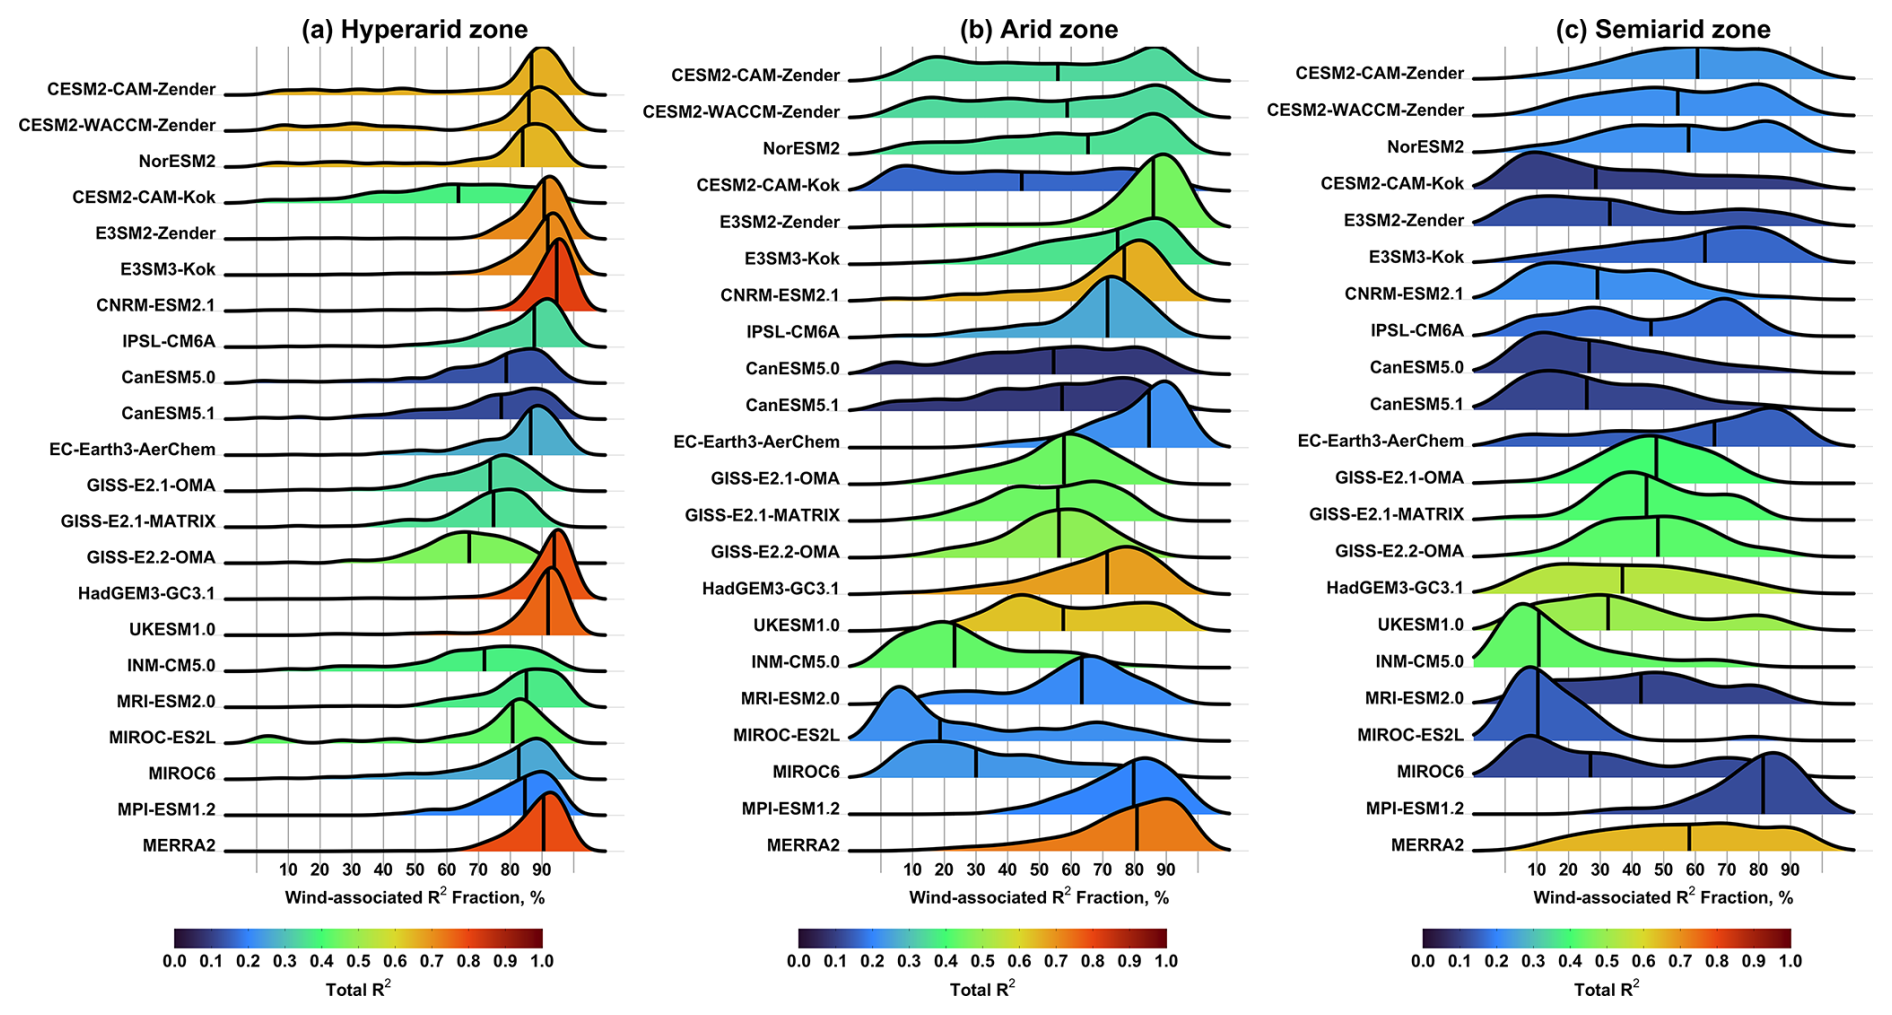
Figure 10Ridgeline plots for the fractional contributions of wind speed to the total R2 over (a) hyperarid, (b) arid, and (c) semiarid climate zones. Black vertical lines indicate median values. Color shading represents mean total R2 values.
In the hyperarid zone (Fig. 10a), the majority of ESMs capture the dominant wind control, with median wind-associated R2 fractions exceeding 80 %. The three GISS-E2 models display slightly lower wind contributions (67 %–74 %). In contrast, CESM2-CAM-Kok exhibits greater spatial variability and lower wind influence with a median wind-associated R2 fraction of 63 %, consistent with the model's elevated hydroclimate influence over West Africa and the Tarim Basin as shown in Fig. 8b. Compared to CESM2-CAM-Kok, CESM2-CAM-Zender captures the expected wind dominance with a median of 87 %. The enhanced hydroclimate influence in CESM2-CAM-Kok relative to CESM2-CAM-Zender persists even when comparing common dust-emitting areas in these two models.
In the arid zone (Fig. 10b), total R2 values are generally lower, again reflecting reduced explanatory power of the selected predictors. The ESMs exhibit greater discrepancies in the relative importance of wind speed versus hydroclimate drivers in the arid zone. Specifically, wind speed remains the dominant driver of dust variability in most ESMs, despite increased spatial variability. The three GISS-E2 models simulate nearly equal wind and hydroclimate influences. INM-CM5.0, MIROC-ES2L and MIROC6 produce median wind-associated R2 fractions well below 50 %, signifying a transition from wind- to hydroclimate-dominated regimes. CESM2-CAM-Kok also displays this transition, although to a smaller extent with a median of 44 % and large spatial variability. In both CESM and E3SM, replacing the Zender with Kok dust scheme weakens the wind influence and strengthens the hydroclimate influence, with the median wind-associated R2 fraction declining from 56 % to 44 % in CESM and from 86 % to 74 % in E3SM. This is somewhat consistent with previous findings that the more physically based sediment erodibility formulations in the Kok scheme enhance the dust sensitivity to climate variability relative to the Zender scheme (Kok et al., 2014a).
Results for the semiarid zone (Fig. 10c) are considered less robust due to significantly smaller dust-emitting areas (see Fig. 1). Overall, the contribution of wind speed further weakens, while hydroclimate drivers become more important. The resulting change of predictor relative importance, however, varies considerably. Specifically, four models (CESM2-CAM-Zender, E3SM3-Kok, EC-Earth3-AerChem and MPI-ESM1.2) retain the wind dominance, albeit with increased spatial variability. Hydroclimate dominance persists and strengthens in CESM2-CAM-Kok, INM-CM5.0, MIROC-ES2L and MIROC6, consistent with their behaviors in the arid zone. In contrast, the following models transition from wind- to hydroclimate-dominated regimes: E3SM2-Zender, CNRM-ESM2.1, CanESM5.0, CanESM5.1, HadGEM3-GC3.1, UKESM1.0 and MRI-ESM2.0. GISS-E2 models and IPSL-CM6A exhibit moderate increases of hydroclimate influence, resulting in roughly equal importance of wind and hydroclimate drivers. Compared to the ESMs, MERRA-2 generally produces dominant wind influence across all three climate zones.
To identify the sources of hydroclimate influence in the ESMs, Fig. 11 presents the median fractional contributions of five hydroclimate variables to the total R2 in each model. The contribution attributed to specific humidity can largely be interpreted as a soil moisture effect, given the strong coupling between near-surface humidity and surface soil water content through evapotranspiration. In hyperarid regions, dust variability is expected to be dominated by wind speed, with minimal hydroclimate influence. Thus, anomalously large hydroclimate contributions in some ESMs may be explained by two possible mechanisms: (1) the model overestimates hydroclimate variability, thereby producing spurious correlations with dust emissions regardless of whether the hydroclimate variable is explicitly used in the dust parameterizations; and (2) the model reasonably represents hydroclimate variability but overestimates dust sensitivity to the hydroclimate variable, indicating a potential bias in the parameterization itself. Understanding the causes for the statistically inferred predictor influences would require detailed knowledge of the physical parameterizations and model configurations specific to each ESM.
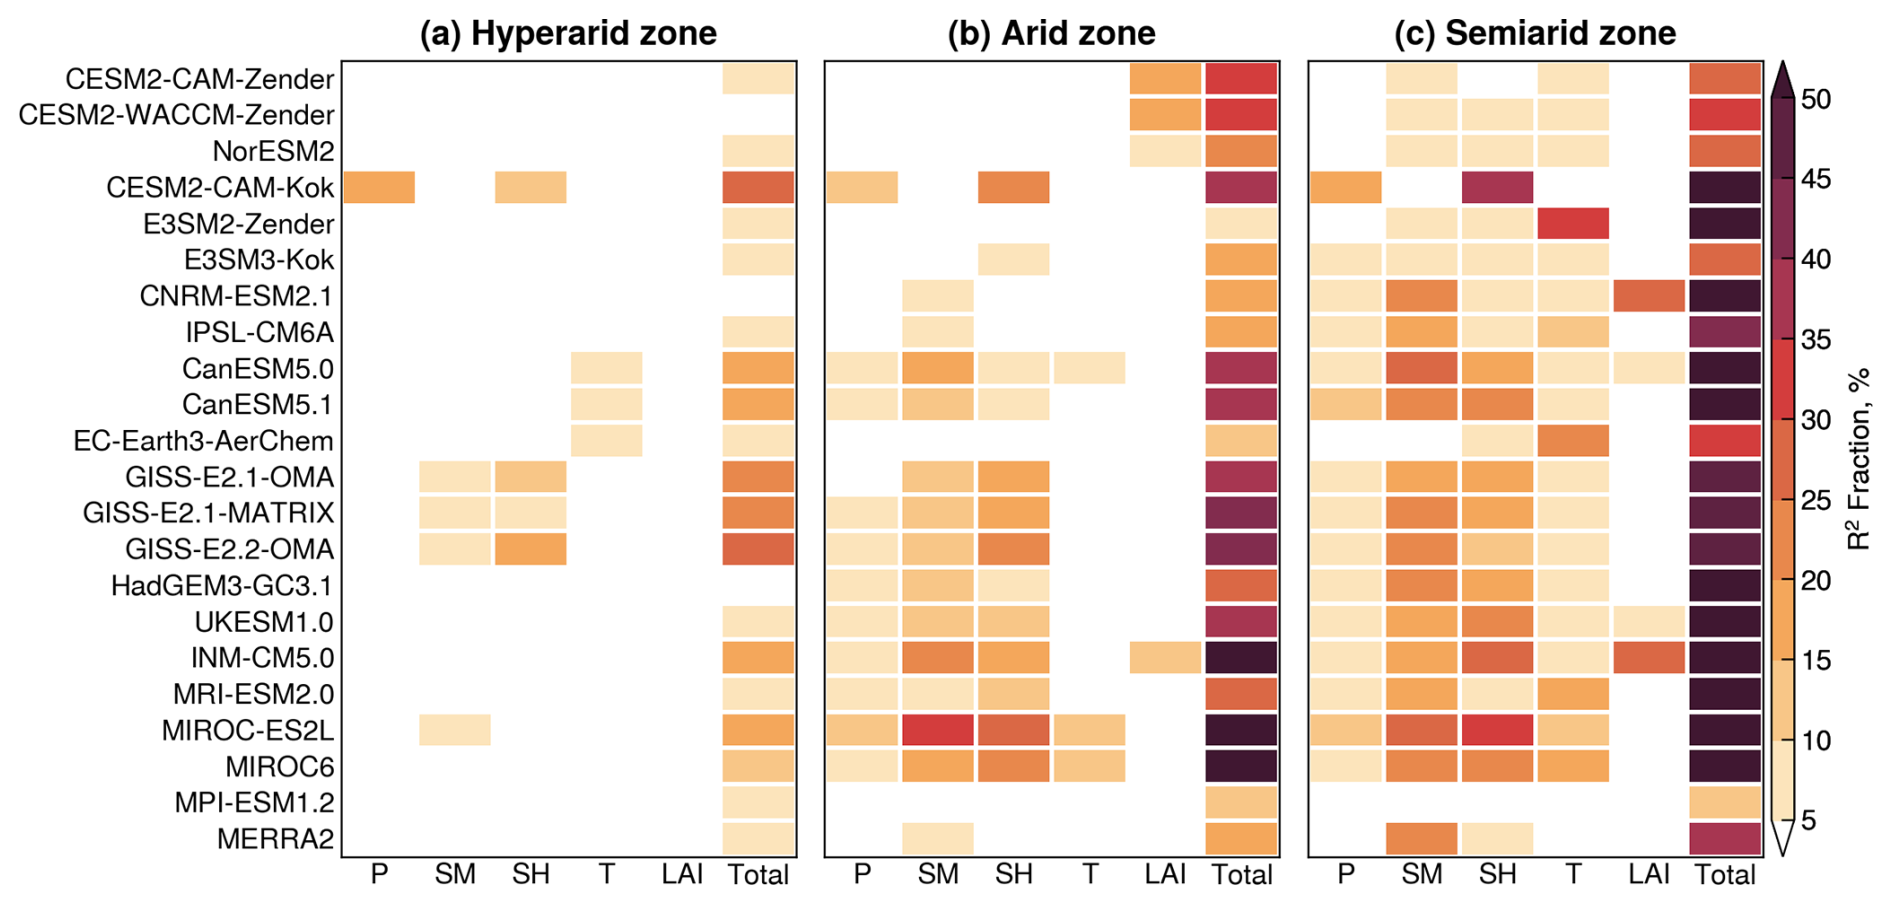
Figure 11Median factional contributions of hydroclimate drivers to the total explained variance (R2) in Earth system models and MERRA-2 over (a) hyperarid, (b) arid, and (c) semiarid climate zones. Hydroclimate variables are precipitation (P), soil moisture (SM), specific humidity (SH), air temperature (T), and leaf area index (LAI).
In the hyperarid zone, the hydroclimate influence in CESM2-CAM-Kok is associated with precipitation and specific humidity, which may partly reflect the increased dust sensitivity to soil moisture in the Kok scheme relative to the Zender scheme (Kok et al., 2014a). Another possible reason is the short simulation period for CESM2-CAM-Kok (2004–2013), which may not adequately capture the full range of dust variability and predictor relationships as in CESM2-CAM-Zender (1980–2014). In this regard, the E3SM experiments provide a more robust comparison between the two dust schemes. As shown in Fig. 11a, both E3SM2-Zender and E3SM3-Kok produce the expected negligible hydroclimate influence in the hyperarid zone. In the arid zone, however, E3SM3-Kok exhibits stronger hydroclimate influence than E3SM2-Zender, consistent with previous findings that the Kok scheme amplifies the dust sensitivity to hydroclimate conditions compared to the Zender scheme (Kok et al., 2014a). GISS models exhibit elevated influences from specific humidity and soil moisture, which explains their moderate wind contributions as shown in Fig. 10a.
In the arid zone (Fig. 11b), the enhanced hydroclimate influence is primarily associated with soil moisture and specific humidity in most ESMs, consistent with their well-established roles in modulating sediment erodibility (e.g., Csavina et al., 2014; Ravi et al., 2006; Kim and Choi, 2015). Several models – including CESM and INM-CM5.0 – attribute strong influences to LAI. Unlike other hydroclimate variables, LAI may be prescribed from climatology or interactively simulated by dynamic vegetation model components (Table 1). Models using prescribed LAI typically exhibit limited interannual variability in vegetation cover and therefore weak influence on dust emissions. For CESM and INM-CM5.0, the elevated LAI influence can be explained by their parameterizations of the bare soil fraction as a function of LAI.
This study examines discrepancies among 21 ESMs in representing the interannual variability of windblown dust emissions and the relative importance of near-surface wind speed versus five hydroclimate drivers (precipitation, soil moisture, specific humidity, air temperature, and LAI) across different climate aridity zones (hyperarid, arid, and semiarid). Recognizing the unconstrained, model-specific nature of dust emission fluxes, we use the dominance analysis technique to quantify the relative influence of a common set of six physical drivers within each model.
The extent of inter-model agreement in dust variability varies strongly with climate aridity. In the hyperarid zone, the ESMs exhibit poor agreement, with only 9 % out of 210 pairwise comparisons showing statistically significant positive correlations, reflecting large inconsistencies in model-simulated near-surface wind speeds. In arid and semiarid zones, the ESMs exhibit a dual pattern driven by a “double-edged sword” effect of land surface memory: models with coherent representations of hydroclimate variability tend to converge in their simulated dust variability, whereas those with divergent hydroclimate representations diverge in dust emission responses.
The relative importance of wind speed versus hydroclimate drivers also varies with climate aridity. In hyperarid areas, most ESMs capture the expected dominance of wind speed and minimal hydroclimate influence. CESM2-CAM-Kok exhibits elevated influences from precipitation and specific humidity, which may partly result from the more physically based sediment erodibility formulations in the Kok et al. (2014b) scheme relative to the Zender et al. (2003) dust emission scheme. A similar behavior is found in E3SM, where replacing the Zender et al. (2003) scheme with the Kok et al. (2014b) scheme reduces the wind dominance and enhances the hydroclimate influence on dust emission. Due to confounding model changes in the CESM and E3SM experiments, however, targeted experiments will be needed to isolate the effect of dust parameterization choice on the dust sensitivity. In arid and semiarid areas, wind influence generally weakens while hydroclimate influence strengthens in all ESMs. However, the relative importance between the two becomes less consistent, with contrasting model behaviors in retaining wind dominance or shifting toward hydroclimate dominance or near-equal importance. Compared to the ESMs, the MERRA-2 aerosol reanalysis generally produce stronger wind influence and weaker hydroclimate influence across all climate aridity regimes.
Note that the physical drivers considered in this study may not fully represent all the dust emission driving factors for specific emission schemes; instead, we focus on a common set of drivers for all models to provide a fair comparison across the ESMs. Therefore, the inferred relative importance from this analysis is limited to those common drivers considered and their influences on dust emissions in different models. Also, because of the statistical nature of dominance analysis, the predictor importance results shall be interpreted with caution when linking to model parameterizations. Despite these limitations, this study introduces a new framework for model intercomparison and yields new insights into how current ESMs represent the variability and physical controls of dust emissions across different climate aridity regimes. Overall, our findings highlight two promising directions for reducing model uncertainties in dust emission simulations: (1) improving the representation of near-surface wind speeds and gustiness in hyperarid regions, and (2) enhancing the representation of hydroclimate and land surface processes that modulate sediment erodibility in arid and semiarid areas.
Model comparison and dominance analysis results are available at https://doi.org/10.5281/zenodo.17666380 (Xi, 2025).
Conceptualization and methodology – Xin Xi; Data curation and analysis – Xinzhu Li, Xin Xi, Longlei Li, Yan Feng; Writing of original draft – Xinzhu Li, Xin Xi. Review and editing of draft – Xinzhu Li, Xin Xi, Longlei Li, Yan Feng.
The contact author has declared that none of the authors has any competing interests.
Publisher's note: Copernicus Publications remains neutral with regard to jurisdictional claims made in the text, published maps, institutional affiliations, or any other geographical representation in this paper. The authors bear the ultimate responsibility for providing appropriate place names. Views expressed in the text are those of the authors and do not necessarily reflect the views of the publisher.
X.L. and X.X. acknowledge support from the NASA Land-Cover and Land-Use Change Program. Y.F. acknowledges the support of the Energy Exascale Earth System Model (E3SM) project, funded by the U.S. Department of Energy (DOE), Office of Science, Office of Biological and Environmental Research, under contract DE‐AC02‐06CH11357. All authors thank the E3SM project team for their efforts in developing and supporting the E3SM. L.L. acknowledges support from DOE under award DE-SC0021302, and from the Earth Surface Mineral Dust Source Investigation (EMIT), a NASA Earth Ventures-Instrument (EVI-4) mission. He also acknowledges the high-performance computing resources provided by Derecho at the National Center for Atmospheric Research (NCAR), through NCAR’s Computational and Information Systems Laboratory (CISL), which is sponsored by the National Science Foundation (NSF). All authors acknowledge the World Climate Research Programme for coordinating and promoting CMIP6, and thank the climate modeling groups for producing and making available their model output, the Earth System Grid Federation (ESGF) for archiving the data and providing access, and the multiple funding agencies who support CMIP6 and ESGF.
This research has been supported by the NASA Land-Cover and Land-Use Change Program (grant no. 80NSSC20K1480).
This paper was edited by Yuan Wang and reviewed by two anonymous referees.
Albani, S., Mahowald, N. M., Perry, A. T., Scanza, R. A., Zender, C. S., Heavens, N. G., Maggi, V., Kok, J. F., and Otto-Bliesner, B. L.: Improved dust representation in the Community Atmosphere Model, Journal of Advances in Modeling Earth Systems, 6, 541–570, https://doi.org/10.1002/2013MS000279, 2015. a
Aryal, Y. N. and Evans, S.: Global Dust Variability Explained by Drought Sensitivity in CMIP6 Models, Journal of Geophysical Research: Earth Surface, 126, https://doi.org/10.1029/2021JF006073, 2021. a
Azen, R. and Budescu, D. V.: The Dominance Analysis Approach for Comparing Predictors in Multiple Regression, Psychological Methods, 8, 129–148, https://doi.org/10.1037/1082-989X.8.2.129, 2003. a
Bagnold, R. A.: The Physics of Blown Sand and Desert Dunes, Springer Dordrecht, 1 edn., ISBN 978-94-009-5684-1, https://doi.org/10.1007/978-94-009-5682-7, 1974. a
Balkanski, Y., Schulz, M., Claquin, T., Moulin, C., and Ginoux, P.: Global Emissions of Mineral Aerosol: Formulation and Validation using Satellite Imagery, in: Emissions of Atmospheric Trace Compounds, edited by Granier, C., Artaxo, P., and Reeves, C. E., Springer, 239–267, https://doi.org/10.1007/978-1-4020-2167-1_6, 2004. a
Bauer, S. E., Tsigaridis, K., Faluvegi, G., Nazarenko, L., Miller, R. L., Kelley, M., and Schmidt, G.: The Turning Point of the Aerosol Era, Journal of Advances in Modeling Earth Systems, 14, https://doi.org/10.1029/2022MS003070, 2022. a
Budescu, D. V.: Dominance analysis: A new approach to the problem of relative importance of predictors in multiple regression, Psychological Bulletin, 114, 542–551, https://doi.org/10.1037/0033-2909.114.3.542, 1993. a
Bullard, J. E. and Livingstone, I.: Interactions between aeolian and fluvial systems in dryland environments, Area, 34, 8–16, https://doi.org/10.1111/1475-4762.00052, 2002. a
Bullard, J. E., Harrison, S. P., Baddock, M. C., Drake, N., Gill, T. E., McTainsh, G., and Sun, Y.: Preferential dust sources: A geomorphological classification designed for use in global dust-cycle models, Journal of Geophysical Research: Earth Surface, 116, https://doi.org/10.1029/2011JF002061, 2011. a
Cowie, S. M., Marsham, J. H., and Knippertz, P.: The importance of rare, high-wind events for dust uplift in northern Africa, Geophysical Research Letters, 42, 8208–8215, https://doi.org/10.1002/2015GL065819, 2015. a
Csavina, J., Field, J., Félix, O., Corral-Avitia, A. Y., Sáez, A. E., and Betterton, E. A.: Effect of wind speed and relative humidity on atmospheric dust concentrations in semi-arid climates, Science of the Total Environment, 487, 82–90, https://doi.org/10.1016/j.scitotenv.2014.03.138, 2014. a
Engelstaedter, S., Kohfeld, K. E., Tegen, I., and Harrison, S. P.: Controls of dust emissions by vegetation and topographic depressions: An evaluation using dust storm frequency data, Geophysical Research Letters, 30, https://doi.org/10.1029/2002GL016471, 2003. a
Evan, A. T.: Surface Winds and Dust Biases in Climate Models, Geophysical Research Letters, 45, 1079–1085, https://doi.org/10.1002/2017GL076353, 2018. a, b
Evan, A. T., Flamant, C., Fiedler, S., and Doherty, O.: An analysis of aeolian dust in climate models, Geophysical Research Letters, 41, 5996–6001, https://doi.org/10.1002/2014GL060545, 2014. a
Evans, S., Ginoux, P., Malyshev, S., and Shevliakova, E.: Climate-vegetation interaction and amplification of Australian dust variability, Geophysical Research Letters, 43, 11,823–11,830, https://doi.org/10.1002/2016GL071016, 2016. a
Feng, Y., Wang, H., Rasch, P. J., Zhang, K., Lin, W., Tang, Q., Xie, S., Hamilton, D. S., Mahowald, N., and Yu, H.: Global Dust Cycle and Direct Radiative Effect in E3SM Version 1: Impact of Increasing Model Resolution, Journal of Advances in Modeling Earth Systems, https://doi.org/10.1029/2021MS002909, 2022. a, b
Fécan, F., Marticorena, B., and Bergametti, G.: Parametrization of the increase of the aeolian erosion threshold wind friction velocity due to soil moisture for arid and semi-arid areas, Ann. Geophys., 17, 149–157, https://doi.org/10.1007/s00585-999-0149-7, 1999. a
Gelaro, R., McCarty, W., Suárez, M. J., Todling, R., Molod, A., Takacs, L., Randles, C. A., Darmenov, A., Bosilovich, M. G., Reichle, R., Wargan, K., Coy, L., Cullather, R., Draper, C., Akella, S., Buchard, V., Conaty, A., Silva, A. M. d., Gu, W., Kim, G. K., Koster, R., Lucchesi, R., Merkova, D., Nielsen, J. E., Partyka, G., Pawson, S., Putman, W., Rienecker, M., Schubert, S. D., Sienkiewicz, M., and Zhao, B.: The modern-era retrospective analysis for research and applications, version 2 (MERRA-2), Journal of Climate, 30, 5419–5454, https://doi.org/10.1175/JCLI-D-16-0758.1, 2017. a, b
Gettelman, A., Mills, M. J., Kinnison, D. E., Garcia, R. R., Smith, A. K., Marsh, D. R., Tilmes, S., Vitt, F., Bardeen, C. G., McInerny, J., Liu, H. L., Solomon, S. C., Polvani, L. M., Emmons, L. K., Lamarque, J. F., Richter, J. H., Glanville, A. S., Bacmeister, J. T., Phillips, A. S., Neale, R. B., Simpson, I. R., DuVivier, A. K., Hodzic, A., and Randel, W. J.: The Whole Atmosphere Community Climate Model Version 6 (WACCM6), Journal of Geophysical Research: Atmospheres, 124, 12380–12403, https://doi.org/10.1029/2019JD030943, 2019. a
Ginoux, P., Chin, M., Tegen, I., Prospero, J. M., Holben, B., Dubovik, O., and Lin, S. J.: Sources and distributions of dust aerosols simulated with the GOCART model, Journal of Geophysical Research Atmospheres, 106, 20255–20273, https://doi.org/10.1029/2000JD000053, 2001. a, b, c, d, e, f
Gliß, J., Mortier, A., Schulz, M., Andrews, E., Balkanski, Y., Bauer, S. E., Benedictow, A. M. K., Bian, H., Checa-Garcia, R., Chin, M., Ginoux, P., Griesfeller, J. J., Heckel, A., Kipling, Z., Kirkevåg, A., Kokkola, H., Laj, P., Le Sager, P., Lund, M. T., Lund Myhre, C., Matsui, H., Myhre, G., Neubauer, D., van Noije, T., North, P., Olivié, D. J. L., Rémy, S., Sogacheva, L., Takemura, T., Tsigaridis, K., and Tsyro, S. G.: AeroCom phase III multi-model evaluation of the aerosol life cycle and optical properties using ground- and space-based remote sensing as well as surface in situ observations, Atmospheric Chemistry and Physics, 21, 87–128, https://doi.org/10.5194/acp-21-87-2021, 2021. a, b, c
Hajima, T., Watanabe, M., Yamamoto, A., Tatebe, H., Noguchi, M. A., Abe, M., Ohgaito, R., Ito, A., Yamazaki, D., Okajima, H., Ito, A., Takata, K., Ogochi, K., Watanabe, S., and Kawamiya, M.: Development of the MIROC-ES2L Earth system model and the evaluation of biogeochemical processes and feedbacks, Geoscientific Model Development, 13, 2197–2244, https://doi.org/10.5194/gmd-13-2197-2020, 2020. a, b
Huneeus, N., Schulz, M., Balkanski, Y., Griesfeller, J., Prospero, J., Kinne, S., Bauer, S., Boucher, O., Chin, M., Dentener, F., Diehl, T., Easter, R., Fillmore, D., Ghan, S., Ginoux, P., Grini, A., Horowitz, L., Koch, D., Krol, M. C., Landing, W., Liu, X., Mahowald, N., Miller, R., Morcrette, J.-J., Myhre, G., Penner, J., Perlwitz, J., Stier, P., Takemura, T., and Zender, C. S.: Global dust model intercomparison in AeroCom phase I, Atmospheric Chemistry and Physics, 11, 7781–7816, https://doi.org/10.5194/acp-11-7781-2011, 2011. a, b, c
Kim, D., Chin, M., Yu, H., Diehl, T., Tan, Q., Kahn, R. A., Tsigaridis, K., Bauer, S. E., Takemura, T., Pozzoli, L., Bellouin, N., Schulz, M., Peyridieu, S., Chédin, A., and Koffi, B.: Sources, sinks, and transatlantic transport of North African dust aerosol: A multimodel analysis and comparison with remote sensing data, Journal of Geophysical Research, 119, 6259–6277, https://doi.org/10.1002/2013JD021099, 2014. a
Kim, D., Chin, M., Schuster, G., Yu, H., Takemura, T., Tuccella, P., Ginoux, P., Liu, X., Shi, Y., Matsui, H., Tsigaridis, K., Bauer, S. E., Kok, J. F., and Schulz, M.: Where Dust Comes From: Global Assessment of Dust Source Attributions With AeroCom Models, Journal of Geophysical Research: Atmospheres, 129, e2024JD041377, https://doi.org/10.1029/2024JD041377, Ltd, 2024. a
Kim, H. and Choi, M.: Impact of soil moisture on dust outbreaks in East Asia: Using satellite and assimilation data, Geophysical Research Letters, 42, 2789–2796, https://doi.org/10.1002/2015GL063325, 2015. a, b
Knippertz, P. and Todd, M. C.: Mineral dust aerosols over the Sahara: Meteorological controls on emission and transport and implications for modeling, Reviews of Geophysics, 50, https://doi.org/10.1029/2011RG000362, 2012. a
Kok, J. F., Parteli, E. J. R., Michaels, T. I., and Karam, D. B.: The physics of wind-blown sand and dust, Reports on Progress in Physics, 75, https://doi.org/10.1088/0034-4885/75/10/106901, 2012. a
Kok, J. F., Albani, S., Mahowald, N. M., and Ward, D. S.: An improved dust emission model – Part 2: Evaluation in the Community Earth System Model, with implications for the use of dust source functions, Atmospheric Chemistry and Physics, 14, 13043–13061, https://doi.org/10.5194/acp-14-13043-2014, 2014a. a, b, c, d
Kok, J. F., Mahowald, N. M., Fratini, G., Gillies, J. A., Ishizuka, M., Leys, J. F., Mikami, M., Park, M.-S., Park, S.-U., Van Pelt, R. S., and Zobeck, T. M.: An improved dust emission model – Part 1: Model description and comparison against measurements, Atmospheric Chemistry and Physics, 14, 13023–13041, https://doi.org/10.5194/acp-14-13023-2014, 2014b. a, b, c, d, e, f, g
Kok, J. F., Storelvmo, T., Karydis, V. A., Adebiyi, A. A., Mahowald, N. M., Evan, A. T., He, C., and Leung, D. M.: Mineral dust aerosol impacts on global climate and climate change, Nature Reviews Earth and Environment, 4, 71–86, https://doi.org/10.1038/s43017-022-00379-5, 2023. a
Koster, R. D., Guo, Z., Yang, R., Dirmeyer, P. A., Mitchell, K., and Puma, M. J.: On the nature of soil moisture in land surface models, Journal of Climate, 22, 4322–4335, https://doi.org/10.1175/2009JCLI2832.1, 2009. a
Leung, D. M., Kok, J. F., Li, L., Okin, G. S., Prigent, C., Klose, M., Pérez García-Pando, C., Menut, L., Mahowald, N. M., Lawrence, D. M., and Chamecki, M.: A new process-based and scale-aware desert dust emission scheme for global climate models – Part I: Description and evaluation against inverse modeling emissions, Atmospheric Chemistry and Physics, 23, 6487–6523, https://doi.org/10.5194/acp-23-6487-2023, 2023. a
Li, L., Mahowald, N. M., Kok, J. F., Liu, X., Wu, M., Leung, D. M., Hamilton, D. S., Emmons, L. K., Huang, Y., Sexton, N., Meng, J., and Wan, J.: Importance of different parameterization changes for the updated dust cycle modeling in the Community Atmosphere Model (version 6.1), Geoscientific Model Development, 15, 8181–8219, https://doi.org/10.5194/gmd-15-8181-2022, 2022. a, b
Li, L., Mahowald, N. M., Ageitos, M. G., Obiso, V., Miller, R. L., García-Pando, C. P., Biagio, C. D., Formenti, P., Brodrick, P. G., Clark, R. N., Green, R. O., Kokaly, R., Swayze, G., and Thompson, D. R.: Improved constraints on hematite refractive index for estimating climatic effects of dust aerosols, Communications Earth & Environment, 5, 295, https://doi.org/10.1038/s43247-024-01441-4, 2024. a
Lurton, T., Balkanski, Y., Bastrikov, V., Bekki, S., Bopp, L., Braconnot, P., Brockmann, P., Cadule, P., Contoux, C., Cozic, A., Cugnet, D., Dufresne, J.-L., Éthé, C., Foujols, M.-A., Ghattas, J., Hauglustaine, D., Hu, R.-M., Kageyama, M., Khodri, M., Lebas, N., Levavasseur, G., Marchand, M., Ottlé, C., Peylin, P., Sima, A., Szopa, S., Thiéblemont, R., Vuichard, N., and Boucher, O.: Implementation of the CMIP6 Forcing Data in the IPSL-CM6A-LR Model, Journal of Advances in Modeling Earth Systems, 12, e2019MS001940, https://doi.org/10.1029/2019MS001940, 2020. a
Marticorena, B. and Bergametti, G.: Modeling the atmospheric dust cycle: 1. Design of a soil-derived dust emission scheme, Journal of Geophysical Research, 100, https://doi.org/10.1029/95jd00690, 1995. a
Mauritsen, T., Bader, J., Becker, T., Behrens, J., Bittner, M., Brokopf, R., Brovkin, V., Claussen, M., Crueger, T., Esch, M., Fast, I., Fiedler, S., Fläschner, D., Gayler, V., Giorgetta, M., Goll, D. S., Haak, H., Hagemann, S., Hedemann, C., Hohenegger, C., Ilyina, T., Jahns, T., Jimenéz-de-la Cuesta, D., Jungclaus, J., Kleinen, T., Kloster, S., Kracher, D., Kinne, S., Kleberg, D., Lasslop, G., Kornblueh, L., Marotzke, J., Matei, D., Meraner, K., Mikolajewicz, U., Modali, K., Möbis, B., Müller, W. A., Nabel, J. E. M. S., Nam, C. C. W., Notz, D., Nyawira, S.-S., Paulsen, H., Peters, K., Pincus, R., Pohlmann, H., Pongratz, J., Popp, M., Raddatz, T. J., Rast, S., Redler, R., Reick, C. H., Rohrschneider, T., Schemann, V., Schmidt, H., Schnur, R., Schulzweida, U., Six, K. D., Stein, L., Stemmler, I., Stevens, B., Storch, J.-S. v., Tian, F., Voigt, A., Vrese, P., Wieners, K.-H., Wilkenskjeld, S., Winkler, A., and Roeckner, E.: Developments in the MPI-M Earth System Model version 1.2 (MPI-ESM1.2) and Its Response to Increasing CO2, Journal of Advances in Modeling Earth Systems, 11, 998–1038, https://doi.org/10.1029/2018MS001400, 2019. a
Miller, R. L., Cakmur, R. V., Perlwitz, J., Geogdzhayev, I. V., Ginoux, P., Koch, D., Kohfeld, K. E., Prigent, C., Ruedy, R., Schmidt, G. A., and Tegen, I.: Mineral dust aerosols in the NASA Goddard Institute for Space Sciences ModelE atmospheric general circulation model, Journal of Geophysical Research Atmospheres, 111, https://doi.org/10.1029/2005JD005796, 2006. a, b, c, d
Miller, R. L., Schmidt, G. A., Nazarenko, L. S., Bauer, S. E., Kelley, M., Ruedy, R., Russell, G. L., Ackerman, A. S., Aleinov, I., Bauer, M., Bleck, R., Canuto, V., Cesana, G., Cheng, Y., Clune, T. L., Cook, B. I., Cruz, C. A., Genio, A. D. D., Elsaesser, G. S., Faluvegi, G., Kiang, N. Y., Kim, D., Lacis, A. A., Leboissetier, A., LeGrande, A. N., Lo, K. K., Marshall, J., Matthews, E. E., McDermid, S., Mezuman, K., Murray, L. T., Oinas, V., Orbe, C., García-Pando, C. P., Perlwitz, J. P., Puma, M. J., Rind, D., Romanou, A., Shindell, D. T., Sun, S., Tausnev, N., Tsigaridis, K., Tselioudis, G., Weng, E., Wu, J., and Yao, M. S.: CMIP6 Historical Simulations (1850–2014) With GISS-E2.1, Journal of Advances in Modeling Earth Systems, 13, https://doi.org/10.1029/2019MS002034, 2021. a, b, c
Nandintsetseg, B. and Shinoda, M.: Land surface memory effects on dust emission in a Mongolian temperate grassland, Journal of Geophysical Research: Biogeosciences, 120, 414–427, https://doi.org/10.1002/2014JG002708, 2015. a
van Noije, T., Bergman, T., Le Sager, P., O'Donnell, D., Makkonen, R., Gonçalves-Ageitos, M., Döscher, R., Fladrich, U., von Hardenberg, J., Keskinen, J.-P., Korhonen, H., Laakso, A., Myriokefalitakis, S., Ollinaho, P., Pérez García-Pando, C., Reerink, T., Schrödner, R., Wyser, K., and Yang, S.: EC-Earth3-AerChem: a global climate model with interactive aerosols and atmospheric chemistry participating in CMIP6, Geoscientific Model Development, 14, 5637–5668, https://doi.org/10.5194/gmd-14-5637-2021, 2021. a, b
Owen, P. R.: Saltation of uniform grains in air, Journal of Fluid Mechanics, 20, 225–242, https://doi.org/10.1017/S0022112064001173, 1964. a
Peng, Y., von Salzen, K., and Li, J.: Simulation of mineral dust aerosol with Piecewise Log-normal Approximation (PLA) in CanAM4-PAM, Atmospheric Chemistry and Physics, 12, 6891–6914, https://doi.org/10.5194/acp-12-6891-2012, 2012. a, b, c
Prospero, J. M. and Lamb, P. J.: African Droughts and Dust Transport to the Caribbean: Climate Change Implications, Science, 302, 1024–1027, https://doi.org/10.1126/science.1089915, 2003. a
Prospero, J. M., Ginoux, P., Torres, O., Nicholson, S. E., and Gill, T. E.: Environmental characterization of global sources of atmospheric soil dust identified with the Nimbus 7 Total Ozone Mapping Spectrometer (TOMS) absorbing aerosol product, Reviews of Geophysics, 40, 2-1–2-31, https://doi.org/10.1029/2000RG000095, 2002. a
Pu, B. and Ginoux, P.: The impact of the Pacific Decadal Oscillation on springtime dust activity in Syria, Atmospheric Chemistry and Physics, 16, 13431–13448, https://doi.org/10.5194/acp-16-13431-2016, 2016. a
Pu, B. and Ginoux, P.: How reliable are CMIP5 models in simulating dust optical depth?, Atmospheric Chemistry and Physics, 18, 12491–12510, https://doi.org/10.5194/acp-18-12491-2018, 2018. a
Randles, C. A., Silva, A. M. d., Buchard, V., Colarco, P. R., Darmenov, A., Govindaraju, R., Smirnov, A., Holben, B., Ferrare, R., Hair, J., Shinozuka, Y., and Flynn, C. J.: The MERRA-2 aerosol reanalysis, 1980 onward. Part I: System description and data assimilation evaluation, Journal of Climate, 30, 6823–6850, https://doi.org/10.1175/JCLI-D-16-0609.1, 2017. a
Raupach, M. R., Gillette, D. A., and Leys, J. F.: The effect of roughness elements on wind erosion threshold, Journal of Geophysical Research: Atmospheres, 98, 3023–3029, https://doi.org/10.1029/92JD01922, 1993. a
Ravi, S., Zobeck, T. E. D. M., Over, T. M., Okin, G. S., and D'Odorico, P.: On the effect of moisture bonding forces in air-dry soils on threshold friction velocity of wind erosion, Sedimentology, 53, 597–609, https://doi.org/10.1111/j.1365-3091.2006.00775.x, 2006. a, b
Rind, D., Orbe, C., Jonas, J., Nazarenko, L., Zhou, T., Kelley, M., Lacis, A., Shindell, D., Faluvegi, G., Romanou, A., Russell, G., Tausnev, N., Bauer, M., and Schmidt, G.: GISS Model E2.2: A Climate Model Optimized for the Middle Atmosphere—Model Structure, Climatology, Variability, and Climate Sensitivity, Journal of Geophysical Research: Atmospheres, 125, https://doi.org/10.1029/2019JD032204, 2020. a, b
Roberts, M. J., Baker, A., Blockley, E. W., Calvert, D., Coward, A., Hewitt, H. T., Jackson, L. C., Kuhlbrodt, T., Mathiot, P., Roberts, C. D., Schiemann, R., Seddon, J., Vannière, B., and Vidale, P. L.: Description of the resolution hierarchy of the global coupled HadGEM3-GC3.1 model as used in CMIP6 HighResMIP experiments, Geoscientific Model Development, 12, 4999–5028, https://doi.org/10.5194/gmd-12-4999-2019, 2019. a
Séférian, R., Nabat, P., Michou, M., Saint-Martin, D., Voldoire, A., Colin, J., Decharme, B., Delire, C., Berthet, S., Chevallier, M., Sénési, S., Franchisteguy, L., Vial, J., Mallet, M., Joetzjer, E., Geoffroy, O., Guérémy, J. F., Moine, M. P., Msadek, R., Ribes, A., Rocher, M., Roehrig, R., Salas-y Mélia, D., Sanchez, E., Terray, L., Valcke, S., Waldman, R., Aumont, O., Bopp, L., Deshayes, J., Éthé, C., and Madec, G.: Evaluation of CNRM Earth System Model, CNRM-ESM2-1: Role of Earth System Processes in Present-Day and Future Climate, Journal of Advances in Modeling Earth Systems, 11, 4182–4227, https://doi.org/10.1029/2019MS001791, 2019. a
Seland, Ø., Bentsen, M., Olivié, D., Toniazzo, T., Gjermundsen, A., Graff, L. S., Debernard, J. B., Gupta, A. K., He, Y.-C., Kirkevåg, A., Schwinger, J., Tjiputra, J., Aas, K. S., Bethke, I., Fan, Y., Griesfeller, J., Grini, A., Guo, C., Ilicak, M., Karset, I. H. H., Landgren, O., Liakka, J., Moseid, K. O., Nummelin, A., Spensberger, C., Tang, H., Zhang, Z., Heinze, C., Iversen, T., and Schulz, M.: Overview of the Norwegian Earth System Model (NorESM2) and key climate response of CMIP6 DECK, historical, and scenario simulations, Geoscientific Model Development, 13, 6165–6200, https://doi.org/10.5194/gmd-13-6165-2020, 2020. a
Shao, Y.: A model for mineral dust emission, Journal of Geophysical Research Atmospheres, 106, 20239–20254, https://doi.org/10.1029/2001JD900171, 2001. a
Shao, Y., Raupach, M. R., and Leys, J. F.: A model for predicting aeolian sand drift and dust entrainment on scales from paddock to region, Australian Journal of Soil Research, 34, 309–342, https://doi.org/10.1071/SR9960309, 1996. a, b, c
Shao, Y., Wyrwoll, K. H., Chappell, A., Huang, J., Lin, Z., McTainsh, G. H., Mikami, M., Tanaka, T. Y., Wang, X., and Yoon, S.: Dust cycle: An emerging core theme in Earth system science, Aeolian Research, 2, 181–204, https://doi.org/10.1016/j.aeolia.2011.02.001, 2011. a
Shevliakova, E., Malyshev, S., Martinez-Cano, I., Milly, P. C. D., Pacala, S. W., Ginoux, P., Dunne, K. A., Dunne, J. P., Dupuis, C., Findell, K. L., Ghannam, K., Horowitz, L. W., Knutson, T. R., Krasting, J. P., Naik, V., Phillipps, P., Zadeh, N., Yu, Y., Zeng, F., and Zeng, Y.: The Land Component LM4.1 of the GFDL Earth System Model ESM4.1: Model Description and Characteristics of Land Surface Climate and Carbon Cycling in the Historical Simulation, Journal of Advances in Modeling Earth Systems, 16, e2023MS003922, https://doi.org/10.1029/2023MS003922, Ltd, 2024. a
Shinoda, M. and Nandintsetseg, B.: Soil moisture and vegetation memories in a cold, arid climate, Global and Planetary Change, 79, 110–117, https://doi.org/10.1016/j.gloplacha.2011.08.005, 2011. a
Sigmond, M., Anstey, J., Arora, V., Digby, R., Gillett, N., Kharin, V., Merryfield, W., Reader, C., Scinocca, J., Swart, N., Virgin, J., Abraham, C., Cole, J., Lambert, N., Lee, W.-S., Liang, Y., Malinina, E., Rieger, L., von Salzen, K., Seiler, C., Seinen, C., Shao, A., Sospedra-Alfonso, R., Wang, L., and Yang, D.: Improvements in the Canadian Earth System Model (CanESM) through systematic model analysis: CanESM5.0 and CanESM5.1, Geoscientific Model Development, 16, 6553–6591, https://doi.org/10.5194/gmd-16-6553-2023, 2023. a, b, c, d
Swart, N. C., Cole, J. N. S., Kharin, V. V., Lazare, M., Scinocca, J. F., Gillett, N. P., Anstey, J., Arora, V., Christian, J. R., Hanna, S., Jiao, Y., Lee, W. G., Majaess, F., Saenko, O. A., Seiler, C., Seinen, C., Shao, A., Sigmond, M., Solheim, L., von Salzen, K., Yang, D., and Winter, B.: The Canadian Earth System Model version 5 (CanESM5.0.3), Geoscientific Model Development, 12, 4823–4873, https://doi.org/10.5194/gmd-12-4823-2019, 2019. a
Takemura, T., Egashira, M., Matsuzawa, K., Ichijo, H., O'ishi, R., and Abe-Ouchi, A.: A simulation of the global distribution and radiative forcing of soil dust aerosols at the Last Glacial Maximum, Atmospheric Chemistry and Physics, 9, 3061–3073, https://doi.org/10.5194/acp-9-3061-2009, 2009. a, b, c
Tatebe, H., Ogura, T., Nitta, T., Komuro, Y., Ogochi, K., Takemura, T., Sudo, K., Sekiguchi, M., Abe, M., Saito, F., Chikira, M., Watanabe, S., Mori, M., Hirota, N., Kawatani, Y., Mochizuki, T., Yoshimura, K., Takata, K., O'ishi, R., Yamazaki, D., Suzuki, T., Kurogi, M., Kataoka, T., Watanabe, M., and Kimoto, M.: Description and basic evaluation of simulated mean state, internal variability, and climate sensitivity in MIROC6, Geoscientific Model Development, 12, 2727–2765, https://doi.org/10.5194/gmd-12-2727-2019, 2019. a, b
Tegen, I., Harrison, S. P., Kohfeld, K., Prentice, I. C., Coe, M., and Heimann, M.: Impact of vegetation and preferential source areas on global dust aerosol: Results from a model study, Journal of Geophysical Research Atmospheres, 107, https://doi.org/10.1029/2001JD000963, 2002. a, b
Tegen, I., Neubauer, D., Ferrachat, S., Siegenthaler-Le Drian, C., Bey, I., Schutgens, N., Stier, P., Watson-Parris, D., Stanelle, T., Schmidt, H., Rast, S., Kokkola, H., Schultz, M., Schroeder, S., Daskalakis, N., Barthel, S., Heinold, B., and Lohmann, U.: The global aerosol–climate model ECHAM6.3–HAM2.3 – Part 1: Aerosol evaluation, Geoscientific Model Development, 12, 1643–1677, https://doi.org/10.5194/gmd-12-1643-2019, 2019. a, b
Textor, C., Schulz, M., Guibert, S., Kinne, S., Balkanski, Y., Bauer, S., Berntsen, T., Berglen, T., Boucher, O., Chin, M., Dentener, F., Diehl, T., Easter, R., Feichter, H., Fillmore, D., Ghan, S., Ginoux, P., Gong, S., Grini, A., Hendricks, J., Horowitz, L., Huang, P., Isaksen, I., Iversen, I., Kloster, S., Koch, D., Kirkevåg, A., Kristjansson, J. E., Krol, M., Lauer, A., Lamarque, J. F., Liu, X., Montanaro, V., Myhre, G., Penner, J., Pitari, G., Reddy, S., Seland, Ø., Stier, P., Takemura, T., and Tie, X.: Analysis and quantification of the diversities of aerosol life cycles within AeroCom, Atmospheric Chemistry and Physics, 6, 1777–1813, https://doi.org/10.5194/acp-6-1777-2006, 2006. a
Volodin, E. M.: Possible Climate Change in Russia in the 21st Century Based on the INM-CM5-0 Climate Model, Russian Meteorology and Hydrology, 47, 327–333, https://doi.org/10.3103/S1068373922050016, 2022. a, b
Volodin, E. M. and Kostrykin, S. V.: The aerosol module in the INM RAS climate model, Russian Meteorology and Hydrology, 41, 519–528, https://doi.org/10.3103/S106837391608001X, 2016. a, b, c, d, e
Voss, K. K. and Evan, A. T.: A new satellite-based global climatology of dust aerosol optical depth, Journal of Applied Meteorology and Climatology, 59, 83–102, https://doi.org/10.1175/JAMC-D-19-0194.1, 2020. a
White, B. R.: Soil transport by winds on Mars, Journal of Geophysical Research: Solid Earth, 84, 4643–4651, https://doi.org/10.1029/JB084iB09p04643, 1979. a
Woodward, S.: Modeling the atmospheric life cycle and radiative impact of mineral dust in the Hadley Centre climate model, Journal of Geophysical Research Atmospheres, 106, 18155–18166, https://doi.org/10.1029/2000JD900795, 2001. a, b
Woodward, S.: Mineral dust in HadGEM2, Met Office Hadley Centre Technical Note 87, https://library.metoffice.gov.uk/Portal/Default/en-GB/DownloadImageFile.ashx?objectId=1095&ownerType=0&ownerId=252246 (last access: 16 January 2026), 2011. a
Woodward, S., Sellar, A. A., Tang, Y., Stringer, M., Yool, A., Robertson, E., and Wiltshire, A.: The simulation of mineral dust in the United Kingdom Earth System Model UKESM1, Atmospheric Chemistry and Physics, 22, 14503–14528, https://doi.org/10.5194/acp-22-14503-2022, 2022. a, b, c
Wu, C., Lin, Z., and Liu, X.: The global dust cycle and uncertainty in CMIP5 (Coupled Model Intercomparison Project phase 5) models, Atmospheric Chemistry and Physics, 20, 10401–10425, https://doi.org/10.5194/acp-20-10401-2020, 2020. a, b, c
Xi, X.: Data from “The relative importance of wind and hydroclimate drivers in modulating the interannual variability of dust emissions in Earth system models”, Zenodo [data set], https://doi.org/10.5281/zenodo.17666380, 2025.
Xi, X. and Sokolik, I. N.: Dust interannual variability and trend in Central Asia from 2000 to 2014 and their climatic linkages, Journal of Geophysical Research: Atmospheres, 120, 12175–12197, https://doi.org/10.1002/2015JD024092, 2015a. a
Xi, X. and Sokolik, I. N.: Seasonal dynamics of threshold friction velocity and dust emission in Central Asia, Journal of Geophysical Research: Atmospheres, 120, 1536–1564, https://doi.org/10.1002/2014JD022471, 2015b. a, b
Xie, S., Terai, C. R., Wang, H., Tang, Q., Fan, J., Burrows, S., Lin, W., Wu, M., Song, X., Zhang, Y., Taylor, M. A., Golaz, J., Benedict, J. J., Chen, C., Feng, Y., Hannah, W. M., Ke, Z., Shan, Y., Larson, V. E., Liu, X., Prather, M. J., Richter, J. H., Shrivastava, M., Wan, H., Zhang, G. J., Zhang, K., Bradley, A. M., Cameron-Smith, P., Damiano, L., Debusschere, B. J., Donahue, A. S., Easter, R. C., Eldred, M. S., Griffin, B. M., Guba, O., Guo, Z., Huang, X., Lee, J., Lee, H., Lou, S., Mahfouz, N., Moncrieff, M., Mülmenstädt, J., Qian, Y., Rasool, Q. Z., Roberts, A. F., Santos, S. P., Sargsyan, K., Shpund, J., Singh, B., Tao, C., Xie, J., Yang, Y., Zeng, X., Zhang, C., Zhang, M., Zhang, S., Zhang, T., Zheng, X., Jacob, R. L., Leung, L. R., McCoy, R. B., and Bader, D. C.: The Energy Exascale Earth System Model version 3: 1. Overview of the atmospheric component, Journal of Advances in Modeling Earth Systems, 17, e2025MS005120, https://doi.org/10.1029/2025MS005120, 2025. a, b, c
Yukimoto, S., Kawai, H., Koshiro, T., Oshima, N., Yoshida, K., Urakawa, S., Tsujino, H., Deushi, M., Tanaka, T., Hosaka, M., Yabu, S., Yoshimura, H., Shindo, E., Mizuta, R., Obata, A., Adachi, Y., and Ishii, M.: The meteorological research institute Earth system model version 2.0, MRI-ESM2.0: Description and basic evaluation of the physical component, Journal of the Meteorological Society of Japan, 97, 931–965, https://doi.org/10.2151/jmsj.2019-051, 2019. a, b
Yumimoto, K., Tanaka, T. Y., Oshima, N., and Maki, T.: JRAero: the Japanese Reanalysis for Aerosol v1.0, Geoscientific Model Development, 10, 3225–3253, https://doi.org/10.5194/gmd-10-3225-2017, 2017. a, b, c, d
Zender, C. S. and Kwon, E. Y.: Regional contrasts in dust emission responses to climate, Journal of Geophysical Research Atmospheres, 110, https://doi.org/10.1029/2004JD005501, 2005. a
Zender, C. S., Bian, H., and Newman, D.: Mineral Dust Entrainment and Deposition (DEAD) model: Description and 1990s dust climatology, Journal of Geophysical Research: Atmospheres, 108, https://doi.org/10.1029/2002jd002775, 2003. a, b, c, d, e, f, g, h, i, j, k, l
Zhao, A., Ryder, C. L., and Wilcox, L. J.: How well do the CMIP6 models simulate dust aerosols?, Atmospheric Chemistry and Physics, 22, 2095–2119, https://doi.org/10.5194/acp-22-2095-2022, 2022. a, b, c, d
Zomer, R. J., Xu, J., and Trabucco, A.: Version 3 of the Global Aridity Index and Potential Evapotranspiration Database, Scientific Data, 9, https://doi.org/10.1038/s41597-022-01493-1, 2022. a
Zou, X. K. and Zhai, P. M.: Relationship between vegetation coverage and spring dust storms over northern China, Journal of Geophysical Research: Atmospheres, 109, https://doi.org/10.1029/2003jd003913, 2004. a