
the Creative Commons Attribution 4.0 License.
the Creative Commons Attribution 4.0 License.
 | 07 Jul 2026
The changing sensitivity of wintertime particulate nitrate to precursor emissions diagnosed via GEOS-Chem and satellite observations of ammonia and nitrogen dioxide over the Midwestern United States
Toan Vo
Amy E. Christiansen
Particulate nitrate (PN) is a critical component of fine particulate matter (PM2.5). During wintertime, the contribution of PN to PM2.5 over the Midwestern United States (MWUS), an agriculturally intensive region, has increased over the past decade and now contributes up to 40 % of the particle mass. PN formation is controlled by nitrogen oxides , ammonia (NH3), and volatile organic compounds (VOCs). To best control wintertime PM2.5 burden, it is critical to determine PN formation sensitivity to precursor gases, but this is not well constrained. Prior efforts to diagnose PN sensitivity have been limited on both spatial and temporal scales. Satellite tropospheric column NH3 NO2 ratios cover large areas and long timeframes, and they have been shown to be effective in diagnosing PN sensitivity over East Asia, Europe, and the Eastern United States. Here, we expand this approach to quantify spatially and temporally resolved multidecadal wintertime PN formation sensitivity to NH3, NOx, and VOCs in the MWUS from 2007 to 2023 via satellite observations and GEOS-Chem sensitivity simulations. More than half of the total diagnosed pixels are classified as NOx-sensitive in 2007, and this increases to 89.0 % by 2023. VOCs do not control MWUS PN formation. The shift in PN formation sensitivity is explained by relatively flat trends in satellite NO2 column densities (0.48 ± 0.60 % yr−1) in combination with increases in satellite NH3 column densities (1.3 ± 0.3 % yr−1). Our work indicates that targeting NOx emissions is chemically effective for reducing wintertime PN and PM2.5 burden.
- Article
(4666 KB) - Full-text XML
-
Supplement
(1743 KB) - BibTeX
- EndNote


PM2.5, particulate matter with an aerodynamic diameter of 2.5 µm or less, is the largest environmental health risk factor in the United States (Di et al., 2017; Pokharel et al., 2023; Shi et al., 2022; Tessum et al., 2019; Wu et al., 2018). PM2.5 is formed via acid-base reactions between the acidic precursor species, nitrogen oxides and sulfur dioxide (SO2), and the basic gas ammonia (NH3) to form ammonium sulfate and ammonium nitrate. Regulations on SO2 and NOx emissions via the Clean Air Act have led to notable decreases in the PM2.5 burden across the United States over the past few decades, primarily through the reduction in particulate nitrate (PN) and particulate sulfate (PS) (Hand et al., 2012). PS, which has historically dominated the inorganic fraction of PM2.5, has decreased more quickly than PN, increasing the relative contribution of PN to total PM2.5 mass. PN concentrations are highest during wintertime because the gas-to-particle partitioning of PN is favored at low temperatures (Pitchford et al., 2009). During wintertime over the Midwestern United States (MWUS), a highly agricultural region, the PN PS ratio has increased, as PS has decreased at a faster rate compared to PN over the past decade (Fig. S1 in the Supplement). The increase in relative PN abundance may also be influenced by increases in the atmospheric lifetime of total nitrate during wintertime (Zhai et al., 2021). Over the MWUS, wintertime PN now comprises up to 40 % of the total PM2.5 mass on average.
PN is highly hygroscopic, which affects particle properties and enhances the reflectivity of particles (Wang et al., 2018; Wu et al., 2019). PN has been found to drive pollution events over certain regions of the US (Franchin et al., 2018; Womack et al., 2019) and the globe (Qin et al., 2024; Xu et al., 2019). PN has also become the controlling factor behind particle water uptake in some regions, impacting particle chemical processes and visibility (Christiansen et al., 2020; Jefferson et al., 2017). Recent studies have shown that the products from PN photolysis may influence the formation of tropospheric O3 and thus atmospheric oxidation capacity (Cao et al., 2022; Gen et al., 2022; Sarwar et al., 2024). It is critical to accurately understand PN properties and formation to better understand PN impacts and create effective policy that controls PM2.5 burden.
NOx, NH3, and volatile organic compounds (VOCs) are critical to the formation of PN (Wang et al., 2023a). During the daytime, NO2 is oxidized to HNO3 via reaction with hydroxyl radical (•OH). HNO3 then reacts with NH3 to form ammonium nitrate, which partitions into the particle phase. During nighttime, PN is formed via the heterogenous hydrolysis of N2O5, which is formed from the oxidation of NO2 with ozone (O3). In these mechanisms, the availability of •OH and O3 are highly dependent on VOC abundance. Thus, PN formation is sensitive to the precursor gases NOx, NH3, and VOCs, and its formation is controlled by whichever precursor gas is the limiting reagent. Competing mechanisms with organic molecules also contribute to total PN, but the exact mechanisms and processes behind organo-nitrate formation are not well constrained, and inorganic nitrate is most prominent in particles (Romer Present et al., 2020; Wang et al., 2023a).
Precursor gas emissions have changed drastically over the past few decades, potentially altering PN formation sensitivity and its relative contribution to total PM2.5 mass. Urban NOx emissions dominated by anthropogenic sources have decreased by 40 % from 2005 to 2018 across the US (Jiang et al., 2022). Over rural areas, total surface NO2 trends decreased strongly until 2010, after which they flattened. The decreasing prevalence of urban NOx emissions have caused rural total NOx trends to be influenced more strongly by relatively constant background emissions (e.g., lightning, soil), and NOx trends over rural areas post-2010 are typically insignificant (Christiansen et al., 2024; Jiang et al., 2022; Silvern et al., 2019). Satellite NO2 column densities show similar flattening trends after 2010, which is attributed to the increasingly strong relative influence of free tropospheric NO2 in satellite column trends (Dang et al., 2023a; Fioletov et al., 2022; He et al., 2022; Jiang et al., 2018; Tong et al., 2015; Wang et al., 2021).
In contrast, NH3 is not regulated as a criterion pollutant, although there exist some regulations on agricultural NH3 practices, which target livestock emissions (US EPA, 2014). Recently, satellite NH3 column densities have increased strongly over the US (2.40 ± 0.45 % yr−1 from 2002 to 2018), which matches increases in surface NH3 concentrations (Van Damme et al., 2021; Wang et al., 2023b; Yu et al., 2018). The increase in NH3 concentrations over the agricultural Central United States is disproportionately higher than over the US as a whole, ranging from 1 % yr−1–7 % yr−1 (Yu et al., 2018). This increase can be explained by increases in emissions from both agriculture (Vo and Christiansen, 2024; Yang et al., 2023) and vehicles (Fenn et al., 2018; Sun et al., 2017; Walters et al., 2022), as well as decreases in NO2 and SO2 emissions that increase unreacted NH3 abundance (Warner et al., 2017).
Anthropogenic VOC emissions are low during winter, but they have continuously decreased over time. Urban VOC emissions over the United States have decreased by −36.4 % from 2000 to 2019, which is attributable to decreases in transportation and industrial solvent emissions (Xiong et al., 2024). Emissions of isoprene, a biogenic VOC, conversely showed an increase of 0.14 % yr−1 from 2000 to 2020 in US, which is primarily influenced by meteorological factors and changes in vegetation coverage (Wang et al., 2024).
To most effectively reduce PM2.5 burden, it is critical to understand how these large changes in precursor gas emissions have influenced PN formation sensitivity over time. Over past decades, controlling NH3 emissions has been suggested to be most effective in reducing wintertime PM2.5 burden over agricultural regions, but more recent analyses suggest that NOx controls may now be more effective, although at a higher cost and more technologically complex approach than NH3 controls (Guo et al., 2024; Holt et al., 2015; Pan et al., 2024; Paulot et al., 2014; Pinder et al., 2007; Wiegand et al., 2022). Therefore, the most effective strategy to control PN and PM2.5 in agriculturally impacted areas, such as the MWUS regions, remains an open question. Few prior studies have attempted to diagnose PN and PM2.5 sensitivity to precursor gases in the MWUS. Holt et al. (2015) diagnosed the wintertime inorganic PM2.5 sensitivity over the US to NOx, NH3, and SO2 emissions between 2005 and 2012 using only GEOS-Chem simulations and found that NOx sensitivity increased over time (Holt et al., 2015). Dang et al. (2024) conducted a PN formation sensitivity diagnosis over the US across all seasons in 2017, but this focused mostly on the Eastern US and covered very little of agricultural MWUS (Dang et al., 2024). Neither of these studies captured the long-term (multidecadal) dynamics of wintertime PN formation sensitivity over highly agricultural areas.
Determining PN formation sensitivity has traditionally proven challenging. Methods used in previous studies are subject to large uncertainties, especially in the measurement of HNO3 (Franchin et al., 2018; Petetin et al., 2016), are computationally intensive (Paulot et al., 2016; Shimadera et al., 2014; Zhai et al., 2021), and typically have only been applied to short timeframes (Nenes et al., 2020; Wen et al., 2018; Zhai et al., 2023). Recently, Dang et al. (2023b) introduced an innovative approach to overcome these limitations and diagnose PN sensitivity using satellite tropospheric column NH3 NO2 ratios and chemical transport models without the need for HNO3 measurements or exceedingly computationally intensive calculations (Dang et al., 2023b). Importantly, this method can quickly diagnose PN sensitivity to precursor gases across a broad region and a longer timeframe due to the large spatial and temporal coverage of satellite observations. This approach has been applied on short timeframes over East Asia, Europe, and the Eastern United States across all seasons with high accuracy when compared to previous studies (Dang et al., 2024). Here, we will expand this methodology over the MWUS to track multidecadal changes in wintertime PN formation sensitivity.
In this work, we evaluate changes in wintertime PN formation sensitivity by quantifying the changes in the sensitivity regime of wintertime PN to NH3, NOx, and VOCs over the MWUS from 2007 to 2023 via satellite observations of NO2 and NH3 column density and model sensitivity simulations. We also explore whether controlling NOx emissions or controlling NH3 emissions is the best PN and PM2.5 mitigation strategy over the MWUS during winter. These methods can be expanded in the future to investigate PN formation sensitivity in other seasons, as both NO2 and NH3 exhibit strong seasonality.
2.1 Satellite observations
2.1.1 General information
NO2 column density was obtained from the Ozone Monitoring Instrument (OMI) using version 4.0 of the NASA OMI/Aura NO2 Level 2 product (https://disc.gsfc.nasa.gov/datasets/OMNO2_003/summary, last access: 27 October 2025). OMI is operated onboard the sun-synchronous NASA Earth Observing System (EOS) Aura satellite (Krotkov et al., 2019). NO2 is detected at visible wavelengths (402–465 nm), and the measurements are in swaths of 2600 km width at 13:45 ± 0:15 local solar time; LST (Lamsal et al., 2021).
NH3 column density was obtained from the Infrared Atmospheric Sounding Interferometer (IASI) onboard the Metop-A and Metop-B sun-synchronous satellites (Clarisse and Coheur, 2018a, b) (https://iasi.aeris-data.fr/catalog/?currentSelection=871d9366-22d7-4d8d-997e-02e7721f7e94#masthead, last access: 30 October 2025, for Metop-A; https://iasi.aeris-data.fr/catalog/?currentSelection=44a739bf-8b68-4b64-b594-d7bb3fbe40bf#masthead, last access: 31 October 2025, for Metop-B). Here, we use the reanalyzed daily IASI/Metop-A (2007–2020) and IASI/Metop-B (2021–2023) dataset (ANNI-NH3-v4R). This satellite provides measurements twice daily in the morning (09:30 LST) and the evening (21:30 LST) (Van Damme et al., 2014). In this study, we use only morning overpass measurements to minimize time separation from OMI (13:45 ± 0:15 LST). IASI captures backscattered infrared radiation (∼ 645–2760 cm−1) of atmospheric trace gases directly perpendicular to Earth's surface with a 12 km circular footprint (Clerbaux et al., 2009; Van Damme et al., 2017).
2.1.2 Analyzing satellite observations
The methodology of this study is summarized in Fig. S2. We obtained NO2 and NH3 column density from winter 2007 to winter 2023 over the MWUS (36 to 49° latitude and −104 to −87° longitude) from OMI and IASI. We used measurements from November, December, January, and February to represent winter to ensure > 60 % coverage over the MWUS both spatially and temporally due to the limited satellite sensitivity. For NO2 columns, we filtered out any pixels with solar zenith angle > 85°, cloud fraction > 0.3, terrain reflectivity > 0.3, NO2 column density < 0, and any observations impacted by the row anomaly, which arose from problems with radiance measurements (Dang et al., 2023b). For NH3 column density, we then removed any pixels with cloud fraction > 0.1, NH3 column density < 0, and pixels with limited sensitivity to NH3 using the post retrieval quality flag (Dang et al., 2023b).
Next, both NO2 and NH3 data sets were averaged seasonally to a 0.5° × 0.625° resolution (latitude × longitude) to spatially match the GEOS-Chem simulation pixels (see Sect. 3), and we removed any grid cells with < 20 successful retrievals to further reduce noise. We computed the median NO2 and NH3 column density for each pixel for each winter to visualize the distribution of precursor gases over MWUS from 2007 to 2023.
To reduce potential errors arising from differences in the assumed vertical profiles between OMI and GEOS-Chem, a correction factor was calculated to adjust air mass factors (AMFs). Differences in underlying vertical profile assumptions can lead to inconsistencies between the model and satellite observations. We replaced the a priori profile used in the OMI retrieval to match that of GEOS-Chem to minimize those errors (Visser et al., 2019). For NO2 column density, we applied the method described by Lamsal et al. (2010), Boersma et al. (2016), and Visser et al. (2019) to derive a correction factor, which we applied to the AMF in OMI for each aggregated grid cell (Eq. 1) (Boersma et al., 2016; Lamsal et al., 2010; Visser et al., 2019).
In Eq. (1), AMFOMI is the air mass factor from OMI, Atrop is the averaging kernel, and xl,GC is NO2 column density obtained from GEOS-Chem in molec. cm−2 (Boersma et al., 2016; Lamsal et al., 2010; Visser et al., 2019). The averaging kernel is obtained by taking the ratios of scattering weight and AMFOMI at each level (Boersma et al., 2016; Palmer et al., 2001). Then, the newly calculated AMFs (AMFGC) were used to correct the NO2 column density (NO2,OMI) from OMI (Eq. 2). In Eq. (2), NO2,new is the corrected OMI NO2 column, with the underlying a priori profile replaced by the profile in GEOS-Chem.
Note that correction of satellite column densities by replacing a priori vertical profiles with those from GEOS-Chem only applies to NO2 since there is not enough information from IASI to correct satellite NH3 column densities. We then calculated the winter average of satellite NO2 and NH3 from the median of each grid cell over the MWUS for each year from 2007 to 2023. We then computed the wintertime NH3 NO2 ratios across the MWUS by overlaying spatial and temporal 0.5° × 0.625° composites of NH3 and NO2 column density.
2.2 GEOS-Chem simulations
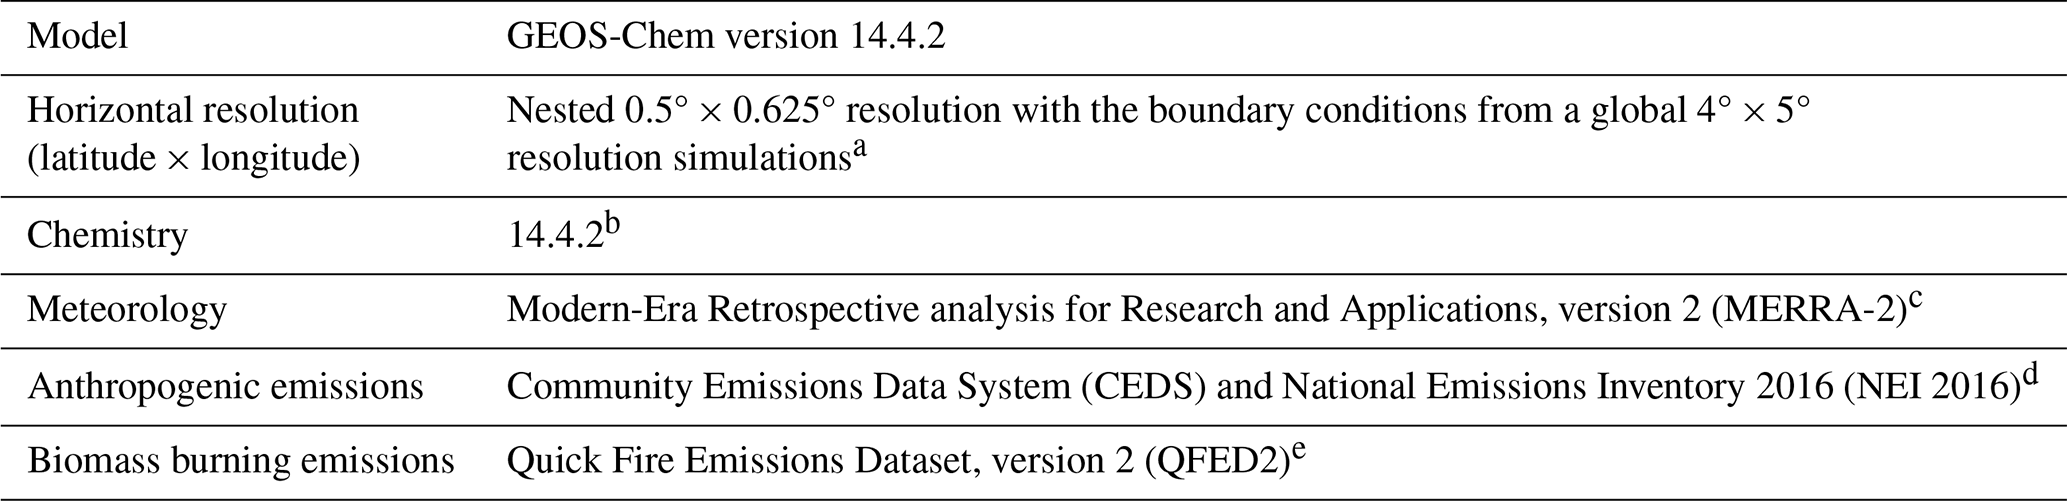
We used the 3D chemical transport model GEOS-Chem to examine the sensitivity of PN formation to NOx, NH3, and VOCs. The simulation parameters are summarized in Table 1. In this study, we used GEOS-Chem version 14.4.2, and all the simulations were performed at the nested 0.5° × 0.625° horizontal resolution with boundary conditions from a global 4° × 5° resolution simulation (https://doi.org/10.5281/zenodo.12807579, Yantosca et al., 2024; Wang et al., 2004). Next, we assumed that January could represent the entire winter season to reduce computational burden (Dang et al., 2023b). Although GEOS-Chem underestimates observed PN mass concentrations, trends in wintertime PN simulated by GEOS-Chem and observations from the IMPROVE and CSN networks agree well (R2 > 0.6 between GEOS-Chem and ground monitoring networks) (Fig. S3). We will evaluate the performance of GEOS-Chem further in Sect. 2.5.
Table 1Description of GEOS-Chem simulations
a Wang et al. (2004). b https://doi.org/10.5281/zenodo.12807579 (Yantosca et al., 2024). c Gelaro et al. (2017); d Hoesly et al. (2018). e Darmenov and da Silva (2015).
All sensitivity simulations were conducted using 72 vertical pressure levels from 2007 to 2022. GEOS-Chem includes detailed HOx-NOx-VOC-O3−BrOx-aerosol tropospheric chemistry with over 200 species. We used the reanalysis product Modern-Era Retrospective analysis for Research and Applications, Version 2 (MERRA-2), developed by the NASA Global Modeling and Assimilation Office (GMAO), for meteorological inputs (Gelaro et al., 2017). Emissions were computed by the Harvard-NASA Emissions Component (HEMCO) (Keller et al., 2014). All global anthropogenic emissions were provided by the Community Emissions Data System inventory (Hoesly et al., 2018). Until winter 2018, these emissions were overwritten over the CONUS by the National Emissions Inventory 2016 (NEI 2016) at 0.1° × 0.1° resolution, which was created by NEI Collaborative for air quality modeling over the United States (National Emissions Inventory Collaborative, 2019). Since NEI emissions in the model were only available through January 2019, we used the CEDS inventory at the 0.5° × 0.5° resolution after to simulate anthropogenic emissions over the CONUS (Hoesly et al., 2018). Despite some differences in estimates of emissions magnitudes, which mainly arise from differences in horizontal resolution and the methods used in estimating agricultural emissions, the CEDS and NEI2016 inventories show similar trends (Fig. S4), and both predict the same wintertime PN sensitivity at various time slices and locations from 2007 to 2019 (see Sect. 3.1 and Fig. S5), suggesting the sensitivity findings are continuous regardless of inventory (Hoesly et al., 2018; Inventory Collaborative 2016v1 Emissions Modelling Platform, 2020).
Aircraft emissions were taken from the Aviation Emissions Inventory Code 2019 (AEIC 2019), which covered up to 2019 (Simone et al., 2013). Emissions after 2019 were kept constant at 2019 values. Offline soil NOx emissions were used, which were provided by Hudman et al. (2012), and offline biogenic VOC emissions were provided by the Model of Emissions of Gases and Aerosols from Nature version 2.1 (MEGAN) as implemented by Hu et al. (2015) from 2007 to 2020 (Guenther et al., 2012; Hu et al., 2015; Hudman et al., 2012). Similar to aircraft emissions, emissions after 2020 for soil NOx and biogenic VOC emissions were kept constant at 2020 values. Biomass burning emissions were provided by the Quick Fire Emissions Dataset, version 2 (QFED2) (Darmenov and da Silva, 2015). Thermodynamic PN formation was calculated with ISORROPIA-II (Fountoukis and Nenes, 2007). We used the Luo et al. (2020) wet deposition scheme to improve the accuracy of modelled PN (Luo et al., 2020). The PN photolysis scheme is described by Shah et al. (2023).
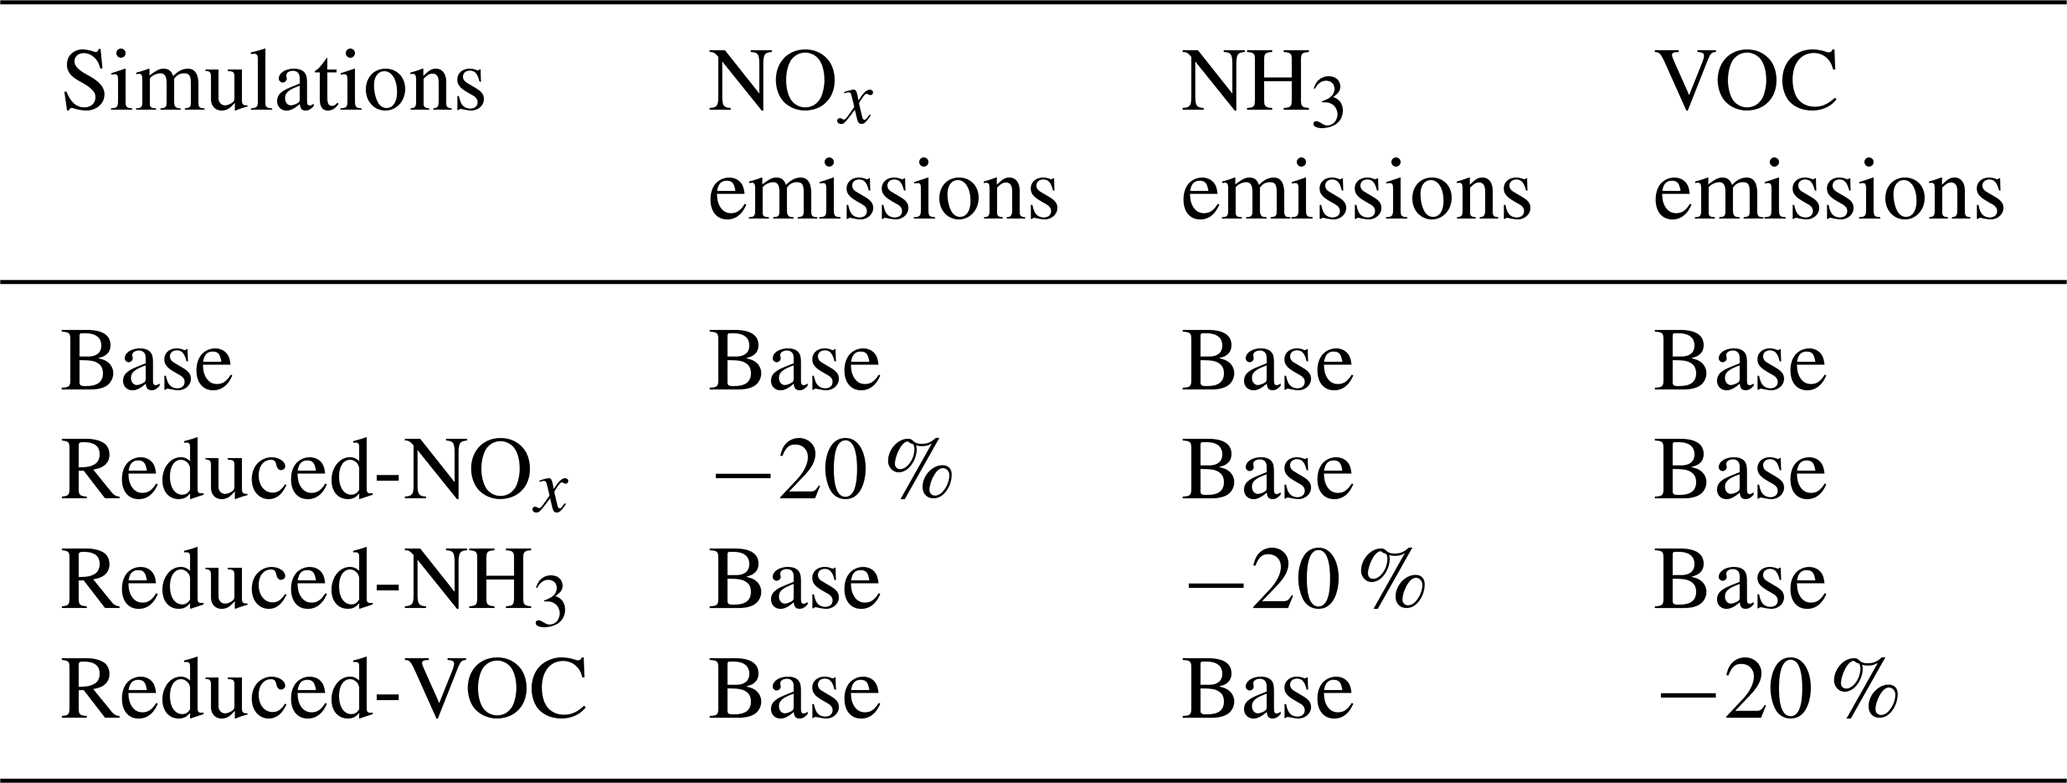
Sensitivity simulations used to quantify formation regime cutoffs are summarized in Table 2. The standard simulation (“Base”) was conducted from 2007 to 2022, where no modifications were applied to any emissions. The sensitivity of PN formation to the precursor gases NOx, NH3, and VOCs was evaluated with 3 simulations: (1) “Reduced-NOx”, where NOx emissions were decreased by 20 %; (2) “Reduced-NH3”, where NH3 emissions were decreased by 20 %; and (3) “Reduced-VOC”, where VOC emissions were decreased by 20 % (Dang et al., 2023b; 2024). The total quantities (in Tg) for NOx, NH3, and VOC emissions for each sensitivity simulation from 2007 to 2022 are shown in Fig. S6. In each sensitivity simulation, the decrease of the precursor gas applied to all emissions sources (natural and anthropogenic). We chose a perturbation of 20 % because it is in line with the model's ability to capture changes in PN. Throughout the timeframe, GEOS-Chem captures wintertime PN trends well (see Sect. 2.5) through changes in NOx and NH3 emissions that span 20 %–50 % (Fig. S4), suggesting the model will be able to accurately capture the impacts of a 20 % perturbation in emissions. Other analyses using this method similarly use 20 % (Dang et al., 2023b, 2024). Each sensitivity simulation was run with a full-year spin up for boundary conditions (4° × 5°) followed by 1-week spin up for nested simulations (0.5° × 0.625°). Production runs were performed for January of each year. These sensitivity simulations allowed us to examine the influence of each precursor gas on wintertime PN formation, how that sensitivity changed over time, and quantify cutoffs for PN formation regime determination.
Table 2Description of all sensitivity simulations using GEOS-Chem 14.4.2.
2.3 Ground monitoring observations
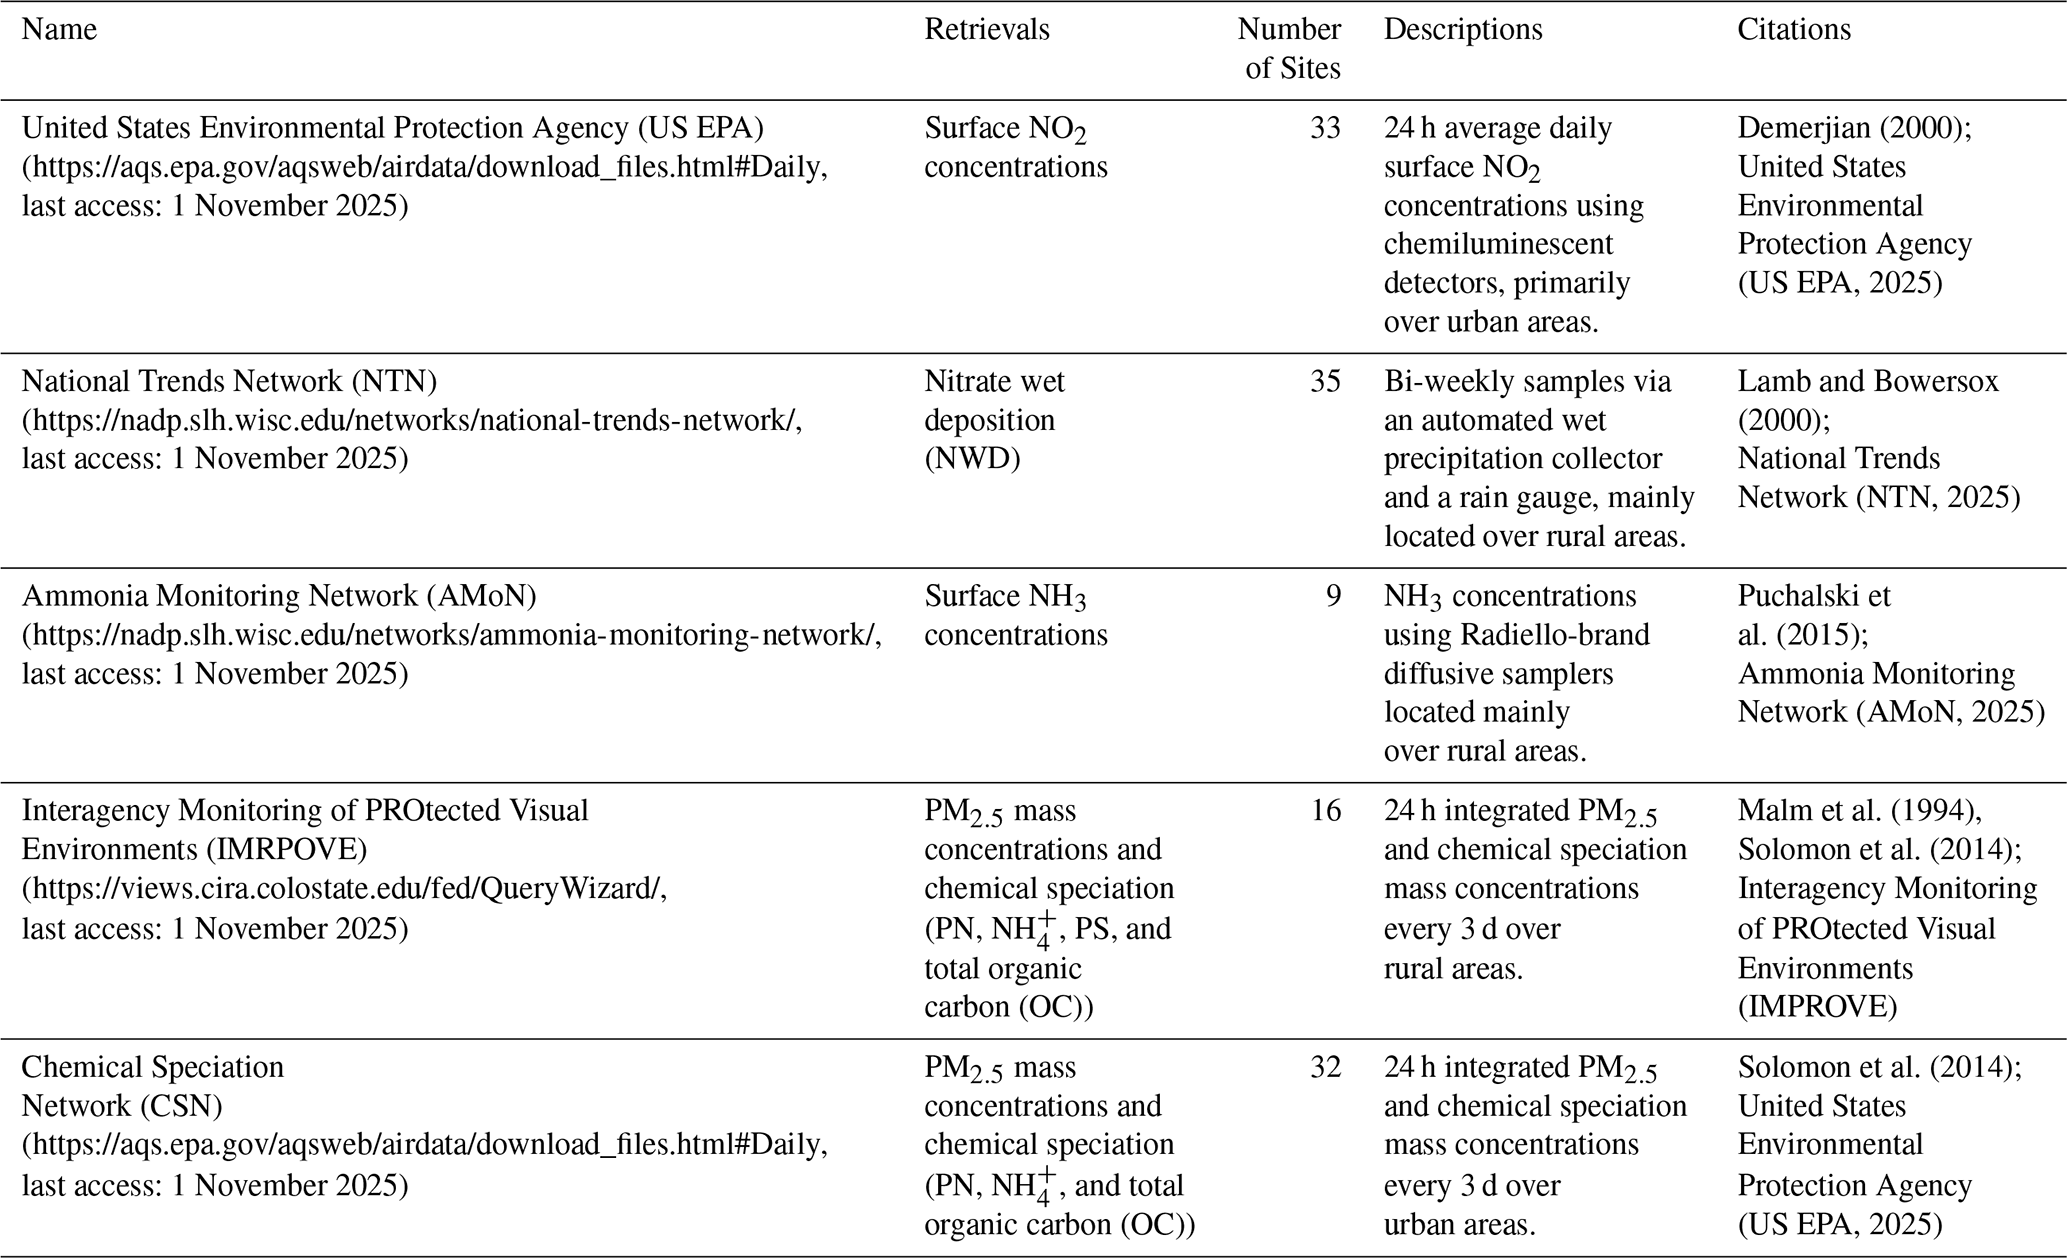
The descriptions of all ground monitoring observations and the locations of each site are summarized in Fig. 1 and Table 3. We define winter in this analysis to be November, December, January, and February to match satellite retrievals. In addition, we analyze trends in gas concentrations, wet deposition, and particle speciation and compare them to satellite NO2 column densities, NH3 column densities, and model simulations to place results into context. We assume NWD and surface NH3 concentrations trends are representative of the entire MWUS. While this introduces uncertainty, the agreement of trends between satellite and ground observations is excellent. This will be further discussed in Sect. 3.
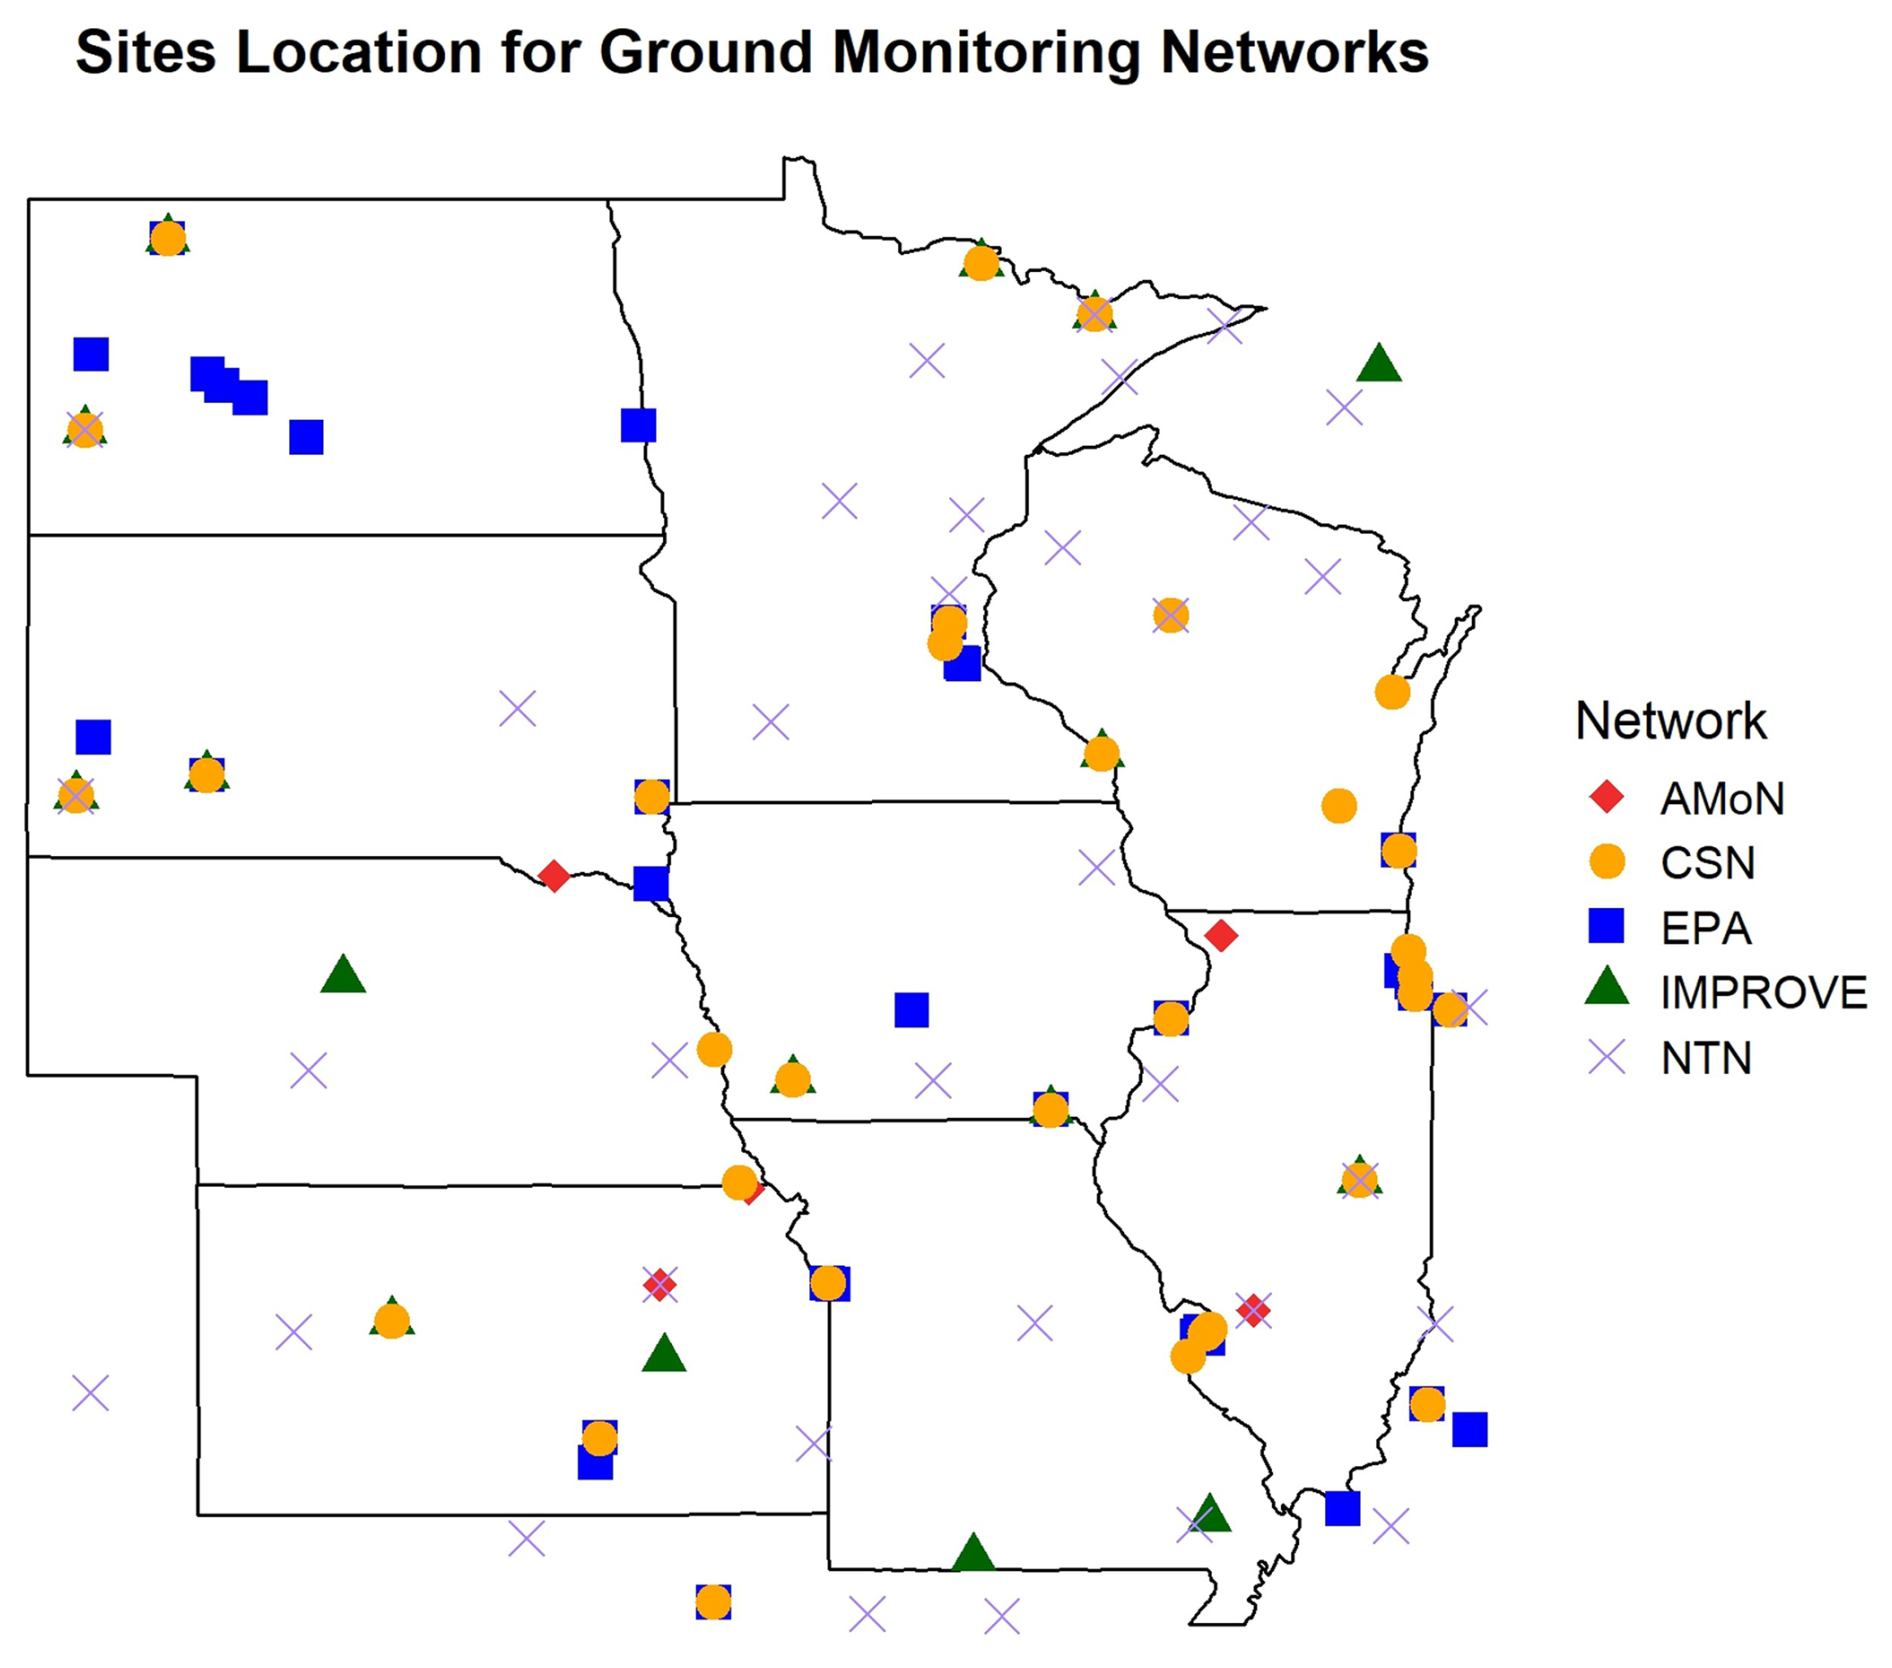
Figure 1Site locations for Ammonia Monitoring Network (AMoN), Chemical Speciation Network (CSN), US Environmental Protection Agency (EPA), Interagency Monitoring of PROtected Visual Environments (IMPROVE), and National Trends Network (NTN) ground monitoring networks. Note that some sites are part of multiple networks.
2.4 PN formation sensitivity diagnostic methods
We calculated the local PN sensitivity to each precursor gas, Si, for individual 0.5° × 0.625° grid cells from GEOS-Chem using Eq. (3). Here, we calculated the ratio of the changes in monthly PN concentrations to changes in emissions of species i, Ei between the sensitivity and Base simulations. In Eq. (3), i is NOx, NH3, or VOCs (Dang et al., 2023b).
We then chose all the pixels with sensitivity ratios of 0.95 ≤ Si Sj ≤ 1.05 from 2007 to 2023 (i.e., sites without a distinct dominant regime for PN sensitivity), where Si is the dominant sensitivity, and Sj is the one of the other two sensitivities different from Si (e.g., if Si is S, then Sj is S or SVOC), to perform reduced-major-axis linear regression and deduce the wintertime PN sensitivity regime cutoff (Fig. S7) (Dang et al., 2023b). In this work, we chose to derive the regime cutoffs for the whole timeframe instead of deriving for individual years because there was not enough data without a dominant regime in some years to perform the regression. However, it is important to note that long-term trends in the formation sensitivity are the same whether using individual year or multi-year regressions (Fig. S8). We focused on the NOx-sensitive and NH3-sensitive regime because MWUS PN had limited sensitivity to VOC emissions during wintertime (Sect. 3.1). After diagnosing the PN sensitivity for each pixel for each winter season, we analyzed the changes in PN sensitivity from 2007 to 2023.
2.5 GEOS-Chem evaluation
We perform a series of simulations in GEOS-Chem to assess the sensitivity of PN to changes in precursor gas emissions from 2007 to 2022. First, we establish the reliability of GEOS-Chem for this analysis by evaluating the ability of the GEOS-Chem Base simulations to reproduce ground monitoring observations and trends. We compare PN magnitudes and trends during January and sample GEOS-Chem at the IMPROVE and CSN monitoring locations (Fig. S3). On average, GEOS-Chem underestimates wintertime PN mass concentrations by −33.6 % compared to ground observations (GEOS-Chem: 1.3 µg m−3, IMPROVE: 1.6 µg m−3, CSN: 2.3 µg m−3). The biases in modelled PN may be due to uncertainties in nighttime chemistry, especially N2O5 uptake and the extent to which residual upper-planetary boundary layer PN sinks to the ground, emissions inventories, aerosol liquid water, and wet deposition of HNO3 (Norman et al., 2025; Travis et al., 2022; Heald et al., 2012; Curci et al., 2015; Tang et al., 2021). Despite underestimation, GEOS-Chem shows good agreement with ground monitor trends, indicating that the sensitivity of PN to changes in emissions is captured. PN mass concentrations from GEOS-Chem show a decreasing trend from 2007 to 2013 (−10.3 ± 2.3 % yr−1), which then flattens from 2014 to 2022 (−0.14 ± 1.16 % yr−1). This is consistent with the trends from CSN and IMPROVE on average: PN decreases by −11.0 ± 4.5 % yr−1 from 2007 to 2013, and it flattens afterward to 1.1 ± 1.9 % yr−1. Thus, GEOS-Chem successfully captures the decrease and subsequent flattening trends of wintertime PN over both rural (IMPROVE) and urban (CSN) areas from 2007 to 2022. Modeled nitrate wet deposition is overestimated by 139 %, but nitrate wet deposition trends are also captured well by GEOS-Chem (Fig. S9) (Luo et al., 2020; Christiansen et al., 2024; Silvern et al., 2019).
3.1 Diagnosing PN sensitivity regime over the MWUS
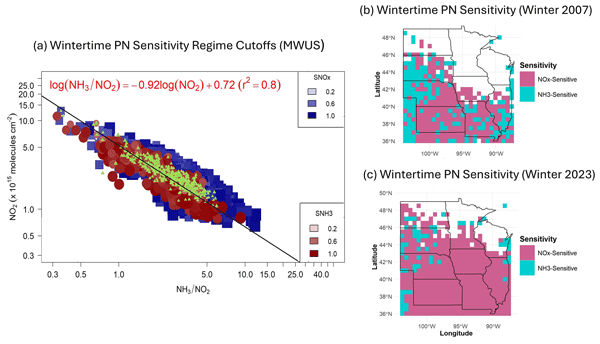
The local model sensitivity of PN, Si, is calculated by Eq. (3) for each model grid cell to derive the regime cutoffs using reduced-major-axis linear regression. PN is not sensitive to changes in VOC emissions (Reduced-VOC) at any point during the timeframe. In the Reduced-VOC simulation, changes in PN as a result of a 20 % decrease in VOC emissions range from 0.84 % to 4.0 %, which is substantially lower than changes seen in the Reduced-NOx and Reduced-NH3 simulations (range of 6.0 % to 21.6 %) (Fig. 2). Hence, SVOC is excluded from the regression, although it is shown in Fig. 3a for illustration.
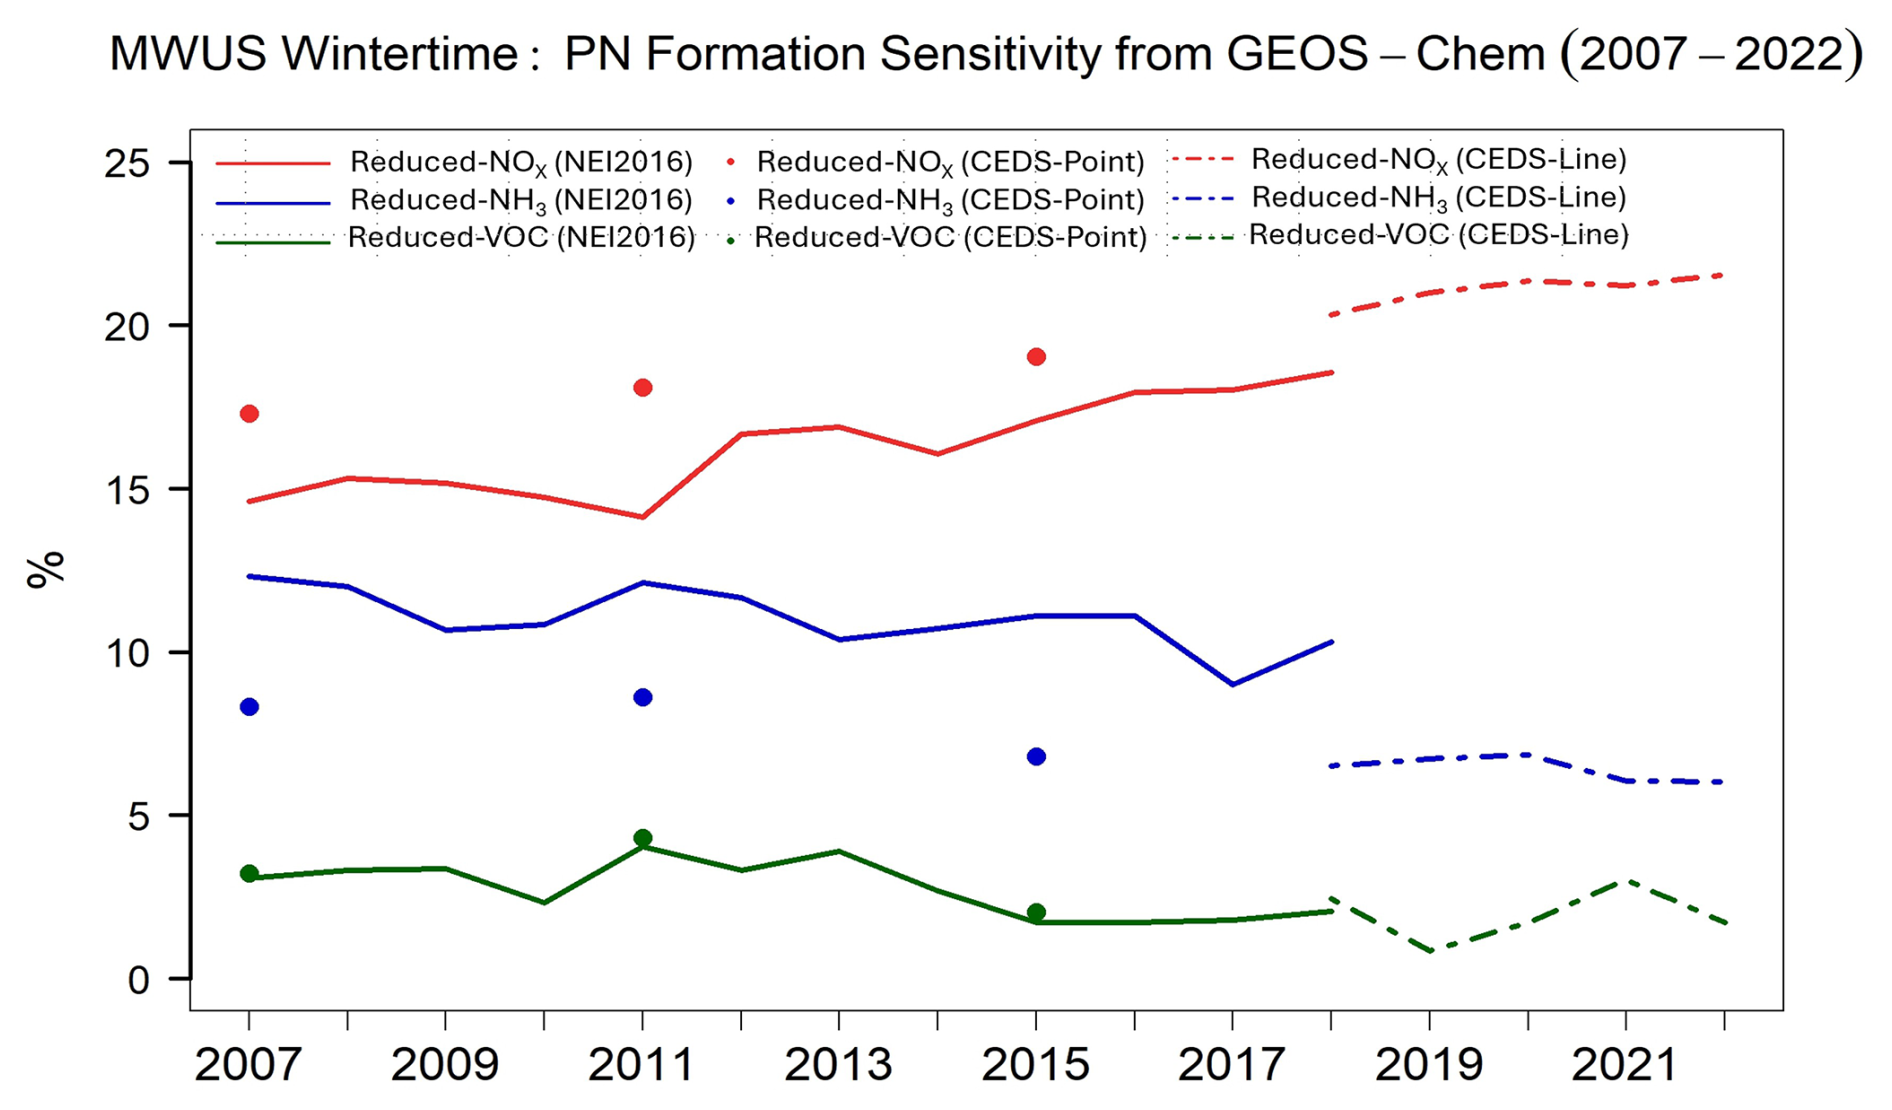
Figure 2The percentage difference in PN mass concentrations between the Base simulations and Reduced-NOx simulations (red), Base simulations and Reduced-NH3 simulations (blue), and Base simulations and Reduced-VOC simulations (green). The solid lines indicate sensitivity simulations using the NEI2016 emissions inventory, and the dashed lines and points indicate sensitivity simulations using the CEDS emissions inventory.
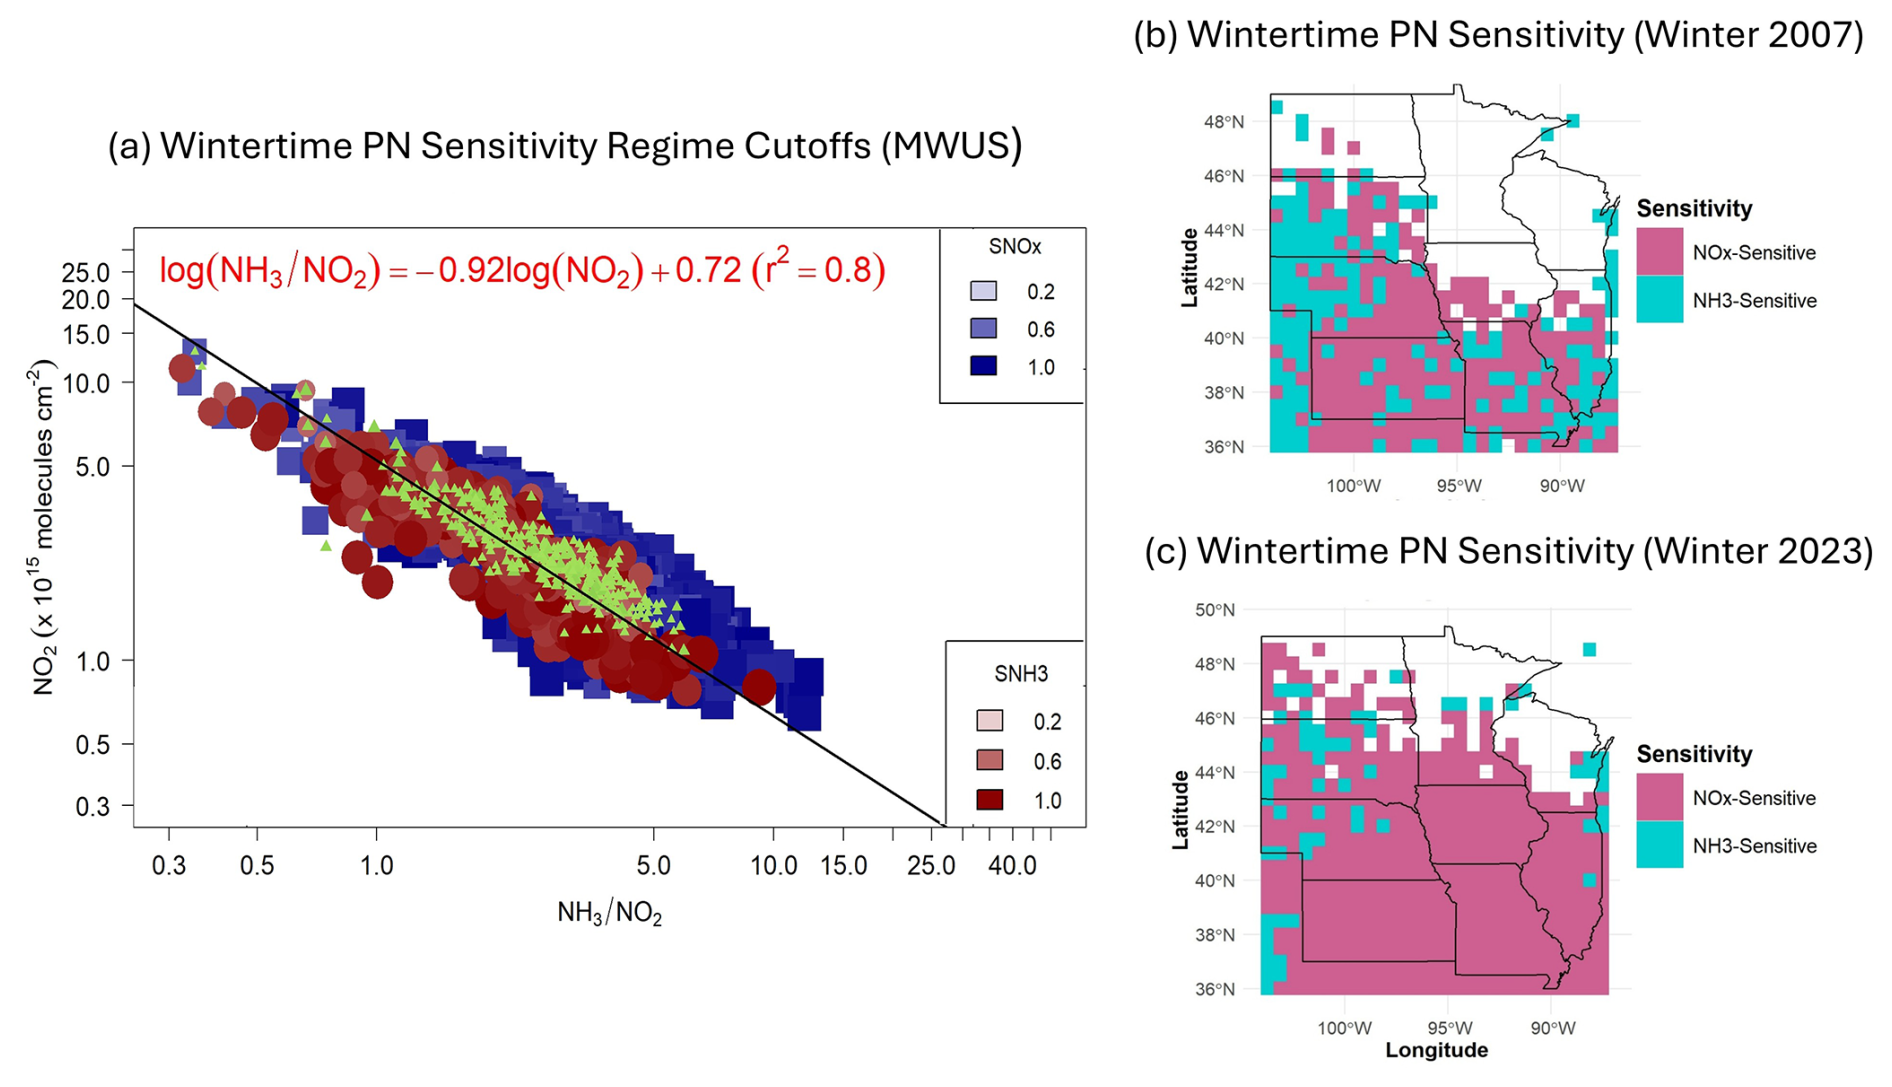
Figure 3Wintertime PN formation sensitivity over the MWUS. Panel (a) shows the wintertime PN diagnostic regime cutoffs using GEOS-Chem and satellite observations. The x axis is satellite tropospheric NH3 NO2 ratio, and the y axis is satellite NO2 column densities from OMI. The colors of the data points shown here are GEOS-Chem-calculated local PN sensitivity to each precursor gas (Si). The data points are GEOS-Chem-calculated sensitivity ratios (Si Sj > 1.1) in independent model grid cells. Blue squares represent the NOx-sensitive regime, red circles represent the NH3-sensitive regime, and green triangles represent the VOC-sensitive regime. As no pixels are dominated by VOC-sensitive regime (i.e., no SVOC Sj > 1.1), only pixels with sensitivity values SVOC > 0.2 are shown for illustration but not included in calculations. The regression line is derived via reduced-major-axis linear regression using pixels of all years with sensitivity ratios of 0.95 < Si Sj < 1.05. Panels (b) and (c) shows the wintertime PN formation sensitivity over the MWUS in 2007 and in 2023, respectively, after satellite grid cell ratios are placed into sensitivity regimes using Eqs. (4) and (5). In panels (b) and (c), pink indicates NOx-sensitive regions, and blue indicates NH3-sensitive regions.
In Fig. 3, each point represents a GEOS-Chem grid cell with a dominant wintertime PN sensitivity regime (i.e., Si Sj > 1.1) plotted at its corresponding independent satellite NO2 column densities and satellite tropospheric NH3 / NO2 ratios. Some overlap of data points in Fig. 3a is expected for two reasons: (1) this figure combines all dominant sites from 2007 to 2022, and (2) wintertime NOx and NH3 concentrations shift drastically across the timeframe. As noted previously, the trend in the shift of PN formation regimes is the same regardless of whether we determine formation regimes with individual-year or combined-year data (Fig. S8). After performing reduced-major-axis linear regression, the diagnostic cutoffs for NOx and NH3-senstive regimes are expressed by Inequalities (4) and (5).
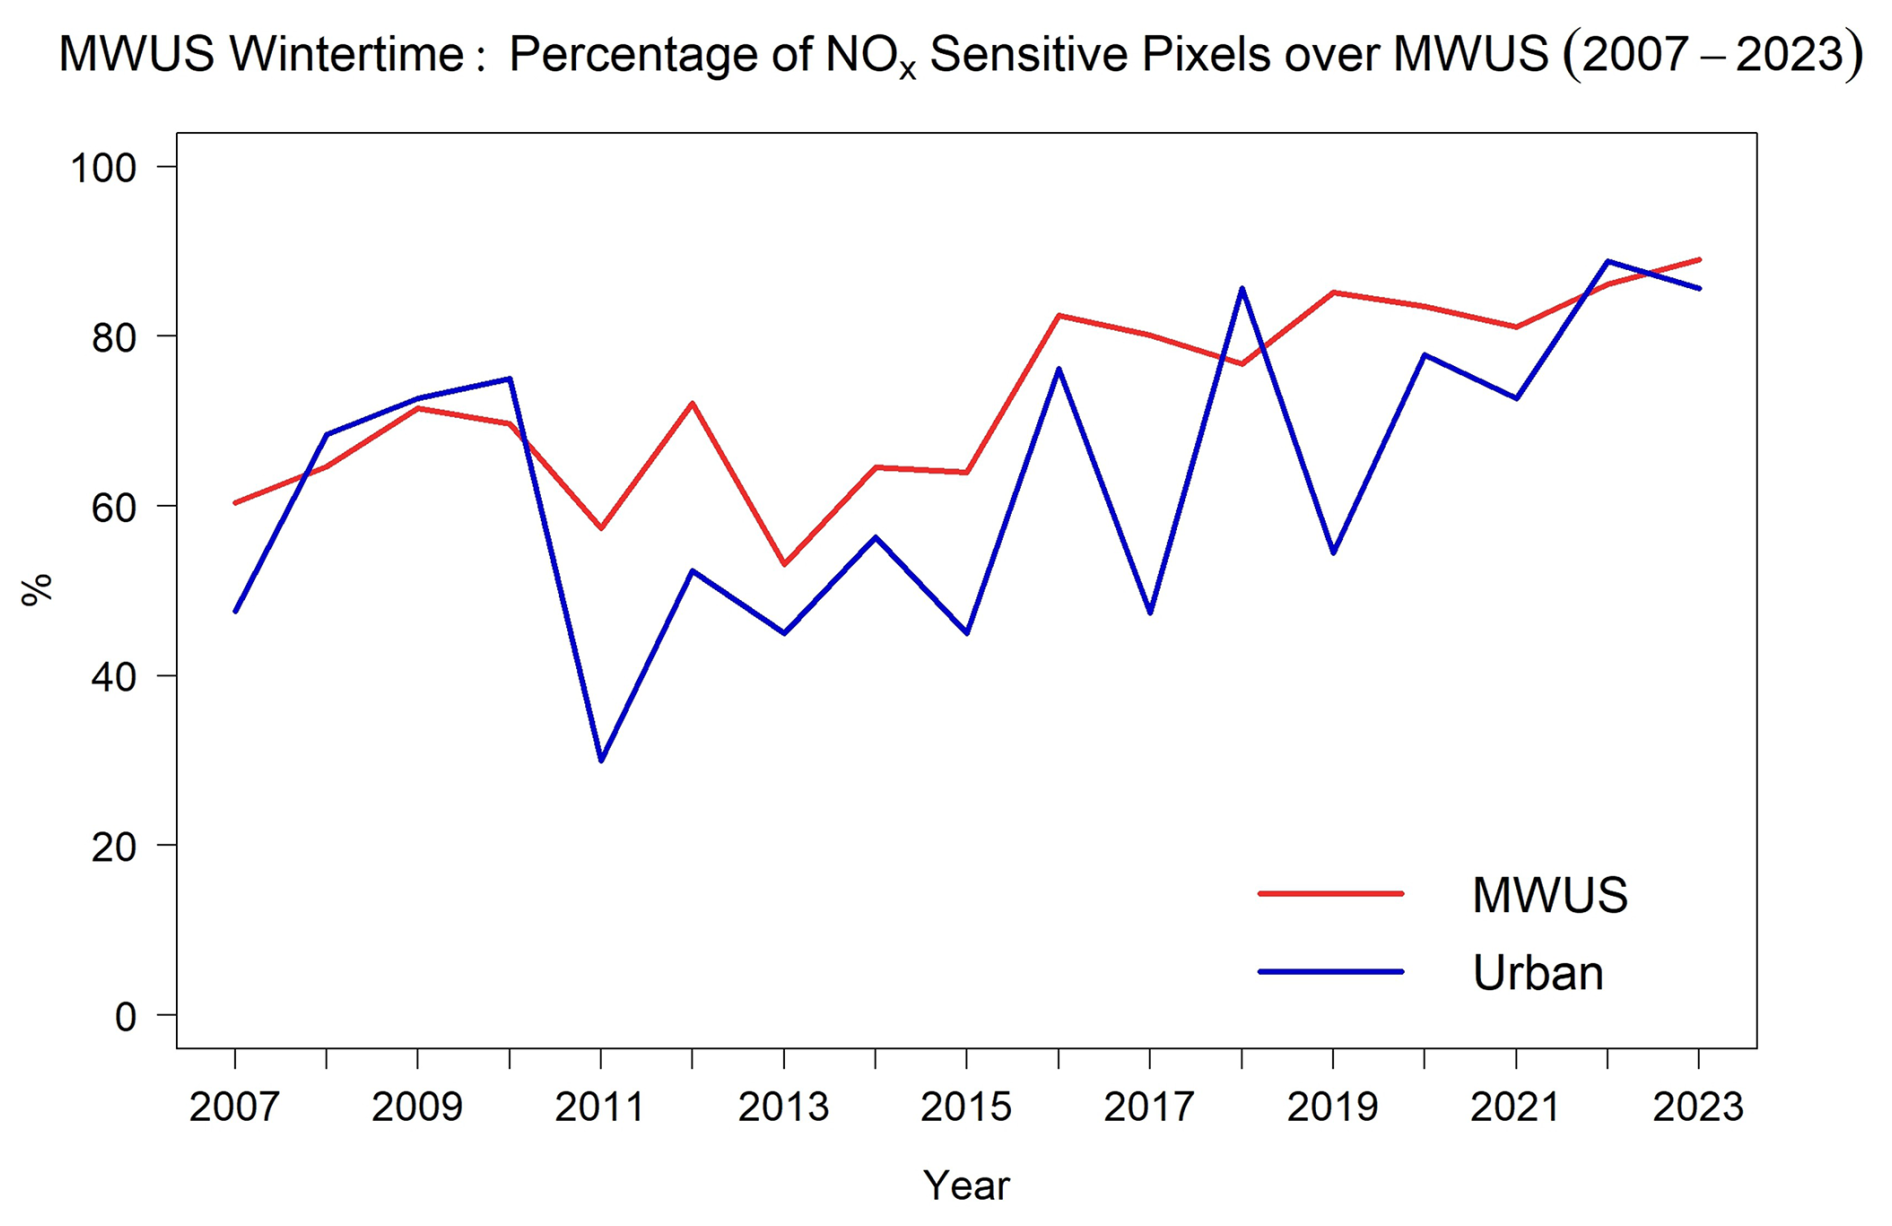
Figure 4The percentage of NOx-sensitive pixel counts over the MWUS (red) and over just urban areas (blue) (2007–2023).
The percent differences in PN mass concentrations between the Base and Reduced-NOx simulations increase from 14.6 % in 2007 to 21.6 % in 2022. By contrast, the percent differences between the Base and Reduced-NH3 simulations decrease from 12.3 % in 2007 to 6.0 % in 2022 (Fig. 2). Together, these results suggest that PN is becoming increasingly sensitive to NOx emissions and less sensitive to NH3 emissions. Our satellite-based results are consistent with an independent analysis of chemical mechanics (Sect. S1 in the Supplement) and PN thermodynamic sensitivity (Sect. S2). This is covered in more detail in the Supplement, but briefly, we use the thermodynamic equilibrium model ISORROPIA-II to investigate the thermodynamic sensitivity of PN and the roles of other potential drivers of trends (Fountoukis and Nenes, 2007). Our results suggest that the thermodynamics of wintertime PN formation over the MWUS is shifting away from NH3-sensitivity (Fig. S10 and Sect. S2), consistent with our satellite-based diagnostic, and that PN trends cannot be explained by changes in aerosol liquid water, meteorological variability, or N2O5 uptake (Sect. S1).
Quantitatively, the NOx-sensitive regime is the dominant regime in the MWUS, as the distribution of NOx-sensitive grid cells is always > 50 % (Fig. 4), and this is especially prevalent over the Central MWUS (Movie S1 in the Video supplement). In 2007, 60.4 % of the diagnosed pixels are NOx-sensitive, but this increases to 89.0 % in 2023 (Figs. 3 and 4). The largest shift in PN sensitivity over the MWUS occurs after 2013, where 76.9 % of the total diagnosed pixels are classified as NOx-sensitive on average from 2014 to 2023, compared to 66.0 % on average from 2007 to 2013 (Fig. 4). Satellite NO2 and NH3 column uncertainties may propagate to errors in classification. We find that accounting for the extreme ends of the uncertainty may cause a change in diagnosed sensitivity regime in ∼ 30 % of the classified grid cells, but wintertime PN formation shows a consistent shift toward a predominant NOx-sensitive regime after 2013 in all cases (Fig. S11). PN sensitivity over urban areas also follows the shifts in regime found for the rural MWUS (Fig. 4). Our findings are consistent with previous studies which diagnosed PN sensitivity over agricultural areas. Holt et al. (2015) found that the wintertime sensitivity of inorganic PM2.5 over Northern Midwest has become more sensitive to NOx emissions in 2012 compared to 2005 (Holt et al., 2015). Wintertime PN formation is also NOx-sensitive over South Korea, where 76 % of anthropogenic NH3 emissions originate from livestock (Oak et al., 2025). In addition, Guo et al. (2018) found that PN formation is more sensitive to NOx than NH3 during wintertime over an agricultural area in the Netherlands (Guo et al., 2018). Overall, our findings suggest that MWUS PN formation was sensitive to both changes in NOx and NH3 emissions from 2007 to 2013, but this has shifted to a predominantly NOx-sensitive regime afterward.
The distribution of PN sensitivity regimes from 2007 to 2023 over the MWUS is shown in Movie S1. Spatially, much of the shift in PN formation sensitivity is driven by changes in emissions over the eastern portion of the MWUS, which is more densely populated. In 2007, MWUS PN formation was highly sensitive to NH3 emissions over the eastern part of MWUS (Fig. 3b, c), which shifted strongly toward NOx sensitivity by 2023. The shift in formation regime is consistent with the spatial trends of NO2 and NH3 column densities (Movies S2–S4, Fig. S12).
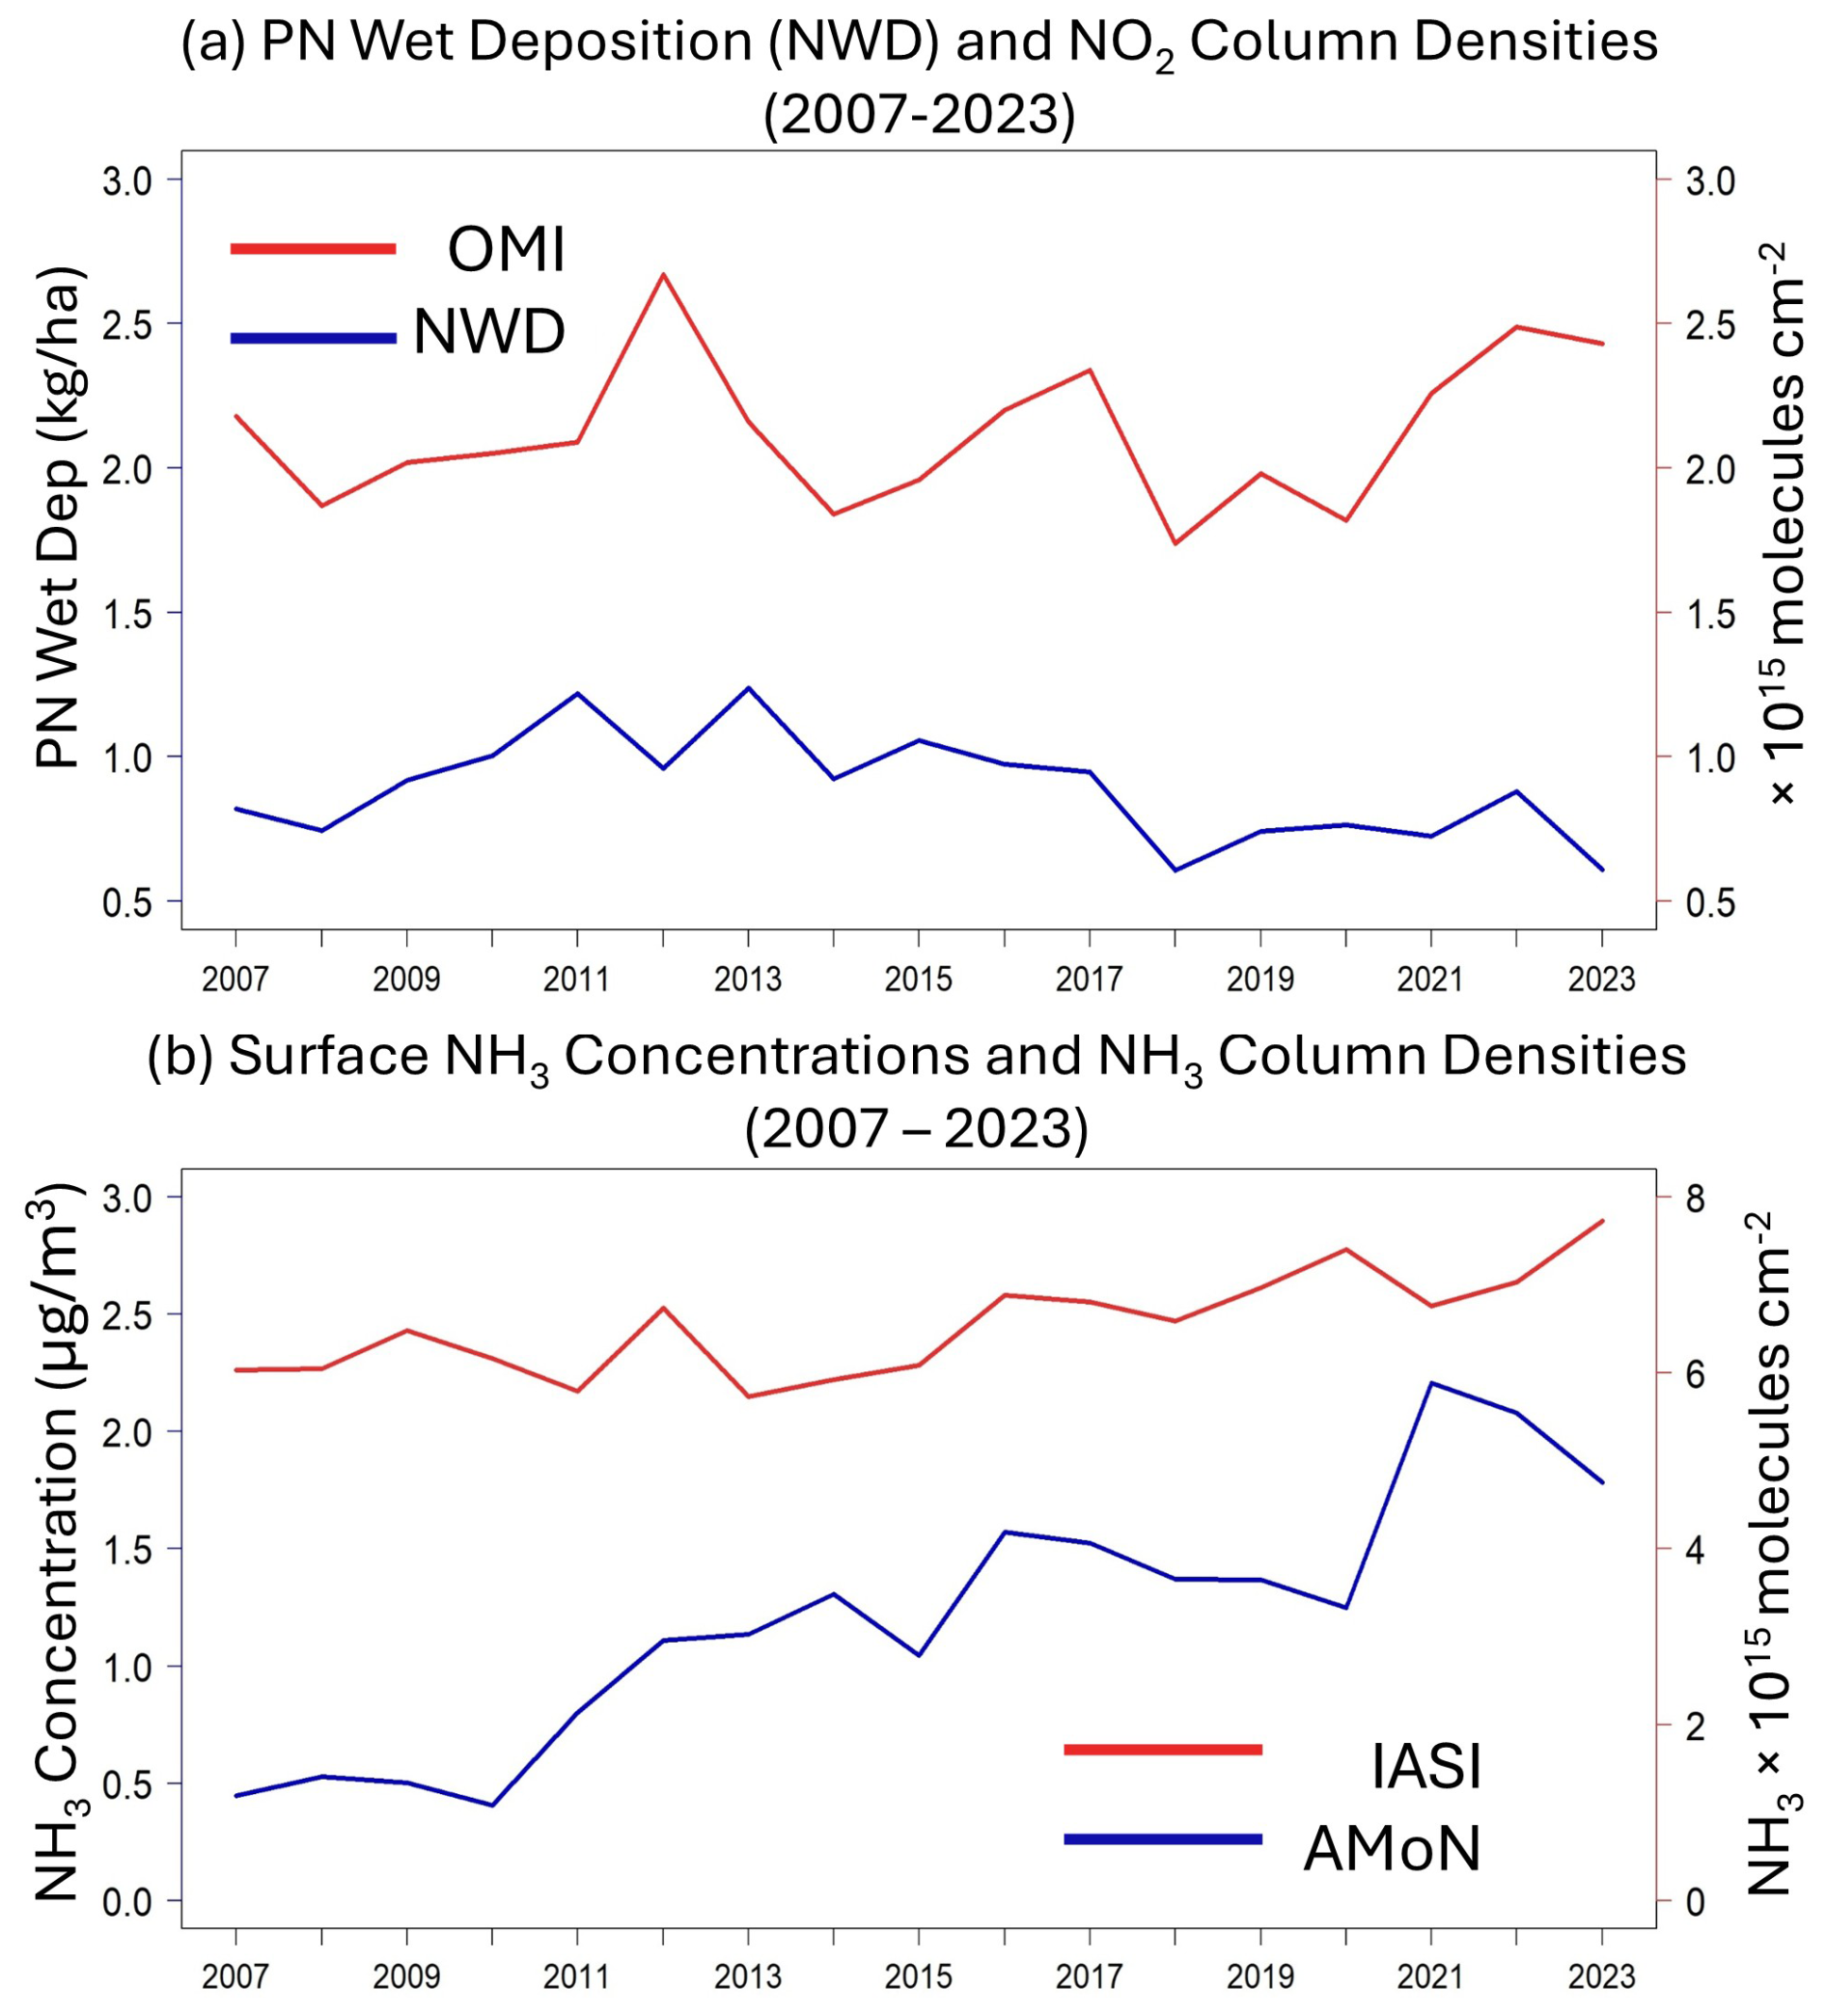
Figure 5Wintertime NO2 and NH3 column density trends over the MWUS (2007–2023). Panel (a) shows the trends between nitrate wet deposition (NWD) (blue) from NADP and NO2 column density over the MWUS (red) from OMI. Panel (b) shows the trends between surface NH3 concentrations (blue) from AMoN and NH3 column density (red) from IASI (2007–2023).
The shift in PN sensitivity regime over the MWUS is consistent with the trends in wintertime NO2 and NH3 satellite column densities and ground observations. We find that these trends cannot be explained by meteorological variability, and instead rely on aerosol chemistry and thermodynamic processes (Fig. S13 and Sect. S2). The trends of satellite NO2 and NH3 column densities from 2007 to 2023 with uncertainties are shown in Fig. S14. Trends in NO2 column densities stayed relatively flat from 2007 to 2023 (0.48 ± 0.60 % yr−1) (Fig. 5a). The relatively flat trends in satellite NO2 are consistent with prior analyses of satellite trends over rural areas and nitrate wet deposition (NWD), a good proxy for regional NO2. Prior decreases in rural NO2 have flattened out over time due to the increasing relative importance of static background NO2 sources, such as soils, lightning, and biomass burning, as anthropogenic NOx emissions decrease (Fig. S4) (Christiansen et al., 2024; Jiang et al., 2018; Silvern et al., 2019). This is consistent with the flattening trends in NWD, a proxy for regional NOx trends (Fig. S15). When we compare satellite NO2 to EPA monitors over urban areas, which are dominated by anthropogenic NOx emissions, by matching grid cells exactly, we find that NO2 concentrations and NO2 column density exhibit decreasing trends, which are −2.5 ± 0.5 % yr−1 and −1.2 ± 0.8 % yr−1, respectively. In contrast, wintertime NH3 column densities have increased from 2007 to 2023 by 1.3 ± 0.3 % yr−1 (Fig. 5b). The increase in NH3 columns agree with increases in surface NH3 concentrations reported by AMoN (8.2 ± 1.0 % yr−1) (Fig. 5b) and prior studies (Wang et al., 2023b). Interestingly, NH3 column densities significantly increase by 2.2 ± 0.5 % yr−1 from 2014 to 2023, a stronger rate compared to the relatively flat trends from 2007 to 2013 (−0.1 ± 1.2 % yr−1). This acceleration in NH3 column density over the MWUS may be attributed to wintertime agricultural emissions (Vo and Christiansen, 2024; Wang et al., 2023b; Yu et al., 2018). Over the MWUS, fertilizer application contributes ∼ 62 % of total agricultural NH3 emissions, and livestock waste contributes ∼ 38 % in 2020 (US EPA, 2020). The observed trends from both satellites and at the surface are consistent with PN sensitivity shifts toward the NOx-sensitive regime. This suggests that controlling wintertime NOx emissions over the MWUS is a critical mitigation strategy for reducing wintertime PN and PM2.5 burden.
3.2 Implications for particulate matter
Throughout the region, PN is the dominant wintertime component of the particle matrix. The average contributions of particle chemical components are 25.7 % for PN, 10.3 % for SO, and 19.5 % for OC over urban areas. The contribution of PN, SO and OC to total PM2.5 mass concentrations over rural areas are 32.3 %, 18.7 %, and 25.3 %, respectively (Fig. S16). Trends in observed PM2.5 and PN also align with our findings regarding formation sensitivity. Observations from the IMPROVE network and CSN show decreases in wintertime PM2.5 mass concentrations of −3.3 ± 0.6 % yr−1 from 2007 to 2023 over the MWUS (Fig. 6a). Prior to 2013, the decrease in PM2.5 was stronger compared to the trends after 2013, during which time the trends in PM2.5 started to level off (−7.1 ± 1.9 % yr−1 from 2007 to 2013, −1.0 ± 1.0 % yr−1 from 2014 to 2023). This similarity persists in PN mass concentrations. Overall, PN shows a decreasing trend of −3.4 ± 0.9 % yr−1. Prior to 2013, PN decreases by −6.3 ± 2.9 % yr−1, while the decreases after 2013 slow to −1.0 ± 2.3 % yr−1. These results suggest that PN and PM2.5 trends are mostly driven by changes in NO2, especially after 2013, when NH3 concentrations increase strongly and NO2 remains relatively constant (Fig. 6b). These trends are consistent across urban and rural sites (Fig. S13). Our model simulations also suggest that overall PM2.5 formation sensitivity is becoming more sensitive to NOx emissions (Fig. 7), similar to our findings for PN (Fig. 2).
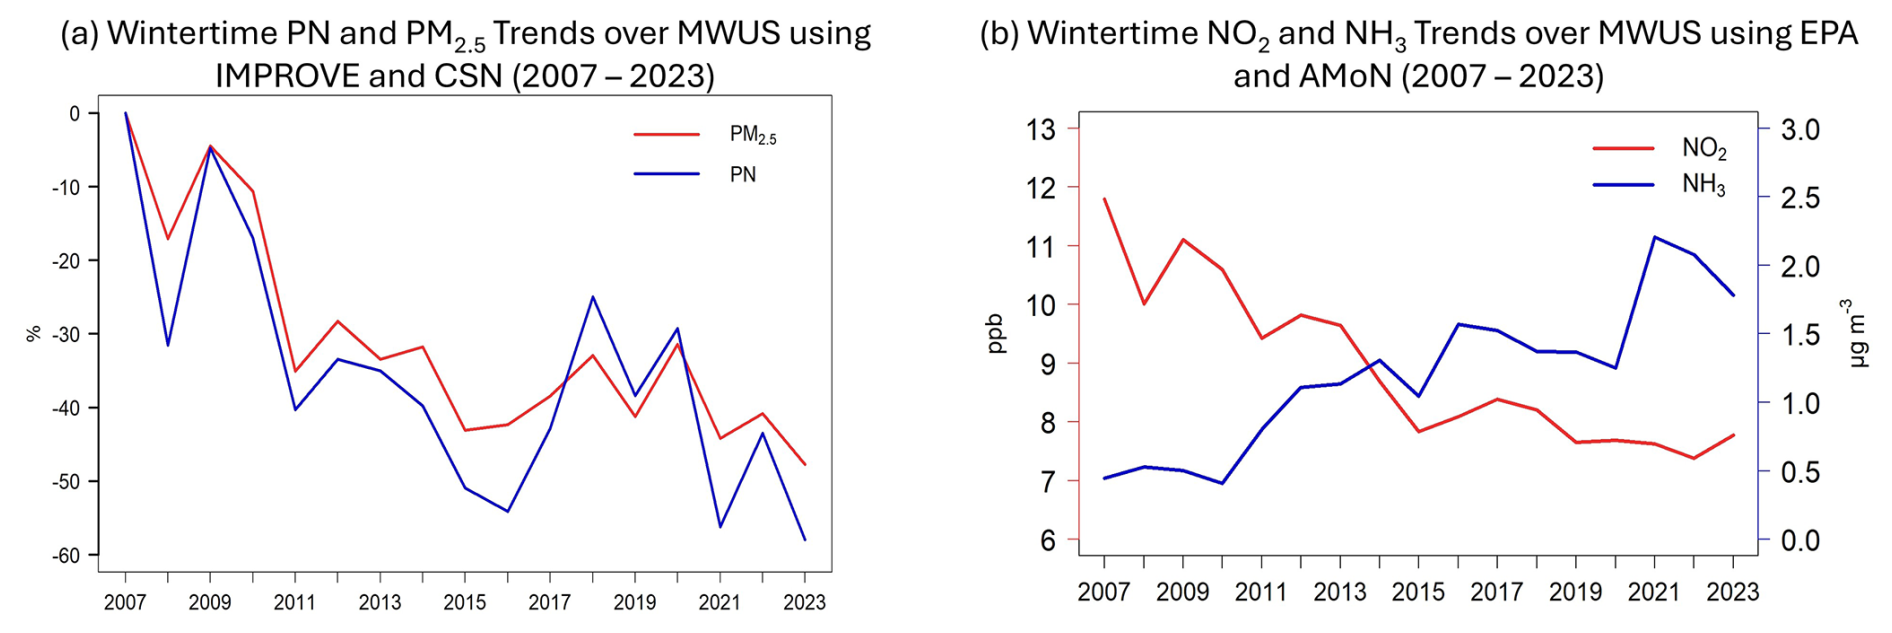
Figure 6Panel (a) shows the relative changes of PM2.5 (red) and PN (blue) since 2007 over the MWUS using IMPROVE and CSN ground monitoring observations. Panel (b) shows the wintertime trends in NO2 (red) and NH3 (blue) concentrations over the MWUS using AMoN and EPA ground monitoring observations.
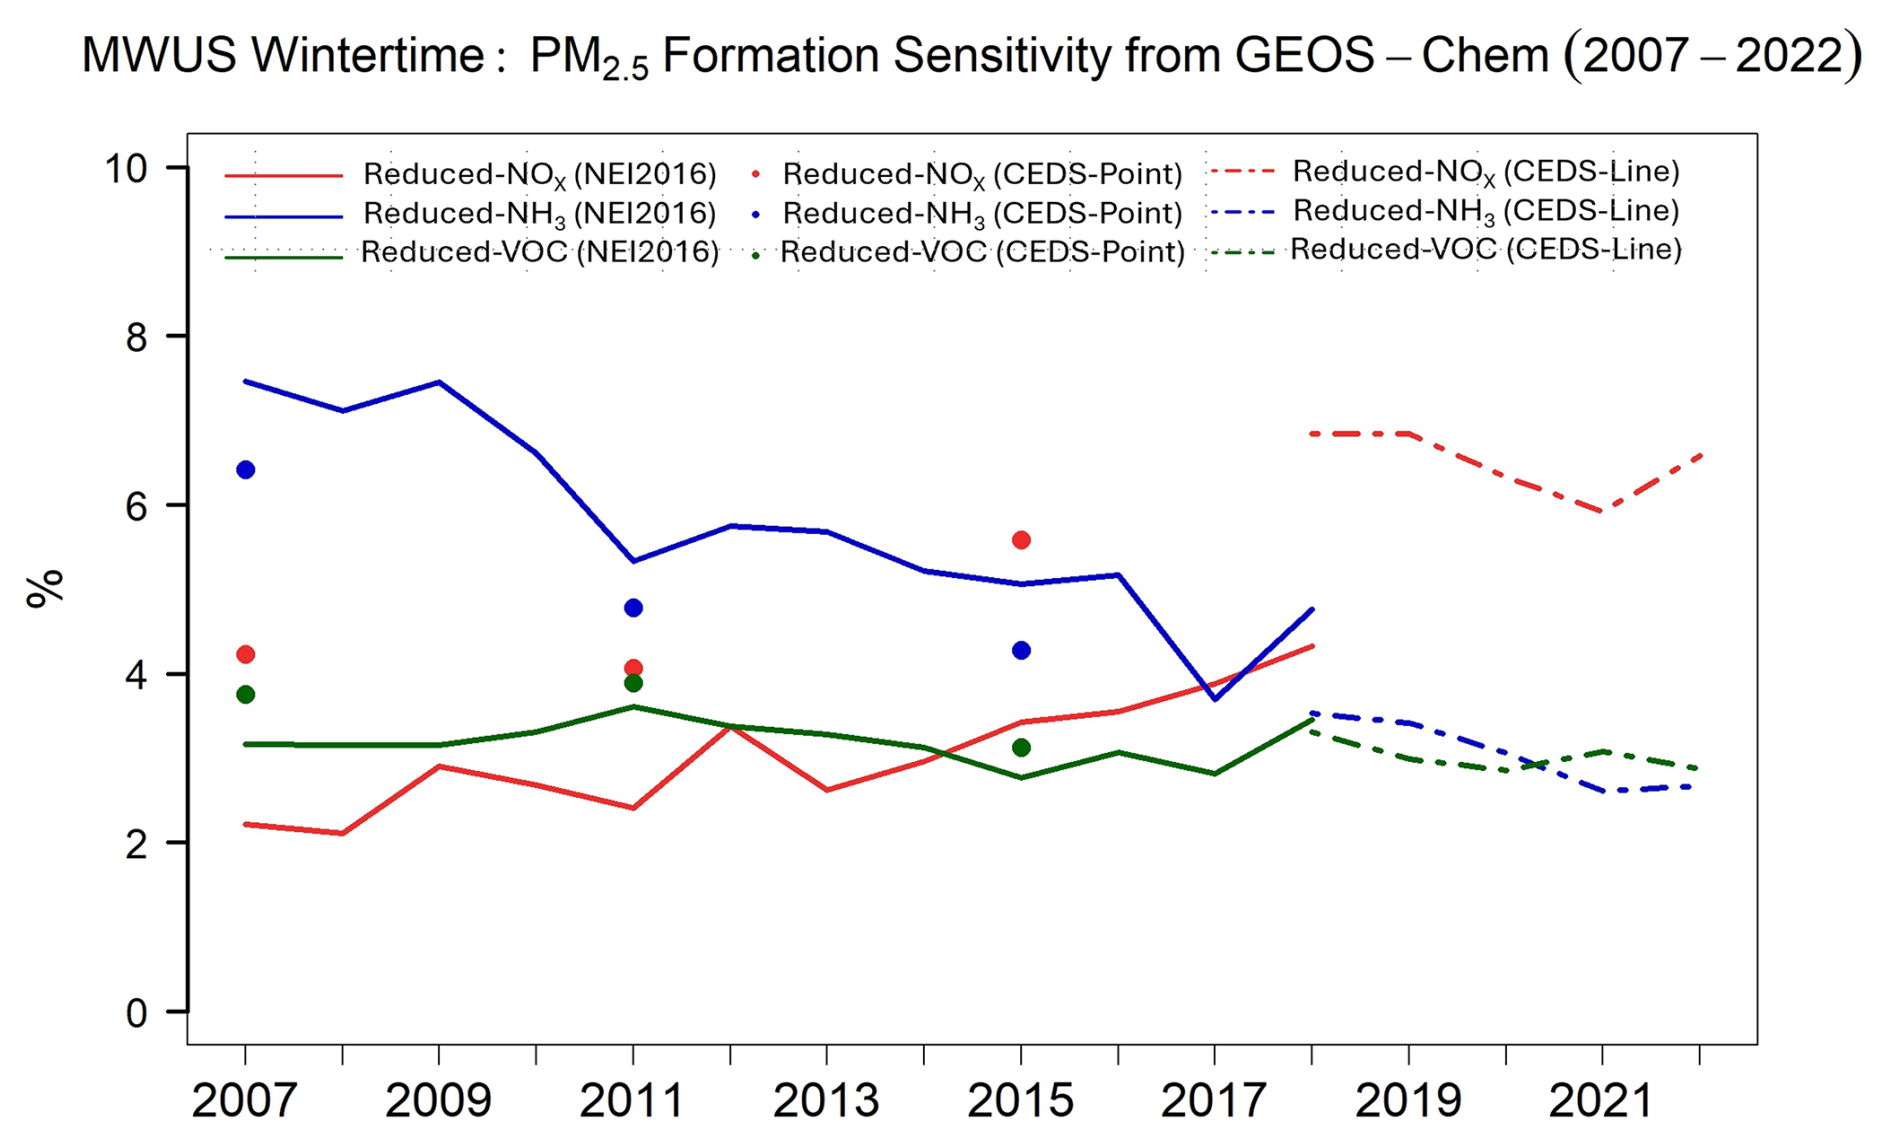
Figure 7The percentage difference in PM2.5 mass concentrations between the Base simulations and Reduced-NOx simulations (red), Base simulations and Reduced-NH3 simulations (blue), and Base simulations and Reduced-VOC simulations (green). The solid lines represent sensitivity simulations using the NEI2016 emissions inventory. The dashed lines and points represent sensitivity simulations using the CEDS emissions inventory.
The prominence of PN in the particle matrix, the similarity of PN and PM2.5 trends, and the increasing sensitivity of both PN and PM2.5 to NOx emissions all suggest that PN may be critical for determining wintertime PM2.5 burden and trends over the MWUS (Fig. S17). Hence, reducing PN would be most effective for reducing PM2.5 burden over the MWUS during winter. The most impactful timeframe for controlling wintertime PM2.5 via NH3 reduction in the MWUS may have already passed. Prior to the mid-2010s, regulating NH3 emissions during wintertime would have decreased PM2.5 mass concentrations more effectively over the MWUS compared to reducing NOx emissions, as reported in many studies starting in the mid-2000s (Gu et al., 2021; Makar et al., 2009; Pinder et al., 2007; Yang et al., 2022). This is consistent with our findings prior to 2010, in which the changes in PM2.5 burden are more sensitive to changes in NH3 emissions in almost half the region. However, during this time period, regulations focused on NOx and SO2 emissions, increasing formation sensitivity to NOx as emissions continued to decrease. After the late 2000s, reducing NH3 emissions has become increasingly less effective in controlling wintertime PN and thus PM2.5 burden. The percentage difference in wintertime PM2.5 mass concentrations between the Base and Reduced-NOx simulations gradually increases by 0.31 % yr−1 from 2007 to 2022 (2.2 % in 2007, 6.6 % in 2022), while it decreases by −0.33 % yr−1 in the Reduced-NH3 simulation (7.5 % in 2007, 2.7 % in 2022). This is consistent with the shifts in wintertime PN sensitivity. These trends are captured using both NEI2016 and CEDS emissions inventories (Fig. 7). Our findings are also consistent with more recent studies. In 2015, it was estimated that effective mitigation of PM2.5 in the MWUS may require anthropogenic NH3 emissions cuts of 60 %–90 % (Guo et al., 2024). This requirement will have only become harder to achieve since then. Similarly, Pan et al. (2024) suggested that regulating NH3 is becoming less effective as secondary inorganic aerosols have become less sensitive to NH, and reductions in NH concentrations of 40 %–70 % would be needed to reduce annual secondary inorganic aerosols over the rural United States (Pan et al., 2024). Holt et al. (2015) found that the sensitivity of wintertime inorganic PM2.5 shifted toward NOx emissions from 2005 to 2012, especially over the northern Midwest (Holt et al., 2015). Currently and in the future, NOx emissions reductions are likely the most effective way to control wintertime PN formation and PM2.5 burden in the MWUS.
It should be noted that, while PN is most sensitive to NOx in the winter, reducing NH3 emissions can still decrease PM2.5 burden with significant benefits within this season. Over the MWUS, despite having the lowest agricultural NH3 emissions compared to other seasons, a reduction of 0.01 Tg NH3 could decrease PM2.5 burden up to 3.7 % during wintertime, suggesting that reducing agricultural NH3 emissions may still have significant impacts over agricultural regions (Vo and Christiansen, 2024). Controlling NOx emissions will become increasingly costly, but agricultural NH3 emissions may be able to be targeted at a lower cost (Gu et al., 2021; Makar et al., 2009; Muller and Mendelsohn, 2007; Pinder et al., 2007). In addition, controlling local NOx production may become less effective for mitigating air quality concerns as regional sources (e.g., lightning, soils) become dominant contributors to NOx emissions and trends. Careful consideration of technological advancements and economic concerns will be needed for new regulations aimed at reducing PM2.5 burden over agricultural regions. This study was only focused on wintertime PN and PM2.5 burden, and sensitivity conditions in other seasons may differ, as both NOx and NH3 emissions show distinct seasonal patterns. This is an area for future investigation.
Our study shows that wintertime PN formation is becoming more sensitive to NOx emissions over the MWUS from 2007 to 2023. This is consistent with the relatively flat trends in satellite NO2 column densities (0.48 ± 0.60 % yr−1) and the continuous increases in satellite NH3 column densities (1.3 ± 0.3 % yr−1) from 2007 to 2023 over MWUS. VOCs do not influence the formation of PN over the MWUS. Our results indicate that it is most chemically effective to control NOx emissions to reduce wintertime PN and PM2.5 burden. The MWUS might have missed the most impactful window to control wintertime PM2.5 by reducing NH3 emissions. Future work to diagnose PN formation sensitivity over the MWUS across other seasons is needed to understand whether controlling NOx emissions is effective year-round. This work provides a chemical perspective for policymakers interested in effective emissions controls to improve air quality and human health over agriculturally intensive regions.
Data and R code used in this publication are available at https://doi.org/10.5281/zenodo.19638364 (Vo, 2026a).
Movies S1–S4 are available at: https://doi.org/10.5281/zenodo.20669721 (Vo, 2026b)
The supplement related to this article is available online at https://doi.org/10.5194/acp-26-9493-2026-supplement.
AC designed and directed the projects. TV performed the research, compiled and analyzed the data, conducted model simulations, and prepared the manuscript.
The contact author has declared that neither of the authors has any competing interests.
Publisher's note: Copernicus Publications remains neutral with regard to jurisdictional claims made in the text, published maps, institutional affiliations, or any other geographical representation in this paper. The authors bear the ultimate responsibility for providing appropriate place names. Views expressed in the text are those of the authors and do not necessarily reflect the views of the publisher.
We would like to acknowledge Krotkov et al. (2019) for publicly available NO2 column densities and Clarisse and Coheur (2018a, b) for NH3 column densities. The computational for this work was performed on the high-performance computing infrastructure operated by Research Support Solutions in the Division of IT at the University of Missouri, Columbia MO on the Hellbender cluster (DOI: https://doi.org/10.32469/10355/97710). We thank the National Atmospheric Deposition Program for providing open-access data for gaseous NH3 concentrations and nitrate wet deposition over the United States. We also acknowledge the United States Environmental Agency for publicly available surface NO2 concentrations, PM2.5 mass concentrations and particle chemical speciation data over urban areas. We also acknowledge the Interagency Monitoring of PROtected Visual Environments (IMRPOVE) for the public availability of PM2.5 mass concentrations and particle chemical speciation data over rural areas. Lastly, we thank Daniel Jacob for the development and public availability of GEOS-Chem.
This paper was edited by Yves Balkanski and reviewed by three anonymous referees.
Ammonia Monitoring Network (AMoN): https://nadp.slh.wisc.edu/networks/ammonia-monitoring-network/, National Atmospheric Deposition Program, last access: 1 November 2025.
Boersma, K. F., Vinken, G. C. M., and Eskes, H. J.: Representativeness errors in comparing chemistry transport and chemistry climate models with satellite UV–Vis tropospheric column retrievals, Geosci. Model Dev., 9, 875–898, https://doi.org/10.5194/gmd-9-875-2016, 2016.
Cao, Y., Ma, Q., Chu, B., and He, H.: Homogeneous and heterogeneous photolysis of nitrate in the atmosphere: state of the science, current research needs, and future prospects, Frontiers of Environmental Science & Engineering, 17, 1–18, https://doi.org/10.1007/s11783-023-1648-6, 2022.
Christiansen, A., Mickley, L. J., and Hu, L.: Constraining long-term NOx emissions over the United States and Europe using nitrate wet deposition monitoring networks, Atmos. Chem. Phys., 24, 4569–4589, https://doi.org/10.5194/acp-24-4569-2024, 2024.
Christiansen, A. E., Carlton, A. G., and Porter, W. C.: Changing Nature of Organic Carbon over the United States, Environ. Sci. Technol., 54, 10524–10532, https://doi.org/10.1021/acs.est.0c02225, 2020.
Clarisse, L. and Coheur, P.-F.: Reanalyzed daily IASI/Metop-A ULB-LATMOS ammonia (NH3) L2 product (total column), Aeris [data set], https://doi.org/10.25326/12, 2018a.
Clarisse, L. and Coheur, P.-F.: Reanalyzed daily IASI/Metop-B ULB-LATMOS ammonia (NH3) L2 product (total column), Aeris [data set], https://doi.org/10.25326/13, 2018b.
Clerbaux, C., Boynard, A., Clarisse, L., George, M., Hadji-Lazaro, J., Herbin, H., Hurtmans, D., Pommier, M., Razavi, A., Turquety, S., Wespes, C., and Coheur, P.-F.: Monitoring of atmospheric composition using the thermal infrared IASI/MetOp sounder, Atmos. Chem. Phys., 9, 6041–6054, https://doi.org/10.5194/acp-9-6041-2009, 2009.
Curci, G., Ferrero, L., Tuccella, P., Barnaba, F., Angelini, F., Bolzacchini, E., Carbone, C., Denier van der Gon, H. A. C., Facchini, M. C., Gobbi, G. P., Kuenen, J. P. P., Landi, T. C., Perrino, C., Perrone, M. G., Sangiorgi, G., and Stocchi, P.: How much is particulate matter near the ground influenced by upper-level processes within and above the PBL? A summertime case study in Milan (Italy) evidences the distinctive role of nitrate, Atmos. Chem. Phys., 15, 2629–2649, https://doi.org/10.5194/acp-15-2629-2015, 2015.
Dang, R., Jacob, D. J., Shah, V., Eastham, S. D., Fritz, T. M., Mickley, L. J., Liu, T., Wang, Y., and Wang, J.: Background nitrogen dioxide (NO2) over the United States and its implications for satellite observations and trends: effects of nitrate photolysis, aircraft, and open fires, Atmos. Chem. Phys., 23, 6271–6284, https://doi.org/10.5194/acp-23-6271-2023, 2023a.
Dang, R., Jacob, D. J., Zhai, S., Coheur, P., Clarisse, L., Van Damme, M., Pendergrass, D. C., Choi, J., Park, J., Liu, Z., and Liao, H.: Diagnosing the Sensitivity of Particulate Nitrate to Precursor Emissions Using Satellite Observations of Ammonia and Nitrogen Dioxide, Geophys. Res. Lett., 50, e2023GL105761, https://doi.org/10.1029/2023GL105761, 2023b.
Dang, R., Jacob, D. J., Zhai, S., Yang, L. H., Pendergrass, D. C., Coheur, P., Clarisse, L., Van Damme, M., Choi, J., Park, J., Liu, Z., Xie, P., and Liao, H.: A Satellite-Based Indicator for Diagnosing Particulate Nitrate Sensitivity to Precursor Emissions: Application to East Asia, Europe, and North America, Environ. Sci. Technol., 58, 20101–20113, https://doi.org/10.1021/acs.est.4c08082, 2024.
Darmenov, A. S. and da Silva, A. M.: The Quick Fire Emissions Dataset (QFED): Documentation of Versions 2.1, 2.2 and 2.4: Technical Report Series on Global Modeling and Data Assimilation – Volume 38, edited by: Koster, R. D., NASA, https://ntrs.nasa.gov/citations/20180005253 (last access: 1 April 2026), 2015.
Demerjian, K. L.: A review of national monitoring networks in North America, Atmos. Environ., 34, 1861–1884, https://doi.org/10.1016/S1352-2310(99)00452-5, 2000.
Di, Q., Wang, Y., Zanobetti, A., Wang, Y., Koutrakis, P., Choirat, C., Dominici, F., and Schwartz, J. D.: Air Pollution and Mortality in the Medicare Population, New Engl. J. Med., 376, 2513–2522, https://doi.org/10.1056/NEJMoa1702747, 2017.
Fenn, M. E., Bytnerowicz, A., Schilling, S. L., Vallano, D. M., Zavaleta, E. S., Weiss, S. B., Morozumi, C., Geiser, L. H., and Hanks, K.: On-road emissions of ammonia: An underappreciated source of atmospheric nitrogen deposition, Sci. Total Environ., 625, 909–919, https://doi.org/10.1016/j.scitotenv.2017.12.313, 2018.
Fioletov, V., McLinden, C. A., Griffin, D., Krotkov, N., Liu, F., and Eskes, H.: Quantifying urban, industrial, and background changes in NO2 during the COVID-19 lockdown period based on TROPOMI satellite observations, Atmos. Chem. Phys., 22, 4201–4236, https://doi.org/10.5194/acp-22-4201-2022, 2022.
Fountoukis, C. and Nenes, A.: ISORROPIA II: a computationally efficient thermodynamic equilibrium model for K+; Ca2+; Mg2+; NH; Na+; SO; NO; Cl−; H2O aerosols, Atmos. Chem. Phys., 7, 4639–4659, https://doi.org/10.5194/acp-7-4639-2007, 2007.
Franchin, A., Fibiger, D. L., Goldberger, L., McDuffie, E. E., Moravek, A., Womack, C. C., Crosman, E. T., Docherty, K. S., Dube, W. P., Hoch, S. W., Lee, B. H., Long, R., Murphy, J. G., Thornton, J. A., Brown, S. S., Baasandorj, M., and Middlebrook, A. M.: Airborne and ground-based observations of ammonium-nitrate-dominated aerosols in a shallow boundary layer during intense winter pollution episodes in northern Utah, Atmos. Chem. Phys., 18, 17259–17276, https://doi.org/10.5194/acp-18-17259-2018, 2018.
Gelaro, R., McCarty, W., Suárez, M. J., Todling, R., Molod, A., Takacs, L., Randles, C. A., Darmenov, A., Bosilovich, M. G., Reichle, R., Wargan, K., Coy, L., Cullather, R., Draper, C., Akella, S., Buchard, V., Conaty, A., Silva, A. M. da, Gu, W., Kim, G.-K., Koster, R., Lucchesi, R., Merkova, D., Nielsen, J. E., Partyka, G., Pawson, S., Putman, W., Rienecker, M., Schubert, S. D., Sienkiewicz, M., and Zhao, B.: The Modern-Era Retrospective Analysis for Research and Applications, Version 2 (MERRA-2), J. Climate, 30, 5419–5454, https://doi.org/10.1175/JCLI-D-16-0758.1, 2017.
Gen, M., Liang, Z., Zhang, R., Go, B. R., and Chan, C. K.: Particulate nitrate photolysis in the atmosphere, Environ. Sci.: Atmos., 2, 111–127, https://doi.org/10.1039/D1EA00087J, 2022.
Gu, B., Zhang, L., Van Dingenen, R., Vieno, M., Van Grinsven, H. J., Zhang, X., Zhang, S., Chen, Y., Wang, S., Ren, C., Rao, S., Holland, M., Winiwarter, W., Chen, D., Xu, J., and Sutton, M. A.: Abating ammonia is more cost-effective than nitrogen oxides for mitigating PM2.5 air pollution, Science, 374, 758–762, https://doi.org/10.1126/science.abf8623, 2021.
Guenther, A. B., Jiang, X., Heald, C. L., Sakulyanontvittaya, T., Duhl, T., Emmons, L. K., and Wang, X.: The Model of Emissions of Gases and Aerosols from Nature version 2.1 (MEGAN2.1): an extended and updated framework for modeling biogenic emissions, Geosci. Model Dev., 5, 1471–1492, https://doi.org/10.5194/gmd-5-1471-2012, 2012.
Guo, H., Otjes, R., Schlag, P., Kiendler-Scharr, A., Nenes, A., and Weber, R. J.: Effectiveness of ammonia reduction on control of fine particle nitrate, Atmos. Chem. Phys., 18, 12241–12256, https://doi.org/10.5194/acp-18-12241-2018, 2018.
Guo, Y., Zhang, L., Winiwarter, W., Grinsven, H. J. M. van, Wang, X., Li, K., Pan, D., Liu, Z., and Gu, B.: Ambitious nitrogen abatement is required to mitigate future global PM2.5 air pollution toward the World Health Organization targets, One Earth, 7, 1600–1613, https://doi.org/10.1016/j.oneear.2024.08.007, 2024.
Hand, J. L., Schichtel, B. A., Pitchford, M., Malm, W. C., and Frank, N. H.: Seasonal composition of remote and urban fine particulate matter in the United States, J. Geophys. Res.-Atmos., 117, D05209, https://doi.org/10.1029/2011JD017122, 2012.
He, T.-L., Jones, D. B. A., Miyazaki, K., Huang, B., Liu, Y., Jiang, Z., White, E. C., Worden, H. M., and Worden, J. R.: Deep Learning to Evaluate US NOx Emissions Using Surface Ozone Predictions, J. Geophys. Res.-Atmos., 127, e2021JD035597, https://doi.org/10.1029/2021JD035597, 2022.
Heald, C. L., Collett Jr., J. L., Lee, T., Benedict, K. B., Schwandner, F. M., Li, Y., Clarisse, L., Hurtmans, D. R., Van Damme, M., Clerbaux, C., Coheur, P.-F., Philip, S., Martin, R. V., and Pye, H. O. T.: Atmospheric ammonia and particulate inorganic nitrogen over the United States, Atmos. Chem. Phys., 12, 10295–10312, https://doi.org/10.5194/acp-12-10295-2012, 2012.
Hoesly, R. M., Smith, S. J., Feng, L., Klimont, Z., Janssens-Maenhout, G., Pitkanen, T., Seibert, J. J., Vu, L., Andres, R. J., Bolt, R. M., Bond, T. C., Dawidowski, L., Kholod, N., Kurokawa, J.-I., Li, M., Liu, L., Lu, Z., Moura, M. C. P., O'Rourke, P. R., and Zhang, Q.: Historical (1750–2014) anthropogenic emissions of reactive gases and aerosols from the Community Emissions Data System (CEDS), Geosci. Model Dev., 11, 369–408, https://doi.org/10.5194/gmd-11-369-2018, 2018.
Holt, J., Selin, N. E., and Solomon, S.: Changes in Inorganic Fine Particulate Matter Sensitivities to Precursors Due to Large-Scale US Emissions Reductions, Environ. Sci. Technol., 49, 4834–4841, https://doi.org/10.1021/acs.est.5b00008, 2015.
Hu, L., Millet, D. B., Baasandorj, M., Griffis, T. J., Turner, P., Helmig, D., Curtis, A. J., and Hueber, J.: Isoprene emissions and impacts over an ecological transition region in the U.S. Upper Midwest inferred from tall tower measurements, J. Geophys. Res.-Atmos., 120, 3553–3571, https://doi.org/10.1002/2014JD022732, 2015.
Hudman, R. C., Moore, N. E., Mebust, A. K., Martin, R. V., Russell, A. R., Valin, L. C., and Cohen, R. C.: Steps towards a mechanistic model of global soil nitric oxide emissions: implementation and space based-constraints, Atmos. Chem. Phys., 12, 7779–7795, https://doi.org/10.5194/acp-12-7779-2012, 2012.
Interagency Monitoring of PROtected Visual Environments: IMPROVE Data [data set], https://views.cira.colostate.edu/fed/QueryWizard/, last access: 1 November 2025.
Inventory Collaborative 2016v1 Emissions Modeling Platform: Specification Sheet: AG, https://views.cira.colostate.edu/wiki/Attachments/Inventory Collaborative/Documentation/2016v1/after_comments/National-Emissions-Collaborative_2016v1_nonpoint-ag_25Feb2020.pdf (last access: 12 March 2026), 2020.
Jefferson, A., Hageman, D., Morrow, H., Mei, F., and Watson, T.: Seven years of aerosol scattering hygroscopic growth measurements from SGP: Factors influencing water uptake, J. Geophys. Res.-Atmos., 122, 9451–9466, https://doi.org/10.1002/2017JD026804, 2017.
Jiang, Z., McDonald, B. C., Worden, H., Worden, J. R., Miyazaki, K., Qu, Z., Henze, D. K., Jones, D. B. A., Arellano, A. F., Fischer, E. V., Zhu, L., and Boersma, K. F.: Unexpected slowdown of US pollutant emission reduction in the past decade, P. Natl. Acad. Sci. USA, 115, 5099–5104, https://doi.org/10.1073/pnas.1801191115, 2018.
Jiang, Z., Zhu, R., Miyazaki, K., McDonald, B. C., Klimont, Z., Zheng, B., Boersma, K. F., Zhang, Q., Worden, H., Worden, J. R., Henze, D. K., Jones, D. B. A., Denier van de Gon, H. A. C., and Eskes, H.: Decadal variabilities in tropospheric nitrogen oxides over United States, Europe, and China, J. Geophys. Res.-Atmos., 127, e2021JD035872, https://doi.org/10.1029/2021JD035872, 2022.
Keller, C. A., Long, M. S., Yantosca, R. M., Da Silva, A. M., Pawson, S., and Jacob, D. J.: HEMCO v1.0: a versatile, ESMF-compliant component for calculating emissions in atmospheric models, Geosci. Model Dev., 7, 1409–1417, https://doi.org/10.5194/gmd-7-1409-2014, 2014.
Krotkov, N. A., Lamsal, L. N., Marchenko, S. V., Bucsela, E. J., Swartz, W. H., Joiner, J., and the OMI Core Team: OMI/Aura Nitrogen Dioxide (NO2) Total and Tropospheric Column 1-orbit L2 Swath 13x24 km V003, Goddard Earth Sciences Data and Information Services Center (GES DISC) [data set], Greenbelt, MD, USA, https://doi.org/10.5067/Aura/OMI/DATA2017, 2019.
Lamb, D. and Bowersox, V.: The national atmospheric deposition program: an overview, Atmos. Environ., 34, 1661–1663, https://doi.org/10.1016/S1352-2310(99)00425-2, 2000.
Lamsal, L. N., Martin, R. V., van Donkelaar, A., Celarier, E. A., Bucsela, E. J., Boersma, K. F., Dirksen, R., Luo, C., and Wang, Y.: Indirect validation of tropospheric nitrogen dioxide retrieved from the OMI satellite instrument: Insight into the seasonal variation of nitrogen oxides at northern midlatitudes, J. Geophys. Res.-Atmos., 115, https://doi.org/10.1029/2009JD013351, 2010.
Lamsal, L. N., Krotkov, N. A., Vasilkov, A., Marchenko, S., Qin, W., Yang, E.-S., Fasnacht, Z., Joiner, J., Choi, S., Haffner, D., Swartz, W. H., Fisher, B., and Bucsela, E.: Ozone Monitoring Instrument (OMI) Aura nitrogen dioxide standard product version 4.0 with improved surface and cloud treatments, Atmos. Meas. Tech., 14, 455–479, https://doi.org/10.5194/amt-14-455-2021, 2021.
Luo, G., Yu, F., and Moch, J. M.: Further improvement of wet process treatments in GEOS-Chem v12.6.0: impact on global distributions of aerosols and aerosol precursors, Geosci. Model Dev., 13, 2879–2903, https://doi.org/10.5194/gmd-13-2879-2020, 2020.
Makar, P. A., Moran, M. D., Zheng, Q., Cousineau, S., Sassi, M., Duhamel, A., Besner, M., Davignon, D., Crevier, L.-P., and Bouchet, V. S.: Modelling the impacts of ammonia emissions reductions on North American air quality, Atmos. Chem. Phys., 9, 7183–7212, https://doi.org/10.5194/acp-9-7183-2009, 2009.
Malm, W. C., Sisler, J. F., Huffman, D., Eldred, R. A., and Cahill, T. A.: Spatial and seasonal trends in particle concentration and optical extinction in the United States, J. Geophys. Res.-Atmos., 99, 1347–1370, https://doi.org/10.1029/93JD02916, 1994.
Muller, N. Z. and Mendelsohn, R.: Measuring the damages of air pollution in the United States, J. Environmental Economics and Management, 54, 1–14, https://doi.org/10.1016/j.jeem.2006.12.002, 2007.
National Emissions Inventory Collaborative: 2016v1 Emissions Modeling Platform, http://views.cira.colostate.edu/wiki/wiki/10202 (last access: 31 October 2025), 2019.
National Trends Network: National Atmospheric Deposition Program, NTN Weekly Data [data set], https://nadp.slh.wisc.edu/networks/national-trends-network/, last access: 1 November 2025.
Nenes, A., Pandis, S. N., Weber, R. J., and Russell, A.: Aerosol pH and liquid water content determine when particulate matter is sensitive to ammonia and nitrate availability, Atmos. Chem. Phys., 20, 3249–3258, https://doi.org/10.5194/acp-20-3249-2020, 2020.
Norman, O. G., Heald, C. L., Bililign, S., Campuzano-Jost, P., Coe, H., Fiddler, M. N., Green, J. R., Jimenez, J. L., Kaiser, K., Liao, J., Middlebrook, A. M., Nault, B. A., Nowak, J. B., Schneider, J., and Welti, A.: Exploring the processes controlling secondary inorganic aerosol: evaluating the global GEOS-Chem simulation using a suite of aircraft campaigns, Atmos. Chem. Phys., 25, 771–795, https://doi.org/10.5194/acp-25-771-2025, 2025.
Oak, Y. J., Jacob, D. J., Pendergrass, D. C., Dang, R., Colombi, N. K., Chong, H., Lee, S., Kuk, S. K., and Kim, J.: Air quality trends and regimes in South Korea inferred from 2015–2023 surface and satellite observations, Atmos. Chem. Phys., 25, 3233–3252, https://doi.org/10.5194/acp-25-3233-2025, 2025.
Palmer, P. I., Jacob, D. J., Chance, K., Martin, R. V., Spurr, R. J. D., Kurosu, T. P., Bey, I., Yantosca, R., Fiore, A., and Li, Q.: Air mass factor formulation for spectroscopic measurements from satellites: Application to formaldehyde retrievals from the Global Ozone Monitoring Experiment, J. Geophys. Res.-Atmos., 106, 14539–14550, https://doi.org/10.1029/2000JD900772, 2001.
Pan, D., Mauzerall, D. L., Wang, R., Guo, X., Puchalski, M., Guo, Y., Song, S., Tong, D., Sullivan, A. P., Schichtel, B. A., Collett, J. L., and Zondlo, M. A.: Regime shift in secondary inorganic aerosol formation and nitrogen deposition in the rural United States, Nat. Geosci., 17, 617–623, https://doi.org/10.1038/s41561-024-01455-9, 2024.
Paulot, F., Jacob, D. J., Pinder, R. W., Bash, J. O., Travis, K., and Henze, D. K.: Ammonia emissions in the United States, European Union, and China derived by high-resolution inversion of ammonium wet deposition data: Interpretation with a new agricultural emissions inventory (MASAGE_NH3), J. Geophys. Res.-Atmos., 119, 4343–4364, https://doi.org/10.1002/2013JD021130, 2014.
Paulot, F., Ginoux, P., Cooke, W. F., Donner, L. J., Fan, S., Lin, M.-Y., Mao, J., Naik, V., and Horowitz, L. W.: Sensitivity of nitrate aerosols to ammonia emissions and to nitrate chemistry: implications for present and future nitrate optical depth, Atmos. Chem. Phys., 16, 1459–1477, https://doi.org/10.5194/acp-16-1459-2016, 2016.
Petetin, H., Sciare, J., Bressi, M., Gros, V., Rosso, A., Sanchez, O., Sarda-Estève, R., Petit, J.-E., and Beekmann, M.: Assessing the ammonium nitrate formation regime in the Paris megacity and its representation in the CHIMERE model, Atmos. Chem. Phys., 16, 10419–10440, https://doi.org/10.5194/acp-16-10419-2016, 2016.
Pinder, R. W., Adams, P. J., and Pandis, S. N.: Ammonia Emission Controls as a Cost-Effective Strategy for Reducing Atmospheric Particulate Matter in the Eastern United States, Environ. Sci. Technol., 41, 380–386, https://doi.org/10.1021/es060379a, 2007.
Pitchford, M. L., Poirot ,Richard L., Schichtel ,Bret A., and and Malm, W. C.: Characterization of the Winter Midwestern Particulate Nitrate Bulge, J. Air Waste Ma., 59, 1061–1069, https://doi.org/10.3155/1047-3289.59.9.1061, 2009.
Pokharel, A., Hennessy, D. A., and Wu, F.: Health burden associated with tillage-related PM2.5 pollution in the United States, and mitigation strategies, Sci. Total Environ., 903, 166161, https://doi.org/10.1016/j.scitotenv.2023.166161, 2023.
Puchalski, M. A., Rogers, C. M., Baumgardner, R., Mishoe, K. P., Price, G., Smith, M. J., Watkins, N., and Lehmann, C. M.: A statistical comparison of active and passive ammonia measurements collected at Clean Air Status and Trends Network (CASTNET) sites, Environ. Sci.: Processes Impacts, 17, 358–369, https://doi.org/10.1039/C4EM00531G, 2015.
Qin, C., Fu, X., Wang, T., Gao, J., and Wang, J.: Control of fine particulate nitrate during severe winter haze in “2+26” cities, J. Environ. Sci., 136, 261–269, https://doi.org/10.1016/j.jes.2022.12.016, 2024.
Romer Present, P. S., Zare, A., and Cohen, R. C.: The changing role of organic nitrates in the removal and transport of NOx, Atmos. Chem. Phys., 20, 267–279, https://doi.org/10.5194/acp-20-267-2020, 2020.
Sarwar, G., Hogrefe, C., Henderson, B. H., Mathur, R., Gilliam, R., Callaghan, A. B., Lee, J., and Carpenter, L. J.: Impact of particulate nitrate photolysis on air quality over the Northern Hemisphere, Sci. Total Environ., 917, 170406, https://doi.org/10.1016/j.scitotenv.2024.170406, 2024.
Shah, V., Jacob, D. J., Dang, R., Lamsal, L. N., Strode, S. A., Steenrod, S. D., Boersma, K. F., Eastham, S. D., Fritz, T. M., Thompson, C., Peischl, J., Bourgeois, I., Pollack, I. B., Nault, B. A., Cohen, R. C., Campuzano-Jost, P., Jimenez, J. L., Andersen, S. T., Carpenter, L. J., Sherwen, T., and Evans, M. J.: Nitrogen oxides in the free troposphere: implications for tropospheric oxidants and the interpretation of satellite NO2 measurements, Atmos. Chem. Phys., 23, 1227–1257, https://doi.org/10.5194/acp-23-1227-2023, 2023.
Shi, L., Rosenberg, A., Wang, Y., Liu, P., Danesh Yazdi, M., Réquia, W., Steenland, K., Chang, H., Sarnat, J. A., Wang, W., Zhang, K., Zhao, J., and Schwartz, J.: Low-Concentration Air Pollution and Mortality in American Older Adults: A National Cohort Analysis (2001–2017), Environ. Sci. Technol., 56, 7194–7202, https://doi.org/10.1021/acs.est.1c03653, 2022.
Shimadera, H., Hayami, H., Chatani, S., Morino, Y., Mori, Y., Morikawa, T., Yamaji, K., and Ohara, T.: Sensitivity analyses of factors influencing CMAQ performance for fine particulate nitrate, J. Air Waste Ma., 64, 374–387, https://doi.org/10.1080/10962247.2013.778919, 2014.
Silvern, R. F., Jacob, D. J., Mickley, L. J., Sulprizio, M. P., Travis, K. R., Marais, E. A., Cohen, R. C., Laughner, J. L., Choi, S., Joiner, J., and Lamsal, L. N.: Using satellite observations of tropospheric NO2 columns to infer long-term trends in US NOx emissions: the importance of accounting for the free tropospheric NO2 background, Atmos. Chem. Phys., 19, 8863–8878, https://doi.org/10.5194/acp-19-8863-2019, 2019.
Simone, N. W., Stettler, M. E. J., and Barrett, S. R. H.: Rapid estimation of global civil aviation emissions with uncertainty quantification, Transport. Res. D-Tr. E., 25, 33–41, https://doi.org/10.1016/j.trd.2013.07.001, 2013.
Solomon, P. A., Crumpler, D., Flanagan, J. B., Jayanty, R. K. M., Rickman, E. E., and McDade, C. E.: U.S. National PM2.5 Chemical Speciation Monitoring Networks – CSN and IMPROVE: Description of networks, J. Air Waste Ma., 64, 1410–1438, https://doi.org/10.1080/10962247.2014.956904, 2014.
Sun, K., Tao, L., Miller, D. J., Pan, D., Golston, L. M., Zondlo, M. A., Griffin, R. J., Wallace, H. W., Leong, Y. J., Yang, M. M., Zhang, Y., Mauzerall, D. L., and Zhu, T.: Vehicle Emissions as an Important Urban Ammonia Source in the United States and China, Environ. Sci. Technol., 51, 2472–2481, https://doi.org/10.1021/acs.est.6b02805, 2017.
Tang, G., Wang, Y., Liu., Y., Wu, S., Huang, X., Yang, Y., Wang, Y., Ma, J., Bao, X., Liu, Z., Ji, D., Li, T., Li, X., and Wang, Y.: Low particulate nitrate in the residual layer in autumn over the North China Plain, Sci. Total Environ., 782, 146845, https://doi.org/10.1016/j.scitotenv.2021.146845, 2021.
Tessum, C. W., Apte, J. S., Goodkind, A. L., Muller, N. Z., Mullins, K. A., Paolella, D. A., Polasky, S., Springer, N. P., Thakrar, S. K., Marshall, J. D., and Hill, J. D.: Inequity in consumption of goods and services adds to racial–ethnic disparities in air pollution exposure, P. Natl. Acad. Sci. USA, 116, 6001–6006, https://doi.org/10.1073/pnas.1818859116, 2019.
Travis, K. R., Crawford, J. H., Chen, G., Jordan, C. E., Nault, B. A., Kim, H., Jimenez, J. L., Campuzano-Jost, P., Dibb, J. E., Woo, J.-H., Kim, Y., Zhai, S., Wang, X., McDuffie, E. E., Luo, G., Yu, F., Kim, S., Simpson, I. J., Blake, D. R., Chang, L., and Kim, M. J.: Limitations in representation of physical processes prevent successful simulation of PM2.5 during KORUS-AQ, Atmos. Chem. Phys., 22, 7933–7958, https://doi.org/10.5194/acp-22-7933-2022, 2022.
Tong, D. Q., Lamsal, L., Pan, L., Ding, C., Kim, H., Lee, P., Chai, T., Pickering, K. E., and Stajner, I.: Long-term NOx trends over large cities in the United States during the great recession: Comparison of satellite retrievals, ground observations, and emission inventories, Atmos. Environ., 107, 70–84, https://doi.org/10.1016/j.atmosenv.2015.01.035, 2015.
United States Environmental Protection Agency (US EPA): Ammonia Emissions: What to Know before You Regulate Official White Paper of USDA Agricultural Air Quality Task Force 2014, https://www.nrcs.usda.gov/sites/default/files/2022-10/AAQTF-AccomplishmentsAmmonia-White-Paper.pdf (last access: 31 October 2025), 2014.
United States Environmental Protection Agency (US EPA): 2020 NEI Supporting Data and Summaries, https://www.epa.gov/air-emissions-inventories/2020-nei-supporting-data-and-summaries (last access: 1 April 2026), 2020 (updated 30 March 2023).
United States Environmental Protection Agency (US EPA): Pre-Generated Data Files, Daily Summary Data, US EPA, https://aqs.epa.gov/aqsweb/airdata/download_files.html#Daily, last access: 1 November 2025.
Van Damme, M., Clarisse, L., Heald, C. L., Hurtmans, D., Ngadi, Y., Clerbaux, C., Dolman, A. J., Erisman, J. W., and Coheur, P. F.: Global distributions, time series and error characterization of atmospheric ammonia (NH3) from IASI satellite observations, Atmos. Chem. Phys., 14, 2905–2922, https://doi.org/10.5194/acp-14-2905-2014, 2014.
Van Damme, M., Whitburn, S., Clarisse, L., Clerbaux, C., Hurtmans, D., and Coheur, P.-F.: Version 2 of the IASI NH3 neural network retrieval algorithm: near-real-time and reanalysed datasets, Atmos. Meas. Tech., 10, 4905–4914, https://doi.org/10.5194/amt-10-4905-2017, 2017.
Van Damme, M., Clarisse, L., Franco, B., Sutton, M. A., Erisman, J. W., Wichink Kruit, R., van Zanten, M., Whitburn, S., Hadji-Lazaro, J., Hurtmans, D., Clerbaux, C., and Coheur, P.-F.: Global, regional and national trends of atmospheric ammonia derived from a decadal (2008–2018) satellite record, Environ. Res. Lett., 16, 055017, https://doi.org/10.1088/1748-9326/abd5e0, 2021.
Visser, A. J., Boersma, K. F., Ganzeveld, L. N., and Krol, M. C.: European NOx emissions in WRF-Chem derived from OMI: impacts on summertime surface ozone, Atmos. Chem. Phys., 19, 11821–11841, https://doi.org/10.5194/acp-19-11821-2019, 2019.
Vo, T.: The Changing Sensitivity of Wintertime Particulate Nitrate to Precursor Emissions Diagnosed via GEOS-Chem and Satellite Observations of Ammonia and Nitrogen Dioxide over the Midwestern United States, Version v2, Zenodo [data set/code], https://doi.org/10.5281/zenodo.19638364, 2026a.
Vo, T.: The Changing Sensitivity of Wintertime Particulate Nitrate to Precursor Emissions Diagnosed via GEOS-Chem and Satellite Observations of Ammonia and Nitrogen Dioxide over the Midwestern United States, Version v1, Zenodo [video], https://doi.org/10.5281/zenodo.20669721, 2026b.
Vo, T. and Christiansen, A. E.: Impact of Recent Agricultural Ammonia Increases on Fine Particulate Matter Burden over the Midwestern United States, ACS Earth Space Chem., 8, 2209–2217, https://doi.org/10.1021/acsearthspacechem.4c00180, 2024.
Walters, W. W., Karod, M., Willcocks, E., Baek, B. H., Blum, D. E., and Hastings, M. G.: Quantifying the importance of vehicle ammonia emissions in an urban area of northeastern USA utilizing nitrogen isotopes, Atmos. Chem. Phys., 22, 13431–13448, https://doi.org/10.5194/acp-22-13431-2022, 2022.
Wang, H., Lu, K., Tan, Z., Chen, X., Liu, Y., and Zhang, Y.: Formation mechanism and control strategy for particulate nitrate in China, J. Environ. Sci., 123, 476–486, https://doi.org/10.1016/j.jes.2022.09.019, 2023a.
Wang, H., Liu, X., Wu, C., and Lin, G.: Regional to global distributions, trends, and drivers of biogenic volatile organic compound emission from 2001 to 2020, Atmos. Chem. Phys., 24, 3309–3328, https://doi.org/10.5194/acp-24-3309-2024, 2024.
Wang, R., Pan, D., Guo, X., Sun, K., Clarisse, L., Van Damme, M., Coheur, P.-F., Clerbaux, C., Puchalski, M., and Zondlo, M. A.: Bridging the spatial gaps of the Ammonia Monitoring Network using satellite ammonia measurements, Atmos. Chem. Phys., 23, 13217–13234, https://doi.org/10.5194/acp-23-13217-2023, 2023b.
Wang, Y., Ge, C., Castro Garcia, L., Jenerette, G. D., Oikawa, P. Y., and Wang, J.: Improved modelling of soil NOx emissions in a high temperature agricultural region: role of background emissions on NO2 trend over the US, Environ. Res. Lett., 16, 084061, https://doi.org/10.1088/1748-9326/ac16a3, 2021.
Wang, Y. X., McElroy, M. B., Jacob, D. J., and Yantosca, R. M.: A nested grid formulation for chemical transport over Asia: Applications to CO, J. Geophys. Res.-Atmos., 109, https://doi.org/10.1029/2004JD005237, 2004.
Wang, Z., Jing, B., Shi, X., Tong, S., Wang, W., and Ge, M.: Importance of water-soluble organic acid on the hygroscopicity of nitrate, Atmos. Environ., 190, 65–73, https://doi.org/10.1016/j.atmosenv.2018.07.010, 2018.
Warner, J. X., Dickerson, R. R., Wei, Z., Strow, L. L., Wang, Y., and Liang, Q.: Increased atmospheric ammonia over the world's major agricultural areas detected from space, Geophys. Res. Lett., 44, 2875–2884, https://doi.org/10.1002/2016GL072305, 2017.
Wen, L., Xue, L., Wang, X., Xu, C., Chen, T., Yang, L., Wang, T., Zhang, Q., and Wang, W.: Summertime fine particulate nitrate pollution in the North China Plain: increasing trends, formation mechanisms and implications for control policy, Atmos. Chem. Phys., 18, 11261–11275, https://doi.org/10.5194/acp-18-11261-2018, 2018.
Wiegand, R., Battye, W. H., Myers, C. B., and Aneja, V. P.: Particulate Matter and Ammonia Pollution in the Animal Agricultural-Producing Regions of North Carolina: Integrated Ground-Based Measurements and Satellite Analysis, Atmosphere, 13, 821, https://doi.org/10.3390/atmos13050821, 2022.
Womack, C. C., McDuffie, E. E., Edwards, P. M., Bares, R., de Gouw, J. A., Docherty, K. S., Dubé, W. P., Fibiger, D. L., Franchin, A., Gilman, J. B., Goldberger, L., Lee, B. H., Lin, J. C., Long, R., Middlebrook, A. M., Millet, D. B., Moravek, A., Murphy, J. G., Quinn, P. K., Riedel, T. P., Roberts, J. M., Thornton, J. A., Valin, L. C., Veres, P. R., Whitehill, A. R., Wild, R. J., Warneke, C., Yuan, B., Baasandorj, M., and Brown, S. S.: An Odd Oxygen Framework for Wintertime Ammonium Nitrate Aerosol Pollution in Urban Areas: NOx and VOC Control as Mitigation Strategies, Geophys. Res. Lett., 46, 4971–4979, https://doi.org/10.1029/2019GL082028, 2019.
Wu, L., Li, X., and Ro, C.-U.: Hygroscopic Behavior of Ammonium Sulfate, Ammonium Nitrate, and their Mixture Particles, Asian Journal of Atmospheric Environment, 13, 196–211, https://doi.org/10.5572/ajae.2019.13.3.196, 2019.
Wu, W., Jin, Y., and Carlsten, C.: Inflammatory health effects of indoor and outdoor particulate matter, J. Allergy Clin. Immun., 141, 833–844, https://doi.org/10.1016/j.jaci.2017.12.981, 2018.
Xiong, Y., Du, K., and Huang, Y.: One-third of global population at cancer risk due to elevated volatile organic compounds levels, npj Clim. Atmos. Sci., 7, 54, https://doi.org/10.1038/s41612-024-00598-1, 2024.
Xu, Z., Liu, M., Zhang, M., Song, Y., Wang, S., Zhang, L., Xu, T., Wang, T., Yan, C., Zhou, T., Sun, Y., Pan, Y., Hu, M., Zheng, M., and Zhu, T.: High efficiency of livestock ammonia emission controls in alleviating particulate nitrate during a severe winter haze episode in northern China, Atmos. Chem. Phys., 19, 5605–5613, https://doi.org/10.5194/acp-19-5605-2019, 2019.
Yang, Y., Liu, L., Bai, Z., Xu, W., Zhang, F., Zhang, X., Liu, X., and Xie, Y.: Comprehensive quantification of global cropland ammonia emissions and potential abatement, Sci. Total Environ., 812, 151450, https://doi.org/10.1016/j.scitotenv.2021.151450, 2022.
Yang, Y., Liu, L., Liu, P., Ding, J., Xu, H., and Liu, S.: Improved global agricultural crop- and animal-specific ammonia emissions during 1961–2018, Agr. Ecosyst. Environ., 344, 108289, https://doi.org/10.1016/j.agee.2022.108289, 2023.
Yantosca, B., Sulprizio, M., Lundgren, L., kelvinhb, Eastham, S. D., Fritz, T., Lin, H., 22degrees, Ridley, D., Bindle, L., michael-s-long, tsherwen, Downs, W., Fisher, J., Holmes, C., Thackray, C., GanLuo, BettyCroft, Zhuang, J., Murray, L., SpaceMouse, Estrada, L. A., Shutter, J., noelleselin, nicholasbalasus, Long, M., xin-chen-github, Jourdan-He, Zhu, H., and emily-ramnarine: geoschem/geos-chem: GEOS-Chem 14.4.2 (14.4.2), Zenodo [code], https://doi.org/10.5281/zenodo.12807579, 2024.
Yu, F., Nair, A. A., and Luo, G.: Long-Term Trend of Gaseous Ammonia Over the United States: Modeling and Comparison With Observations, J. Geophys. Res.-Atmos., 123, 8315–8325, https://doi.org/10.1029/2018JD028412, 2018.
Zhai, S., Jacob, D. J., Wang, X., Liu, Z., Wen, T., Shah, V., Li, K., Moch, J. M., Bates, K. H., Song, S., Shen, L., Zhang, Y., Luo, G., Yu, F., Sun, Y., Wang, L., Qi, M., Tao, J., Gui, K., Xu, H., Zhang, Q., Zhao, T., Wang, Y., Lee, H. C., Choi, H., and Liao, H.: Control of particulate nitrate air pollution in China, Nat. Geosci., 14, 389–395, https://doi.org/10.1038/s41561-021-00726-z, 2021.
Zhai, S., Jacob, D. J., Pendergrass, D. C., Colombi, N. K., Shah, V., Yang, L. H., Zhang, Q., Wang, S., Kim, H., Sun, Y., Choi, J.-S., Park, J.-S., Luo, G., Yu, F., Woo, J.-H., Kim, Y., Dibb, J. E., Lee, T., Han, J.-S., Anderson, B. E., Li, K., and Liao, H.: Coarse particulate matter air quality in East Asia: implications for fine particulate nitrate, Atmos. Chem. Phys., 23, 4271–4281, https://doi.org/10.5194/acp-23-4271-2023, 2023.