the Creative Commons Attribution 4.0 License.
the Creative Commons Attribution 4.0 License.
 | 30 Jun 2026
Microphysical evolution and column loading drive nonlinear regional contrast in black carbon top-of-atmosphere forcing
Pravash Tiwari
Hongrui Gao
Lingxiao Lu
Oleg Dubovik
Black carbon (BC) aerosols remain among the most uncertain contributors to anthropogenic climate forcing, as their radiative impact depends sensitively on microphysical evolution and atmospheric loading. This study presents a physics-informed, machine learning (ML) approach to estimate clear-sky BC top-of-atmosphere direct radiative forcing (BC TOA) at high spatial-temporal resolution while retaining physical interpretability. The study derives necessary optical properties for radiative transfer modeling (RTM), by constraining them with multi-platform, multi-waveband observations and their associated uncertainties. The RTM outputs are then used to train the ML surrogates and applied over two contrasting urban agglomerates-Xuzhou, China, and Dhaka, Bangladesh. The ML framework closely reproduces physics-based regional climatological mean ( W m−2 versus W m−2 over Xuzhou; W m−2 versus W m−2 for Dhaka), while achieving high predictive fidelity R2>0.95; RMSE ∼ 1.5–1.8 W m−2 and strong cross-regional consistency (r>0.9). SHAP based predictor attribution indicates that BC TOA estimates are strongly associated with BC aerosol optical depth (BCAOD), column number density, and mixing state, with their relative contributions varying non-linearly across cooling-to-warming regimes. Crucially, similar BC loading can yield contrasting absorption-scattering dynamics across region, which are not captured by simplified forcing parameterization. To test transferability, the combined ML model (trained in Xuzhou, China and Dhaka, Bangladesh) was evaluated zero-shot on two additional regions with contrasting aerosol microphysical conditions represented by Delhi, India (urban and agricultural burning sources) and Mongu, Zambia (strong savanna fires). While transference to Delhi is reasonable (Adj. R2=0.91, RMSE = 2.3 W m−2), there is a systematic underestimate at Mongu (Adj. R2=0.83; MBE = −4.2 W m−2). Feature-space overlap analysis attributes this degradation to a distributional mismatch in key microphysical predictors. Retraining on an expanded dataset including all four regions preserves urban performance while reducing Mongu RMSE by 68 % and bias from −4.2 to −0.8 W m−2. Together, the physics-informed ML framework and the multi-domain evaluation provide an efficient and transferable tool for constraining BC radiative impacts across real-world heterogeneity. The study also offers new mechanistic insight into how regional properties reshape BC radiative forcing.
- Article
(14323 KB) - Full-text XML
-
Supplement
(11410 KB) - BibTeX
- EndNote


Among the major climate forcers, aerosols represent one of the largest sources of uncertainty in Earth's radiative budget, primarily through their interactions with solar and terrestrial radiation. These radiative perturbations arise through key aerosol–radiation interactions and manifest as the direct aerosol effect (Chung, 2012; Yu et al., 2006); the indirect aerosol effect (Lohmann and Feichter, 2005; Nenes et al., 2002) and the semi-direct effect (Koch and Del Genio, 2010; Randles and Ramaswamy, 2010). Despite an estimated net global cooling of around W m−2 from anthropogenic aerosols−offsetting ∼33 % of the GHGs warming (Li et al., 2022), their radiative forcing quantification remains highly uncertain and poorly constrained. The diverse optical and microphysical characteristics of aerosol species (Li et al., 2022), adds to the substantial spread in aerosol's direct radiative forcing (DRF), amplifying uncertainties in climate sensitivity.
Black carbon (BC) aerosols, emitted primarily from incomplete combustion of carbon exerts strong solar-radiation integrated absorption, impacting regional radiative forcing and heating, where it locally competes with greenhouse gases like CO2 and CH4 (Hansen and Sato, 2001; Jacobson, 2001). Yet, its DRF estimates vary widely, for instance, one study reported a global BC instantaneous radiative forcing of +0.9 W m−2 (+0.4 to +1.2 W m−2) (Ramanathan and Carmichael, 2008). In contrast, AeroCom Phase II yielded a lower estimate of +0.23 W m−2 (Myhre et al., 2013). AERONET-derived absorption aerosol optical depth (AAOD) analyses suggested +0.51 W m−2 (+0.06 to +0.91 W m−2) (Bond et al., 2013), while the IPCC AR5 synthesized expert judgment estimating +0.4 W m−2 (+0.05 to +0.8 W m−2) (Bond et al., 2013; Myhre et al., 2013). The recent IPCC AR6 reports a ∼50 % reduction in BC warming and an associated top of the atmospheric (TOA) increase by 0.1° (Forster et al., 2023) due to adjusted rapid climate responses (Everett et al., 2022), however, several studies emphasize that emission products used by the CMIP-6 models (used in the IPCC AR6) did not adequately account for BC loading as well as varying absorption incurred from dynamic variability in morphological complexities (Chen et al., 2022; Kelesidis et al., 2022; Ramachandran et al., 2023).
Both ground and satellite-based observational communities are rigorously working to improve quantification of BCDRF regionally. Ground-based BC mass measurements and/or sun-sky photometer's aerosol optical depth (AOD) provide some essential constraints for optical modeling. These are typically used in iterative Mie model frameworks to derive single scatter albedo (SSA), phase function and asymmetry coefficient (ASY) for radiative transfer model (RTM) simulations (Mehrotra et al., 2024; Zeb et al., 2020). However, these approaches are spatially limited, rely on limited size bins and lacks ability to resolve internal mixing. Furthermore, few observational studies have either interpolated or extrapolated absorption or extinction between a small number of distinct wavebands (where observations are taken) and/or use fixed mass absorption coefficients (MAC of 7.5±1.2 and 8.0±0.7 m2 g−1 at 550 nm) (Liu et al., 2020a; Randles et al., 2017; Zangmeister et al., 2018) to compute BC DRF. Satellite-based approaches extend the spatial coverage to better capture regional variability of regional aerosol DRF (Bellouin et al., 2005; Kahn et al., 2023; Matus et al., 2019; Wu et al., 2024). The Clouds and the Earth's Radiant Energy System CERES) and CloudSat (2B-FLXHR-LIDAR) provides a comprehensive dataset of TOA fluxes which are widely used (Gautam et al., 2023; Loeb et al., 2021; Subba et al., 2020, 2022). While these approaches have analyzed total aerosol DRF, however, accurate isolation of BC signals from co-existing aerosol types within the satellite data is challenging. Furthermore, computing no-aerosol fluxes to derive net TOA forcing adds to the existing challenge. Studies often assume either linear AOD-flux relationships (computing TOAno-aerosol-flux at AOD = 0) or using low-aerosol pixels for pristine flux (Biswas et al., 2017; Christopher and Zhang, 2002; Sundström et al., 2015). However, such approaches can introduce significant uncertainties in regions undergoing rapid industrialization or experiencing persistently high aerosol loading. such as South and East Asia, where truly pristine conditions are rare and the aerosol–radiation interactions are highly nonlinear. Finally, many satellite derived DRF approaches rely on single-wavelength absorption measurements (commonly at 500 or 550 nm), which increases DRF uncertainty as it neglects the spectral dependence of aerosol–radiation interactions across the solar spectrum. Complementarily, reanalysis products like MERRA-2 and CAMS assimilate multi-source data and provide different BC specific properties. However, these products also incorporate simplified aerosol representations like using pre-defined morphology with median radii and standard deviations that are climatologically fixed limiting reanalysis accuracy (Chen et al., 2023; Chin et al., 2002; Ding and Liu, 2022). Moreover, emissions datasets underlying these assimilations are often outdated (Li et al., 2024), particularly over many rapidly developing and industrial areas in the Global South (Dasari et al., 2020; Ren et al., 2025), and many employ externally mixed tracers (Fernandes et al., 2023; Xu et al., 2020) rather than internal mixtures.
Overall, these approaches have advanced our understanding of aerosol DRF, but still leave persistent gaps in capturing BC's dynamic radiative behavior at regional scales. The underlaying uncertainties in BC DRF quantifications are further aggravated at regional level, due to BC's short atmospheric lifetime, rapidly evolving microphysics and multispectral absorption interaction. Reducing these discrepancies requires a geospatially resolved approach that uses multi-waveband information, considers both columnar loading and per-particle properties in tandem (Tiwari et al., 2023). Additionally, an improved accounting of emissions also requires accurate knowledge of microphysical evolution (Fierce et al., 2020; Liu et al., 2017), morphological dynamics (Wu et al., 2018), and vertical lofting of BC (Cohen and Wang, 2014). Accurate regional BC DRF quantification is therefore critical, not only to resolve local radiative impacts but also to reduce uncertainties in global forcing estimates.
In light of persistent challenges in regional BCDRF quantification and building on recent advances in observationally constrained BC microphysical retrievals, including the core-shell Mie model optimization (COSMO), this study extends and refines multi-platform framework of an earlier approach developed by Tiwari et al. (2025). That framework combined multi-wavelength observations with a flexible core-shell morphology to derive probabilistic BC microphysical solutions and column densities, jointly constrained by multi-band SSA. Here, we introduce an additional observational constraint through multi-satellite total AOD inputs, further optimizing the estimation of BC size, mixing state, and column loading, along with their associated optical properties. These physically consistent ensembles are then coupled with RTM to generate high resolution clear-sky BC top-of-atmosphere direct radiative forcing (BC TOA; used interchangeably with BC TOA DRF). Finally, we train a set of linear, parametric and interpretable machine learning (ML) surrogate models on these COSMO-RTM outputs to test their predictive skills, provide a fast and transferable tool for estimating BC TOA DRF and diagnosing how BC microphysics modulate radiative forcing. Unlike most previous assessments which have generally not incorporated dynamically varying size-mixing states (e.g. Luo et al., 2022; Romshoo et al., 2024; Yang et al., 2025) or jointly constrained microphysics and column loading in TOA forcing calculations (e.g. Tiwari et al., 2023), this unified approach integrates these aspects to enhance understanding of regional BC TOA DRF while providing a physically interpretable, transferable and computationally efficient modeling tool and explore new aspects of BC's microphysical and column property influence on clear-sky instantaneous BC TOA DRF .
2.1 Computing BC TOA DRF from observationally constrained microphysics and RTM
Tiwari et al. (2025) used a multi-platform COSMO approach to derive BC aerosol size, mixing state, and column densities over Xuzhou, China and greater Dhaka, Bangladesh. Greater Dhaka is one urban agglomeration representing a rapidly expanding monocentric megacity in a tropical river delta along with its per-urban settlements. They are characterized by intense emissions from traffic, brick kilns, and small-scale industries along the inland river networks. In contrast, Xuzhou, as the largest city in the Huaihai region is a polycentric urban agglomeration on the North China Plain, where it acts as a central node in a network of cities with significant heavy industry, energy production, and agriculture. Comparing these two regions provides unique insights into how different urban forms and regional economic structures influence the physical and optical properties of light-absorbing aerosols.
The original framework combined multi-waveband single-scattering albedo (SSA) from TROPOMI (388 nm) and AERONET/SONET (440–1020 nm) observations for these regions and used a two-component Mie inversion to generate ensembles of physically consistent microphysical solutions for BC core and non-absorbing shell sizes while accounting for both waveband offsets and cross-platform SSA uncertainties at a grid-by-grid and day-by-day level. A brief description of the Mie model framework and assumed morphological set up, including key assumptions and their rationale, is provided in Appendix A. In essence, Tiwari et al. (2025) first constructed multi-waveband SSA ranges at each grid based on their uncertainties and waveband offsets. Since each BC particle interacts with radiation across all wavebands simultaneously, the COSMO was used to generate paired core-shell size solutions that are physically consistent across the spectrum. Each candidate size pair was evaluated by comparing its modeled SSA at multiple wavebands to the uncertainty-bounded SSA ranges. Only those solutions with SSA values falling within the SSA uncertainty range at all wavebands simultaneously were retained. This filtering approach has been previously implemented using both ground and satellite SSA observations, both in tandem as well as separately (Liu et al., 2024a, b, c; Wang et al., 2021) . The multi-waveband SSA constraining ensures that the resulting microphysical ensembles reflect only BC core/sulfate shell pairs capable of reproducing the observed, uncertainty-aware SSA constraints across the full spectral domain. For more details on the geographical context of the urban agglomerates including, differences in emission characteristics of Xuzhou and greater Dhaka region, and the application of the multi-platform COSMO with SSA constraint to derive BC microphysics and derivation of BC column loading, readers are referred to Tiwari et al. (2025).
This study extends and refines the framework, where it uses the probabilistic solutions of core and shell sizes and total column mass density derived from earlier SSA constraint for computing BC aerosol optical depth (BCAOD) across multiple wavelengths. The BCAOD calculation follows a forward Mie-based physical formulation. Specifically, the diameters of the BC core (Dcore) and total diameter (D) of the particle are used to determine the particle's geometric cross-sectional area (σg), which reflects the amount of light that the particles interact with. Next, the volumes of the BC core (Vcore), SUL shell (Vshell), and total particle volume (Vtotal) are used to establish the effective density of the aerosol ρtotal based on the volume weighted of BC (ρBC) and sulfate (ρSUL). Subsequently, the mass of a single particle (mp) is calculated by multiplying its total volume (Vtotal) by its effective density (ρtotal). The mass extinction efficiency (αext) is then computed to assess how effectively the particle contributes to light extinction per unit mass using extinction efficiency (Qext). Finally, the modeled BCAOD (τBC) was deduced by multiplying the mass extinction efficiency by the total aerosol mass (Mc) in the column. The mathematical formulation of BCAOD computation is summarized in Eq. (1) through Eq. (8).
The SSA-based constraint ensures internal spectral consistency, but it does not by itself rule out microphysical solutions that generate unrealistically strong BC extinction. To address this limitation, we introduce a physically binding requirement that the modeled τBC must always be less than total AOD measured in the column. Since total AOD represents the combined extinction from all aerosol species, not only BC, any case where τBC exceeds the total AOD indicates a violation and is therefore physically unrealistic. This requirement acts as an additional layer of observational constraint to refine microphysical and column loading solutions.
The Mie model outputs, τBC, SSA and ASY, which are computed at three wavebands 388, 470, and 550 nm. To implement this total AOD constraint, we derive specific upper uncertainty bounds based on AOD measurements from Multi-Angle Implementation of Atmospheric Correction (MAIAC) algorithm-based AOD (470, 550 nm) (Lyapustin et al., 2018; Martins et al., 2017) and TROPOMI (388 nm). The upper limits for AOD are defined in Eqs. (9)–(11). based on Lyapustin and Wang (2022) and de Graaf (2022):
The above violation condition was implemented whereby τBC must remain below the upper-bound total AOD observed across all wavebands simultaneously. If τBC exceeds the total AOD for even one waveband, that dataset is excluded from further analysis. After implementing this quality control, a total of 178 and 314 d of data were used for analysis for Xuzhou and greater Dhaka respectively from the period of 30 April 2018 to 30 April 2022, consisting of a total of 105 569 and 273 225 individual grid points in space and time.
The τBC, SSA and ASY at multiple wavebands, are used within the RTM model to generate BC DRF. Additional necessary datasets, including MODIS Level 2 precipitable water vapor (PWV) (MYD05/MOD05), surface spectral albedo from the MODIS Bidirectional Reflectance Distribution Function product (MCD43A1), and total column ozone from the TROPOMI S5P_L2__O3_TOT_HiR product, were processed and spatio-temporally harmonized to align with the BC data grid resolution. The RTM model used herein is the Santa Barbara DISORT Atmospheric Radiative Transfer (SBDART) (Ricchiazzi et al., 1998) model which generates the TOA and surface radiative forcing. The description and processing of each ancillary dataset is provided in Appendix B and mathematical formulation for calculating BC TOA DRF from SBDART derived fluxes are provided in Sect. S1 in the Supplement. A schematic overview of the workflow, encompassing BCAOD computation, multi-waveband satellite data filtering, and radiative transfer modeling, is provided in Fig. 1.
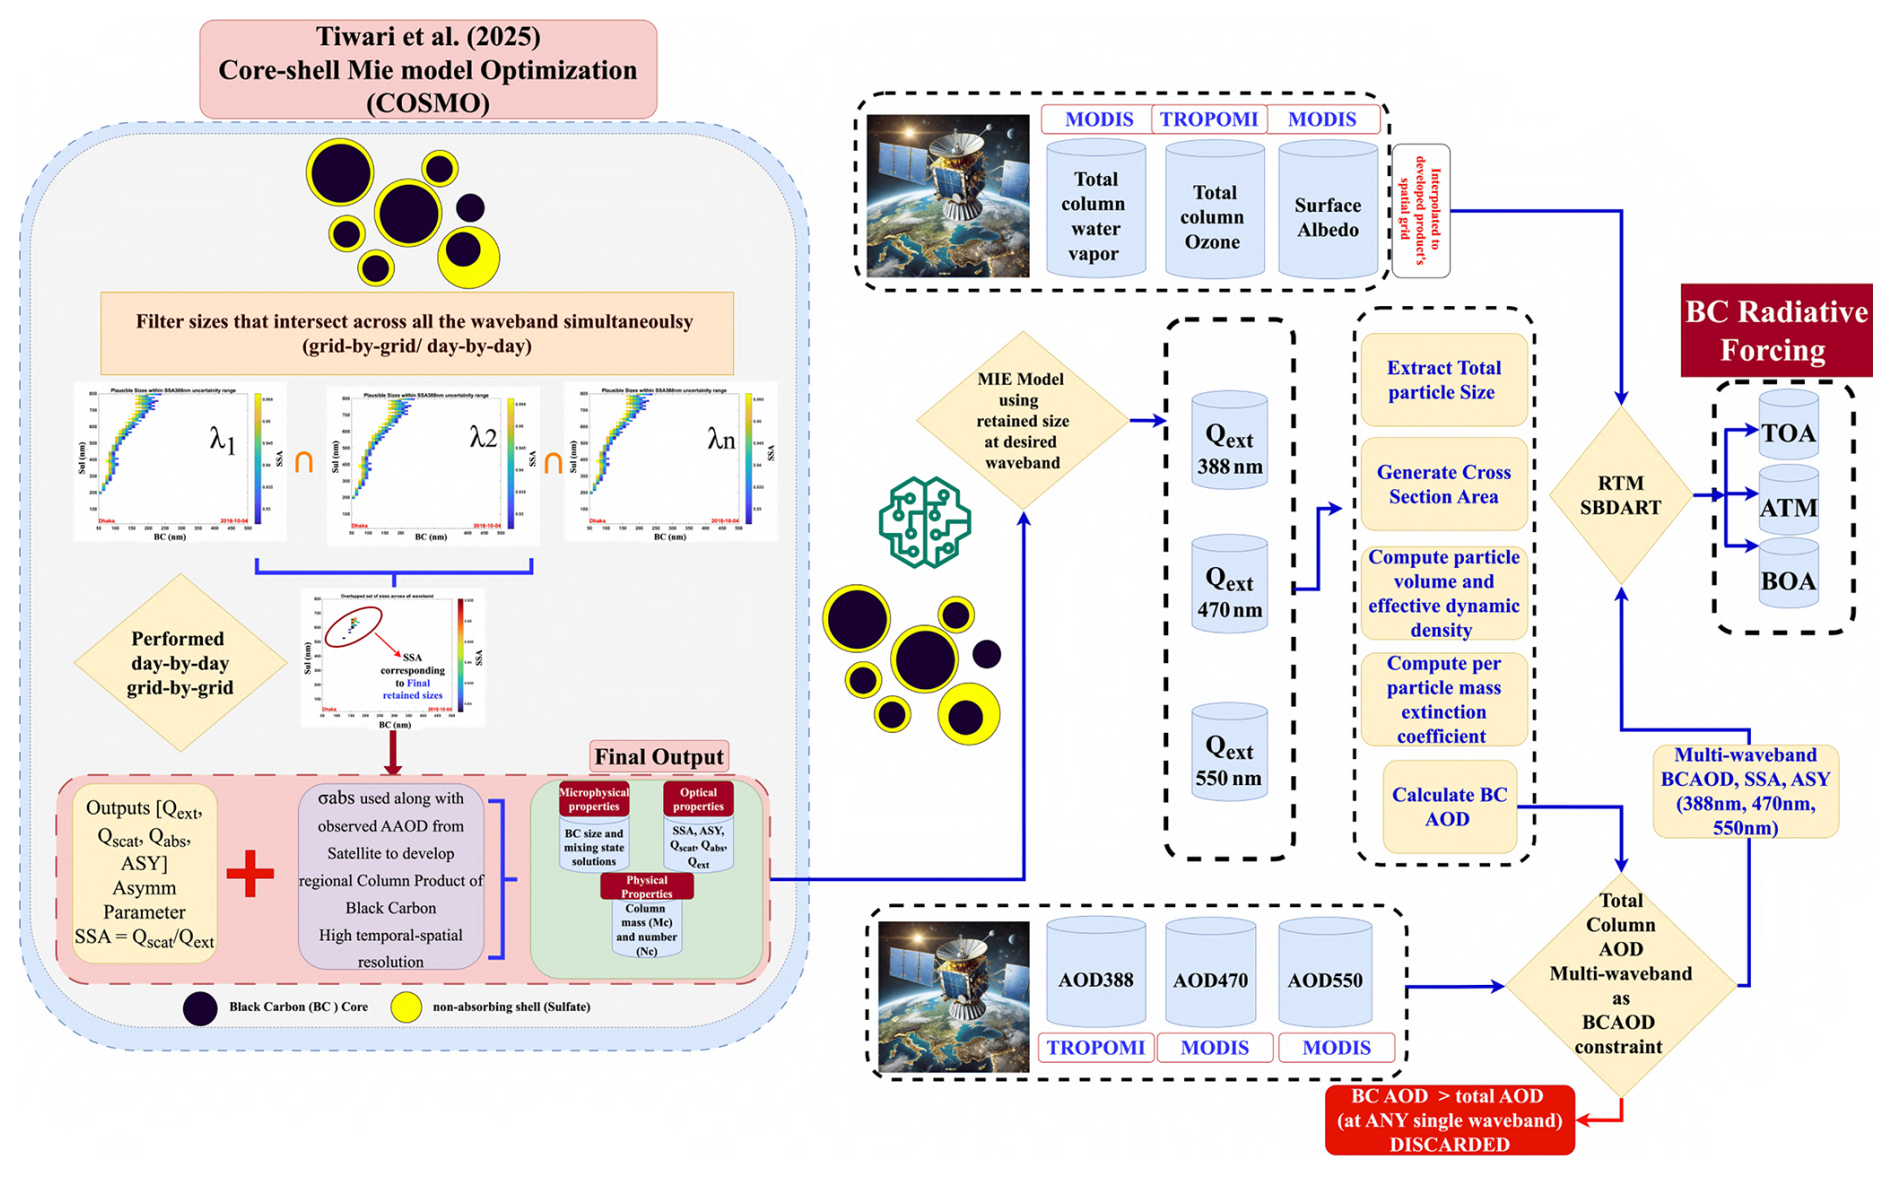
Overall approach integrates TROPOMI and AERONET/SONET SSAs using waveband offset adjustment and further employs observationally constrained multi-waveband inverse-forward MIE modeling to generate size, mixing state and associated optical and physical properties as detailed in Tiwari et al. (2025). This study further refines the established approach using an additional layer of observational constraint from multi-waveband aerosol optical depth. The resulting set of microphysical and associated optical properties are integrated with PWV, surface spectral albedo, and total column ozone are used to perform SBDART RTM runs and BC radiative forcing at a day-by-day and grid-by-grid resolution over Xuzhou and greater Dhaka are derived.
2.2 Surrogate models for rapid BC TOA DRF estimation
High-fidelity RTMs such as SBDART, when simulated with morphologically dynamic BC aerosol properties and environmental variables can enhance the accuracy of BC DRF estimates. However, computational demands render the approach impractical for large-scale chemical transport or climate modeling applications. As a means of coping with the computational issue, the atmospheric science community often adopts a linear radiative efficiency approach specifically for total aerosol DRF, by assuming the TOA as a linear function of AOD (García et al., 2012; Sena et al., 2013; Sundström et al., 2015). While this method enables rapid regional-to-global scaling of DRF estimates using satellite AOD products, it overlooks non-linear modulations in BC TOA DRF caused by microphysical variability (e.g., particle size, mixing state), column number loading, and their role in both absorption and extinction efficiency. Similarly, BC TOA forcing regimes, characterizing the transition from strong cooling to warming effects were defined by stratifying SBDART-derived BC TOA ensemble for both the regions into percentile-based categories. Low BC TOA (≤ 25th percentile), Mid-Low BC TOA (25th–50th percentile), Mid-High BC TOA (50th–75th percentile), and High BC TOA (≥ 75th percentile).
This study explores this gap by developing three surrogate models for fast BC radiative forcing calculation using the full physical SBDART-derived BC TOA DRF outputs:
-
Linear model: mimicking the community's approach of scaling TOA with AOD at 550 nm for total aerosol DRF (Matus et al., 2019; Sena et al., 2013; Sena and Artaxo, 2015), we derive a regression slope (β) between SBDART-generated BC TOA forcing and BCAOD550.
-
Parametric multiple linear regression (MLR) model: expanding on the previously proposed MLR equation (Tiwari et al., 2023) we incorporate additional predictors; column mass (Mc) and number concentration (Nc), BC size, and mixing state along with BCAOD550 into the MLR framework
-
Machine learning (ML) model: while MLR improves BC TOA prediction by accounting for additional variables, it assumes fixed, first order or pseudo-linearized, additive contributions of predictors (Cohen and Prinn, 2011). The ensemble learning algorithm herein employs a random forest approach, which helps explore the complex relationships and inter-dependencies between the predictors and physically derived TOA, providing a more robust framework for BC TOA estimation. Specifically, random forest regressor was used to predict COSMO-RTM derived BCTOA from the COSMO-derived predictor variables. The predictors were BCAOD550, aerosol column number density (Nc), aerosol column mass density (Mc), BC core size, and mixing state (defined as the ratio of BC core size to total size). These variables are derived from the observation-constrained COSMO retrieval framework described in Sect. 2.1. For each region's RTM output BC TOA is subjected to a 70–30 train-test split, with 70 % of the data used to train the model and 30 % withheld as an independent test set. This approach allowed the model to learn relationships between predictors and BC TOA while ensuring a robust evaluation on unseen data. The Random Forest hyperparameters were set as follows: n_estimators = 100, max_depth = 10, min_samples_split = 5, min_samples_leaf = 3, and max_features = “sqrt”. These regularized settings were used to provide a stable ensemble prediction while limiting overfitting through restricted tree depth, minimum node sizes, and randomized feature selection. The statistical metrics – coefficient of determination (R2), mean bias error (MBE), mean absolute error (MAE) and root mean square error (RMSE) – for both the training and test data are presented, along with the corresponding predicted versus actual plots for each set along with their statistics and error metrics provided in Fig. S1 and Table S1 in the Supplement respectively. The ML-model demonstrated robust predictive capabilities in analyzing the relationship between BC TOA and key predictors in both Xuzhou and Dhaka, with R2, RMSE, and MAE of 0.97, 1.7 W m−2, and 1.1 W m−2 respectively on the training set and 0.96, 1.8 W m−2, and 1.2 W m−2 respectively on the test set, capturing approximately 96 % of the variance in BC TOA in Xuzhou. Similarly, in Dhaka, the model achieved an R2, RMSE, and MAE of 0.96, 1.5 W m−2, and 1.1 W m−2 respectively for the training and set and 0.96, 1.6 W m−2, and 1.1 W m−2 respectively for the test dataset. In all cases, the MBE remained near zero, indicating negligible bias. Cross-validation using a 5-fold split yielded a mean R2 of 0.96 with a standard deviation of 0.001, reflecting the model's consistency across different training subsets. Additionally, the learning curve analysis observed converging curve for RMSE as the datasets were added in subsequent runs, with training and validation curve closely converging. These metrics and observations assure confidence to apply the trained model across all the datasets and subset of these datasets under varying conditions.
Currently, to the best of our knowledge, no observational products directly quantify BC TOA DRF while fully accounting for dynamic BC microphysics and using multi-wavelength optical properties in tandem. Although satellite and ground-based platforms provide key aerosol optical parameters (e.g., AOD, AAOD and SSA), they do not provide BC TOA DRF for direct comparison. Therefore, we use physically based COSMO-RTM model outputs, that accounts for BC microphysics and optical properties, as the reference standard to compare our surrogate models. This ensures comparison against a comprehensive, physically consistent benchmark in the absence of direct observational data. As an additional check on the physical credibility of this COSMO-RTM BC TOA DRF target, an AERONET-based forcing-efficiency consistency test was performed over Dhaka using Version 3 Level 2.0 inversion radiative forcing products (Sect. S2). The analysis shows that COSMO-RTM BC TOA forcing efficiency exhibits regime-dependent consistency with AERONET total-aerosol TOA forcing efficiency under absorbing, spectrally BC-like conditions (Fig. S2), and that observed proportional scaling falls within the expected BC-to-total TOA forcing efficiency range (Table S2).
Furthermore, to better understand how different predictors influence BC TOA DRF, each surrogate model is tested across different pollution and morphological regimes. Pollution conditions were categorized based on BCAOD550 values, while different morphological regimes were categorized based on BC size and mixing state (ratio of BC core size to total size) conditions. These conditions were generated following percentile-based division as shown in Table S3. A series of performance and error metrics – adj R2, root mean square error (RMSE), mean Absolute and bias error, mean absolute percentage error (MAPE), bias-corrected RMSE and confidence intervals etc. – are computed and compared, to assess the performance of different models detailed in.
2.3 SHAP (SHapley Additive exPlanation) analysis
To further explain the feature contributions, Shapley Additive Explanations (SHAP) analysis is used, where SHAP values, derived from cooperative game theory (Lundberg and Lee, 2017), quantify the contribution of each feature by considering all possible combinations. These values capture both individual and joint feature contributions, offering a fair and consistent explanation of the model's predictions. Additionally, violin plots are employed to visualize the distribution of SHAP values across predictions, providing insights into how feature contributions vary.
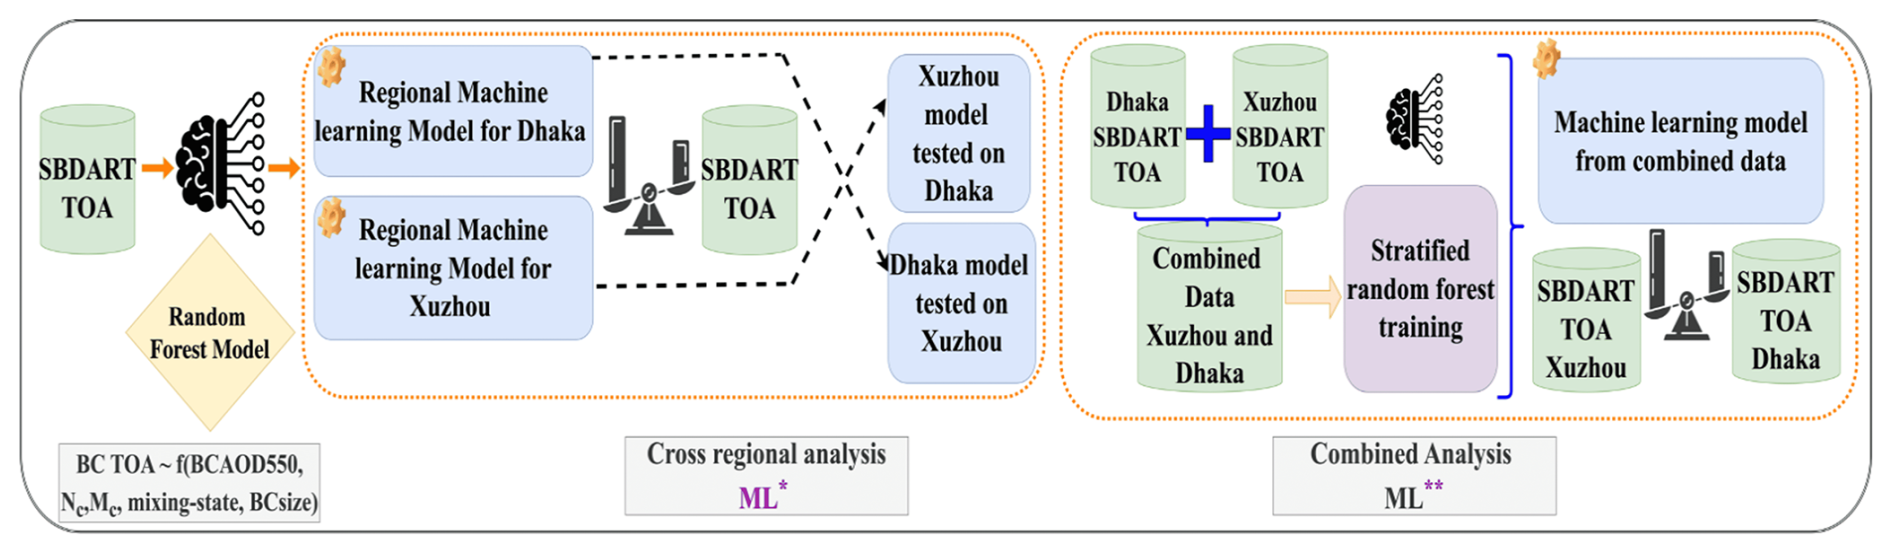
Figure 2Conceptual schematic for conducting cross-regional (ML*) and combined (ML) analysis.
2.4 Testing ML models transferability: cross-regional and combined approach
Finally, to test if developed surrogate ML models can serve as a fast BC radiative transfer tool in other geographic regions, a cross-regional and combined model testing analysis was carried out. First, the ML model generated in one region (e.g., Dhaka) was applied to predict BC TOA DRF in the other region (e.g., Xuzhou), and vice versa. The specific cross-regional model (ML*) validation tested the transferability of region-specific models informed by local BC properties into different regions with their own unique local BC properties, providing critical insights into the extent to which these models perform across distinct environmental, microphysical, and total column conditions using the same sets of predictors. Additionally, a combined model (ML) was developed by implementing stratified regional testing, combining data from both the regions as inputs, hence learning the variability in how BC TOA is physically computed based on relationships using predictors based on environmental conditions across both regions in tandem. Subsequently ML is again tested over both Xuzhou and Dhaka and is compared with SBDART BC TOA. The conceptual overview of this framework is summarized in Fig. 2.
Finally high resolution (0.05°×0.05°) long-term average spatial maps of SBDART, ML* and ML BCTOA were generated and spatial correlation are analyzed to assess how well the surrogate models capture spatial variability over a long-term average time frame. Additionally, comparison between the local ML and the ML model is performed over these spatial aggregated climatologies, by computing error improvement metrics and spatial difference in absolute prediction errors evaluated against SBDART.
3.1 Comparative analysis of black carbon microphysical, optical, and columnar properties in Xuzhou and Dhaka: key predictors of BC TOA DRF
Optical, microphysical and column abundance properties like BCAOD, BC size (radius in nm) and mixing state (ratio of BC size to total size), Nc, Mc, BC core size directly or indirectly influence aerosol–radiation interactions, ultimately impact TOA forcing. Figure 3, below presents the distribution of these parameters via probability density plots over both the regions.
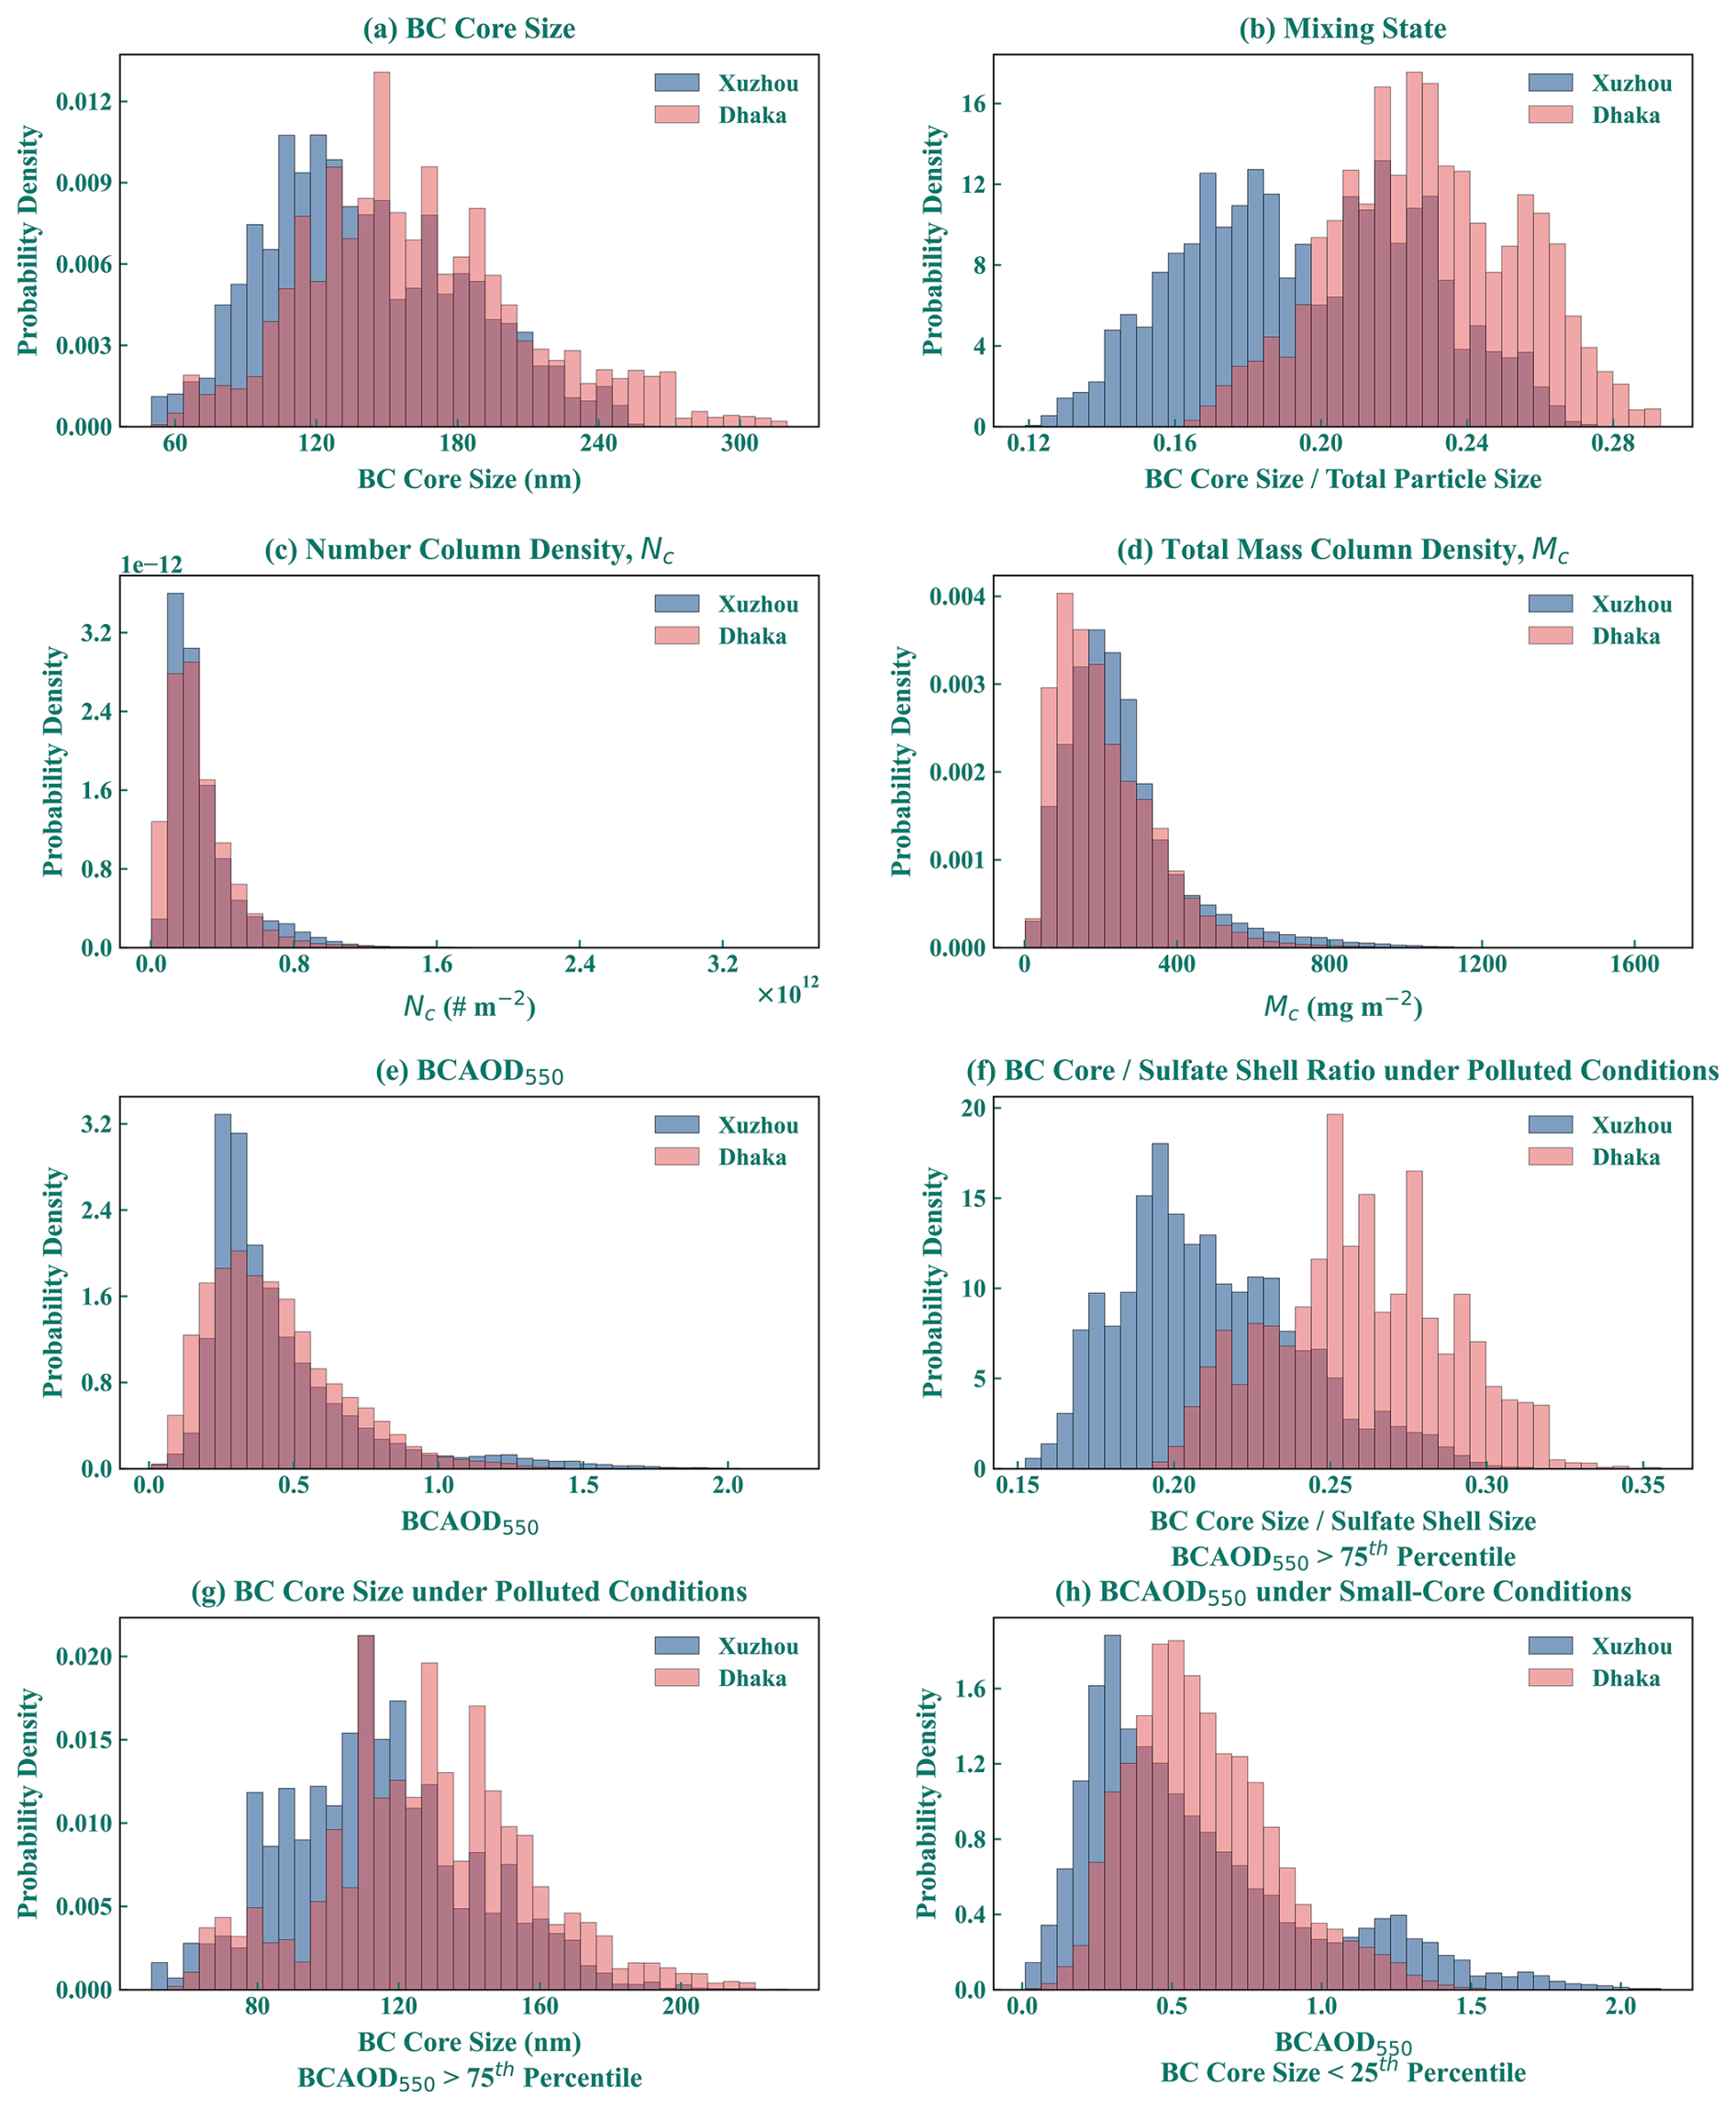
Figure 3Probability density distributions of key predictors for aerosol radiative forcing analysis in Xuzhou and Dhaka: (a) Black Carbon (BC) core size, (b) mixing state (ratio of BC size to total size), (c) number column density (Nc), (d) total mass column density (Mc), and (e) BCAOD at 550 nm, (f) BC core to Sulfate shell size ratio (BCAOD550 > 75th percentile), (g) BC core size for polluted condition (BCAOD550 > 75th percentile), (h) BCAOD550 distribution (BC core size < 25th percentile or under barely coated conditions).
The regional differences in per-particle BC size and mixing state between Dhaka and Xuzhou revealed contrasting behavior. First, BC core size (Fig. 3a) showed a broader and mostly higher range in Dhaka (from 50 to 320 nm, with mean/25th/50th/75th percentiles distributed as 162.5/130/156/190 nm) than in Xuzhou (from 50 to 260 nm, with corresponding statistics of 140.5/110/134.4/170 nm). The mixing state distribution was also distinct (Fig. 3b), with the value over Dhaka both narrower and higher (from 0.16 to 0.29 with mean/25th/50th/75th observed as 0.23/0.21/0.23/0.25) than over Xuzhou (0.12 to 0.28, with corresponding statistics of 0.2/0.17/0.2/0.22). In general BC aerosols over Xuzhou are emitted as smaller particles which then more rapidly coat, while over Dhaka, larger BC cores are emitted and the coating is lesser. These results are consistent with the wide range of co-emitted sources and higher in-situ secondary aerosol and other atmospheric processing occurring in Xuzhou, and the less efficient combustion leading to more and larger soot monomers combined with less oxidative atmosphere in Dhaka leading to less overall secondary aerosol production. These factors play a crucial role in shaping the microphysical properties of BC, and subsequent influence on the solar radiation stream and overall atmospheric effects.
Nc exhibited distinct distribution patterns (Fig. 3c) with the value in Xuzhou generally higher on average but less extreme (from 6.4×10⁹ to 2.7×10¹² # m−2, with the mean/25th/median/75th values distributed as 3.0×10¹¹/1.6×1011/2.3×1011/3.5×1011 # m−2) than in Dhaka (from 4.5×10⁹ to 3.6×10¹² # m−2, with corresponding statistics 2.7×10¹¹/1.5×1011/2.2×1011/3.5×1011 # m−2). Xuzhou exhibits a consistently higher baseline for Nc, as indicated by its minimum, 25th percentile, and median values, consistent with more sustained yet regulated aerosol sources from known industrial and urban centers, as well as influence from substantial regional transport. Dhaka shows slightly lower mean and baseline values, although its maximum Nc is substantially higher, highlighting the occurrence of extreme aerosol loading events, which are consistent with strong yet episodic sources, including extensive contributions from biomass burning, and brick kiln operations, as well as influence from stagnant atmospheric conditions, which exacerbate aerosol accumulation in the region (Rahman et al., 2019; Salam et al., 2021; Zaman et al., 2023). Interestingly, the 75th percentile values of Nc are comparable across both regions indicating similar levels of moderately high loading.
Mc exhibited a broader range and higher loading across all percentiles in Xuzhou compared to Dhaka (Fig. 3d). Over Xuzhou, Mc ranged from 2.8 to 1668.2 mg m−2 with mean/25th/median/75th values of 254.2/151.8/222.1/309.6 mg m−2, while over Dhaka Mc ranged between 1.9 to 1052 mg m−2 with corresponding values of 211.9/113.3/181.2/284.9 respectively. This is concordant with a previous study which pointed out that the higher Mc in Xuzhou is mostly associated with the larger aerosol coating compared with Dhaka (Tiwari et al., 2025). This discrepancy is consistent with lower combustion efficiency in Dhaka and significant influences of agricultural and biomass burning, leading to larger cores but also slower secondary aerosol growth. Additionally, such conditions lead to reduced local solar radiation required for rapid secondary aerosol production of inorganic aerosols compared to Xuzhou. In contrast, Xuzhou's elevated BC levels are attributed to its higher total power consumption and diverse industrial emissions, which arise from both local and regional transport activities. This finding is consistent with observations from other urban and suburban regions throughout central and western China, where diverse emission sources, effective secondary aerosol formation processes, and significant co-emissions have been identified as contributing factors (Liu et al., 2024c). Consequently, these long-range transport events in Xuzhou may also further contribute to the higher Mc.
Notably, BCAOD at 550 nm showed comparable values between Xuzhou and Dhaka (Fig. 3e), ranging from 0.01 to 2.2 with mean/25th/median/75th values distributed as 0.5/0.3/0.4/0.5 in Xuzhou and 0.4/0.3/0.4/0.6 in Dhaka. Detailed comparison reveals distinct regional differences in BC dynamics, with Xuzhou experiencing more extreme aerosol events contributing to BC loading, as reflected by its higher maximum and elevated mean values. These episodic events likely enhance the BC loading and aging, in turn enhancing net extinction from inorganics, contributing to the longer tail in the distribution. In contrast, Dhaka exhibits a more uniform distribution of moderately high values, as evidenced by its slightly higher 75th percentile but lower overall maximum, suggesting high but consistent aerosol loading, potentially driven by continuous emissions from urban and regional sources. The elevated BCAOD550 in Xuzhou is likely influenced by both local emissions and regional loading, as supported by Qin et al. (2022), which observed transported aloft aerosols promote rapid formation of secondary inorganics like secondary sulfate over Xuzhou, which when coated with BC cores can enhance the overall extinction. Additionally, Chen et al. (2019) previously reported high BC to PM ratio in Xuzhou often associated with both southern and northern winds originating from major economic areas in the lower Yangtze River Delta and Beijing-Tianjin-Hebei provinces. Source attribution has pointed to Shandong as well as central provinces, Henan and Anhui, as significant contributors to BC loading over Xuzhou.
Further analysis of high polluted conditions (BCAOD550 > 75th percentile) demonstrates distinct BC core size distributions (Fig. 3f and g). The polluted-condition core-to-shell ratio distribution indicates relatively thicker sulfate coatings in Xuzhou, whereas Dhaka exhibits larger core-to-shell ratios, consistent with comparatively larger BC cores and thinner relative coatings. The polluted-condition BC core size PDF further shows that Xuzhou is dominated by a more compact small-to-medium core-size population, while Dhaka exhibits a broader distribution extending toward larger BC core sizes.
The corresponding two-dimensional core-shell KDE analysis further supports this interpretation (Fig. S3). Xuzhou shows a compact distribution with BC cores mostly between 100–120 nm and sulfate shells of 500–600 nm, plus a smaller cluster of 80–90 nm cores with 390–410 nm shells, indicating well-coated small to medium cores. Dhaka's primary cluster features 100–120 nm cores with 390–450 nm shells, and a secondary cluster of larger 140–160 nm cores paired with 550–620 nm shells. The BCAOD550 probability density function for small cores (Fig. 3h) associates these sizes with elevated pollution in both areas, while core-to-shell ratios highlight a dominance of thicker shell coatings in Xuzhou, reflecting strong secondary inorganic formation. Conversely, Dhaka's narrower small-core distribution and larger core-to-shell ratios imply frequent pollution events involve larger BC cores with relatively thinner coatings. These contrasts emphasize secondary inorganic growth drives Xuzhou's polluted conditions, while primary emissions drive Dhaka's polluted conditions.
3.2 Evaluating model performance: overall, and across varied pollution condition and morphological regimes
As outlined in Sect. 2.2, the three surrogate models span a deliberate complexity gradient, from AOD-only linear scaling to multivariate parametric regression, and ultimately nonlinear ensemble learning, each model tier is designed to probe a distinct aspect of BC–radiation interactions. Their performance is assessed not only in aggregate but across distinct pollution, coating, and size regimes, where the physical drivers of BC TOA forcing are expected to differ most.
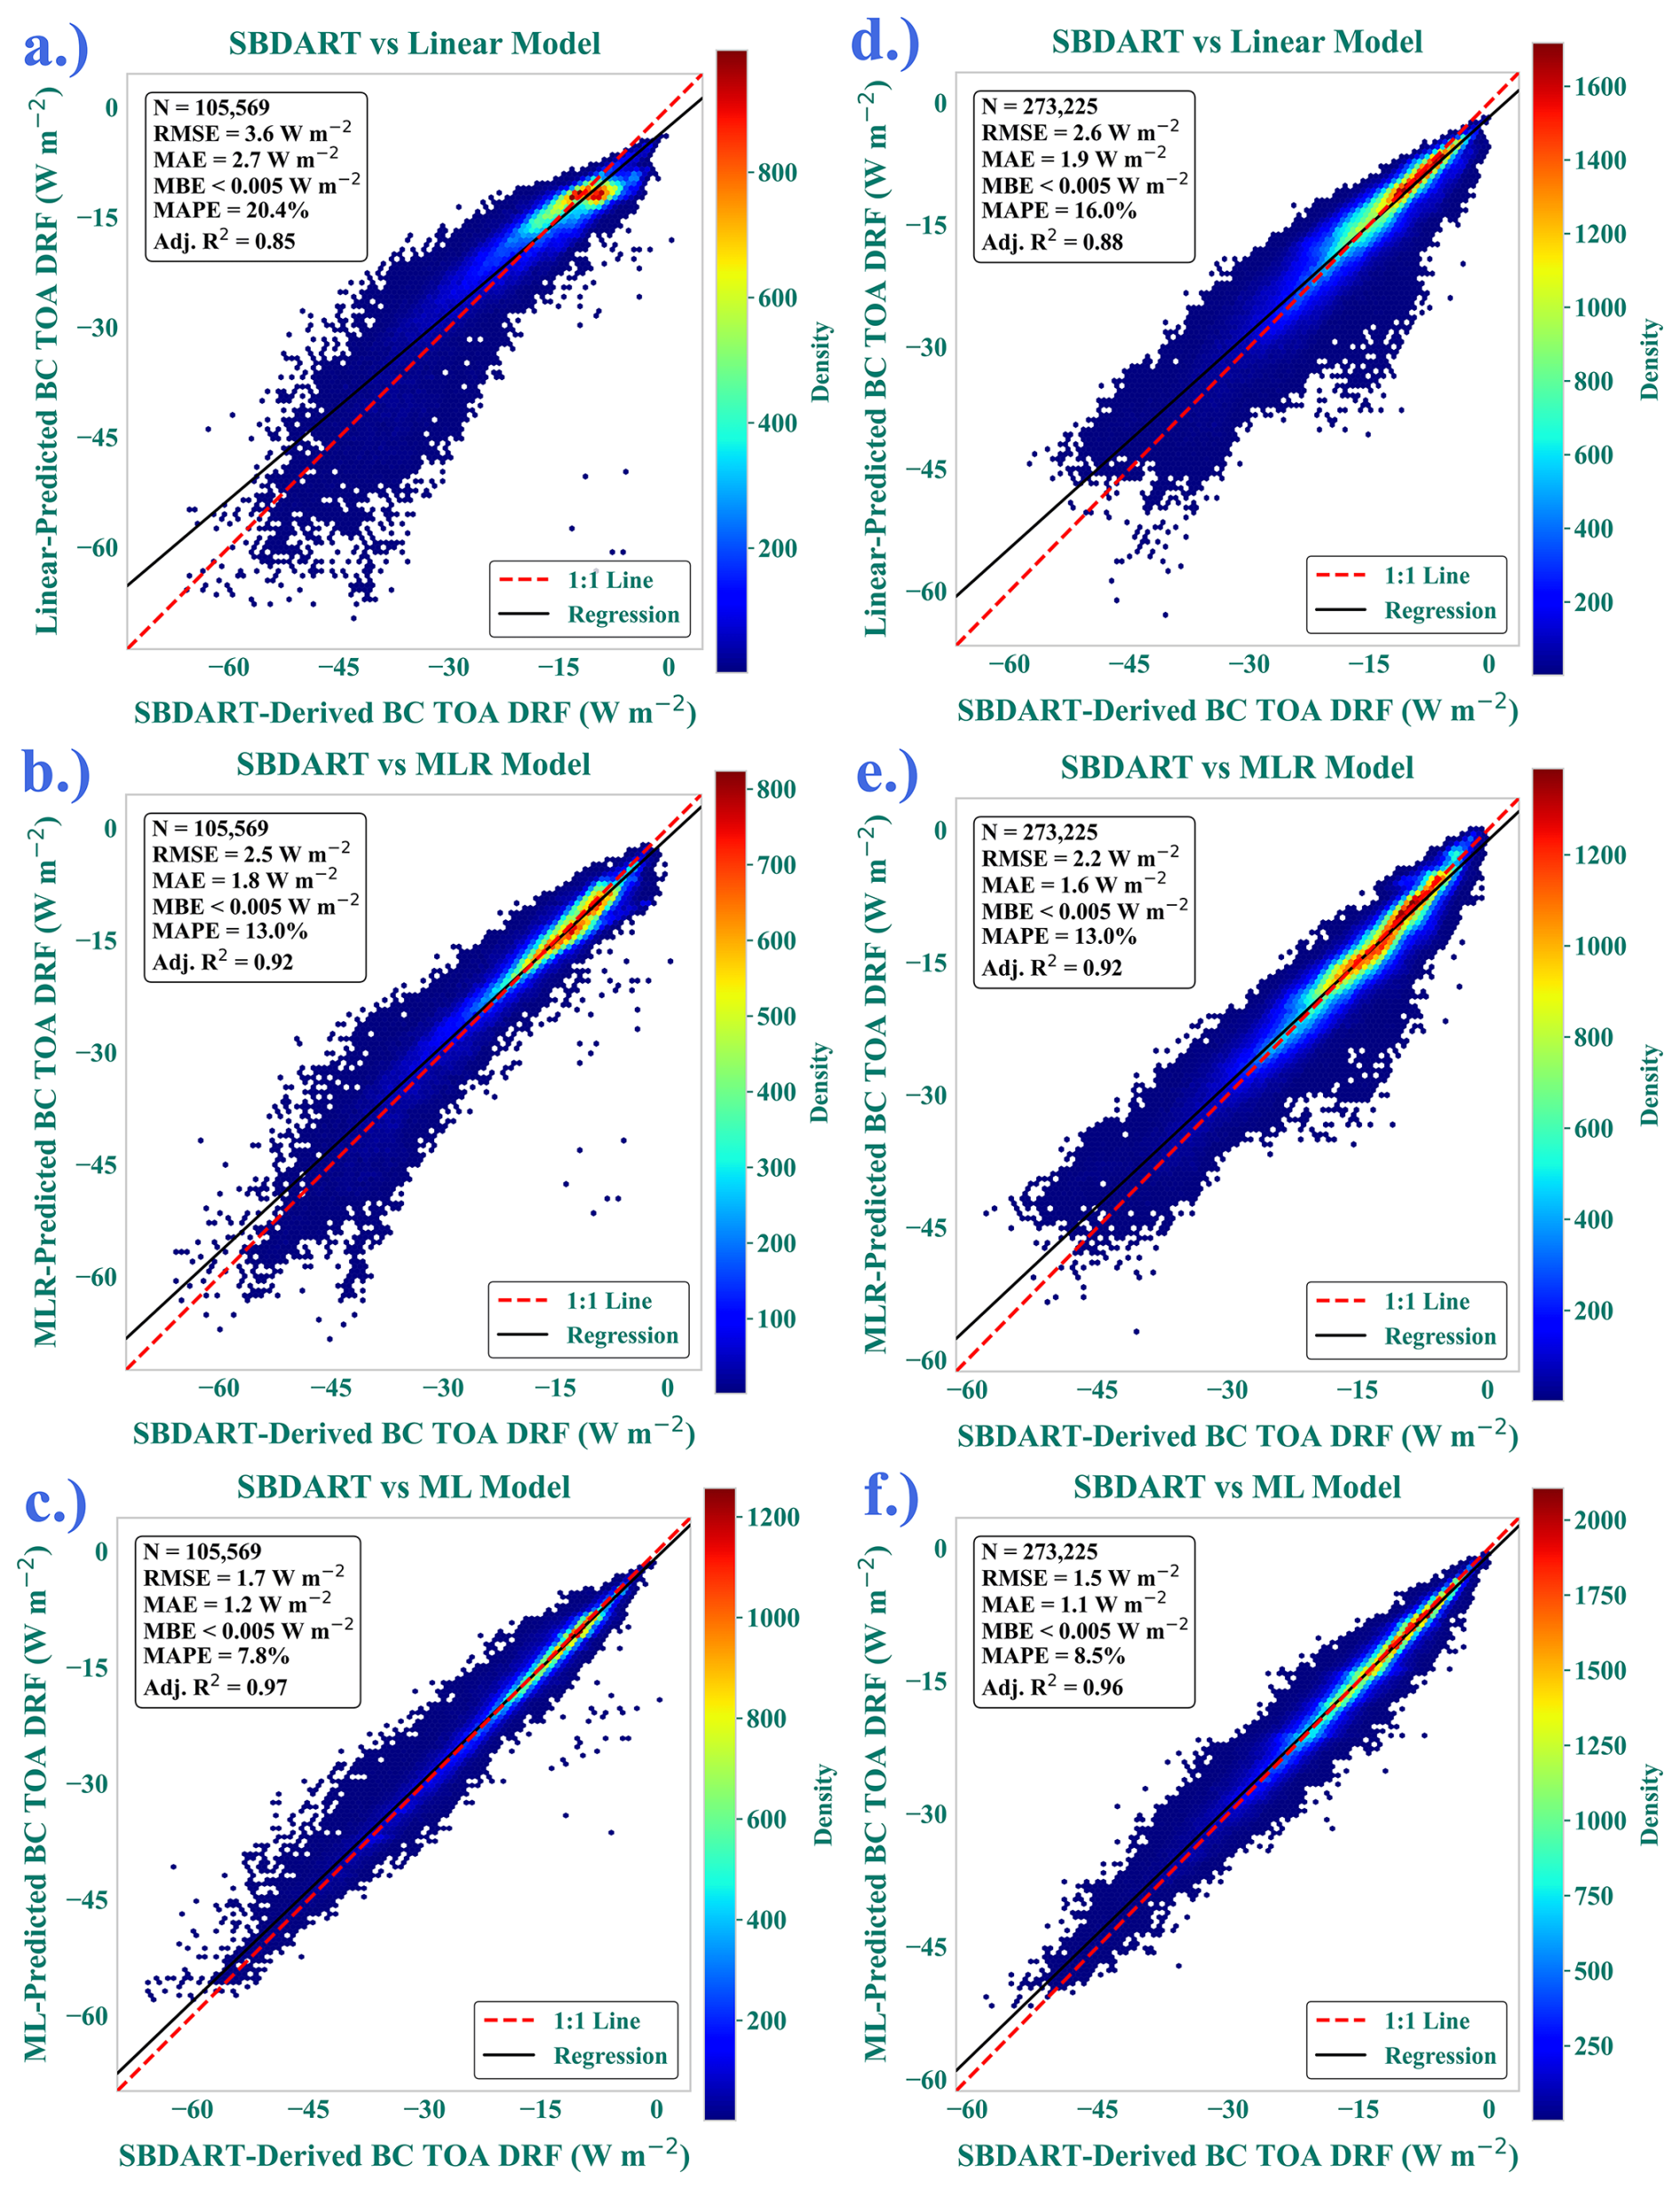
Figure 4Comparison of BC TOA DRF predictions from various models (Linear, MLR, and ML) with SBDART BC TOA DRF for Xuzhou (a–c) and Dhaka (d–f). The scatter plots (a, d) display the relationship between model predictions and SBDART values, with color maps indicating the density of data points.
The performance of the Linear, MLR, and ML models in predicting SBDART TOA were visualized through 2D density plots for both Xuzhou (Fig. 4a–c) and Dhaka (Fig. 4d–f). The ML-model, MLR, and linear models reproduce the SBDART-derived TOA radiative forcing (mean: Xuzhou = W m−2; Dhaka = W m−2) with moderate-high fidelity, as evidenced by near-identical means and low percentage errors (ML: 7.8 %–8.5 %; MLR: 13.0 %; Linear: 16.0 %–20.4 %) (Fig. 4). The progressively tighter clustering around the 1:1 line from Fig. 4a–c and d–f confirms that the ML-model exhibits superior accuracy with the lowest RMSE (Xuzhou: 1.7 W m−2; Dhaka: 1.5 W m−2) and highest R2 (0.96–0.97) (Fig. 4c and f), reflecting its improved capacity to capture non-linear BC–radiation interactions. The linear model underestimates extreme BCTOA values (e.g., Xuzhou 1st percentile: Linear = −49.0 W m−2 versus SBDART = −45.4 W m−2), while ML-model closely matches SBDART distributions (Xuzhou 1st percentile: ML = −43.9 W m−2 versus SBDART = −45.4 W m−2), particularly at tails as shown in Fig. S4. In Dhaka, ML's narrower 95 % confidence intervals (−0.002 to 0.009 W m−2) and lower MAE (1.1 W m−2) highlight its robustness in capturing TOA variability. Both regions show systematic model divergence at warming conditions, where linear and MLR models underestimate warming (e.g., Xuzhou 99th percentile: Linear = −7.2 W m−2 versus SBDART = −4.1 W m−2), whereas ML marginally minimizes bias (ML = −4.5 W m−2) (Fig. S4).
The ML, MLR, and linear models exhibit distinct performance patterns across BCTOA radiative forcing regimes, revealing significant variations in accuracy, precision, and robustness. In Xuzhou, the linear model exhibited the highest errors in all BC TOA categories, with a mean error of 1.98 W m−2 (95 % CI: 1.92–2.03) in Low BC TOA (more cooling scenarios) and −2.9 W m−2 (95 % CI: -2.89 to -2.83) in High BC TOA (more warming scenarios), alongside persistent bias (RMSE = 3.4 W m−2 in High BC TOA). The MLR model showed intermediate performance, reducing errors compared to linear (e.g., MAE = 2.8 W m−2 in Low BC TOA versus Linear's 4.4 W m−2) but still underperforming ML (MAE = 1.6 W m−2). In High BC TOA, MLR's bias corrected RMSE (1.8 W m−2) matched Linear's, indicating unresolved bias, while ML achieved the lowest RMSE and bias corrected RMSE (1.2 and 1.1 W m−2) and highest R2 (0.73). In Dhaka, similar trends emerged but with smaller errors. Linear model had a mean error of 1.1 W m−2 in Low TOA and −1.2 W m−2 (95 % CI: −1.2 to −1.1) in High BC TOA, with RMSE and bias corrected RMSE as 3.5 and 3.3 W m−2 and 2.0 and 1.6 W m−2 in Low and High BC TOA scenarios. MLR improved over Linear (e.g., MAE = 2.1 W m−2in Low BC TOA versus Linear's 2.8 W m−2) but lagged behind ML (MAE = 1.5 W m−2). In High BC TOA, MLR's R2 (0.58) was higher than Linear's (0.47) but lower than ML's (0.78), with ML achieving the lowest RMSE (1.0 W m−2).
An interesting pattern is observed over the range of TOA values transitioning between strong cooling and slight cooling/warming, hereafter considered the transition- BCTOA regimes. For both Mid-Low and Mid-High BC TOA categories, all the models demonstrated lower R2 despite similar or lower error metrics than the Low and High BC TOA across some models. In both Xuzhou and Dhaka, the Mid-Low and Mid-High BC TOA categories revealed a striking inconsistency between error metrics and variance explained. For instance, in Xuzhou's Mid-Low category, the ML model achieved a low MAE of 1.1 W m−2 and RMSE of 1.6 W m−2, comparable and better to its performance in extreme BC TOA ranges (e.g., Low BC TOA: MAE = 1.6 and RMSE = 2.4 W m−2 and High BC TOA: MAE = 0.9 W m−2, RMSE = 1.2 W m−2). Similarly, in Dhaka's Mid-Low category, ML had MAE = 1.2 W m−2 and RMSE = 1.6 W m−2, better than its performance in the low BC TOA range (MAE = 1.5 W m−2, RMSE = 2.0 W m−2). However, R2 values in mid-range categories were significantly lower (e.g., Xuzhou Mid-Low; R2=0.56 versus High BC TOA: R2=0.73 and Low BC TOA: R2=0.89; Dhaka Mid-Low: R2=0.50 versus High BC TOA: R2=0.78 and Low BC TOA: R2=0.87). This pattern persisted across models. In Xuzhou's Mid-High category, MLR exhibited a mean error near zero (−0.4 W m−2) but explained only 26 % of variance, while linear model had a 11.9 % MAPE; lower than Low and High BC TOA regimes, but R2 of 0.13. In Dhaka's Mid-High category, MLR achieved a low MAPE of 13.2 % when R2 was 0.33, compared to its performance at High TOA (MAPE = 21.5 % R2=0.58). These results highlight a bias-variance trade-off, meaning, the models tend to capture the average radiative forcing magnitude fairly well (low RMSE/MAE) but failed to explain data variability in mid-range BC TOA conditions. This discrepancy likely arises from the complex, non-linear interplay of aerosol microphysics and atmospheric dynamics that dominate the transition between cooling to warming BC TOA condition, as well as daily-scale variability which occurs underlying these special events as they crossover from one regime to the other. For instance, transient processes such as mixing-state evolution (e.g., sulfate coating on BC cores; Cappa et al., 2012; Fierce et al., 2020; gradual growth in per particle size and mass; McFiggans et al., 2006, and impacts of changes in precursor species on the size distribution; Seinfeld et al., 2003), can introduce high intra-category variability, or spatial and temporal variation, which linear and MLR framework cannot resolve and ML only partially captures. These regimes also involve competing absorption-scattering balances, where minor shifts in aerosol composition or morphology disproportionately alter per-particle properties (Guan et al., 2026) and even forcing directionality, amplifying unexplained variance (Samset et al., 2018b).
To assess the model performance under different and microphysical conditions, performance comparison across different mixing state and BC core size conditions were analyzed and tabulated in Table 1.
Table 1Performance comparison of Linear, MLR, and ML surrogate models across BC core size and mixing state regimes (all model differences significant at p<0.05). Reported metrics are Adj. R2, errors (RMSE, MAE, MBE (all in W m−2), and MAPE (%)).
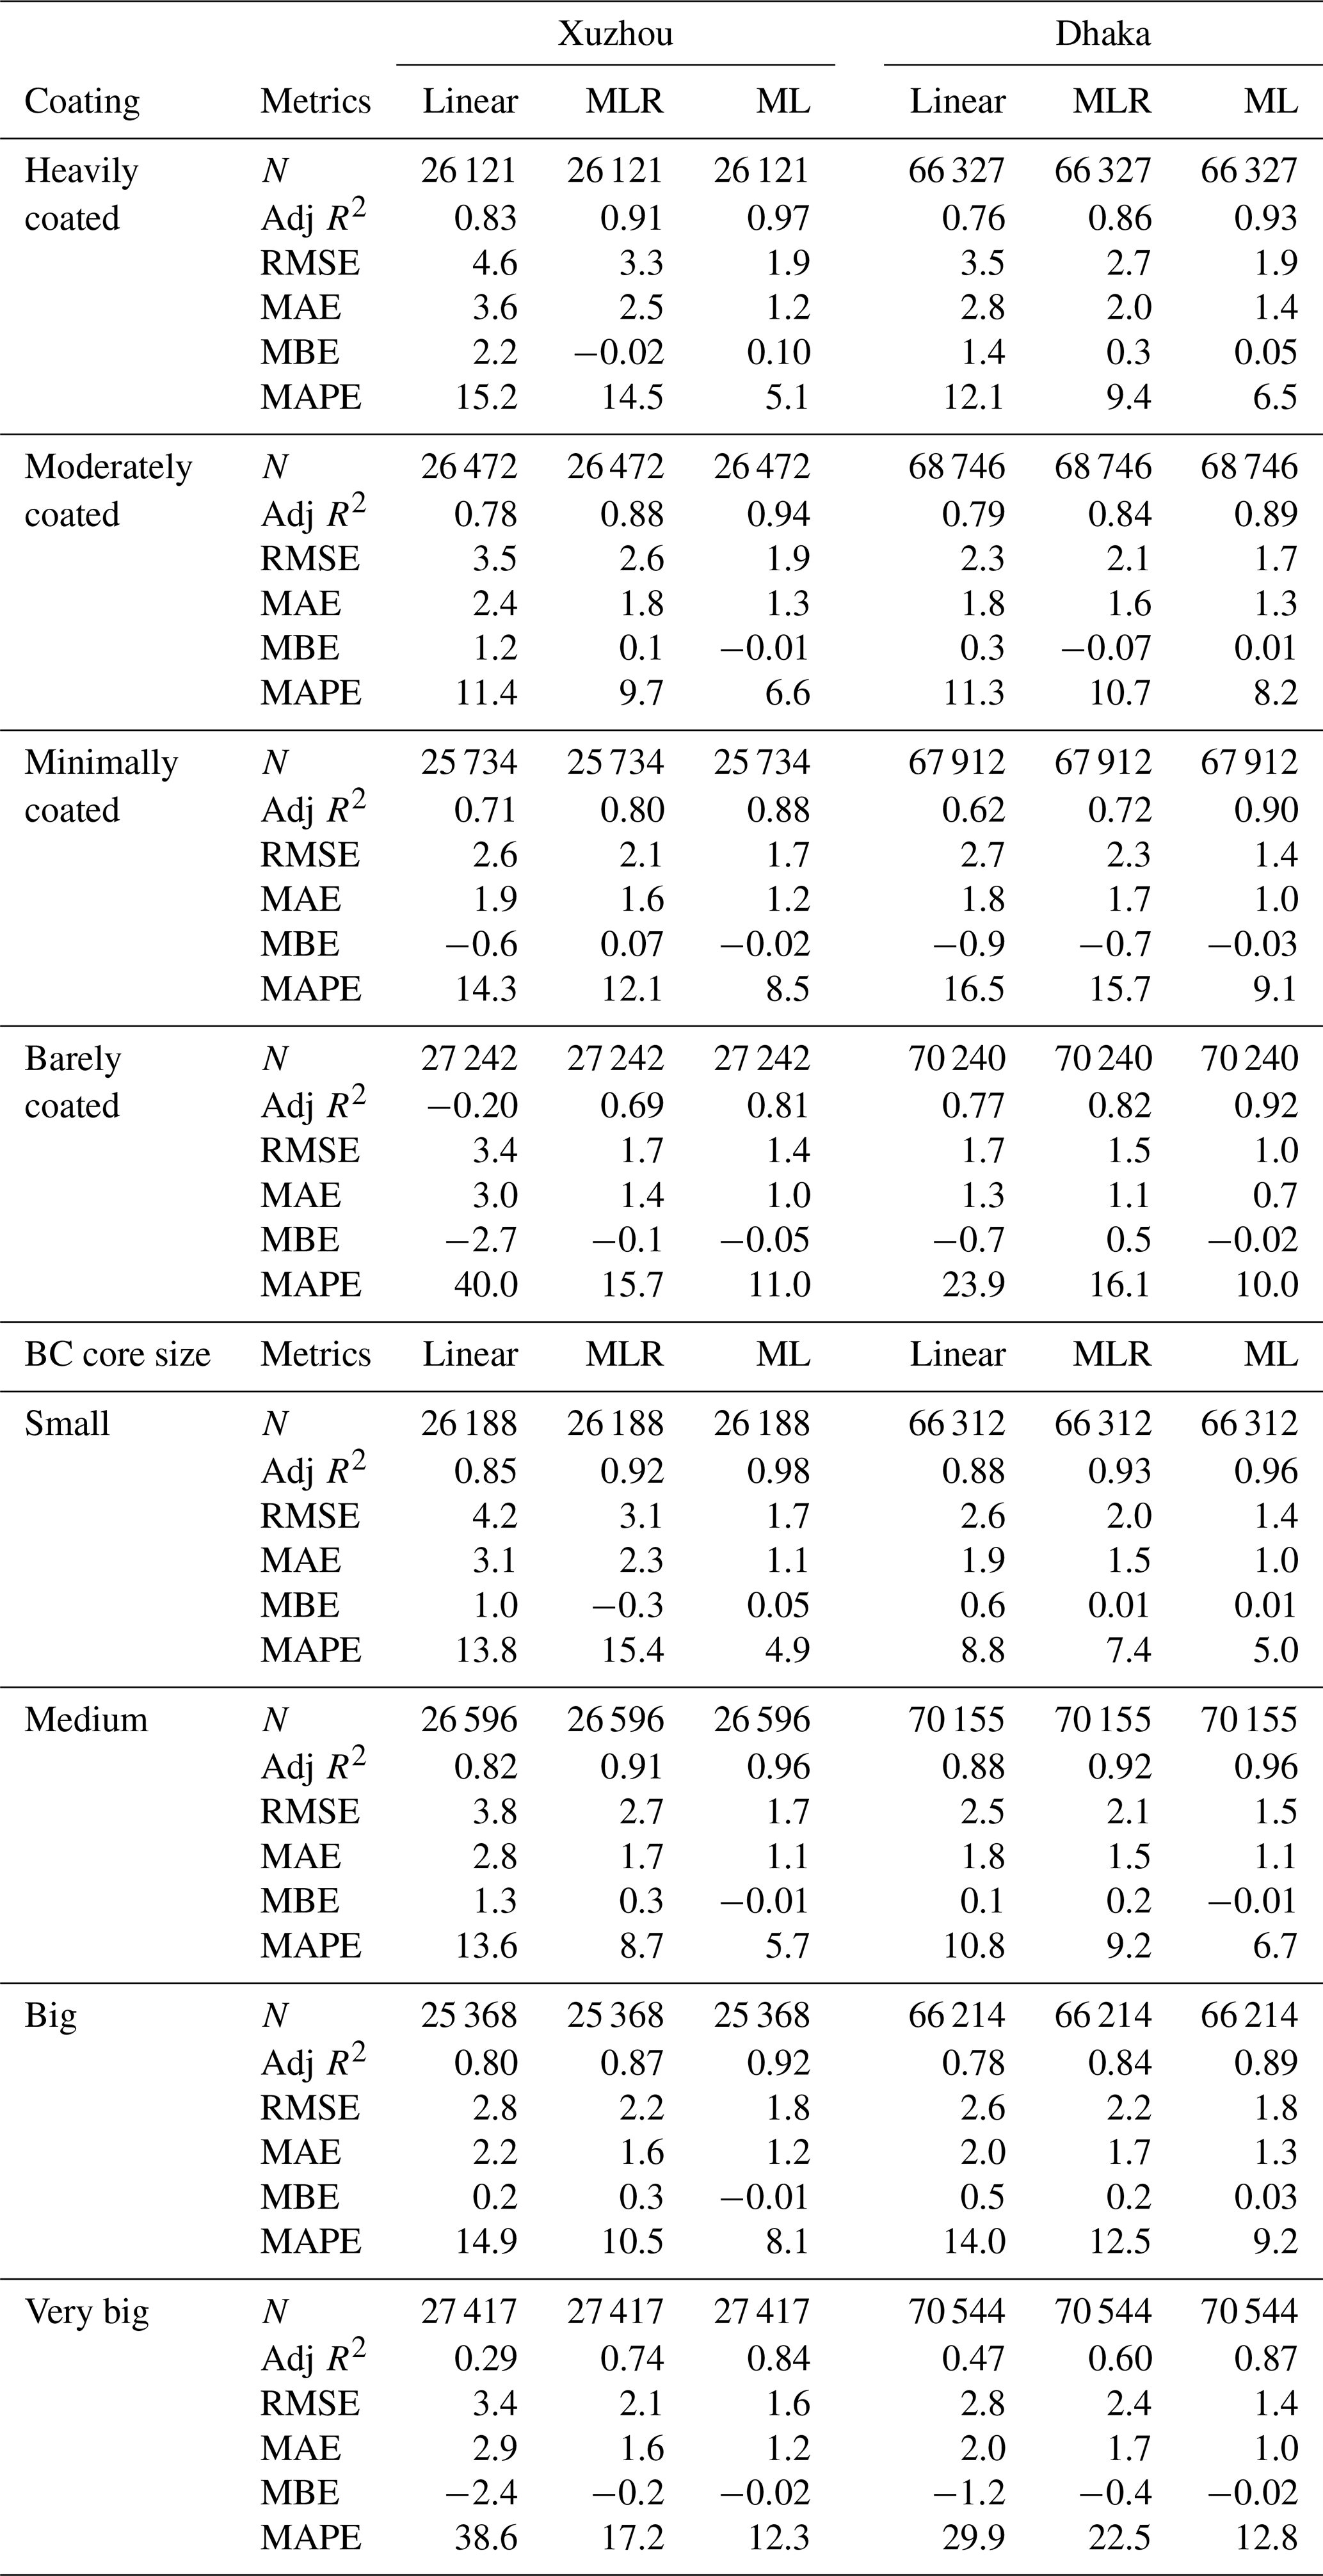
For heavily coated BC, ML achieves superior accuracy in both Xuzhou (Adj. R2=0.97) and Dhaka (Adj. R2=0.93), reducing RMSE by 59 % and 46 % relative to linear and MLR models, with near-zero mean bias (MBE: 0.1 versus 2.2 in Xuzhou; 0.05 versus 1.4 in Dhaka). Under moderately coated conditions, ML remains dominant, lowering MAE 46 %–50 % in Xuzhou (1.3 W m−2 versus 2.4 W m−2) and MAPE by 19 %–24 % in Dhaka (8.2 % versus 10.7 %). Even for minimally coated BC, ML demonstrates strong predictive skills, reducing RMSE by 35 % compared to MLR over Xuzhou and lowering MAPE by 42 % in Dhaka. Notably, for barely coated BC, linear modeling fails entirely in Xuzhou (Adj. ), whereas, ML retains robust performance (Adj. R2: 0.81, RMSE: 1.4 W m−2, MAPE: 11.0 %), underscoring its resilience under low-coating conditions. In Dhaka, ML's MAPE (10.0 %) reducing MAPE by 38 % lower than MLR's (16.1 %), with near-perfect bias neutrality (MBE −0.02 W m−2). Linear and MLR models exhibit stronger systematic bias in these regimes including underprediction (MBE: −2.7 W m−2) in Xuzhou, and slight overprediction (MBE: 0.5 W m−2) in Dhaka. Regarding BC core size, ML achieves high precision for small cores in both cities (Adj. R2=0.98/0.96, RMSE = 1.7/1.4 W m−2, MAPE = 4.9 %/5.0 % in Xuzhou/Dhaka, reducing RMSE errors by 45 %–60 % over Xuzhou and 30 %–46 % over Dhaka compared to MLR and linear models. Transitioning to very big BC cores, the linear frameworks perform poorly in Xuzhou (Adj. R2=0.29; MAPE = 38.6 %), while ML retains robust accuracy (Adj. R2=0.84, MAPE = 12.3 %). In Dhaka, ML reduces RMSE by 42 % and nearly halves MAPE relative to MLR. Similarly, model performances across different pollution conditions also demonstrates superior accuracy and robustness of ML compared to its contemporaries; detailed evaluation including Taylor diagram analysis in Fig. S5 within Sect. S3.
Analysis of the underlying microphysical properties reveals that ensemble learning models consistently outperform linear and MLR approaches in reproducing BC TOA, across diverse pollution conditions (clean to polluted), mixing states (heavily coated to barely coated), and size categories (small to very large) in both Xuzhou and Dhaka. Statistically, RF achieves superior accuracy (Adj. R2 spanning 0.73–0.98), near-neutral bias (), and error reductions of 30 %–67 % (RMSE) compared to linear models, with performance gaps widening under complex conditions-such as heavily polluted scenarios (Xuzhou: RF RMSE 2.26 W m−2 versus MLR 3.62 W m−2) or minimally coated BC (for Dhaka; RF MAPE 9.1 % versus MLR 15.7 %). Physically, ML's dominance stems from its ability to resolve non-linear interactions between BC core size, coating thickness, and atmospheric aging processes, which linear frameworks oversimplify, including the transition states between negative and nearly zero or even positive BC TOA. The observed bias-variance trade-off in mid-range BC TOA regimes further underscores the complex interplay of BC microphysics and atmospheric dynamics and other sources of non-linearities which ML models partially capture but remains a challenge for conventional approaches.
3.3 Interpreting BC forcing drivers using SHAP Analysis of ML
To interpret how the ML surrogate reproduces COSMO-RTM-derived BC TOA, we applied SHAP analysis to decompose the model predictions into feature-level attributions (Fig. 5). This provides a diagnostic of how BCAOD550, column number density, mixing state, BC size, and column mass contribute to predicted BCTOA across Xuzhou and Dhaka, while explicitly accounting for non-linear feature interactions.
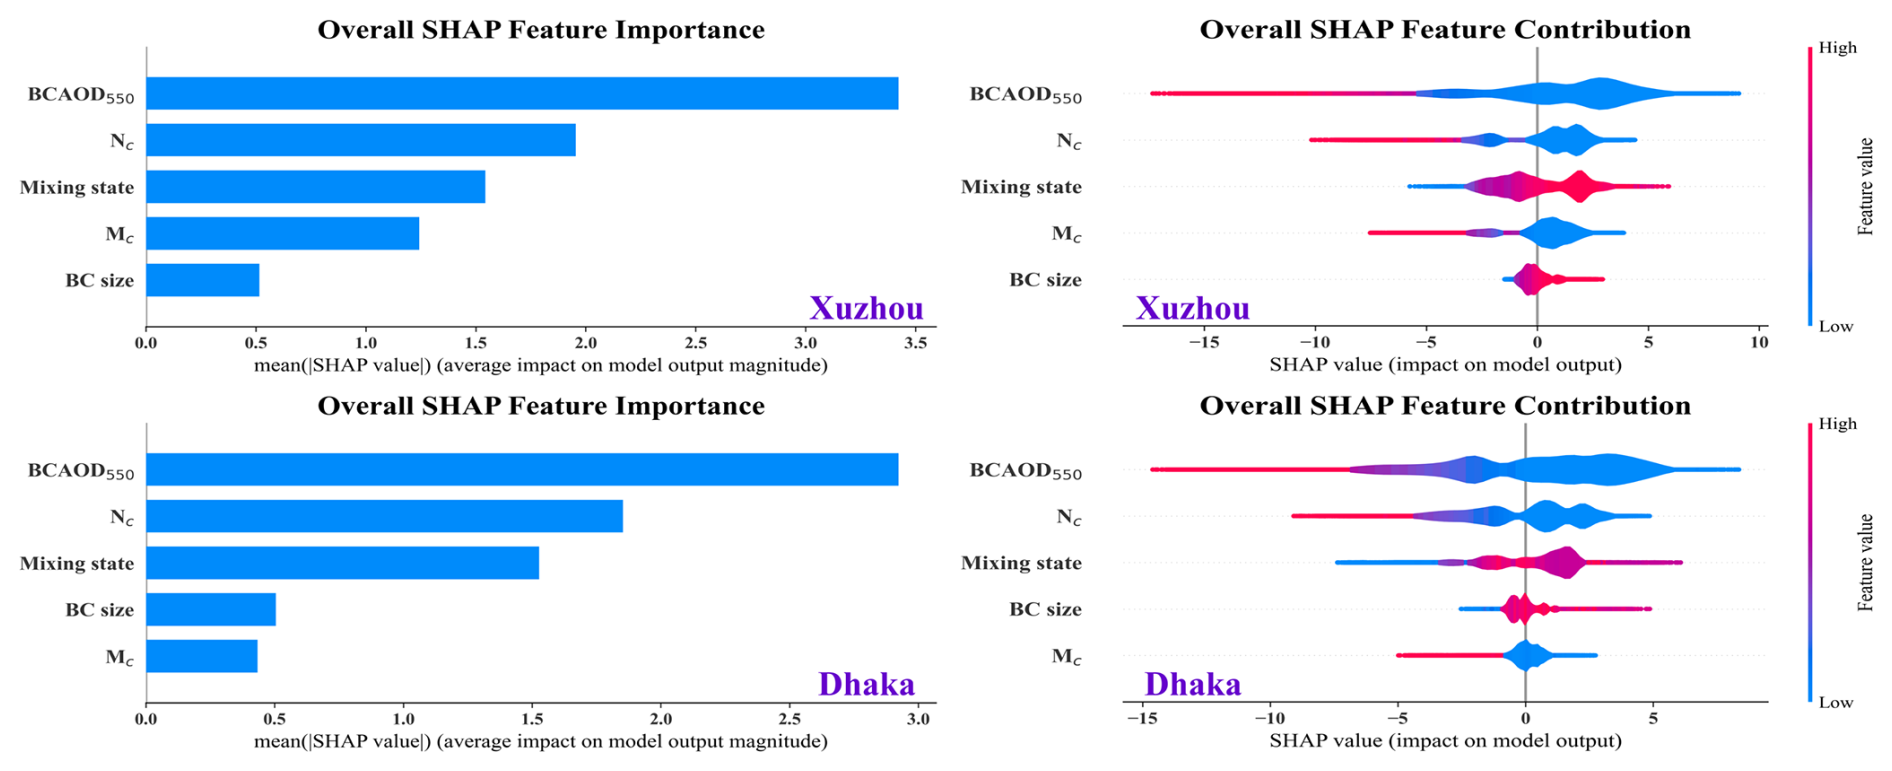
Figure 5Overall feature importance and feature contributions for predicting BC TOA in Xuzhou and Dhaka. The bar plots (left panels) display the overall feature importance based on the mean SHAP value, and the violin plots (right panels) show the distribution of SHAP values for each feature, indicating the direction and magnitude of feature contributions to the model's output. Blue corresponds to low feature values, and red indicates high feature values, with the SHAP values reflecting model-attributed shifts in predicted BCTOA toward relatively warmer positive or cooler negative forcing contributions. All SHAP values represent the impact on predicted BC TOA DRF (in W m−2).
Across both regions the ML models exhibit broadly consistent feature rankings, with BCAOD550 showing the largest mean absolute SHAP attribution. The mean SHAP associated with BCAOD550 is larger in Xuzhou (3.4, 62.1 % positive) than in Dhaka (2.9, 57.3 % positive). However, SHAP distributions reveal pronounced non-linearity across TOA forcing regimes. Lower-to-moderate BCAOD550 values are more frequently associated with positive SHAP values, whereas higher BCAOD550 values are more frequently associated with negative SHAP values. with BCAOD550 contributing positively under clean to moderately polluted conditions (BCAOD550; 0.01–0.53), but increasingly negative under moderately to heavily polluted conditions (BCAOD550; 0.37–1.9). This sign change in SHAP likely reflects a transition in the modeled radiative response, wherein increases in total extinction and scattering enhancement outweigh absorption enhancement at higher aerosol loadings. The overlap region (0.37–0.53), where both positive and negative BCAOD550 SHAP values occur, further indicates that column loading and total extinction alone are insufficient to separate weaker-cooling/warming from stronger-cooling regimes. Instead, the ML interpretation indicates that per-particle microphysical properties-represented here through dynamic coating ratios and BC core size, simultaneously modulate absorption, total scattering, and angular redistribution, producing regime-dependent forcing behaviour. This microphysics-driven BC TOA sign variability, previously demonstrated by Tiwari et al. (2023), likely arises from non-linear changes in absorption, scattering and scattering angle that occur simultaneously with small changes in the mixing ratio and core size in tandem. While such interactions and sensitivity are often high AOD contributing to more negative TOA forcing is consistent with the total attenuation under the conditions where scattering enhancement is larger than the absorption enhancement. In this context, the SHAP analysis further shows that per-particle microphysics and column loading do not map to a single TOA response, instead depending on their coupled state, they are associated with both positive or negative contributions to predicted BC TOA. This behaviour highlights that commonly used assumptions of external mixing and reliance on AOD alone maybe insufficient, as it may yield either enhanced scattering or absorption while systematically missing critical microphysical effects that govern the net TOA response In the range of BCAOD values between 0.37 and 0.53, the per particle microphysics and overall column loading can contribute either positively or negatively to TOA forcing, suggesting that commonly used external mixing assumption and AOD in tandem are insufficient (Mahajan et al., 2013; Mehrotra et al., 2024, 2025), either yielding enhanced scattering or absorption, thus assessing and demonstrating BC mostly exerting a positive TOA missing actual microphysical effects.
Followed by BCAOD550, Nc emerges as the second most important predictor in both the regions, with comparable mean SHAP of (1.95 over Xuzhou and 1.85 over Dhaka). In Xuzhou, higher Nc (> 65th percentile) coincides with increasingly negative SHAP contributions, implying the model predicts stronger cooling (more negative BC TOA) under elevated Nc. Dhaka observes a similar finding, but with the range of Nc exhibiting positive SHAP (warming tendency) being narrow (< 40th percentile). While SHAP explains model sensitivity rather than emission source characteristics, this behaviour is consistent with BC populations that remain weakly mixed over a broader range of lower particle numbers in Dhaka, consistent with limited microphysical aging and enhanced absorption efficiency. In contrast, the narrower range of Nc associated with positive TOA contributions likely suggests more rapid microphysical evolution, plausibly facilitated by co-emitted non-absorbing aerosols that promote condensation, coagulation, and coating growth.
The SHAP results further reveals a moderate but systematic role of mixing state in modulating the predicted BCTOA forcing. While the mean SHAP magnitude associated with mixing state is similar in both regions (∼1.5) the sign and distribution vary. The distribution of SHAP values indicates that positive contributions occur more frequently in Dhaka (58.6 %) than in Xuzhou (44.8 %), reflecting differences in how mixing-state variability modulates the modeled TOA response across the two urban regions. Higher mixing state values (≥0.21 in Xuzhou; ≥0.23 in Dhaka), corresponding to thinner coatings and/or larger BC core are generally associated with enhanced BC TOA warming, whereas, lower mixing states (<0.17 in Xuzhou, <0.16 in Dhaka), correspond to thicker coatings and/or smaller core fractions, coincide with negative BCTOA (cooling) via increased scattering. These regional contrasts highlight that mixing-state effects on BCTOA forcing are strongly context-dependent and emerge through interactions with column loading and particle number, rather than acting as an independent control.
In contrast, Mc and BC size exhibit comparatively weaker influence on predicted BC TOA DRF. In Xuzhou, Mc shows a higher mean SHAP than Dhaka (1.24 versus 0.43), with only the upper ∼31 % of column mass loading (>450 mg m−2) associated with cooling in the model prediction. This pattern is consistent with conditions where scattering by co-emitted aerosols dominates absorption. In Dhaka, BC core size marginally outweighs Mc in importance, though its overall contribution remains minimal, with only 9 % of larger BC cores (>220 nm) coinciding with weakly enhanced BC TOA warming. This weak sensitivity suggests that, within the observed range, BC size variations exert a secondary influence compared to column optical extinction, abundance and mixing state.
When stratified across distinct BC TOA forcing regimes-from cooling to warming, SHAP analysis reveals that BCAOD550, consistently exerts the largest influence on the predicted BC TOA DRF, while mixing state and Nc, provide a secondary but systematic contributions with regime dependent importance. This evolving hierarchy of feature contributions highlights the strongly non-linear nature of aerosol impacts on TOA forcing, consistent with transition behaviour arising from coupled changes in column optical loading and per-particle microphysics, rather than by bulk optical properties alone. The detailed SHAP analysis across BC TOA regimes is presented in Fig. S6 within Sect. S4.
3.4 Adaptability of cross-regional and combined ML surrogates under domain shift
Understanding the cross-regional adaptability of ML models is critical for assessing their transferability in terms of predicting BC TOA over different regions from where the ML model was trained. The performance of the cross-regional ML models is evaluated by applying the Xuzhou-trained model to Dhaka data and vice versa. In parallel, model adaptability is evaluated by using combined model (ML) surrogate trained on samples drawn from both the regions, and performing comparison with region-specific ML surrogates with SBDART DRF as reference. This analysis revealed that the cross-regional application results in slight performance degradation while still retaining non-trivial predictive skill, as visualized in Fig. 6.
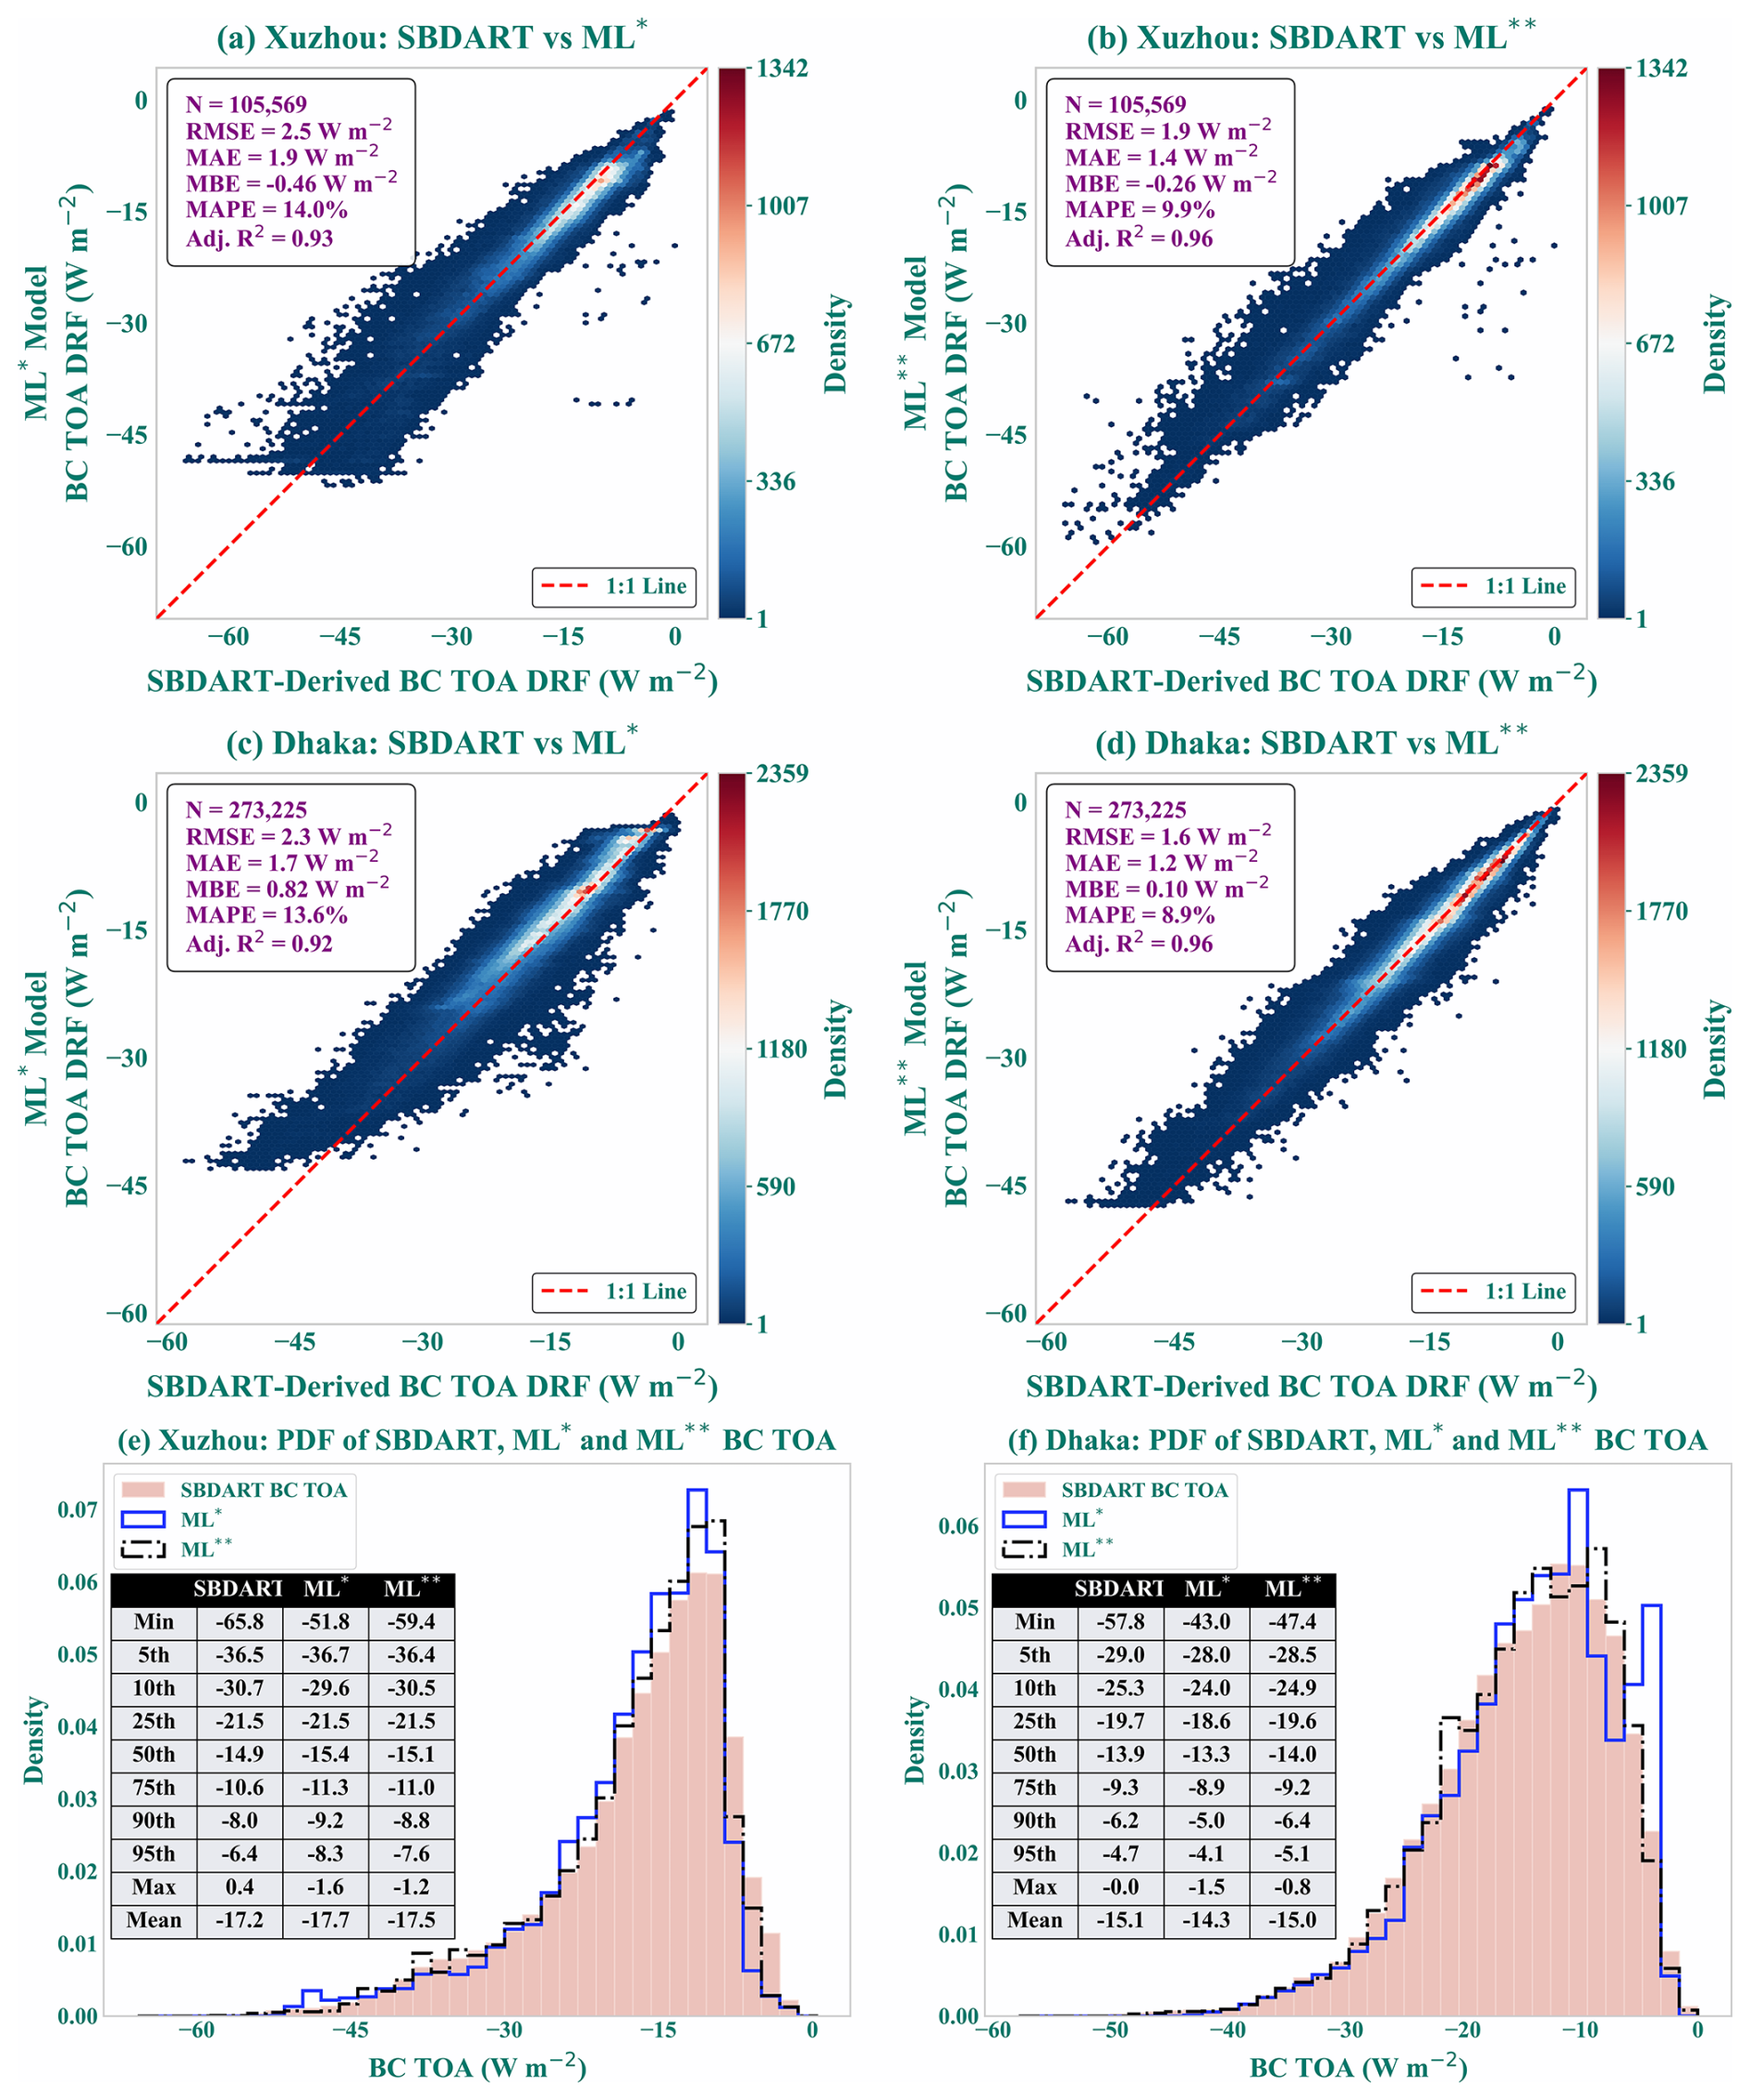
Figure 6Comparison of SBDART-derived BC TOA forcing with cross-regional (ML*) and combined (ML) ensemble learning models for Xuzhou (a, b) and Dhaka (c, d). PDF comparisons between SBDART BC TOA and ML-predicted BC TOA, with statistical summaries of BCTOA distributions at different percentiles (e, f).
When the Dhaka-trained ML model is applied over Xuzhou, the predicted BCTOA forcing remains strongly correlated with SBDART estimates (R=0.96, p<0.05), but exhibits reduced variability (predicted standard deviation = 8.7 W m−2 versus 9.2 W m−2), indicating incomplete capture of Xuzhou's TOA extremes. This is accompanied by a systematic negative bias (MBE = −0.46 W m−2, 95 % CI = −0.47 to −0.44), corresponding to an overestimation of cooling and an elevated RMSE (2.5 W m−2), approximately 24 % higher than that of the local Xuzhou ML model (RMSE = 1.9 W m−2). The associated percentage error (14 %) and residual standard deviation (2.5 W m−2 after bias removal) indicate the performance degradation arises from both reduced variance representation and systematic bias. These differences may primarily be linked to shifts in the distributions of BCAOD550, Nc and mixing-state, particularly exerting stronger modulation of BCTOA under warming conditions. Conversely, employing the Xuzhou-trained ML model to Dhaka also retains high correlation (R=0.96, p<0.05) but underestimates TOA variability (predicted standard deviation = 7.3 W m−2 versus observed standard deviation = 7.7 W m−2) and systematically over-predicts warming in Dhaka (MBE = +0.82 W m−2, 95 % CI = 0.81 to 0.83). These inconsistencies likely stem due to the differences in BC microphysical regimes between the two regions, including variations in BC core size distributions and coating evolution, which are not fully captured when models are transferred across regions. Despite these discrepancies, ML* models outperform local linear models, and performed comparably against the local MLR models. Over Xuzhou, Dhaka-trained model achieves a higher capability to capture variance (R2=0.92) compared with local linear (R2=0.85) and local MLR, with a 30 % lower percentage error than linear (14.0 % versus 20.4 %). Similarly in Dhaka, the Xuzhou-trained ML (R2=0.91) surpasses local linear (R2=0.88) and is similar to local MLR (R2=0.92). The combined ML model, exhibits improved generalization across both regions with minimal loss of regional accuracy. In Xuzhou, the combined model attains an Adj. R2=0.96 (RMSE = 1.90 W m−2, MAE = 1.4 W m−2), closely matching the local ML model (R2=0.97, RMSE = 1.70 W m−2 and MAE = 1.2 W m−2) while significantly outperforming local linear (RMSE = 3.6 W m−2 and MAE = 2.7 W m−2) and local MLR (RMSE = 2.5 W m−2, MAE = 1.8 W m−2). Similarly, in Dhaka, the combined model achieves R2=0.96 (RMSE = 1.6 W m−2, MAE = 1.2 W m−2), nearly equaling local ML (R2=0.96, RMSE = 1.5 W m−2) and surpassing local linear (R2=0.88, RMSE = 2.6 W m−2) and local MLR (R2=0.92, RMSE = 2.2 W m−2). Although the combined model does not consistently outperform region-specific ML surrogates, it substantially reduces biases associated with cross-regional transfer.
3.5 Spatial climatological evaluation and robustness of the ML model
Swath-by-swath pixel comparisons between the cross-regional (ML*) and combined (ML) models provide insight into short-term, local-scale predictability of BC radiative effects, but do not directly characterize the models' ability to reproduce long-term spatial structure and climatological variability. To assess regional long-term average and spatial generalization, we therefore compare the 0.05° weighted BC TOA forcing climatology simulated by ML* and ML against SBDART benchmarks. This spatial analysis serves two complementary purposes: (i) to assess the fidelity with which each surrogate reproduces long-term spatial patterns and climatological variability of BC TOA forcing (Fig. 7), and (ii) to examine whether the improved cross-regional adaptability of the ML model translates into spatial performance relative to region-specific ML surrogates (Fig. 8).
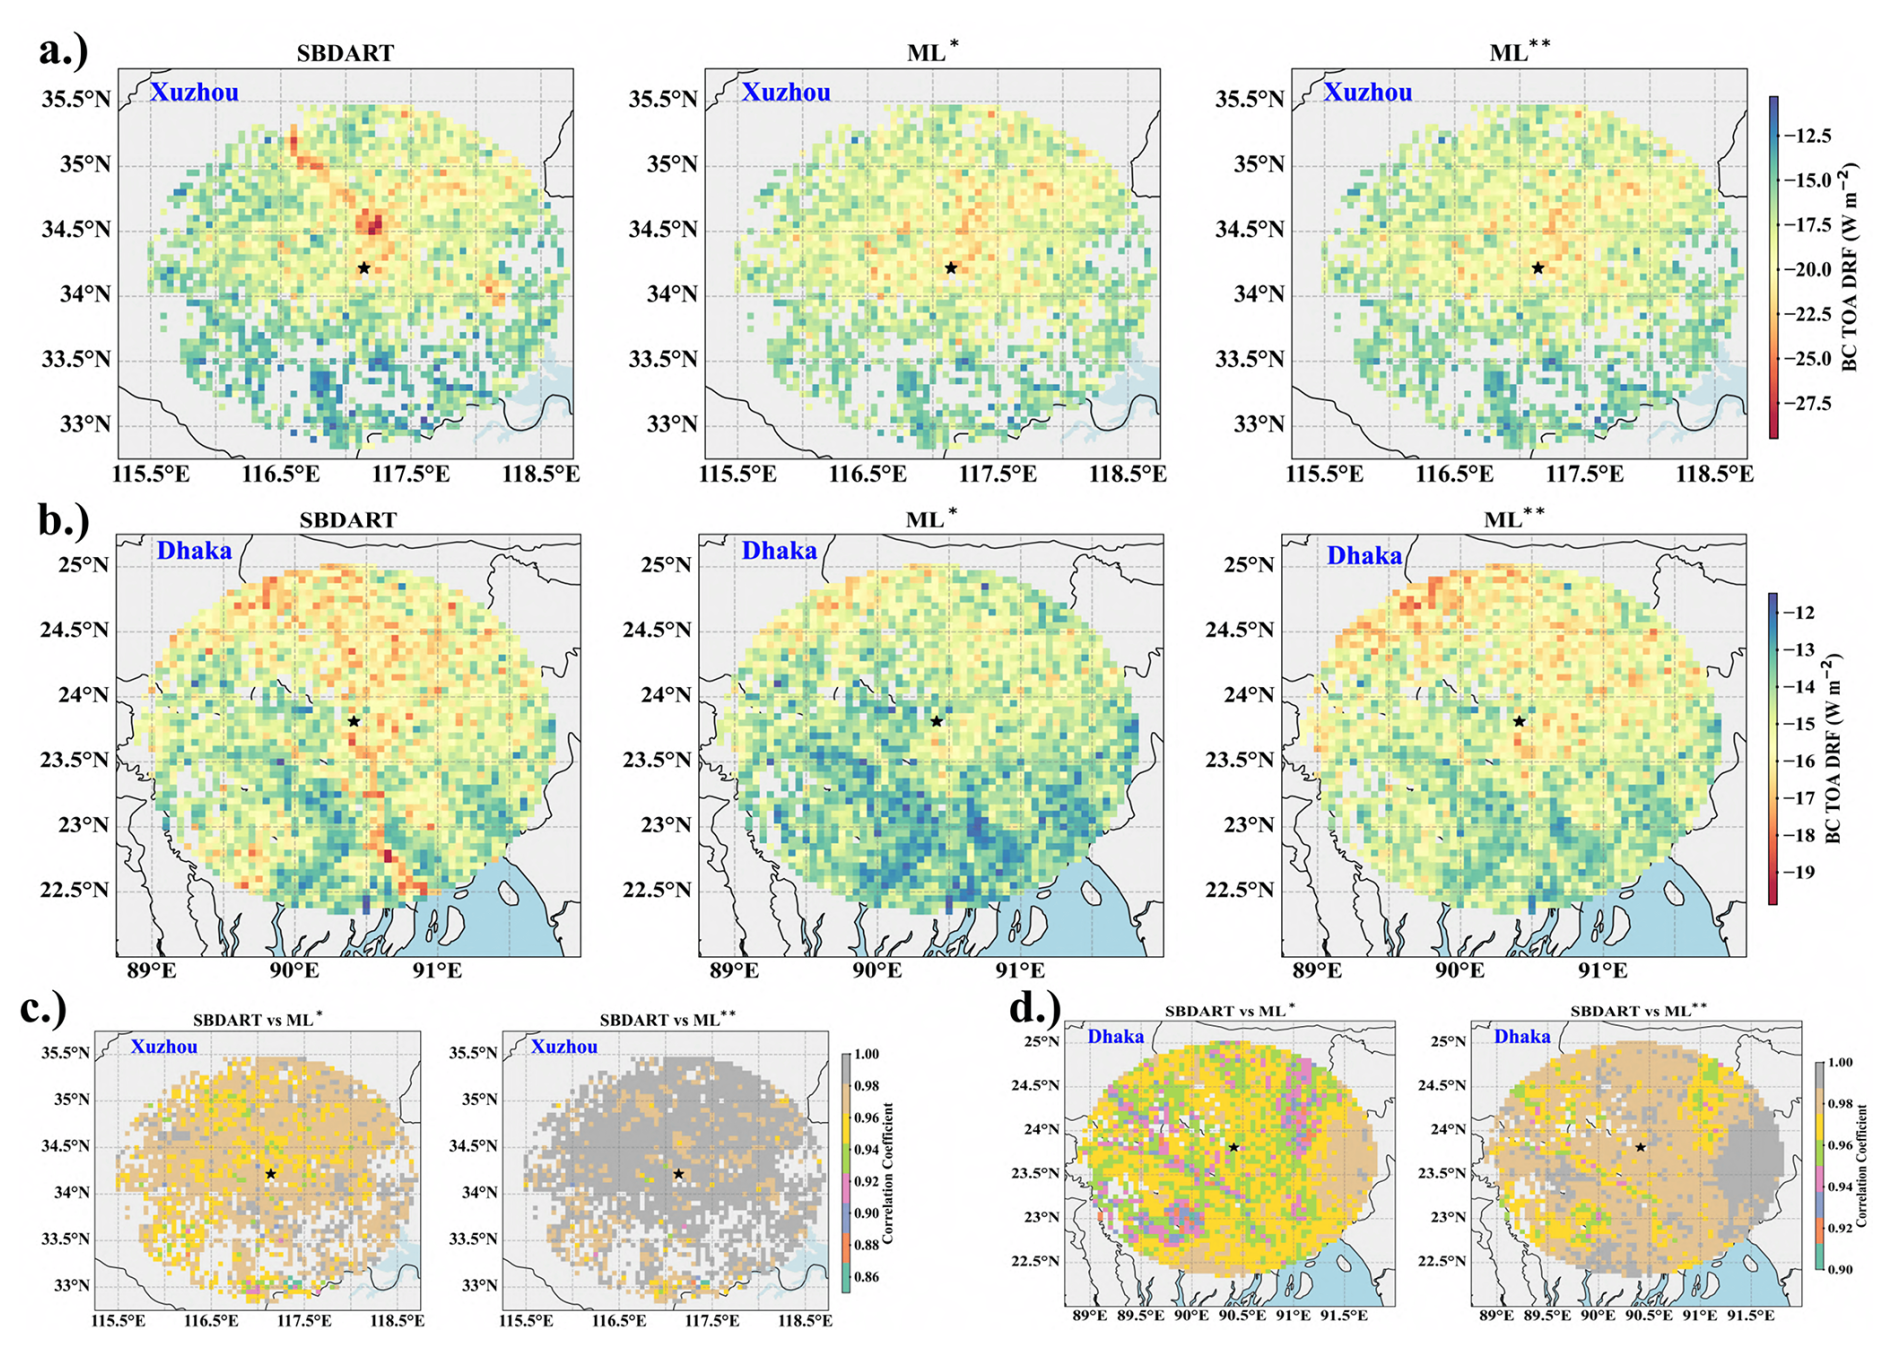
Figure 7Spatial Evaluation of BCTOA DRF Simulations: Comparison of SBDART, Cross-Regional (ML*), and Combined Data (ML) surrogate ML models Over Xuzhou and Dhaka. Panels (a) and (b) show weighted climatology maps of BCTOA DRF simulated by SBDART (reference model), cross-regional (ML*) model, and combined (ML) model over Xuzhou (a) and Dhaka (b) computed over valid days between April 2018–April 2022. Panels (c) and (d) present grid-by-grid correlation coefficients between SBDART and ML* and ML for Xuzhou (c) and Dhaka (d). Color bars indicate TOA DRF values (W m−2) and correlation coefficients. Stars mark key observational sites (SONET/AERONET stations) over Xuzhou and Dhaka respectively.
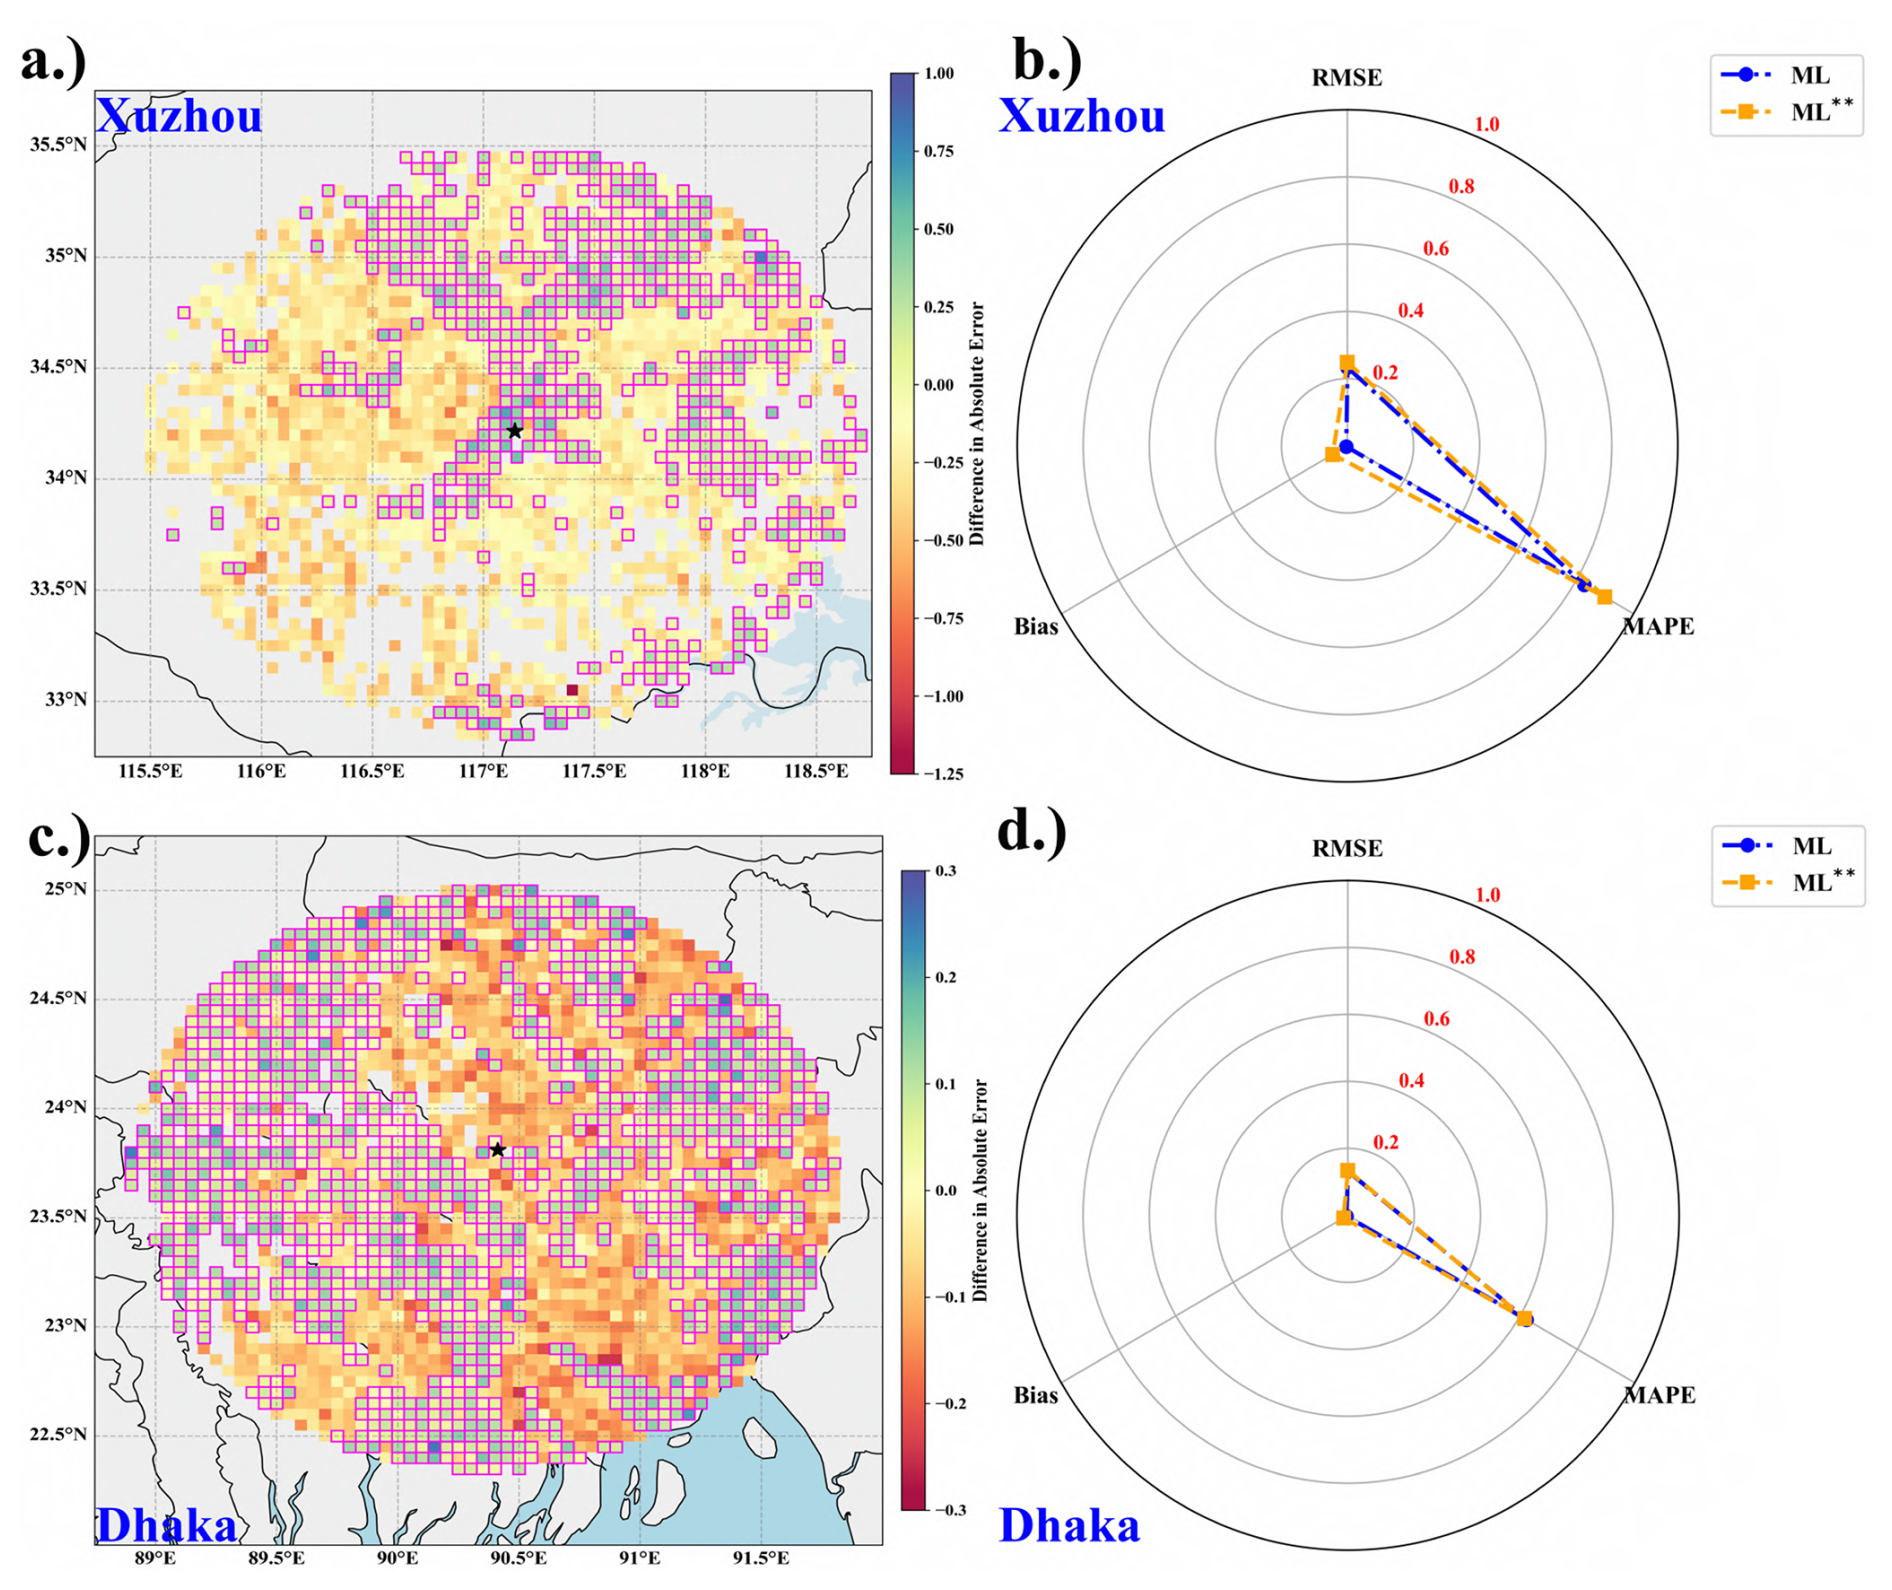
Figure 8Spatial comparison of combined and region-specific ML performance. Panels (a) and (c) show maps of the difference in absolute error () over Xuzhou and Dhaka, respectively. Positive values indicate grid cells where the combined ML (ML) yields lower absolute error than the region-specific ML model, while negative values indicate underperformance. Magenta-outlined grid cells mark locations where ML achieves strictly lower absolute error. Panels (b) and (d) present radar plots comparing domain-aggregated performance metrics (RMSE, MAPE, and bias) for ML and ML over Xuzhou and Dhaka, respectively. Metrics are normalized using min-max scaling, where 0 denotes the best observed performance and 1 the worst. Stars indicate SONET/AERONET sites.
Over Xuzhou (Fig. 7a), both ML models capture the general spatial distribution of BC forcing, including the broad patterns of cooling (negative forcing) over central and northern regions and warming (positive forcing) in the south. The overall mean BC TOA DRF simulated by SBDART across the domain was W m−2, with ML* showing a mean of W m−2 and ML at W m−2. Despite this consistency in weighted climatological mean, localized discrepancies emerge in regions characterized by strong spatial gradients. Specifially, SBDART simulates an intense, spatially confined cooling feature north-northwest of the Xuzhou_CUMT station, which both ML* and ML reproduce only in a spatially diffused form, underestimating its magnitude and sharpness. This smoothing likely reflects a combination of spatial averaging, regularization, and error propagation inherent to ML surrogates, which preferentially preserve coherent regional patterns while attenuating localized extremes. Over Dhaka (Fig. 7b) differences between ML* and ML become more pronounced. SBDART simulates a weighted climatological BCTOA mean of W m−2 closely matched by ML ( W m−2), whereas ML* exhibits a weaker cooling ( W m−2). In terms of spatial coherence, ML demonstrates superior agreement with SBDART, particularly north of the Dhaka_University AERONET station, where SBDART resolves localized cooling pockets with sharp gradients. ML preserves both the spatial extent and intensity of these features, while ML* underestimates their magnitude. Similarly, south of the station, SBDART indicates relatively warmer BCTOA forcing, which ML reproduces with high fidelity, whereas ML* overestimates warming in these regions.
A shared limitation of both ML models is evident in their inability to fully reproduce a pronounced cooling pocket centered near 90.5–91° E and 22.5–23° N. This feature, prominent in SBDART simulations, is absent in ML* and only feebly represented in ML, suggesting that region-specific non-linear relationships between predictors and TOA forcing are not fully captured by cross-regional or combined training alone. Such discrepancies are consistent with a well-recognized trade-off in ML applications to atmospheric and environmental sciences; wherein spatial regularization improves overall coherence and reduces random noise but can smooth localized extremes and hotspots (Colin et al., 2018; Rasp et al., 2018; Reichstein et al., 2019; Soriano and Maxwell, 2023). Grid-by-grid spatial correlations further demonstrate that ML consistently outperforms ML* across the majority of the domain in both regions (Fig. 7c and d), achieving statistically significant correlations (p<0.05) for more than 90 % of grid cells.
Having established that ML outperforms the cross-regional ML* in reproducing climatological spatial structure, we next evaluate its robustness relative to fully trained, region-specific ML models (Fig. 8). This comparison assesses whether the combined model can generalize across diverse BC microphysical and emission regimes without sacrificing local predictive skill.
In Xuzhou (Fig. 8a), despite complex aerosol environments characterized by high BC column number density, more internally mixed particles, and varying BC core-to-total mass ratios, ML achieves lower absolute error than the local ML model in approximately 32 % of grid cells. These improvements are most evident over grids influenced by large industrial sources, where spatial variability in scattering enhancement and coating evolution is pronounced. While ML underperforms the local ML model in other parts of the domain, its overall accuracy remains robust (RMSE ∼ 1.1 W m−2; MAPE∼ 4.5 %). Over Dhaka (Fig. 8c), ML outperforms the local ML model over a larger fraction of the domain, achieving lower absolute error in 53.5 % of valid grid cells. Spatially aggregated metrics indicate comparable performance between ML and ML, with low bias and RMSE (∼0.6 W m−2) and similar MAPE (∼2.8 %), demonstrating that the combined model retains strong predictive capability in a region dominated by distinct BC microphysical regimes.
This grid-level behaviour is further reflected in the domain-aggregated performance metrics (Fig. 8b and d). Over both domain RMSE, MAPE, and bias show that the ML performs comparably to the region-specific ML model in both Xuzhou and Dhaka, with no systematic degradation in any metric. In Xuzhou, ML exhibits slightly higher bias than the local ML model, consistent with its underperformance in portions of the domain, while near similar RMSE and MAPE. In Dhaka, the two models show nearly identical normalized metrics, confirming that the ML retains robust predictive skill while improving performance over a larger fraction of grid cells.
Overall, these results indicate that combined training enables ML to capture substantial spatial variability and retain predictive skill across regions with contrasting BC microphysical-optical characteristics. While the combined model does not uniformly outperform region-specific surrogates, it achieves comparable or superior performance over substantial portions of both domains, supporting its utility as a unified framework for transferable BC radiative forcing estimation. At the same time, the results underscore an inherent trade-off between generalization and regional specificity; blending heterogeneous distributions improves robustness to domain shifts but may partially dilute localized interactions that are optimally captured by region-specific models.
3.6 Diagnosing transferability limits: zero-shot evaluation on complex urban and biomass burning regions and improving ML
While the preceding analysis demonstrates ML robust performance across Xuzhou and Dhaka, the question of transferability to regimes with stronger biomass burning influence remains unanswered. To address this, ML was in a zero-shot manner (i.e., without any retraining or fine-tuning) on two additional regions with contrasting dominant aerosol types. Delhi, India during the post-monsoon crop residue burning period (October–November 2024), representing an urban-biomass burning mixed regime and Mongu, Zambia during the peak dry season (July–October 2024), a remote AERONET site representative of intense savanna fire emissions.
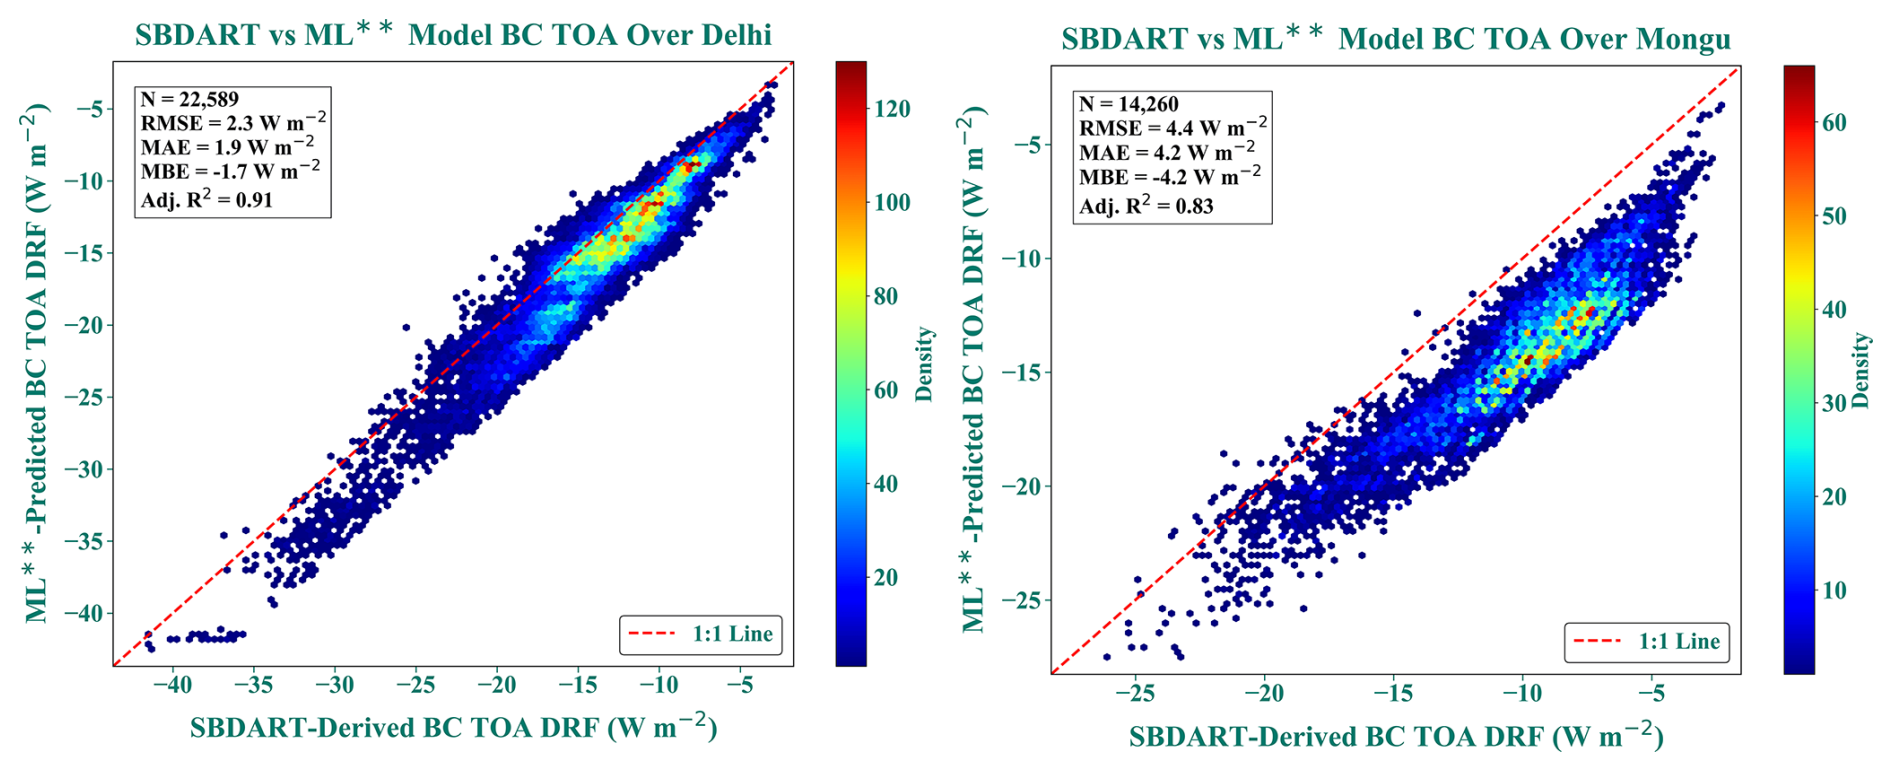
Figure 9Zero-shot transferability evaluation of the combined ML model (trained exclusively on Xuzhou and Dhaka data) over two contrasting biomass burning-influenced regions.
Figure 9 presents the zero-shot evaluation results. ML transfers well to Delhi (Adj. R2=0.91, RMSE = 2.3 W m−2, MAE = 1.9 W m−2, MBE = −1.7 W m−2), demonstrating effective generalization to a heavily polluted urban-influenced environment during a period when the aerosol loading is significantly influenced by surrounding agricultural burning. Performance at Mongu, however, degrades substantially (Adj. R2=0.83, RMSE = 4.4 W m−2, MAE = 4.2 W m−2, MBE = −4.2 W m−2), with a systematic underprediction bias more than twice that observed at Delhi. The Adj. R2 of 0.83 indicates that ML correctly tracks the relative variability in BC TOA DRF. However, the MBE of −4.2 W m−2 reveals systematic underprediction bias.
To diagnose the cause of this degradation, feature-space overlap analysis was conducted comparing the distribution of key predictors between the training dataset (Xuzhou and Dhaka combined) and each test region. For Delhi, all predictors showed >97 % overlap with training ranges, with Cohen's d values < 0.30 and strong IQR overlap, confirming distributional compatibility. For Mongu, the overlap analysis reveals a systematic, multi-predictor distributional mismatch across the key predictors. Shell thickness shows the most severe divergence (60.7 % overlap, Cohen's ), followed by number concentration (80.8 % overlap, Cohen's ), BC core size (84.2 % overlap, Cohen's ), and total mass (88.3 % overlap, zero IQR overlap). The high Mc overlap is driven solely by distributional tails; the zero IQR overlap reveals that the bulk of Mongu's aerosol mass occupies a range completely disjoint from the training data's central tendency. The mixing state predictor shows a subtler but equally important diagnostic, despite 99.2 % overlap, Cohen's indicates a large systematic shift. This apparent contradiction is attributable to the fact that the same mixing state ratio can arise from different microphysical configurations. In Mongu, the higher mixing state reflects a small BC core (∼103 nm) with a thin coating (∼203 nm). In the training data, a similar ratio corresponds to a larger core (∼120 nm) with a proportionally thicker coating (∼480 nm). The ratio overlaps numerically, but the underlying particle architecture, and thus the radiative behaviour is physically distinct.
These microphysical distinctions are not merely statistical artefacts; they reflect genuinely different aerosol regimes that can be independently validated against in-situ observations. The COSMO-retrieved BC core median size for Mongu (∼103 nm) is smaller than the training dataset median used in ML (Xuzhou+Dhaka). This is consistent with savanna fire BC particles that have undergone limited coagulation and growth compared to relatively more aged urban BC characteristic of Xuzhou and Dhaka. In-situ SP2 measurements of African biomass burning smoke consistently report BC core count median diameters in the range of ∼100–200 nm, with values varying by transport age and fire type (Wu et al., 2021). The Mongu retrieval falls squarely in the middle of this range, as expected for a regional receptor site dominated by fresh to moderately aged savanna smoke. Similar physical consistency extends to the coating thickness. The thinner coatings retrieved at Mongu align with SP2-based measurements of West African savanna fire plumes reporting BC coating thicknesses change by ∼13–50 nm over the first 12 h of transport (Wu et al., 2021), reflecting limited secondary processing in remote savanna environments compared to urban BC. The lifecycle of biomass burning aerosol coatings further supports this, with rapid initial growth followed by slower accumulation or net loss with continued ageing (Sedlacek et al., 2022), keeping coatings thinner relative to urban pollution. The elevated column number concentration and low total aerosol mass retrieved at Mongu are equally physically consistent. Dense particle number concentrations are characteristic of optically thick southern African savanna smoke (Holanda et al., 2020; Wu et al., 2020), while the low total aerosol mass reflects the sulfate-poor nature of savanna fire BC, where sulfate mass fractions remain minimal in the absence of industrial sulfur emissions. Study by Wang et al. (2025) has shown that this area has a very high amount of NOx emitted during this time, which would provide a way through co-emitted NOx to rapidly form nitrate aerosols, which are optically identical to sulfate, and hence could fill the gap between the thinner shell sizes observed using COSMO and the even thinner shell sizes from the above observational studies.This indicates that the COSMO retrieved properties represent a realistic biomass burning regime rather than retrieval artifacts. Consequently, the feature-space divergence from the training distribution reflects a genuine aerosol type underrepresented in ML training, providing a physical explanation for the systematic underprediction at this site.
To improve transferability to biomass burning regimes, we retrained the model on an expanded dataset including all four regions - Xuzhou, Dhaka, Delhi, and Mongu using a region-stratified 70/30 split. The test set (30 % from each region, 124 691 samples total) was held out entirely during training to ensure rigorous evaluation on unseen data. Internal validation (80/20 split of training data) showed minimal train-validation gaps (R2 difference < 0.005, RMSE difference < 0.05 W m−2), confirming no overfitting. This improved combined model is denoted by ML, when applied over the unseen held-out test datasets achieved strong and consistent performance across all four regions (Fig. S7). For the urban sites, Xuzhou (N=31 670) yielded Adj. R2=0.95, RMSE = 2.0 W m−2, and MBE = −0.2 W m−2; Dhaka (N=81 967) yielded Adj. R2=0.95, RMSE = 1.7 W m−2, and MBE = +0.2 W m−2. For the biomass burning-influenced site, Delhi (N=6776) achieved Adj. R2=0.94, RMSE = 1.6 W m−2, and MBE = −1.1 W m−2; Mongu (N=4278) achieved Adj. R2=0.89, RMSE = 1.4 W m−2, and MBE = −0.8 W m−2. The near-identical performance between urban sites and the modestly lower but still robust performance at Mongu demonstrate that ML performs effectively across diverse aerosol regimes without degrading urban accuracy.
Finally, the ML was applied to the full datasets across all four regions and the performance against the ML model was compared (Table 2). This analysis aids in assessing whether adding biomass burning predictor regimes improve performance at Mongu and Delhi, while simultaneously preserve accuracy at Xuzhou and Dhaka.
Table 2Performance comparison between the ML surrogates combined model ML and the revised four-region combined ML model (ML) for predicting COSMO-RTM BC TOA DRF.
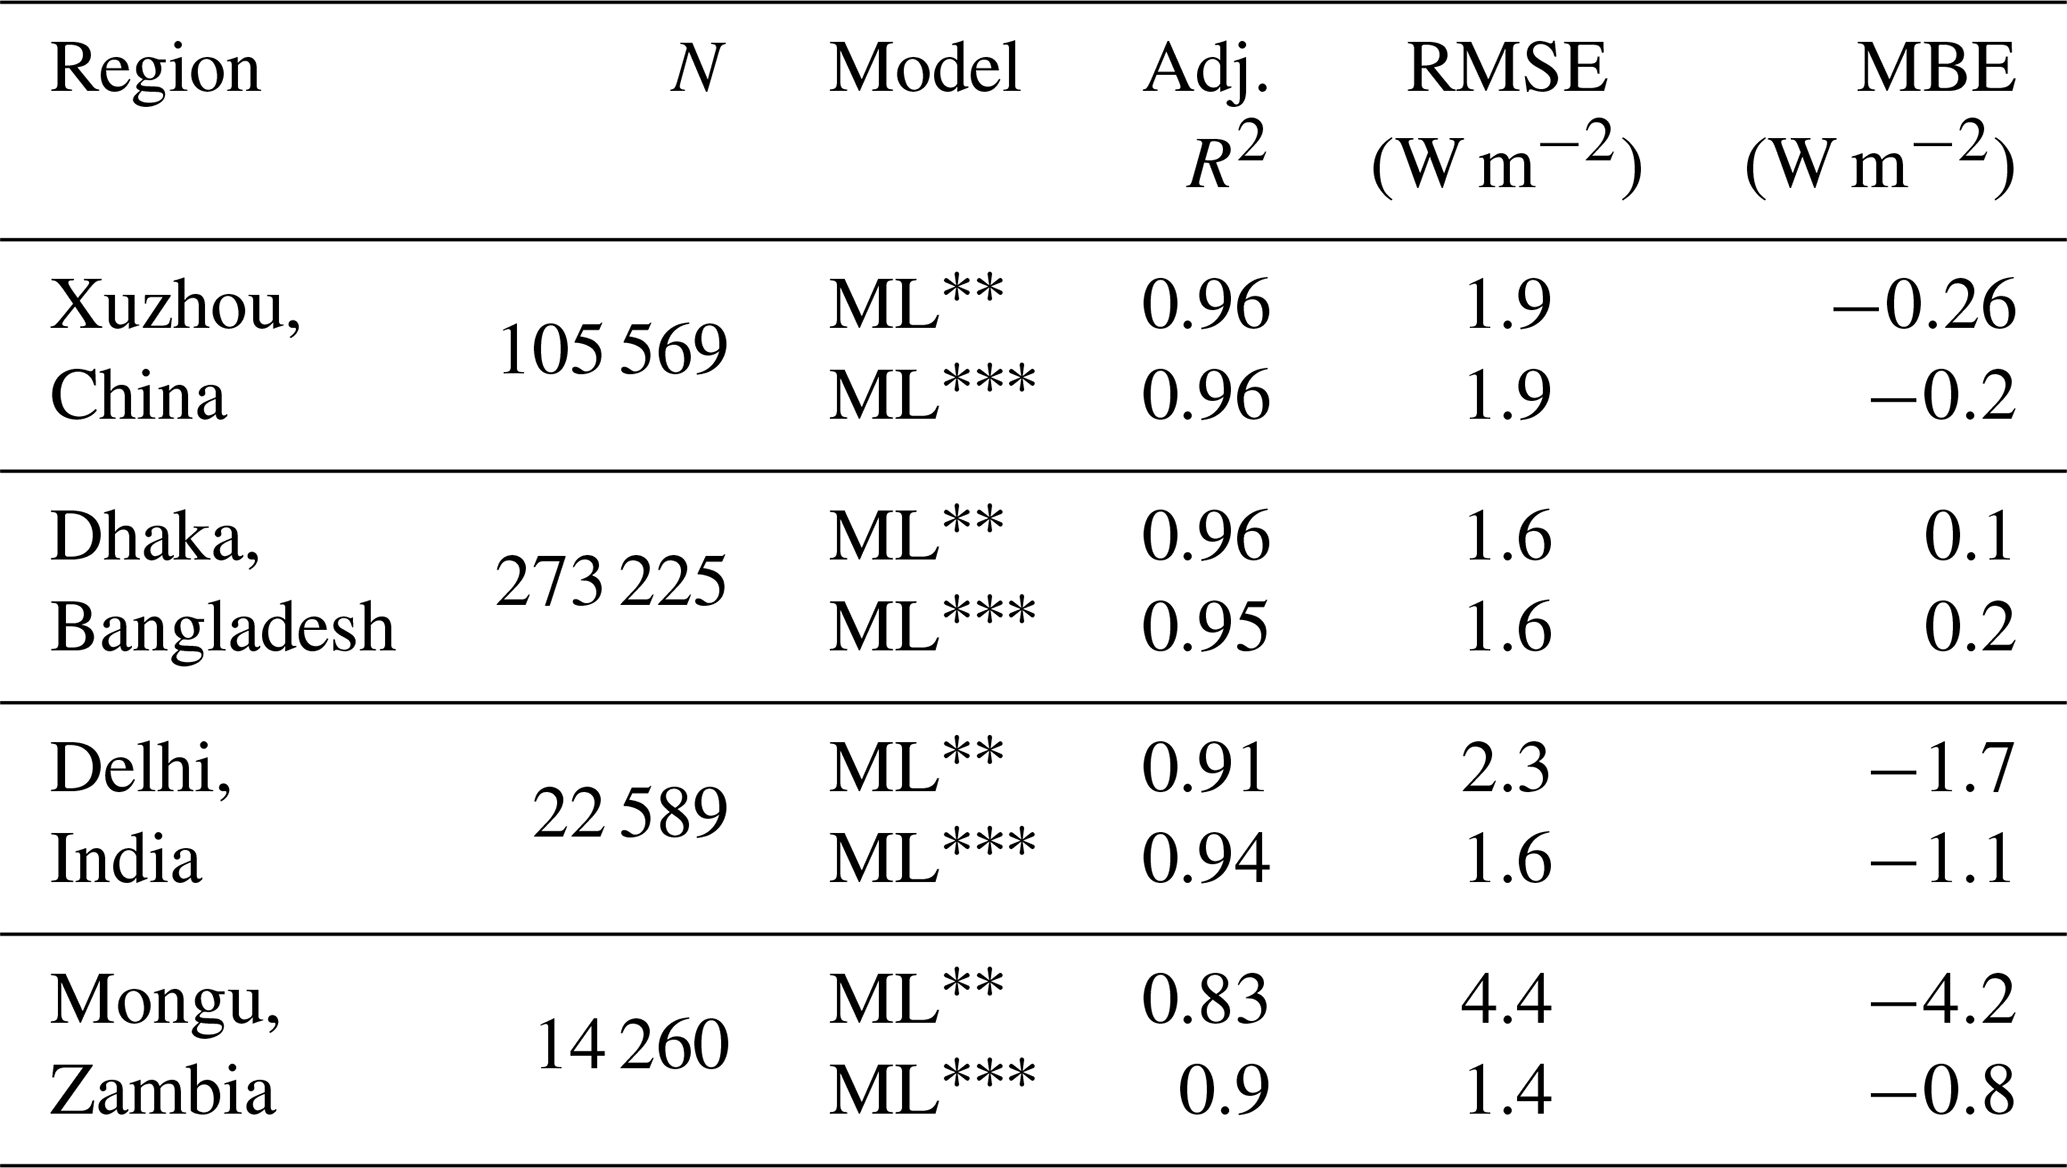
The results show that, urban performance remains virtually unchanged; Xuzhou and Dhaka show negligible differences, confirming that incorporating extreme biomass burning cases from Mongu and mixed urban-biomass burning cases from Delhi does not compromise the model's ability to capture urban BC–radiation interactions. ML substantially improves performance at the biomass burning-influenced sites. For Delhi, RMSE improves by 30 % and bias reduces by 35 %. For Mongu, RMSE decreases by 68 % and bias improves from −4.2 to −0.8 W m−2. Consistent performance across region by ML demonstrates that the revised combined model transfers effectively across diverse aerosol regimes, from polluted urban environments with signatures of biomass burning (Xuzhou, Delhi, Dhaka) to remote savanna fire (Mongu) environments.
This study advances the COSMO framework by refining the characterization of BC microphysical and columnar properties derived in Tiwari et al. (2025) and integrating them into a large ensemble of physically consistent radiative transfer simulations. By coupling observation-constrained microphysics with more than 400 000 RTM runs, we generate high-resolution estimates of BC DRF that resolve both spatial and temporal variability beyond what is achievable with conventional mass-based approaches.
A central scientific finding is the emergence of grid-scale BC TOA DRF that spans both positive and negative values within the same regional domains. While positive BC TOA is widely reported, the occurrence of negative BC TOA highlights the importance of resolving microphysical and column-dependent absorption-scattering competition, which is inadequately represented in many current climate-model parameterization. This demonstrates that BC radiative effects are not monotonic with loading and that realistic aerosol–radiation interactions require explicit treatment of particle size, mixing state, and column abundance. The contrast between Xuzhou and Dhaka provides a compelling illustration of this complexity. Similar BCAOD550 magnitudes mask fundamentally different absorption-scattering dynamics driven by differences in BC microphysics and column abundance, leading to divergent radiative outcomes and regional climate implications. These results underscore the limitations of mass-based or bulk optical approaches, including methods that infer PM2.5 or radiative effects from AOD alone (Chen et al., 2020; Kang et al., 2025; Ma et al., 2022; Wei et al., 2023), which inherently overlook the microphysical processes influencing the BC absorption efficiency and mass absorption cross-section variability.
ML surrogates trained on the RTM ensemble outperforms linear and parametric approaches across a wide range of pollution and microphysical regimes. Despite modest bias-variance trade-offs in transitional BC TOA regimes, the ML framework retains robust predictive ability. SHAP analysis of the trained surrogate further indicates that model learns parameterization in which the predicted BC TOA DRF depends strongly on non-linear interactions among BCAOD550, mixing state, and Nc, with no universal threshold separating cooling and warming regimes in the learned mapping. Instead, a transitional regime emerges in which scattering increases more rapidly than absorption at high aerosol loading, with region-dependent moderation and overall expression. In industrial Xuzhou, enhanced scattering dominates at high loadings consistent with rapid aging and internal mixing with co-emitted species including sulfate and nitrate, qualitatively illustrated by the pronounced directional haze contrast in Fig. S8. In contrast, in biomass-burning-dominated Dhaka, absorption remains comparatively strong consistent with larger, less-coated BC cores, consistent with observations from other combustion-intensive regions (Guan et al., 2026). These findings demonstrate that no universal parameterization of BC forcing is currently feasible and that BC climate impacts are inseparable from source-specific microphysics and local environmental conditions.
Transferability tests over Delhi and Mongu show that ML surrogate performance depends strongly on how well the target aerosol microphysical and optical regimes are represented within the training feature space. The original Xuzhou-Dhaka-trained combined model (ML) reproduced Delhi reasonably well, indicating that geographically distinct regions can still be predictable when their BC microphysical and optical predictors remain within the learned domain. In contrast, the systematic underprediction over Mongu reflected a distinct savanna-fire regime characterized by smaller BC cores and thinner coatings outside of the main ranges of the training dataset, as well as higher column number abundance near the top of the range of the training dataset, and shifted predictor distributions relative to the ML training data. Incorporating Delhi and Mongu into the revised four-region model (ML) substantially reduced this bias, particularly over Mongu, while preserving performance over Xuzhou and Dhaka, and slightly improving performance of Delhi. These results indicate that transferability is not universal, but is diagnosable and can be improved by expanding the RTM training ensemble to include underrepresented aerosol regimes. Therefore, surrogate deployment should be preceded by a quantitative feature-space compatibility test. Simple inclusion within the training min-max range is not sufficient, because distributional tails can mask systematic shifts in the central predictor space. Instead, target-region predictors should be compared with the training domain using complementary diagnostics: (i) the fraction of samples within the training 2nd–98th percentile range, (ii) Cohen's d effect size to identify systematic distributional displacement, and (iii) interquartile-range overlap to determine whether the bulk of the target distribution lies within the learned regime. This also demonstrates that the traditional approach of prescribing fixed optical and microphysical properties for urban and biomass burning aerosol types – which global models currently heavily rely upon (Brown et al., 2021; Chen et al., 2023; Das et al., 2024) is likely incompatible with the diversity of microphysical properties revealed within each type by observationally constrained retrievals.
While this framework captures key microphysical controls on BC TOA, several assumptions define its present scope. The use of a core-shell representation with a non-absorbing sulfate proxy reflects a deliberate optical constraint. Although urban aerosols arise from diverse emission sources, extensive field evidence across urban, industrial, and biomass-burning regions in East and South Asia indicates that BC is frequently internally mixed and coated by optically similar inorganic and organic material (Kompalli et al., 2021; Peng et al., 2016; Sun et al., 2024; Zamora et al., 2019), supporting the physical relevance of this assumption. However, particles with irregular shapes, including fractal aggregates, agglomerated structures, are known to occur prominently in freshly emitted BC, are not explicitly addressed in this study. Future extensions could reconcile this limitation through hybrid frameworks that couple fractal or irregular morphologies at emission with spherical coated particles at advanced aging stages. Next, the treatment of organic aerosols follows an optical rather than chemical constraint, with purely scattering organic carbon treated similarly to nitrate and sulfate, while the absorption associated with absorbing organic carbon (aOC) is not explicitly prescribed but is filtered through a strict multi-band SSA consistency requirement. As described in previous studies (Liu et al., 2024b, c), the multi-waveband optical consistency inherently favours particles exhibiting stable cross-band absorption characteristic of BC, while disfavouring wavelength-confined absorbers whose absorption is confined to shorter wavelengths, such as aOC (Flores et al., 2014; Forrister et al., 2015; Lambe et al., 2013; Park et al., 2010). Additional limitations arise from the conservative spatial representativity of merged AERONET-TROPOMI SSA constraints, where pixel exclusion prioritizes physical admissibility over spatial completeness; denser ground-based networks and expanded geostationary coverage offer a pathway to relax these constraints. Furthermore, vertical variability of BC remains unresolved, reflecting both methodological choices and the maturity of current observing systems. A companion CALIPSO-constrained sensitivity analysis over Xuzhou and Dhaka showed that the dominant aerosol layers are largely boundary-layer confined, and that redistributing high-BCAOD, low-SSA cases into CALIPSO-derived elevated layers produced only modest BC TOA DRF changes, with median relative differences below 1 % and 95th-percentile differences below approximately 2 % (Tiwari et al., 2026a). This suggests that the baseline vertical-profile assumption is unlikely to dominate the BC TOA DRF uncertainty over these two regions, although the retrieval remains column-integrated and does not resolve the true vertical profile of BC extinction. Emerging multispectral GRASP-based TROPOMI products (Chen et al., 2024; Litvinov et al., 2024), together with new global BC microphysical datasets (Liu et al., 2026), provide a direct route to extend this framework without substantially altering its core physical foundations.
Finally, this study computes clear-sky BCDRF at the TOA, surface, and within the atmosphere. However, the analysis presented here emphasizes BC TOA, because it represents the net clear-sky TOA perturbation associated with the observation-constrained BC-containing aerosol state. As the primary contributor to the instantaneous radiative energy imbalance caused by BC, BC TOA provides an unambiguous metric for assessing BC-specific climate forcing and feedbacks under clear-sky conditions. Follow-up work will extend this framework to jointly analyse the spatio-temporal variability of TOA, surface, and net atmospheric BC DRF components and provide a more complete assessment of BC radiative impacts over these contrasting urban regions.
Mie model
Mie theory provides a classical solution to Maxwell's equations describing the scattering of electromagnetic waves by homogeneous spherical particles, widely used to model aerosol scattering properties (Bohren and Huffman, 1998; Mie, 1908) such as extinction efficiency (Qext), scattering efficiency (Qscat), single scattering albedo (SSA), and asymmetry factor (g). The Mie model used in Tiwari et al. (2023, 2025) characterizes BC aerosol particles as coated spheres, consisting of a black carbon (BC) core with sizes ranging from 50 to 500 nm and (Schuster, 2005), coated by a non-absorbing sulfate (Sul) shell sized between 10 and 800 nm and (Aouizerats et al., 2010). This core-shell configuration allows us to analyze scattering properties at the single-particle level while varying particle size and mixing state, constrained qualitatively by multi-waveband observational data and their uncertainties.
While the Mie model's assumption of spherical, core-shell particles does not capture the full complexity of aerosol morphology – such as agglomerated or irregularly shaped particles – numerous studies have demonstrated that this approach remains representative for BC aerosols in regions dominated by urban, industrial, and biomass burning sources, particularly across South Asia and China (Kompalli et al., 2021; Liu et al., 2020b; Peng et al., 2016; Wang et al., 2021; Zamora et al., 2019). The core-shell assumption simplifies the optical modeling while effectively capturing key interactions between incident radiation and particle morphology relevant to these environments.
Tiwari et al. (2025) derived size, mixing state, column mass and number density over Xuzhou, China and Dhaka, Bangladesh using this morphological setup adopting sulfate as a proxy for the non-absorbing shell material due to its optical similarity to other common scattering aerosol coatings such as nitrate and ammonium. Literature shows that differences in extinction efficiency and SSA among these species are minimal, typically within 2 %, and further reduced when mixed with aerosol water (Dai et al., 2024). Another study demonstrated that ammonium sulfate's refractive index remains nearly constant under varying humidity, with negligible absorption changes (Erlick et al., 2011). Thus, categorizing sulfate, nitrate, ammonium, and similar species collectively as scattering aerosols is justified, based on their low absorption characteristics, supporting the use of sulfate as an effective scattering shell proxy in the used core-shell model. Furthermore, the exclusion of secondary organic aerosol (SOA) particularly absorbing organic carbon (aOC) from analysis is grounded within the methodological screening. Our approach emphasizes identifying core-shell size combinations that exhibit absorption consistent with all observations made across the UV, VIS, and NIR bands in tandem, a trait commonly associated with aerosols like black carbon (Bond and Bergstrom, 2006; Samset et al., 2018a). SOA and aOC exhibit strong UV absorption but diminishing visible and near-infrared absorption, leading to instability in SSA across wavebands and failure to meet the filtering criteria derived from observations. Furthermore, aOC undergoes rapid photochemical bleaching and mass absorption cross-section reduction within hours to a single diurnal cycle after emission, transitioning from absorbing to primarily scattering behavior (Forrister et al., 2015; Lambe et al., 2013; McMeeking et al., 2011; Park et al., 2010; Saleh et al., 2013). Sensitivity tests incorporating aOC within the shell layer of BC cores was conducted by Liu et al. (2024b), revealing lower aerosol absorption retrievals and reduces the number of valid pixels raising question on the physical realism of aOC absorption in aged aerosols, particularly in urban environments where chemical aging accelerates. Consequently, our model prioritizes particles with, cross-band absorption characteristics consistent with BC and sulfate, effectively excluding SOA from the core-shell assumption. This method prioritizes consistency with BC aerosol type and variable size and mixing state, potentially excluding some cases with similar loading but differing optical characteristics. Although conservative, this exclusion enhances the reliability of the inverted results ascertaining the pixel for BC. Future expansion of observational networks and studies will be essential to refine the selection of optimal solutions from the probabilistic solution developed using this approach, improving the accuracy of BC concentration monitoring in varied urban settings and deepening insight into emissions amid dynamic urban-industrial changes.
B1 Satellite and reanalysis dataset processing for SBDART model simulation
B1.1 Multi-Angle Implementation of Atmospheric Correction (MAIAC) algorithm-based AOD
MODIS aerosol products, widely utilized for regional and global analyses (Tian et al., 2023; Wei et al., 2020), are derived primarily from three algorithms: Dark Target (DT), Deep Blue (DB), and MAIAC (Qin et al., 2021). The DT algorithm is limited by its limited ability to retrieve aerosol optical properties over bright surfaces such as urban areas, deserts, and the Gobi region. The DB algorithm, meanwhile, assumes that short-wave infrared bands, that exhibit minimal reflectance influence from vegetation (Hsu et al., 2013; Sayer et al., 2013), which can cause errors in aerosol optical depth (AOD) retrievals, especially under polluted conditions.
The MAIAC algorithm retrieves AOD over land by applying time series analysis to distinguish aerosol signals from surface reflectance, while explicitly accounting for the bidirectional reflectance distribution function (BRDF) of the terrain (Lyapustin et al., 2011). By integrating temporal and spatial image processing, MAIAC effectively corrects atmospheric effects, enabling reliable AOD retrievals even over bright surfaces and densely vegetated areas (Lyapustin et al., 2011, 2018). Compared to the DT and DB algorithms, MAIAC offers enhanced spatial coverage with a spatial resolution of 1 km × 1 km daily data. This study employs MCD19A2 AOD data at 470 and 550 nm wavelengths, accessed from the https://search.earthdata.nasa.gov/search/granules?p=C2324689816-LPCLOUD&pg[0][v]=f&pg[0][gsk]=-start_date&q=MCD19A2 (last access: 27 June 2026). To ensure data integrity, pixels were rigorously filtered following the MAIAC Collection 6.1 quality assurance protocols, including cloud masking, adjacency effect screening, and AOD quality flags. Only pixels flagged as “Clear”, “Normal Condition/Clear”, and “Best Quality with No glint” were retained for analysis. MAIAC AOD products have been extensively validated at both regional and global scales, including over South Asia, demonstrating superior accuracy compared to DT and DB algorithms (Mhawish et al., 2019). Global study has reported strong agreement with ground-based AERONET observations, with correlation coefficients exceeding 0.8 at over two-thirds of monitoring sites (Qin et al., 2021).
B1.2 Total column precipitable water vapor from MODIS (MYD05 and MOD05)
This study predominantly utilizes the MODIS PWV Level 2 product MYD05_L2, with MOD05_L2 data employed as a substitute when MYD05_L2 is unavailable. The MODIS PWV is derived from the ratio of three water vapor absorbing bands (0.905, 0.936, and 0.930 µm) to two atmospheric window bands (0.865 and 1.240 µm) (King et al., 1992). While both IR and NIR channels provide PWV information, this study opts for the NIR product due to its lower sensitivity to atmospheric temperature compared to atmospheric water vapor content (Bai et al., 2021; Zhou and Cheng, 2025). The NIR product offers a daily data at a spatial resolution of 1×1 km.
Given the sensitivity of MODIS PWV to cloud presence in the field of view (He and Liu, 2019), a series of rigorous quality assurance measures were implemented to retain only the most reliable pixels. The study explicitly checks for Cloud Mask QA flags, retaining only those pixels with “Cloud Mask Status Flag” marked as “determined” and “Cloudiness Flag” as “Confident clear”. Furthermore, each pixel undergoes scrutiny for product quality and retrieval processing flags. Only pixels with PWV (NIR) “Usefulness Flag” designated as “Useful” and “Confidence Flag” as “Good” or “Very Good confidence” are incorporated into the study. For a comprehensive understanding of the physical background of the retrieval method, the retrieval algorithm, adapted inversion technique, uncertainty estimates, and validation, readers are directed to the detailed study conducted by He and Liu (2019). Since the MOD05/MYD05_L2 data only has geolocation scientific data set for PWV(IR) at 5×5 km, this study separately downloaded MYD03_L2/MOD03_L2 1 km Geolocation data and collocated MYD05 and MYD03. Both MOD/MYD03_L2 and MOD/MYD05_L2 datasets utilized in this study are publicly accessible via the NASA's Level-1 and Atmosphere Archive & Distribution System Distributed Active Archive Center (LAADS DAAC) (URL: https://ladsweb.modaps.eosdis.nasa.gov/search/order/2/MYD03--0,MYD05_L2--0, last access: 27 June 2026).
B1.3 Surface spectral albedo from MODIS BRDF albedo model (MCD43A1)
In this study, we utilize the MCD43A1 dataset, which includes MODIS, Terra and Aqua BRDF/Albedo model parameters on a daily basis at a 500 m resolution, to compute the actual blue-sky albedo. This measured albedo is employed in the radiative transfer model as the surface albedo, replacing the predefined values used by the model.
The MODIS BRDF/albedo algorithm, based on the three-parameter Ross-Thick-Li-Sparse-Reciprocal model, estimates kernel parameters from clear-sky surface reflectance collected by Terra and Aqua MODIS sensors (Lucht et al., 2000; Román et al., 2010; Schaaf et al., 2002). These parameters include the isotropic parameter (fiso), the kernel for volume scattering (Kvol), and the kernel derived from surface scattering and geometric shadow theory (Kgeo). They are available for each MODIS spectral band and for three broad bands: 0.3–0.7, 0.7–5.0, and 0.3–5.0 µm. These parameters can be utilized in the forward model to reconstruct surface anisotropic effects, allowing for the correction of directional reflectance. From the MCD43A1.061 files, layers of BRDF Albedo Parameters for visible, near infrared and shortwave bands along with their respective albedo band mandatory quality flags are used. The weighting parameters described above are used to compute integrated directional hemispherical reflectance also known as Black-sky Albedo (albedo in the absence of a diffuse component and is a function of solar zenith angle) at local solar zenith angle, and bihemispherical reflectance or White-sky albedo (albedo measured without direct sunlight when the diffuse component is isotropic). Together, these two types of albedos represent the extremes of completely direct and completely diffuse illumination. Finally, the actual blue-sky albedo is derived as an interpolated value between these extremes (Jia et al., 2022), depending upon the fraction of diffuse skylight present. This fraction, itself a function of the solar optical depth (Giannaklis et al., 2023). For each short-wave, visible and near-infrared band, we compute the actual blue-sky albedo using the above method and finally spectral average of the blue-sky albedo is taken across these wavebands which serves as the input for radiative transfer model (RTM). This approach aligns with previous methods, where surface albedo values are averaged across the four operational AERONET wavebands. This spectral averaging has been demonstrated to provide a reliable approximation for estimating direct aerosol radiative forcing at the surface (García et al., 2012; Logothetis et al., 2021).
The fundamental equations for calculating black-sky and white-sky albedo using the BRDF kernels, as well as the global assessment/validation of these albedo products, have been extensively covered in earlier literature assuring the quality of the product (Che et al., 2017; Wang et al., 2015). NASA's Application for Extracting and Exploring Analysis Ready Samples (AppEEARS) platform, offers efficient tool for extracting the required layers of data for desired temporal and spatial range. The MCD43A1.061 data can be sourced from https://appeears.earthdatacloud.nasa.gov/task/area (last access: 27 June 2026).
B1.4 Total column ozone from Sentinel-5P TROPOMI (TROPOspheric monitoring instrument)
The total column ozone data used in this study were obtained from the Sentinel-5P TROPOMI (TROPOspheric Monitoring Instrument) S5P_L2__O3_TOT_HiR product, which provides data at a high spatial resolution of 5.5×3.5 km (Inness et al., 2019; Sullivan et al., 2022). This study uses dataset derived from offline and reprocessed products, which employs the GOME-type Direct FITting (GODFIT) algorithm. This advanced retrieval algorithm enhances the accuracy of total ozone measurements by directly fitting simulated radiances in the Huggins bands (325–335 nm) to observational data (Garane et al., 2019). The adjustment process involves varying key atmospheric parameters, including total ozone concentration, effective scene albedo, and effective temperature. To retain only the best pixel, for total column ozone, the study implements a pixel-by-pixel data quality assurance assuring that qa_value is greater than 0.5 following the recommendation of S5P Mission Performance Centre OFFL/RPRO Total ozone Readme Manual.
The S5P_L2__O3_TOT_HiR can be sourced from: https://disc.gsfc.nasa.gov/datasets/S5P_L2__O3_TOT_HiR_2/summary?keywords=Total column ozone (last access: 27 June 2026). This study used the spatio-temporal data subsetting tool provided by Goddard Earth Sciences Data and Information Services Centre (GES DISC) to source the data for desired spatio-temporal range. A comprehensive validation of this product, using both global ground-based and contemporary satellite observations, was conducted by Garane et al. (2019). In a more recent study, various factors – such as solar zenith angle, surface albedo, and measurement parameters like scan angle – and their impact on the uncertainty in TROPOMI's ozone profile retrievals were investigated (Keppens et al., 2024).
The level-2 raw satellite datasets for different products used in this study were downloaded from publicly accessible NASA data archives.
TROPOMAER SSA products are available from the NASA GES DISC (https://disc.gsfc.nasa.gov/datasets/TROPOMAER_1/summary?keywords=TROPOMAER, last access: 27 June 2026). MAIAC MCD19A2 AOD data can be downloaded from the NASA LAADS DAAC (NASA EARTHDATA SEARCH: https://search.earthdata.nasa.gov/search/granules?p=C2324689816-LPCLOUD&pg[0][v]=f&pg[0][gsk]=-start_date&q=MCD19A2, last access: 27 June 2026). MODIS geolocation datasets (MOD03_L2/MYD03_L2) and collocated water vapor products (MOD05_L2/MYD05_L2) are available through LAADS DAAC (https://ladsweb.modaps.eosdis.nasa.gov/search/order/2/MYD03--0,MYD05_L2--0, last access: 27 June 2026) Surface spectral albedo from the MODIS BRDF-Albedo model (MCD43A1.061) was obtained from NASA AppEEARS (https://appeears.earthdatacloud.nasa.gov/task/area, last access: 27 June 2026), and total column ozone data from the Sentinel-5P TROPOMI S5P_L2__O3_TOT_HiR product were accessed via NASA GES DISC (https://disc.gsfc.nasa.gov/datasets/S5P_L2__O3_TOT_HiR_2/summary?keywords=Total column ozone, last access: 27 June 2026). One can download these products for specified time ranges and spatial domains encompassing Xuzhou and Dhaka.
The radiative-transfer calculations employed the SBDART model sourced from Ricchiazzi et al. (1998). The COSMO model used the baseline Mie model (later author modified for SSA constraint) from Mätzler (2002).
All processed datasets and code supporting this study are archived in Figshare data repository link: https://doi.org/10.6084/m9.figshare.30006343 (Tiwari et al., 2026b). Due to their large size data have been compressed for storage. Each folder can be extracted individually which contains sequential steps, from using microphysical BC data from Tiwari et al. (2025), processing ancillary satellite inputs, example codes of Mie and radiative-transfer modules, as well as the surrogate machine-learning models.
The supplement related to this article is available online at https://doi.org/10.5194/acp-26-9149-2026-supplement.
PT conceptualized the study, curated the data, developed the methodological framework, performed the formal analysis and investigation, created the visualizations, and prepared the original manuscript draft, with subsequent revisions. JBC supervised the research, validated the results, and contributed to the writing, review, and editing of the manuscript. HG contributed to data curation and investigation. LL contributed to the investigation and manuscript review and editing. JW and OD contributed to validation and manuscript review and editing. KQ supervised the project and validated the results.
At least one of the (co-)authors is a member of the editorial board of Atmospheric Chemistry and Physics. The peer-review process was guided by an independent editor, and the authors also have no other competing interests to declare.
Publisher's note: Copernicus Publications remains neutral with regard to jurisdictional claims made in the text, published maps, institutional affiliations, or any other geographical representation in this paper. The authors bear the ultimate responsibility for providing appropriate place names. Views expressed in the text are those of the authors and do not necessarily reflect the views of the publisher.
The author(s) want to thank all of the Principal Investigators of TROPOMI, AERONET and MODIS for making the data available. Jun Wang's participation is made possible by in-kind support (Lichtenberger Family Chair professorship) through the University of Iowa. The lead author wishes to extend a special thanks to Piyush Kumar Patel (SRON) for his valuable guidance during the early stages of the lead author's career, particularly in satellite data processing and proficient application of the SBDART model.
This paper was edited by Kara Lamb and reviewed by two anonymous referees.
Aouizerats, B., Thouron, O., Tulet, P., Mallet, M., Gomes, L., and Henzing, J. S.: Development of an online radiative module for the computation of aerosol optical properties in 3-D atmospheric models: validation during the EUCAARI campaign, Geosci. Model Dev., 3, 553–564, https://doi.org/10.5194/gmd-3-553-2010, 2010.
Bai, J., Lou, Y., Zhang, W., Zhou, Y., Zhang, Z., and Shi, C.: Assessment and calibration of MODIS precipitable water vapor products based on GPS network over China, Atmos. Res., 254, 105504, https://doi.org/10.1016/j.atmosres.2021.105504, 2021.
Bellouin, N., Boucher, O., Haywood, J., and Reddy, M. S.: Global estimate of aerosol direct radiative forcing from satellite measurements, Nature, 438, 1138–1141, https://doi.org/10.1038/nature04348, 2005.
Biswas, J., Pathak, B., Patadia, F., Bhuyan, P. K., Gogoi, M. M., and Suresh Babu, S.: Satellite-retrieved direct radiative forcing of aerosols over North-East India and adjoining areas: climatology and impact assessment, Int. J. Climatol., 37, 4756–4756, https://doi.org/10.1002/joc.5325, 2017.
Bohren, C. F. and Huffman, D. R.: Absorption and Scattering of Light by Small Particles, Wiley, https://doi.org/10.1002/9783527618156, 1998.
Bond, T. C. and Bergstrom, R. W.: Light Absorption by Carbonaceous Particles: An Investigative Review, Aerosol Sci. Tech., 40, 27–67, https://doi.org/10.1080/02786820500421521, 2006.
Bond, T. C., Doherty, S. J., Fahey, D. W., Forster, P. M., Berntsen, T., Deangelo, B. J., Flanner, M. G., Ghan, S., Kärcher, B., Koch, D., Kinne, S., Kondo, Y., Quinn, P. K., Sarofim, M. C., Schultz, M. G., Schulz, M., Venkataraman, C., Zhang, H., Zhang, S., Bellouin, N., Guttikunda, S. K., Hopke, P. K., Jacobson, M. Z., Kaiser, J. W., Klimont, Z., Lohmann, U., Schwarz, J. P., Shindell, D., Storelvmo, T., Warren, S. G., and Zender, C. S.: Bounding the role of black carbon in the climate system: A scientific assessment, J. Geophys. Res.-Atmos., 118, 5380–5552, https://doi.org/10.1002/jgrd.50171, 2013.
Brown, H., Liu, X., Pokhrel, R., Murphy, S., Lu, Z., Saleh, R., Mielonen, T., Kokkola, H., Bergman, T., Myhre, G., Skeie, R. B., Watson-Paris, D., Stier, P., Johnson, B., Bellouin, N., Schulz, M., Vakkari, V., Beukes, J. P., van Zyl, P. G., Liu, S., and Chand, D.: Biomass burning aerosols in most climate models are too absorbing, Nat. Commun., 12, 277, https://doi.org/10.1038/s41467-020-20482-9, 2021.
Cappa, C. D., Onasch, T. B., Massoli, P., Worsnop, D. R., Bates, T. S., Cross, E. S., Davidovits, P., Hakala, J., Hayden, K. L., Jobson, B. T., Kolesar, K. R., Lack, D. A., Lerner, B. M., Li, S.-M., Mellon, D., Nuaaman, I., Olfert, J. S., Petäjä, T., Quinn, P. K., Song, C., Subramanian, R., Williams, E. J., and Zaveri, R. A.: Radiative Absorption Enhancements Due to the Mixing State of Atmospheric Black Carbon, Science, 337, 1078–1081, https://doi.org/10.1126/science.1223447, 2012.
Che, X., Feng, M., Sexton, J., Channan, S., Yang, Y., and Sun, Q.: Assessment of MODIS BRDF/Albedo Model Parameters (MCD43A1 Collection 6) for Directional Reflectance Retrieval, Remote Sens., 9, 1123, https://doi.org/10.3390/rs9111123, 2017.
Chen, C., Dubovik, O., Schuster, G. L., Chin, M., Henze, D. K., Lapyonok, T., Li, Z., Derimian, Y., and Zhang, Y.: Multi-angular polarimetric remote sensing to pinpoint global aerosol absorption and direct radiative forcing, Nat. Commun., 13, 7459, https://doi.org/10.1038/s41467-022-35147-y, 2022.
Chen, C., Litvinov, P., Dubovik, O., Bindreiter, L., Matar, C., Fuertes, D., Lopatin, A., Lapyonok, T., Lanzinger, V., Hangler, A., Aspetsberger, M., de Graaf, M., Tilstra, L. G., Stammes, P., Dandocsi, A., Gasbarra, D., Fluck, E., Zehner, C., and Retscher, C.: Extended aerosol and surface characterization from S5P/TROPOMI with GRASP algorithm. Part II: Global validation and Intercomparison, Remote Sens. Environ., 313, 114374, https://doi.org/10.1016/j.rse.2024.114374, 2024.
Chen, G., Wang, J., Wang, Y., Wang, J., Jin, Y., Cheng, Y., Yin, Y., Liao, H., Ding, A., Wang, S., Hao, J., and Liu, C.: An Aerosol Optical Module With Observation-Constrained Black Carbon Properties for Global Climate Models, J. Adv. Model. Earth Syst., 15, https://doi.org/10.1029/2022MS003501, 2023.
Chen, W., Tian, H., and Qin, K.: Black Carbon Aerosol in the Industrial City of Xuzhou, China: Temporal Characteristics and Source Appointment, Aerosol Air Qual. Res., 19, 794–811, https://doi.org/10.4209/aaqr.2018.07.0245, 2019.
Chen, W., Ran, H., Cao, X., Wang, J., Teng, D., Chen, J., and Zheng, X.: Estimating PM2.5 with high-resolution 1-km AOD data and an improved machine learning model over Shenzhen, China, Sci. Total Environ., 746, 141093, https://doi.org/10.1016/j.scitotenv.2020.141093, 2020.
Chin, M., Ginoux, P., Kinne, S., Torres, O., Holben, B. N., Duncan, B. N., Martin, R. V., Logan, J. A., Higurashi, A., and Nakajima, T.: Tropospheric Aerosol Optical Thickness from the GOCART Model and Comparisons with Satellite and Sun Photometer Measurements, J. Atmos. Sci., 59, 461–483, https://doi.org/10.1175/1520-0469(2002)059<0461:TAOTFT>2.0.CO;2, 2002.
Christopher, S. A. and Zhang, J.: Shortwave Aerosol Radiative Forcing from MODIS and CERES observations over the oceans, Geophys. Res. Lett., 29, https://doi.org/10.1029/2002GL014803, 2002.
Chung, C. E.: Aerosol Direct Radiative Forcing: A Review, in: Atmospheric Aerosols – Regional Characteristics – Chemistry and Physics, InTech, https://doi.org/10.5772/50248, 2012.
Cohen, J. B. and Prinn, R. G.: Development of a fast, urban chemistry metamodel for inclusion in global models, Atmos. Chem. Phys., 11, 7629–7656, https://doi.org/10.5194/acp-11-7629-2011, 2011.
Cohen, J. B. and Wang, C.: Estimating global black carbon emissions using a top-down Kalman Filter approach, J. Geophys. Res.-Atmos., 119, 307–323, https://doi.org/10.1002/2013JD019912, 2014.
Colin, B., Schmidt, M., Clifford, S., Woodley, A., and Mengersen, K.: Influence of Spatial Aggregation on Prediction Accuracy of Green Vegetation Using Boosted Regression Trees, Remote Sens., 10, 1260, https://doi.org/10.3390/rs10081260, 2018.
Dai, C., Zhang, X., Lian, W., Wei, H., Liu, J., and Zou, S.: Comparison study between nitrate and sulfate aerosols and their coating effect on the scattering properties of mineral aerosol, Sci. Rep., 14, 21756, https://doi.org/10.1038/s41598-024-71532-x, 2024.
Das, S., Colarco, P. R., Bian, H., and Gassó, S.: Improved simulations of biomass burning aerosol optical properties and lifetimes in the NASA GEOS Model during the ORACLES-I campaign, Atmos. Chem. Phys., 24, 4421–4449, https://doi.org/10.5194/acp-24-4421-2024, 2024.
Dasari, S., Andersson, A., Stohl, A., Evangeliou, N., Bikkina, S., Holmstrand, H., Budhavant, K., Salam, A., and Gustafsson, Ö.: Source Quantification of South Asian Black Carbon Aerosols with Isotopes and Modeling, Environ. Sci. Technol., 54, 11771–11779, https://doi.org/10.1021/acs.est.0c02193, 2020.
de Graaf, M.: TROPOMI validation report of the Aerosol Optical Thickness product, Netherlands, 13 pp., https://data-portal.s5p-pal.com/product-docs/aot/s5p_aot_vr_v1.0.0_2022-02-10_signed.pdf (last access: 27 June 2026), 2022.
Ding, S. and Liu, D.: Evaluation of the CAMS reanalysis for atmospheric black carbon and carbon monoxide over the north China plain, Environ. Pollut., 314, 120286, https://doi.org/10.1016/j.envpol.2022.120286, 2022.
Erlick, C., Abbatt, J. P. D., and Rudich, Y.: How Different Calculations of the Refractive Index Affect Estimates of the Radiative Forcing Efficiency of Ammonium Sulfate Aerosols, J. Atmos. Sci., 68, 1845–1852, https://doi.org/10.1175/2011JAS3721.1, 2011.
Everett, J. T., Newton, E. N., and Odum, M. M.: A Review of Progress in Constraining Global Black Carbon Climate Effects, Earth Syst. Environ., 6, 771–785, https://doi.org/10.1007/s41748-022-00313-1, 2022.
Fernandes, A., Szkop, A., and Pietruczuk, A.: Comparison of the Performance of the GRASP and MERRA2 Models in Reproducing Tropospheric Aerosol Layers, Atmosphere, 14, 1409, https://doi.org/10.3390/atmos14091409, 2023.
Fierce, L., Onasch, T. B., Cappa, C. D., Mazzoleni, C., China, S., Bhandari, J., Davidovits, P., Fischer, D. Al, Helgestad, T., Lambe, A. T., Sedlacek, A. J., Smith, G. D., and Wolff, L.: Radiative absorption enhancements by black carbon controlled by particle-to-particle heterogeneity in composition, P. Natl. Acad. Sci. USA, 117, 5196–5203, https://doi.org/10.1073/pnas.1919723117, 2020.
Flores, J. M., Zhao, D. F., Segev, L., Schlag, P., Kiendler-Scharr, A., Fuchs, H., Watne, Å. K., Bluvshtein, N., Mentel, Th. F., Hallquist, M., and Rudich, Y.: Evolution of the complex refractive index in the UV spectral region in ageing secondary organic aerosol, Atmos. Chem. Phys., 14, 5793–5806, https://doi.org/10.5194/acp-14-5793-2014, 2014.
Forrister, H., Liu, J., Scheuer, E., Dibb, J., Ziemba, L., Thornhill, K. L., Anderson, B., Diskin, G., Perring, A. E., Schwarz, J. P., Campuzano-Jost, P., Day, D. A., Palm, B. B., Jimenez, J. L., Nenes, A., and Weber, R. J.: Evolution of brown carbon in wildfire plumes, Geophys. Res. Lett., 42, 4623–4630, https://doi.org/10.1002/2015GL063897, 2015.
Forster, P. M., Smith, C. J., Walsh, T., Lamb, W. F., Lamboll, R., Hauser, M., Ribes, A., Rosen, D., Gillett, N., Palmer, M. D., Rogelj, J., von Schuckmann, K., Seneviratne, S. I., Trewin, B., Zhang, X., Allen, M., Andrew, R., Birt, A., Borger, A., Boyer, T., Broersma, J. A., Cheng, L., Dentener, F., Friedlingstein, P., Gutiérrez, J. M., Gütschow, J., Hall, B., Ishii, M., Jenkins, S., Lan, X., Lee, J.-Y., Morice, C., Kadow, C., Kennedy, J., Killick, R., Minx, J. C., Naik, V., Peters, G. P., Pirani, A., Pongratz, J., Schleussner, C.-F., Szopa, S., Thorne, P., Rohde, R., Rojas Corradi, M., Schumacher, D., Vose, R., Zickfeld, K., Masson-Delmotte, V., and Zhai, P.: Indicators of Global Climate Change 2022: annual update of large-scale indicators of the state of the climate system and human influence, Earth Syst. Sci. Data, 15, 2295–2327, https://doi.org/10.5194/essd-15-2295-2023, 2023.
Garane, K., Koukouli, M.-E., Verhoelst, T., Lerot, C., Heue, K.-P., Fioletov, V., Balis, D., Bais, A., Bazureau, A., Dehn, A., Goutail, F., Granville, J., Griffin, D., Hubert, D., Keppens, A., Lambert, J.-C., Loyola, D., McLinden, C., Pazmino, A., Pommereau, J.-P., Redondas, A., Romahn, F., Valks, P., Van Roozendael, M., Xu, J., Zehner, C., Zerefos, C., and Zimmer, W.: TROPOMI/S5P total ozone column data: global ground-based validation and consistency with other satellite missions, Atmos. Meas. Tech., 12, 5263–5287, https://doi.org/10.5194/amt-12-5263-2019, 2019.
García, O. E., Díaz, J. P., Expósito, F. J., Díaz, A. M., Dubovik, O., Derimian, Y., Dubuisson, P., and Roger, J.-C.: Shortwave radiative forcing and efficiency of key aerosol types using AERONET data, Atmos. Chem. Phys., 12, 5129–5145, https://doi.org/10.5194/acp-12-5129-2012, 2012.
Gautam, R., Patel, P. N., Singh, M. K., Liu, T., Mickley, L. J., Jethva, H., and DeFries, R. S.: Extreme Smog Challenge of India Intensified by Increasing Lower Tropospheric Stability, Geophys. Res. Lett., 50, https://doi.org/10.1029/2023GL103105, 2023.
Giannaklis, C.-P., Logothetis, S.-A., Salamalikis, V., Tzoumanikas, P., Katsidimas, K., and Kazantzidis, A.: Simulations of Sky Radiances in Red and Blue Channels at Various Aerosol Conditions Using Radiative Transfer Modeling, in: 16th International Conference on Meteorology, Climatology and Atmospheric Physics – COMECAP 2023, 89, https://doi.org/10.3390/environsciproc2023026089, 2023.
Guan, L., Cohen, J. B., Wang, S., Tiwari, P., Liu, Z., Li, Z., and Qin, K.: In-tandem multi-waveband particulate absorption and size observations yield substantial changes in radiative forcing over industrial Central China, Atmos. Chem. Phys., 26, 3107–3123, https://doi.org/10.5194/acp-26-3107-2026, 2026.
Hansen, J. E. and Sato, M.: Trends of measured climate forcing agents, P. Natl. Acad. Sci. USA, 98, 14778–14783, https://doi.org/10.1073/pnas.261553698, 2001.
He, J. and Liu, Z.: Comparison of Satellite-Derived Precipitable Water Vapor Through Near-Infrared Remote Sensing Channels, IEEE T. Geosci. Remote, 57, 10252–10262, https://doi.org/10.1109/TGRS.2019.2932847, 2019.
Holanda, B. A., Pöhlker, M. L., Walter, D., Saturno, J., Sörgel, M., Ditas, J., Ditas, F., Schulz, C., Franco, M. A., Wang, Q., Donth, T., Artaxo, P., Barbosa, H. M. J., Borrmann, S., Braga, R., Brito, J., Cheng, Y., Dollner, M., Kaiser, J. W., Klimach, T., Knote, C., Krüger, O. O., Fütterer, D., Lavrič, J. V., Ma, N., Machado, L. A. T., Ming, J., Morais, F. G., Paulsen, H., Sauer, D., Schlager, H., Schneider, J., Su, H., Weinzierl, B., Walser, A., Wendisch, M., Ziereis, H., Zöger, M., Pöschl, U., Andreae, M. O., and Pöhlker, C.: Influx of African biomass burning aerosol during the Amazonian dry season through layered transatlantic transport of black carbon-rich smoke, Atmos. Chem. Phys., 20, 4757–4785, https://doi.org/10.5194/acp-20-4757-2020, 2020.
Hsu, N. C., Jeong, M. J., Bettenhausen, C., Sayer, A. M., Hansell, R., Seftor, C. S., Huang, J., and Tsay, S. C.: Enhanced Deep Blue aerosol retrieval algorithm: The second generation, J. Geophys. Res.-Atmos., 118, 9296–9315, https://doi.org/10.1002/jgrd.50712, 2013.
Inness, A., Flemming, J., Heue, K.-P., Lerot, C., Loyola, D., Ribas, R., Valks, P., van Roozendael, M., Xu, J., and Zimmer, W.: Monitoring and assimilation tests with TROPOMI data in the CAMS system: near-real-time total column ozone, Atmos. Chem. Phys., 19, 3939–3962, https://doi.org/10.5194/acp-19-3939-2019, 2019.
Jacobson, M. Z.: Strong radiative heating due to the mixing state of black carbon in atmospheric aerosols, Nature, 409, 695–697, https://doi.org/10.1038/35055518, 2001.
Jia, A., Wang, D., Liang, S., Peng, J., and Yu, Y.: Global Daily Actual and Snow-Free Blue-Sky Land Surface Albedo Climatology From 20-Year MODIS Products, J. Geophys. Res.-Atmos., 127, https://doi.org/10.1029/2021JD035987, 2022.
Kahn, R. A., Andrews, E., Brock, C. A., Chin, M., Feingold, G., Gettelman, A., Levy, R. C., Murphy, D. M., Nenes, A., Pierce, J. R., Popp, T., Redemann, J., Sayer, A. M., da Silva, A. M., Sogacheva, L., and Stier, P.: Reducing Aerosol Forcing Uncertainty by Combining Models With Satellite and Within-The-Atmosphere Observations: A Three-Way Street, Rev. Geophys., 61, https://doi.org/10.1029/2022RG000796, 2023.
Kang, J., Wang, S., Cohen, J., Wang, W., Shi, L., Wang, T., Sun, Q., Feng, J., and Qin, K.: Improving estimation of surface PM2.5 by including satellite observations of gases, aerosols, and radiation in tandem, Environ. Res. Lett., 20, 124019, https://doi.org/10.1088/1748-9326/ae1e17, 2025.
Kelesidis, G. A., Neubauer, D., Fan, L.-S., Lohmann, U., and Pratsinis, S. E.: Enhanced Light Absorption and Radiative Forcing by Black Carbon Agglomerates, Environ. Sci. Technol., 56, 8610–8618, https://doi.org/10.1021/acs.est.2c00428, 2022.
Keppens, A., Di Pede, S., Hubert, D., Lambert, J.-C., Veefkind, P., Sneep, M., De Haan, J., ter Linden, M., Leblanc, T., Compernolle, S., Verhoelst, T., Granville, J., Nath, O., Fjæraa, A. M., Boyd, I., Niemeijer, S., Van Malderen, R., Smit, H. G. J., Duflot, V., Godin-Beekmann, S., Johnson, B. J., Steinbrecht, W., Tarasick, D. W., Kollonige, D. E., Stauffer, R. M., Thompson, A. M., Dehn, A., and Zehner, C.: 5 years of Sentinel-5P TROPOMI operational ozone profiling and geophysical validation using ozonesonde and lidar ground-based networks, Atmos. Meas. Tech., 17, 3969–3993, https://doi.org/10.5194/amt-17-3969-2024, 2024.
King, M. D., Kaufman, Y. J., Menzel, W. P., and Tanre, D.: Remote sensing of cloud, aerosol, and water vapor properties from the moderate resolution imaging spectrometer (MODIS), IEEE T. Geosci. Remote, 30, 2–27, https://doi.org/10.1109/36.124212, 1992.
Koch, D. and Del Genio, A. D.: Black carbon semi-direct effects on cloud cover: review and synthesis, Atmos. Chem. Phys., 10, 7685–7696, https://doi.org/10.5194/acp-10-7685-2010, 2010.
Kompalli, S. K., Babu, S. N. S., Moorthy, K. K., Satheesh, S. K., Gogoi, M. M., Nair, V. S., Jayachandran, V. N., Liu, D., Flynn, M. J., and Coe, H.: Mixing state of refractory black carbon aerosol in the South Asian outflow over the northern Indian Ocean during winter, Atmos. Chem. Phys., 21, 9173–9199, https://doi.org/10.5194/acp-21-9173-2021, 2021.
Lambe, A. T., Cappa, C. D., Massoli, P., Onasch, T. B., Forestieri, S. D., Martin, A. T., Cummings, M. J., Croasdale, D. R., Brune, W. H., Worsnop, D. R., and Davidovits, P.: Relationship between Oxidation Level and Optical Properties of Secondary Organic Aerosol, Environ. Sci. Technol., 47, 6349–6357, https://doi.org/10.1021/es401043j, 2013.
Li, J., Carlson, B. E., Yung, Y. L., Lv, D., Hansen, J., Penner, J. E., Liao, H., Ramaswamy, V., Kahn, R. A., Zhang, P., Dubovik, O., Ding, A., Lacis, A. A., Zhang, L., and Dong, Y.: Scattering and absorbing aerosols in the climate system, Nat. Rev. Earth Environ., 3, 363–379, https://doi.org/10.1038/s43017-022-00296-7, 2022.
Li, W., Wang, Y., Yi, Z., Guo, B., Chen, W., Che, H., and Zhang, X.: Evaluation of MERRA-2 and CAMS reanalysis for black carbon aerosol in China, Environ. Pollut., 343, 123182, https://doi.org/10.1016/j.envpol.2023.123182, 2024.
Litvinov, P., Chen, C., Dubovik, O., Bindreiter, L., Matar, C., Fuertes, D., Lopatin, A., Lapyonok, T., Lanzinger, V., Hangler, A., Aspetsberger, M., de Graaf, M., Tilstra, L. G., Stammes, P., Dandocsi, A., Gasbarra, D., Fluck, E., Zehner, C., and Retscher, C.: Extended aerosol and surface characterization from S5P/TROPOMI with GRASP algorithm. Part I: Conditions, approaches, performance and new possibilities, Remote Sens. Environ., 313, 114355, https://doi.org/10.1016/j.rse.2024.114355, 2024.
Liu, D., Whitehead, J., Alfarra, M. R., Reyes-Villegas, E., Spracklen, D. V., Reddington, C. L., Kong, S., Williams, P. I., Ting, Y.-C., Haslett, S., Taylor, J. W., Flynn, M. J., Morgan, W. T., McFiggans, G., Coe, H., and Allan, J. D.: Black-carbon absorption enhancement in the atmosphere determined by particle mixing state, Nat. Geosci., 10, 184–188, https://doi.org/10.1038/ngeo2901, 2017.
Liu, F., Yon, J., Fuentes, A., Lobo, P., Smallwood, G. J., and Corbin, J. C.: Review of recent literature on the light absorption properties of black carbon: Refractive index, mass absorption cross section, and absorption function, Aerosol Sci. Tech., 54, 33–51, https://doi.org/10.1080/02786826.2019.1676878, 2020a.
Liu, H., Pan, X., Liu, D., Liu, X., Chen, X., Tian, Y., Sun, Y., Fu, P., and Wang, Z.: Mixing characteristics of refractory black carbon aerosols at an urban site in Beijing, Atmos. Chem. Phys., 20, 5771–5785, https://doi.org/10.5194/acp-20-5771-2020, 2020b.
Liu, J., Cohen, J. B., He, Q., Tiwari, P., and Qin, K.: Accounting for NOx emissions from biomass burning and urbanization doubles existing inventories over South, Southeast and East Asia, Commun. Earth Environ., 5, 255, https://doi.org/10.1038/s43247-024-01424-5, 2024a.
Liu, J., Cohen, J. B., Tiwari, P., Liu, Z., Yim, S. H.-L., Gupta, P., and Qin, K.: New top-down estimation of daily mass and number column density of black carbon driven by OMI and AERONET observations, Remote Sens. Environ., 315, 114436, https://doi.org/10.1016/j.rse.2024.114436, 2024b.
Liu, Z., Cohen, J. B., Wang, S., Wang, X., Tiwari, P., and Qin, K.: Remotely sensed BC columns over rapidly changing Western China show significant decreases in mass and inconsistent changes in number, size, and mixing properties due to policy actions, npj Clim. Atmos. Sci., 7, 124, https://doi.org/10.1038/s41612-024-00663-9, 2024c.
Liu, Z., Cohen, J. B., Tiwari, P., Guan, L., Wang, S., Li, Z., and Qin, K.: A global black carbon dataset of column concentration and microphysical information derived from MISR multi-band observations and Mie scattering simulations, Earth Syst. Sci. Data, 18, 507–533, https://doi.org/10.5194/essd-18-507-2026, 2026.
Loeb, N. G., Su, W., Bellouin, N., and Ming, Y.: Changes in Clear-Sky Shortwave Aerosol Direct Radiative Effects Since 2002, J. Geophys. Res.-Atmos., 126, https://doi.org/10.1029/2020JD034090, 2021.
Logothetis, S.-A., Salamalikis, V., and Kazantzidis, A.: The impact of different aerosol properties and types on direct aerosol radiative forcing and efficiency using AERONET version 3, Atmos. Res., 250, 105343, https://doi.org/10.1016/j.atmosres.2020.105343, 2021.
Lohmann, U. and Feichter, J.: Global indirect aerosol effects: A review, Atmos. Chem. Phys., 5, 715–737, https://doi.org/10.5194/acp-5-715-2005, 2005.
Lucht, W., Schaaf, C. B., and Strahler, A. H.: An algorithm for the retrieval of albedo from space using semiempirical BRDF models, IEEE T. Geosci. Remote, 38, 977–998, https://doi.org/10.1109/36.841980, 2000.
Lundberg, S. M. and Lee, S.-I.: A Unified Approach to Interpreting Model Predictions, in: Neural Information Processing Systems, https://proceedings.neurips.cc/paper_files/paper/2017/file/8a20a8621978632d76c43dfd28b67767-Paper.pdf (last access: 27 June 2026), 2017.
Luo, J., Li, Z., Zhang, C., Zhang, Q., Zhang, Y., Zhang, Y., Curci, G., and Chakrabarty, R. K.: Regional impacts of black carbon morphologies on shortwave aerosol–radiation interactions: a comparative study between the US and China, Atmos. Chem. Phys., 22, 7647–7666, https://doi.org/10.5194/acp-22-7647-2022, 2022.
Lyapustin, A. and Wang, Y.: MODIS Multi-Angle Implementation of Atmospheric Correction (MAIAC) Data User's Guide, Collection 6.1, Version 3.1, https://lpdaac.usgs.gov/documents/1500/MCD19_User_Guide_V61.pdf (last access: 27 June 2026), 2022.
Lyapustin, A., Wang, Y., Laszlo, I., Kahn, R., Korkin, S., Remer, L., Levy, R., and Reid, J. S.: Multiangle implementation of atmospheric correction (MAIAC): 2. Aerosol algorithm, J. Geophys. Res., 116, D03211, https://doi.org/10.1029/2010JD014986, 2011.
Lyapustin, A., Wang, Y., Korkin, S., and Huang, D.: MODIS Collection 6 MAIAC algorithm, Atmos. Meas. Tech., 11, 5741–5765, https://doi.org/10.5194/amt-11-5741-2018, 2018.
Ma, Z., Dey, S., Christopher, S., Liu, R., Bi, J., Balyan, P., and Liu, Y.: A review of statistical methods used for developing large-scale and long-term PM2.5 models from satellite data, Remote Sens. Environ., 269, 112827, https://doi.org/10.1016/j.rse.2021.112827, 2022.
Mahajan, S., Evans, K. J., Hack, J. J., and Truesdale, J. E.: Linearity of Climate Response to Increases in Black Carbon Aerosols, J. Climate, 26, 8223–8237, https://doi.org/10.1175/JCLI-D-12-00715.1, 2013.
Martins, V. S., Lyapustin, A., de Carvalho, L. A. S., Barbosa, C. C. F., and Novo, E. M. L. M.: Validation of high-resolution MAIAC aerosol product over South America, J. Geophys. Res.-Atmos., 122, 7537–7559, https://doi.org/10.1002/2016JD026301, 2017.
Matus, A. V., L'Ecuyer, T. S., and Henderson, D. S.: New Estimates of Aerosol Direct Radiative Effects and Forcing From A-Train Satellite Observations, Geophys. Res. Lett., 46, 8338–8346, https://doi.org/10.1029/2019GL083656, 2019.
Mätzler, C.: MATLAB functions for Mie scattering and absorption, IAP Res. Rep., 8, 2002, https://www.researchgate.net/publication/228703362_MATLAB_functions_for_Mie_scattering_and_absorption (last access: 27 June 2026), 2002.
McFiggans, G., Artaxo, P., Baltensperger, U., Coe, H., Facchini, M. C., Feingold, G., Fuzzi, S., Gysel, M., Laaksonen, A., Lohmann, U., Mentel, T. F., Murphy, D. M., O'Dowd, C. D., Snider, J. R., and Weingartner, E.: The effect of physical and chemical aerosol properties on warm cloud droplet activation, Atmos. Chem. Phys., 6, 2593–2649, https://doi.org/10.5194/acp-6-2593-2006, 2006.
McMeeking, G. R., Morgan, W. T., Flynn, M., Highwood, E. J., Turnbull, K., Haywood, J., and Coe, H.: Black carbon aerosol mixing state, organic aerosols and aerosol optical properties over the United Kingdom, Atmos. Chem. Phys., 11, 9037–9052, https://doi.org/10.5194/acp-11-9037-2011, 2011.
Mehrotra, B. J., Srivastava, A. K., Singh, A., Parashar, D., Majumder, N., Singh, R. S., Choudhary, A., and Srivastava, M. K.: Long-Term Trend in Black Carbon Mass Concentration Over Central Indo-Gangetic Plain Location: Understanding the Implied Change in Radiative Forcing, J. Geophys. Res.-Atmos., 129, https://doi.org/10.1029/2024JD040754, 2024.
Mehrotra, B. J., Choudhary, A., Srivastava, A. K., Sharma, S. K., and Srivastava, M. K.: Physical, optical and radiative attributes of atmospheric aerosols produced due to bonfire during the Holika festival, Phys. Chem. Earth Pt. A/B/C, 138, 103856, https://doi.org/10.1016/j.pce.2025.103856, 2025.
Mhawish, A., Banerjee, T., Sorek-Hamer, M., Lyapustin, A., Broday, D. M., and Chatfield, R.: Comparison and evaluation of MODIS Multi-angle Implementation of Atmospheric Correction (MAIAC) aerosol product over South Asia, Remote Sens. Environ., 224, 12–28, https://doi.org/10.1016/j.rse.2019.01.033, 2019.
Mie, G.: Beiträge zur Optik trüber Medien, speziell kolloidaler Metallösungen, Ann. Phys., 330, 377–445, https://doi.org/10.1002/andp.19083300302, 1908.
Myhre, G., Samset, B. H., Schulz, M., Balkanski, Y., Bauer, S., Berntsen, T. K., Bian, H., Bellouin, N., Chin, M., Diehl, T., Easter, R. C., Feichter, J., Ghan, S. J., Hauglustaine, D., Iversen, T., Kinne, S., Kirkevåg, A., Lamarque, J.-F., Lin, G., Liu, X., Lund, M. T., Luo, G., Ma, X., van Noije, T., Penner, J. E., Rasch, P. J., Ruiz, A., Seland, Ø., Skeie, R. B., Stier, P., Takemura, T., Tsigaridis, K., Wang, P., Wang, Z., Xu, L., Yu, H., Yu, F., Yoon, J.-H., Zhang, K., Zhang, H., and Zhou, C.: Radiative forcing of the direct aerosol effect from AeroCom Phase II simulations, Atmos. Chem. Phys., 13, 1853–1877, https://doi.org/10.5194/acp-13-1853-2013, 2013.
Nenes, A., Conant, W. C., and Seinfeld, J. H.: Black carbon radiative heating effects on cloud microphysics and implications for the aerosol indirect effect 2. Cloud microphysics, J. Geophys. Res.-Atmos., 107, https://doi.org/10.1029/2002JD002101, 2002.
Park, R. J., Kim, M. J., Jeong, J. I., Youn, D., and Kim, S.: A contribution of brown carbon aerosol to the aerosol light absorption and its radiative forcing in East Asia, Atmos. Environ., 44, 1414–1421, https://doi.org/10.1016/j.atmosenv.2010.01.042, 2010.
Peng, J., Hu, M., Guo, S., Du, Z., Zheng, J., Shang, D., Levy Zamora, M., Zeng, L., Shao, M., Wu, Y.-S., Zheng, J., Wang, Y., Glen, C. R., Collins, D. R., Molina, M. J., and Zhang, R.: Markedly enhanced absorption and direct radiative forcing of black carbon under polluted urban environments, P. Natl. Acad. Sci. USA, 113, 4266–4271, https://doi.org/10.1073/pnas.1602310113, 2016.
Qin, K., He, Q., Zhang, Y., Cohen, J. B., Tiwari, P., and Lolli, S.: Aloft Transport of Haze Aerosols to Xuzhou, Eastern China: Optical Properties, Sources, Type, and Components, Remote Sens., 14, 1589, https://doi.org/10.3390/rs14071589, 2022.
Qin, W., Fang, H., Wang, L., Wei, J., Zhang, M., Su, X., Bilal, M., and Liang, X.: MODIS high-resolution MAIAC aerosol product: Global validation and analysis, Atmos. Environ., 264, 118684, https://doi.org/10.1016/j.atmosenv.2021.118684, 2021.
Rahman, M. M., Mahamud, S., and Thurston, G. D.: Recent spatial gradients and time trends in Dhaka, Bangladesh, air pollution and their human health implications, J. Air Waste Manage. Assoc., 69, 478–501, https://doi.org/10.1080/10962247.2018.1548388, 2019.
Ramachandran, S., Rupakheti, M., Cherian, R., and Lawrence, M. G.: Aerosols heat up the Himalayan climate, Sci. Total Environ., 164733, https://doi.org/10.1016/j.scitotenv.2023.164733, 2023.
Ramanathan, V. and Carmichael, G.: Global and regional climate changes due to black carbon, Nat. Geosci., 1, 221–227, https://doi.org/10.1038/ngeo156, 2008.
Randles, C. A. and Ramaswamy, V.: Direct and semi-direct impacts of absorbing biomass burning aerosol on the climate of southern Africa: a Geophysical Fluid Dynamics Laboratory GCM sensitivity study, Atmos. Chem. Phys., 10, 9819–9831, https://doi.org/10.5194/acp-10-9819-2010, 2010.
Randles, C. A., da Silva, A. M., Buchard, V., Colarco, P. R., Darmenov, A., Govindaraju, R., Smirnov, A., Holben, B., Ferrare, R., Hair, J., Shinozuka, Y., and Flynn, C. J.: The MERRA-2 Aerosol Reanalysis, 1980 Onward. Part I: System Description and Data Assimilation Evaluation, J. Climate, 30, 6823–6850, https://doi.org/10.1175/JCLI-D-16-0609.1, 2017.
Rasp, S., Pritchard, M. S., and Gentine, P.: Deep learning to represent subgrid processes in climate models, P. Natl. Acad. Sci. USA, 115, 9684–9689, https://doi.org/10.1073/pnas.1810286115, 2018.
Reichstein, M., Camps-Valls, G., Stevens, B., Jung, M., Denzler, J., Carvalhais, N., and Prabhat: Deep learning and process understanding for data-driven Earth system science, Nature, 566, 195–204, https://doi.org/10.1038/s41586-019-0912-1, 2019.
Ren, Y., Oxford, C. R., Zhang, D., Liu, X., Zhu, H., Dillner, A. M., White, W. H., Chakrabarty, R. K., Hasheminassab, S., Diner, D. J., Le Roy, E. J., Kumar, J., Viteri, V., Song, K., Akoshile, C., Amador-Muñoz, O., Asfaw, A., Chang, R. Y.-W., Francis, D., Gahungu, P., Garland, R. M., Grutter, M., Kim, J., Langerman, K., Lee, P.-C., Lestari, P., Mayol-Bracero, O. L., Naidoo, M., Nelli, N., O'Neill, N., Park, S. S., Salam, A., Sarangi, B., Schechner, Y., Schofield, R., Tripathi, S. N., Windwer, E., Wu, M.-T., Zhang, Q., Rudich, Y., Brauer, M., and Martin, R. V.: Black carbon emissions generally underestimated in the global south as revealed by globally distributed measurements, Nat. Commun., 16, 7010, https://doi.org/10.1038/s41467-025-62468-5, 2025.
Ricchiazzi, P., Yang, S., Gautier, C., and Sowle, D.: SBDART: A Research and Teaching Software Tool for Plane-Parallel Radiative Transfer in the Earth's Atmosphere, B. Am. Meteorol. Soc., 79, 2101–2114, https://doi.org/10.1175/1520-0477(1998)079<2101:SARATS>2.0.CO;2, 1998.
Román, M. O., Schaaf, C. B., Lewis, P., Gao, F., Anderson, G. P., Privette, J. L., Strahler, A. H., Woodcock, C. E., and Barnsley, M.: Assessing the coupling between surface albedo derived from MODIS and the fraction of diffuse skylight over spatially-characterized landscapes, Remote Sens. Environ., 114, 738–760, https://doi.org/10.1016/j.rse.2009.11.014, 2010.
Romshoo, B., Patil, J., Michels, T., Müller, T., Kloft, M., and Pöhlker, M.: Improving the predictions of black carbon (BC) optical properties at various aging stages using a machine-learning-based approach, Atmos. Chem. Phys., 24, 8821–8846, https://doi.org/10.5194/acp-24-8821-2024, 2024.
Salam, A., Andersson, A., Jeba, F., Haque, M. I., Hossain Khan, M. D., and Gustafsson, Ö.: Wintertime Air Quality in Megacity Dhaka, Bangladesh Strongly Affected by Influx of Black Carbon Aerosols from Regional Biomass Burning, Environ. Sci. Technol., 55, 12243–12249, https://doi.org/10.1021/acs.est.1c03623, 2021.
Saleh, R., Hennigan, C. J., McMeeking, G. R., Chuang, W. K., Robinson, E. S., Coe, H., Donahue, N. M., and Robinson, A. L.: Absorptivity of brown carbon in fresh and photo-chemically aged biomass-burning emissions, Atmos. Chem. Phys., 13, 7683–7693, https://doi.org/10.5194/acp-13-7683-2013, 2013.
Samset, B. H., Stjern, C. W., Andrews, E., Kahn, R. A., Myhre, G., Schulz, M., and Schuster, G. L.: Aerosol Absorption: Progress Towards Global and Regional Constraints, Curr. Clim. Change Rep., 4, 65–83, https://doi.org/10.1007/s40641-018-0091-4, 2018a.
Samset, B. H., Sand, M., Smith, C. J., Bauer, S. E., Forster, P. M., Fuglestvedt, J. S., Osprey, S., and Schleussner, C. -F.: Climate Impacts From a Removal of Anthropogenic Aerosol Emissions, Geophys. Res. Lett., 45, 1020–1029, https://doi.org/10.1002/2017GL076079, 2018b.
Sayer, A. M., Hsu, N. C., Bettenhausen, C., and Jeong, M.-J.: Validation and uncertainty estimates for MODIS Collection 6 “Deep Blue” aerosol data, J. Geophys. Res.-Atmos., 118, 7864–7872, https://doi.org/10.1002/jgrd.50600, 2013.
Schaaf, C. B., Gao, F., Strahler, A. H., Lucht, W., Li, X., Tsang, T., Strugnell, N. C., Zhang, X., Jin, Y., Muller, J.-P., Lewis, P., Barnsley, M., Hobson, P., Disney, M., Roberts, G., Dunderdale, M., Doll, C., d'Entremont, R. P., Hu, B., Liang, S., Privette, J. L., and Roy, D.: First operational BRDF, albedo nadir reflectance products from MODIS, Remote Sens. Environ., 83, 135–148, https://doi.org/10.1016/S0034-4257(02)00091-3, 2002.
Schuster, G. L.: Inferring black carbon content and specific absorption from Aerosol Robotic Network (AERONET) aerosol retrievals, J. Geophys. Res., 110, D10S17, https://doi.org/10.1029/2004JD004548, 2005.
Sedlacek, A. J., Lewis, E. R., Onasch, T. B., Zuidema, P., Redemann, J., Jaffe, D., and Kleinman, L. I.: Using the Black Carbon Particle Mixing State to Characterize the Lifecycle of Biomass Burning Aerosols, Environ. Sci. Technol., 56, 14315–14325, https://doi.org/10.1021/acs.est.2c03851, 2022.
Seinfeld, J. H., Kleindienst, T. E., Edney, E. O., and Cohen, J. B.: Aerosol Growth in a Steady-State, Continuous Flow Chamber: Application to Studies of Secondary Aerosol Formation, Aerosol Sci. Tech., 37, 728–734, https://doi.org/10.1080/02786820300915, 2003.
Sena, E. T. and Artaxo, P.: A novel methodology for large-scale daily assessment of the direct radiative forcing of smoke aerosols, Atmos. Chem. Phys., 15, 5471–5483, https://doi.org/10.5194/acp-15-5471-2015, 2015.
Sena, E. T., Artaxo, P., and Correia, A. L.: Spatial variability of the direct radiative forcing of biomass burning aerosols and the effects of land use change in Amazonia, Atmos. Chem. Phys., 13, 1261–1275, https://doi.org/10.5194/acp-13-1261-2013, 2013.
Soriano Jr., M. A. and Maxwell, R.: Spatial aggregation effects on the performance of machine learning metamodels for predicting transit time to baseflow, Environ. Res. Commun., 5, 115002, https://doi.org/10.1088/2515-7620/ad0744, 2023.
Subba, T., Gogoi, M. M., Pathak, B., Bhuyan, P. K., and Babu, S. S.: Recent trend in the global distribution of aerosol direct radiative forcing from satellite measurements, Atmos. Sci. Lett., 21, https://doi.org/10.1002/asl.975, 2020.
Subba, T., Gogoi, M. M., Moorthy, K. K., Bhuyan, P. K., Pathak, B., Guha, A., Srivastava, M. K., Vyas, B. M., Singh, K., Krishnan, J., Lakshmi Kumar, T. V., and Babu, S. S.: New estimates of aerosol radiative effects over India from surface and satellite observations, Atmos. Res., 276, 106254, https://doi.org/10.1016/j.atmosres.2022.106254, 2022.
Sullivan, J. T., Apituley, A., Mettig, N., Kreher, K., Knowland, K. E., Allaart, M., Piters, A., Van Roozendael, M., Veefkind, P., Ziemke, J. R., Kramarova, N., Weber, M., Rozanov, A., Twigg, L., Sumnicht, G., and McGee, T. J.: Tropospheric and stratospheric ozone profiles during the 2019 TROpomi vaLIdation eXperiment (TROLIX-19), Atmos. Chem. Phys., 22, 11137–11153, https://doi.org/10.5194/acp-22-11137-2022, 2022.
Sun, C., Zhang, Y., Liang, B., Gao, M., Sun, X., Li, F., Ni, X., Sun, Q., Ou, H., Chen, D., Zhou, S., and Zhao, J.: Morphological and optical properties of carbonaceous aerosol particles from ship emissions and biomass burning during a summer cruise measurement in the South China Sea, Atmos. Chem. Phys., 24, 3043–3063, https://doi.org/10.5194/acp-24-3043-2024, 2024.
Sundström, A.-M., Arola, A., Kolmonen, P., Xue, Y., de Leeuw, G., and Kulmala, M.: On the use of a satellite remote-sensing-based approach for determining aerosol direct radiative effect over land: a case study over China, Atmos. Chem. Phys., 15, 505–518, https://doi.org/10.5194/acp-15-505-2015, 2015.
Tian, X., Tang, C., Wu, X., Yang, J., Zhao, F., and Liu, D.: The global spatial-temporal distribution and EOF analysis of AOD based on MODIS data during 2003–2021, Atmos. Environ., 302, 119722, https://doi.org/10.1016/j.atmosenv.2023.119722, 2023.
Tiwari, P., Cohen, J. B., Wang, X., Wang, S., and Qin, K.: Radiative forcing bias calculation based on COSMO (Core-Shell Mie model Optimization) and AERONET data, npj Clim. Atmos. Sci., 6, 193, https://doi.org/10.1038/s41612-023-00520-1, 2023.
Tiwari, P., Cohen, J. B., Lu, L., Wang, S., Li, X., Guan, L., Liu, Z., Li, Z., and Qin, K.: Multi-platform observations and constraints reveal overlooked urban sources of black carbon in Xuzhou and Dhaka, Commun. Earth Environ., 6, 38, https://doi.org/10.1038/s43247-025-02012-x, 2025.
Tiwari, P., Cohen, J. B., Kahn, R., Gao, H., Guan, L., Liu, Z., Lu, L., Wang, S., Zaman, S. U., Fan, C., Lolli, S., Li, Z., Dubovik, O., and Qin, K.: Observation-constrained black carbon radiative forcing from multi-sensor and multi-spectral remote sensing reveals divergent forcing pathways over Asian urban agglomerates, SSRN, https://doi.org/10.2139/ssrn.6604914, 2026a.
Tiwari, P., Cohen, J., Gao, H., and Lu, L.: Microphysical evolution and column loading drive nonlinear regional contrast in black carbon top-of-atmosphere forcing, figshare. Journal contribution [data set], https://doi.org/10.6084/m9.figshare.30006343.v1, 2026b.
Wang, D., Liang, S., He, T., Yu, Y., Schaaf, C., and Wang, Z.: Estimating daily mean land surface albedo from MODIS data, J. Geophys. Res.-Atmos., 120, 4825–4841, https://doi.org/10.1002/2015JD023178, 2015.
Wang, S., Wang, X., Cohen, J. B., and Qin, K.: Inferring Polluted Asian Absorbing Aerosol Properties Using Decadal Scale AERONET Measurements and a MIE Model, Geophys. Res. Lett., 48, e2021GL094300, https://doi.org/10.1029/2021GL094300, 2021.
Wang, S., Cohen, J. B., Guan, L., Lu, L., Tiwari, P., and Qin, K.: Observationally constrained global NOx and CO emissions variability reveals sources which contribute significantly to CO2 emissions, npj Clim. Atmos. Sci., 8, 87, https://doi.org/10.1038/s41612-025-00977-2, 2025.
Wei, J., Li, Z., Sun, L., Peng, Y., Liu, L., He, L., Qin, W., and Cribb, M.: MODIS Collection 6.1 3 km resolution aerosol optical depth product: global evaluation and uncertainty analysis, Atmos. Environ., 240, 117768, https://doi.org/10.1016/j.atmosenv.2020.117768, 2020.
Wei, J., Li, Z., Lyapustin, A., Wang, J., Dubovik, O., Schwartz, J., Sun, L., Li, C., Liu, S., and Zhu, T.: First close insight into global daily gapless 1 km PM2.5 pollution, variability, and health impact, Nat. Commun., 14, 8349, https://doi.org/10.1038/s41467-023-43862-3, 2023.
Wu, H., Taylor, J. W., Szpek, K., Langridge, J. M., Williams, P. I., Flynn, M., Allan, J. D., Abel, S. J., Pitt, J., Cotterell, M. I., Fox, C., Davies, N. W., Haywood, J., and Coe, H.: Vertical variability of the properties of highly aged biomass burning aerosol transported over the southeast Atlantic during CLARIFY-2017, Atmos. Chem. Phys., 20, 12697–12719, https://doi.org/10.5194/acp-20-12697-2020, 2020.
Wu, H., Taylor, J. W., Langridge, J. M., Yu, C., Allan, J. D., Szpek, K., Cotterell, M. I., Williams, P. I., Flynn, M., Barker, P., Fox, C., Allen, G., Lee, J., and Coe, H.: Rapid transformation of ambient absorbing aerosols from West African biomass burning, Atmos. Chem. Phys., 21, 9417–9440, https://doi.org/10.5194/acp-21-9417-2021, 2021.
Wu, L., Ciren, N., Wang, D., Meng, H., Li, M., Wang, Y., and Chen, T.: Research on simulation and validation methods of aerosol radiative forcing on the Tibetan Plateau based on satellite and ground-based remote sensing observations over the past 20 years, Atmos. Res., 107683, https://doi.org/10.1016/j.atmosres.2024.107683, 2024.
Wu, Y., Cheng, T., Liu, D., Allan, J. D., Zheng, L., and Chen, H.: Light Absorption Enhancement of Black Carbon Aerosol Constrained by Particle Morphology, Environ. Sci. Technol., 52, 6912–6919, https://doi.org/10.1021/acs.est.8b00636, 2018.
Xu, X., Yang, X., Zhu, B., Tang, Z., Wu, H., and Xie, L.: Characteristics of MERRA-2 black carbon variation in east China during 2000–2016, Atmos. Environ., 222, 117140, https://doi.org/10.1016/j.atmosenv.2019.117140, 2020.
Yang, S., Liu, Y., Chen, L., Cao, N., Wang, J., and Gao, S.: Direct radiative forcing of light-absorbing carbonaceous aerosol and the influencing factors over China, Atmos. Chem. Phys., 25, 9335–9355, https://doi.org/10.5194/acp-25-9335-2025, 2025.
Yu, H., Kaufman, Y. J., Chin, M., Feingold, G., Remer, L. A., Anderson, T. L., Balkanski, Y., Bellouin, N., Boucher, O., Christopher, S., DeCola, P., Kahn, R., Koch, D., Loeb, N., Reddy, M. S., Schulz, M., Takemura, T., and Zhou, M.: A review of measurement-based assessments of the aerosol direct radiative effect and forcing, Atmos. Chem. Phys., 6, 613–666, https://doi.org/10.5194/acp-6-613-2006, 2006.
Zaman, S. U., Islam, M. S., Roy, S., Jeba, F., and Salam, A.: Light Absorption Properties of Biomass Burning Emissions in Bangladesh: Current State of Knowledge, in: Vegetation Fires and Pollution in Asia, Springer International Publishing, Cham, 283–298, https://doi.org/10.1007/978-3-031-29916-2_17, 2023.
Zamora, M. L., Peng, J., Hu, M., Guo, S., Marrero-Ortiz, W., Shang, D., Zheng, J., Du, Z., Wu, Z., and Zhang, R.: Wintertime aerosol properties in Beijing, Atmos. Chem. Phys., 19, 14329–14338, https://doi.org/10.5194/acp-19-14329-2019, 2019.
Zangmeister, C. D., You, R., Lunny, E. M., Jacobson, A. E., Okumura, M., Zachariah, M. R., and Radney, J. G.: Measured in-situ mass absorption spectra for nine forms of highly-absorbing carbonaceous aerosol, Carbon, 136, 85–93, https://doi.org/10.1016/j.carbon.2018.04.057, 2018.
Zeb, B., Alam, K., Nasir, J., Mansha, M., Ahmad, I., Bibi, S., Malik, S. M., and Ali, M.: Black Carbon aerosol characteristics and radiative forcing over the high altitude glacier region of Himalaya-Karakorum-Hindukush, Atmos. Environ., 238, 117711, https://doi.org/10.1016/j.atmosenv.2020.117711, 2020.
Zhou, S. and Cheng, J.: A physics-based atmospheric precipitable water vapor retrieval algorithm by synchronizing MODIS near-infrared and thermal infrared measurements, Remote Sens. Environ., 317, 114523, https://doi.org/10.1016/j.rse.2024.114523, 2025.