the Creative Commons Attribution 4.0 License.
the Creative Commons Attribution 4.0 License.
Investigating the mechanism of typhoon tracks on ozone pollution episodes in Guangdong, China
Long Wang
Shucheng Chang
Minhui Li
Chong Shen
Chenghao Liao
Yongbo Zhang
Mei Li
Xuemei Wang
Ozone (O3) pollution has emerged as one of the core challenges in atmospheric environmental governance in China, particularly in Guangdong Province. As a crucial weather system during East Asian summers, typhoons exert profound influences on O3 formation, accumulation, and transboundary transport through variations in their tracks and intensities. This study examined 237 historical typhoons approaching or making landfall in China between 2013–2023 classifying them into three distinct trajectory types using k-means clustering: westward-moving typhoons (Type 1), Distant northward-recurving typhoons (Type 2) and Proximal northward-recurving typhoons (Type 3). By integrating ground-based observations, reanalysis data, and WRF-CMAQ model simulations, the mechanisms through which typhoon tracks affect ozone pollution in Guangdong Province were investigated. The results demonstrate that for Guangdong Province, proximal northward-recurving typhoons induce more extreme meteorological conditions compared to westward-moving and distant northward-moving typhoons. The analysis of consecutive northward-moving typhoons' impact on ozone pollution in Guangdong Province reveals that surface photochemical reactions served as the dominant factor, while vertical downward transport of upper-level ozone acted as a secondary contributor. Nevertheless, the long-range vertical transport induced by typhoons cannot be neglected. During this event, vertical transport contributed up to 39.9 ppbv to near-surface (100 m) ozone concentrations, with cross-boundary-layer transport accounting for up to 16 % of boundary layer ozone concentrations, demonstrating that typhoon-induced vertical transport significantly enhances boundary layer ozone levels and consequently worsens surface pollution. Additionally, analysis of the backward trajectories and 3-dimensional ozone concentration fields of 237 typhoons indicates that northward-moving typhoons significantly enhance the downward transport of ozone, consequently increasing the ozone concentration at the central point of Guangdong Province by 2.5–14.0 ppbv (Type 2) and 0.3–14.5 ppbv (Type 3) within the 250–900 hPa layer.
- Article
(7907 KB) - Full-text XML
-
Supplement
(1419 KB) - BibTeX
- EndNote
Ozone (O3) pollution has become one of the core challenges in atmospheric environmental governance in China, particularly in the Pearl River Delta region. As a typical secondary pollutant, the formation of O3 is dually regulated by precursor emissions (NOx and VOCs) and meteorological conditions. (Dou et al., 2024; Gong et al., 2025; Qiu et al., 2025; Yang et al., 2019). In recent years, despite continuous strengthening of anthropogenic emission control measures, the increasing frequency of extreme weather events has significantly amplified the complexity of O3 pollution. (Chen et al., 2022a; Lu et al., 2024; Wan et al., 2022; Wang et al., 2024a). Among these factors, typhoons, as a crucial weather system during the East Asian summer, exert profound impacts on O3 formation, accumulation, and transboundary transport through their track and intensity variations, which significantly modify regional meteorological conditions (e.g., temperature, humidity, wind speed) and atmospheric transport processes. (Chen et al., 2021; Qu et al., 2021; Shen et al., 2023; Wang et al., 2022).
Typhoons affect ozone generation, accumulation, and vertical transport by altering meteorological and circulation conditions. The peripheral subsidence flows of typhoons frequently induce high temperatures, low humidity, and stagnant weather conditions, which enhances photochemical reactions while suppressing pollutant dispersion, consequently leads to localized O3 accumulation. (Chen et al., 2022b). Meanwhile, the heat-stagnation conditions stimulate biogenic emissions (e.g., doubling isoprene concentrations), providing additional precursors for ozone formation (Xu et al., 2023). Observations and models indicate that typhoons can increase biogenic emissions and cross-boundary ozone transport by 78.0 % and 22.5 %, respectively, and more than double ozone formation efficiency (Wang et al., 2022). Additionally, typhoon systems may drive vertical transport, bringing ozone from higher altitudes down to the surface, further exacerbating pollution (Chen et al., 2021; Zhan et al., 2020; Chen et al., 2022c). However, the relative contribution of vertical transport remains debated: some studies suggest that ozone increases are primarily due to enhanced surface-level photochemical activity (Huang et al., 2021; Jiang et al., 2024; Wang et al., 2025), with subsidence mainly acting to suppress dispersion (Ding et al., 2023; Li et al., 2022; Ouyang et al., 2022), while others confirm that processes such as typhoon-induced stratospheric intrusions can directly elevate surface ozone concentrations by 10–15 ppbv (Chen et al., 2021).
Current research demonstrates that typhoon impacts on ozone pollution exhibit significant path dependence. Westward-moving typhoons induce increased net ozone production in the Pearl River Delta (PRD) core region prior to landfall, followed by a rapid decline to near-zero levels on the landfall day (Ding et al., 2023). When a typhoon approaches the land, the accompanying wind and rain effects can lead to the removal of pollutants, leading to negative ozone anomalies over the Yangtze River Delta region (Chen et al., 2021). When typhoons track northward across the Taiwan Strait through the low-latitude western Pacific, they trigger sequential regional ozone pollution episodes in both the Yangtze River Delta (YRD) and Pearl River Delta (PRD) regions (Wang et al., 2022). The northerly peripheral circulation of the typhoons transports precursors from North China and the Yangtze River Delta (YRD) southward, which, when superimposed with local emissions, triggers abrupt ozone concentration increases(Shen et al., 2023). Successive northward-moving typhoons can elevate O3 concentrations by 30 % across eastern China while prolonging pollution duration (Wang et al., 2024a). Furthermore, the interaction between typhoons and the subtropical high can form a compound weather system, which exacerbates O3 pollution intensity and prolongs its duration (Gao et al., 2020; Han et al., 2020; Qin et al., 2020).
However, current research predominantly focuses on individual typhoon cases or isolated meteorological factors (Kumar et al., 2023; Li et al., 2023a; Zhan et al., 2020), leaving significant gaps in comparative analyses of mechanisms associated with different typhoon tracks. The key scientific questions include: How do different movement paths of typhoons separately regulate meteorological conditions and regional transport? How do large-scale circulation changes induced by varying typhoon tracks influence the vertical distribution of ozone? The systematic exploration of these issues will deepen our understanding of the interaction mechanism between typhoons and ozone.
As a high-frequency typhoon landing region, Guangdong Province exhibits particularly strong correlations between ozone pollution and typhoon activity (Shuping et al., 2022; Yaoyao et al., 2022). Statistical analyses reveal that over 80 % of ozone exceedance days during Guangdong's summer-autumn seasons from 2015–2021 were typhoon-associated (Shen et al., 2023). Under climate change scenarios, observed trends of northward-shifting typhoon tracks and intensifying storm strength may further alter regional ozone pollution patterns (Guo and Tan, 2022). Consequently, elucidating the mechanistic links between typhoon paths and ozone pollution holds dual significance: advancing regional atmospheric multipollutant theory while providing scientific foundations for dynamic, precision-based ozone control strategies.
This study systematically investigates all typhoons near Guangdong Province from 2013 to 2023 by integrating multi-source observational data and numerical simulations. Through comprehensive classification of typhoon tracks, we conduct in-depth analyses of the relationships between meteorological factors, circulation patterns, atmospheric transport, and three-dimensional ozone distribution under different typhoon paths. Specifically, we examine the contribution of upper-level transport to boundary layer ozone concentrations during typical typhoon events. The research aims to elucidate the differential impacts of various typhoon tracks on O3 pollution in Guangdong region, thereby providing scientific support for refined air quality management strategies.
2.1 K-means Clustering Analysis
K-means represents one of the most prevalent partition-based clustering methods. The algorithm categorizes n objects into K clusters based on a predefined parameter K, aiming to minimize the within-cluster sum of squares (WCSS) while maximizing the between-cluster sum of squares (BCSS). This ensures high intra-cluster similarity and low inter-cluster similarity. The K-means algorithm has been widely applied in atmospheric trajectory classification studies due to its effectiveness in identifying characteristic transport patterns (Han et al., 2020; Yufeng et al., 2024; Zhu et al., 2023).
In this study, we performed two distinct clustering analyses using the K-means method: typhoon track clustering and atmospheric transport pathway clustering. For typhoon track clustering: (1) Targeted typhoon tracks over the western Pacific Ocean; (2) Employed Euclidean distance metric for data point allocation; (3) Determined the optimal K value by identifying the elbow point where the rate of WCSS decrease substantially diminished; (4) Selected K=3 as the optimal cluster number, yielding three distinct typhoon track types (Fig. S1 in the Supplement). For atmospheric transport pathway clustering: (1) Analyzed 7 d three-dimensional backward trajectories; (2) Classified atmospheric transport channels into four categories (Fig. S2 in the Supplement); (3) Implemented similar optimization procedures for cluster determination. The methodology ensures statistically robust classification of both typhoon trajectories and associated air mass transport patterns, providing a quantitative basis for subsequent ozone transport analysis.
2.2 HYSPLIT Trajectory Model
HYSPLIT is a complete system for computing simple air parcel trajectories, as well as complex transport, dispersion, chemical transformation, and deposition simulations. A common application is a back trajectory analysis to determine the origin of air masses and establish source-receptor relationships (Rolph et al., 2017; Stein et al., 2015).
This study employs the NOAA HYSPLIT Trajectory Model (https://www.ready.noaa.gov/HYSPLIT_traj.php, last access: 10 February 2025) to conduct backward trajectory simulations for 237 typhoons in the Western Pacific region between 2013 and 2023. The meteorological data used is GDAS (1° resolution). The source location is set at 23.6° N, 113.5° E, with the backward trajectories initiated at 14:00 LT (local time) on the day of peak ozone pollution during each typhoon event. The backward simulation runs for 168 h (7 d), with trajectory heights set at 500, 1000, and 2000 m above ground level ().
2.3 WRF-CMAQ
The WRF-CMAQ modeling system was employed to simulate meteorological fields and ozone concentration variations during the typhoon process. The WRF (Weather Research and Forecasting) model version 3.9 was configured with the following parameterizations: Microphysics, WSM6 Scheme; Cumulus Parameterization: Grell–Freitas (GF) Scheme; Radiation: RRTMG Scheme; Boundary Layer: YSU Scheme; Surface Layer: MM5 Similarity Theory; Land Surface: Noah LSM. The large-scale meteorological fields and boundary conditions were derived from NCEP's Global 6-hourly FNL forecast data. The CMAQ (Community Multiscale Air Quality) model version 5.0.2 was implemented with the IPR (integrated process rate) analysis module. The CB05 mechanism was selected for gas-phase chemistry, while the AE6 mechanism was adopted for aerosol chemistry.
The modeling system utilized a triple-nested grid configuration (see Fig. S3 in the Supplement) with Lambert conformal projection centered at 28.5° N, change 114° E and two standard parallels at 15 and 40° N. The outermost domain (D01) had a horizontal resolution of 27 km × 27 km, covering China, Southeast Asia and the western Pacific region. The intermediate domain (D02) featured a 9 km × 9 km resolution encompassing South China, while the innermost domain (D03) employed a 3 km × 3 km resolution focusing on Guangdong Province and surrounding cities. The vertical structure consisted of 14 layers with the model top set at 200 hPa. For the first and second nested domains, the air pollutant emission inventory adopted was the 0.25° × 0.25° MEIC (Multi-resolution Emission Inventory for China) developed by Tsinghua University for the year 2020. For the third (innermost) domain, a higher-resolution 3 km × 3 km emission inventory compiled by the research team (Li et al., 2023b) was utilized. The simulation period spanned from 00:00 UTC on 24 August to 00:00 UTC on 31 August 2020.
In the present study, O3 was used as a model pollutant to analyze the effects of atmospheric processes on the pollutants' value in deep convection events by using Integrated Process Rate (IPR) analysis. The IPR analysis in CMAQ can be used to calculate the influence of different atmospheric processes on the values of pollutants, and to quantify the importance of each process in the evolution of the pollutant value (Chen et al., 2018; Chen et al., 2022a). The processes include gas-phase chemistry (CHEM),vertical advection (ZADV), horizontal advection (HADV), vertical diffusion (VDIF), horizontal diffusion (HDIF), dry deposition(DDEP) and cloud processes (CLDS).
3.1 Typhoon track data
The typhoon track data were obtained from the CMA Best Track Dataset (https://tcdata.typhoon.org.cn, last access: 9 October 2024) maintained by the Tropical Cyclone Data Center of China Meteorological Administration. This dataset provides 6-hourly positional and intensity records of tropical cyclones in the Northwest Pacific (including the South China Sea, north of the equator and west of 180° E) since 1949, covering all typhoons approaching/making landfall in China, with a spatial resolution of 0.1° × 0.1° (Lu et al., 2021; Ying et al., 2014). For this study, we extracted all typhoon track data from 2013, to 31 December 2023, including temporal, geographical coordinates (longitude and latitude), and intensity information. After interpolating the data, we performed typhoon track classification using the K-means clustering method.
3.2 Ozone data
The ground-level ozone monitoring data were obtained from the China National Environmental Monitoring Center (CNEMC). This dataset contains hourly concentrations of SO2, NO2, CO, O3, PM10, and PM2.5 from 1657 monitoring stations across China. For this study, we extracted hourly O3 data from 105 stations within Guangdong Province (station locations are shown in Fig. S3). Following the “Technical Regulation on Ambient Air Quality Index (on trial)” (HJ 663-2013), we calculated the daily maximum 8 h average ozone concentration (MDA8 O3). Days with MDA8 O3 concentrations exceeding 160 µg m−3 (approximately 75 ppbv) were identified as ozone exceedance days.
The TROPESS Chemical Reanalysis O3 Increment 6-Hourly 3-dimensional Product V1 dataset from NASA was utilized to investigate the three-dimensional spatial distribution of ozone under typhoon conditions (https://disc.gsfc.nasa.gov/datasets/TRPSCRO3I6H3D_1/summary, last access: 29 November 2024). The data are part of the Tropospheric Chemical Reanalysis v2 (TCR-2) for the period 2005–2021. TCR-2 uses JPL's Multi-mOdel Multi-cOnstituent Chemical (MOMO-Chem) data assimilation framework that simultaneously optimizes both concentrations and emissions of multiple species from multiple satellite sensors. The data files contains a year of data at 6-hourly resolution, and a spatial resolution of 1.125° × 1.125° at 27 pressure levels between 1000 and 60 hPa. This study extracted data from 1 January 2013 to 31 December 2021 for spatial analysis of ozone distribution.
3.3 Meteorological data
Meteorological data from ERA5 (the fifth-generation European Mesoscale Weather Forecasting Center reanalysis of global climate and weather for the past four to seven decades) was also adopted in order to understand the pollution characteristics. The temporal resolution of the data is hourly and the spatial resolution is 0.25° × 0.25°. The parameters extracted herein include 2 m temperature, surface relative humidity, total cloud cover, downward UV radiation at the surface, total precipitation, mean sea level pressure, the u-component and v-component of wind at the 10 m, 175 and 900 hPa level, boundary layer height, vertical velocity at the 850 hPa level, the Geopotential at the 175 and 900 hPa level (https://cds.climate.copernicus.eu/cdsapp#!/dataset/reanalysis-era5-single-levels?tab=overview, last access: 13 December 2024).
3.4 Ground-level ozone reanalysis dataset
The ground-level MDA8 O3 concentrations across China were obtained from the China 1 km High-Resolution Daily Ground-Level Ozone (O3) Dataset (2000–2023), a high-resolution (1 km) product developed by Wei et al. and hosted on the National Earth System Science Data Sharing Platform (http://geodata.nnu.edu.cn, last access: 13 February 2025) (Wei et al., 2022). This dataset was generated through an ensemble learning approach combining multi-source data, including hourly O3 measurements from ∼ 940 to 1630 monitoring stations (2013–2020) under China's Ministry of Ecology and Environment (MEE) network, OMI/Aura total-column O3 and tropospheric NO2 retrievals, downward solar radiation (DSR) and surface air temperature (TEM) from ERA5 reanalysis (0.1° resolution), emissions of NOx, VOCs, and CO from MEIC inventory, land cover from MODIS, elevation from SRTM, and population density from LandScan. The subset of data from 1 January 2013 to 31 December 2023, was temporally aligned with recorded typhoon tracks to assess the spatio-temporal variability of O3 during periods with distinct typhoon track types.
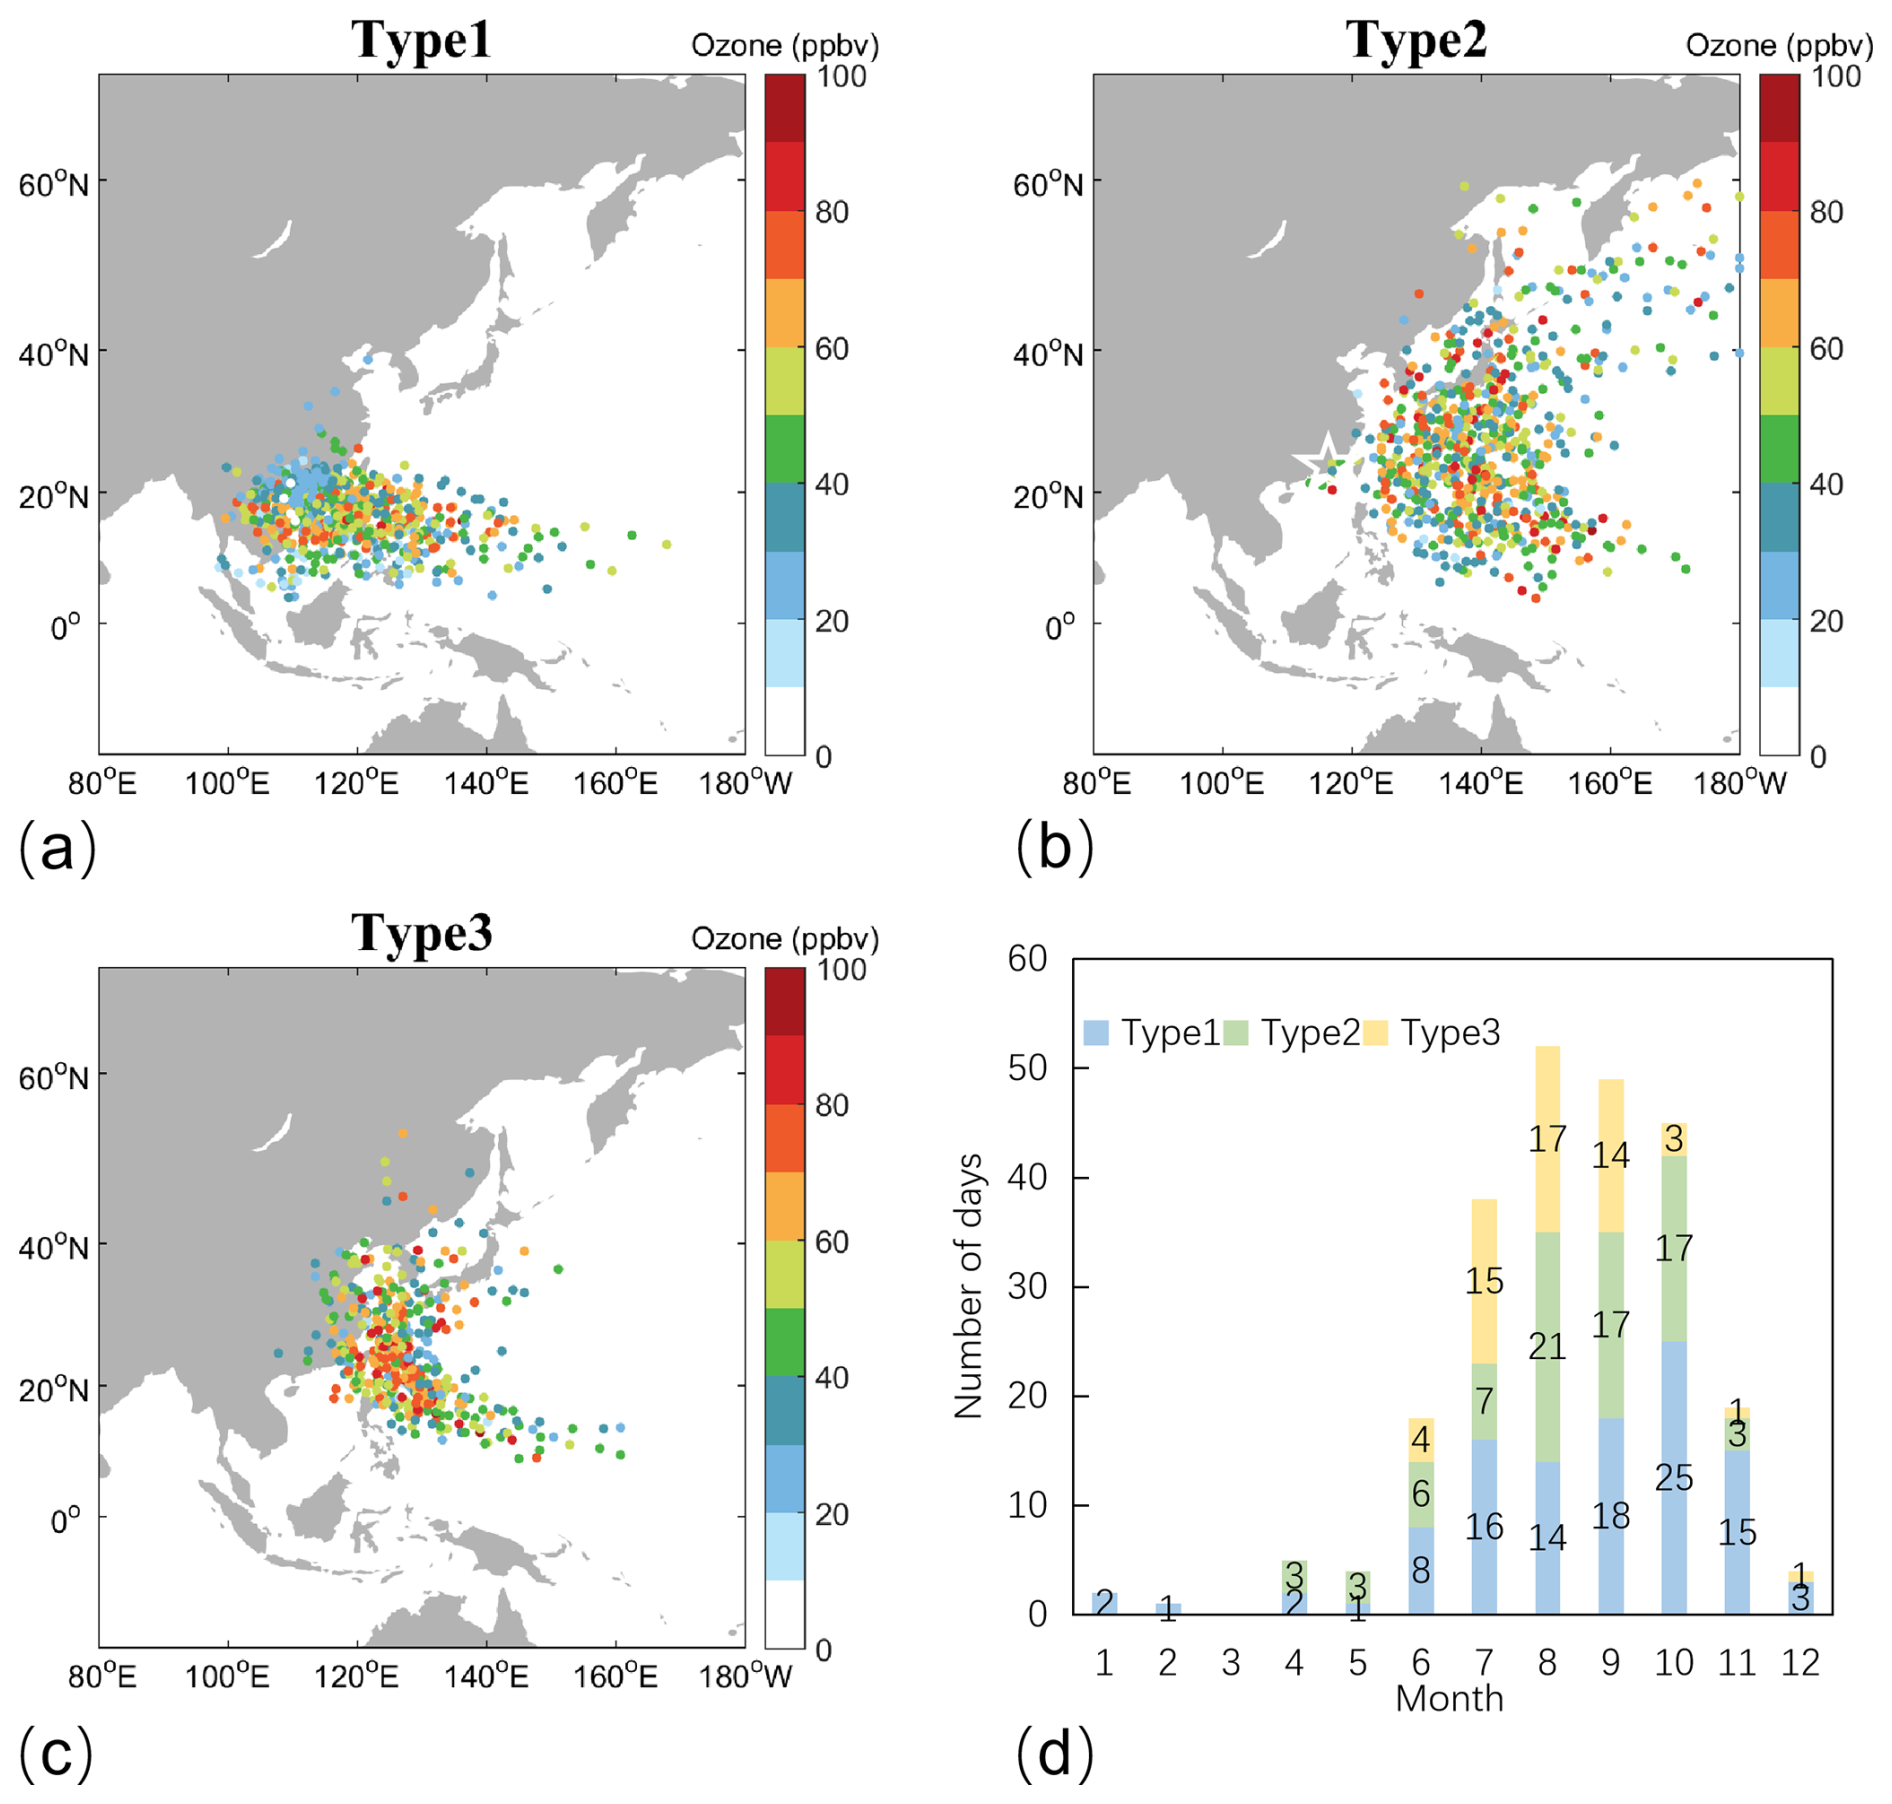
Figure 1(a–c) Maximum daily 8 h average (MDA8) ozone concentrations in Guangdong Province (marked by red pentagrams) under different typhoon tracks(Different colors of dots represent the average ozone concentration at all monitoring stations in Guangdong Province when the typhoon is at that location), and (d) the corresponding temporal distributions of typhoon occurrences for each track type.
4.1 Characteristics of ozone pollution under different typhoon paths
4.1.1 Typhoon track clustering
Through k-means clustering analysis, the 237 typhoon tracks over the western Pacific from 2013 to 2023 were classified into three distinct types (Fig. 1a–c). Type 1 comprises typhoons that form in the western Pacific, move into the South China Sea, and subsequently make landfall in South China or pass through its southern maritime areas (total: 105 cases). Type 2 consists of typhoons originating from low-latitude regions of the western Pacific that approach China before recurring northward, traversing Japan and Korea before returning to the western Pacific basin (total: 77 cases). Type 3 represents typhoons generated in low-latitude western Pacific regions that approach China and recurve northward, ultimately making landfall in China or dissipating near Japan/Korea (total: 55 cases).
For clarity, these three typhoon types are, respectively designated as: Type 1: Westward-moving typhoons; Type 2: Distant northward-recurving typhoons; Type 3: Proximal northward-recurving typhoons. Temporal distribution analysis (Fig. 1d) reveals that both Type 1 and Type 2 primarily occur from July to November, with peak frequency in autumn, while Type 3 is predominantly observed from July to September, showing maximum occurrence during summer.
4.1.2 Characteristics of ozone pollution
Figure 1a–c illustrate the temporal evolution of maximum daily 8 h average ozone (MDA8) concentrations in Guangdong Province in relation to typhoon track movements. From the perspective of ozone pollution characteristics, during the approach of Type 1 typhoons toward mainland China, ozone concentrations in Guangdong Province exhibit a gradual increase. If the typhoon does not make landfall, ozone concentrations remain elevated until the typhoon dissipates. However, if the typhoon makes landfall, ozone concentrations decrease rapidly due to precipitation and strong winds (Fig. 1a). Recent studies highlight the dual effects of typhoons on ozone: initial stages often enhance ozone through photochemical processes and stratospheric intrusions, whereas landfall phases suppress it via convective activity and precipitation (Chen et al., 2021; Li et al., 2021). Typhoons of Type 2 can affect the ozone concentration in Guangdong Province from a relatively distant location from the mainland. The paths of typhoons causing ozone pollution mainly fall within the range of 15–40° N and 130–150° E (Fig. 1b). This phenomenon may be associated with large-scale transport of ozone and its precursors. Typhoons of Type 3 tend to induce ozone pollution in Guangdong when approaching eastern China, with peak ozone concentrations occurring when the typhoon reaches approximately 25° N latitude. Following typhoon landfall or eastward deflection, ozone concentrations decrease (Fig. 1c).
Figure 2Distribution of ozone pollution under different typhoon paths.
We extracted the MDA8 O3 concentrations during each typhoon event and calculated Type-specific averages to examine ozone distribution patterns in Guangdong under different typhoon types (Fig. 2). The results demonstrate that: Type 1 corresponds to MDA8 O3 concentrations ranging 9.2–70.9 ppbv, with an average of 20 monitoring stations exceeding standards. Type 2 shows MDA8 O3 concentrations of 12.2–90.3 ppbv, averaging 34 exceedance stations. Type 3 exhibits MDA8 O3 concentrations of 3.3–89.7 ppbv, with 35 stations exceeding limits on average. The spatial analysis reveals that ozone hotspots for all types consistently cluster in central Guangdong, indicating similar spatial distribution patterns despite varying intensity. Type 3 exhibited the highest number of non-compliant monitoring sites, while Type 1 showed the lowest count.
4.1.3 Meteorological characteristics
To investigate the influence of meteorological factors on ozone pollution in Guangdong Province under different typhoon tracks, we compared the differences in meteorological conditions between three types of typhoon weather and non-typhoon weather in Guangdong. Typhoon conditions refer to the day with the most severe pollution during the typhoon event, while non-typhoon conditions correspond to the remaining periods after excluding the entire typhoon process. Select the period from June to November when typhoons are most frequent to compare the meteorological differences between typhoon and non-typhoon weather conditions. The meteorological factors analyzed included surface temperature, total cloud cover, surface solar radiation, precipitation, surface relative humidity, boundary layer height, 10 m wind speed, and vertical velocity at 850 hPa. All meteorological data were extracted from ERA5 at 14:00 LT for comparative analysis.
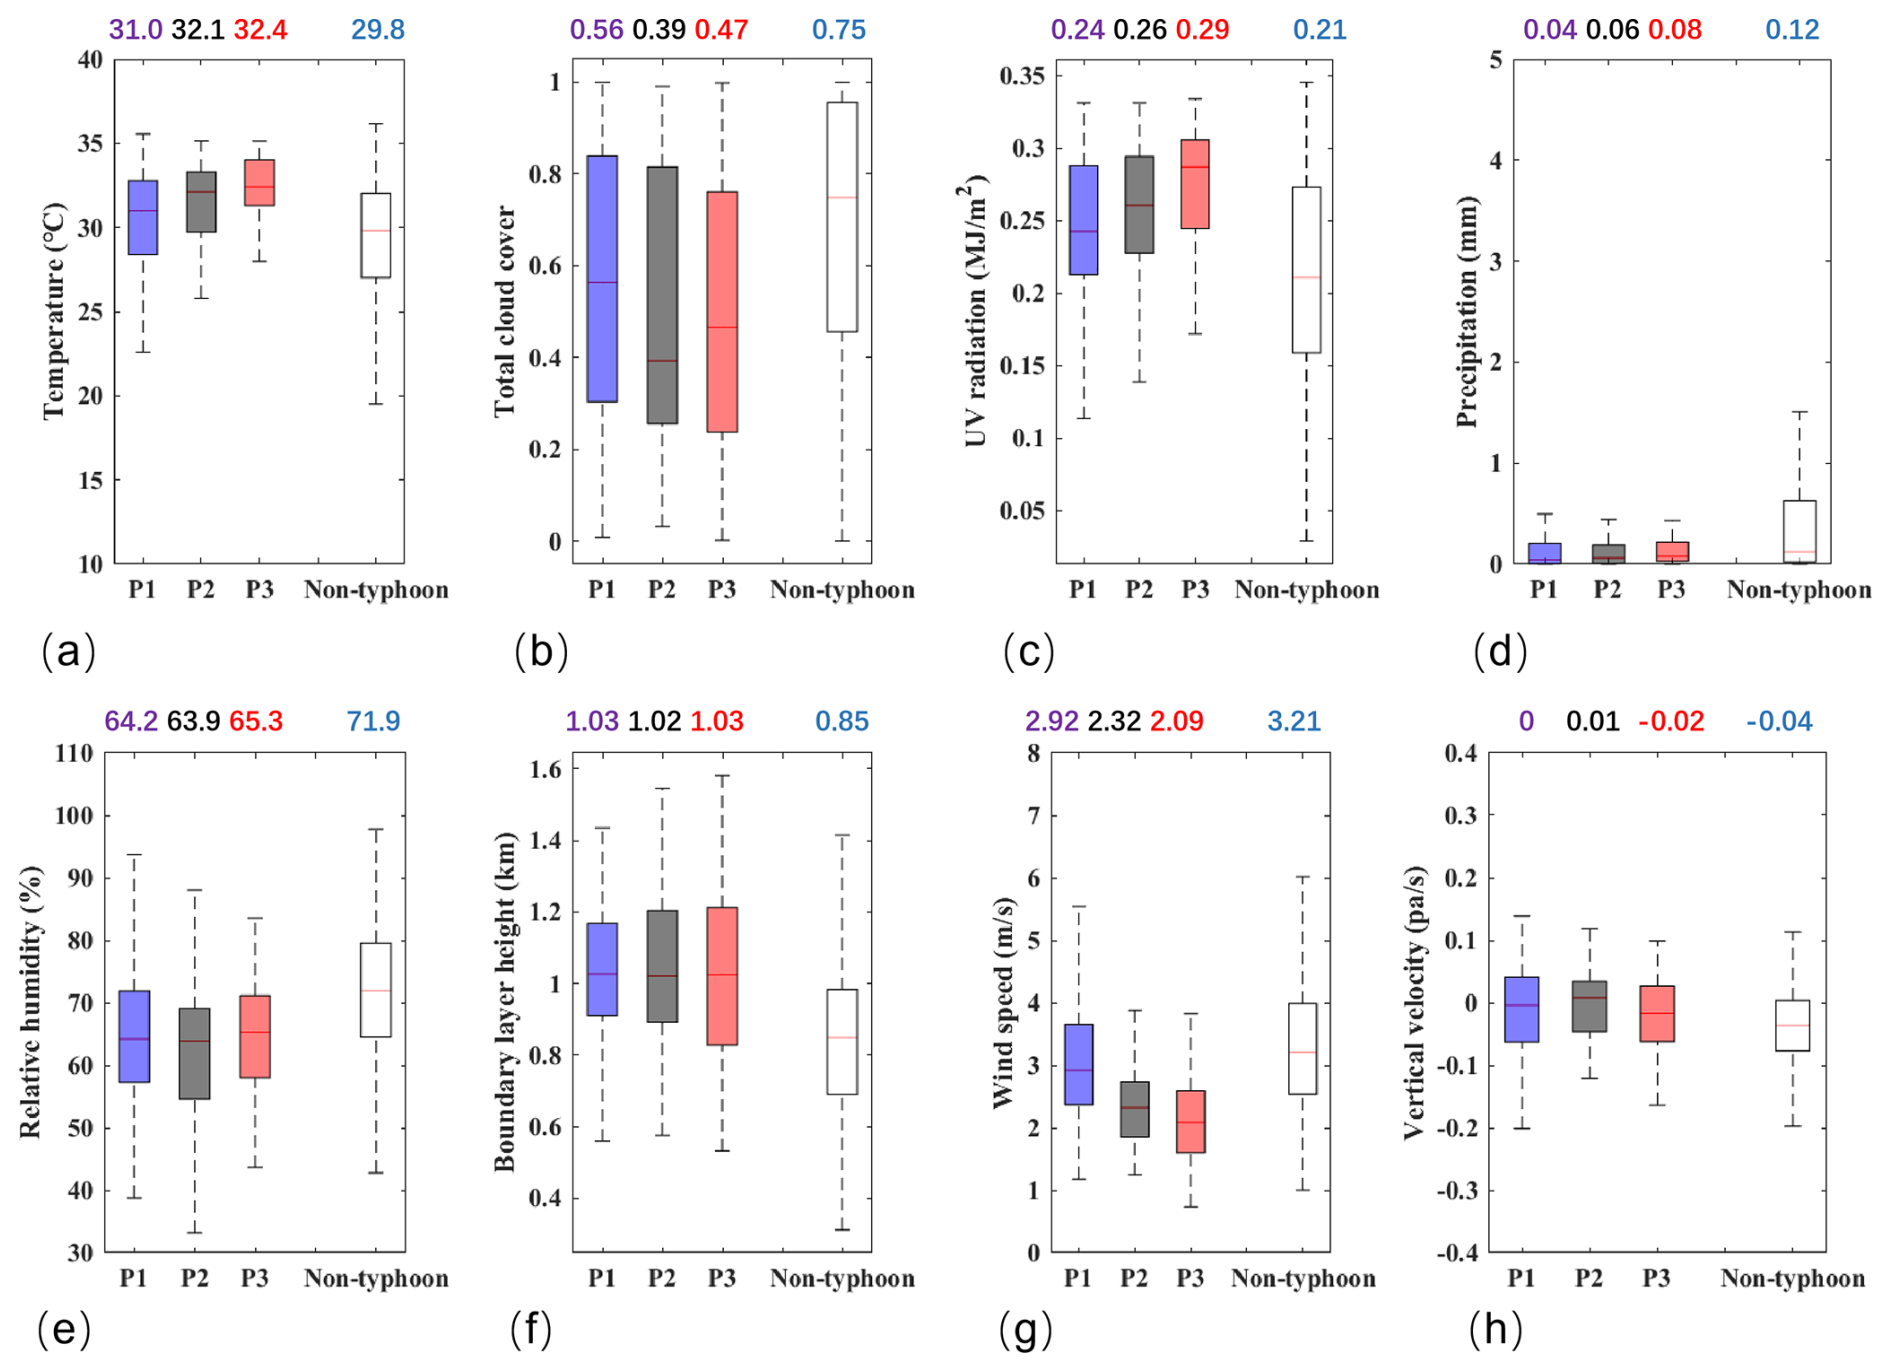
Figure 3Comparison of meteorological conditions between typhoon and non-typhoon weather. (a–f) represent 2 m temperature, total cloud cover, surface solar radiation, precipitation, relative humidity, boundary layer height, 10 m wind speed, and vertical velocity at 850 hPa, respectively. P1, P2, and P3 denote three distinct typhoon tracks, while Non-typhoon refers to non-typhoon conditions. The numerical values above each boxplot indicate the median of the corresponding dataset.
The results indicate that, compared to non-typhoon weather, typhoon weather in Guangdong is characterized by higher temperatures, stronger solar radiation, lower cloud cover, reduced precipitation, lower relative humidity, higher boundary layer height, weaker surface winds, and suppressed vertical motion (Fig. 3). The peripheral circulation of typhoons modifies the thermodynamic and dynamic structure of the boundary layer, creating an “ideal reactor” for ozone formation. Near-surface conditions of high temperatures, low humidity, and weak winds foster a stable boundary layer structure, significantly enhancing photochemical reaction rates (Ding et al., 2023). Additionally, increased solar radiation and elevated boundary layer height further expand the spatial domain for ozone production.
A comparison of meteorological characteristics across different typhoon track types reveals that Type 3 corresponds to what may be termed “extreme” meteorological conditions. It brings high temperature(32.4°), high radiation (0.29 MJ m−2), low cloud cover (0.47), low precipitation (0.08 mm), low relative humidity (65.3 %), high boundary layer height (1.03 km), low wind speed(2.09 m s−1), and less vertical movement (−0.02 pa s−1) meteorological conditions, which are more likely to cause ozone pollution in Guangdong Province. Compared to non-typhoon conditions, Type 3 exhibits a temperature increase of 2.6 °C, a cloud cover reduction of 0.28, a radiation intensity enhancement of 0.08 MJ m−2, and a boundary layer height elevation of 0.18 km. It demonstrates the poorest horizontal diffusion conditions, with a near-surface wind speed of 1.12 m s−1 lower than non-typhoon conditions. The severe ozone pollution observed in Guangdong Province results from the combined effects of strong ozone production rates and poor diffusion conditions, creating a synergistic amplification of pollution levels. The photochemical reaction conditions in Type 2 are slightly weaker than those in Type 3; however, reduced precipitation inhibits the wet scavenging of ozone and its precursors. Additionally, strong subsidence at the 850 hPa level not only suppresses the vertical diffusion of pollutants within the boundary layer but also transports ozone from higher altitudes downward, further increasing surface ozone concentrations. Compared to the other two typhoon types, Type 1 exhibits weaker ozone formation conditions and better dispersion, resulting in the least severe ozone pollution.
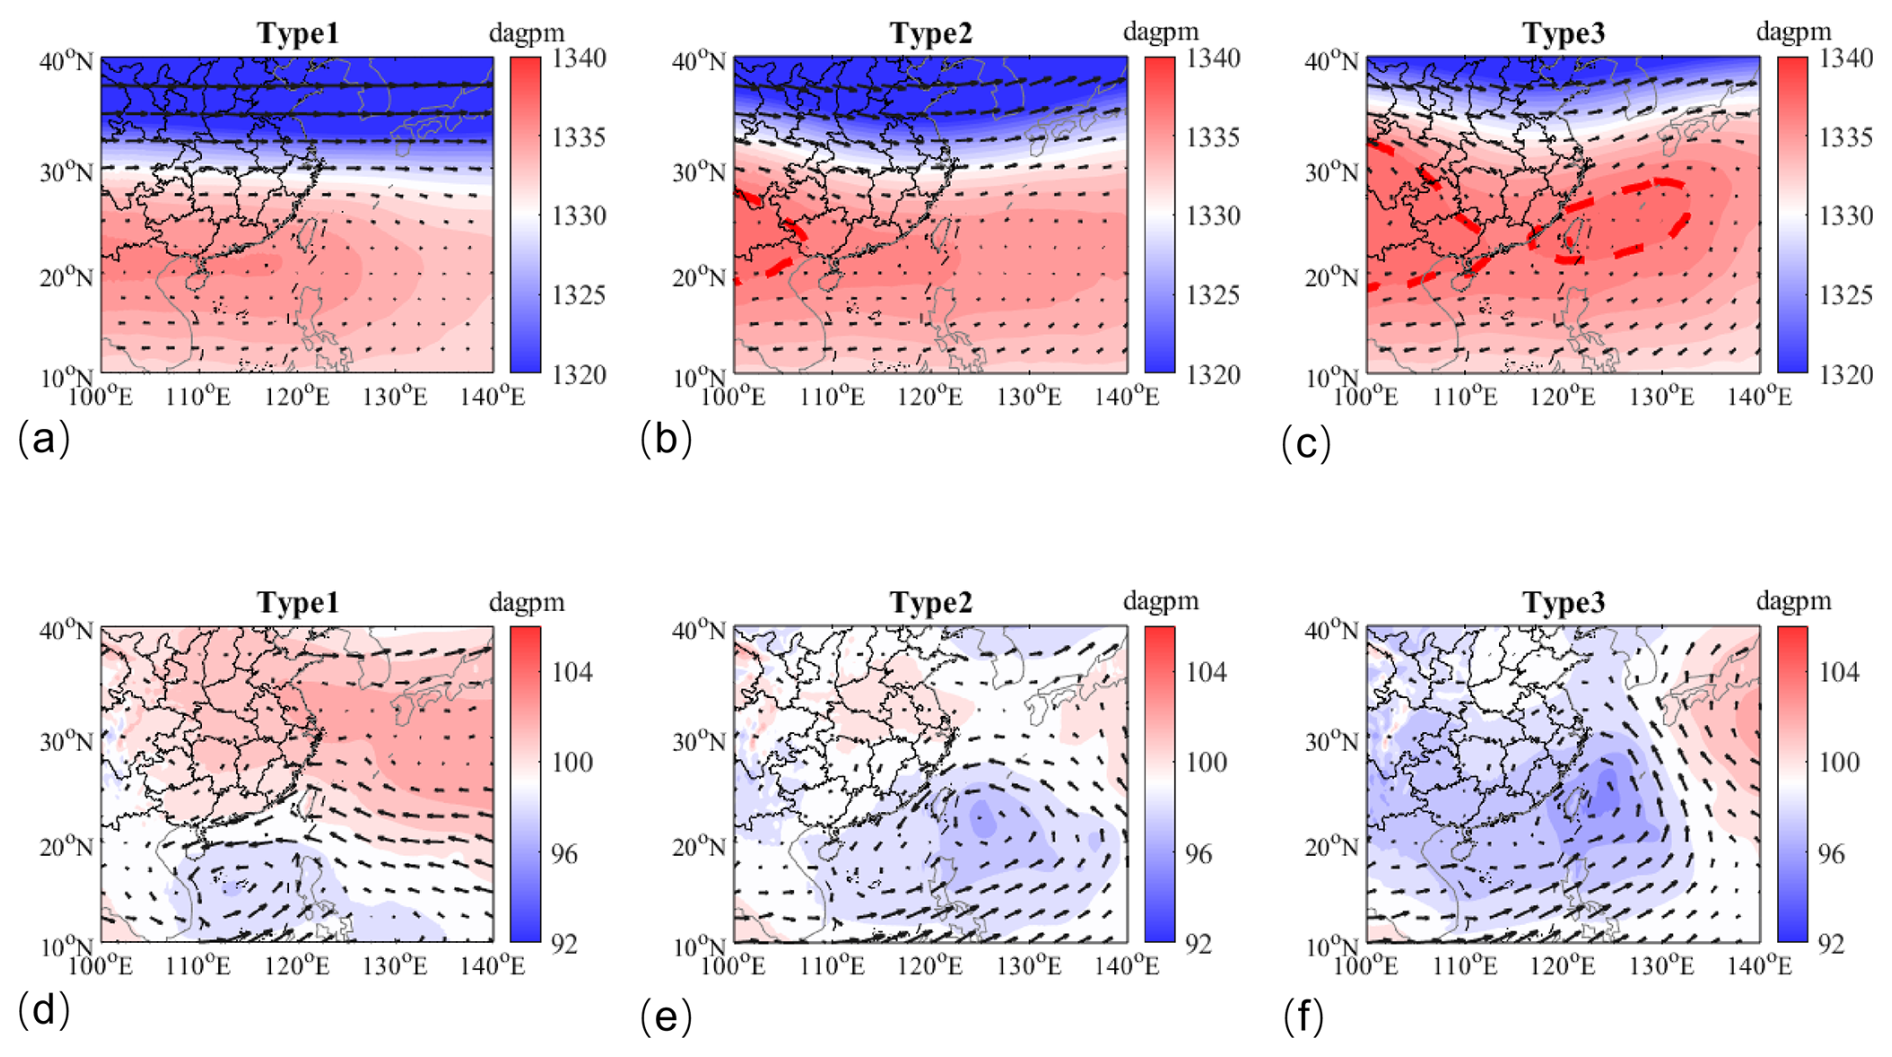
Figure 4Comparison of circulation patterns under different typhoon tracks. (a–c) show geopotential height and wind fields at 175 hPa (upper panels) and 900 hPa (lower panels), respectively. The red curves indicate the positions of high-pressure centers.
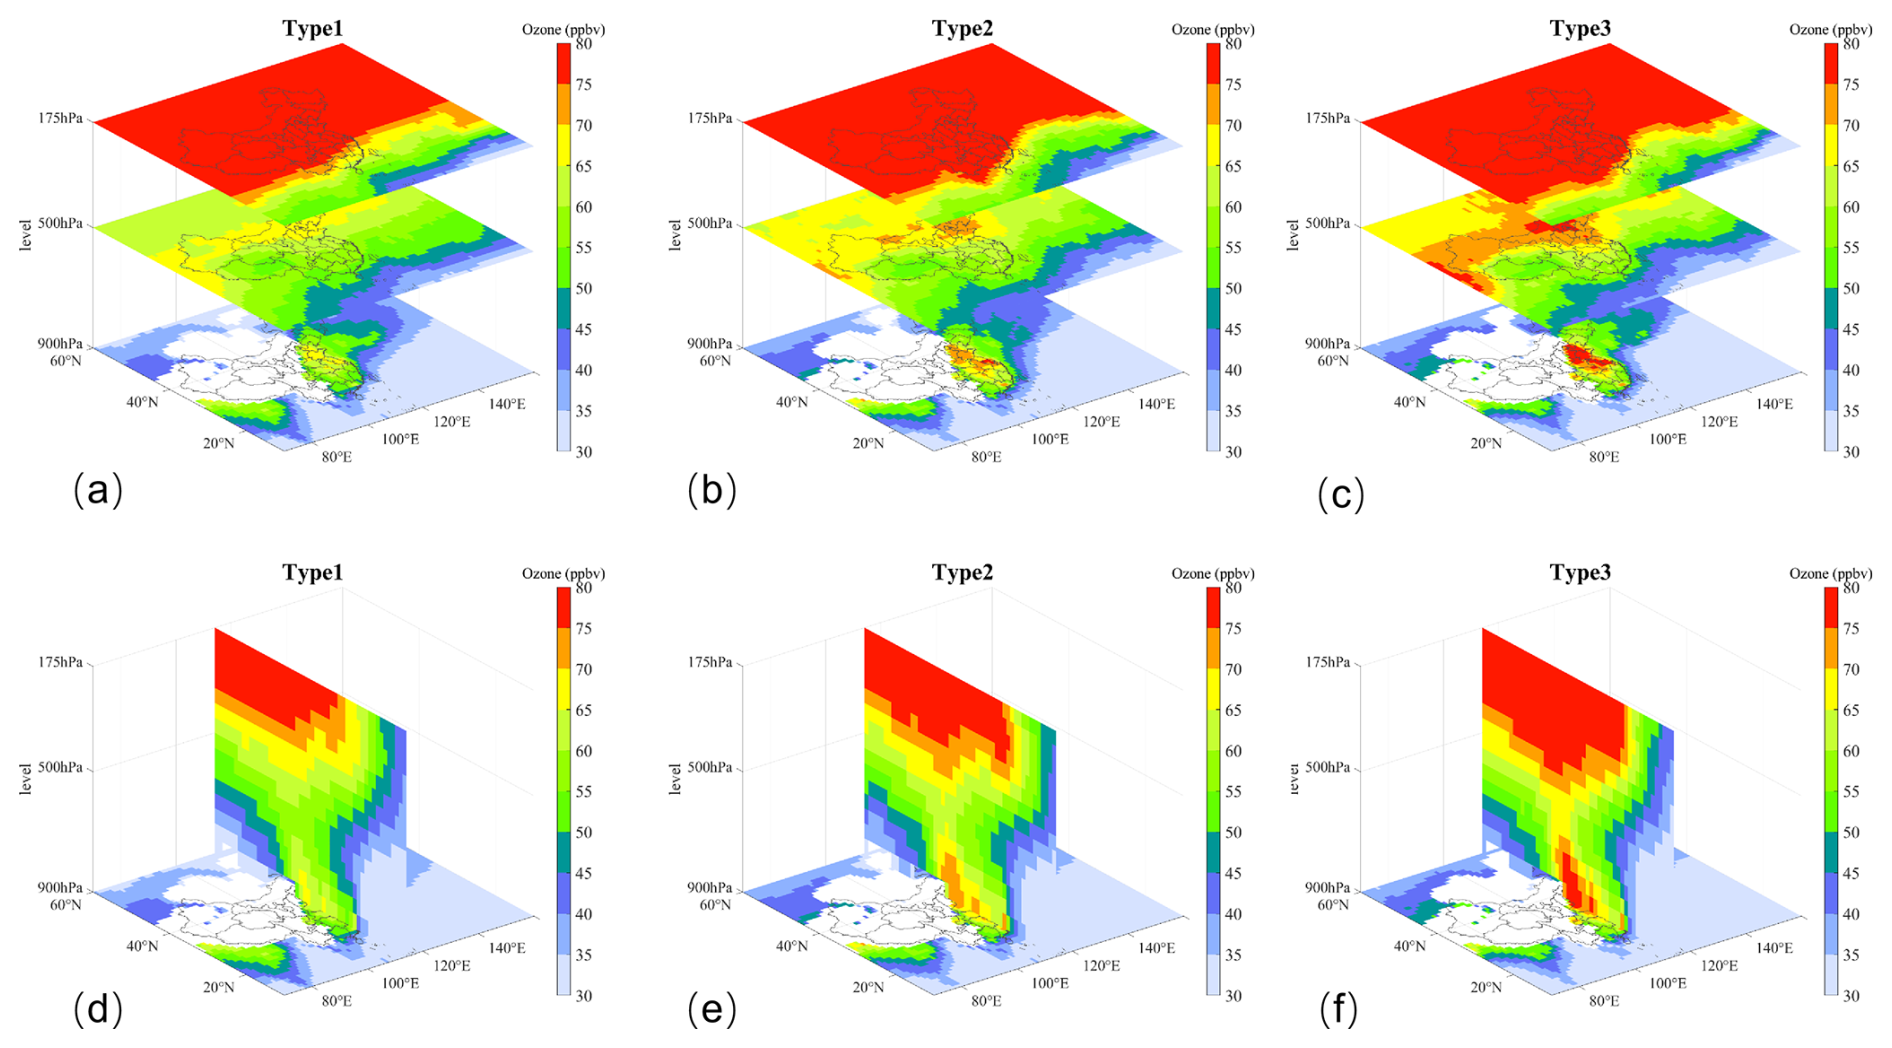
Figure 5Three-dimensional spatial distribution of ozone under different typhoon tracks. (a–c) Horizontal ozone distributions at 900, 500, and 175 hPa for the three typhoon track types. (d–f) Horizontal ozone distributions at 900 hPa and corresponding vertical cross-sections along 114° E for each typhoon type.
4.2 Effect of regional transport on ozone distribution
4.2.1 Three-dimensional spatial distribution of ozone
The impact of typhoons on ozone extends beyond creating favorable photochemical conditions. The regional transport induced by large-scale circulation plays a pivotal role in determining ozone concentration distribution (Chen et al., 2022b; Wang et al., 2018). Typhoon tracks modify regional airflow patterns, facilitating cross-regional transport of ozone and its precursors (Chen et al., 2021). This study employs three-dimensional reanalysis O3 data (2013–2021) coupled with wind fields and geopotential height to examine how typhoon-induced regional transport affects the three-dimensional spatial distribution of ozone concentrations (Figs. 4 and 5). When the typhoon moves northward (type 2 and type3), a high-pressure center emerges over western China at the 175 hPa level, aligned with the westerly jet to the north, an ozone transport pathway is established, extending from high to low latitudes and accompanied by subsidence (Fig. 4b and c). Specifically, Fig. 4c shows a configuration featuring two distinct, separated anticyclones (the South Asian High (SAH) over the Tibetan Plateau and the western Pacific Subtropical High (WPSH) aloft) with a prominent saddle zone and upper-level convergence between them at 175 hPa. Dynamically, such a setup provides a classic pathway for significant stratospheric ozone intrusion. A tropopause fold, often triggered on the northeastern flank of the SAH where it interacts with the enhanced westerly jet stream, injects a substantial volume of ozone-rich, dry stratospheric air into the upper troposphere. Subsequently, the pronounced subsidence within the saddle zone – induced by the convergence between the SAH and WPSH – effectively transports this intruded air mass downward and southward, directing it toward eastern China and the adjacent oceanic regions. The periphery of typhoon with type 3 tracks could enhance the southward and downward transport of stratospheric ozone, which enhances stratosphere-to-boundary-layer transport of ozone-rich air from the mid-high latitudes (Meng et al., 2022). Through this transport channel, stratospheric ozone with high concentrations (> 75 ppbv) is advected southward to approximately 20° N and descends below the 500 hPa level (Fig. 5e and f). In contrast, westward-propagating typhoons (Type 1) do not generate perturbations in the westerly jet, and no pronounced southward transport or subsidence of upper-level ozone is evident (Fig. 5a and d).
As demonstrated by recent studies (Wang et al., 2022; Yufeng et al., 2024), the peripheral circulation of western North Pacific typhoons can effectively transport ozone and its precursors from source regions (including the Yangtze River Delta, Fujian, and Anhui provinces) to Guangdong through well-organized atmospheric transport pathways. Analysis of ozone distribution at the 900 hPa level reveals that northward-moving typhoons not only induce ozone pollution in Guangdong, but also lead to elevated ozone concentrations in the Beijing–Tianjin–Hebei and Yangtze River Delta regions (Fig. 5b and c). During the typhoon's northward progression, the low-pressure center traverses China's eastern coastal areas, where cyclonic circulation facilitates southward transport of pollutants along the coast, ultimately impacting Guangdong Province (Fig. 4e and f).
Figure S5 in the Supplement presents the spatial distribution of ground-level MDA8 O3 concentrations across China, as derived from the reanalysis 1 km high-resolution daily dataset, under three distinct typhoon track types (type 1, type 2, and type 3). The analysis focuses on typhoon events, characterized as the date with the highest number of ground monitoring sites exceeding the 160 µg m−3 (∼ 75 ppbv) MDA8 O3 threshold during the entire typhoon track.
Being consistent with spatial distribution of ground monitoring O3 concentrations in Sect. 4.1.2, here reveals significant spatial heterogeneity in O3 concentrations across typhoon track types, particularly in Guangdong Province, where the mean MDA8 O3 follows the order: Type 2 (56.9 ppbv) > Type 3 (54.6 ppbv) > Type 1 (51.25 ppbv). This variability is attributed to differences in regional transport pathways and precursor availability. Specifically, type 2 typhoons exhibit elevated O3 levels in eastern China but reduced concentrations in northern and central regions compared to type 3. The enhanced O3 under type 2 conditions is driven by two synergistic mechanisms: (1) intensified low-tropospheric transport along China's eastern coastal region, as evidenced by atmospheric circulation patterns (Fig. 4e), and (2) the advection of O3-rich air masses from northern and central China, which supply abundant precursors to Guangdong, particularly its eastern sector. Type 3 typhoons facilitate a more direct, meridional transport of O3 from northern and central China, coupled with pronounced stratospheric intrusions that enhance upper-tropospheric O3 contributions (Fig. 5c and f). While type 2 systems lack the robust northern transport pathway observed in type 3, they compensate via secondary O3 delivery through coastal advection, which subsequently propagates inland. This dual transport mechanism culminates in the highest O3 concentrations in Guangdong, especially the eastern and coastal part, during type 2 events.
Collectively, integrating atmospheric dynamics (Fig. 4), three dimensional evolution of O3 (Fig. 5), and ground-level O3 distributions (Fig. S5), underscores the critical role of typhoon-track-dependent transport pathways in modulating regional O3 pollution. These highlight the necessity of considering multi-scale meteorological processes in air quality forecasting and quantifying their contributions to O3 concentrations across different vertical levels.
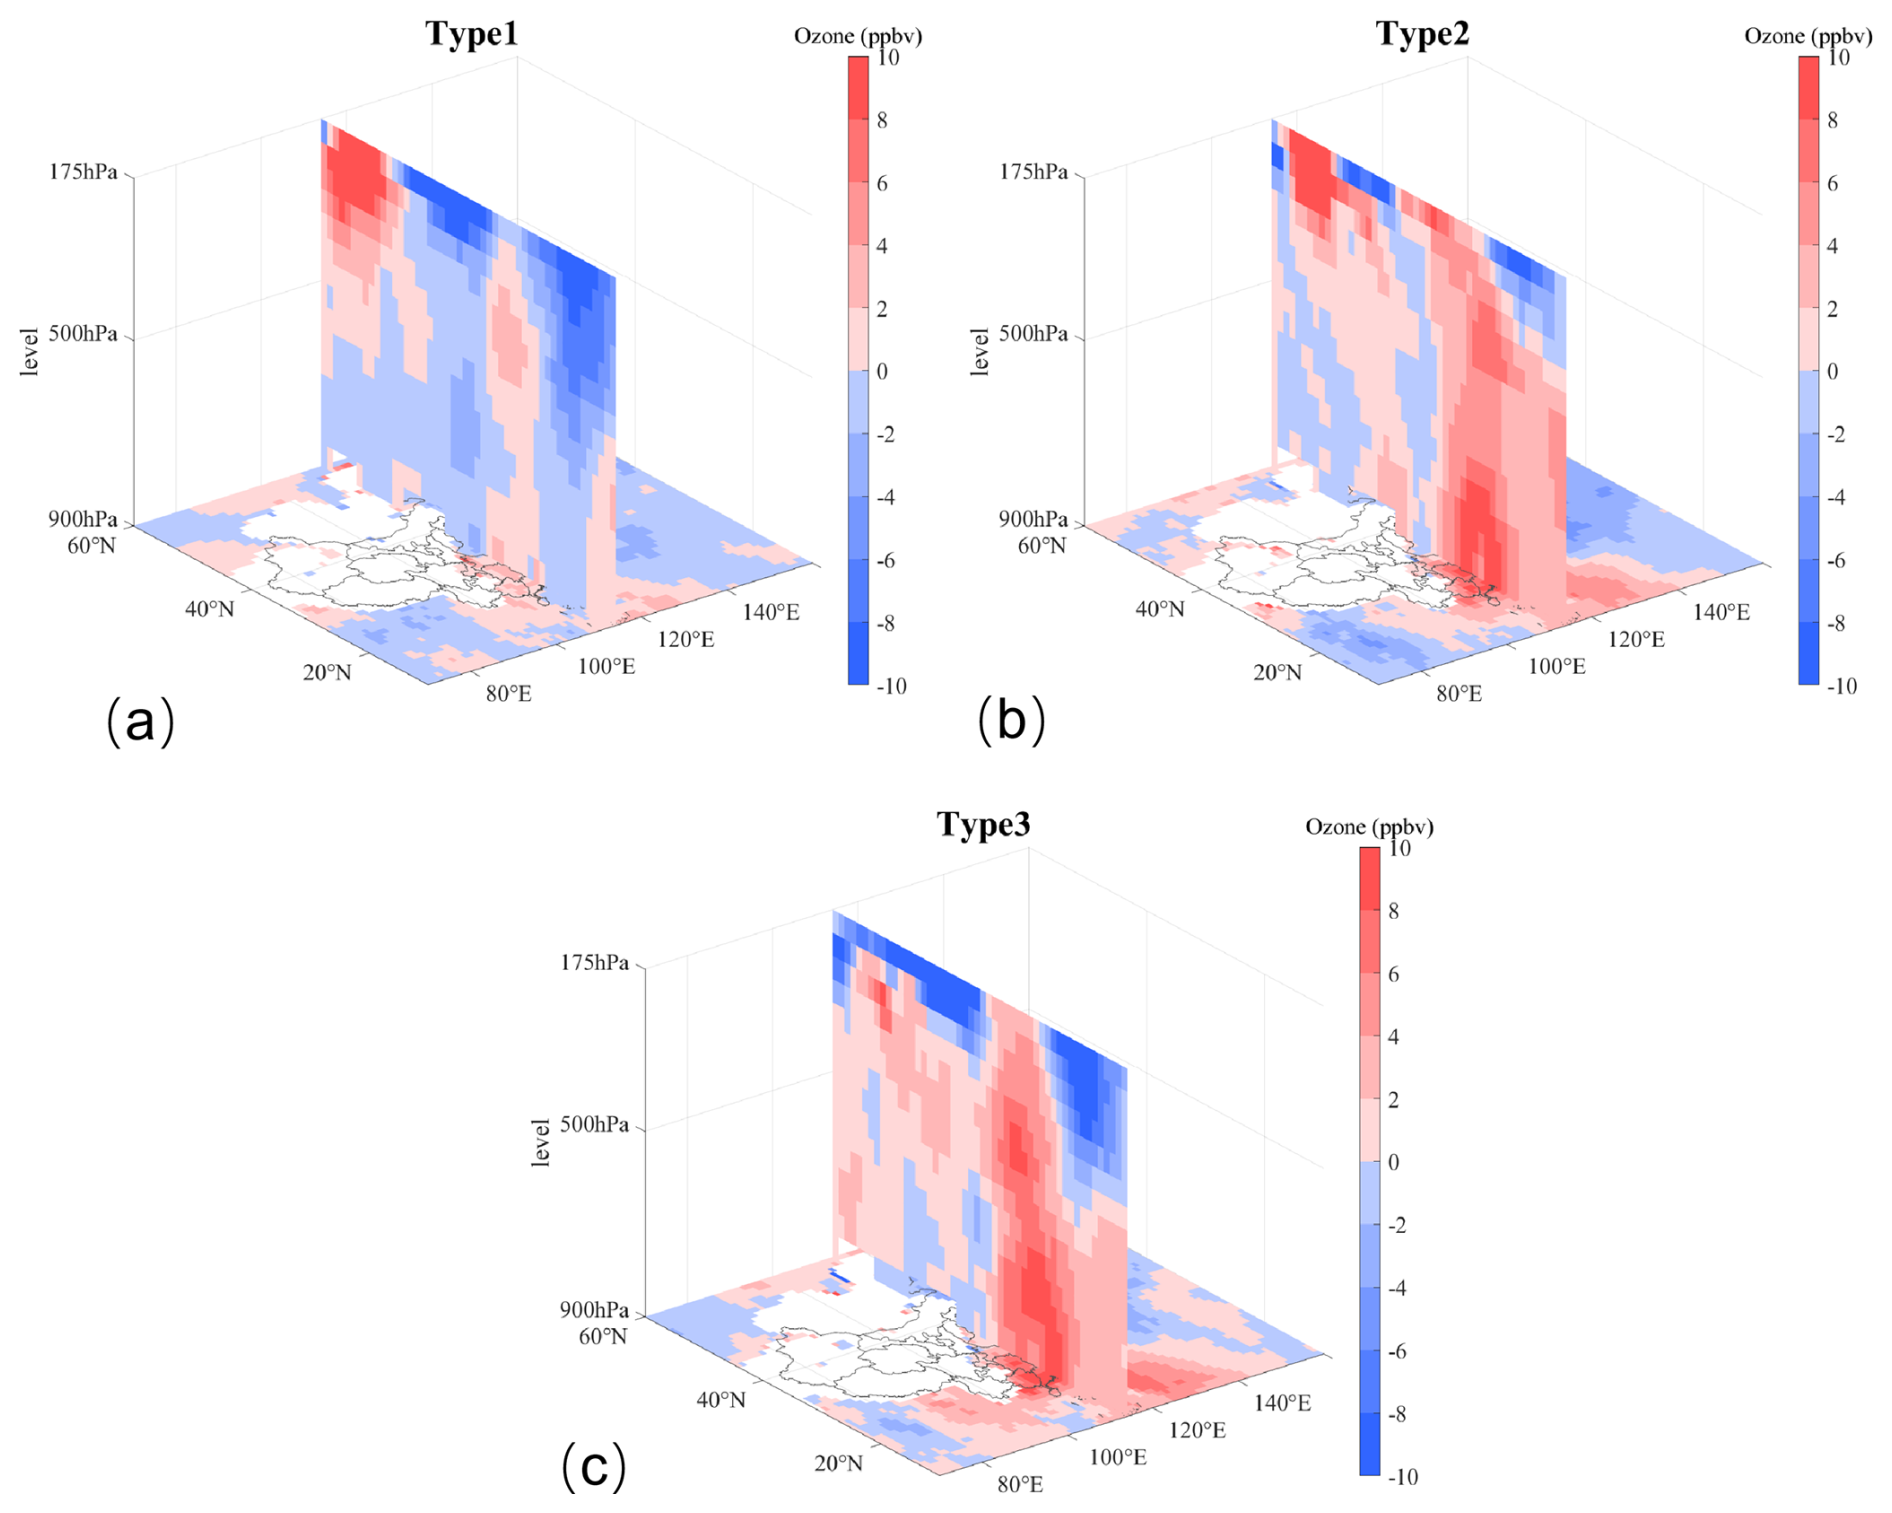
Figure 6Ozone concentration changes induced by different typhoon types (a–c: horizontal distribution changes at 900 hPa and vertical cross-section changes along 114° E for each typhoon track type, respectively).
To further investigate typhoon-induced ozone variations, spatial ozone concentration differences between typhoon conditions and non-typhoon conditions were calculated (Fig. 6). To eliminate seasonal influences, the anomaly in ozone concentrations between typhoon days and non-typhoon days was first calculated on a monthly basis, after which the different types of statistics were conducted. The results indicate that northward-moving typhoons (Type 2 and Type 3) can significantly increase the ozone concentration at altitudes ranging from 250 to 900 hPa (Fig. 6b and c). Within this altitude range, the variation of ozone concentration at the center point (23.16° N, 113.23° E) changes ranged between 2.5–14.0 ppbv (Type 2) and 0.3–14.5 ppbv (Type 3). In contrast, Type 1 did not cause significant high-altitude ozone increases, with central point ozone concentration changes ranging from −3.5 to 2.5 ppbv. Studies indicate that when gravity waves break in the upper troposphere and lower stratosphere on the western side of typhoon centers, intense turbulence occurs, leading to stratosphere-troposphere exchange (STE) (Huang et al., 2024). Subsequently, typhoons approaching landfall significantly enhance cross-regional ozone transport from North China to South China through STE (Wang et al., 2024b). This suggests that after Types 2 and 3 typhoons move northward, their cyclonic circulations transport high-concentration ozone from the tropopause to lower latitudes and altitudes through STE, causing significant changes in ozone vertical distribution and increased ozone concentrations within the boundary layer.
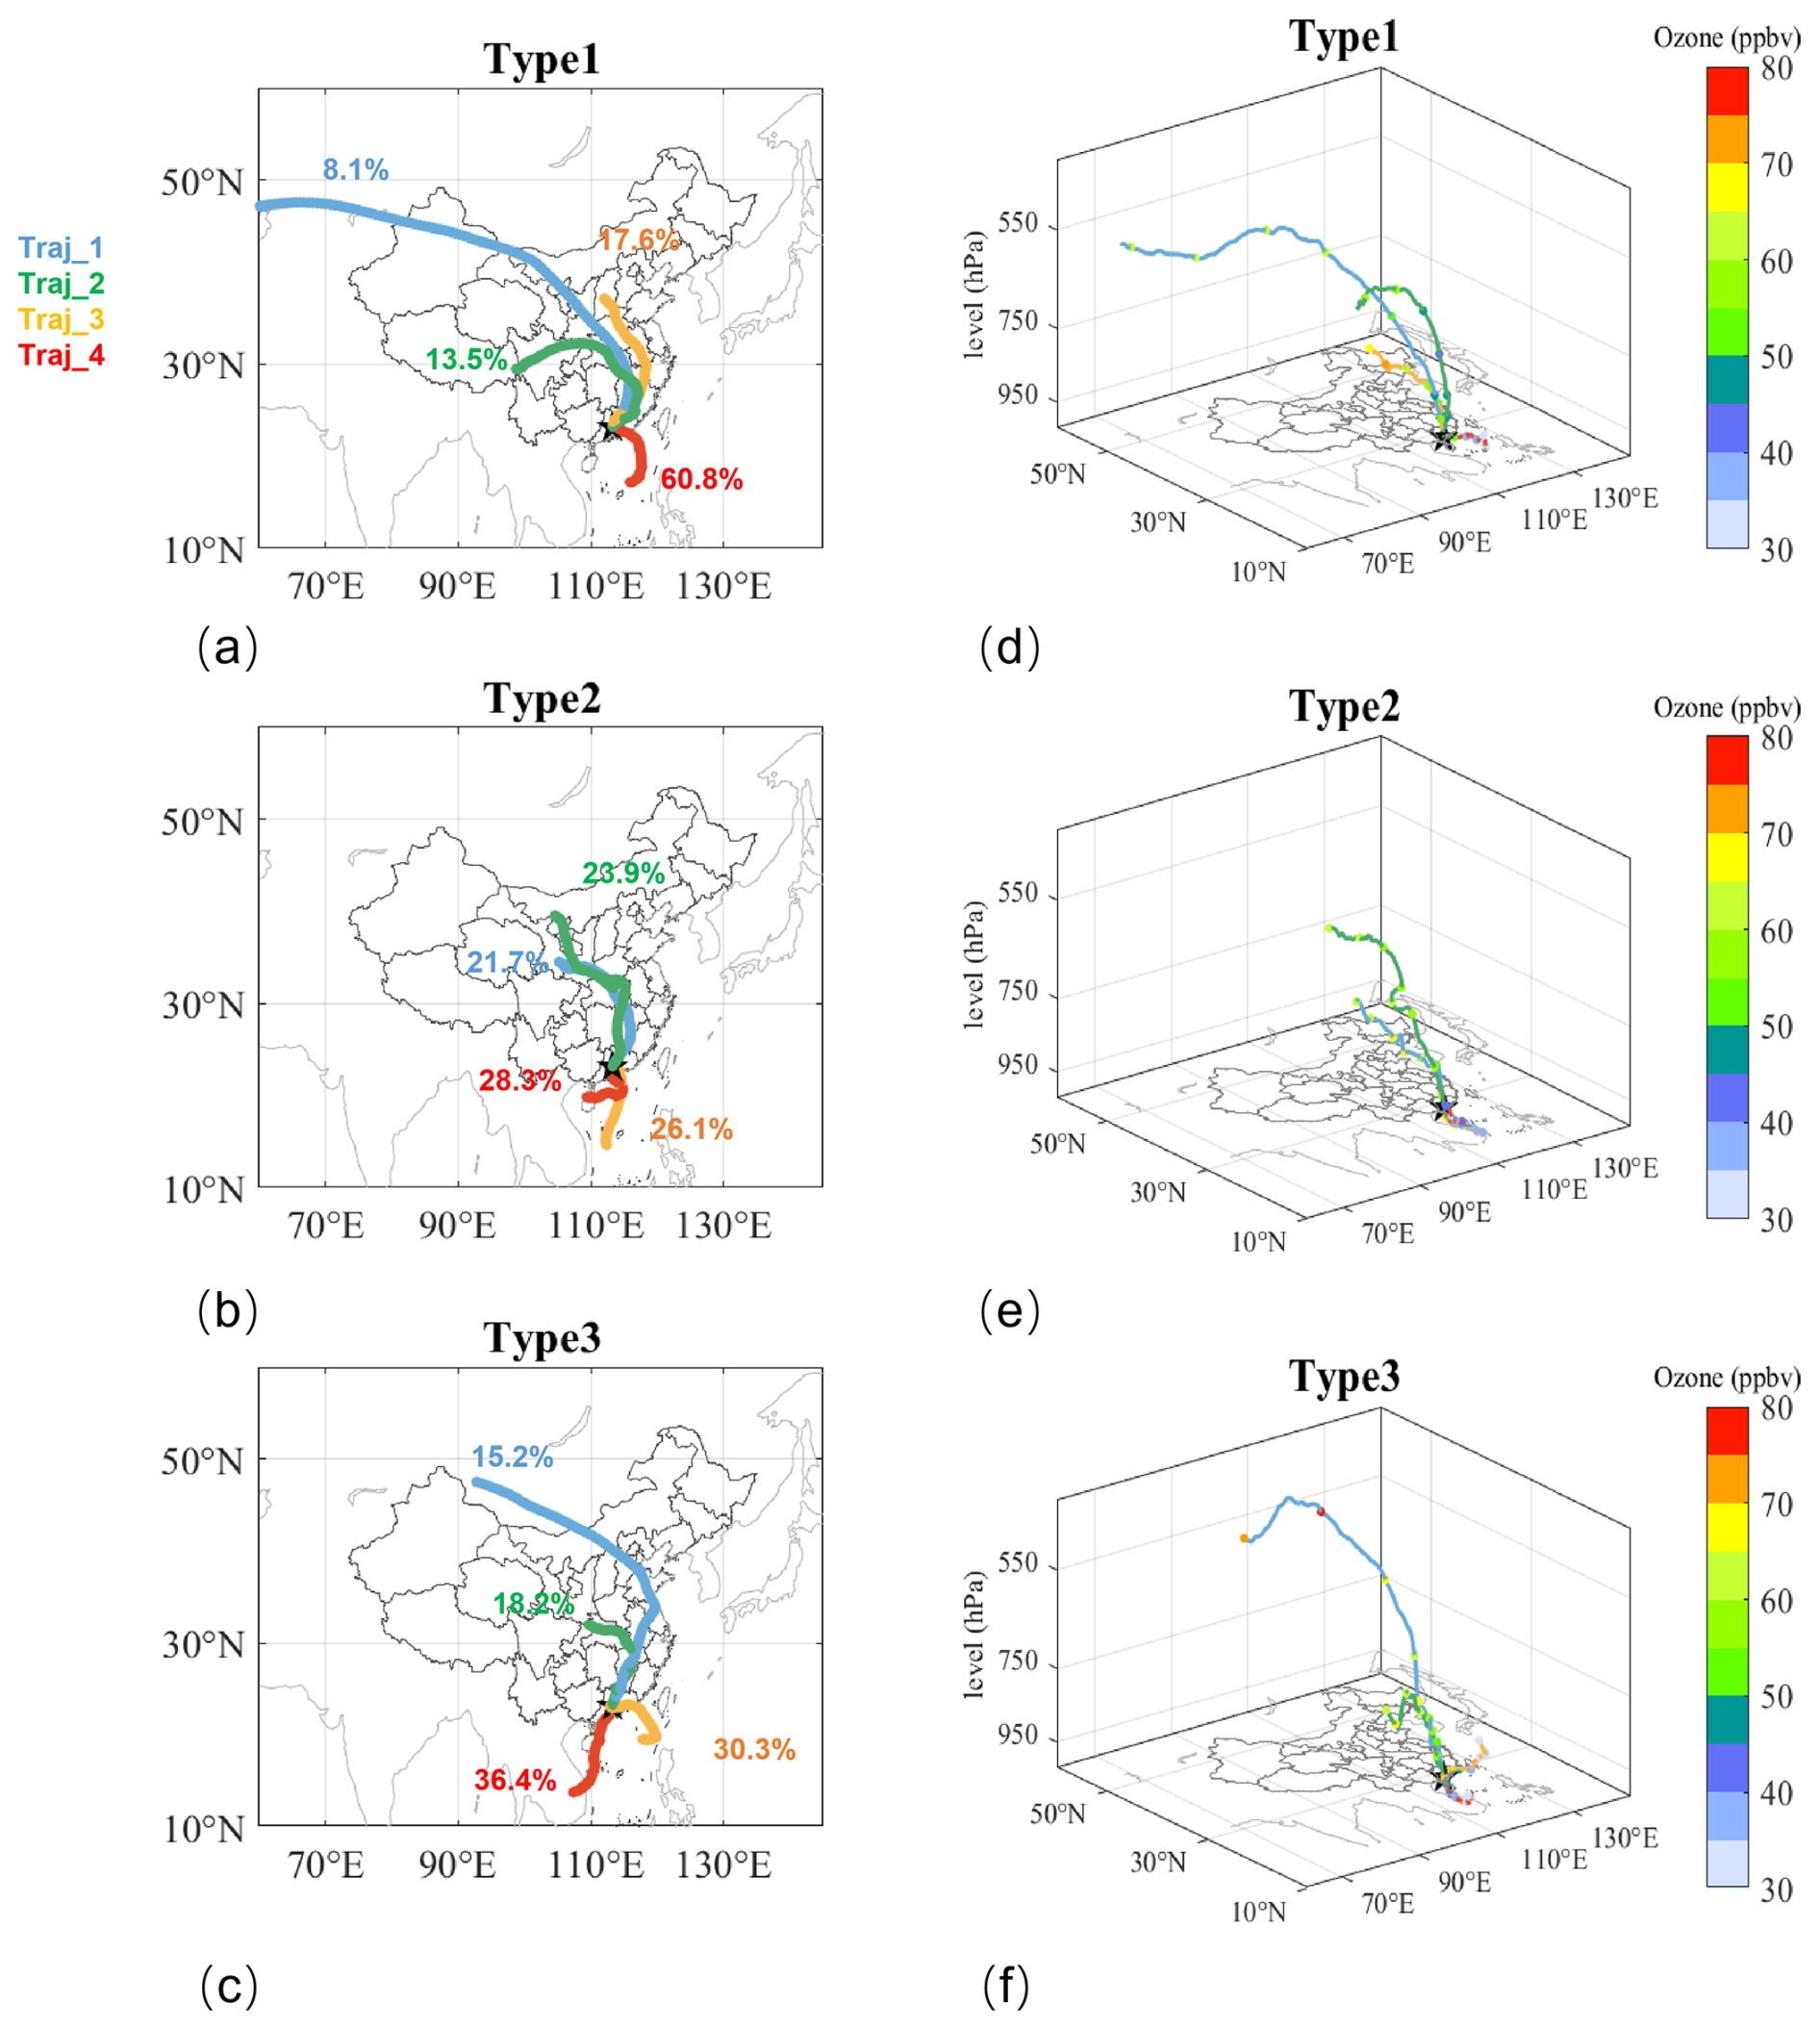
Figure 7Comparison of boundary-layer air mass trajectory sources under different typhoon tracks: (a–c) two-dimensional views with trajectory percentages indicated numerically; (d–f) three-dimensional views showing ozone concentrations (ppbv) along trajectories (marked by colored points); target regions are denoted by black pentagrams on maps.
4.2.2 Boundary layer ozone
To investigate the ozone transport pathways within the boundary layer over Guangdong Province under typhoon conditions, and to examine the differences in ozone sources associated with distinct typhoon tracks, this study conducted HYSPLIT backward trajectory analysis for 237 typhoon events. The analysis focused on 7 d air mass origins at 500 m altitude over central Guangdong (Fig. S6 in the Supplement). For each typhoon type, cluster analysis of air mass origins was performed. After K-value screening, the air mass origins were classified into four trajectory clusters (Fig. 7). Table S1 in the Supplement presents statistics for each trajectory type, including: (1) The percentage of different trajectories, (2) mean ozone concentrations along trajectories (data from TROPESS Chemical Reanalysis O3), and (3) corresponding surface ozone concentrations.
Under Type 1 conditions, air masses in the target area mainly originated from within the boundary layer, accounting for 60.8 %, with air transported from the South China Sea below 841 m to Guangdong Province (Traj_4). Analysis of the subtropical high's influence shows that under this typhoon type, Guangdong experienced the highest surface pressure and was closest to the subtropical high (Fig. S7 in the Supplement). Research indicates that under the influence of the subtropical high, O3 pollution is primarily affected by local emissions (Chen et al., 2024). This aligns with Traj_4's characteristics of short transport distance and low altitude. The other three trajectories originated from northwest China (Traj_1, 8.1 %), western China (Traj_2, 13.5 %), and central China (Traj_3, 17.6 %), respectively (Fig. 7a). The trajectory with the highest surface ozone concentration was Traj_2, which descended from 3794.1 m with an average ozone concentration of 50.3 ppbv along the trajectory(Fig. 7d, Table S1). Under Type 2 conditions, nearly half of the air masses in the target area originated from northwest China (Traj_1, 21.7 % and Traj_2, 23.9 %), while the other half came from the South China Sea region (Traj_3, 26.1 % and Traj_4, 28.9 %) (Fig. 7b). Among these, Traj_1 and Traj_2 air masses descended from above 2000 m, whereas Traj_3 and Traj_4 air masses were transported within the boundary layer (Fig. 7b). The trajectory with the highest surface concentration was Traj_1, which descended from 2646 m with an average ozone concentration of 61.9 ppbv along the trajectory (Fig. 7e, Table S1). Under Type 3 conditions, Traj_1 carried high-concentration ozone (> 75 ppbv) from high-altitude (6356 m) over high-latitude areas through North China to the target region, corresponding to the highest surface ozone concentration (15.2 % proportion) (Fig. 7f, Table S1). The other three trajectories originated from central China (Traj_2, 18.2 %) and the South China Sea region (Traj_3, 30.3 % and Traj_4, 36.4 %) (Fig. 7c).
A comparative analysis of air mass trajectories from different directions demonstrates that marine air masses originating from the South China Sea are characterized by lower altitudes and extended residence time over Guangdong Province, thereby constituting local ozone pollution sources. Conversely, continental air masses exhibit longer transport pathways and higher altitudes, representing regional ozone transport sources. Quantitative analysis reveals that the proportional contributions of local pollution sources under different typhoon tracks are 60.8 %, 55.0 %, and 66.4 %, respectively. Analysis of long-range transport trajectories reveals that different typhoon types can, respectively deliver ozone from maximum altitudes of 7468 m (∼ 380 hPa), 8927 m (∼ 320 hPa), and 9980 m (∼ 250 hPa) into the boundary layer. Type 2 and Type 3 exhibit significantly greater proportion from upper-level air mass transport (23.9 % and 15.2 %, respectively) compared to Type 1. These typhoons can transport ozone from altitudes down into the boundary layer. Combined with the high ozone concentrations along the atmospheric transport pathways, this results in boundary-layer ozone increases of 10.7 and 12.3 ppbv for these two types, respectively (Fig. 6b and c).
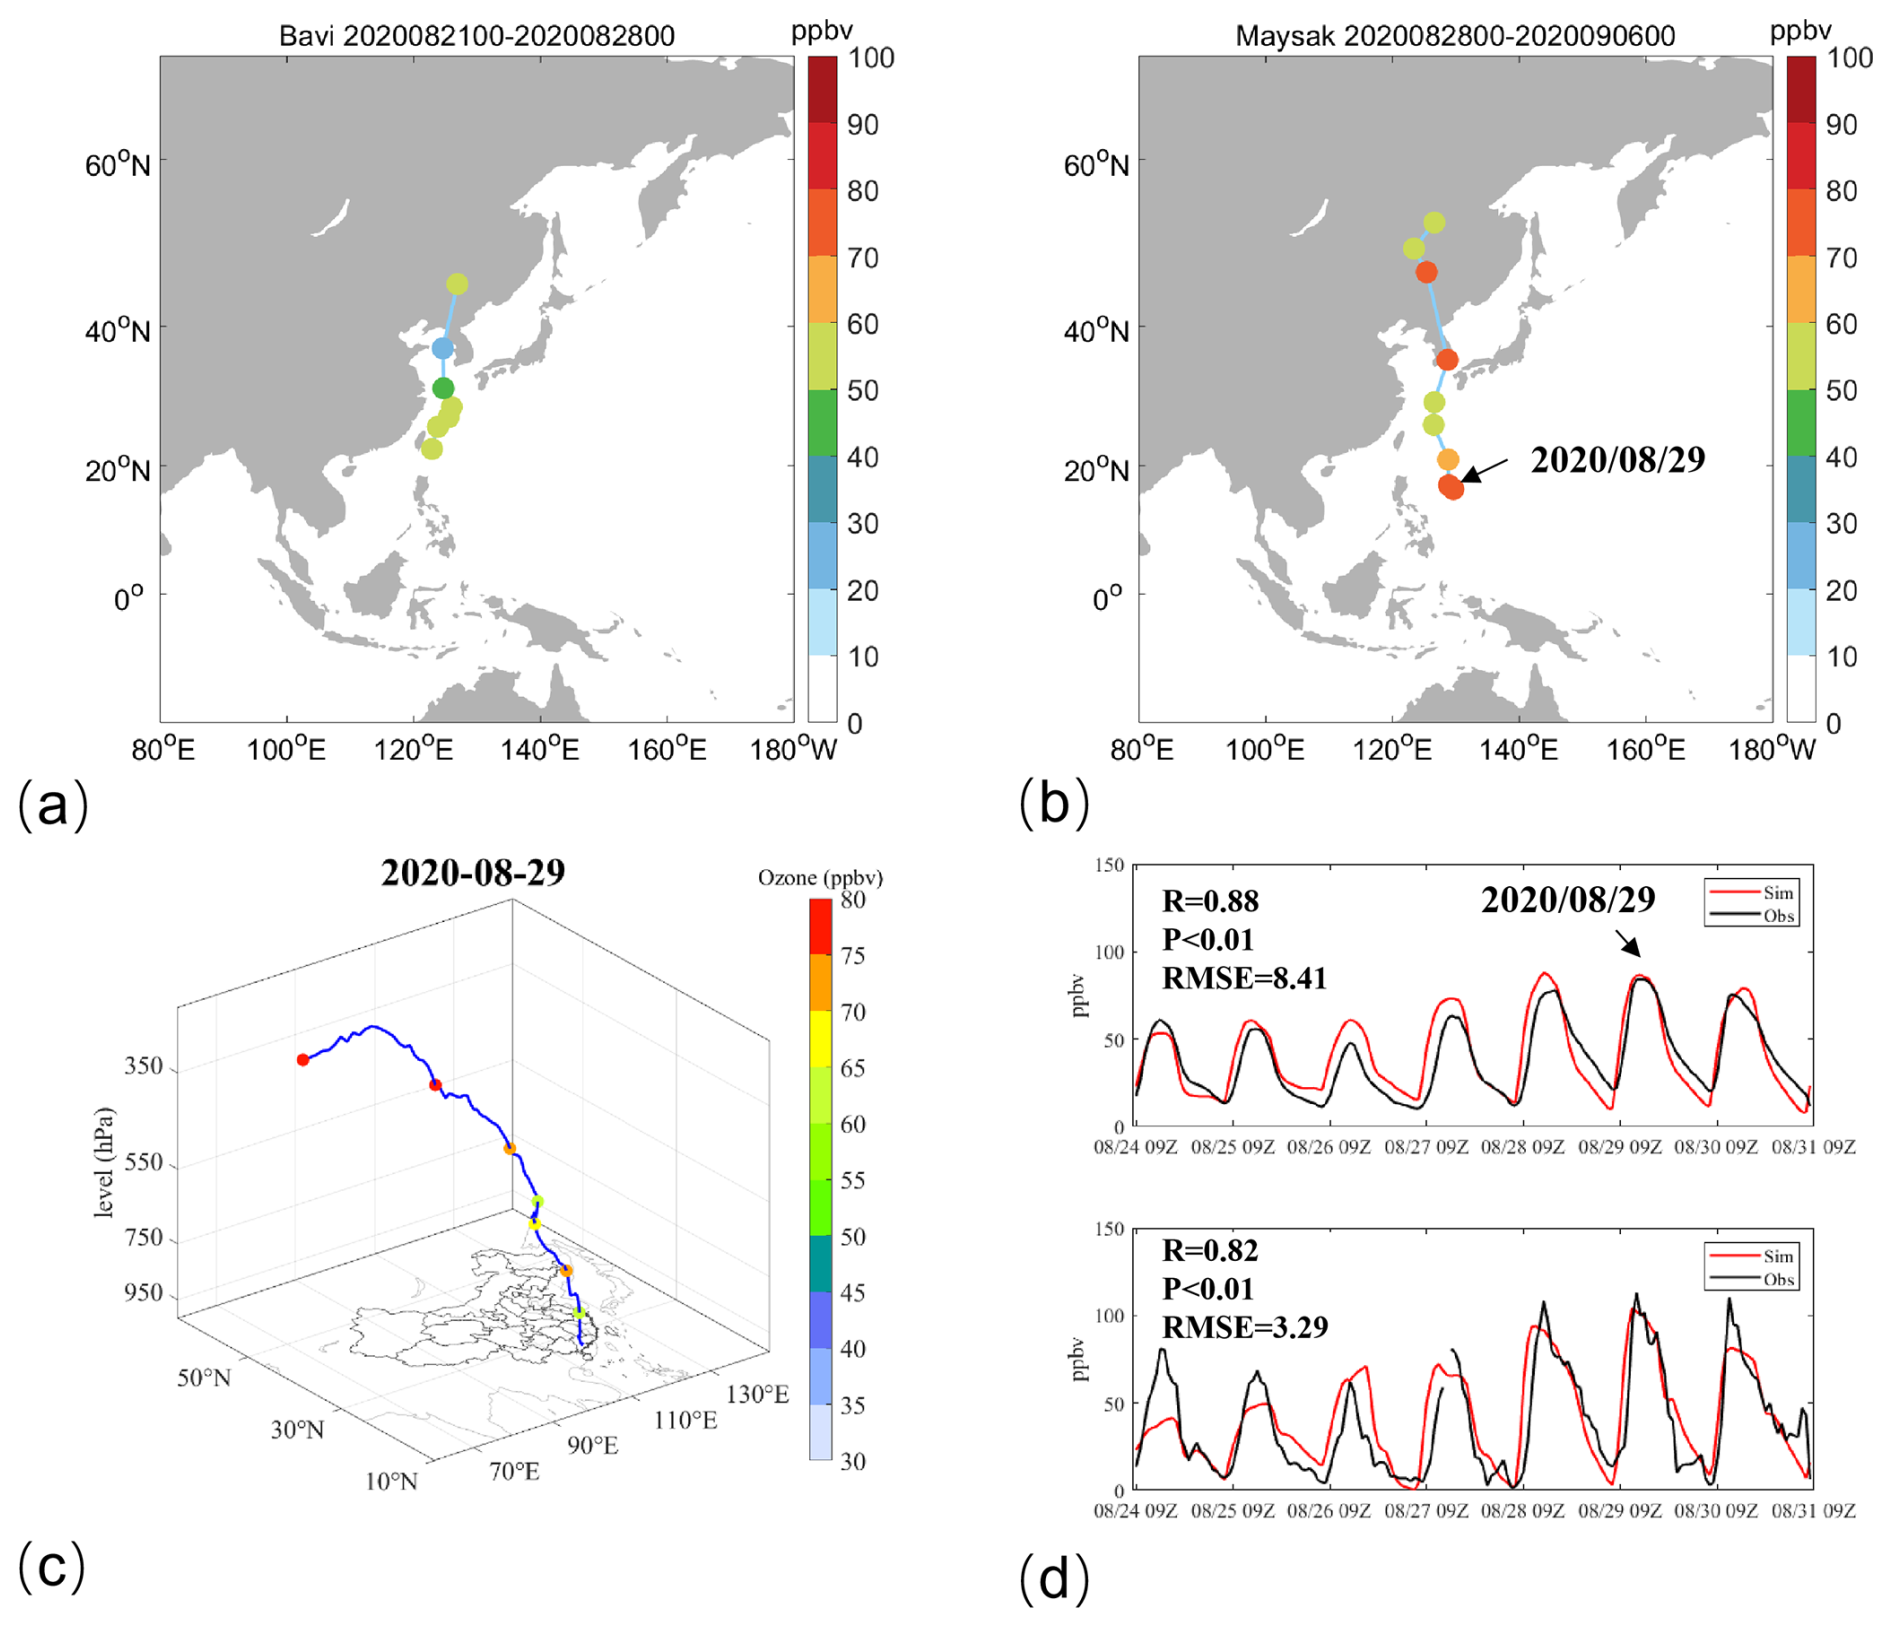
Figure 8Consecutive northward-moving typhoon tracks, backward trajectories, and ozone variations. (a, b) Typhoon paths with corresponding MDA8 ozone concentrations in Guangdong province; (c) Backward trajectories at 13:00 LST on 29 August 2020; (d) WRF-CMAQ simulated ozone variations (upper panel: average across 105 Guangdong monitoring stations; lower panel: Foshan Sanshui station (23.15° N, 112.8° E) observations, with red lines indicating simulated values and black lines representing monitored concentrations).
4.3 Contribution of typhoons to the vertical transport of ozone
During the period from 21 August 6 September 2020, the consecutive occurrence of two northward-moving typhoons (Bavi and Maysak) triggered prolonged ozone pollution episodes in the Beijing–Tianjin–Hebei and Yangtze River Delta regions, with over 50 % of monitoring stations exceeding ozone standards (Cong et al., 2024; Hu et al., 2024). Our study reveals that Guangdong Province similarly experienced extended ozone pollution episodes, particularly between 28–30 August and 1–3 September, when more than 40 out of 105 monitoring stations (38.1 %) recorded exceedances. The most severe pollution occurred on 29 August, with 57 stations (54.3 %) exceeding standards and an average MDA8 ozone concentration of 80.6 ppbv (Fig. 8a and b). Backward trajectory analysis for 29 August identified a 7 d vertical transport pathway from upper levels to the boundary layer, suggesting potential downward mixing of high-ozone air masses (Fig. 8c). This section examines the period from 24 to 31 August 2020, employing the WRF-CMAQ model to simulate the spatial distribution of ozone. Integrated Process Rate (IPR) analysis is applied to investigate the formation mechanisms of surface ozone pollution in Guangdong Province under the influence of consecutive northward-moving typhoons, with a quantitative assessment of the impact of vertical transport on ozone concentrations within the planetary boundary layer.
The WRF-CMAQ model was used to simulate ozone variations in Guangdong Province from 24 to 31 August 2020, with evaluation results showing excellent performance (Fig. 8d). For all 105 monitoring stations across the province, the correlation coefficient between observed and simulated ozone concentrations reached 0.88 (p < 0.01), with a root mean square error (RMSE) of 8.41 ppbv. Focusing on the Sanshui station (23.15° N, 112.8° E), which exhibited both high ozone levels and a clear increasing trend, the correlation coefficient was 0.82 (p < 0.01) with an RMSE of 3.29 ppbv. These results demonstrate that the WRF-CMAQ model successfully captured the spatial distribution and temporal evolution of this ozone pollution event in Guangdong, with statistical metrics meeting operational air quality modeling standards. The model's strong performance, particularly in reproducing both regional patterns and local pollution trends, provides reliable support for subsequent analysis of ozone formation mechanisms under typhoon conditions.
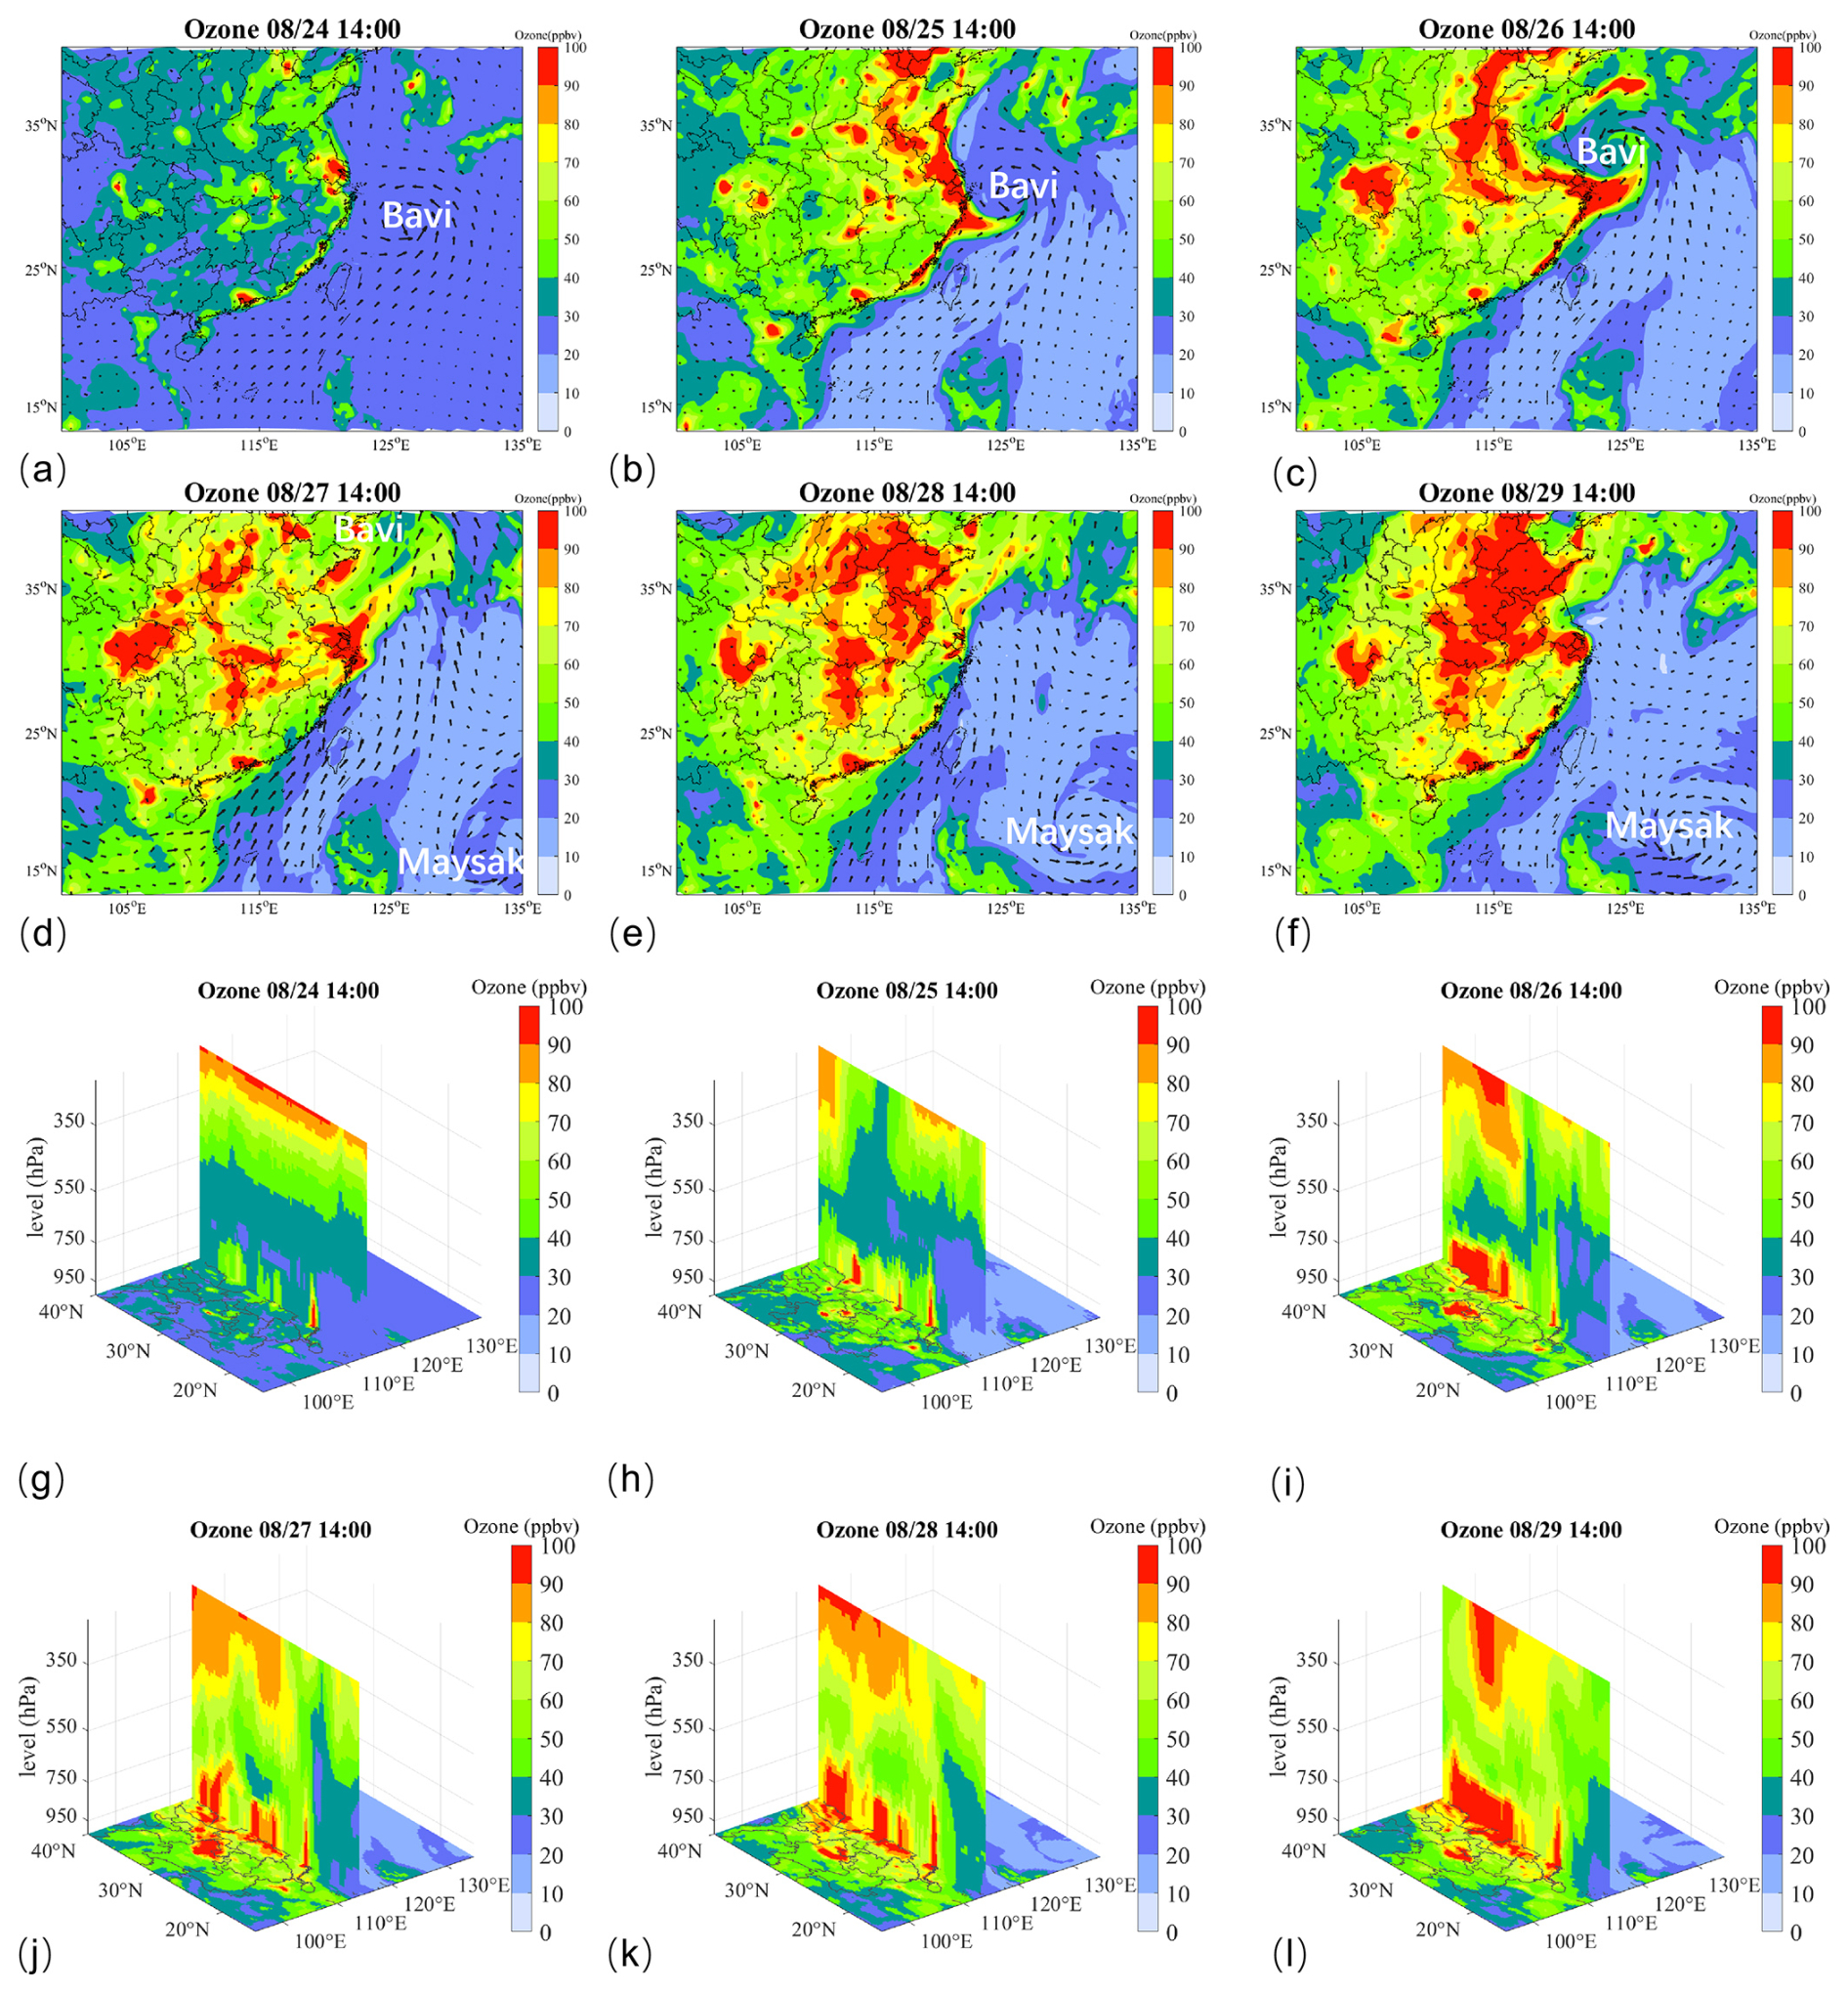
Figure 9Temporal evolution of (a–f) horizontal distributions of surface ozone and (g–l) vertical distributions (along 114° E cross-section) of ozone from 14:00 LST, 24 August, to 14:00 LST, 29 August 2020.
From 24 to 27 August, Typhoon Bavi was located along the eastern coastal region of China, moving northward before gradually dissipating. From 28 to 31 August, Typhoon Maysak emerged in the South China Sea and progressively approached the Chinese mainland. During this period, we analyzed variations in surface ozone concentrations and their vertical distribution under the influence of these consecutive northward-moving typhoons, based on model simulation results (Fig. 9). The results show that the variation in surface ozone distribution can be divided into two stages: The first stage occurred under the influence of Typhoon Bavi, when surface ozone concentrations rapidly increased in the Beijing–Tianjin–Hebei region, Yangtze River Delta, and Pearl River Delta, and was rapidly transported to southwestern China by circulation. The second stage occurred under the influence of Typhoon Maysak, when ozone concentrations continued to rise across most regions of China. Compared with the first stage, horizontal ozone transport was not significant during the second stage (Fig. 9a–f). In the vertical dimension, the consecutive northward-moving typhoons triggered a sustained downward transport process of ozone. Beginning on 25 August, downward ozone transport was observed in the upper atmosphere between 35 and 40° N. From 26 to 29 August, the zone of ozone subsidence gradually expanded southward, leading to a significant increase in ozone concentrations over Guangdong Province (Fig. 9g–l).
The IPR process analysis results elucidate the impacts of photochemical reactions and atmospheric transport on ozone concentration variations during this event (Figs. S8 and S9 in the Supplement). The photochemical reactions correspond to the CHEM contribution in the process analysis. The atmospheric transport represents the combined contributions of horizontal diffusion (HDIF), horizontal advection (HADV), vertical diffusion (VDIF), and vertical advection (ZADV) in the process analysis. The results indicate that the increase in surface ozone was primarily driven by photochemical reactions. During the period dominated by Typhoon Bavi (24–27 August), photochemical reactions intensified rapidly over Guangdong Province, contributing more than 30 ppbv to surface ozone concentrations in the central region (Fig. S8a–d). Under the influence of Typhoon Maysak (28–29 August), the positive contribution from photochemical reactions was slightly lower than in the previous phase, but still exceeded 16 ppbv in the central Guangdong region (Fig. S8e and f). The contribution of atmospheric transport varied significantly across different altitudes, exhibiting predominantly negative effects below 850 hPa and positive effects above 850 hPa. Vertical cross-sections of daily mean atmospheric transport contributions reveal a gradual southward transport of ozone from higher to lower latitudes. However, its positive contribution to ozone concentrations was substantially lower than that of photochemical reactions, with daily mean contributions remaining below 4.5 ppbv (Fig. S9). The downward transport of upper-level ozone inhibited vertical diffusion of surface ozone while simultaneously transporting high-concentration ozone downward into the boundary layer, further intensifying ozone pollution levels. In summary, during this ozone pollution event caused by consecutive northward-moving typhoons: Chemical processes were the main cause of surface ozone pollution in Guangdong Province, Atmospheric transport was a secondary contributing factor.
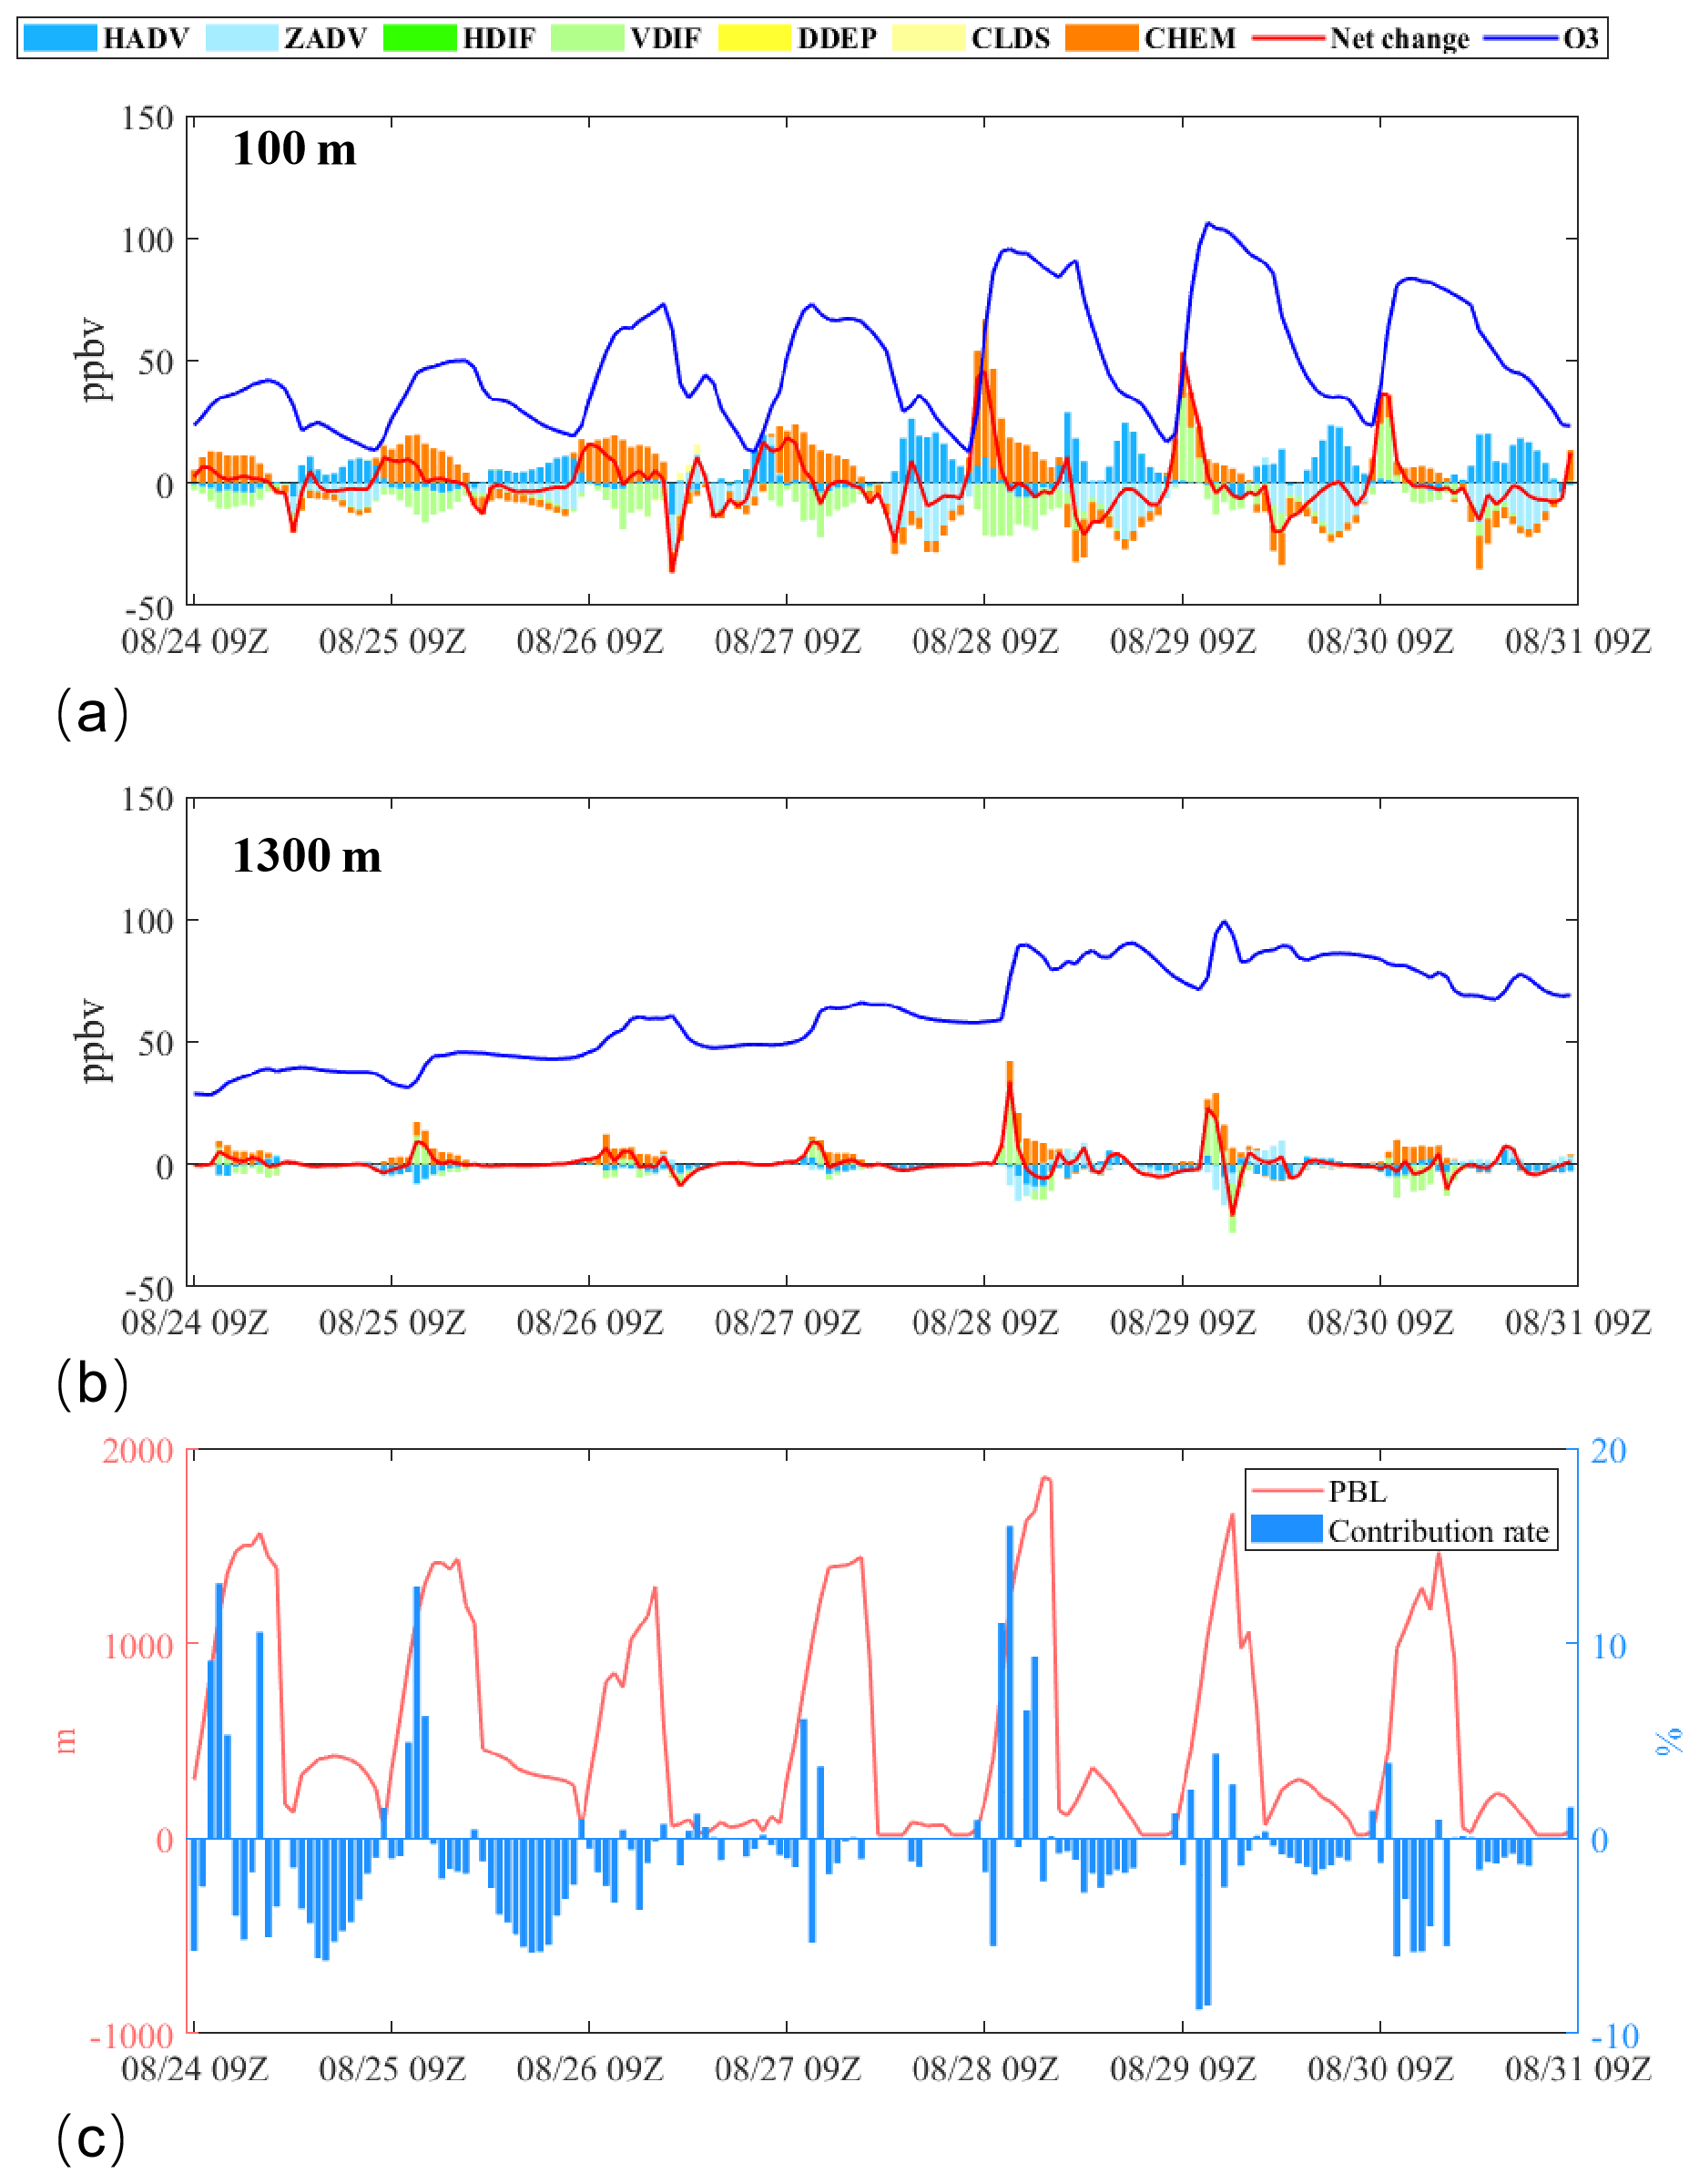
Figure 10Process contributions to ozone concentrations at 100 and 1300 m altitudes, and cross-boundary-layer vertical transport contribution rates. (a, b): Contributions from horizontal diffusion (HDIF), horizontal advection (HADV), vertical diffusion (VDIF), vertical advection (ZADV), chemical processes (CHEM), dry deposition (DDEP), and cloud processes (CLDS). (c): Red lines indicate net ozone change, while blue lines show ozone concentration variations.)
To quantitatively analyze the contribution of vertical transport to ozone concentrations within the boundary layer, we employed the IPR (Integrated Process Rate) analysis method to decompose ozone sources and sinks across the study area. A detailed analysis was conducted using results from the Sanshui station at 100 and 1300 m altitudes (Fig. 10a and b). Subsequently, we calculated the contribution rate of cross-boundary-layer vertical transport to ozone concentrations in the boundary layer at each time point (Fig. 10c) using the following formula (Chen et al., 2022a):
where IPRv,pbl indicates the IPR value corresponding to vertical transport (VDIF + ZADV) on the Boundary layer height. that is, the change in the values of pollutants caused by the vertical diffusion, Zpbl represents the height of the layer in the model that is close to the height of the boundary layer. O3,j indicates the ozone concentration in layer j, Zj represents the height of j layer.
Detailed analysis of process contributions at different heights within the boundary layer shows that while near-surface atmospheric transport exhibited negative contributions to daily mean ozone concentrations, the decomposition of individual processes at 100 m height revealed positive contributions from vertical diffusion (VDIF) during 09:00–11:00 LST on 29 August, with magnitudes of 39.9, 26.4, and 12.3 ppbv, respectively (Fig. 10a). Further analysis of process contributions at 1300 m height reveals distinct positive signals from vertical transport during the morning hours of both 28 and 29 August (Fig. 10b). This confirms that upper-level ozone can be transported into the boundary layer, thereby influencing ozone concentrations within the boundary layer. Calculation of cross-boundary-layer vertical transport contributions revealed six distinct ozone transport events during this consecutive northward-moving typhoon episode, occurring on 24, 25, 27, 28, 29, and 30 August. The maximum contribution rate to ozone concentrations within the boundary layer reached 16 %.
This study systematically investigated the mechanisms by which different typhoon tracks influence ozone pollution in Guangdong Province through meteorological factors, atmospheric circulation patterns, transport trajectories, and vertical transport contributions, based on 237 typhoons in China's adjacent waters from 2013–2023. The key findings are:
- 1.
Historical typhoons were classified into three types using the K-MEANS clustering method: westward-moving typhoons (Type 1), distant northward-moving typhoons (Type 2), and proximal northward-recurving typhoons (Type 3). Among these, near-track northward-moving typhoons are more likely to induce ozone pollution in Guangdong Province due to their more extreme meteorological conditions, including higher temperatures, stronger solar radiation, lower cloud cover, reduced precipitation, decreased relative humidity, elevated boundary layer height, weaker surface winds, and suppressed vertical motion.
- 2.
Under the influence of northward-moving typhoons (types 2 and 3), an anticyclone develops over western China at the 175 hPa level, positioned to the south of the westerly jet. This configuration leads to a more pronounced southerly wind anomaly in the right exit region of the westerly jet. This process triggers the subsidence of high-concentration ozone from the upper troposphere, accompanied by pole-to-equator transport. Comparative analysis between typhoon and non-typhoon conditions reveals that both types of northward-moving typhoons induce significant ozone enhancement throughout the vertical column, with increases ranging from 2.5 to 11.6 ppbv (Type 2) and 0.3 to 12.3 ppbv (Type 3).
- 3.
For Type 1 typhoons, the associated ozone pollution is primarily controlled by the subtropical high system, with significant contributions from local pollution sources. In contrast, Type 2 and Type 3 typhoons exhibit the highest proportions of upper-level transport trajectories (23.9 % and 15.2 %, respectively), capable of delivering air masses from as high as 9980 m (∼ 250 hPa) into the boundary layer. Coupled with the elevated ozone concentrations along these transport pathways, these mechanisms result in ozone enhancements of 10.7 and 12.3 ppbv at boundary layer altitudes for Type 2 and Type 3, respectively.
- 4.
Under the influence of two consecutive northward-moving typhoons from 21 August to 6 September 2020, Guangdong Province experienced a prolonged ozone pollution episode. On 29 August, ozone exceedance was observed at 54.3 % of monitoring stations. The primary cause of this ozone pollution event was enhanced photochemical production, with secondary contributions from upper-level ozone transport. Process analysis revealed that during 09:00–11:00 LST on 29 August, the positive contributions of near-surface vertical transport to ozone concentrations were 39.9, 26.4, and 12.3 ppbv, respectively. During this typhoon event, cross-boundary-layer transport via vertical mixing contributed up to 16 % of the ozone concentration within the boundary layer.
All raw data can be provided by the corresponding authors upon request.
The supplement related to this article is available online at https://doi.org/10.5194/acp-26-879-2026-supplement.
XC, XiaC, and XW planned the research; LW, SCh and ML runned the model; XC analyzed the data; XC and XiaC wrote the manuscript draft; CL, YZ, ML, and XW reviewed and edited the manuscript.
The contact author has declared that none of the authors has any competing interests.
Publisher's note: Copernicus Publications remains neutral with regard to jurisdictional claims made in the text, published maps, institutional affiliations, or any other geographical representation in this paper. The authors bear the ultimate responsibility for providing appropriate place names. Views expressed in the text are those of the authors and do not necessarily reflect the views of the publisher.
This research has been supported by:
-
National Natural Science Foundation of China (42121004, 42477273, and 42405194)
-
Guangdong Basic and Applied Basic Research Foundation (2023A1515110103 and 2024A1515510025)
-
Science and Technology Planning Project of Guangzhou (2025A04J4711)
-
Guangdong Province: Special Support Plan for High-Level Talents (2023JC07L057)
-
Guangdong Provincial General Colleges and Universities Innovation Team Project (Natural Science, 2024KCXTD004)
This research has been supported by the National Natural Science Foundation of China (grant no. 42121004, 42477273, and 42405194), the Basic and Applied Basic Research Foundation of Guangdong Province (grant nos. 2023A1515110103 and 2024A1515510025), and the Science and Technology Planning Project of Guangdong Province (grant no. 2025A04J4711).
This paper was edited by Anne Perring and reviewed by three anonymous referees.
Chen, X., Liu, Y., Lai, A., Han, S., Fan, Q., Wang, X., Ling, Z., Huang, F., and Fan, S.: Factors dominating 3-dimensional ozone distribution during high tropospheric ozone period, Environ. Pollut., 232, 55–64, https://doi.org/10.1016/j.envpol.2017.09.017, 2018.
Chen, X., Wu, L., Chen, X., Zhang, Y., Guo, J., Safieddine, S., Huang, F., and Wang, X.: Cross-Tropopause Transport of Surface Pollutants during the Beijing 21 July Deep Convection Event, J. Atmos. Sci., 79, 1349–1362, https://doi.org/10.1175/JAS-D-21-0115.1, 2022a.
Chen, X., Wang, N., Wang, G., Wang, Z., Chen, H., Cheng, C., Li, M., Zheng, L., Wu, L., Zhang, Q., Tang, M., Huang, B., Wang, X., and Zhou, Z.: The Influence of Synoptic Weather Patterns on Spatiotemporal Characteristics of Ozone Pollution Across Pearl River Delta of Southern China, J. Geophys. Res.-Atmos., 127, 1–17, https://doi.org/10.1029/2022jd037121, 2022b.
Chen, Y., Lu, X., and Fung, J. C. H.: Spatiotemporal source apportionment of ozone pollution over the Greater Bay Area, Atmos. Chem. Phys., 24, 8847–8864, https://doi.org/10.5194/acp-24-8847-2024, 2024.
Chen, Z., Liu, J., Cheng, X., Yang, M., and Wang, H.: Positive and negative influences of typhoons on tropospheric ozone over southern China, Atmos. Chem. Phys., 21, 16911–16923, https://doi.org/10.5194/acp-21-16911-2021, 2021.
Chen, Z., Liu, J., Qie, X., Cheng, X., Shen, Y., Yang, M., Jiang, R., and Liu, X.: Transport of substantial stratospheric ozone to the surface by a dying typhoon and shallow convection, Atmos. Chem. Phys., 22, 8221–8240, https://doi.org/10.5194/acp-22-8221-2022, 2022c.
Cong, H., Yuan, Y., Qian, W., and Bi-hui, Z.: Analysis of O3 Pollution Affected by a Succession of Three Landfall Typhoons in 2020 in Eastern China, Huanjing Kexue, 45, 71–80, https://doi.org/10.13227/j.hjkx.202301049, 2024.
Ding, H., Kong, L., You, Y., Mao, J., Chen, W., Chen, D., Chang, M., and Wang, X.: Effects of tropical cyclones with different tracks on ozone pollution over the Pearl River Delta region, Atmos. Res., 286, https://doi.org/10.1016/j.atmosres.2023.106680, 2023.
Dou, X., Li, M., Jiang, Y., Song, Z., Li, P., and Yu, S.: Different contributions of meteorological conditions and emission reductions to the ozone pollution during Shanghai's COVID-19 lockdowns in winter and spring, Atmos. Pollut. Res., 15, https://doi.org/10.1016/j.apr.2024.102252, 2024.
Gao, D., Xie, M., Chen, X., Wang, T., Liu, J., Xu, Q., Mu, X., Chen, F., Li, S., Zhuang, B., Li, M., Zhao, M., and Ren, J.: Systematic classification of circulation patterns and integrated analysis of their effects on different ozone pollution levels in the Yangtze River Delta Region, China, Atmos. Environ., 242, https://doi.org/10.1016/j.atmosenv.2020.117760, 2020.
Gong, D., Du, N., Wang, L., Deng, X., Zhang, X., and Yang, L.: Impacts of meteorological and precursor emission factors on PM2.5 and O3 from 2019 to 2022: Insights from multiple perspectives, Atmos. Res., 315, https://doi.org/10.1016/j.atmosres.2025.107933, 2025.
Guo, Y. P. and Tan, Z. M.: Influence of Track Change on the Inconsistent Poleward Migration of Typhoon Activity, J. Geophys. Res.-Atmos., 127, 1–16, https://doi.org/10.1029/2022JD036640, 2022.
Han, H., Liu, J., Shu, L., Wang, T., and Yuan, H.: Local and synoptic meteorological influences on daily variability in summertime surface ozone in eastern China, Atmos. Chem. Phys., 20, 203–222, https://doi.org/10.5194/acp-20-203-2020, 2020.
Hu, F., Xie, P., Zhu, Y., Zhang, F., Xu, J., Lv, Y., Zhang, Z., Zheng, J., Zhang, Q., Li, Y., and Tian, X.: The impact of evolving synoptic weather patterns on multi-scale transport and sources of persistent high-concentration ozone pollution event in the Yangtze River Delta, China, Sci. Total Environ., 949, https://doi.org/10.1016/j.scitotenv.2024.175048, 2024.
Huang, D., Wan, L., Wan, Y., Chang, S., Ma, X., and Zhao, K.: Gravity Wave Activity and Stratosphere-Troposphere Exchange During Typhoon Molave (2020), J. Trop. Meteorol., 30, 306–326, https://doi.org/10.3724/j.1006-8775.2024.026, 2024.
Huang, T., Yang, Y., O'Connor, E. J., Lolli, S., Haywood, J., Osborne, M., Cheng, J. C.-H., Guo, J., and Yim, S. H.-L.: Influence of a weak typhoon on the vertical distribution of air pollution in Hong Kong: A perspective from a Doppler LiDAR network, Environ. Pollut., 276, https://doi.org/10.1016/j.envpol.2021.116534, 2021.
Jiang, Y., Zhao, T., Meng, K., Cheng, X., and Lv, Q.: 3-D Changes of Tropospheric O3 in Central and Eastern China Induced by Tropical Cyclones over the Northwest Pacific: Recent-Year Characterization with Multi-Source Observations, Remote Sens., 16, https://doi.org/10.3390/rs16071178, 2024.
Kumar, S., Chen, W., and Louis, O.-P.: Ionospheric and Atmospheric Response to Extremely Severe Cyclonic Storm Nida of 29 July–02 August- 2016, J. Geophys. Res.-Space Phys., 128, https://doi.org/10.1029/2023JA031422, 2023.
Li, D., Vogel, B., Mueller, R., Bian, J., Guenther, G., and Riese, M.: Tropical Cyclones Reduce Ozone in the Tropopause Region Over the Western Pacific: An Analysis of 18 Years Ozonesonde Profiles, Earths Future, 9, https://doi.org/10.1029/2020EF001635, 2021.
Li, D., Bian, J., Zhang, X., Vogel, B., Muller, R., and Gunther, G.: Impact of typhoon Soudelor on ozone and water vapor in the Asian monsoon anticyclone western Pacific mode, Atmos. Sci. Lett., 24, https://doi.org/10.1002/asl.1147, 2023a.
Li, M., Zeng, W., Yang, Z., Luo, Y., Zhu, Q., Wang, L., Yang, L., and Liao, C.: Multiple sources emission inventory closely integrated with atmospheric environment management: A case study of Guangdong, China, Atmos. Pollut. Res., 14, 101825, https://doi.org/10.1016/j.apr.2023.101825, 2023b.
Li, Y., Zhao, X., Deng, X., and Gao, J.: The impact of peripheral circulation characteristics of typhoon on sustained ozone episodes over the Pearl River Delta region, China, Atmos. Chem. Phys., 22, 3861–3873, https://doi.org/10.5194/acp-22-3861-2022, 2022.
Lu, P., Liu, R., Luo, Z., Li, S., Wu, Y., Hu, W., and Xue, X.: Impacts of compound extreme weather events on summer ozone in the Beijing-Tianjin-Hebei region, Atmos. Pollut. Res., 15, https://doi.org/10.1016/j.apr.2023.102030, 2024.
Lu, X., Yu, H., Ying, M., Zhao, B., Zhang, S., Lin, L., Bai, L., and Wan, R.: Western North Pacific Tropical Cyclone Database Created by the China Meteorological Administration, Adv. Atmos. Sci., 38, 690–699, https://doi.org/10.1007/s00376-020-0211-7, 2021.
Meng, K., Zhao, T., Xu, X., Hu, Y., Zhao, Y., Zhang, L., Pang, Y., Ma, X., Bai, Y., Zhen, S., and Zhao, Y.: Anomalous surface O3 changes in North China Plain during the northwest-ward movement of a landing typhoon, Sci. Total Environ., 820, https://doi.org/10.1016/j.scitotenv.2022.153196, 2022.
Ouyang, S., Deng, T., Liu, R., Chen, J., He, G., Leung, J. C.-H., Wang, N., and Liu, S. C.: Impact of a subtropical high and a typhoon on a severe ozone pollution episode in the Pearl River Delta, China, Atmos. Chem. Phys., 22, 10751–10767, https://doi.org/10.5194/acp-22-10751-2022, 2022.
Qin, L., Chunyan, D., Biwu, C., and Jianfeng, L.: Reason Analysis and Control of Ozone Pollution in a Southern Coastal City, Environ. Sci. Technol., 43, 71–78, https://doi.org/10.19672/j.cnki.1003-6504.2020.04.012, 2020.
Qiu, Y., Li, X., Chai, W., Liu, Y., Song, M., Tian, X., Zou, Q., Lou, W., Zhang, W., Li, J., and Zhang, Y.: Insights into ozone pollution control in urban areas by decoupling meteorological factors based on machine learning, Atmos. Chem. Phys., 25, 1749–1763, https://doi.org/10.5194/acp-25-1749-2025, 2025.
Qu, K., Wang, X., Yan, Y., Shen, J., Xiao, T., Dong, H., Zeng, L., and Zhang, Y.: A comparative study to reveal the influence of typhoons on the transport, production and accumulation of O3 in the Pearl River Delta, China, Atmos. Chem. Phys., 21, 11593–11612, https://doi.org/10.5194/acp-21-11593-2021, 2021.
Rolph, G., Stein, A., and Stunder, B.: Real-time Environmental Applications and Display sYstem: READY, Environ. Model. Softw., 95, 210–228, https://doi.org/10.1016/j.envsoft.2017.06.025, 2017.
Shen, W., Jin, Y., Li, G., and Cong, P.: Analyzing the response distribution of DO concentration and its environmental factors under the influence of typhoon rain events with remote sensing, Front. Ecol. Evol., 11, https://doi.org/10.3389/fevo.2023.1283281, 2023.
Shuping, S., Chen, C., Haihua, M., Zhuoran, H., Lina, A., Sixin, D., Yan, Z., Min’er, K., and Weihua, C.: Characteristics of ozone pollution in Foshan city and its relationship with meteorology during 2017–2019, Acta Scientiarum Naturalium Universitatis Sunyatseni, 61, 28–35, https://doi.org/10.13471/j.cnki.acta.snus.2021D077, 2022.
Stein, A. F., Draxler, R. R., Rolph, G. D., Stunder, B. J. B., Cohen, M. D., and Ngan, F.: Noaa's hysplit atmospheric transport and dispersion modeling system, Bull. Am. Meteorol. Soc., 96, 2059–2077, https://doi.org/10.1175/BAMS-D-14-00110.1, 2015.
Wan, Y., Yin, Z., Huo, Q., Zhou, B., and Wang, H.: Weather Extremes Led to Large Variability in O3 Pollution and Associated Premature Deaths in East of China, Front. Earth Sci., 10, https://doi.org/10.3389/feart.2022.947001, 2022.
Wang, J., Wang, P., Tian, C., Gao, M., Cheng, T., and Mei, W.: Consecutive Northward Super Typhoons Induced Extreme Ozone Pollution Events in Eastern China, npj Clim. Atmos. Sci., 7, 1–9, https://doi.org/10.1038/s41612-024-00786-z, 2024a.
Wang, K., Zhao, R., Wu, Q., Li, J., Wang, H., and Lin, H.: Responses of surface ozone under the tropical cyclone circulations: Case studies from Fujian Province, China, Atmos. Pollut. Res., 16, https://doi.org/10.1016/j.apr.2024.102323, 2025.
Wang, N., Ling, Z., Deng, X., Deng, T., Lyu, X., Li, T., Gao, X., and Chen, X.: Source Contributions to PM2.5 under Unfavorable Weather Conditions in Guangzhou City, China, Adv. Atmos. Sci., 35, 1145–1159, https://doi.org/10.1007/s00376-018-7212-9, 2018.
Wang, N., Huang, X., Xu, J., Wang, T., Tan, Z. M., and Ding, A.: Typhoon-boosted biogenic emission aggravates cross-regional ozone pollution in China, Sci. Adv., 8, https://doi.org/10.1126/sciadv.abl6166, 2022.
Wang, N., Wang, H., Huang, X., Chen, X., Zou, Y., Deng, T., Li, T., Lyu, X., and Yang, F.: Extreme weather exacerbates ozone pollution in the Pearl River Delta, China: role of natural processes, Atmos. Chem. Phys., 24, 1559–1570, https://doi.org/10.5194/acp-24-1559-2024, 2024b.
Wei, J., Li, Z., Li, K., Dickerson, R. R., Pinker, R. T., Wang, J., Liu, X., Sun, L., Xue, W., and Cribb, M.: Full-coverage mapping and spatiotemporal variations of ground-level ozone (O3) pollution from 2013 to 2020 across China, Remote Sens. Environ., 270, https://doi.org/10.1016/j.rse.2021.112775, 2022.
Xu, J., Zhou, D., Gao, J., Huang, X., Xue, L., Huo, J., Fu, Q., and Ding, A.: Biogenic emissions-related ozone enhancement in two major city clusters during a typical typhoon process, Appl. Geochemistry, 152, https://doi.org/10.1016/j.apgeochem.2023.105634, 2023.
Yang, L., Luo, H., Yuan, Z., Zheng, J., Huang, Z., Li, C., Lin, X., Louie, P. K. K., Chen, D., and Bian, Y.: Quantitative impacts of meteorology and precursor emission changes on the long-term trend of ambient ozone over the Pearl River Delta, China, and implications for ozone control strategy, Atmos. Chem. Phys., 19, 12901–12916, https://doi.org/10.5194/acp-19-12901-2019, 2019.
Yaoyao, C., Tong, L., Yu, W., Jin, S., Yuhong, Z., Siqi, Y., Duohong, C., and Jingyang, C.: Characteristics of Ozone Pollution in Guangdong Province from 2016 to 2020, Ecology and Environment, 31, 2374–2381, https://doi.org/10.16258/j.cnki.1674-5906.2022.12.012, 2022.
Ying, M., Zhang, W., Yu, H., Lu, X., Feng, J., Fan, Y., Zhu, Y., and Chen, D.: An Overview of the China Meteorological Administration Tropical Cyclone Database, J. Atmos. Ocean. Technol., 31, 287–301, https://doi.org/10.1175/JTECH-D-12-00119.1, 2014.
Yufeng, Z., Junjun, Y., Tingting, C., Tao, W., Huang, C., Lili, Z., Boguang, W., and Chengliang, Z.: Influence of typhoon track in northwest Pacific on ozone pollution in autumn in Shantou City, China Environmental Science, 44, 6538–6548, https://doi.org/10.19674/j.cnki.issn1000-6923.20240820.001, 2024.
Zhan, C., Xie, M., Huang, C., Liu, J., Wang, T., Xu, M., Ma, C., Yu, J., Jiao, Y., Li, M., Li, S., Zhuang, B., Zhao, M., and Nie, D.: Ozone affected by a succession of four landfall typhoons in the Yangtze River Delta, China: major processes and health impacts, Atmos. Chem. Phys., 20, 13781–13799, https://doi.org/10.5194/acp-20-13781-2020, 2020.
Zhu, L., Zhou, R., Di, D., Bai, W., and Liu, Z.: Retrieval of Atmospheric Water Vapor Content in the Environment from AHI/H8 Using Both Physical and Random Forest Methods-A Case Study for Typhoon Maria (201808), Remote Sens., 15, https://doi.org/10.3390/rs15020498, 2023.