the Creative Commons Attribution 4.0 License.
the Creative Commons Attribution 4.0 License.
 | 19 Jan 2026
Tracking surface ozone responses to clean air actions under a warming climate in China using machine learning
Jie Fang
Didier Hauglustaine
Ming Wang
Jingyi Li
Haiwei Li
Junfeng Wang
Yun Wu
Mindong Chen
Xinlei Ge
Surface ozone, a major air pollutant with important implications for air quality, ecosystems, and climate, shows long-term trends shaped by both anthropogenic and climatic drivers. Here, we developed a machine learning-based approach, namely the fixed emission approximation (FEA), to decouple the effects of meteorological variability and anthropogenic emissions on summertime ozone trends in China under the clean air actions. Anthropogenic emissions drove an approximately +23.2 ± 1.1 µg m−3 increase in summer maximum daily 8 h average ozone during 2013–2017, followed by an approximately −4.6 ± 1.5 µg m−3 decrease between 2017 and 2020 in response to strengthened emission controls. In contrast, meteorological anomalies, including heatwaves and rainfall conditions, emerged as substantial drivers of ozone variability during 2020–2023. Satellite-derived formaldehyde-to-nitrogen dioxide ratios revealed widespread urban volatile organic compounds-limited regimes for ozone production, with a shift toward nitrogen oxides-limited sensitivity under influence of heatwaves. Extending the FEA framework to assess long-term climate influences from 1970 to 2023, we find that sustained climate warming has driven a substantial increase in urban summertime ozone in China. These results demonstrate that climate change was increasingly offsetting the benefits of emission reductions and highlight the need for integrated ozone mitigation strategies that jointly address emission controls and climate adaptation in a warming world.
- Article
(5932 KB) - Full-text XML
-
Supplement
(6886 KB) - BibTeX
- EndNote


Surface ozone (O3) is a critical air pollutant that poses significant threats to human health (Knowlton et al., 2004), ecosystems (Agathokleous et al., 2020), and climate (Fishman et al., 1979; Hauglustaine et al., 1994). It forms through complex photochemical reactions involving nitrogen oxides (NOx) and volatile organic compounds (VOCs) in the presence of sunlight (Jacob, 2000; Wang et al., 2017), exhibiting a nonlinear response to its precursors (Guo et al., 2023; Liu and Shi, 2021; Wang et al., 2023a). Controlling ozone pollution remains a global environmental challenge. In recent years, China has implemented a series of national clean air actions, most notably the Air Pollution Prevention and Control Action Plan (2013–2017) and the Three-Year Action Plan for Winning the Blue-Sky War (2018–2020) (Geng et al., 2024; Zhang et al., 2019; Zheng et al., 2018), that have markedly improved air quality, particularly by reducing fine particulate matter (PM2.5) (Geng et al., 2024; Zhang et al., 2019). However, surface ozone levels have continued to rise in many regions, raising concerns over the complex drivers of ozone trends and highlighting the need for scientific attribution to guide effective mitigation strategies (Li et al., 2019a; Liu et al., 2023; Wang et al., 2023a; Weng et al., 2022).
Long-term ozone variability is jointly influenced by anthropogenic emissions and weather conditions as well as regional climate (Hallquist et al., 2016; Li et al., 2019b; Wang et al., 2022a). While emission controls directly regulate precursor abundance, climate change modulates ozone through chemical feedbacks, meteorological dynamics, and biosphere–atmosphere interactions (Ma and Yin, 2021; Xue et al., 2020). Over the past century, global surface temperatures have substantially increased relative to the pre-industrial baseline (1850–1900), driven largely by human activities (IPCC, 2021). In such a warming world, extreme climate anomalies – such as heatwaves and persistent rainfall shifts – were expected to be intensified (Li et al., 2025a, b). These events were increasingly recognized as critical modulators of ozone variability through their impacts on photochemistry and precursor emissions (Gao et al., 2023; Pu et al., 2017; Wang et al., 2022a).
Quantifying the respective roles of anthropogenic emissions and meteorological variability in driving ozone trends is therefore essential for evaluating the effectiveness of clean air policies (Li et al., 2019a; Liu et al., 2023). Previous studies have reported rapid increases in surface ozone concentrations in urban cluster regions in China – such as the Beijing–Tianjin–Hebei (BTH) and Yangtze River Delta (YRD) – during the Phase I (2013–2017), with increases of approximately 28 % and 18 %, respectively (Chen et al., 2020; Li et al., 2019a; Liu et al., 2023). In contrast, a modest decline in ozone levels was observed during 2018–2020, largely attributed to emission reductions (Li et al., 2021; Liu and Wang, 2020b; Wang et al., 2024b, 2023a). However, since 2021, observations indicate a renewed increase in ozone concentrations (Fig. S1 in the Supplement). These fluctuations suggest oscillating trends over the past decade, the drivers of which remain poorly constrained.
Two main approaches have been applied to attribute air pollution trends: chemical transport models (CTMs) (Li et al., 2021; Liu et al., 2023; Liu and Wang, 2020a) and data-driven statistical frameworks (Li et al., 2019a, b, 2020). The CTMs simulate atmospheric composition based on emission inventories, meteorological fields, and chemical mechanisms (Ivatt et al., 2022; Liu and Shi, 2021; Liu et al., 2023; Ye et al., 2024). They allow attribution of trend components to emissions or meteorology, and can also resolve sector-specific impacts. However, these models face challenges, including uncertainties and temporal lags in emission inventories. Statistical models, on the other hand, rely on observational datasets and predictor-response relationships without requiring explicit emissions or chemical schemes (Li et al., 2019a, b, 2020; Zhai et al., 2019). With the growing availability of atmospheric big data, machine learning models have emerged as useful tools for trend attribution (Dai et al., 2023; Grange et al., 2018; Vu et al., 2019; Zhang et al., 2025; Zheng et al., 2023). For instance, Grange et al. (2018) developed a random forest-based framework to isolate meteorological influences on particulate matter. Similarly, Wang et al. (2023a) used an enhanced extreme gradient boosting (XGBoost) model to analyze spatial and temporal ozone patterns in China from 2010 to 2021, confirming that emission reductions played a key role in recent declines. Other recent efforts have extended statistical models to long-term assessments of air pollution drivers under climate change (Wang et al., 2022b).
Here, we developed a machine learning-based model framework – fixed emission approximation (FEA) – to quantify the relative contribution of anthropogenic emissions and meteorological conditions in shaping summertime surface ozone trends in China. Applying the FEA to nationwide observational data from 2013 to 2023, we identified three phases of ozone evolution corresponding to the major clean air actions. We further analyzed short-term ozone anomalies associated with extreme weather events, such as the 2022 heatwave and seasonal rainfall. To characterize ozone production regimes, we integrated satellite-derived formaldehyde-to-nitrogen dioxide (HCHO NO2, FNR) ratios from the tropospheric monitoring instrument (TROPOMI), revealing spatiotemporal shifts in ozone formation sensitivity across China. Finally, we extend our FEA analysis to evaluate climate-driven ozone trends from 1970 to 2023, using historical meteorological reanalysis data. Collectively, these analyses provide an integrated understanding of how anthropogenic and climatic factors jointly shape surface ozone dynamics under a warming climate.
2.1 Data sources and methodology overview
Figure 1 provides an overview of the data analysis and methodological framework employed in this study. We first integrated multi-dimensional datasets, including hourly surface air pollutant concentrations, meteorological reanalysis fields, and satellite remote sensing data. Hourly surface observations of ozone, NO2, carbon monoxide (CO), and PM2.5 were accessed from the National Environmental Monitoring Center of China through the open website https://air.cnemc.cn:18007/ (last access: 20 May 2024). Hourly meteorological data with a spatial resolution of 0.25° × 0.25° were sourced from the ERA5 reanalysis dataset provided by the European Centre for Medium-Range Weather Forecasts (ECMWF) and are available for download at https://cds.climate.copernicus.eu (last access: 20 March 2025). Detailed variables are listed in Table S1. The time variables – hour (hour of day) and month (month of year) – are used as emission surrogates to capture regular diurnal and seasonal variations in anthropogenic activity. A similar strategy is widely applied in previous studies about long-term trends in air pollutants (e.g., Grange et al., 2018; Vu et al., 2019) to separate short-term cyclical emission variability from long-term trends. For 2013–2014, the surface MDA8 ozone data were obtained from the Tracking Air Pollution in China (TAP) dataset (Geng et al., 2021), which can be downloaded from http://tapdata.org (last access: 20 May 2024). The TROPOMI on the Sentinel-5P satellite provides global continuous observation data for two indicators of ozone precursors: NO2 and HCHO column concentrations (Lamsal et al., 2014; Shen et al., 2019). The FNR was used as a proxy for VOC NOx reactivity and as a diagnostic indicator of ozone formation sensitivity (Sillman, 1995) to explain and verify the impact of extreme weather and anthropogenic emissions on ozone. Details of the ozone sensitivity diagnostic method are provided in Sect. S1.
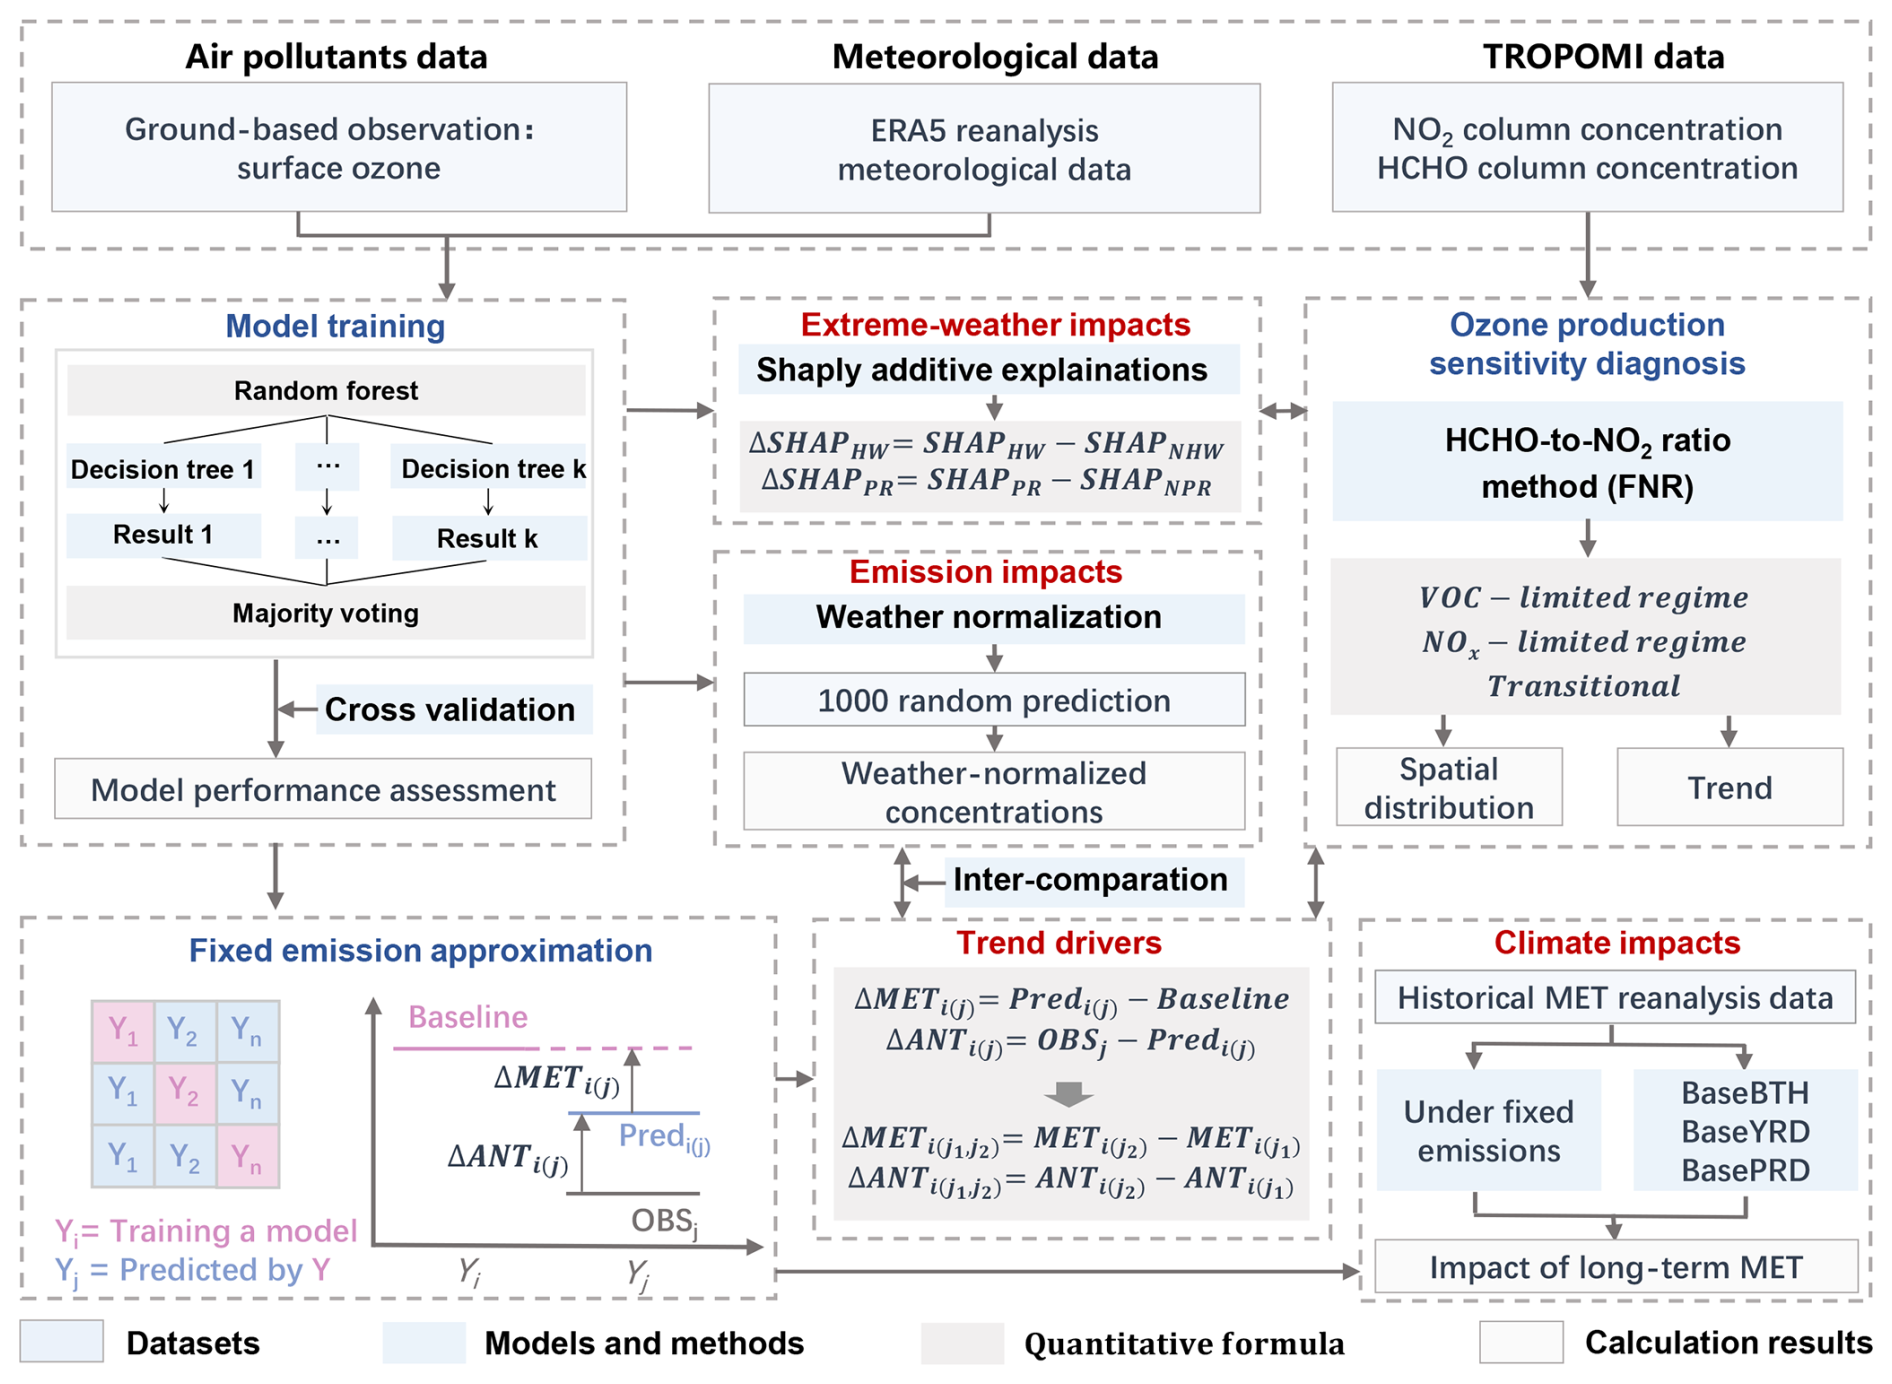
Figure 1Schematic framework of data analysis and methodology. This study integrates multi-dimensional datasets, including ground-based observations, meteorological reanalysis, and satellite remote sensing. A fixed emission approximation (FEA) approach, developed based on the random forest (RF) model, is employed to quantitatively disentangle the contributions of meteorological conditions (MET) and anthropogenic emissions (ANT) to ozone trend variations, and its performance is compared with the conventional meteorological normalization method. The SHAP technique is further applied to assess the influence of extreme weather events, such as heatwaves (HW) and prolonged rainfall (PR). The satellite-derived formaldehyde-to-nitrogen dioxide ratio (FNR) is used to diagnose ozone production sensitivity, to explain and verify the impact of extreme weather and anthropogenic emissions on ozone. Finally, the FEA framework is extended to evaluate the long-term impacts of climate change on ozone trends since 1970.
2.2 Machine learning-based FEA approach
In this study, we develop a machine learning-based FEA approach to assess the impacts of meteorological factors and anthropogenic emissions on the year-round variations in ozone concentrations (Fig. 1). First, a regression model is constructed using the random forest algorithm to relate ozone concentrations to temporal emission surrogates and to meteorological parameters at multiple atmospheric levels. These temporal emission surrogates, including month and hour, represent short-term regular emission patterns (e.g., diurnal cycles), thereby enabling the model to isolate the long-term emission-driven component of ozone changes (Grange et al., 2018; Meng et al., 2025; Shi et al., 2021; Vu et al., 2019). The meteorological parameters include 18 distinct variables at different altitudes (see Table S1). It should be noteworthy that surface air pollutant observations for each city represent multi-site averages rather than data from a single monitoring station, which reduces the influence of local representativeness uncertainty. The meteorological data are obtained from the nearest grid cell corresponding to each city, ensuring spatial consistency between the pollutant and meteorological datasets. This approach was similar to the methodologies widely adopted in previous studies (Shi et al., 2021; Wang et al., 2025; Yao et al., 2024; Zheng et al., 2023). Our modeling strategy involves building and predicting models for individual cities and for each year from 2015 to 2023, which helps in minimizing the uncertainty caused by surface heterogeneity. Due to the lack of available observational data for many cities in 2013 and 2014, we did not develop models for these two years. In our approach, 80 % of the dataset is used for model training, while the remaining 20 % is reserved for testing. We perform ten-fold cross-validation and assess model performance using seven statistical metrics, as listed in Table S2.
Following the construction of the machine learning models for individual cities and years, we introduce the FEA approach. The key principle of FEA is the assumption that the total emissions of ozone precursors remain unchanged from the baseline year. Specifically, we establish hourly-resolution models for the baseline year (i) during the summer season (June to August) as a reference for anthropogenic emissions, represented by the pink solid line in Fig. 1. These models are then applied to predict ozone concentrations under the meteorological conditions of the prediction year (j), while holding the emission levels constant at those of the baseline year (i), as shown by the blue solid line in Fig. 1. The difference between the predicted values (Predi) and the observed values (OBSi) for the baseline year (i) represents the model residuals (RESi), as shown in Eq. (1). The difference in observed MDA8 ozone concentrations between baseline year i and prediction year j is driven by the differences in meteorological conditions METi(j) and anthropogenic emission controls ANTi(j) (Eq. 2).The prediction result Predi(j) obtained by applying the model trained with data from year i to the meteorological conditions of year j, the difference between Predi(j) and Baseline (Predi) is driven by METi(j), while the difference between Predi(j) and the observed levels in year j (OBSj), minus the RESi, yields the ozone variation driven by (ANTi(j)). Therefore, METi(j) and ANTi(j) can be quantified and calculated using Eqs. (3)–(4).
The difference in observed MDA8 ozone concentrations between two different prediction years (j1, j2) is driven by the differences in meteorological conditions (ΔMETi(j1,j2)) and anthropogenic emission controls (ΔANTi(j1,j2)) (Eq. 5). The term ΔMETi(j1,j2) represents the changes in meteorological conditions and can be calculated by the difference between the predicted values, Predi(j1) and Predi(j2), for the corresponding years (Eq. 6). Similarly, the value of ΔANTi(j1,j2), representing the change in anthropogenic emissions between the two years j1 and j2, can be therefore calculated using Eq. (7). By performing these calculations, we can isolate and quantify the contributions of meteorological conditions and anthropogenic emission controls to the observed ozone trends. We used a cross-matrix research method to assess the uncertainty of FEA, with specific formulas available in Sect. S2 in the Supplement.
Model performance was first evaluated through ten-fold cross-validation, revealing high predictive skill between observed and predicted MDA8 ozone levels during 2015–2023 in the BTH regions (Fig. S2). The index of agreement (IOA) ranged from 0.96 to 0.97, with correlation coefficients (R) between 0.93 and 0.95. Root mean square errors (RMSE) and normalized mean bias (NMB) varied from 16.9 to 21.9 µg m−3 and 8 % to 25 %, respectively, indicating high model accuracy. Nationally, the model yielded R values of 0.88–0.91 and IOA of 0.93–0.95, with errors remaining within acceptable ranges (Tables S3–S8). To assess uncertainty stemming from interannual model training variability, we applied a matrix-based resampling approach (see Sect. S2). As shown in Fig. 2, the relative difference in residuals ranged from −9 % to 3 %, and remained within ±12 % for all regions – supporting the robustness of the FEA method. Notably, inclusion of time-related variables could reduce model uncertainty compared to simulations excluding these predictors. The average uncertainty decreased by approximately 2 %–4 % at the regional-mean level (Fig. S3).
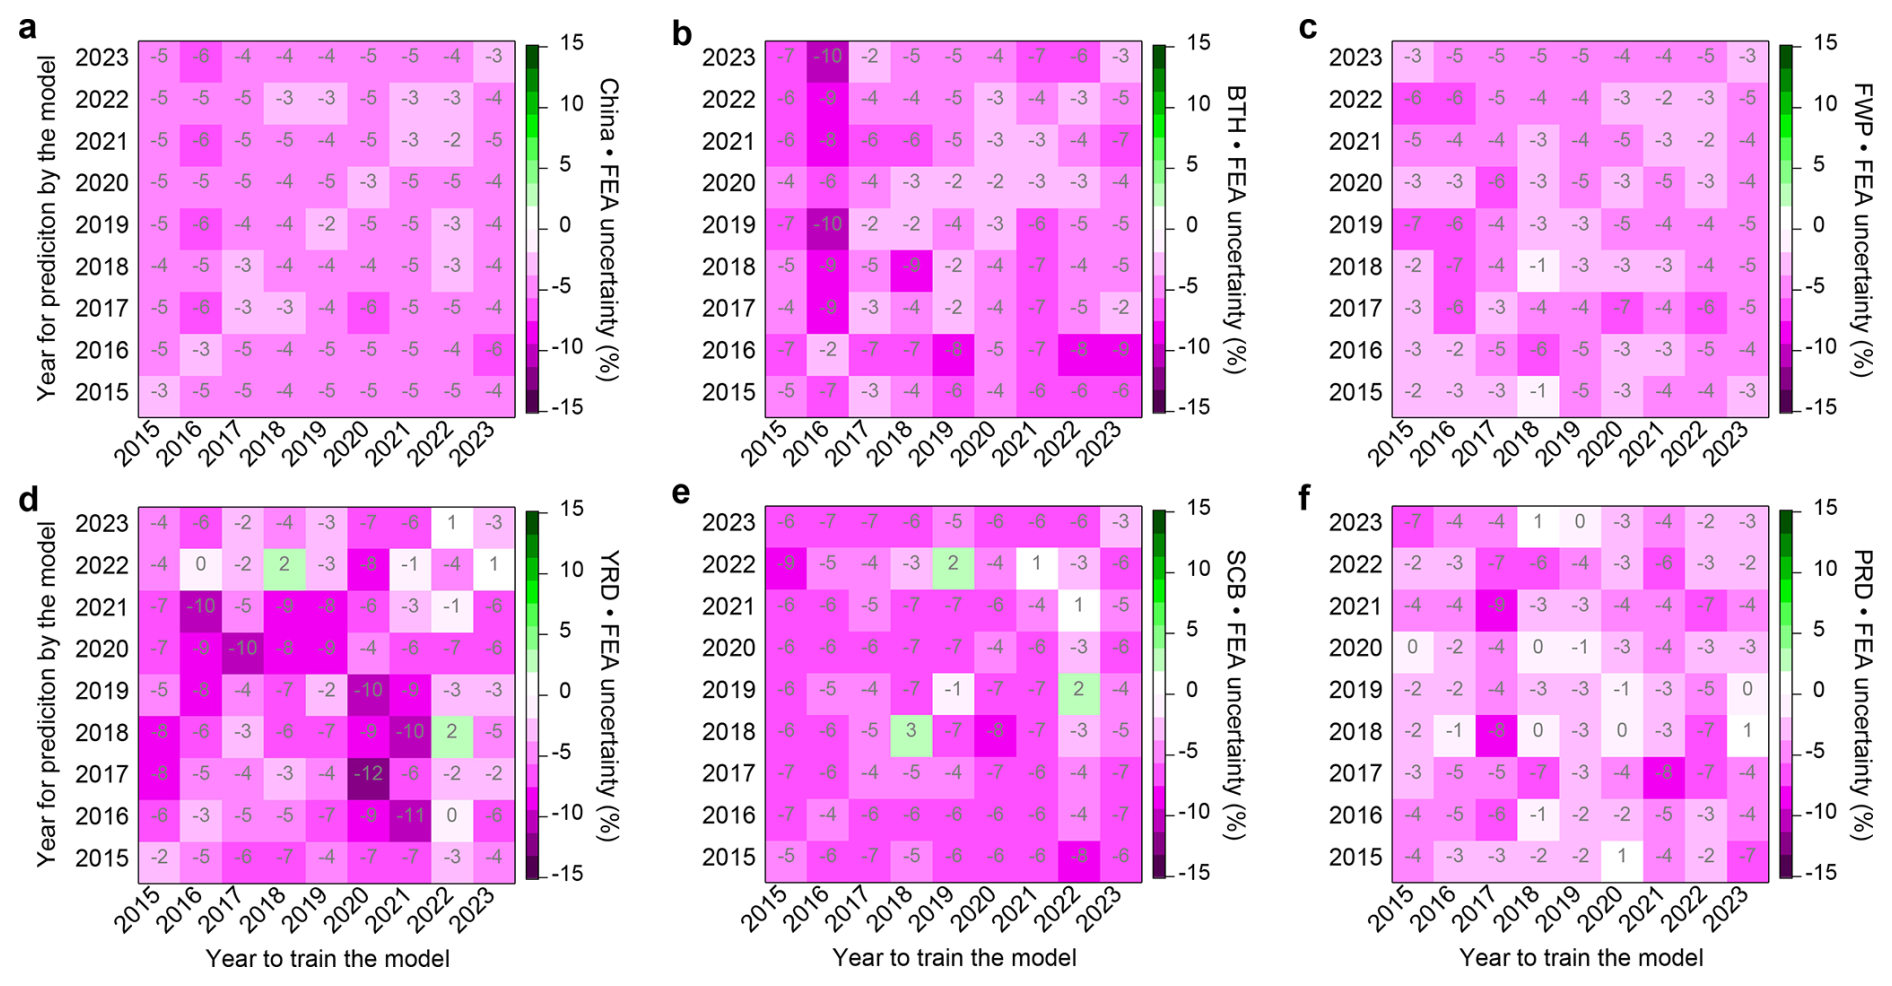
Figure 2Uncertainty assessment of the FEA method. The uncertainty for the FEA method is calculated using the approach described in Sect. S2. The x-axis represents the years used for model training, and the y-axis represents the years predicted by the trained model. The diagonal line in each sub-panel represents the changes in the residuals of the models.
2.3 Weather normalization analysis
To compare the FEA method with other commonly used statistical approaches, we also applied the widely adopted meteorological normalization technique based on the RF algorithm (Grange et al., 2018; Vu et al., 2019). This approach constructs a regression model that relates air pollutant concentrations to meteorological parameters and emission surrogate indicators (i.e., time variables such as unix time, day of year, day of month, and hour of day) (Grange et al., 2018; Vu et al., 2019). Once the model is trained, air pollutant concentrations are predicted by randomly resampling meteorological variables from long-term historical meteorological datasets, thereby generating a new ensemble of predictions (Vu et al., 2019). These predictions are made under consistent meteorological conditions, enabling the isolation of meteorological influences from anthropogenic emission effects on air pollutant trends. The resulting weather-normalized pollutant concentrations (Fig. 1) represent the levels expected under average meteorological conditions, thus reflecting the impact of emission changes alone. In this study, the meteorological normalization follows this established framework, with meteorological variables randomly sampled from the long-term dataset spanning 1970–2023. Each normalization process involves 1000 iterations, and the arithmetic mean of these iterations' simulated values was adopted as the final normalized result. The alignment between FEA-based and weather-normalized trends (Fig. S4) affirms the robustness of the FEA framework.
2.4 Quantification of extreme weather-driven changes in ozone
An unprecedented and persistent heatwave struck central and eastern China during the summer of 2022, with the YRD experiencing the most severe impacts (Wang et al., 2023b; Zhang et al., 2023). This event has been identified as the longest-lasting and most intense heatwave since at least 1961 (Mallapaty, 2022). In contrast, the Yangtze-Huaihe region is climatologically prone to sustained extreme precipitation, where prolonged rainfall episodes frequently occur during the East Asian summer monsoon (Yin et al., 2020). Together, the extreme heatwave (HW) in 2022 and recurrent prolonged rainfall (PR) events provide unique and physically realistic atmospheric conditions to investigate the impacts of typical weather extremes on surface ozone.
To quantify the contributions of extreme meteorological conditions to ozone variability, we applied the SHapley Additive exPlanations (SHAP) method (Lundberg et al., 2020) to interpret predictions from the random forest model. SHAP assigns an importance value to each input feature k, representing its marginal contribution to the model-predicted MDA8 ozone. The PR period was defined as 15 June to 15 July for each year, while the remaining period from June to August was classified as the non-prolonged rainfall (NPR) period. The HW event in 2022 was defined as 16 July to 31 August, with the same calendar period in other years designated as non-heatwave (NHW) conditions.
SHAP values were calculated for all input features during the PR and NPR periods, as well as during the HW and NHW periods, respectively. The relative changes in SHAP values (ΔSHAP) between these conditions were used to assess the responses of MDA8 ozone to the rainy season or the 2022 heatwave weather conditions, as per the following equations:
2.5 FEA-based assessment of climate change impacts on ozone
To evaluate the long-term impact of climate change on surface ozone concentrations across China from 1970 to 2023, we extended the framework of our machine learning-based FEA method. The core idea of this analysis is to isolate the influence of long-term meteorological variability on ozone while assuming fixed anthropogenic emissions. Given the availability of relatively complete and continuous hourly ozone observations and meteorological data from 2015 to 2023, this period was used to construct nine emission baseline scenarios. Following the modeling protocol described in Sect. 2.2, nine independent random forest models were trained for each city and scenario, with each year from 2015 to 2023 serving as an emissions reference. Model inputs included hourly ozone observations, key meteorological predictors, and time-related variables (hour of day and month of year). The trained models were then applied to historical meteorological reanalysis data from 1970 to 2023 to simulate ozone trends under fixed emissions (Fig. 1), yielding nine independent ozone trajectories, each reflecting the influence of long-term meteorological variability under a different fixed-emissions assumption. While the choice of emission baseline may affect the absolute magnitude of simulated ozone, it does not alter the primary objective: assessing the sensitivity of surface ozone to meteorological drivers over multidecadal timescales (Lecœur et al., 2014; Leung et al., 2018; Wang et al., 2022b). This approach could capture the climate-induced ozone signal while adopting the common assumption that emissions are not themselves influenced by climate change – a simplification consistent with prior attribution studies (Dang and Liao, 2019; Leung et al., 2018; Shen et al., 2017; Wang et al., 2022b). For comparison, we also estimated the impact of anthropogenic emission changes on ozone concentrations during 2015–2023 using the same FEA methodology and the complete hourly dataset for model training. This dual-track analysis enables a clear distinction between the impacts of climate variability and emission mitigation on observed ozone trends.
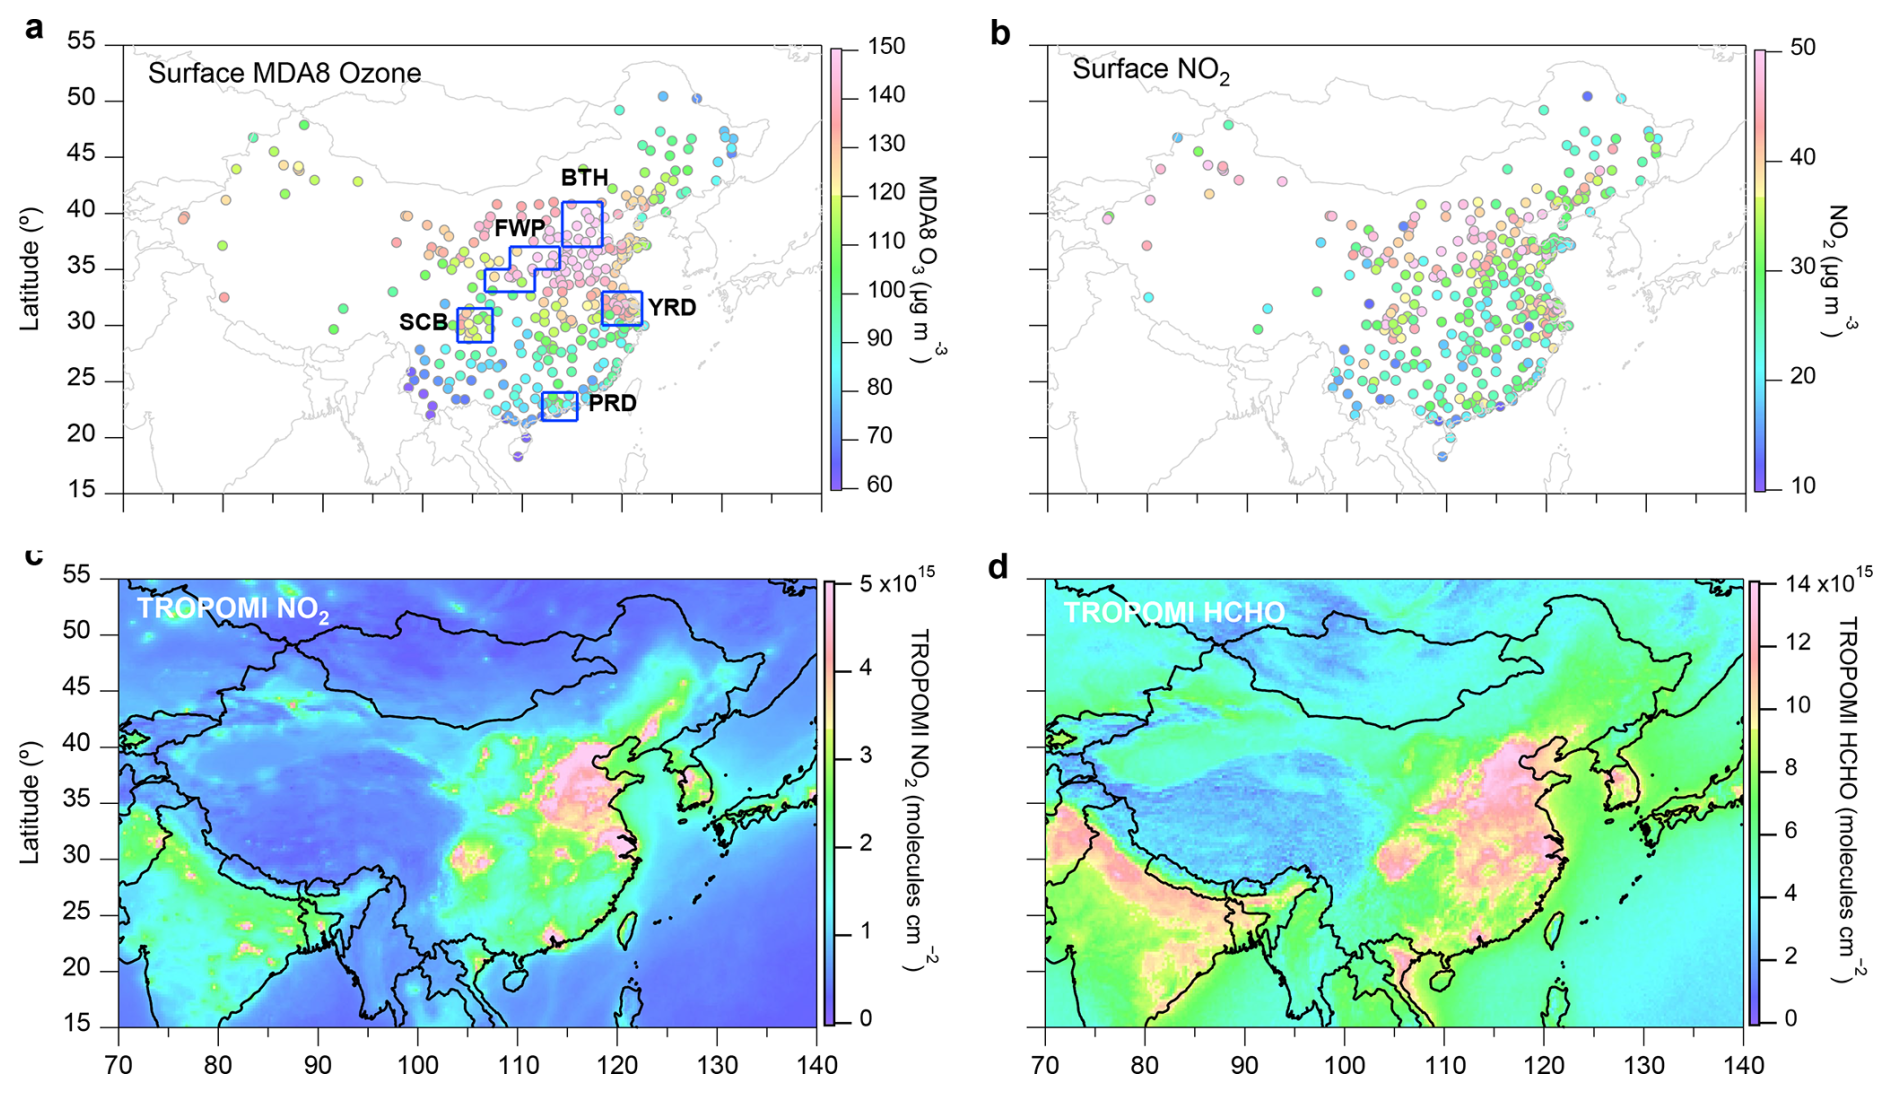
Figure 3Spatial distribution of summertime MDA8 ozone, surface NO2, and TROPOMI NO2, HCHO across major city clusters in China. The panels represent the average MDA8 ozone, surface NO2, and TROPOMI NO2, HCHO column concentrations for 354 cities in China during the summertime (June–August) from 2018 to 2023. The corresponding five regions includes BTH (37–41° N, 114–118° E); YRD (30–33° N, 118.2–122° E); SCB (28.5–31.5° N, 103.5–107° E); PRD (21.5–24° N, 112–115.5° E) and FWP (33–35° N, 106.25–111.25° E, and 35–37° N, 108.75–113.75° E).
To examine the sensitivity of urban ozone pollution to climate variability under different potential atmospheric conditions (e.g., oxidation capacity) and its possible evolution under global warming, we defined three representative regional scenarios based on typical ozone pollution characteristics in China (Fig. 3a): a high-pollution scenario for BTH (BaseBTH), a moderate-pollution scenario for YRD (BaseYRD), and a low-pollution scenario for Pearl River Delta (PRD) (BasePRD). These scenarios allow assessment of ozone trends and climate impacts under fixed emissions across three distinct atmospheric conditions.
3.1 Spatiotemporal variation of summertime ozone
Figure 3 presents the spatial distribution of the average summertime (2018–2023) maximum daily 8 h average (MDA8) ozone, surface NO2, and TROPOMI NO2, HCHO column concentrations across China, along with the locations of the country's five typical city clusters: BTH, Fenwei Plain (FWP), YRD, Sichuan Basin (SCB), and PRD. Across these five city clusters, the average summer ozone concentrations ranged from 88.9 to 161.3 µg m−3 – substantially exceeding the 43.0 µg m−3 threshold associated with ecosystem productivity loss (Gong et al., 2021) and the World Health Organization (WHO, 2021) recommended peak seasonal average of 60 µg m−3. TROPOMI satellite observations of NO2 column concentration show notably elevated concentrations over the five city clusters, particularly in the BTH, YRD, and FWP, which align with surface NO2 distribution patterns and confirm the scale of anthropogenic NOx emissions in these regions (Zheng et al., 2021). TROPOMI satellite observations of HCHO column concentrations similarly reveal these city clusters as hotspots for VOC emissions (Fig. 3d). These concurrent high levels of NO2 and HCHO suggest a strong photochemical ozone pollution potential, as the abundant precursors in these urban clusters could drive substantial ozone production during the summer months.
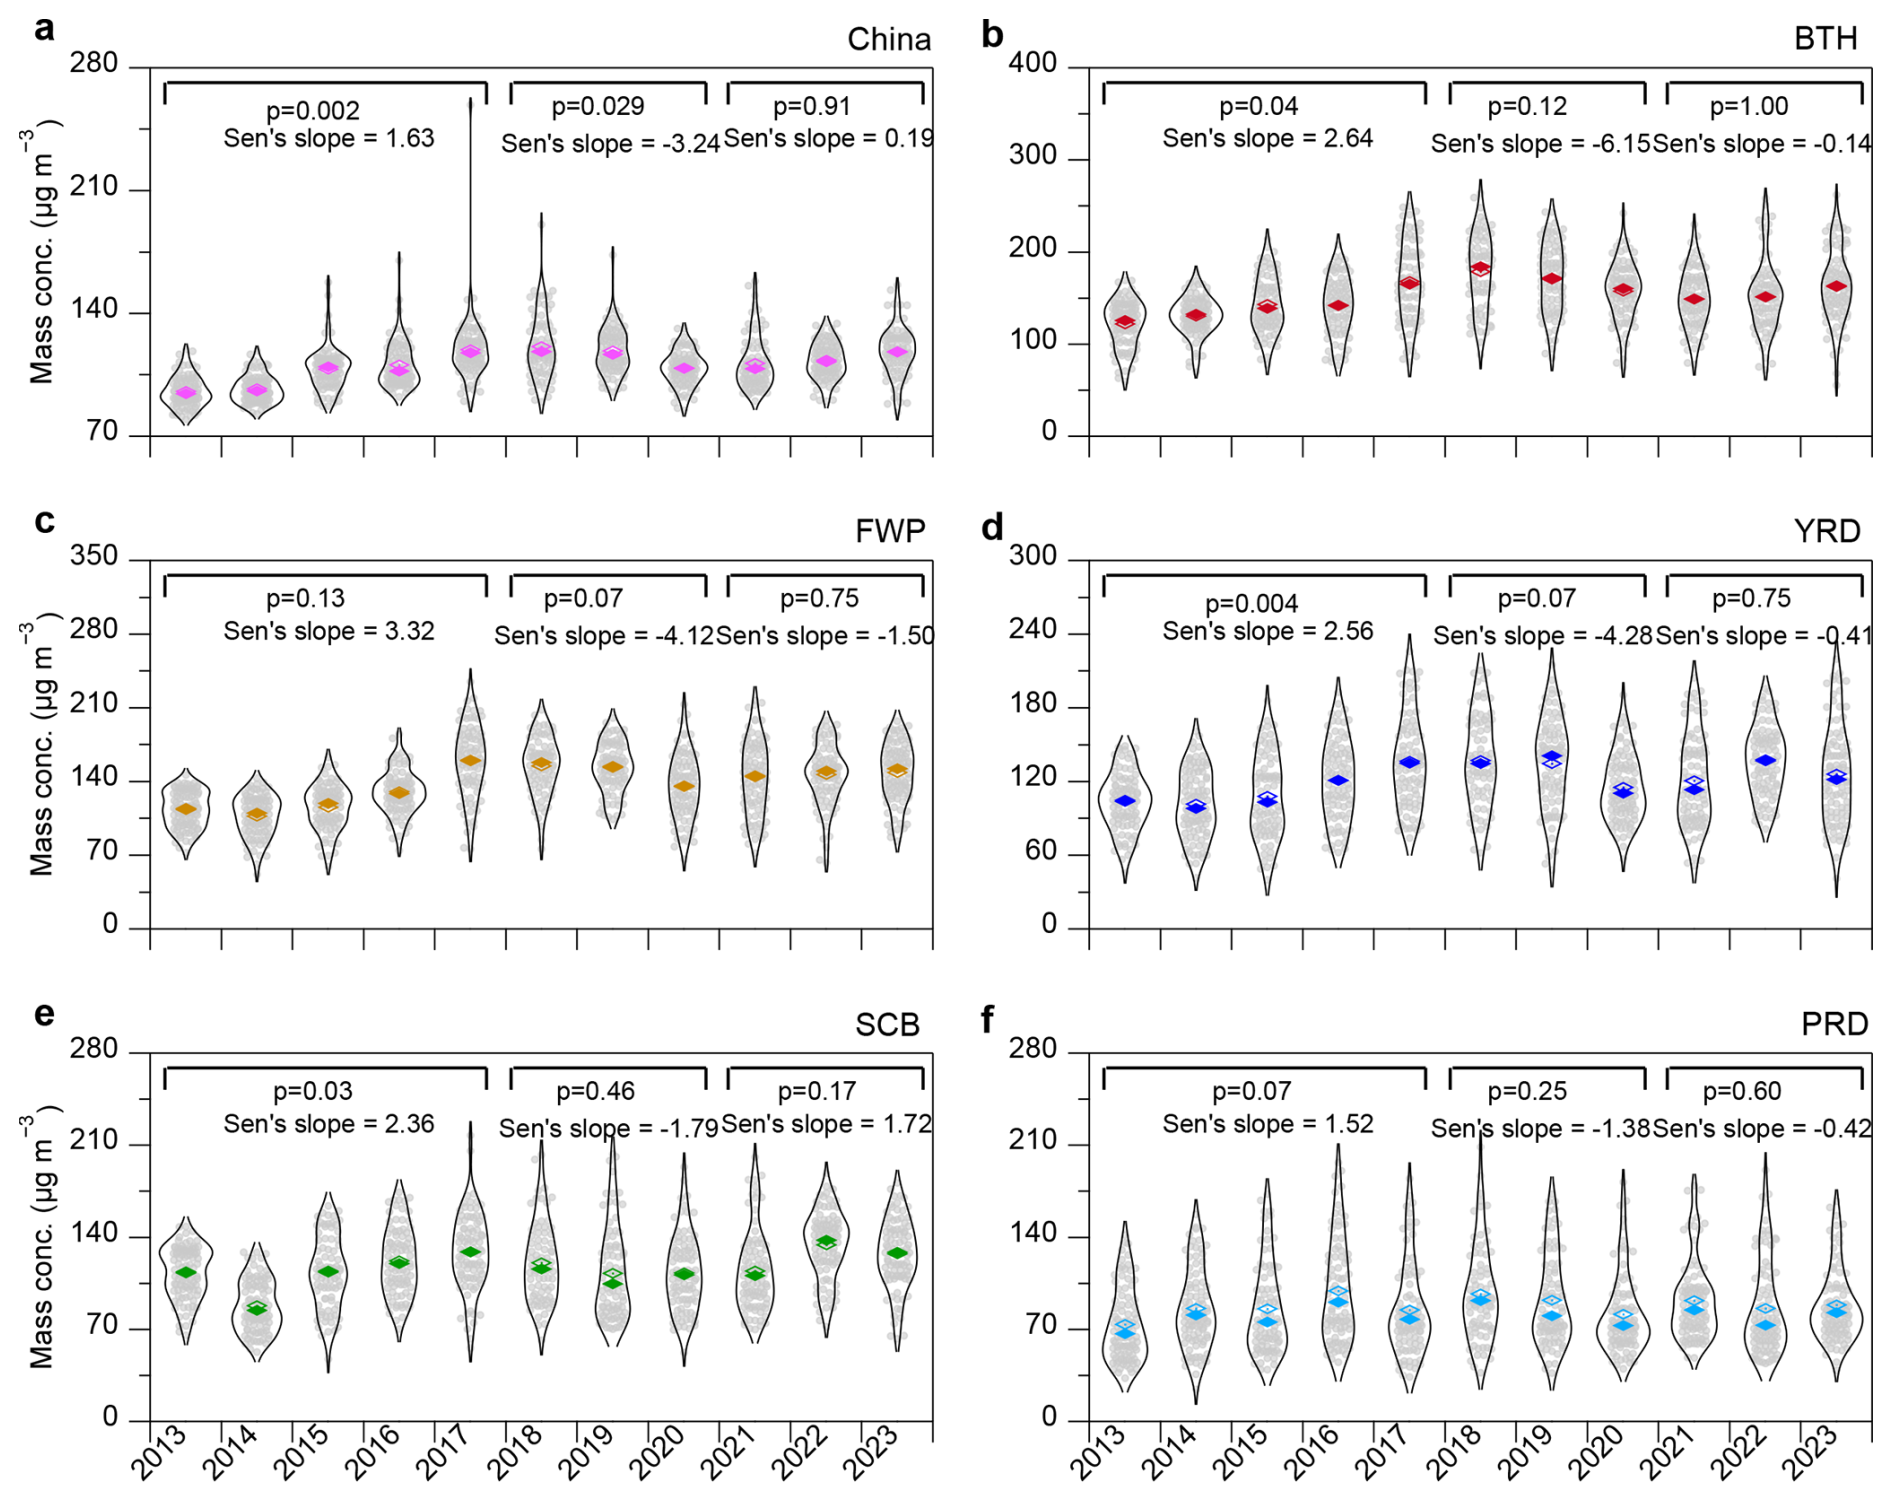
Figure 4Interannual trends of summertime MDA8 ozone across China (2013–2023). (a) The seasonal variations of MDA8 ozone during the summer months (June, July, and August) over China. (b–f) The average trend across the five city cluster regions in China: BTH, FWP, YRD, SCB, and PRD, respectively. The summer months are defined according to meteorological seasonality, encompassing June, July, and August. In the violin plots, hollow diamond markers denote the mean, while solid diamond markers represent the median. The Mann-Kendall test and Sen's slope estimator were employed to assess the statistical significance and rate of change in the monthly average MDA8 ozone concentrations. The p value represents the significance level from the Mann-Kendall test, which is used to determine the statistical significance of the trend in the data.
Figure 4 presents the interannual variations in MDA8 ozone concentrations during summertime across China, with a focus on the five city cluster regions. During the Phase I (2013–2017), the average nationwide MDA8 ozone increased significantly (p < 0.01), rising from 95.5 to 118.0 µg m−3. This growth was especially pronounced in the BTH and FWP regions, where the concentrations increased by approximately 38 % and 41 %, respectively. In contrast, ozone increases were more modest in the YRD (∼ 11 %), SCB (∼ 15 %), and PRD (∼ 16 %) regions, respectively. These results were consistent with the previous studies (Li et al., 2021; Liu and Wang, 2020a, b; Wang et al., 2023a). Corresponding to the implementation of more stringent emission controls on NOx and VOCs emissions during the Phase II (Geng et al., 2024; Liu et al., 2023), a moderate national decrease in MDA8 ozone was observed, with concentrations declining to 109.0 µg m−3 from 2017 to 2020. The declines during this period were most notable in FWP (−16 %) and YRD (−15 %), while BTH (−6 %), SCB (−11 %), and PRD (−4 %) also showed reductions compared to their concentration peaks observed in 2017. However, the MDA8 ozone rebounded, reaching 118.4 µg m−3 in 2023 – comparable to its 2017 peak – with a particularly sharp increase during the summer of 2022. From 2021 to 2023, MDA8 ozone concentrations rose by 2.8 µg m−3 in BTH, 3.1 µg m−3 in FWP, 16.1 µg m−3 in YRD, and 18.5 µg m−3 in SCB, respectively.
Figure S1 further illustrates the spatiotemporal evolution of summertime MDA8 ozone in China from 2013 to 2023. On average, approximately 68 % of the cities exceeded the WHO air quality guideline of 100 µg m−3 for the MDA8 ozone. Elevated ozone levels were primarily observed in densely populated and economically developed regions. Spatially, ozone hotspot regions expanded between 2013 and 2017 (Fig. S1a–e), followed by contraction during 2018–2020 (Fig. S1f–i). However, this progress stalled in 2021. A sharp reversal was observed in 2022, with widespread increases in MDA8 ozone (Fig. S1k). These changes could be closely linked to emission control measures and meteorological conditions, which will be further discussed in Sect. 3.2 and 3.3.
3.2 Anthropogenic emission drivers of ozone trends
To disentangle the relative impacts of anthropogenic emissions and meteorological variability on observed ozone trends, we applied the machine learning-based FEA framework described in Sect. 2.2. As illustrated in Fig. 5, anthropogenic emissions were the dominant driver of ozone increases during 2013–2017, contributing an average rise of approximately 23.2 ± 1.1 µg m−3 nationwide. The most pronounced increases occurred in the FWP and BTH (45.0 ± 2.0 and 42.1 ± 2.0 µg m−3, respectively), whereas the PRD exhibited a relatively modest enhancement (13.4 ± 1.6 µg m−3), reflecting its predominantly NOx-limited photochemical regime versus VOC-limited regimes in other regions (Ren et al., 2022). As shown in Fig. S5, the precursor gases NO2 and CO exhibited regionally distinct decreasing trends, partially explaining the spatial heterogeneity of ozone changes. The MDA8 ozone decreased by 10.5 ± 2.0 µg m−3 in BTH and 10.4 ± 3.0 µg m−3 in FWP, with smaller declines in YRD (−4.8 ± 3.8 µg m−3), SCB (−2.8 ± 2.4 µg m−3), and PRD (−6.6 ± 1.4 µg m−3) between 2017 and 2020 (Fig. 5). These trends were overall consistent with those derived using independent statistical approaches (Wang et al., 2023a). The COVID-19 pandemic (January–April 2020) introduced an unprecedented perturbation to anthropogenic activity, leading to sharp declines in industrial production, energy consumption, and transportation (Shi and Brasseur, 2020; Zheng et al., 2021). National emissions of SO2, NOx, PM2.5, and VOCs were estimated to have decreased by 0.37 Tg (12 %), 0.87 Tg (13 %), 0.25 Tg (10 %), and 1.07 Tg (12 %), respectively, relative to the same period in 2019 (Geng et al., 2024). Despite these reductions, MDA8 ozone concentrations increased by 1.7–2.3 µg m−3 across BTH, FWP, YRD, and SCB, while a slight decrease occurred in PRD (Fig. S6). Overall, ∼ 79 % of monitored cities experienced ozone increases, with a national mean enhancement of 2.1 ± 1.3 µg m−3 (Fig. S7). In the post-pandemic period (2020–2023), concentrations of NO2, CO, and PM2.5 stabilized or declined more gradually (Fig. S5), and the contribution of anthropogenic emissions to ozone variability weakened considerably (Fig. S8). Regionally, emission-driven changes ranged from −1.2 to +2.6 µg m−3 in BTH, −1.6 to +4.0 µg m−3 in FWP, −4.7 to +7.4 µg m−3 in YRD, −3.6 to +3.0 µg m−3 in SCB, and −3.8 to +7.7 µg m−3 in PRD. These results indicate that while emission controls initially yielded substantial ozone mitigation benefits during the Phase II, their effectiveness has gradually diminished, underscoring the need for more targeted and region-specific emission control strategies under evolving photochemical regimes.
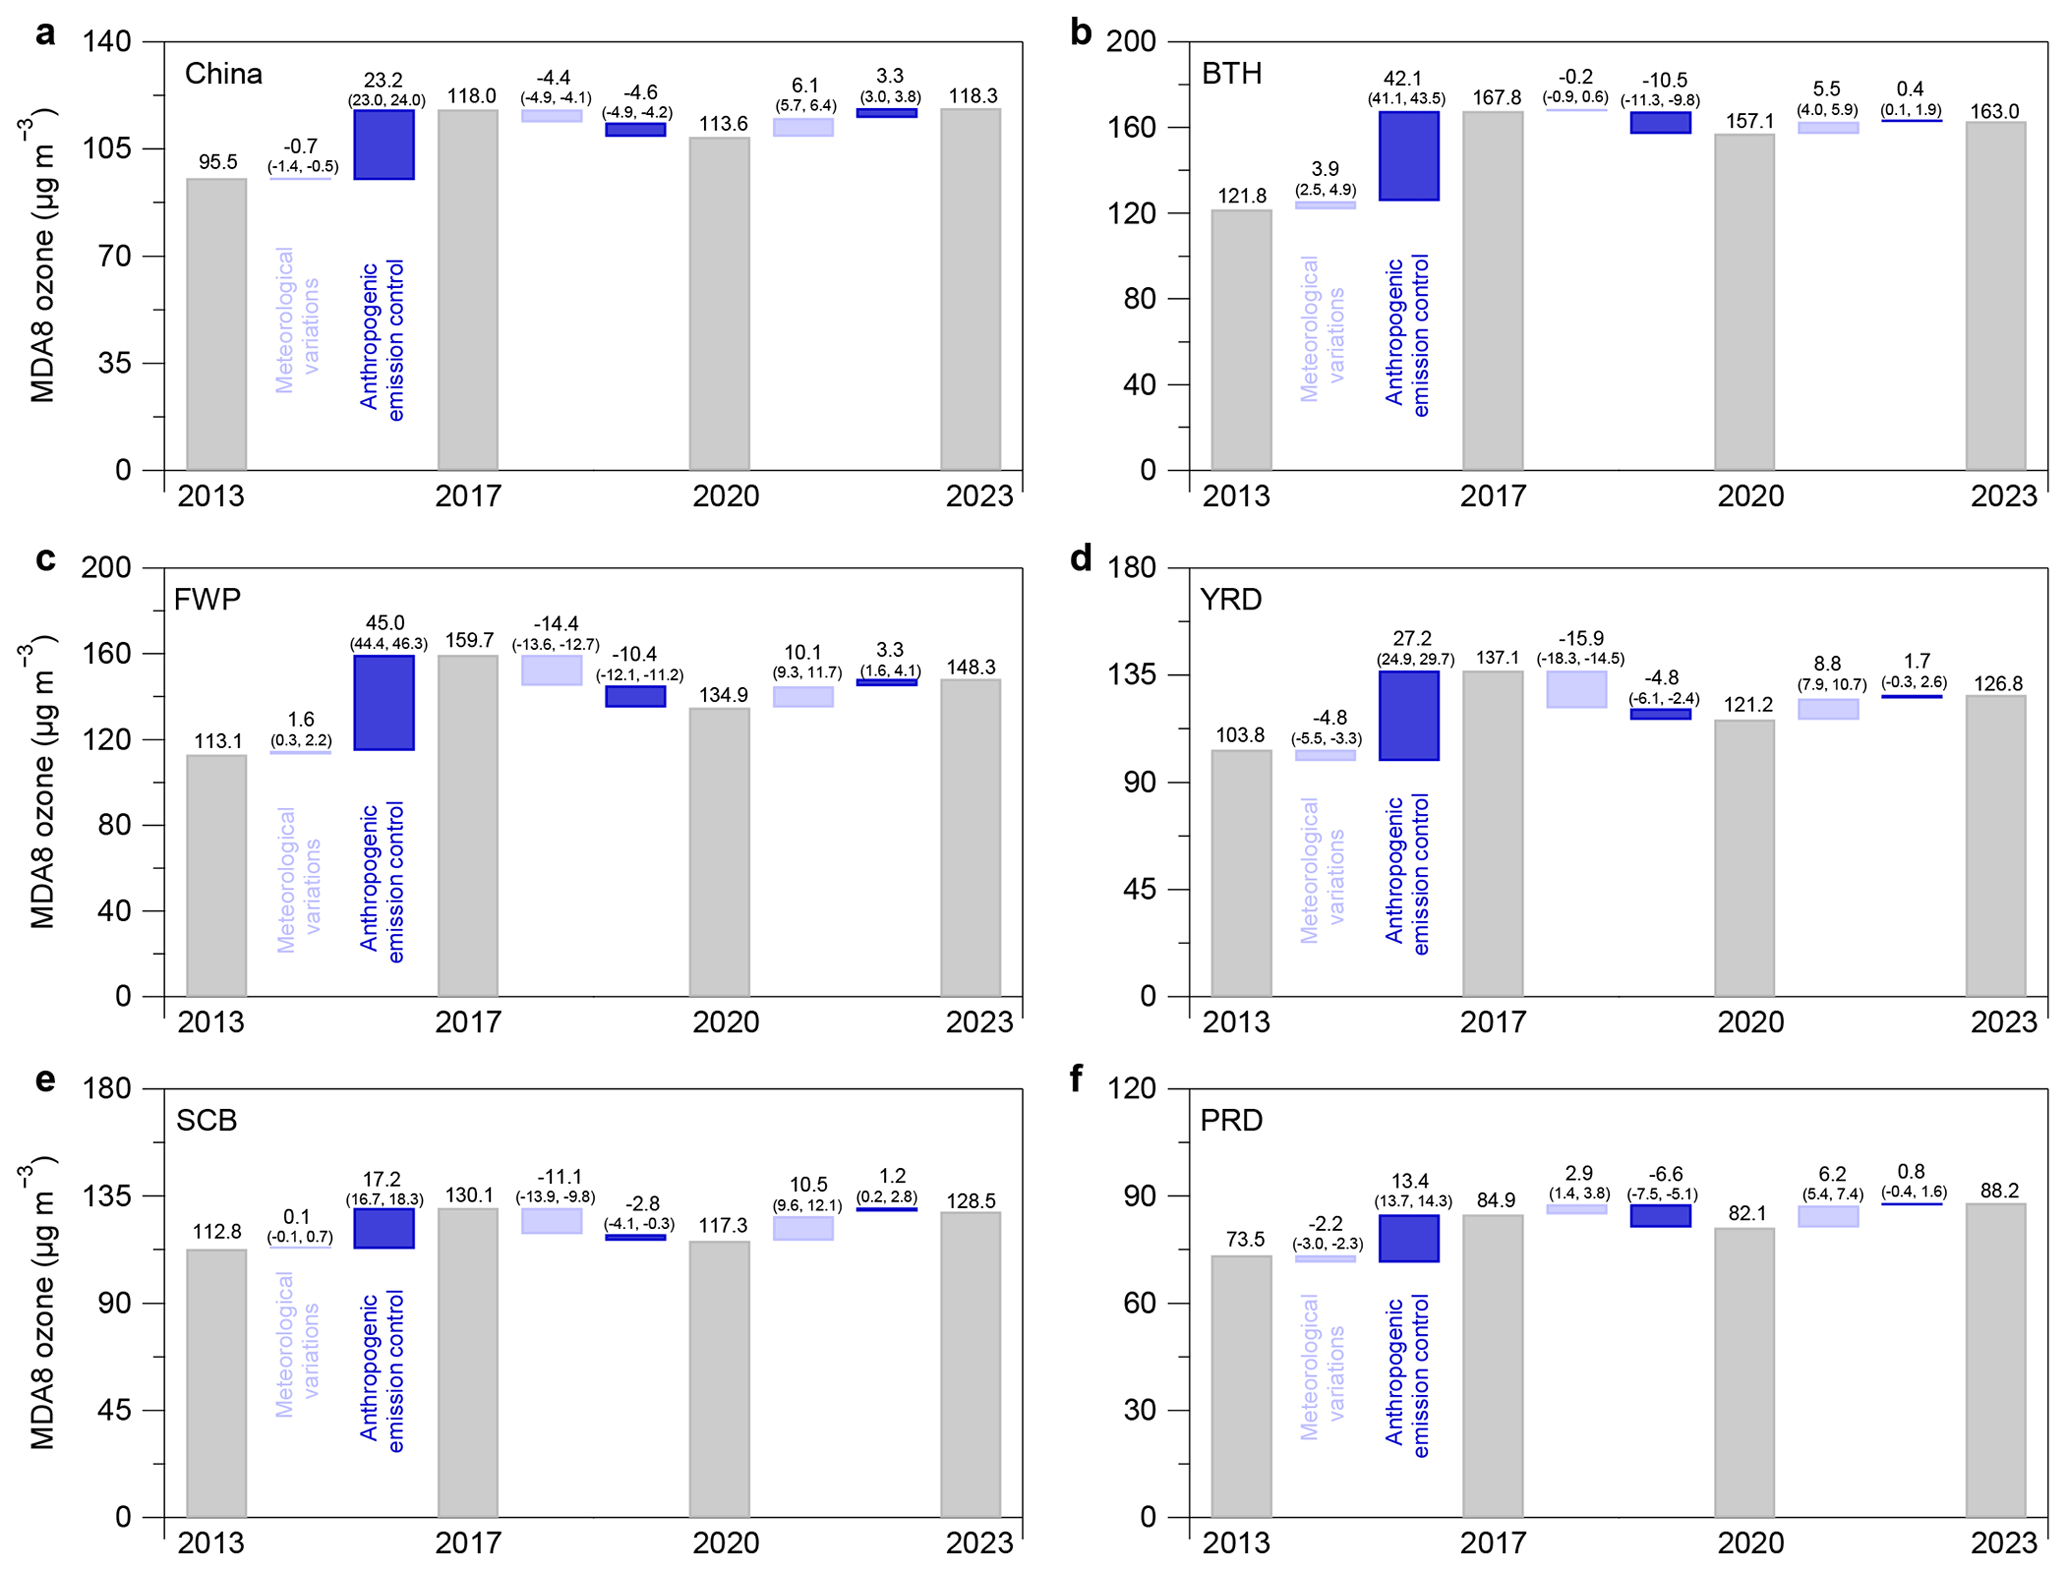
Figure 5Anthropogenic and meteorological drivers of ozone trends from 2013 to 2023. Changes in summertime MDA8 ozone concentrations were decomposed into contributions from anthropogenic emissions and meteorological variability using the FEA framework. Results reflect ensemble estimates based on multiple baseline years (2015–2023) for emissions. The interquartile range, with values in parentheses denoting the 25th and 75th percentiles across all baseline scenarios.
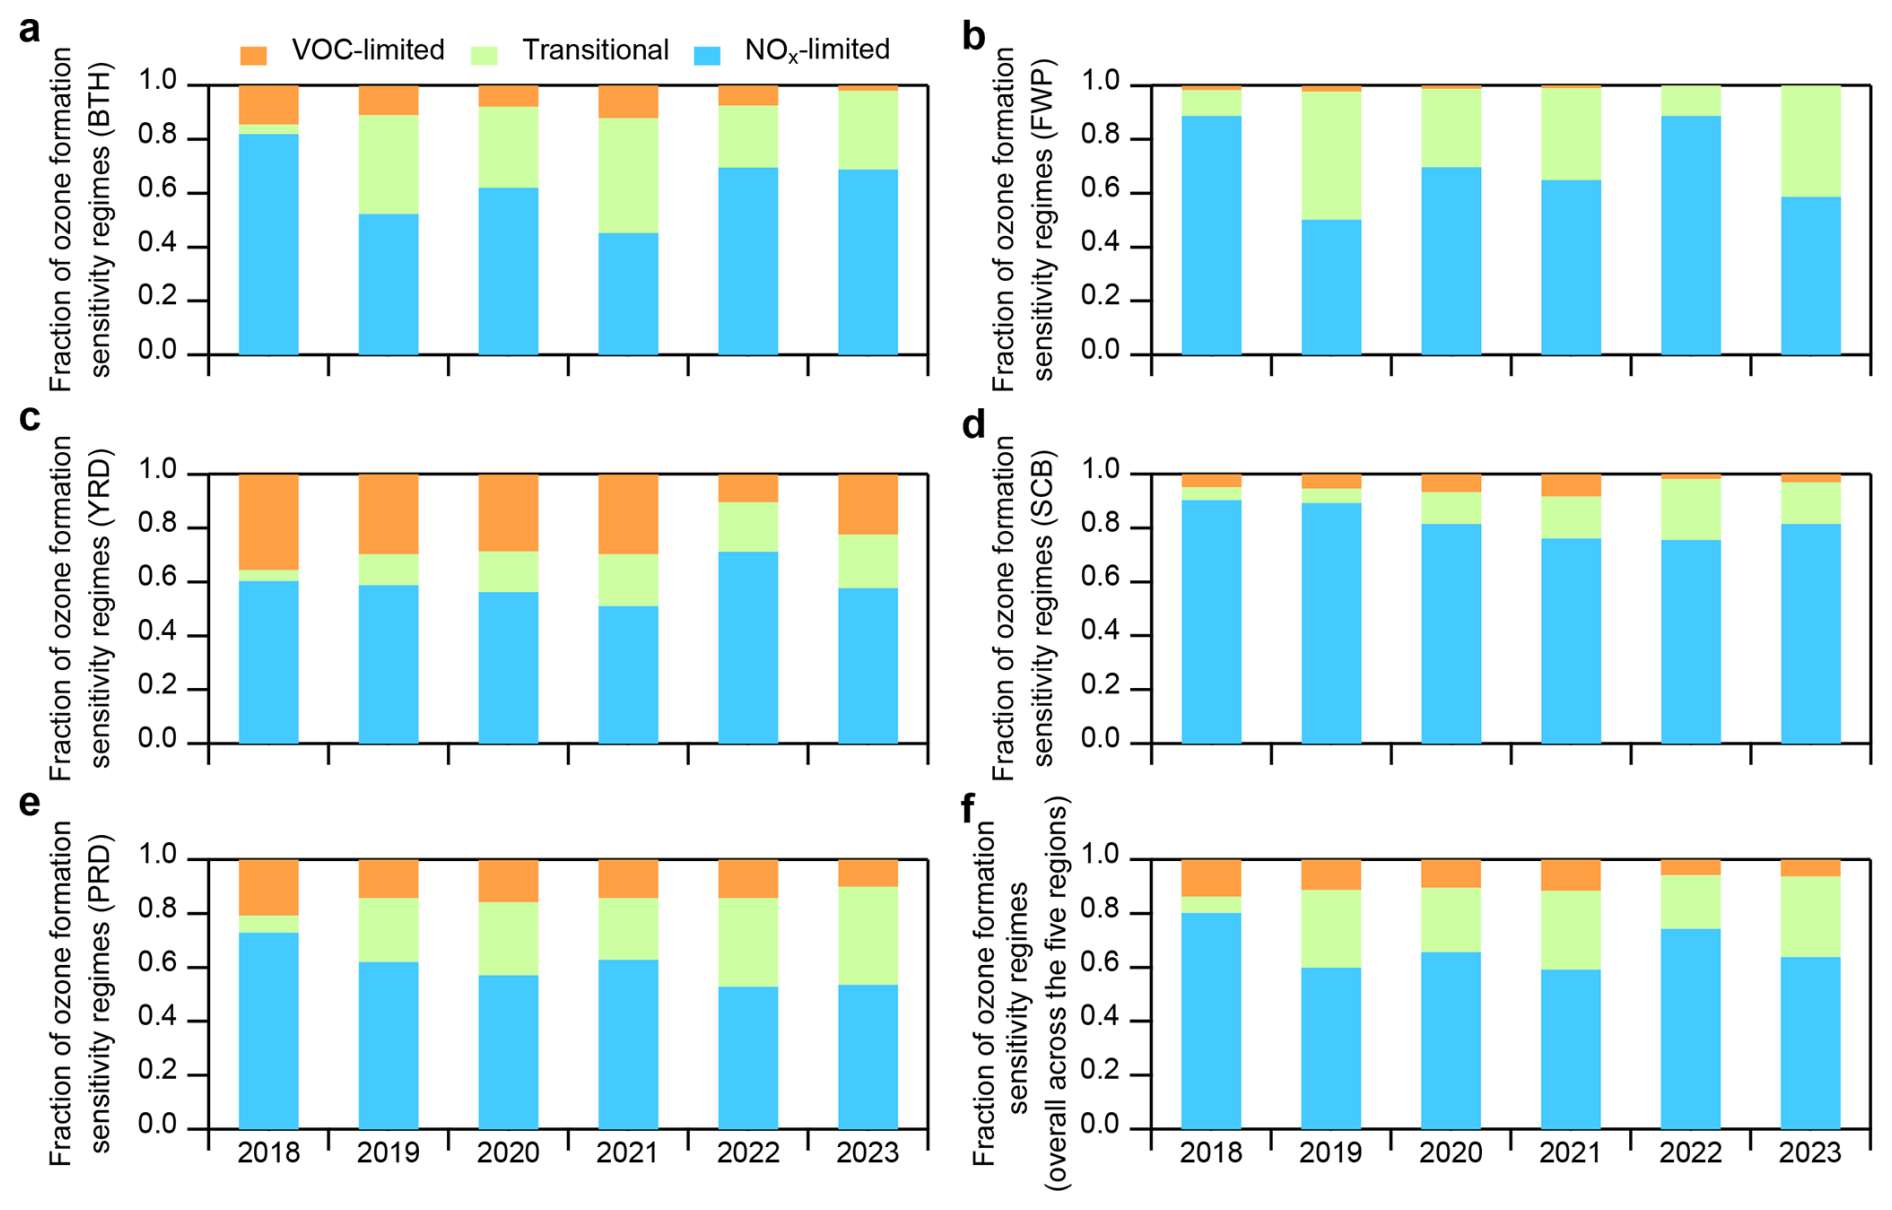
Figure 6Trends in the distributions of ozone production sensitivity regimes. Fractions of VOC-limited, NOx-limited, and transitional ozone sensitivity regimes across five key regions during the summertime (June to August) from 2018 to 2023, based on the FNR analysis. (a–e) The trend across the five city cluster regions in China during the summer months (June, July, and August): BTH, FWP, YRD, SCB, and PRD, respectively. (f) The overall trends for all five regions.
Satellite retrievals of tropospheric NO2 and HCHO from TROPOMI (Figs. S9–S10) further reveal evolving ozone production chemistry. NO2 columns exhibited strong east-west gradients, with eastern China maintaining levels five times higher than the west. Between 2018 and 2023, NO2 columns over the North China Plain (NCP) declined from 4.13 × 10¹⁵ to 3.85 × 10¹⁵ molec. cm−2, while HCHO remained stable until 2021, followed by a sharp increase in 2022. The spatial pattern of temperature anomalies between heatwave and non-heatwave periods (Fig. S11) reveals strong positive differences in the YRD and SCB, consistent with enhanced biogenic and anthropogenic VOC emissions under extreme heat (Qin et al., 2025; Tao et al., 2024). By 2023, HCHO concentrations had returned to pre-heatwave levels. To diagnose the evolving chemical sensitivity of ozone production, we examined the spatiotemporal evolution of the HCHO NO2 ratio (Sect. S1). Figure S12 shows that this ratio exhibited regionally distinct transitions from 2018 to 2023, reflecting shifts in photochemical regimes. Figure 6 summarizes the relative contributions of VOC-limited, NOx-limited, and transitional regimes across the five key regions. In BTH, NOx-limited areas accounted for ∼ 82 % of the domain in 2018 and remained above 45 % thereafter, while VOC-limited regions declined from ∼ 14 % to ∼ 2 %. In FWP, summertime ozone formation was largely controlled by NOx-limited and transitional regimes. The YRD underwent a notable shift from VOC- to NOx-limited chemistry, with VOC-limited fractions decreasing from ∼ 35 % in 2018 to ∼ 22 % in 2023, particularly during 2022 when extreme heat amplified VOC emissions and photochemical activity (Qin et al., 2025; Tao et al., 2024). The SCB region consistently exhibited strong NOx limitation (> 75 %), whereas the PRD showed a gradual expansion of the transitional regime alongside a modest contraction of VOC-limited regions. These shifts in photochemical sensitivity correspond well with the ozone decrease observed during the Phase II emission reductions. Spatial distributions of ozone formation sensitivity during the COVID-19 lockdown (Fig. S13) reveal that most of China was in a transitional regime, with major urban clusters remaining VOC-limited and only limited areas in southern China being NOx-limited. This spatial pattern aligns with the observed widespread ozone increases during the lockdown (Fig. S7). These findings highlight that ozone production chemistry in China was shaped by the complex interplay between emission reduction efforts and the rising frequency of meteorological extremes under a warming climate.
3.3 Meteorological impact on ozone variation
Figure 5 shows the interannual meteorological contributions to summertime MDA8 ozone across different emission-control phases. During the Phase I, meteorology exerted relatively weak influences on ozone variability, with contributions ranging from −4.8 to +3.9 µg m−3 – far smaller than those from anthropogenic emission changes. In contrast, meteorological anomalies became a decisive factor from 2017 to 2020, driving substantial ozone reductions. Ozone decreases attributable to meteorology reached −14.4 ± 3.0 µg m−3 in the FWP, −15.9 ± 3.8 µg m−3 in the YRD, and −11.1 ± 2.4 µg m−3 in the SCB, explaining 58 ± 12 %, 77 ± 18 %, and 80 ± 17 % of the total ozone decline, respectively. A notable shift occurred from 2020 to 2023, when the influence of extreme meteorological events increasingly dominated ozone variability. In the summer of 2022, persistent heatwaves across eastern and southern China (Mallapaty, 2022; Wang et al., 2023b) triggered sharp ozone increases of +20.8 ± 3.6 µg m−3 in the YRD and +22.1 ± 3.2 µg m−3 in the SCB, reflecting the enhanced photochemical activity under high-temperature and intense solar radiation conditions. The following summer (2023) featured anomalously heavy rainfall, resulting in sharp ozone suppression (−17.8 ± 2.3 µg m−3 in the YRD and −9.7 ± 3.3 µg m−3 in the SCB). This reduction coincided with a remarkable increase in precipitation, i.e., 102 % in YRD and 35 % in SCB (Fig. S14), indicating that rainy meteorological conditions may have suppressed ozone production.
To identify the dominant meteorological drivers, we analyzed Gini importance scores derived from the RF model across 18 predictor variables (Fig. S15). Temperature (T) emerged as the most influential predictor in the BTH and FWP regions, while shortwave solar radiation (SR), relative humidity (RH), and 850 hPa zonal wind (u850) were most important in the YRD. In the PRD, ozone variability was primarily governed by temperature and transport-related indices, including meridional winds at different altitudes. These findings are consistent with the climatological contrast between northern continental and southern coastal regimes: in northern China, stagnant anticyclonic conditions (Gong and Liao, 2019) and strong solar radiation promote photochemical production (Bao et al., 2025), whereas in southern regions, high humidity and convective rainfall could tend to suppress ozone by reducing actinic flux and enhancing removal of precursors(Lu et al., 2019).
Partial dependence analysis (Fig. S16) further illustrates the nonlinear responses of ozone to key meteorological factors (T, RH, and SR) for representative cities in each cluster, revealing clear regional contrasts. In Beijing (BTH), ozone concentrations show the strongest positive response to T (Fig. S16a), consistent with the enhancement of reaction kinetics and biogenic VOC emissions under hot conditions. This behavior reflects the thermodynamic coupling between surface heating, boundary-layer expansion, and photochemical production. In Nanjing (YRD), ozone was more sensitive to solar radiation than to temperature (Fig. S16c), highlighting the dominant role of actinic flux in controlling radical production during warm and dry conditions. Consistent with these findings, Yang et al. (2024) reported that high-temperature and low-RH conditions over the NCP and YRD could enhance photochemical ozone formation, with chemical production dominating during peak pollution periods. In the SCB, both T and RH exhibited strong influences, while ozone variability was shaped primarily by T and large-scale circulation patterns in the PRD associated with subtropical maritime flow and typhoon incursions from the Northwest Pacific (Chen et al., 2024; Wang et al., 2024a, 2022a).
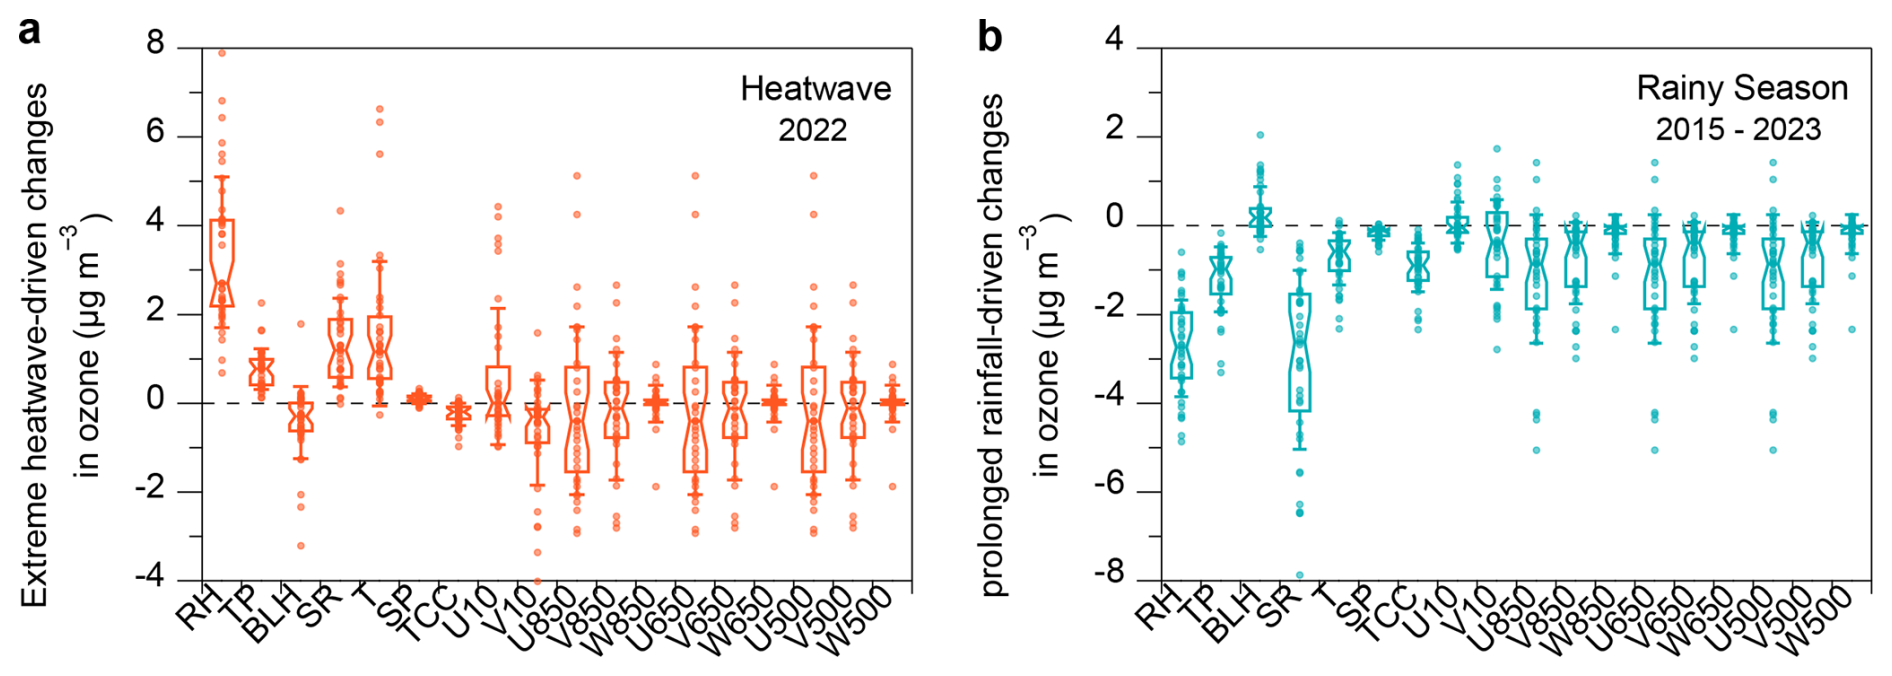
Figure 7Meteorological impact on predicted ozone concentrations under heatwave and rainy weather conditions. (a) The differences in SHAP values (ΔSHAP) between heatwave and non-heatwave periods in the Yangtze-Huaihe region during summer 2022. (b) The ΔSHAP between prolonged rainfall periods and non-prolonged rainfall periods in the same region from 2015 to 2023. Box plots show the distribution of ΔSHAP across cities; the center line indicates the median, boxes denote the interquartile range (25th–75th percentiles), and the whisker line extends to one standard deviation.
To further quantify these relationships, we applied SHAP (SHapley Additive exPlanations) analysis to evaluate the meteorological influence of the HW and the PR events in the Yangtze-Huaihe region between 2015 and 2023 (Sect. 2.4). As shown in Fig. S17, the HW events were associated with strong positive SHAP values in southeastern coastal areas, especially the YRD and SCB, driven by elevated SR and T. Mean SR during the HW periods was substantially higher than during the NHW periods (Fig. S18), increasing photochemical activity through increased radical generation and faster reaction rates. Conversely, PR events produced consistent negative SHAP contributions across all regions (Fig. S19), reflecting the combined effects of reduced photolysis, increased humidity, and efficient wet scavenging on ozone production (He and Carmichael, 1999). A multi-year comparison (Fig. 7) highlights the opposing effects of key meteorological variables – including RH, T, boundary layer height (BLH), total precipitation (TP), and surface pressure (SP) – on MDA8 ozone. The trend in ΔSHAP values under high-humidity conditions from 2015 to 2023 (Fig. S20) further confirms the model's ability to capture the suppressive effects of wet weather conditions on ozone formation.
3.4 Reshaping distributions of ozone by climate change and emission controls
To assess the long-term influence of climate change on surface ozone concentrations, we applied the FEA framework to simulate summertime ozone trends over the period 1970–2023. In this analysis, anthropogenic emissions were held constant at their 2015–2023 summertime levels, while interannual variations in meteorological variables were introduced using historical reanalysis data. This design isolates the climate-driven component of ozone trends while assuming that emission trajectories are independent of climate change – a simplification aligned with prior attribution frameworks (Wang et al., 2022b). The impact of anthropogenic emission controls was estimated by comparing observed ozone concentrations with FEA-predicted values during 2015–2023, thereby quantifying the residual effect of emissions under fixed meteorology.
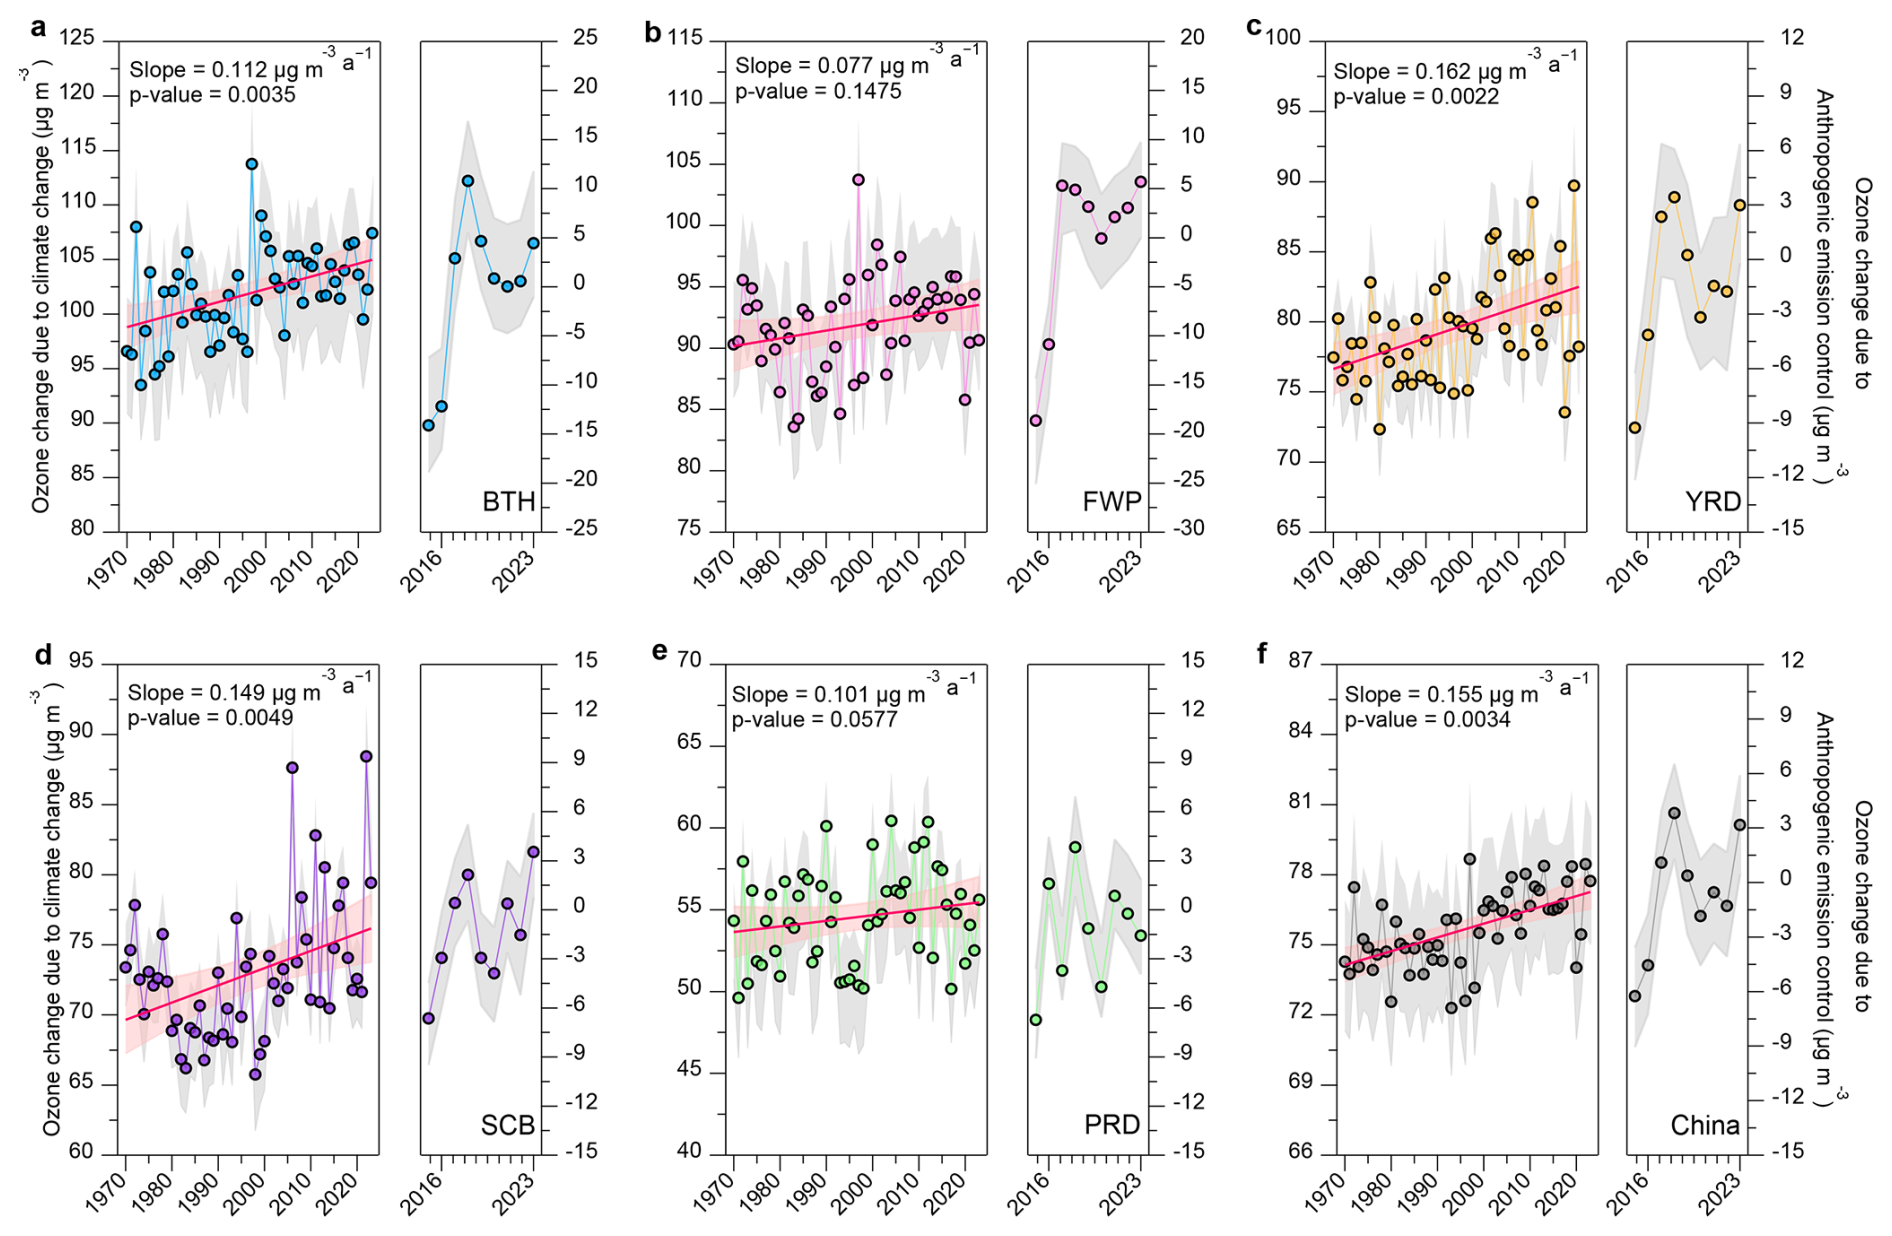
Figure 8Impact of climate change and emission controls on ozone trends. Left panels show ozone trends attributable to long-term climate change from 1970 to 2023, simulated under fixed emission scenarios using the FEA framework. Right panels depict ozone trends from 2015 to 2023, reflecting the impact of anthropogenic emission controls. Each trajectory represents results based on a distinct emissions baseline year. Shaded grey areas indicate the interquartile range (25th–75th percentiles), solid red lines denote trend estimates, and light red shading marks the 5th–95th percentile confidence intervals. Statistical significance and trend slopes were assessed using the Mann-Kendall test. More details of the sensitivity tests are provided in Fig. S18.
As shown in Fig. 8, under the 2015–2023 emission levels, climate change has exerted a statistically significant (p < 0.05) positive influence on urban summertime ozone concentrations across China, resulting in a nationwide increase of approximately 0.06 µg m−3 yr−1 since 1970. All five major urban regions displayed upward trends, with the most pronounced increase observed in the BTH and SCB at 0.12 µg m−3 yr−1. Three sensitivity simulations (see Sect. 2.5 and Fig. S21) confirm this robustness: trend slopes range from 0.11–0.14 µg m−3 yr−1 in BaseBTH (high-pollution scenario), 0.05–0.10 µg m−3 yr−1 in the BaseYRD (moderate-pollution scenario), and 0.03–0.10 µg m−3 yr−1 in the BasePRD (low-pollution scenario). Despite regional differences in chemical regimes or pollution levels, the consistent upward tendencies underscore the pervasive climatic amplification of ozone formation. These results emphasize that climate change acts as a systematic driver of ozone growth across diverse atmospheric environments, reinforcing the need to embed climate resilience within emission control strategies. Spatial correlations between climate-driven ozone increases and temperature changes (Fig. S22) further confirm that warming is the dominant contributor to long-term ozone enhancement. In particular, the correlation coefficients between ozone trends and temperature anomalies reached 0.90 (BTH), 0.89 (FWP), 0.72 (YRD), and 0.93 (SCB), indicating a strong temperature dependence of climate-induced ozone formation in these regions. The PRD showed a weaker correlation, likely due to its unique subtropical maritime climate and higher humidity and cloud cover, which tend to suppress photochemical ozone production (Yang et al., 2019). The right panel of Fig. 8 depicts summertime ozone trends from 2015 to 2023 under the combined influence of anthropogenic emissions, derived from the FEA method. Ozone concentrations rose across all regions between 2015 and 2018, declined modestly during 2018–2020, and rebounded thereafter in most regions except the PRD.
These findings are consistent with future projections that anticipate more frequent high-ozone episodes under continued warming (Li et al., 2023). Recent analyses (Yang et al., 2024) show that the frequency of high-temperature and low-humidity conditions during 2000–2019 was markedly higher than in 1980–1999, suggesting that ozone pollution in both the NCP and YRD has intensified under historical climate change. Indeed, while national emission controls curbed ozone growth after 2018, a post-2020 rebound has emerged, implying that the climatic penalty on ozone is beginning to offset emission gains. The extreme 2022 heatwave exemplified this effect, substantially enhancing photochemical activity and shifting ozone sensitivity from VOC-limited to transitional or NOx-limited regimes. Although reductions in anthropogenic precursor emissions have improved ozone control efficiency, the warming-induced enhancement of ozone increasingly interferes with – and in some regions may partially offset – the air-quality gains achieved through emission reduction efforts.
In this study, we developed a machine learning-based FEA framework to disentangle and quantify the respective roles of anthropogenic emissions and meteorological drivers in shaping ozone trends during 2013–2023. With a national-level prediction uncertainty of approximately 6 %, the FEA method provides a computationally efficient and scalable tool for diagnosing atmospheric variability across large spatial and temporal domains. However, the current model framework did not explicitly resolve grid-scale spatial heterogeneity, vegetation feedbacks, or land-use dynamics, which may influence the ozone prediction. In addition, the sensitivity of the results to spatial resolution need further investigation through coupled applications of machine learning and chemical transport models.
Our results revealed that increased anthropogenic emissions were the dominant driver of the sharp rise in summertime MDA8 ozone concentrations during the Phase I, contributing an average increase of 23.2 ± 1.1 µg m−3. In contrast, the strengthened clean air actions during the Phase II – particularly the synergistic control of NOx and VOCs – led to measurable reductions in MDA8 ozone, with national-average declines of 4.6 ± 1.5 µg m−3 from 2017 to 2020. These improvements were especially evident in regions such as BTH and FWP, where ozone formation was highly sensitive to VOCs. However, the impact of emission reductions diminished considerably during the recent period (2021–2023). This stagnation underscores the urgent need for more targeted, region-specific emission control strategies that address the shifting photochemical sensitivity of ozone formation regimes.
Using the SHAP attribution analysis, we further quantified the influence of meteorological extremes on ozone variability. Record-breaking heatwaves in 2022 enhanced ozone concentrations by up to +5.8 µg m−3, while prolonged pluvial episodes, particularly during the East Asian monsoon season, suppressed ozone by as much as −15.2 µg m−3. These results highlight the dominance of short-term meteorological extremes in shaping ozone air quality under a warming climate. Complementary satellite-based FNR diagnostics revealed that from 2018 to 2023, summertime ozone formation was predominantly influenced by NOx-limited and transitional regimes, while VOC-limited areas experienced a decline.The 2022 heatwave induced regime shifts in regions such as the YRD, where intensified VOC emissions and elevated temperatures drove transitions toward NOx-limited conditions. These findings emphasize the need for dynamic, region-specific assessments of ozone sensitivity to guide effective mitigation strategies.
To assess the climate penalty on ozone, we extended the FEA framework to simulate long-term trends from 1970 to 2023 by fixing emissions and allowing meteorological variables to evolve with observed climate trends. Our findings show that climate change has contributed to a significant upward trend in urban summertime ozone, averaging 0.06 µg m−3 yr−1, with particularly strong increases in the BTH and SCB. Good correlations between the modelled ozone and surface temperature (r = 0.72–0.93) across major urban clusters indicated that climate warming exerts a persistent control on the long-term evolution of ozone. While reductions in precursor emissions have improved ozone control efficiency, the direct enhancement of ozone by rising temperatures increasingly interferes with, and in some regions may partially offset, the air-quality benefits achieved through emission mitigation. Together, these findings highlight that effective ozone management in a warming world will require integrated strategies that jointly address emission reductions and climate adaptation.
The statistical computing in this study was based on R language software which can be download at https://www.r-project.org/ (last access: 20 February 2025).
Data are provided within the manuscript or the Supplement.
The supplement related to this article is available online at https://doi.org/10.5194/acp-26-851-2026-supplement.
YZ initiated and designed the study. YZ and JF developed the statistical methodology, model calculation, and data analysis. JF and YZ prepared the manuscript with contributions from DH, BZ, MW, JL, YS, HL, JW, YW, BY, MC, and XG.
The contact author has declared that none of the authors has any competing interests.
Publisher's note: Copernicus Publications remains neutral with regard to jurisdictional claims made in the text, published maps, institutional affiliations, or any other geographical representation in this paper. The authors bear the ultimate responsibility for providing appropriate place names. Views expressed in the text are those of the authors and do not necessarily reflect the views of the publisher.
This study was supported by the National Key Research and Development Program of China (grant no. 2023YFC3706200), the National Natural Science Foundation of China (grant no. 42207124) and Natural Science Foundation of Jiangsu Province (grant no. BK20210663).
This research has been supported by the National Key Research and Development Program of China (grant no. 2023YFC3706200), the National Natural Science Foundation of China (grant no. 42207124), and the Natural Science Foundation of Jiangsu Province (grant no. BK20210663).
This paper was edited by Zhonghua Zheng and reviewed by two anonymous referees.
Agathokleous, E., Feng, Z., Oksanen, E., Sicard, P., Wang, Q., Saitanis, C. J., Araminiene, V., Blande, J. D., Hayes, F., Calatayud, V., Domingos, M., Veresoglou, S. D., Peñuelas, J., Wardle, D. A., De Marco, A., Li, Z., Harmens, H., Yuan, X., Vitale, M., and Paoletti, E.: Ozone affects plant, insect, and soil microbial communities: A threat to terrestrial ecosystems and biodiversity, Sci. Adv., 6, eabc1176, https://doi.org/10.1126/sciadv.abc1176, 2020.
Bao, J., Li, X., Kong, L., Li, J., Chen, Q., and Zhang, Y.: Comparative analysis of the impact of rising temperatures on ozone levels in China and the United States, npj Clean Air, 1, 23, https://doi.org/10.1038/s44407-025-00023-8, 2025.
Chen, S., Wang, H., Lu, K., Zeng, L., Hu, M., and Zhang, Y.: The trend of surface ozone in Beijing from 2013 to 2019: Indications of the persisting strong atmospheric oxidation capacity, Atmos. Environ., 242, 117801, https://doi.org/10.1016/j.atmosenv.2020.117801, 2020.
Chen, Y., Lu, X., and Fung, J. C. H.: Spatiotemporal source apportionment of ozone pollution over the Greater Bay Area, Atmos. Chem. Phys., 24, 8847–8864, https://doi.org/10.5194/acp-24-8847-2024, 2024.
Dai, Q., Dai, T., Hou, L., Li, L., Bi, X., Zhang, Y., and Feng, Y.: Quantifying the impacts of emissions and meteorology on the interannual variations of air pollutants in major Chinese cities from 2015 to 2021, Sci. China Earth Sci., 66, 1725–1737, https://doi.org/10.1007/s11430-022-1128-1, 2023.
Dang, R. and Liao, H.: Severe winter haze days in the Beijing–Tianjin–Hebei region from 1985 to 2017 and the roles of anthropogenic emissions and meteorology, Atmos. Chem. Phys., 19, 10801–10816, https://doi.org/10.5194/acp-19-10801-2019, 2019.
Fishman, J., Ramanathan, V., Crutzen, P. J., and Liu, S. C.: Tropospheric ozone and climate, Nature, 282, 818–820, https://doi.org/10.1038/282818a0, 1979.
Gao, M., Wang, F., Ding, Y., Wu, Z., Xu, Y., Lu, X., Wang, Z., Carmichael, G. R., and McElroy, M. B.: Large-scale climate patterns offer preseasonal hints on the co-occurrence of heat wave and O3 pollution in China, Proc. Natl. Acad. Sci. USA, 120, e2218274120, https://doi.org/10.1073/pnas.2218274120, 2023.
Geng, G., Xiao, Q., Liu, S., Liu, X., Cheng, J., Zheng, Y., Xue, T., Tong, D., Zheng, B., Peng, Y., Huang, X., He, K., and Zhang, Q.: Tracking air pollution in China: Near real-time PM2.5 retrievals from multisource data fusion, Environ. Sci. Technol., 55, 12106–12115, https://doi.org/10.1021/acs.est.1c01863, 2021.
Geng, G., Liu, Y., Liu, Y., Liu, S., Cheng, J., Yan, L., Wu, N., Hu, H., Tong, D., Zheng, B., Yin, Z., He, K., and Zhang, Q.: Efficacy of China's clean air actions to tackle PM2.5 pollution between 2013 and 2020, Nat. Geosci., 17, 987–994, https://doi.org/10.1038/s41561-024-01540-z, 2024.
Gong, C. and Liao, H.: A typical weather pattern for ozone pollution events in North China, Atmos. Chem. Phys., 19, 13725–13740, https://doi.org/10.5194/acp-19-13725-2019, 2019.
Gong, C., Yue, X., Liao, H., and Ma, Y. M.: A humidity-based exposure index representing ozone damage effects on vegetation, Environ. Res. Lett., 16, https://doi.org/10.1088/1748-9326/abecbb, 2021.
Grange, S. K., Carslaw, D. C., Lewis, A. C., Boleti, E., and Hueglin, C.: Random forest meteorological normalisation models for Swiss PM10 trend analysis, Atmos. Chem. Phys., 18, 6223–6239, https://doi.org/10.5194/acp-18-6223-2018, 2018.
Guo, J., Zhang, X., Gao, Y., Wang, Z., Zhang, M., Xue, W., Herrmann, H., Brasseur, G. P., Wang, T., and Wang, Z.: Evolution of ozone pollution in China: what track will it follow?, Environ. Sci. Technol., 57, 109–117, https://doi.org/10.1021/acs.est.2c08205, 2023.
Hallquist, M., Munthe, J., Hu, M., Wang, T., Chan, C. K., Gao, J., Boman, J., Guo, S., Hallquist, Å. M., Mellqvist, J., Moldanova, J., Pathak, R. K., Pettersson, J. B. C., Pleijel, H., Simpson, D., and Thynell, M.: Photochemical smog in China: scientific challenges and implications for air-quality policies, Natl. Sci. Rev., 3, 401–403, https://doi.org/10.1093/nsr/nww080, 2016.
Hauglustaine, D. A., Granier, C., Brasseur, G. P., and Mégie, G.: The importance of atmospheric chemistry in the calculation of radiative forcing on the climate system, J. Geophys. Res., 99, 1173–1186, https://doi.org/10.1029/93JD02987, 1994.
He, S. and Carmichael, G. R.: Sensitivity of photolysis rates and ozone production in the troposphere to aerosol properties, J. Geophys. Res. Atmos., 104, 26307–26324, https://doi.org/10.1029/1999JD900789, 1999.
IPCC: Annex I: Observational Products, in: Climate Change 2021: The Physical Science Basis. Contribution of Working Group I to the Sixth Assessment Report of the Intergovernmental Panel on Climate Change, edited by: Masson-Delmotte, V., Zhai, P., Pirani, A., Connors, S. L., Péan, C., Berger, S., Caud, N., Chen, Y., Goldfarb, L., Gomis, M. I., Huang, M., Leitzell, K., Lonnoy, E., Matthews, J. B. R., Maycock, T. K., Waterfield, T., Yelekçi, O., Yu, R., and Zhou, B., Cambridge University Press, Cambridge, United Kingdom and New York, NY, USA, 2061–2086, https://doi.org/10.1017/9781009157896.015, 2021.
Ivatt, P. D., Evans, M. J., and Lewis, A. C.: Suppression of surface ozone by an aerosol-inhibited photochemical ozone regime, Nat. Geosci., 15, 536–540, https://doi.org/10.1038/s41561-022-00972-9, 2022.
Jacob, D. J.: Heterogeneous chemistry and tropospheric ozone, Atmos. Environ., 34, 2131–2159, https://doi.org/10.1016/S1352-2310(99)00462-8, 2000.
Knowlton, K., Rosenthal, J. E., Hogrefe, C., Lynn, B., Gaffin, S., Goldberg, R., Rosenzweig, C., Civerolo, K., Ku, J.-Y., and Kinney, P. L.: Assessing ozone-related health impacts under a changing climate, Environ. Health Perspect., 112, 1557–1563, https://doi.org/10.1289/ehp.7163, 2004.
Lamsal, L. N., Krotkov, N. A., Celarier, E. A., Swartz, W. H., Pickering, K. E., Bucsela, E. J., Gleason, J. F., Martin, R. V., Philip, S., Irie, H., Cede, A., Herman, J., Weinheimer, A., Szykman, J. J., and Knepp, T. N.: Evaluation of OMI operational standard NO2 column retrievals using in situ and surface-based NO2 observations, Atmos. Chem. Phys., 14, 11587–11609, https://doi.org/10.5194/acp-14-11587-2014, 2014.
Lecœur, È., Seigneur, C., Pagé, C., and Terray, L.: A statistical method to estimate PM2.5 concentrations from meteorology and its application to the effect of climate change, J. Geophys. Res. Atmos., 119, 3537–3585, https://doi.org/10.1002/2013JD021172, 2014.
Leung, D. M., Tai, A. P. K., Mickley, L. J., Moch, J. M., van Donkelaar, A., Shen, L., and Martin, R. V.: Synoptic meteorological modes of variability for fine particulate matter (PM2.5) air quality in major metropolitan regions of China, Atmos. Chem. Phys., 18, 6733–6748, https://doi.org/10.5194/acp-18-6733-2018, 2018.
Li, H., Yang, Y., Jin, J., Wang, H., Li, K., Wang, P., and Liao, H.: Climate-driven deterioration of future ozone pollution in Asia predicted by machine learning with multi-source data, Atmos. Chem. Phys., 23, 1131–1145, https://doi.org/10.5194/acp-23-1131-2023, 2023.
Li, J., Wang, S., Zhu, J., Wang, D., and Zhao, T.: Accelerated shifts from heatwaves to heavy rainfall in a changing climate, npj Clim. Atmos. Sci. 8, 214, https://doi.org/10.1038/s41612-025-01113-w, 2025a.
Li, K., Jacob, D.J., Liao, H., Shen, L., Zhang, Q., and Bates, K. H.: Anthropogenic drivers of 2013–2017 trends in summer surface ozone in China, Proc. Natl. Acad. Sci. USA, 116, 422–427, https://doi.org/10.1073/pnas.1812168116, 2019a.
Li, K., Jacob, D. J., Liao, H., Zhu, J., Shah, V., Shen, L., Bates, K. H., Zhang, Q., and Zhai, S.: A two-pollutant strategy for improving ozone and particulate air quality in China, Nat. Geosci., 12, 906–910, https://doi.org/10.1038/s41561-019-0464-x, 2019b.
Li, K., Jacob, D. J., Shen, L., Lu, X., De Smedt, I., and Liao, H.: Increases in surface ozone pollution in China from 2013 to 2019: anthropogenic and meteorological influences, Atmos. Chem. Phys., 20, 11423–11433, https://doi.org/10.5194/acp-20-11423-2020, 2020.
Li, M., Wang, T., Shu, L., Qu, Y., Xie, M., Liu, J., Wu, H., and Kalsoom, U.: Rising surface ozone in China from 2013 to 2017: A response to the recent atmospheric warming or pollutant controls?, Atmos. Environ., 246, 118130, https://doi.org/10.1016/j.atmosenv.2020.118130, 2021.
Li, S., Wu, L., Wang, Y., Geng, T., Cai, W., Gan, B., Jing, Z., and Yang, Y.: Intensified Atlantic multidecadal variability in a warming climate, Nat. Clim. Change, 15, 293–300, https://doi.org/10.1038/s41558-025-02252-x, 2025b.
Liu, C. and Shi, K.: A review on methodology in O3-NOx-VOC sensitivity study, Environ. Pollut., 291, 118249, https://doi.org/10.1016/j.envpol.2021.118249, 2021.
Liu, Y. and Wang, T.: Worsening urban ozone pollution in China from 2013 to 2017 – Part 1: The complex and varying roles of meteorology, Atmos. Chem. Phys., 20, 6305–6321, https://doi.org/10.5194/acp-20-6305-2020, 2020a.
Liu, Y. and Wang, T.: Worsening urban ozone pollution in China from 2013 to 2017 – Part 2: The effects of emission changes and implications for multi-pollutant control, Atmos. Chem. Phys., 20, 6323–6337, https://doi.org/10.5194/acp-20-6323-2020, 2020b.
Liu, Y., Geng, G., Cheng, J., Liu, Y., Xiao, Q., Liu, L., Shi, Q., Tong, D., He, K., and Zhang, Q.: Drivers of increasing ozone during the two phases of clean air actions in China 2013–2020, Environ. Sci. Technol., 57, 8954–8964, https://doi.org/10.1021/acs.est.3c00054, 2023.
Lu, X., Zhang, L., and Shen, L.: Meteorology and climate influences on tropospheric ozone: a review of natural sources, chemistry, and transport patterns, Curr. Pollution Rep. 5, 238–260, https://doi.org/10.1007/s40726-019-00118-3, 2019.
Lundberg, S. M., Erion, G., Chen, H., DeGrave, A., Prutkin, J. M., Nair, B., Katz, R., Himmelfarb, J., Bansal, N., and Lee, S. I.: From local explanations to global understanding with explainable AI for trees. Nat. Mach. Intell., 2, 56–67, https://doi.org/10.1038/s42256-019-0138-9, 2020.
Ma, X. and Yin, Z.: Dipole pattern of summer ozone pollution in the east of China and its connection with climate variability, Atmos. Chem. Phys., 21, 16349–16361, https://doi.org/10.5194/acp-21-16349-2021, 2021.
Mallapaty, S.: China's extreme weather challenges scientists trying to study it, Nature, 609, 888–888, https://doi.org/10.1038/d41586-022-02954-8, 2022.
Meng, Q., Zhang, Y., Zhong, S., Fang, J., Tang, L., Rao, Y., Zhou, M., Qiu, J., Xu, X., Petit, J.-E., Favez, O., and Ge, X.: Technical note: Reconstructing missing surface aerosol elemental carbon data in long-term series with ensemble learning, Atmos. Chem. Phys., 25, 7485–7498, https://doi.org/10.5194/acp-25-7485-2025, 2025.
Pu, X., Wang, T. J., Huang, X., Melas, D., Zanis, P., Papanastasiou, D. K., and Poupkou, A.: Enhanced surface ozone during the heat wave of 2013 in Yangtze River Delta region, China, Sci. Total Environ., 603–604, 807–816, https://doi.org/10.1016/j.scitotenv.2017.03.056, 2017.
Qin, M., She, Y., Wang, M., Wang, H., Chang, Y., Tan, Z., An, J., Huang, J., Yuan, Z., Lu, J., Wang, Q., Liu, C., Liu, Z., Xie, X., Li, J., Liao, H., Pye, H. O. T., Huang, C., Guo, S., Hu, M., Zhang, Y., Jacob, D. J., and Hu, J.: Increased urban ozone in heatwaves due to temperature-induced emissions of anthropogenic volatile organic compounds, Nat. Geosci., 18, 50–56, https://doi.org/10.1038/s41561-024-01608-w, 2025.
Ren, J., Guo, F., and Xie, S.: Diagnosing ozone–NOx–VOC sensitivity and revealing causes of ozone increases in China based on 2013–2021 satellite retrievals, Atmos. Chem. Phys., 22, 15035–15047, https://doi.org/10.5194/acp-22-15035-2022, 2022.
Shen, L., Mickley, L. J., and Murray, L. T.: Influence of 2000–2050 climate change on particulate matter in the United States: results from a new statistical model, Atmos. Chem. Phys., 17, 4355–4367, https://doi.org/10.5194/acp-17-4355-2017, 2017.
Shen, L., Jacob, D. J., Zhu, L., Zhang, Q., Zheng, B., Sulprizio, M. P., Li, K., De Smedt, I., González Abad, G., Cao, H., Fu, T.-M., and Liao, H.: The 2005–2016 trends of formaldehyde columns over China observed by satellites: increasing anthropogenic emissions of volatile organic compounds and decreasing agricultural fire emissions, Geophys. Res. Lett., 46, 4468–4475, https://doi.org/10.1029/2019GL082172, 2019.
Shi, X. and Brasseur, G. P.: The response in air quality to the reduction of Chinese economic activities during the COVID-19 outbreak, Geophys. Res. Lett., 47, e2020GL088070, https://doi.org/10.1029/2020GL088070, 2020.
Shi, Z., Song, C., Liu, B., Lu, G., Xu, J., Van Vu, T., Elliott, R. J. R., Li, W., Bloss, W. J., and Harrison, R. M.: Abrupt but smaller than expected changes in surface air quality attributable to COVID-19 lockdowns, Sci. Adv., 7, eabd6696, https://doi.org/10.1126/sciadv.abd6696, 2021.
Sillman, S.: The use of NOy, H2O2, and HNO3 as indicators for ozone-NOx-hydrocarbon sensitivity in urban locations, J. Geophys. Res., 100, 14175–14188, https://doi.org/10.1029/94JD02953, 1995.
Tao, C., Zhang, Y., Zhang, X., Guan, X., Peng, Y., Wang, G., Zhang, Q., Ren, Y., Zhao, X., Zhao, R., Wang, Q., and Wang, W.: Discrepant global surface ozone responses to emission- and heatwave-induced regime shifts, Environ. Sci. Technol., 58, 22288–22297, https://doi.org/10.1021/acs.est.4c08422, 2024.
Vu, T. V., Shi, Z., Cheng, J., Zhang, Q., He, K., Wang, S., and Harrison, R. M.: Assessing the impact of clean air action on air quality trends in Beijing using a machine learning technique, Atmos. Chem. Phys., 19, 11303–11314, https://doi.org/10.5194/acp-19-11303-2019, 2019.
Wang, J., Wang, P., Tian, C., Gao, M., Cheng, T., and Mei, W.: Consecutive Northward super typhoons induced extreme ozone pollution events in Eastern China, npj Clim. Atmos., Sci., 7, 244, https://doi.org/10.1038/s41612-024-00786-z, 2024a.
Wang, L., Chen, B., Ouyang, J., Mu, Y., Zhen, L., Yang, L., Xu, W., and Tang, L.: Causal-inference machine learning reveals the drivers of China's 2022 ozone rebound, Environ. Sci. Ecotech., 24, 100524, https://doi.org/10.1016/j.ese.2025.100524, 2025.
Wang, M., Chen, X., Jiang, Z., He, T.-L., Jones, D., Liu, J., and Shen, Y.: Meteorological and anthropogenic drivers of surface ozone change in the North China Plain in 2015–2021, Sci. Total Environ., 906, 167763, https://doi.org/10.1016/j.scitotenv.2023.167763, 2024b.
Wang, N., Huang, X., Xu, J., Wang, T., Tan, Z.-M., and Ding, A.: Typhoon-boosted biogenic emission aggravates cross-regional ozone pollution in China, Sci. Adv., 8, eabl6166, https://doi.org/10.1126/sciadv.abl6166, 2022a.
Wang, R., Yang, Y., Xing, X., Wang, L., Chen, J., Tang, X., Cao, J., Morawska, L., Balkanski, Y., Hauglustaine,D., Ciais, P., and Ma, J.: Stringent emission controls are needed to reach clean air targets for cities in China under a warming climate, Environ. Sci. Technol., 56, 11199–11211, https://doi.org/10.1021/acs.est.1c08403, 2022b.
Wang, T., Xue, L., Brimblecombe, P., Lam, Y. F., Li, L., and Zhang, L.: Ozone pollution in China: A review of concentrations, meteorological influences, chemical precursors, and effects, Sci. Total Environ., 575, 1582–1596, https://doi.org/10.1016/j.scitotenv.2016.10.081, 2017.
Wang, Y., Zhao, Y., Liu, Y., Jiang, Y., Zheng, B., Xing, J., Liu, Y., Wang, S., and Nielsen, C. P.: Sustained emission reductions have restrained the ozone pollution over China, Nat. Geosci., 16, 967–974, https://doi.org/10.1038/s41561-023-01284-2, 2023a.
Wang, Z. Q., Luo, H. L., and Yang, S.: Different mechanisms for the extremely hot central-eastern China in July–August 2022 from a Eurasian large-scale circulation perspective, Environ. Res. Lett., 18, https://doi.org/10.1088/1748-9326/acb3e5, 2023b.
Weng, X., Forster, G. L., and Nowack, P.: A machine learning approach to quantify meteorological drivers of ozone pollution in China from 2015 to 2019, Atmos. Chem. Phys., 22, 8385–8402, https://doi.org/10.5194/acp-22-8385-2022, 2022.
World Health Organization (WHO): WHO global air quality guidelines. Particulate matter (PM2.5 and PM10), ozone, nitrogen dioxide, sulfur dioxide and carbon monoxide, World Health Organization (WHO), ISBN 978-92-4-003422-8, 2021.
Xue, L., Ding, A., Cooper, O., Huang, X., Wang, W., Zhou, D., Wu, Z., McClure-Begley, A., Petropavlovskikh, I., Andreae, M. O., and Fu, C.: ENSO and Southeast Asian biomass burning modulate subtropical trans-Pacific ozone transport, Natl. Sci. Rev., 8, https://doi.org/10.1093/nsr/nwaa132, 2020.
Yang, L., Luo, H., Yuan, Z., Zheng, J., Huang, Z., Li, C., Lin, X., Louie, P. K. K., Chen, D., and Bian, Y.: Quantitative impacts of meteorology and precursor emission changes on the long-term trend of ambient ozone over the Pearl River Delta, China, and implications for ozone control strategy, Atmos. Chem. Phys., 19, 12901–12916, https://doi.org/10.5194/acp-19-12901-2019, 2019.
Yang, Y., Zhou, Y., Wang, H., Li, M., Li, H., Wang, P., Yue, X., Li, K., Zhu, J., and Liao, H.: Meteorological characteristics of extreme ozone pollution events in China and their future predictions, Atmos. Chem. Phys., 24, 1177–1191, https://doi.org/10.5194/acp-24-1177-2024, 2024.
Yao, T., Lu, S., Wang, Y., Li, X., Ye, H., Duan, Y., Fu, Q., and Li, J.: Revealing the drivers of surface ozone pollution by explainable machine learning and satellite observations in Hangzhou Bay, China, J. Clean. Prod., 440, 140938, https://doi.org/10.1016/j.jclepro.2024.140938, 2024.
Ye, X., Zhang, L., Wang, X., Lu, X., Jiang, Z., Lu, N., Li, D., and Xu, J.: Spatial and temporal variations of surface background ozone in China analyzed with the grid-stretching capability of GEOS-Chem High Performance, Sci. Total Environ., 914, 169909, https://doi.org/10.1016/j.scitotenv.2024.169909, 2024.
Yin, Y., Han, C., Yang, G., Huang, Y., Liu, M., and Wang, X.: Changes in the summer extreme precipitation in the Jianghuai plum rain area and their relationship with the intensity anomalies of the south Asian high, Atmos. Res., 236, 104793, https://doi.org/10.1016/j.atmosres.2019.104793, 2020.
Zhai, S., Jacob, D. J., Wang, X., Shen, L., Li, K., Zhang, Y., Gui, K., Zhao, T., and Liao, H.: Fine particulate matter (PM2.5) trends in China, 2013–2018: separating contributions from anthropogenic emissions and meteorology, Atmos. Chem. Phys., 19, 11031–11041, https://doi.org/10.5194/acp-19-11031-2019, 2019.
Zhang, D. Q., Chen, L. J., Yuan, Y., Zuo, J. Q., and Ke, Z. J.: Why was the heat wave in the Yangtze River valley abnormally intensified in late summer 2022?, Environ. Res. Lett., 18, https://doi.org/10.1088/1748-9326/acba30, 2023.
Zhang, Q., Zheng, Y., Tong, D., Shao, M., Wang, S., Zhang, Y., Xu, X., Wang, J., He, H., Liu, W., Ding, Y., Lei, Y., Li, J., Wang, Z., Zhang, X., Wang, Y., Cheng, J., Liu, Y., Shi, Q., Yan, L., Geng, G., Hong, C., Li, M., Liu, F., Zheng, B., Cao, J., Ding, A., Gao, J., Fu, Q., Huo, J., Liu, B., Liu, Z., Yang, F., He, K., and Hao, J.: Drivers of improved PM2.5 air quality in China from 2013 to 2017, Proc. Natl. Acad. Sci. USA, 116, 24463–24469, https://doi.org/10.1073/pnas.1907956116, 2019.
Zhang, Y., Li, N., Tang, K., Wang, M., Li, H., Li, K., Zheng, B., Zhang, Q., Gao, M., and Fang, J. J. S. A.: Widespread surface ozone reduction triggered by dust storm disturbance on ozone production and destruction chemistry, Sci. Adv., 11, eadr4297, https://doi.org/10.1126/sciadv.adr4297, 2025.
Zheng, B., Tong, D., Li, M., Liu, F., Hong, C., Geng, G., Li, H., Li, X., Peng, L., Qi, J., Yan, L., Zhang, Y., Zhao, H., Zheng, Y., He, K., and Zhang, Q.: Trends in China's anthropogenic emissions since 2010 as the consequence of clean air actions, Atmos. Chem. Phys., 18, 14095–14111, https://doi.org/10.5194/acp-18-14095-2018, 2018.
Zheng, B., Zhang, Q., Geng, G., Chen, C., Shi, Q., Cui, M., Lei, Y., and He, K.: Changes in China's anthropogenic emissions and air quality during the COVID-19 pandemic in 2020, Earth Syst. Sci. Data, 13, 2895–2907, https://doi.org/10.5194/essd-13-2895-2021, 2021.
Zheng, H., Kong, S., Zhai, S., Sun, X., Cheng, Y., Yao, L., Song, C., Zheng, Z., Shi, Z., and Harrison, R. M.: An intercomparison of weather normalization of PM2.5 concentration using traditional statistical methods, machine learning, and chemistry transport models, npj Clim. Atmos. Sci., 6, 214, https://doi.org/10.1038/s41612-023-00536-7, 2023.