the Creative Commons Attribution 4.0 License.
the Creative Commons Attribution 4.0 License.
 | 17 Jun 2026
Impact of northward tropical cyclones on ozone in Southeastern China
Shanshan Ouyang
Tao Deng
Jingyang Chen
Xiaoyang Chen
Jinnan Yuan
Yanyan Huang
Shaw Chen Liu
Autumn ozone pollution over Southeastern China (SEC) is usually influenced by tropical cyclones (TCs). Based on statistical analysis, WRF-CMAQ simulation, and TC vortex filtering method, this study explores the effects of the intensity and location of northward TCs on ozone in SEC. Results show that autumn maximum daily 8 h average ozone during 2014–2024 is strongly affected by northward TCs reaching typhoon (TY) intensity or above, especially within 120–130° E and 20–30° N. As TCs within this key subregion intensify to TY, SEC develops stronger subsidence, fewer clouds, stronger solar radiation, higher boundary layer height, lower relative humidity, weaker precipitation, and weaker surface winds, which jointly enhance ozone compared to other intensities. When TC intensity exceeds TY, the favorable meteorological conditions established at TY are no longer maintained, and ozone over SEC remains high but declines slightly, as confirmed by two simulations with intensifying TCs. In addition, comparison with the sensitivity experiment combining TC vortex removal with a weaker non-TC radiative regime revealed that the dynamical and radiative effects of northward TCs elevated ozone by over 10 ppb, with changes in biogenic emissions contributing approximately 1–3 ppb. Moreover, for TCs near 20° N, they primarily enhance ozone through photochemical production and horizontal transport, with impacts on southern SEC persisting even after landfall at 30° N. Finally, it is important to recognize the non-linear interaction between TCs and large-scale circulation such as the western Pacific subtropical high, which modulates TC tracks and intensity and subsequently influences ozone over SEC and even across the eastern China.
- Article
(17566 KB) - Full-text XML
-
Supplement
(2410 KB) - BibTeX
- EndNote


Tropospheric ozone (O3) is a product of photochemical reaction between volatile organic compounds (VOCs) and nitrogen oxides (NOx) under sunlight (Lu et al., 2019). It is a typical secondary pollutant and one of the important factors causing the complex air pollution in China (Professional Committee of Ozone Pollution Control of Chinese Society for Environmental Sciences, 2024; Trainer et al., 2000; Zhan et al., 2023). Excessive surface ozone concentration has adverse effects on both human health (Jacob and Winner, 2009) and ecosystems (Grulke and Heath, 2020). In addition to large-scale anthropogenic emissions caused by economic development and urban expansion (Feng et al., 2025; Liu et al., 2023b; Xie et al., 2016), synoptic meteorological patterns that bring high temperature, intense solar radiation, low humidity, low wind speed, and other unfavorable meteorological conditions, also play an important role in the formation and accumulation of ozone in various regions (Li et al., 2023b; Liu et al., 2024, 2025).
As a mesoscale weather system that forms and develops over the western Pacific Ocean, Tropical cyclones (TCs) significantly influence the generation, accumulation, transport, and removal of ozone in Southeastern China (SEC) (Qu et al., 2021; Wang et al., 2024a). Statistical analyses indicate that ozone pollution episodes are more likely to occur and persist before TCs land and after TCs dissipate (Xi et al., 2025a; Xi et al., 2025b), when the central location of TC is about 500–4500 km from land (Chen et al., 2021; Hu et al., 2023), when the intensity is of at least a strong tropical storm grade (Qu et al., 2021), or when the moving track follows an offshore-turning or northward type (Deng et al., 2019; Lam et al., 2018; Ding et al., 2023). Numerical simulations have further explored the combined effects of TC and the western Pacific subtropical high (WPSH) (Liu et al., 2023a; Ouyang et al., 2022; Shu et al., 2016), TC-induced stratospheric ozone intrusion (Chen et al., 2022; Zhan and Xie, 2022), changes in the vertical structure of the boundary layer and ozone concentration by TC (He et al., 2021; Huang et al., 2021; Li et al., 2022), enhancement of TC on biogenic emissions and cross-regional transport (Wang et al., 2022, 2024b; Xu et al., 2023), and complex regional ozone variations caused by consecutive TCs (Wang et al., 2024a; Zhan et al., 2020). Moreover, through the Integrated Process Rate method provided by atmospheric chemical models, previous studies have elucidated the impacts of TCs on tropospheric ozone in SEC via generation, transport, and other related processes (Ouyang et al., 2022; Qu et al., 2021; Xu et al., 2024a). However, current quantitative studies of TCs impact on ozone primarily focus on physical and chemical process contributions. Complex interactions with other weather systems pose challenges in isolating and quantifying the specific contribution of TC and its intensity variations (Ouyang et al., 2022; Hu et al., 2024).
To reduce vortex initial position and intensity errors on forecast accuracy in TC simulations, the vortex separation and construction theory along with subsequent improvements proposed by (Kurihara et al., 1993, 1995), are commonly used combined with TC relocation to reconstruct vortex structures (Xu et al., 2019; Huang et al., 2018; Wu et al., 2020b). This method not only improves the accuracy of numerical weather prediction but also provides a foundation for quantifying the contributions of TC and its intensity. For example, Tang et al. (2023) conducted sensitivity experiments that separated the effects of multiple tropical cyclones one by one to investigate the mechanism of the extremely heavy rainfall in Henan Province in 2021. Similarly, Zhao et al. (2021) systematically analyzed the effects of Typhoon Lekima (2019) on extreme heat days along the southeastern coast of China by comparing a control WRF simulation with sensitivity experiments that removed either the entire vortex or only its horizontal wind from the initial conditions. Furthermore, Lin et al. (2024) utilized the bogus model and found that the existence of TC enhanced the regional easterly wind anomaly over the North China Plain (NCP), thereby causing a positive anomaly in surface PM2.5 concentration. However, the application of vortex removal methods in quantifying TC contributions to ozone remains relatively limited.
The Northward TC, as an important weather pattern influencing the interannual fluctuations of autumn ozone concentrations in SEC (Hu et al., 2023, 2024), clarifying how its varying intensities regulate meteorological conditions and atmospheric circulation to differentially impact ozone concentration changes, can provide crucial scientific support for developing targeted ozone management strategies during period of northward TC influence. Therefore, this study employs observational and reanalysis data to statistically analyze the effects of meteorological factors and atmospheric circulation patterns on SEC ozone under different intensities of northward TCs during autumn from 2014 to 2024. Furthermore, through WRF-CMAQ numerical simulation and TC intensity sensitivity experiments, we quantitatively evaluate the contributions of TC intensity and location to SEC ozone during two severe ozone pollution episodes.
2.1 Data
Hourly ozone concentration monitoring data over SEC (105–123° E and 18–32° N) in autumn from 2014 to 2024 were obtained from the China National Environmental Monitoring Centre (available at http://www.cnemc.cn/en/, last access: 19 November 2025). The maximum daily 8 h average (MDA8) ozone concentration is calculated based on the hourly concentration values.
The TC track information, including position and intensity at a temporal resolution of 6 h used in this study was obtained from the China Meteorological Administration Tropical Cyclone Data Centre (available at https://tcdata.typhoon.org.cn/, last access: 19 November 2025). The TC intensity is classified into six categories based on the maximum sustained wind speed near its surface centre (Lu et al., 2021; Ying et al., 2014): Tropical Depression (TD: 10.8–17.1 m s−1), Tropical Storm (TS: 17.2–24.4 m s−1), Severe Tropical Storm (STS: 24.5–32.6 m s−1), Typhoon (TY: 32.7–41.4 m s−1), Severe Typhoon (STY: 41.5–50.9 m s−1), and Super Typhoon (SSTY: ≥ 51.0 m s−1).
The European Centre for Medium-Range Weather Forecasts Reanalysis v5 dataset (available at https://cds.climate.copernicus.eu/, last access: 19 November 2025), with a horizontal resolution of 0.25° × 0.25° and a time interval of 6 h, was used to analyze the meteorological conditions and atmospheric circulation patterns during different intensity periods of TC. The parameters extracted include 2 m temperature, surface solar radiation downwards, boundary layer height, 850 hPa and 10 m zonal and meridional wind speeds, 850 hPa vertical velocity, 1000 hPa relative humidity, total cloud cover, total precipitation, and 500 hPa geopotential height. Following the definition of the National Climate Center (available at https://cmdp.ncc-cma.net/Monitoring/cn_stp_wpshp.php, login required, last access: 19 November 2025), we used the area enclosed by the 5880 geopotential meter contour lines in the 500 hPa geopotential height field to represent the location and extent of the WPSH (Liu et al., 2019).
The 6 h Final Global Forecast System Operational Analysis data with a resolution of 0.25° × 0.25° from the National Centre for Environmental Prediction were used to provide initial and boundary conditions for the WRF simulation (available at https://rda.ucar.edu/datasets/ds083.2/, last access: 19 November 2025). Additionally, the variables used for TC intensity sensitivity experiments include temperature, geopotential height, horizontal winds, and relative humidity for the three-dimensional fields, as well as surface pressure, surface temperature, sea level pressure, and surface horizontal winds for the two-dimensional fields.
2.2 Definition of TC-related days
In this study, TCs active over the western North Pacific during autumn from 2014 to 2024 are identified at a 6 h temporal resolution, and days with at least one TC record are defined as TC Days, while the remaining days are classified as Non-TC Days. Specifically, if more than one TC is present on the same day, that day is still counted only once as a TC Day. Considering the spatial range of TC influence on SEC (Deng et al., 2019; Lin et al., 2024), we further restrict the TC domain to 105–140° E and 10–40° N. Any day with at least one TC record within this region is regarded as a “TC influence” day, including post-landfall residual circulation days.
Based on the definitions above and following our previous work (Ouyang et al., 2026), the identified TCs were further classified into three types according to their activity region, movement trajectory, and landfall characteristics: westward TCs (Fig. 3b), landfalling TCs (Fig. 3c), and northward TCs (Fig. 3d). Westward TCs occur mainly south of 20° N, move westward after genesis, and eventually make landfall in Hainan Province of China or in Vietnam. Landfalling TCs generally move northwestward and subsequently reach the SEC coast between 20 and 30° N. Northward TCs are active east of 120° E and tend to move northward or recurve northeastward within 120–130° E after formation, with landfall locations typically north of 30° N.
2.3 Model configuration
The WRF (v3.9.1)–CMAQ (v4.7.1) model was employed to simulate two TC-related severe ozone pollution episodes that occurred in SEC (TC Mitag with maximum intensity TY: from 28 September to 2 October 2019; TC Muifa with maximum intensity STY: from 8–14 September 2022). The tracks and intensities of the two TCs are shown in Fig. 1a. The WRF model was set with two one-way nested domains with horizontal resolutions of 27 and 9 km (Fig. 1b). The outer domain (d01) covers most of East Asia with 283 × 184 grids, while the inner domain (d02) covers most parts of South China with 250 × 190 grids. The Pearl River Delta (PRD) and the central-northern part of Zhejiang Province (ZJ) are represented by orange and red boxes, respectively (Fig. 1b). The model used the WRF Single-Moment 6-class scheme microphysics scheme, Rapid Radiative Transfer Model longwave scheme, Goddard shortwave scheme, revised MM5 Monin-Obukhov surface layer scheme, Noah land surface model, Yonsei University planetary boundary layer scheme, and Betts-Miller-Janjic cumulus parameterization. Notably, the WRF simulations in this study were conducted using a daily re-initialization strategy following Dong et al. (2018): with integrating the model for 36 h starting at 12:00 UTC each day, then the first 12 h of the integration were discarded as model spin-up, and the remaining 24 h were stitched together for a complete simulation over the TC period.
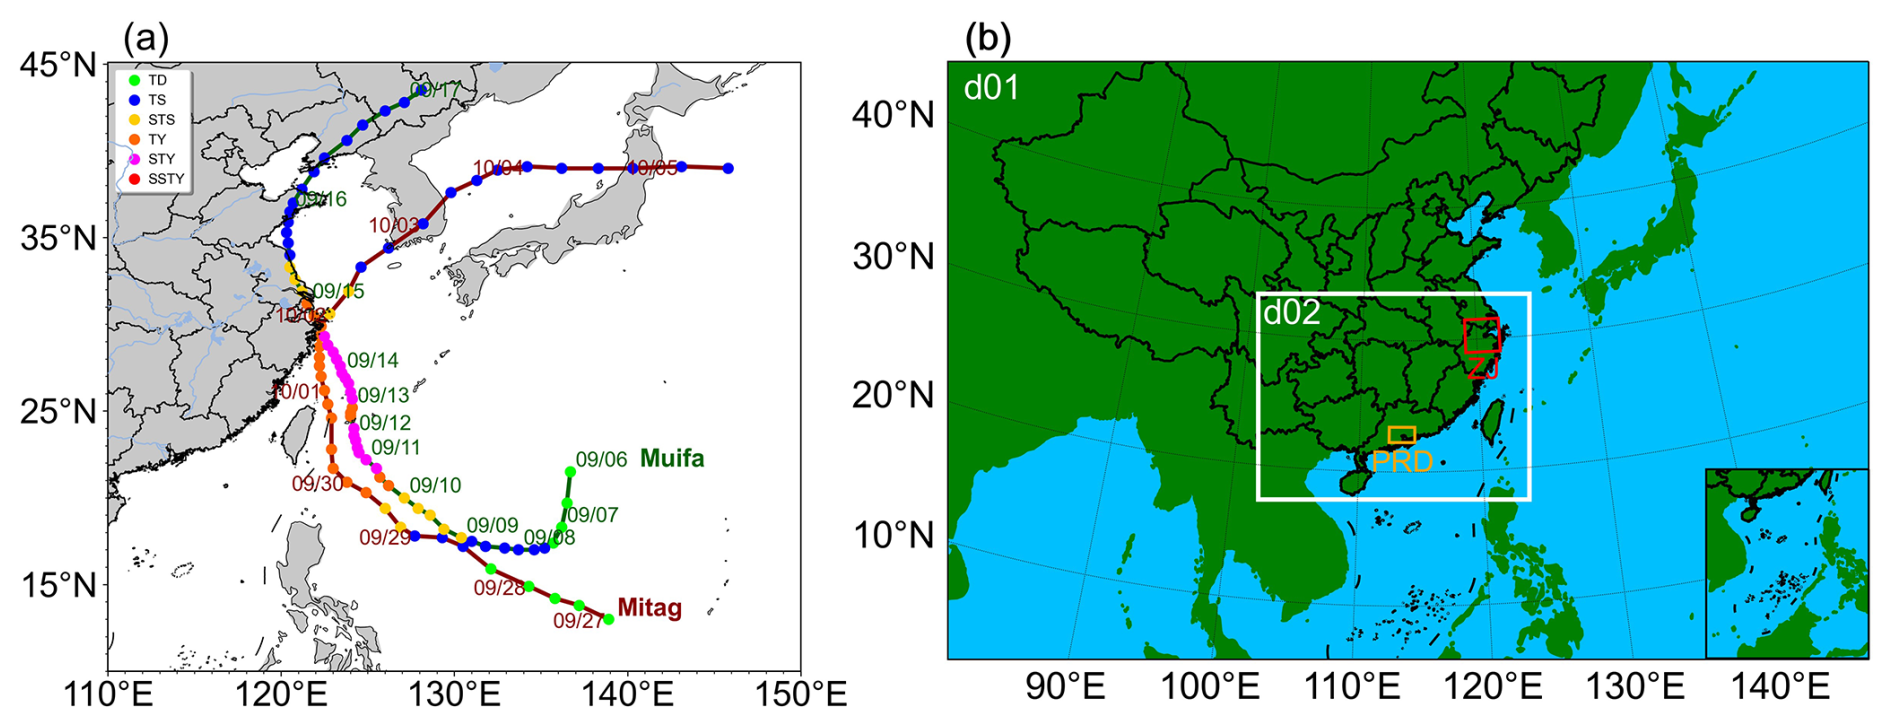
Figure 1(a) The track and intensity of the TC Mitag (red text) and TC Muifa (green text). (b) The two nested model domains in the WRF-CMAQ model, along with the locations of the PRD (orange box) and ZJ (red box).
The Integrated Process Rate module in CMAQ is an effective diagnostic tool for quantifying the hourly contributions of different physicochemical processes to pollutant concentration changes in each grid cell. It helps identify the causes of pollution and the main processes responsible for pollutant concentration variations. These changes can be attributed to seven processes: chemical processes (CHEM), horizontal advection (HADV), vertical advection (ZADV), horizontal diffusion (HDIF), vertical diffusion (VDIF), dry deposition (DDEP), and cloud processes (CLDS). In this study, horizontal transport (HTRA) was defined as the sum of HADV and HDIF, and vertical transport (VTRA) as the sum of ZADV and VDIF. Accordingly, the relative contributions of chemical and transport to ozone concentration changes were diagnosed from the outputs of this module.
2.4 Sensitivity experiments design
In order to explore and quantify the contribution of TC to ozone, a series of experiments was conducted (Table 1). The control simulation (CTL) was performed using the settings described above to represent the original simulation results. Two sensitivity experiments were conducted to demonstrate the influence of TC on ozone in SEC. The first sensitivity experiment (IT_TC) was identical to CTL, except that the horizontal winds of the TC vortex were each doubled in magnitude from the initial conditions to represent a strengthened TC scenario.
Table 1Summary of numerical experiments performed in this study.
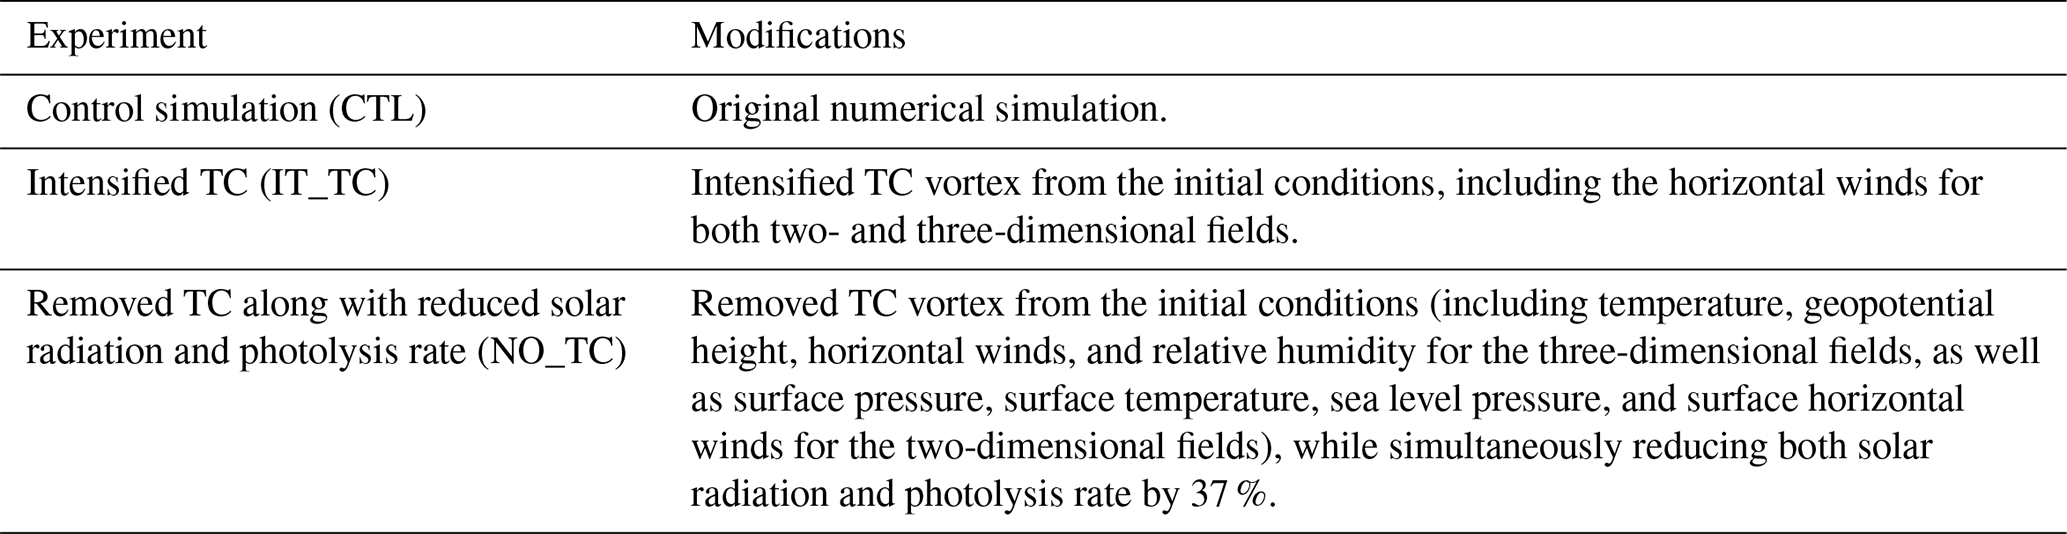
The second sensitivity experiment (NO_TC) was designed to approximate an atmospheric state without TC influence by removing the vortex of temperature, geopotential height, horizontal winds, and relative humidity for the three-dimensional fields, as well as surface pressure, surface temperature, sea level pressure, and surface horizontal winds for the two-dimensional fields. However, additional diagnostic analysis indicated that vortex removal alone may be insufficient to represent the cloud–radiation adjustment expected for periods without northward TCs, especially outside the TC core (not shown). As a result, the simulated radiation fields may remain biased relative to actual non-northward TC conditions. Statistical analysis of surface solar radiation downwards further showed that the average solar radiation over SEC between 12:00 and 18:00 (all times are expressed in local time throughout this paper unless otherwise specified) was 15.01 MJ m−2 during the TC-affected periods of two severe ozone pollution episodes, but only 9.41 MJ m−2 during periods without northward TCs in autumn from 2014 to 2024. This indicates that solar radiation over SEC is generally weaker when there is no northward TC. To better represent this weaker radiative background, a uniform 37 % reduction ((15.01 (MJ m−2) − 9.41 (MJ m−2)) 15.01 (MJ m−2) × 100 %) was applied to solar radiation and photolysis rate over the entire d02 domain throughout the full simulation periods of the two episodes. This was intended to partly compensate for the under-response of cloud- and radiation-related fields after vortex removal and to more accurately simulate the radiation conditions during periods without northward TCs in the NO_TC. Accordingly, NO_TC should be interpreted as a hybrid sensitivity experiment that combines dynamical (vortex removal) with radiative effects (forcing a weaker non-TC radiative regime).
The vortex filtering method proposed by Kurihara et al. (1993, 1995) was adopted in this study, with other meteorological variables adjusted through the dynamic and thermodynamic fields of the model itself to ensure better coordination between the filtering field and the model. TC intensification follows a similar procedure, except that the horizontal winds are doubled and then re-interpolated into the environmental flow. It should be noted that our intention is not to assess the ozone impact of TCs through a direct comparison between IT_TC and NO_TC. Instead, each sensitivity experiment is compared separately with CTL to diagnose the ozone responses under the strengthened–TC and no–TC scenarios, respectively. In other words, the mechanistic attribution is based on the independent comparisons of IT_TC–CTL and NO_TC–CTL, rather than on the direct comparability between IT_TC and NO_TC.
Taking 14:00 on 30 September 2019 as an example, the Final Global Forecast System Operational Analysis data was selected as the initial background field for the CTL to compare the sea-level pressure and 850 hPa wind fields of the NO_TC and the IT_TC. The results show that the CTL simulation (Fig. 2a) exhibits a clear TC vortex to the east of Taiwan, whereas NO_TC shows no vortex or only a very weak one (Fig. 2b). Compared with the 850 hPa wind fields in CTL (Fig. 2c), northerly winds on the western side of the TC strengthen in IT_TC (Fig. 2d) but weaken in NO_TC (Fig. 2e), indicating that the vortex filtering method can effectively enhance or remove the TC. Moreover, the difference between the vortex-filtered background field and the initial background field only exists within the TC vortex component, with no changes outside this region. That is to say, the background field after vortex filtering alters only the distribution of variables within the TC component, while the surrounding meteorological fields remain unchanged, which ensures the consistency of the large-scale environmental field outside the TC component in the vortex-filtered background field. The vortex circulation after filtering maintains good coordination and continuity with the surrounding large-scale environmental field, confirming that this filtering method is both reasonable and feasible.
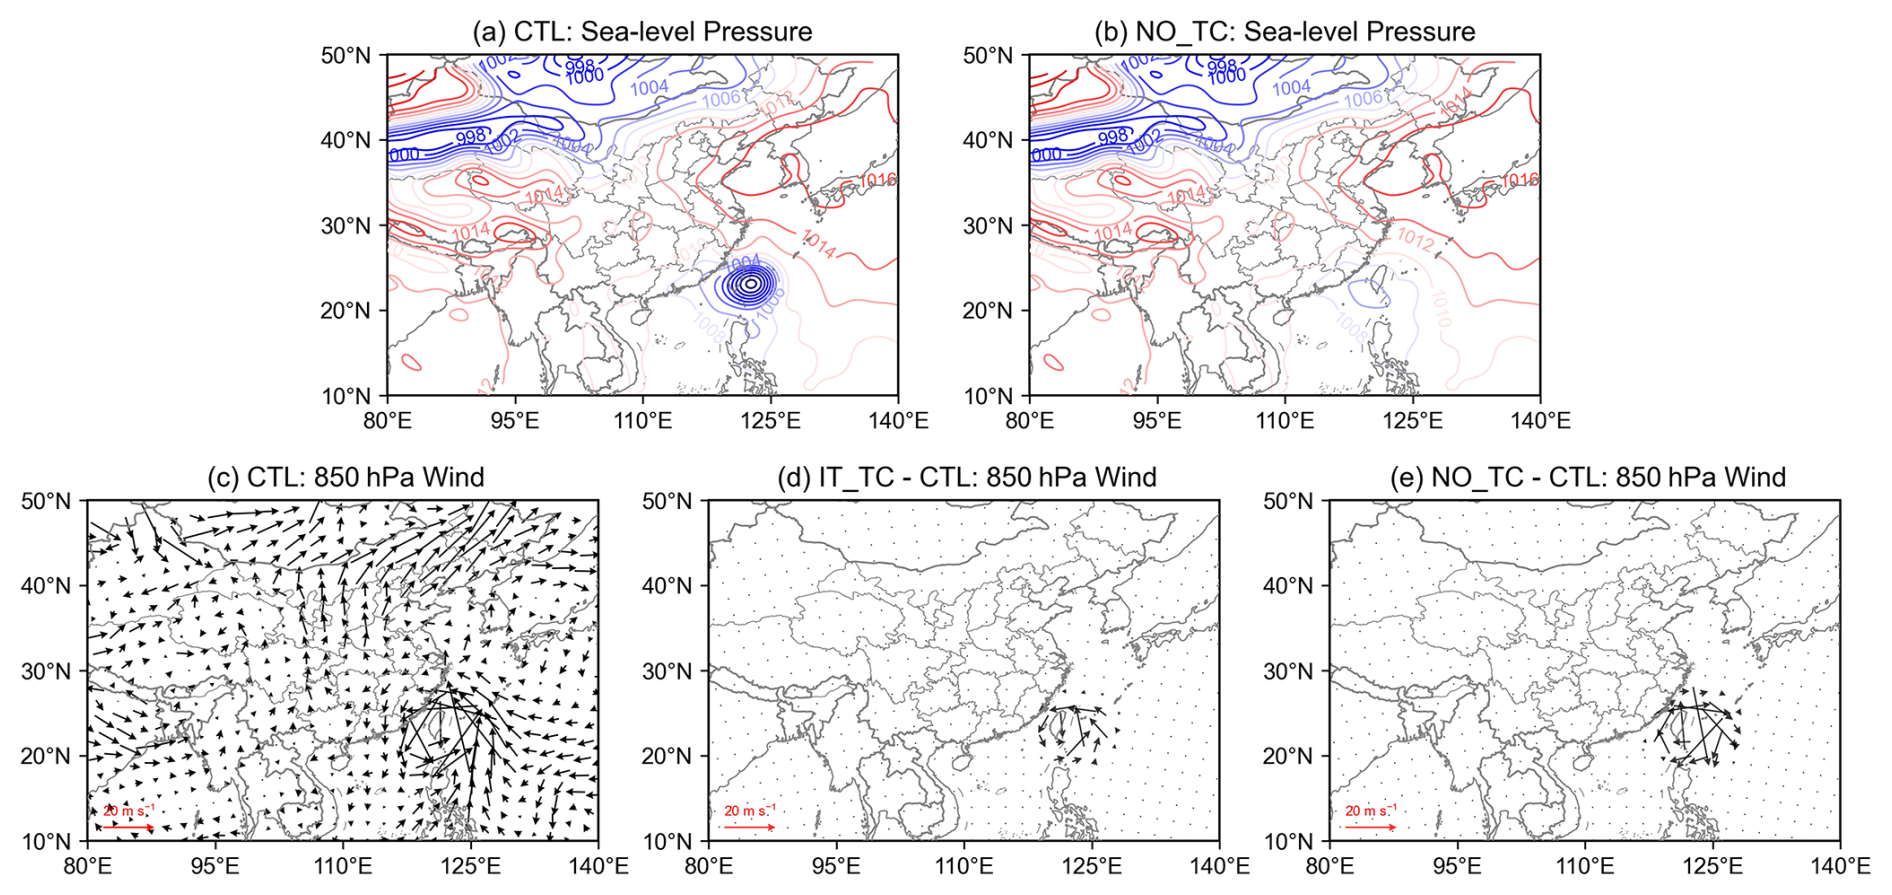
Figure 2Meteorological fields at 14:00 on 30 September 2019. Sea level pressure field for the CTL (a) and the NO_TC (b). Differences with the CTL (c) in the IT_TC (d) and the NO_TC (e) of the 850 hPa wind field.
3.1 Relationship between TC intensity and ozone in SEC
3.1.1 Characteristics of ozone concentration
Figure 3a shows the time series of autumn MDA8 ozone concentration over the SEC from 2014 to 2024 (All Days, black line), with the blue and grey lines representing the average for days with TC (TC Days) and without TC (Non-TC Days), respectively. The interannual variation of the mean MDA8 ozone concentration reveals a fluctuating but overall increasing trend, with peak values occurring in 2019 and 2022. Throughout this period, ozone levels on TC Days consistently exceeded those on All Days, particularly in 2022 when the difference reached 8 ppb. In contrast, Non-TC Days exhibited relatively lower ozone concentration without a significant linear trend over the 11 years period. These results demonstrate that TC activity is closely associated with elevated autumn ozone concentration in SEC.
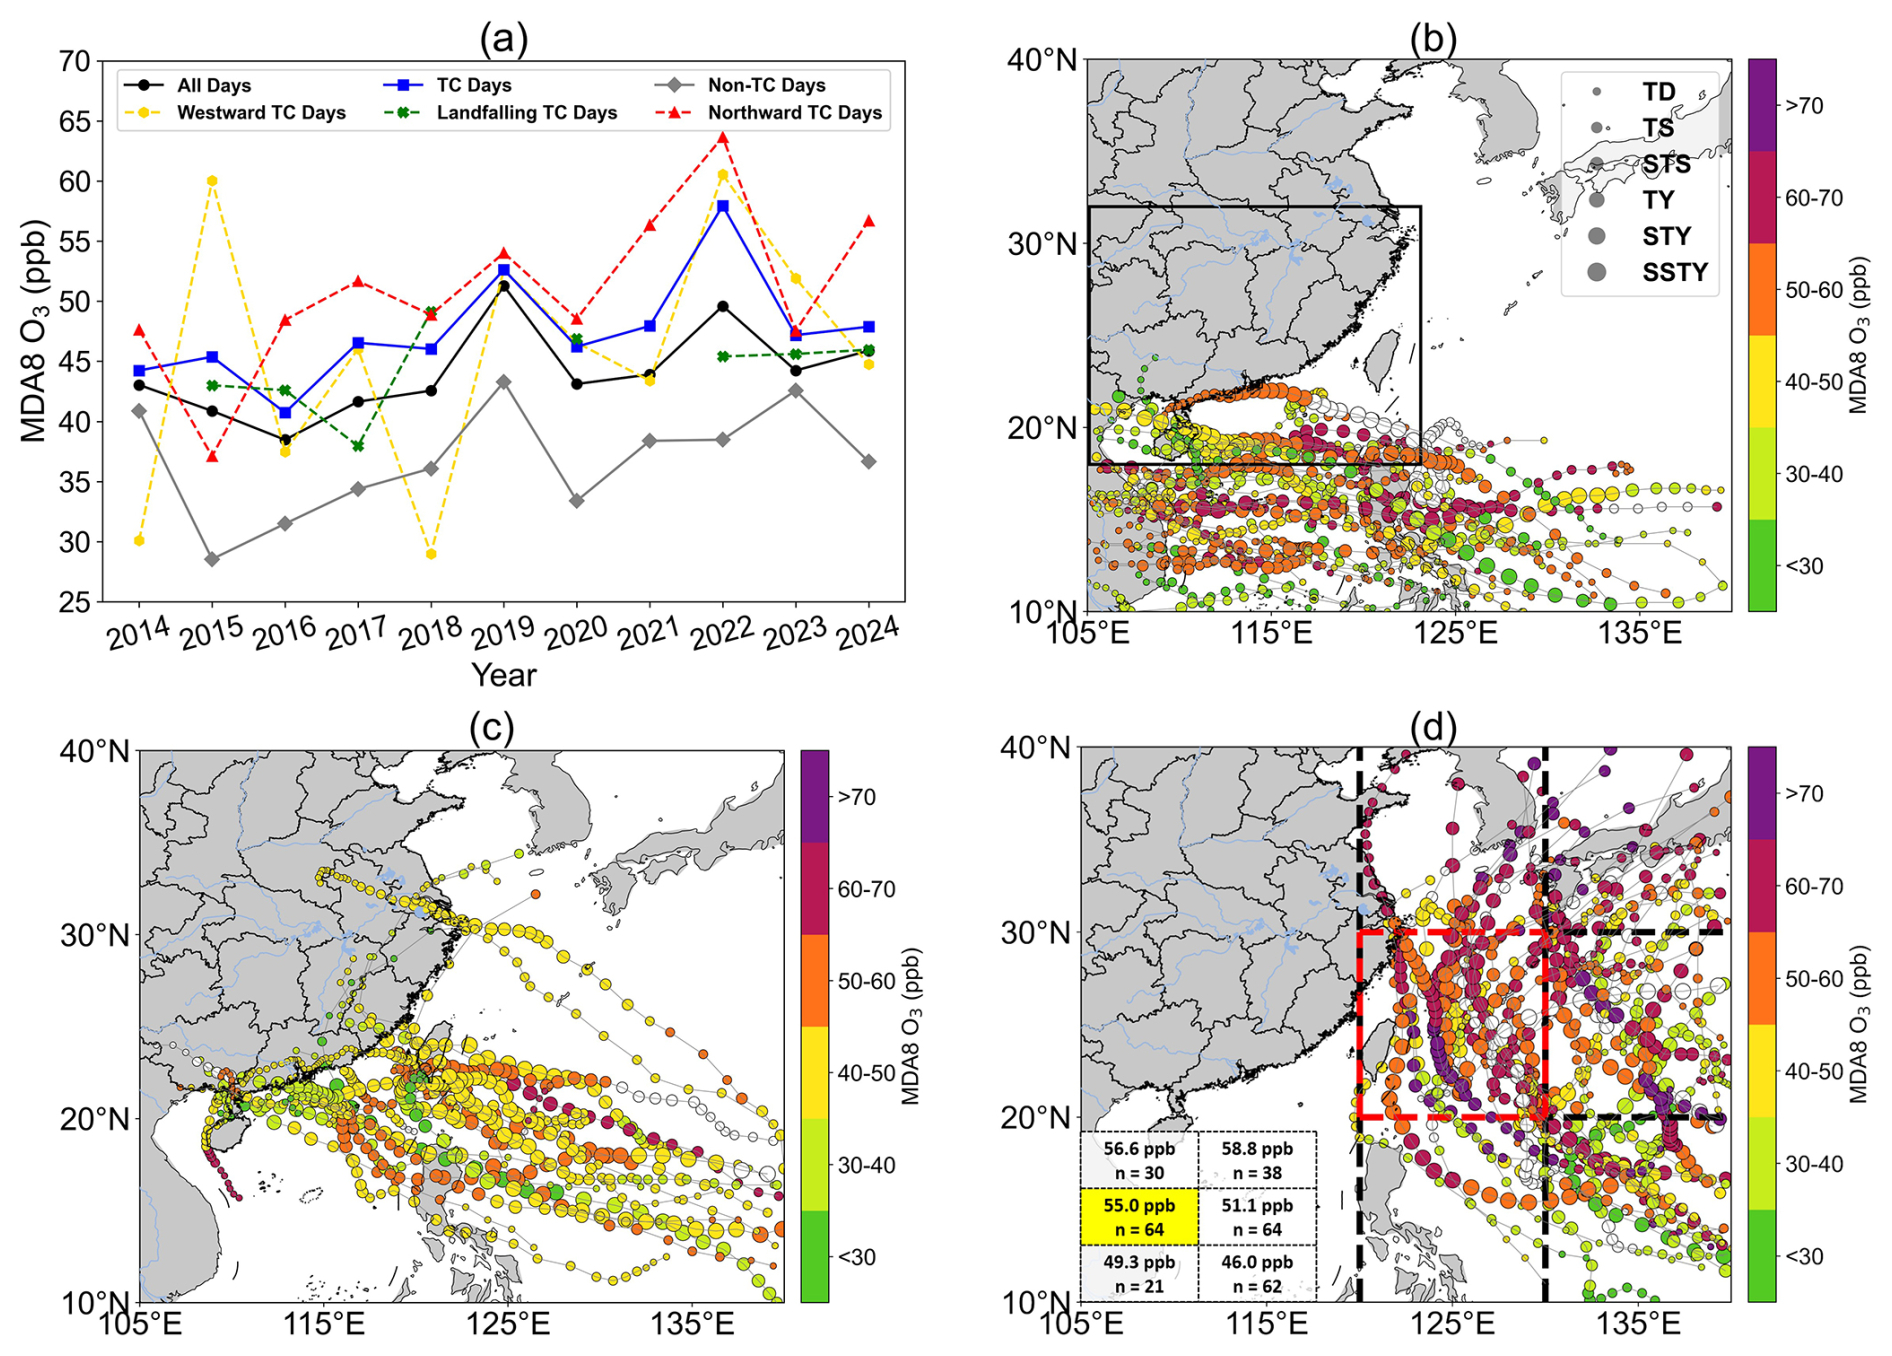
Figure 3(a) Time series of autumn average MDA8 ozone concentration over SEC from 2014 to 2024 for all days (black line), TC days (blue line), non-TC days (grey line), westward TC days (yellow dashed line), landfalling TC days (green dashed line), and northward TC days (red dashed line). (b–d) Tracks of westward TCs, landfalling TCs, and northward TCs, with marker sizes representing TC intensity and marker colors indicating the ozone concentration levels in SEC corresponding to the positions of TCs (unfilled circles denote missing ozone values). The black box in panel (b) outlines the spatial boundary of SEC. In panel (d), the activity region of northward TCs is further partitioned into six subregions at 10° × 10° latitude–longitude intervals, with the key subregion marked by the red box. The inset table in the lower-left corner lists the number of influence days and the mean ozone concentration for each subregion, with the key subregion highlighted in yellow.
After classifying TCs within 105–140° E and 10–40° N by track type, clear differences emerge in the interannual variability of SEC ozone among the three TC types (Fig. 3a). Ozone on westward TC days (yellow dashed line) show the largest year-to-year fluctuations, with relatively low values occur in 2014 and 2018 but much higher values in 2015, 2019, and 2022, indicating strong case-to-case variability in the ozone response to westward TCs. In contrast, ozone on landfalling TC days (green dashed line) is generally lower and varies only weakly from year to year, remaining near 43–46 ppb in most years. In several years, no statistics are available because no landfalling TCs occurred. This suggests that, although landfalling TCs can also be associated with elevated ozone episodes, their effect on regionally averaged ozone is comparatively limited. By comparison, ozone on northward TC Days (red dashed line) stays at a high level in most years and is overall higher than that for the other two track types, especially in 2019, 2022, and 2024, with the highest value occurring in 2022 (about 63.66 ppb). This indicates that northward TCs show the strongest association with autumn high-ozone conditions over the SEC, and that their interannual variability agrees better with the years of elevated regional ozone.
To directly illustrate how the three TC track types affect ozone over SEC during their movement, Fig. 3b–d show the TC positions for each TC type together with the corresponding ozone levels over SEC. The marker sizes and colors represent the intensity of TCs and the MDA8 ozone levels in SEC corresponding to the positions of TCs, respectively. Results show that westward TCs strengthen as they approach the southern side of the SEC, accompanied by varying degrees of ozone concentration enhancement. When these TCs make landfall between 12–18° N subsequently, the ozone concentration across the entire SEC remains at a relatively high level. However, landfall over Hainan (southern area of SEC) induces a clear ozone reduction in SEC (Fig. 3b). For landfalling TCs, both intensity and ozone concentration in SEC initially increase then decrease during their approach, though overall ozone levels remain relatively low among the three TC types (Fig. 3c). During the period of the northward TC influence (Fig. 3d), ozone concentrations in SEC frequently exceeded 50 ppb, significantly higher than that of the other TC types. These findings demonstrate that TC intensity also plays an important role in influencing the ozone concentration of SEC, in addition to track type and location.
To further investigate the influence of TC intensity on ozone in SEC, Fig. 4 presents the ozone concentration across different TC intensity categories for each TC type. For westward TCs (Fig. 4a), both mean and median ozone concentration are obviously higher when TCs reach STY or SSTY intensity, suggesting that approaching but not yet landfalling TCs are more conducive to ozone formation and accumulation in SEC. Landfalling TCs (Fig. 4b) show no clear ozone concentration trend with increasing intensity, with the mean ozone concentration at STY being even lower than that at TY. In contrast, northward TCs (Fig. 4c) maintain higher ozone concentration than the other two types. Particularly when TCs reach TY or higher intensity, the mean, median, and 85th percentile of ozone concentration all reach their highest levels. The findings above collectively identify intense northward TCs as a key contributor to elevated autumn ozone levels in SEC.
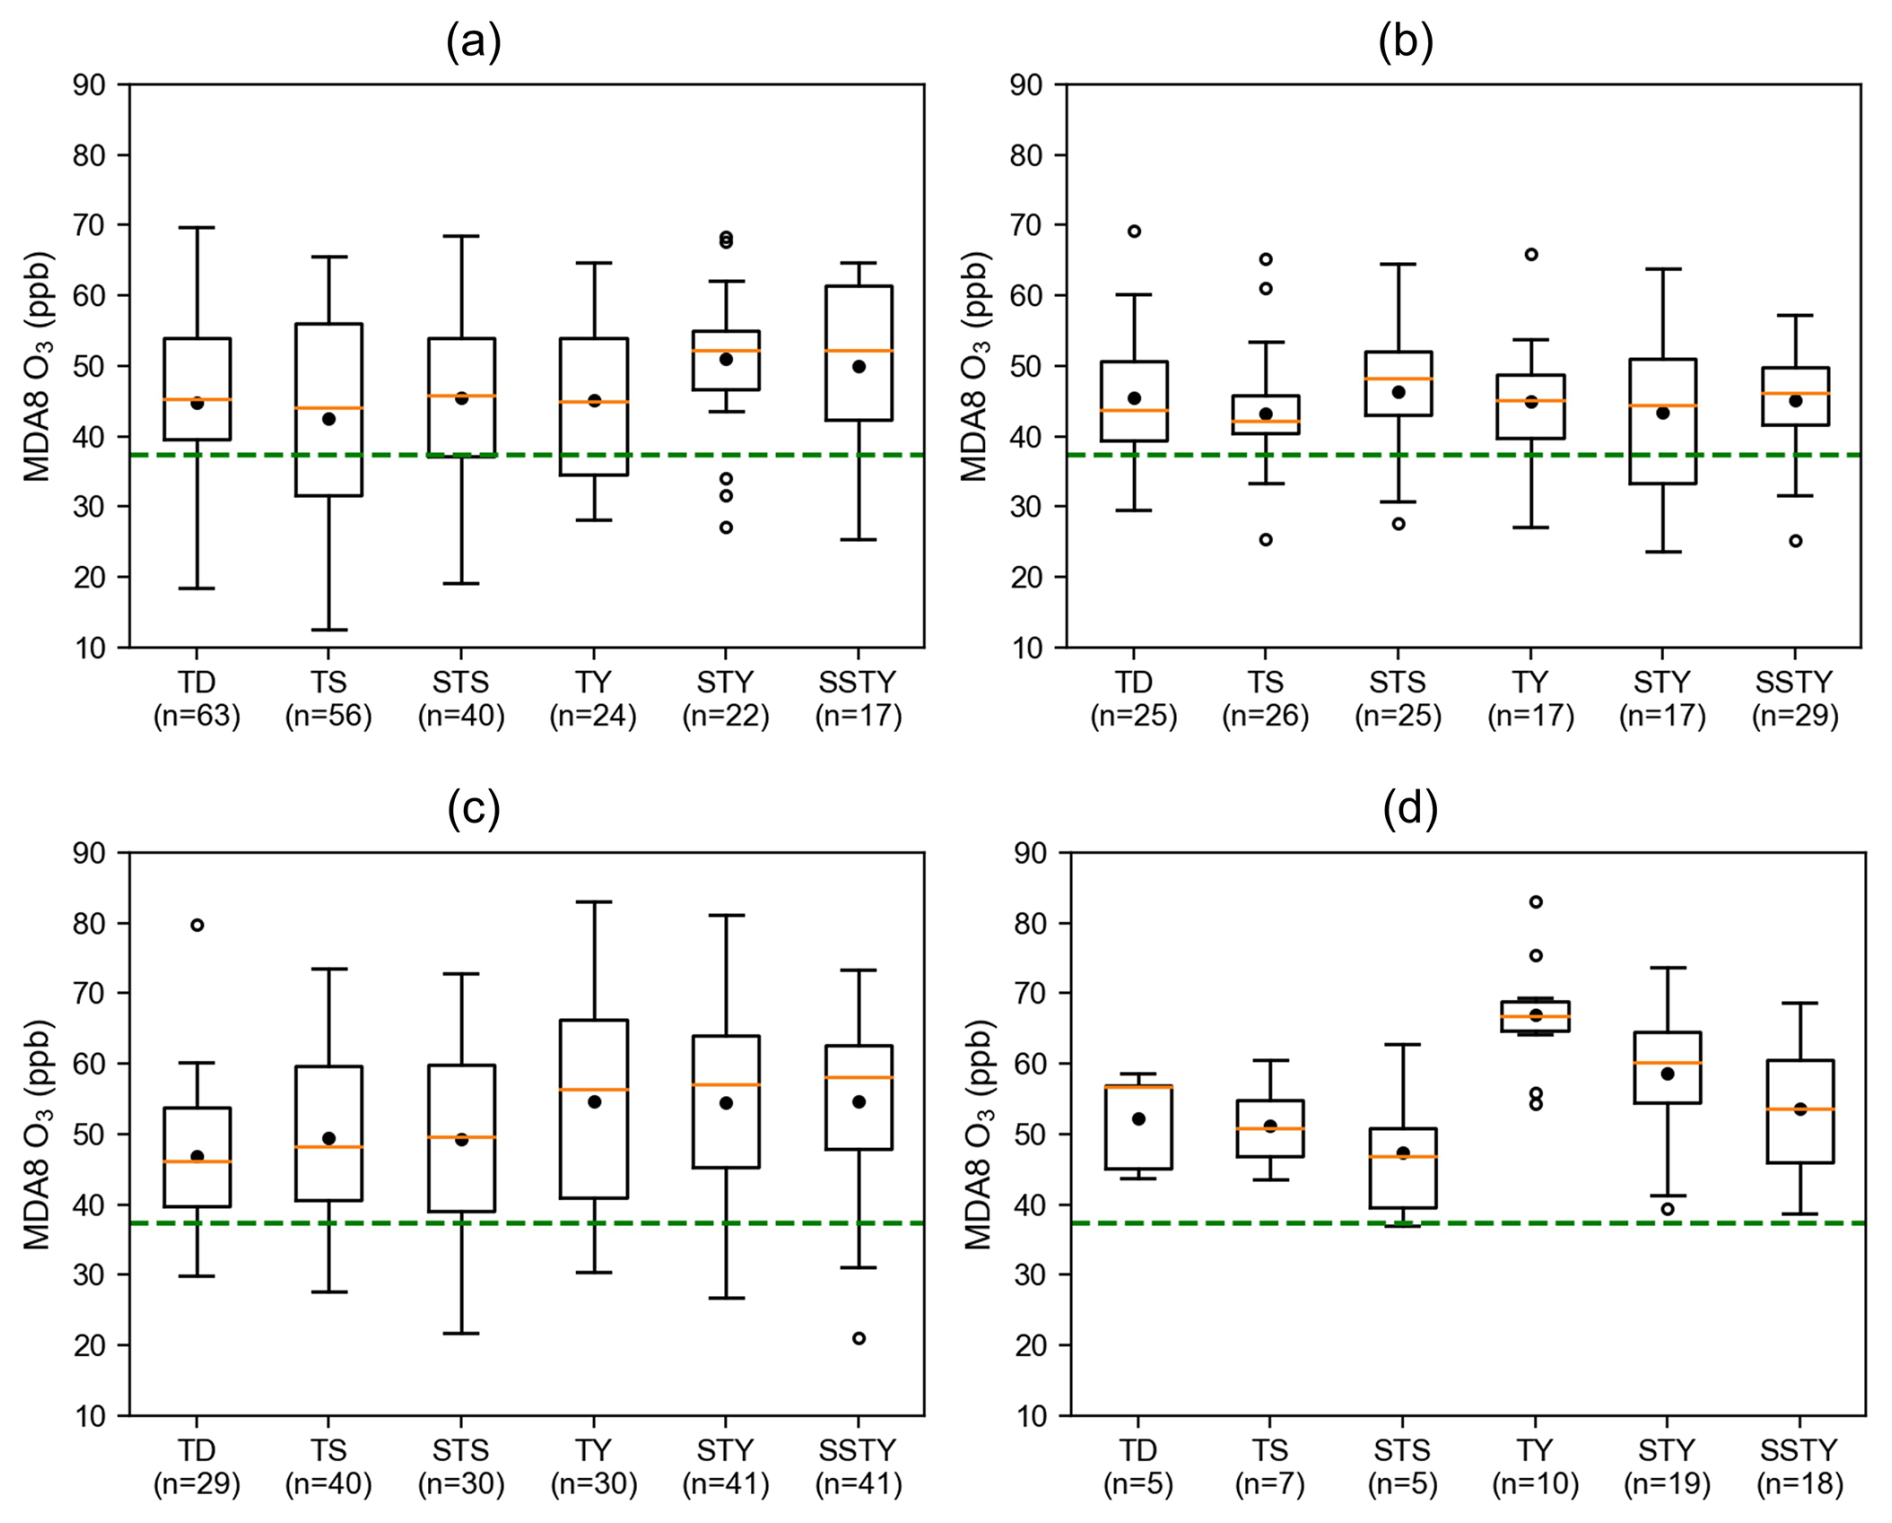
Figure 4Ozone concentration corresponding to different intensities under westward TCs (a), landfalling TCs (b), northward TCs (c), and northward TCs within the key subregion (d). The boxes represent the interquartile range of ozone concentration for each intensity, the orange horizontal lines within the boxes represent the medians, the whiskers represent the maximum and minimum values excluding outliers, the unfilled circles represent outliers, and the black dots represent the mean values. The numbers on the x-axis represent the total number of days for that intensity, and the green dashed line indicates the average ozone concentration on days without TCs.
In addition, considering that the influence of northward TCs on SEC may vary substantially with TC location (Hu et al., 2023), we further divided the activity domain of northward TCs into six subregions at 10° latitude–longitude intervals and calculated, for each subregion, the number of TC influence days and the corresponding mean ozone concentration, in order to identify the most representative area affected by northward TCs. According to the table in the lower-left corner of Fig. 3d, although the two northern subregions exhibit greater ozone enhancement, their sample sizes are much smaller. By contrast, the 120–130° E and 20–30° N subregion has the largest number of TC influence days (64 d) and a relatively high mean ozone concentration (55 ppb), indicating the strongest combined influence in terms of both frequency and ozone level. As shown in Fig. 4d, the mean ozone concentration in this key subregion exceeds 50 ppb at nearly all intensities and reaches a maximum at TY. Unlike the broader-domain result shown in Fig. 4c, ozone decreases at STY and SSTY in this key subregion. This suggests that, when stronger TCs occur within this subregion, the accompanying meteorological changes may shift SEC ozone from an increasing to a decreasing tendency. On this basis, the following section focuses on how northward TC intensity affects ozone over SEC when the TC is located within the key subregion of 120–130° E and 20–30° N.
3.1.2 Meteorological conditions and atmospheric circulation characteristics
To further clarify how circulation changes associated with northward TCs within the key subregion at different intensities modulate local meteorological conditions and thereby affect ozone over SEC, we examined the daytime (08:00–18:00) average characteristics of meteorological variables at each intensity (Fig. 5) together with the corresponding atmospheric circulation anomalies relative to the autumn climatology during 2014–2024 (Fig. 6). The variables analyzed in Fig. 5 include total cloud cover, surface solar radiation downwards, 1000 hPa relative humidity, total precipitation, 2 m temperature, boundary layer height, 850 hPa vertical velocity, and 10 m wind speed. In Fig. 6, shading denotes 500 hPa geopotential height anomalies, wind arrows indicate 850 hPa wind anomalies, and the dark red dashed lines mark the mean position of the WPSH. It should be noted that, because TCs usually continue to develop and intensify before reaching the key subregion, the number of days in the TD, TS, and STS is relatively small. Accordingly, the fluctuations shown for these categories may partly reflect sampling variability rather than robust physical differences associated with TC intensity.
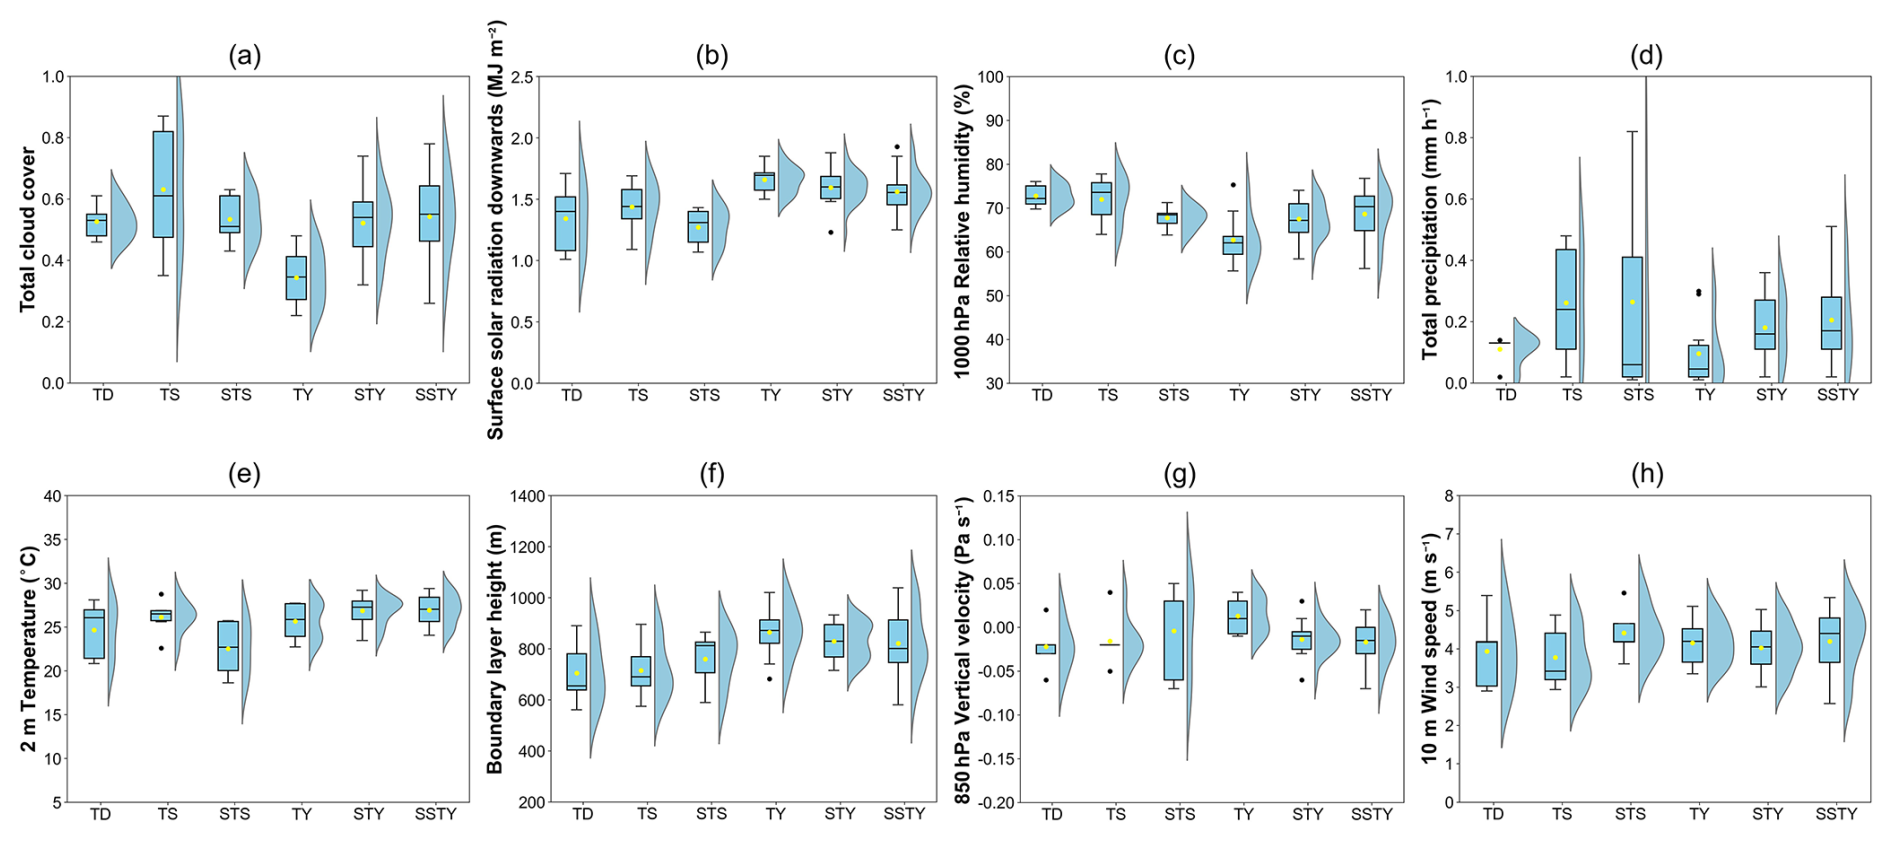
Figure 5Comparison of meteorological conditions among different intensities of northward TCs within the key subregion. Panels (a)–(h) represent total cloud cover, surface solar radiation, 1000 hPa relative humidity, total precipitation, 2 m temperature, boundary layer height, 850 hPa vertical velocity, and 10 m wind speed, respectively. For each panel, the box plot on the left summarizes the basic statistics, while the violin plot on the right shows the data distribution. Boxes represent the interquartile range, horizontal lines within the boxes represent medians, whiskers represent the maximum and minimum values excluding outliers, black dots represent outliers, and yellow dots represent mean values.
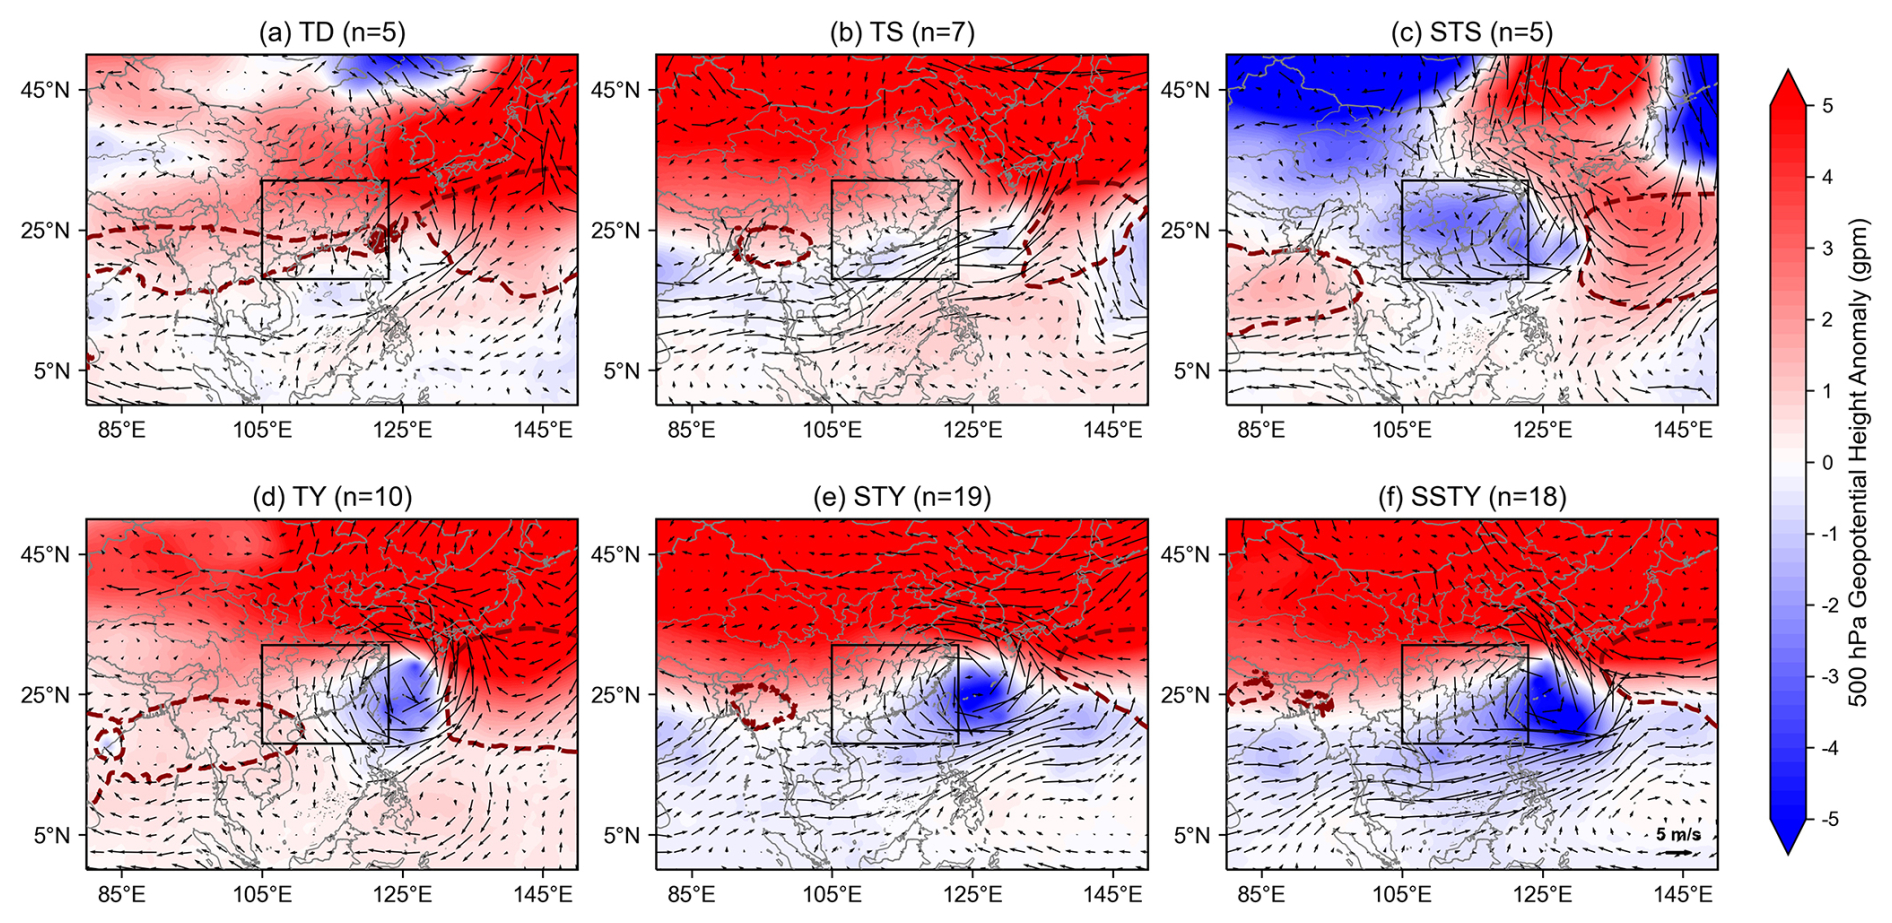
Figure 6Composited anomalies of 500 hPa geopotential height (color shade) and 850 hPa wind fields (wind arrow) under different intensities of northward TCs within the key subregion relative to the autumn climatology. The dark red dashed lines represent the mean position of the WPSH.
From TD to TS (Fig. 6a–b), positive 500 hPa geopotential height anomalies dominate over SEC and the regions to its north, while the anomalous winds at 850 hPa remain relatively weak. This indicates that the mid-tropospheric circulation is still mainly controlled by a relatively stable weak anticyclonic background. It is worth noting that the WPSH splits into a double-center structure under the intrusion of the northward TC from TS, and this feature also persists in other periods (Fig. 6b–f). Under this circulation configuration, solar radiation and 2 m temperature increase slightly, but total cloud cover (0.63) and total precipitation (0.26 mm h−1) remain relatively high (Fig. 5), and ozone therefore changes little (Fig. 4d). At STS, weak negative 500 hPa geopotential height anomalies emerge over SEC, and the anomalous cyclonic circulation to its east becomes more distinct at 850 hPa, suggesting a strengthened influence of TC-induced disturbances. Although total cloud cover and 1000 hPa relative humidity decrease to 0.53 and 67.77 %, respectively, surface solar radiation and 2 m temperature also drop markedly to 1.27 MJ m−2 and 22.54 °C, while total precipitation remains relatively high at 0.26 mm h−1. As a result, ozone decreases to a relatively low level of 47.5 ppb.
When TC intensifies to TY, a pronounced center of negative 500 hPa geopotential height anomalies develops over the coastal ocean east of SEC, accompanied by a well-defined anomalous cyclonic circulation at 850 hPa. SEC is located on its western flank and is influenced by a more evident anomalous northerly flow, indicating that the study region comes under stronger control of the TC peripheral circulation (Fig. 6d). Under these circulation conditions, the 850 hPa vertical velocity changes from negative (−0.02 Pa s−1) to positive (0.01 Pa s−1), favoring suppressed convection and reduced cloud and rainfall activity. Correspondingly, total cloud cover, 1000 hPa relative humidity, and total precipitation decrease substantially from 0.53, 67.77 %, and 0.26 mm h−1 at STS to 0.34, 62.69 %, and 0.10 mm h−1, respectively. At the same time, solar radiation, 2 m temperature, and boundary layer height increase to 1.66 MJ m−2, 25.64 °C, and 864.53 m, whereas 10 m wind speed remains around 4 m s−1. Overall, SEC experiences a meteorological environment during TY characterized by stronger subsidence, fewer clouds, stronger solar radiation, higher boundary layer height, lower relative humidity, and weaker precipitation, all of which are highly favorable for ozone enhancement. Consequently, ozone rises sharply to 67 ppb.
During STY and SSTY, the WPSH retreats eastward and weakens further. Meanwhile, the area of negative 500 hPa geopotential height anomalies over and east of SEC expands relative to TY, and the anomalous cyclonic circulation at 850 hPa becomes more complete. The area affected by anomalous northerly winds over the SEC also broadens, indicating that the mid-tropospheric circulation remains strongly modulated by TC disturbances. Under such circulation pattern, the 850 hPa vertical velocity turns back to weak updraft (−0.01 and −0.02 Pa s−1), surface solar radiation downwards shows a modest decrease (1.59 and 1.56 MJ m−2), and total cloud cover (0.52 and 0.54), 1000 hPa relative humidity (67.54 % and 68.66 %), total precipitation (0.18 and 0.2 mm h−1), and 10 m wind speed (4.03 and 4.2 m s−1) all increase slightly relative to TY. This suggests that the favorable meteorological configuration established at TY is no longer maintained as the TC continues to intensify. Therefore, ozone over SEC stays at a relatively high level but declines compared with TY.
The above results suggest that northward TCs within the key subregion, when intensifying to TY, can jointly promote a peak in SEC ozone concentration through fewer clouds, stronger solar radiation, higher boundary layer height, lower relative humidity, weaker precipitation, weaker surface winds, and suppressed upward motion. Although TC intensity continues to increase during STY and SSTY, the associated meteorological conditions such as solar radiation, total cloud cover, relative humidity, and wind speeds do not evolve further toward a state more favorable for ozone production and accumulation. Consequently, ozone concentration over SEC shows a slight decline rather than a further increase.
3.2 Influence of TC intensity and position on ozone
As analyzed in Sect. 3.1, when northward TCs intensify to TY within the key subregion, the ozone concentration in SEC reaches its maximum. Despite the continuous strengthening of TC intensity, the ozone concentration remains at a high level but declines slightly. Based on the two years with the highest ozone concentration (2019 and 2022) in Fig. 3a, we select two severe ozone pollution episodes under the influence of northward TC with similar tracks to further explore the impact of TC intensity and location on ozone concentration in SEC.
3.2.1 Overview of two ozone episodes
Figure 7a to j present the TC moving tracks, the daily 14:00 LT position of the WPSH (grey shading), and the observed MDA8 ozone concentration across eastern China during two severe ozone pollution episodes (from 28 September to 2 October 2019 and from 8–15 September 2022). Before 28 September 2019 (Fig. 7a) and 8 September 2022 (Fig. 7f), a persistent WPSH influenced over southern China (not shown), which caused a subsidence that suppressed the vertical dispersion of surface air pollutants. Enhanced solar radiation under the clear sky promoted efficient reactions of accumulated ozone precursors, resulting in widespread high ozone levels across eastern China. As the TCs developed and intensified rapidly over the western Pacific, they crossed the ridge of high pressure all the way northward to the southeast of Taiwan, resulting in a break in the subtropical system (Fig. 7b and g). During the subsequent northward movement of TCs, SEC (except Fujian Province near the TCs centre) maintained high ozone levels (Fig. 7c and h). When the TCs made landfall along the coast of ZJ on 1 October 2019 (Fig. 7d) and 14 September 2022 (Fig. 7i), precipitation and strong winds significantly reduced ozone concentrations in this area. Although the overall ozone levels in SEC decreased (particularly in ZJ) as the TCs generally moved away, PRD sustained high values (Fig. 7e and j).
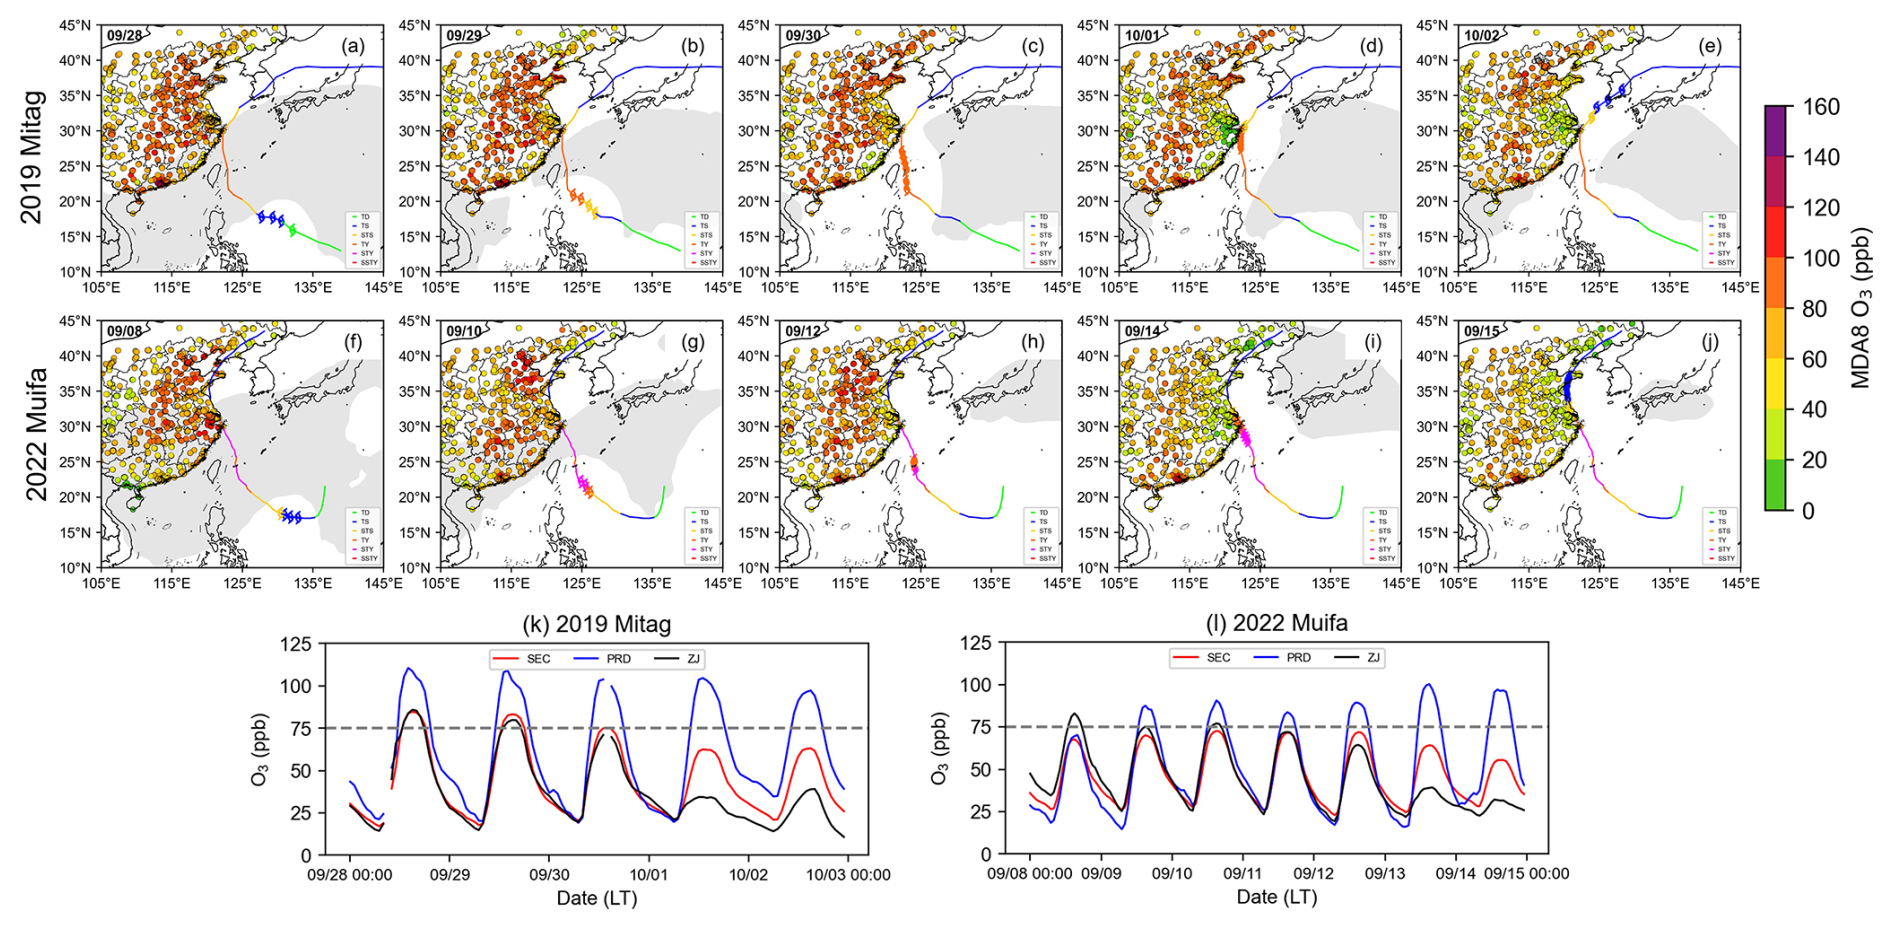
Figure 7The TC moving track (line, with colors representing different intensities), the daily 14:00 LT position of the WPSH (gray shading), and the observed MDA8 ozone concentration across eastern China during two episodes (a–j). Diurnal variation in observed ozone concentrations for SEC (d02 domain, red line), PRD (blue line), and ZJ (black line) from 28 September to 2 October 2019 (k) and from 8–15 September 2022 (l).
Figure 7k and l further present the observed ozone time series for the entire d02 region (red line), the PRD (blue line), and the ZJ (black line) during two ozone pollution episodes. For the entire SEC, the afternoon ozone concentration approached or exceeded 75 ppb in the early periods (before 30 September 2019 and before 13 September 2022), and then decreased significantly. The PRD region experienced afternoon ozone concentration exceeding 75 ppb throughout the TC period. Notably, ozone concentration in ZJ showed a trend of being relatively high in the early period and decreasing significantly later (1–2 October 2019 and 13–14 September 2022).
3.2.2 Control and intensification/removal sensitivity simulations of TCs
The WRF-CMAQ model was utilized to simulate the two TC-related ozone pollution episodes, and ozone in the d02 domain was evaluated (Fig. 8). It can be seen that the model captures the diurnal variation of ozone concentration in two episodes, reproducing the characteristic pattern of a peak in the afternoon followed by a gradual decline at nighttime. While slightly underestimating daytime maxima, the simulations achieved good performance metrics with correlation coefficients (R) and index of agreement (IOA) as high as 0.95, normalized mean biases (NMB) of −0.33 % and −13.89 %, and root mean square errors (RMSE) of 7.46 and 7.79 ppb. These results demonstrate that the model performance is within an acceptable range, giving confidence for conducting further analyses.
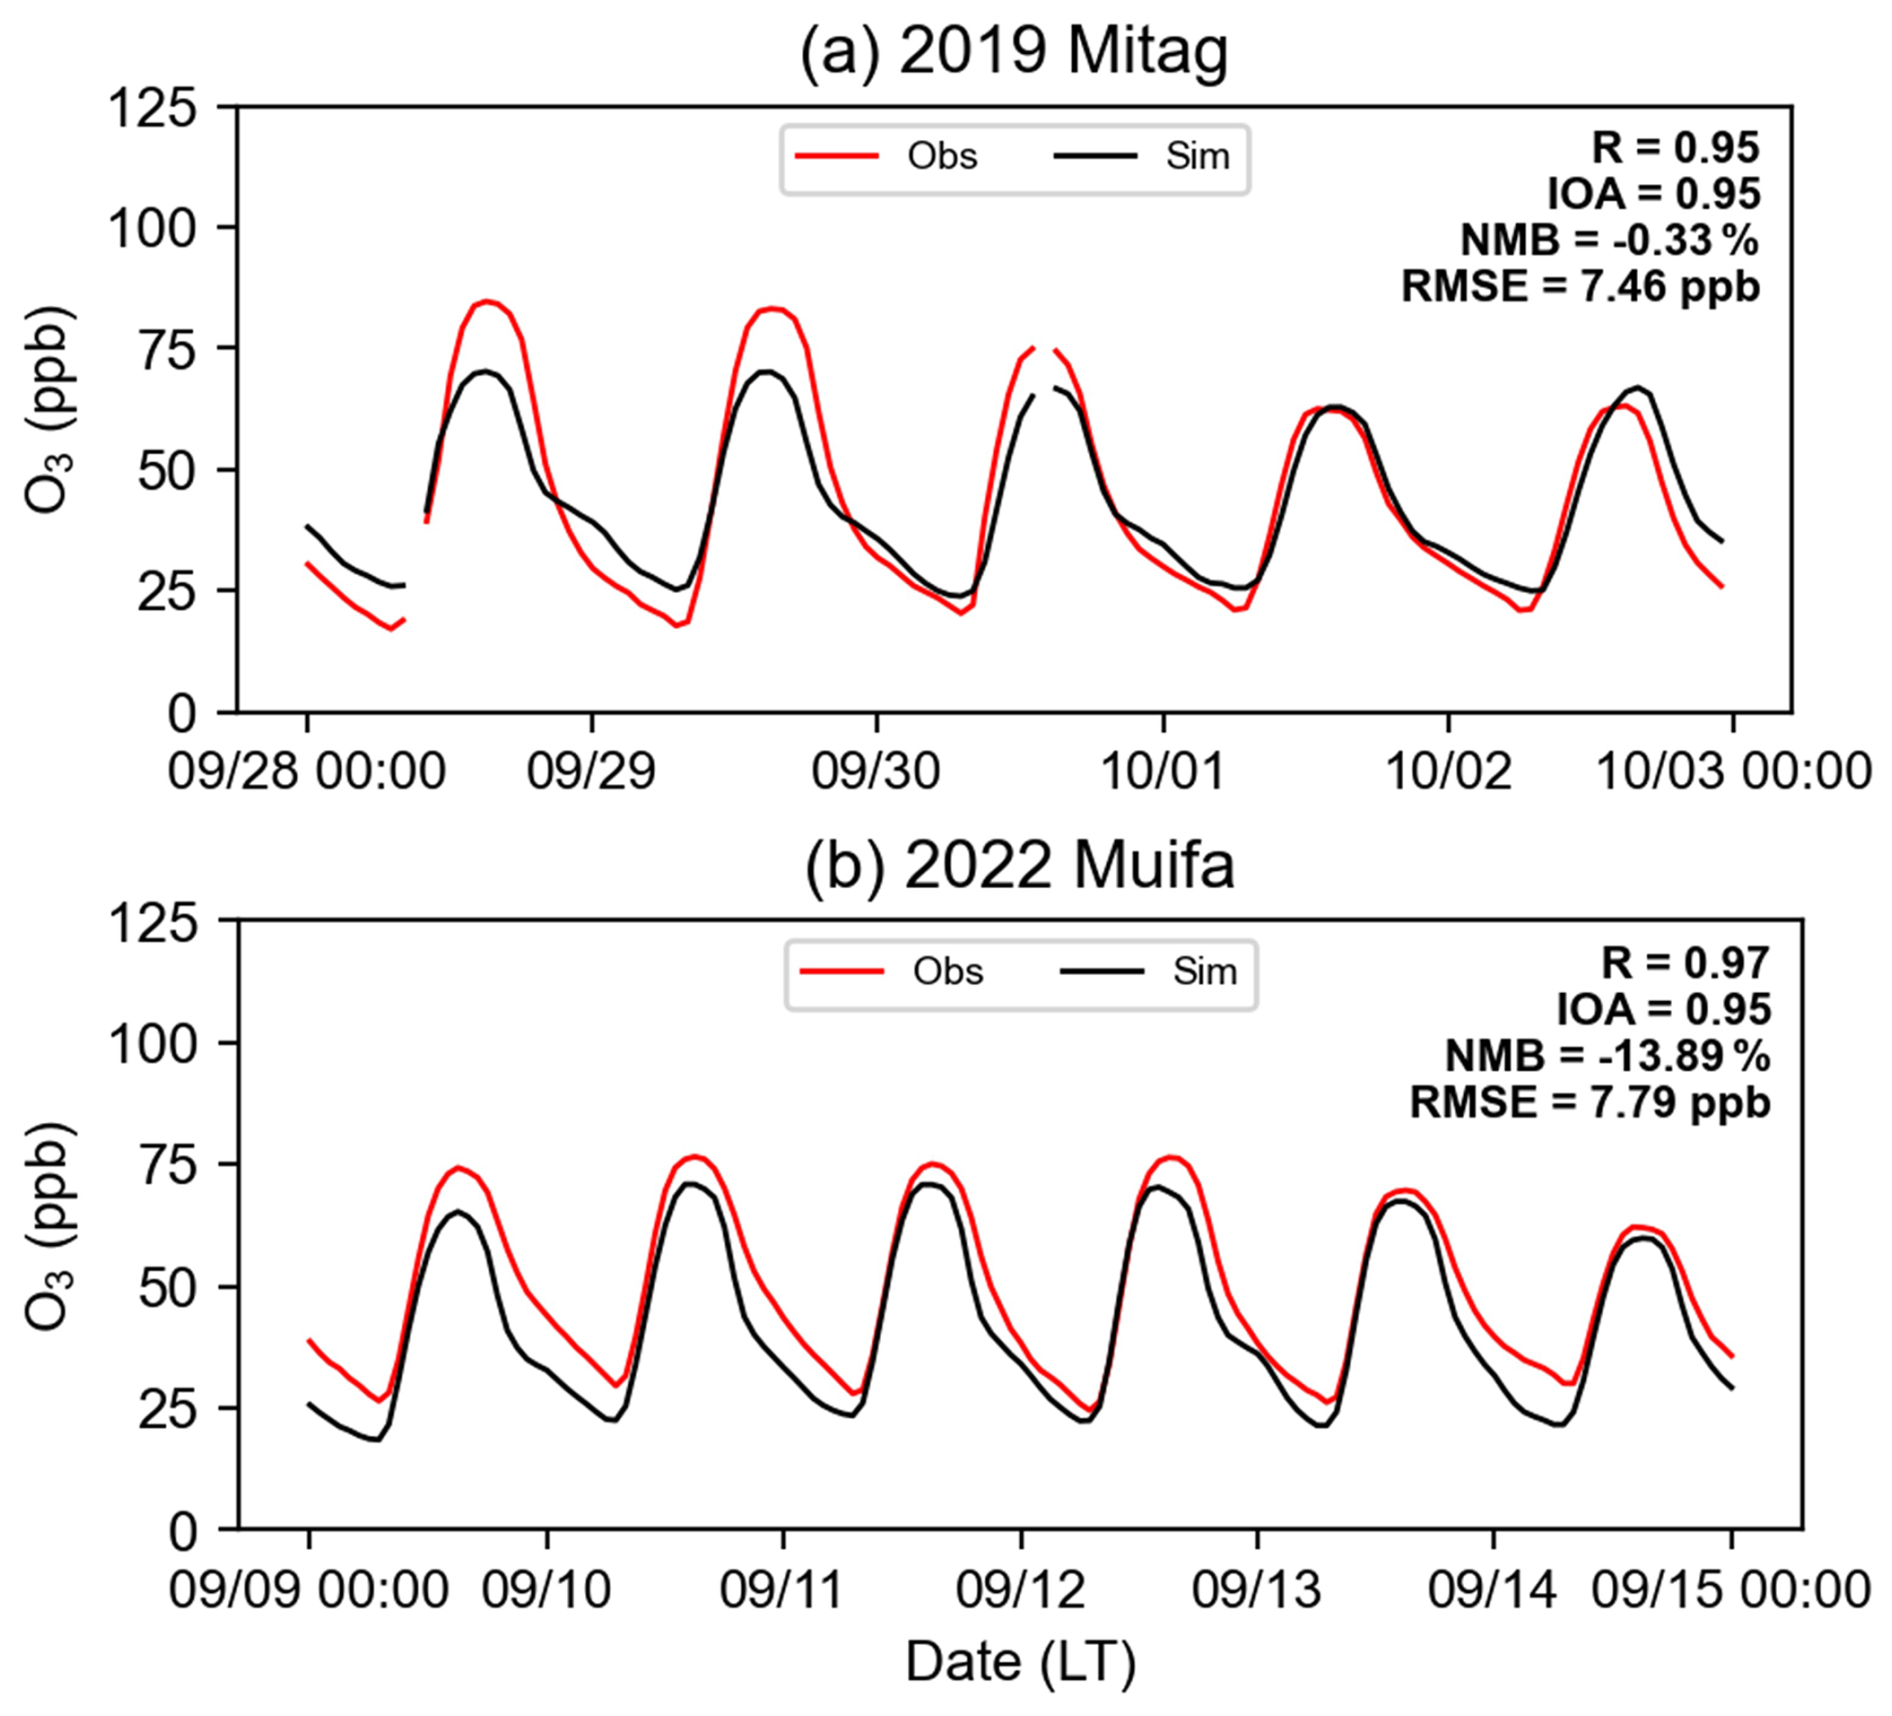
Figure 8Hourly variations and statistical metrics of ozone in observed values (red line) compared to model simulations (black line) for SEC (d02 domain) from two ozone episodes.
Section 3.2.1 reveals that the two ozone pollution episodes shared similar TC moving tracks and consequently exerted comparable impacts on the ozone variations in SEC. Here, we selected three paired dates with similar TC locations in two episodes: 29 September 2019 and 10 September 2022, 30 September 2019 and 12 September 2022, as well as 1 October 2019 and 14 September 2022. We then categorized them into three periods according to the latitude where TC was located (20, 25, and 30° N) to further explore the impact of TC position within the key subregion on ozone concentration in different regions of the SEC.
Figure 9 displays the spatial distribution of near-surface ozone and 10 m wind fields at 14:00 for the CTL. Ozone concentration in SEC along the peripheral northerly airflow region of TC remained at a relatively high level, particularly in PRD and offshore areas. As TC moved northward and made landfall, ozone levels in ZJ decreased from about 100 ppb during the 20° N (Fig. 9a) and 25° N (Fig. 9b) periods to about 40 ppb at 30° N (Fig. 9c).
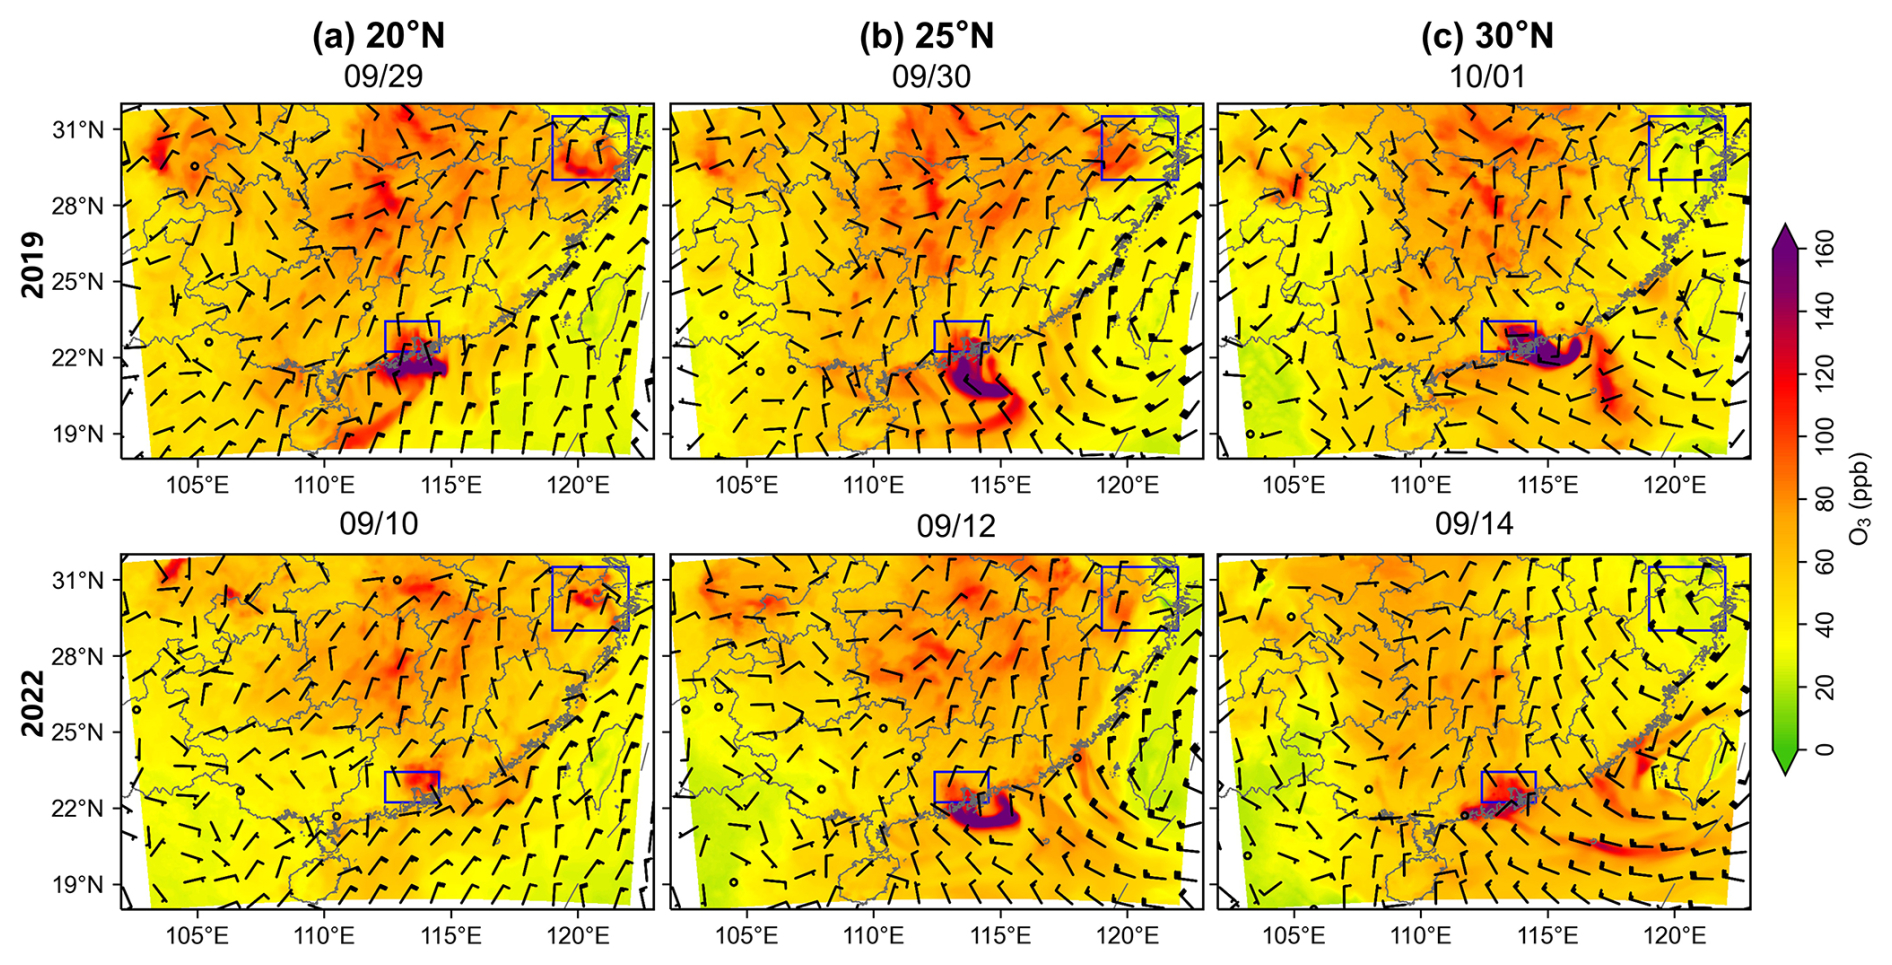
Figure 9Spatial distribution of ozone and wind fields at ground level at 14:00 when TC was located at latitudes of (a) 20° N, (b) 25° N, and (c) 30° N during two episodes.
To investigate how TC located at different positions within the key subregion influences ozone variations over SEC at different intensities of TC, we conducted a comparative analysis of ozone differences in IT_TC (Fig. 10) and NO_TC (Fig. 11) sensitivity experiments, together with the corresponding meteorological fields (solar radiation reaching surface, 2 m temperature, and 2 m relative humidity; Figs. S1–S6 in the Supplement). When the intensified TC (IT_TC) is located within 20–25° N before landfall, northerly winds gradually strengthen (Fig. 10a and b), while solar radiation changes little (Fig. S1a and b), 2 m temperature decreases slightly overall (Fig. S2a and b), and 2 m relative humidity generally increases (Fig. S3a and b). Under this background, ozone concentration over most of SEC exhibits weak positive anomalies (Fig. 10a and b). That is to say, the TC enhancement did not lead to a significant increase in ozone concentration of SEC. In addition, the strong northerly wind also transported the locally high-concentration ozone southward, reducing ozone levels in upstream areas such as the vicinity of ZJ and some parts of the PRD, while increasing ozone concentration in downwind areas like offshore PRD areas (Fig. 10a and b). As mentioned in Sect. 3.1, when TC intensity exceeds TY level, the associated meteorological changes no longer continue to favor ozone production and accumulation. Consequently, for the TC Muifa in 2022 with a maximum intensity of STY, ozone concentration in coastal cities along SEC decreased by more than 10 ppb under its stronger influence on 12 September (bottom panel in Fig. 10b). After the enhanced TC made landfall, stronger winds and enhanced near-surface moisture (Fig. S3c) alleviated the high-temperature conditions (Fig. S2c) and decreased ozone concentration by more than 10 ppb across western SEC compared to the CTL (Fig. 10c), with a greater range of decline during the 2022 Muifa TC period (bottom panel in Fig. 10c).
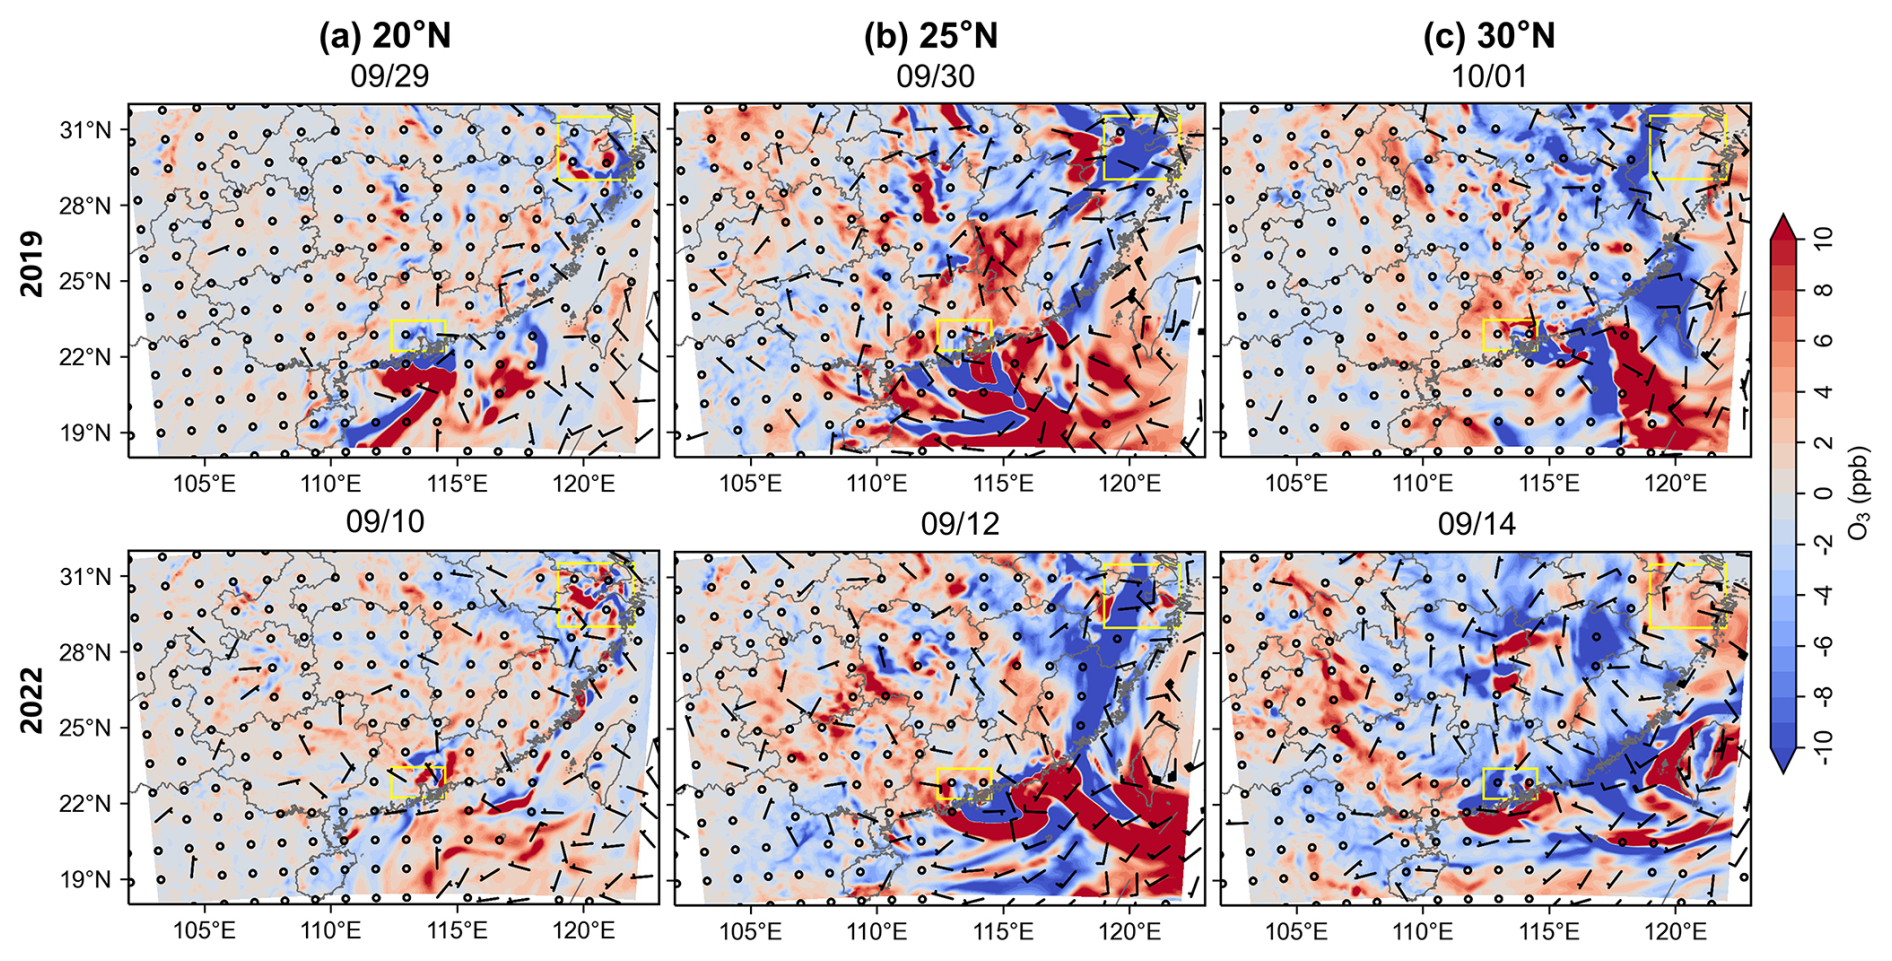
Figure 10Difference in surface ozone concentration and 10 m wind fields between IT_TC and CTL at 14:00.
After removing the influence of TC, the northerly wind weakened and the southward wind component enhanced (Fig. 11). More warm and moist air from the ocean increased the relative humidity (Fig. S6), which, combined with weak solar radiation (Fig. S4), collectively led to a reduction in ozone concentration of more than 10 ppb across most regions of the SEC. This indicates that, under the combined effects of removing the TC-related dynamical influence and imposing a weaker non-TC radiative regime, the situation of high ozone concentration in most parts of the SEC would be alleviated. Notably, without the enhanced near-surface moisture (Fig. S6c) and strong winds brought by the TC landfall, solar radiation (Fig. S4b and c) and 2 m temperature (Fig. S5b and c) both increase markedly, leading to ozone concentration in ZJ and its surrounding areas on the east side of the SEC increased by more than 10 ppb (Fig. 11b and c).
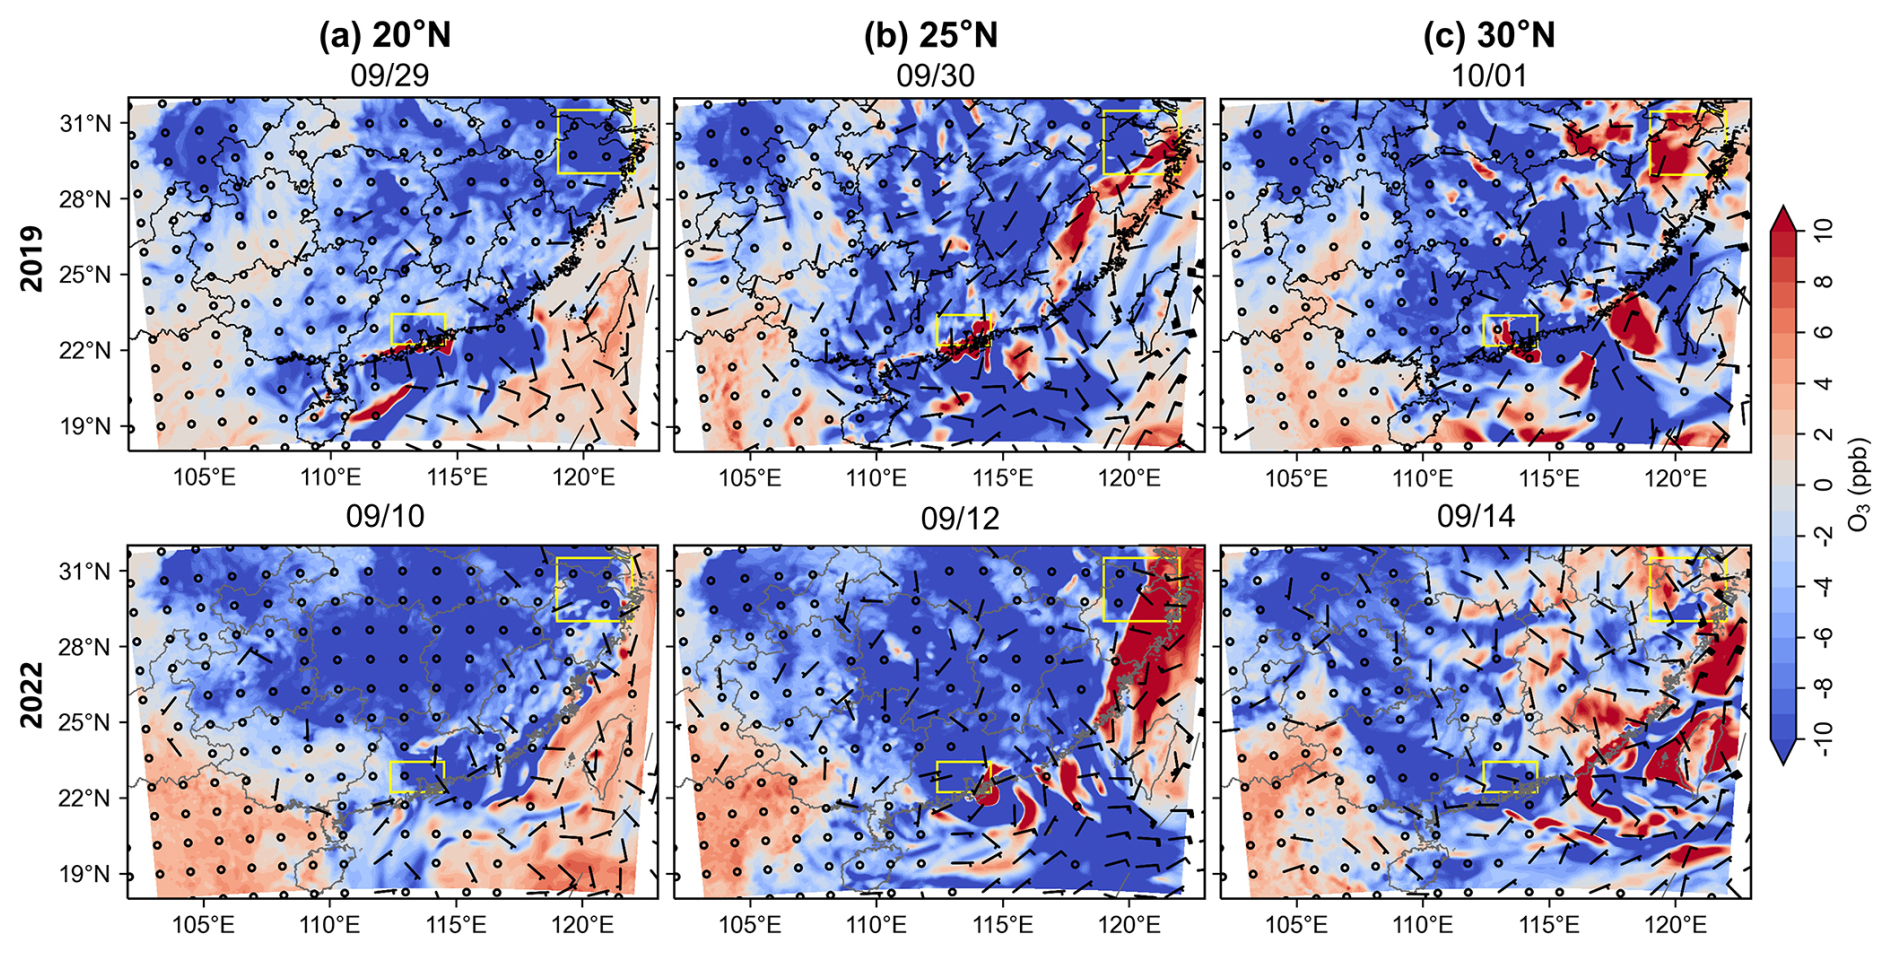
Figure 11Same as Fig. 10 but for the NO_TC experiment.
Further insights can be seen from Fig. 12, which compares atmospheric circulation and ozone vertical distribution during two ozone pollution episodes when TCs are in similar positions. During TC intensification (panels in the third row), stronger northerly winds transport more ozone within the boundary layer from ZJ (A) to PRD (B). Consequently, ozone concentration along the line AB, particularly over PRD and the offshore sea area, increased compared to the CTL (Fig. 12a and d, b and e). As the intensified TC moved to 25° N, ozone concentration over ZJ began to decline significantly (Fig. 12b and e). This reduction became more pronounced upon TC landfall near 30° N (Fig. 12c and f), where stronger winds effectively mitigated the high ozone across a broader region of ZJ. At the same time, decreased 2 m temperature and enhanced 2 m relative humidity near the surface (Figs. S2 and S3) indicate a cooler and moister environment after landfall, which further contributed to the ozone reduction. In NO_TC (panels in the fourth row), reduced solar radiation (Fig. S4) weakened photochemical ozone production, leading to a general decrease in ozone within the boundary layer. Meanwhile, the reduction in wind speeds weakens horizontal transport at all levels along the line AB, causing ozone to accumulate over PRD rather than being blown outside the sea. Subsequently, due to the lack of wind and rainfall brought by the TC landfall, ozone concentration over ZJ increased relative to the CTL experiment (Fig. 12c and f).
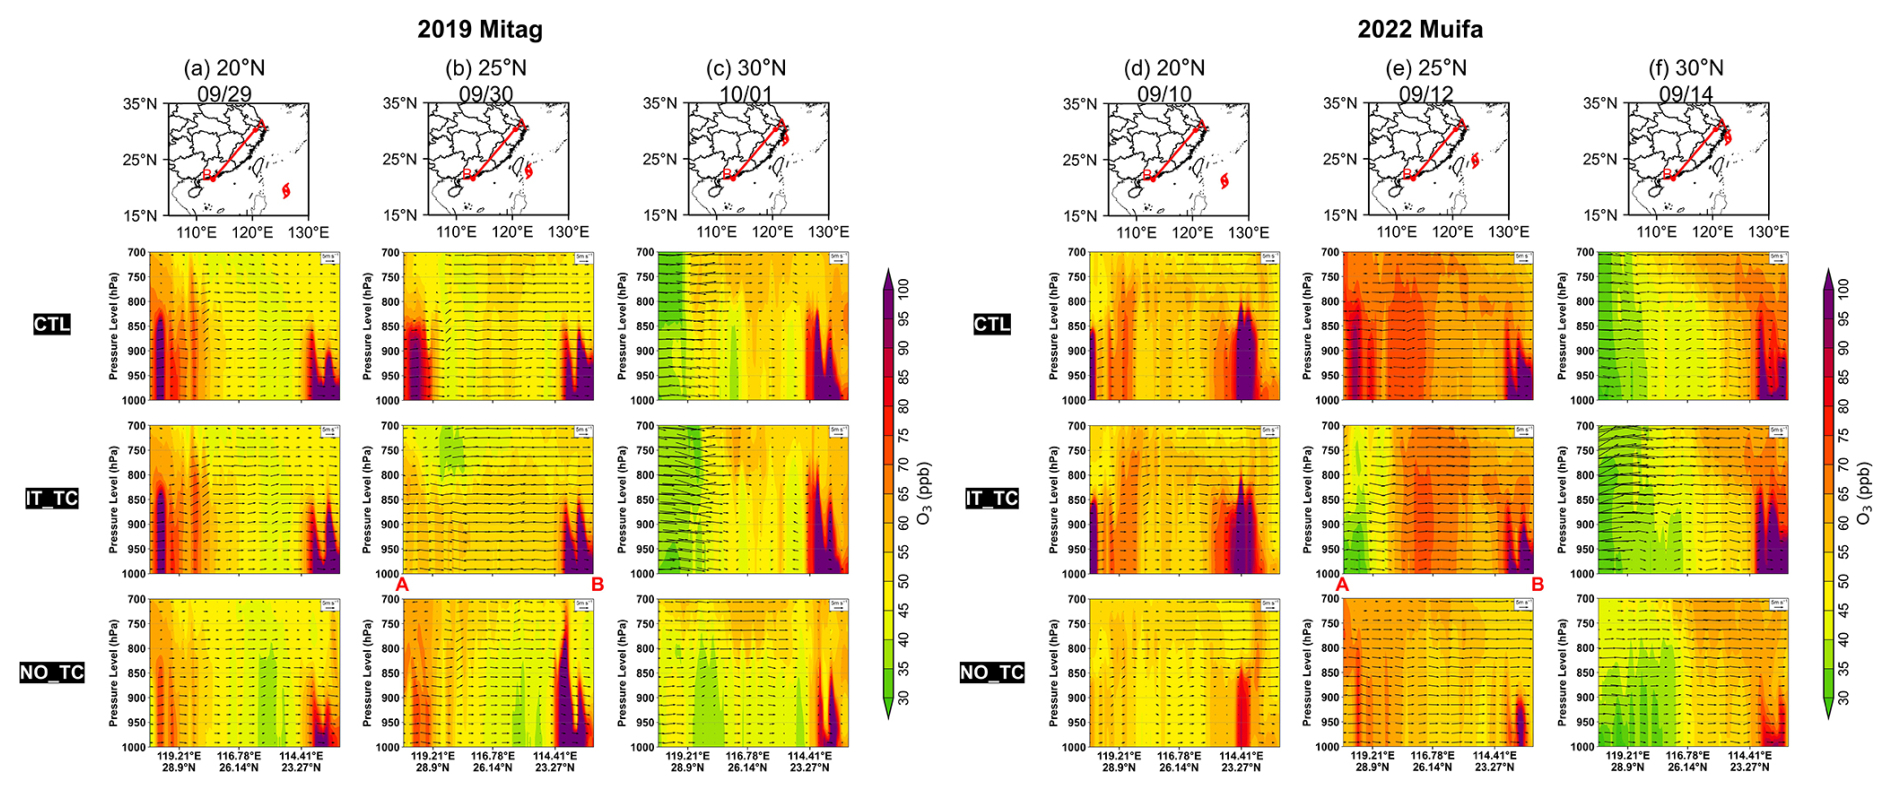
Figure 12Vertical distribution of ozone concentration (contours) and atmospheric circulation (wind vectors) over SEC (along the cross-section marked by the red line in the top-row panels) at 14:00 on the days with similar TC positions during the two episodes.
In summary, an intensified TC initially enhances northerly winds over the SEC, leading to a slight increase in ozone concentration with downwind transport. Subsequently, as the TC makes landfall, improved diffusion conditions and precipitation lead to a more pronounced ozone reduction in ZJ and surrounding areas. Conversely, when there is no TC, strengthened southerly winds bring more warm and humid marine air, coupled with reduced solar radiation, which causes the ozone concentration in the boundary layer of the SEC to decline by more than 10 ppb overall. Later, the lack of TC-induced rainfall and strong winds contributes to elevated ozone concentrations in the ZJ region.
3.2.3 Changes in BVOCs caused by solar radiation alterations
On the other hand, the high temperature and intense solar radiation associated with the TC periphery can induce more biogenic VOC (BVOCs) emissions from forest areas in southern China (Wang et al., 2022; Kou et al., 2023), which are important precursors to ozone formation. Since isoprene (ISOP) is the most abundant BVOC species in the forest areas of southern China (Zheng et al., 2010; Li et al., 2023a; Wang et al., 2024b), we employ ISOP as a representative indicator of BVOC emissions to investigate the impact of solar radiation differences on BVOCs emissions between conditions with and without TC. Figure 13a and b present the variability rate of ISOP caused by solar radiation changes before and after removing TC during two ozone pollution episodes, showing that when solar radiation changes by 37 %, the ISOP concentration in SEC exhibits a corresponding linear reduction of 37 %. This led to an overall decline of approximately 1 ppb in ozone concentration (averaged from 12:00 to 18:00 during the ozone pollution episodes), with a drop of about 3 ppb in the PRD and the central part of SEC, followed by the ZJ of around 2 ppb (Fig. 13c and d). In other words, changes in BVOCs emissions due to altered solar radiation contributed approximately 1–3 ppb to the ozone production. This range of BVOCs emissions contribution is lower than Wang et al. (2022) in PRD between 2014–2018 (from an average of 16.9 % in summer to 26.6 % during TC periods) or Xu et al. (2023) in Beijing-Tianjin-Hebei during TC In-Fa (2021, 10 ppb), which may be related to differences in the research season or the types of TC selected.
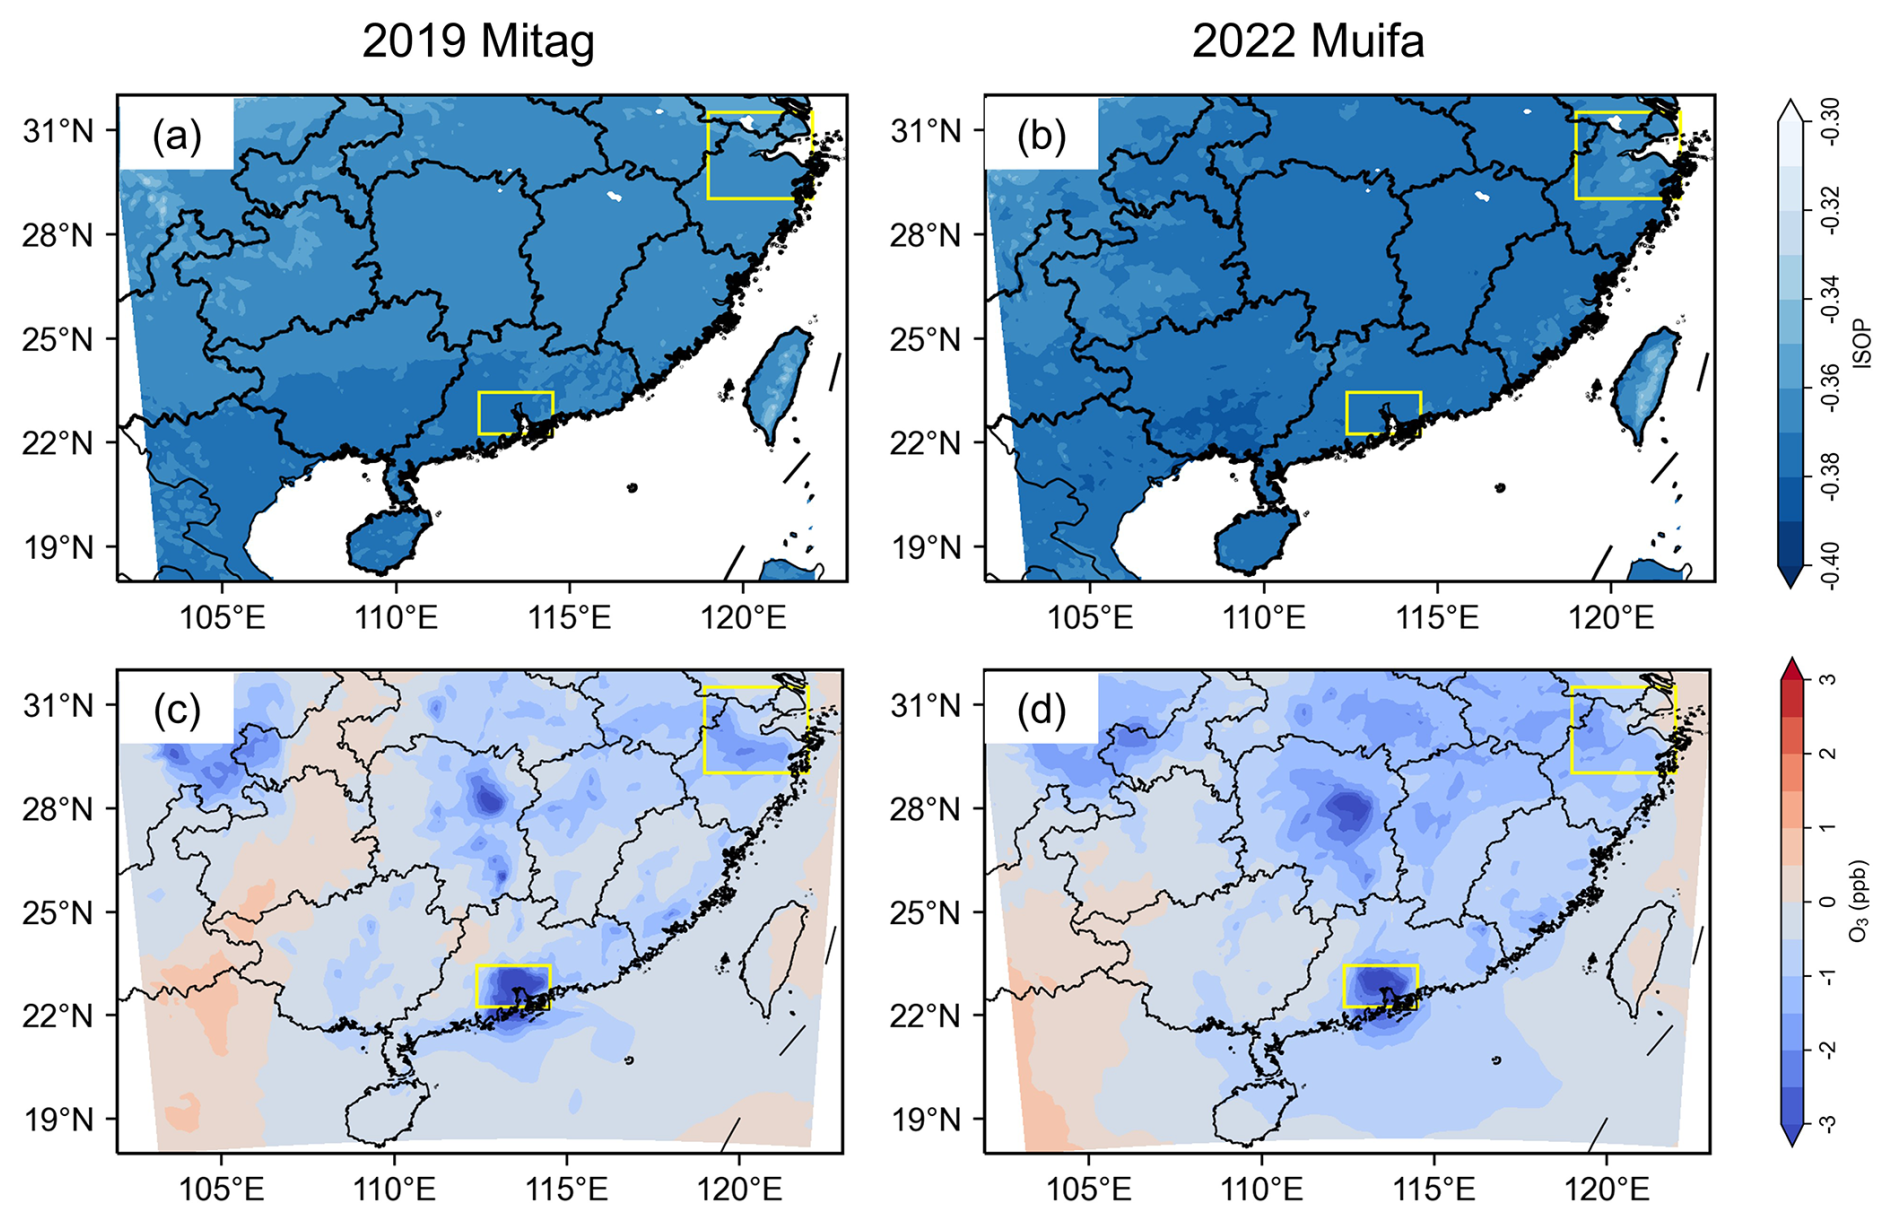
Figure 13Variability rate of ISOP caused by radiation changes during two ozone pollution episodes (a, b). Changes in ozone concentration due to reduced BVOCs emissions resulting from decreased solar radiation (c, d).
3.2.4 Regional ozone budgets in different experiments
To further elucidate the contribution of TCs with varying intensities (different TC experiments) to ozone inside the boundary layer in different SEC regions (PRD and ZJ) at distinct latitudinal positions (TC movement across latitudes), Table 2 summarizes the daytime (08:00–18:00) average contributions of photochemical (CHEM) and transport (HTRA and VTRA) processes results during two ozone pollution episodes. When the TC was positioned at 20° N, CHEM constituted the primary ozone source in both regions (2.13 ppb h−1 in PRD and 1.64 ppb h−1 in ZJ). HTRA mainly showed negative contributions, and VTRA exhibited regional variations. This indicates that even with prevailing northerly winds at the TC periphery driving southward ozone transport, photochemical processes remained dominant when TCs approached the SEC. Upon TC intensification (IT_TC), the contributions of individual processes to ozone in ZJ showed minimal changes (little change in solar radiation and 2 m temperature), suggesting limited influence of enhanced TCs at lower latitudes on the northern SEC. In PRD, the positive contribution of CHEM decreased slightly (an increase in 2 m relative humidity and a slight decrease in 2 m temperature), while the negative contribution of HTRA weakened, demonstrating that intensified northerly winds generally enhanced ozone transport to the southern SEC (PRD). For NO_TC, the reduced positive CHEM contribution (weaker solar radiation) and the significantly weakened negative HTRA contribution (reduced northerly winds) further confirmed that both diminished solar radiation and decreased northerly winds transport collectively led to ozone reduction across the SEC.
Table 2Daytime (08:00–18:00) mean contributions of photochemical (CHEM) and transport (HTRA and VTRA) processes for TCs with varying intensities to ozone within the boundary layer in different SEC regions at distinct latitudinal positions.
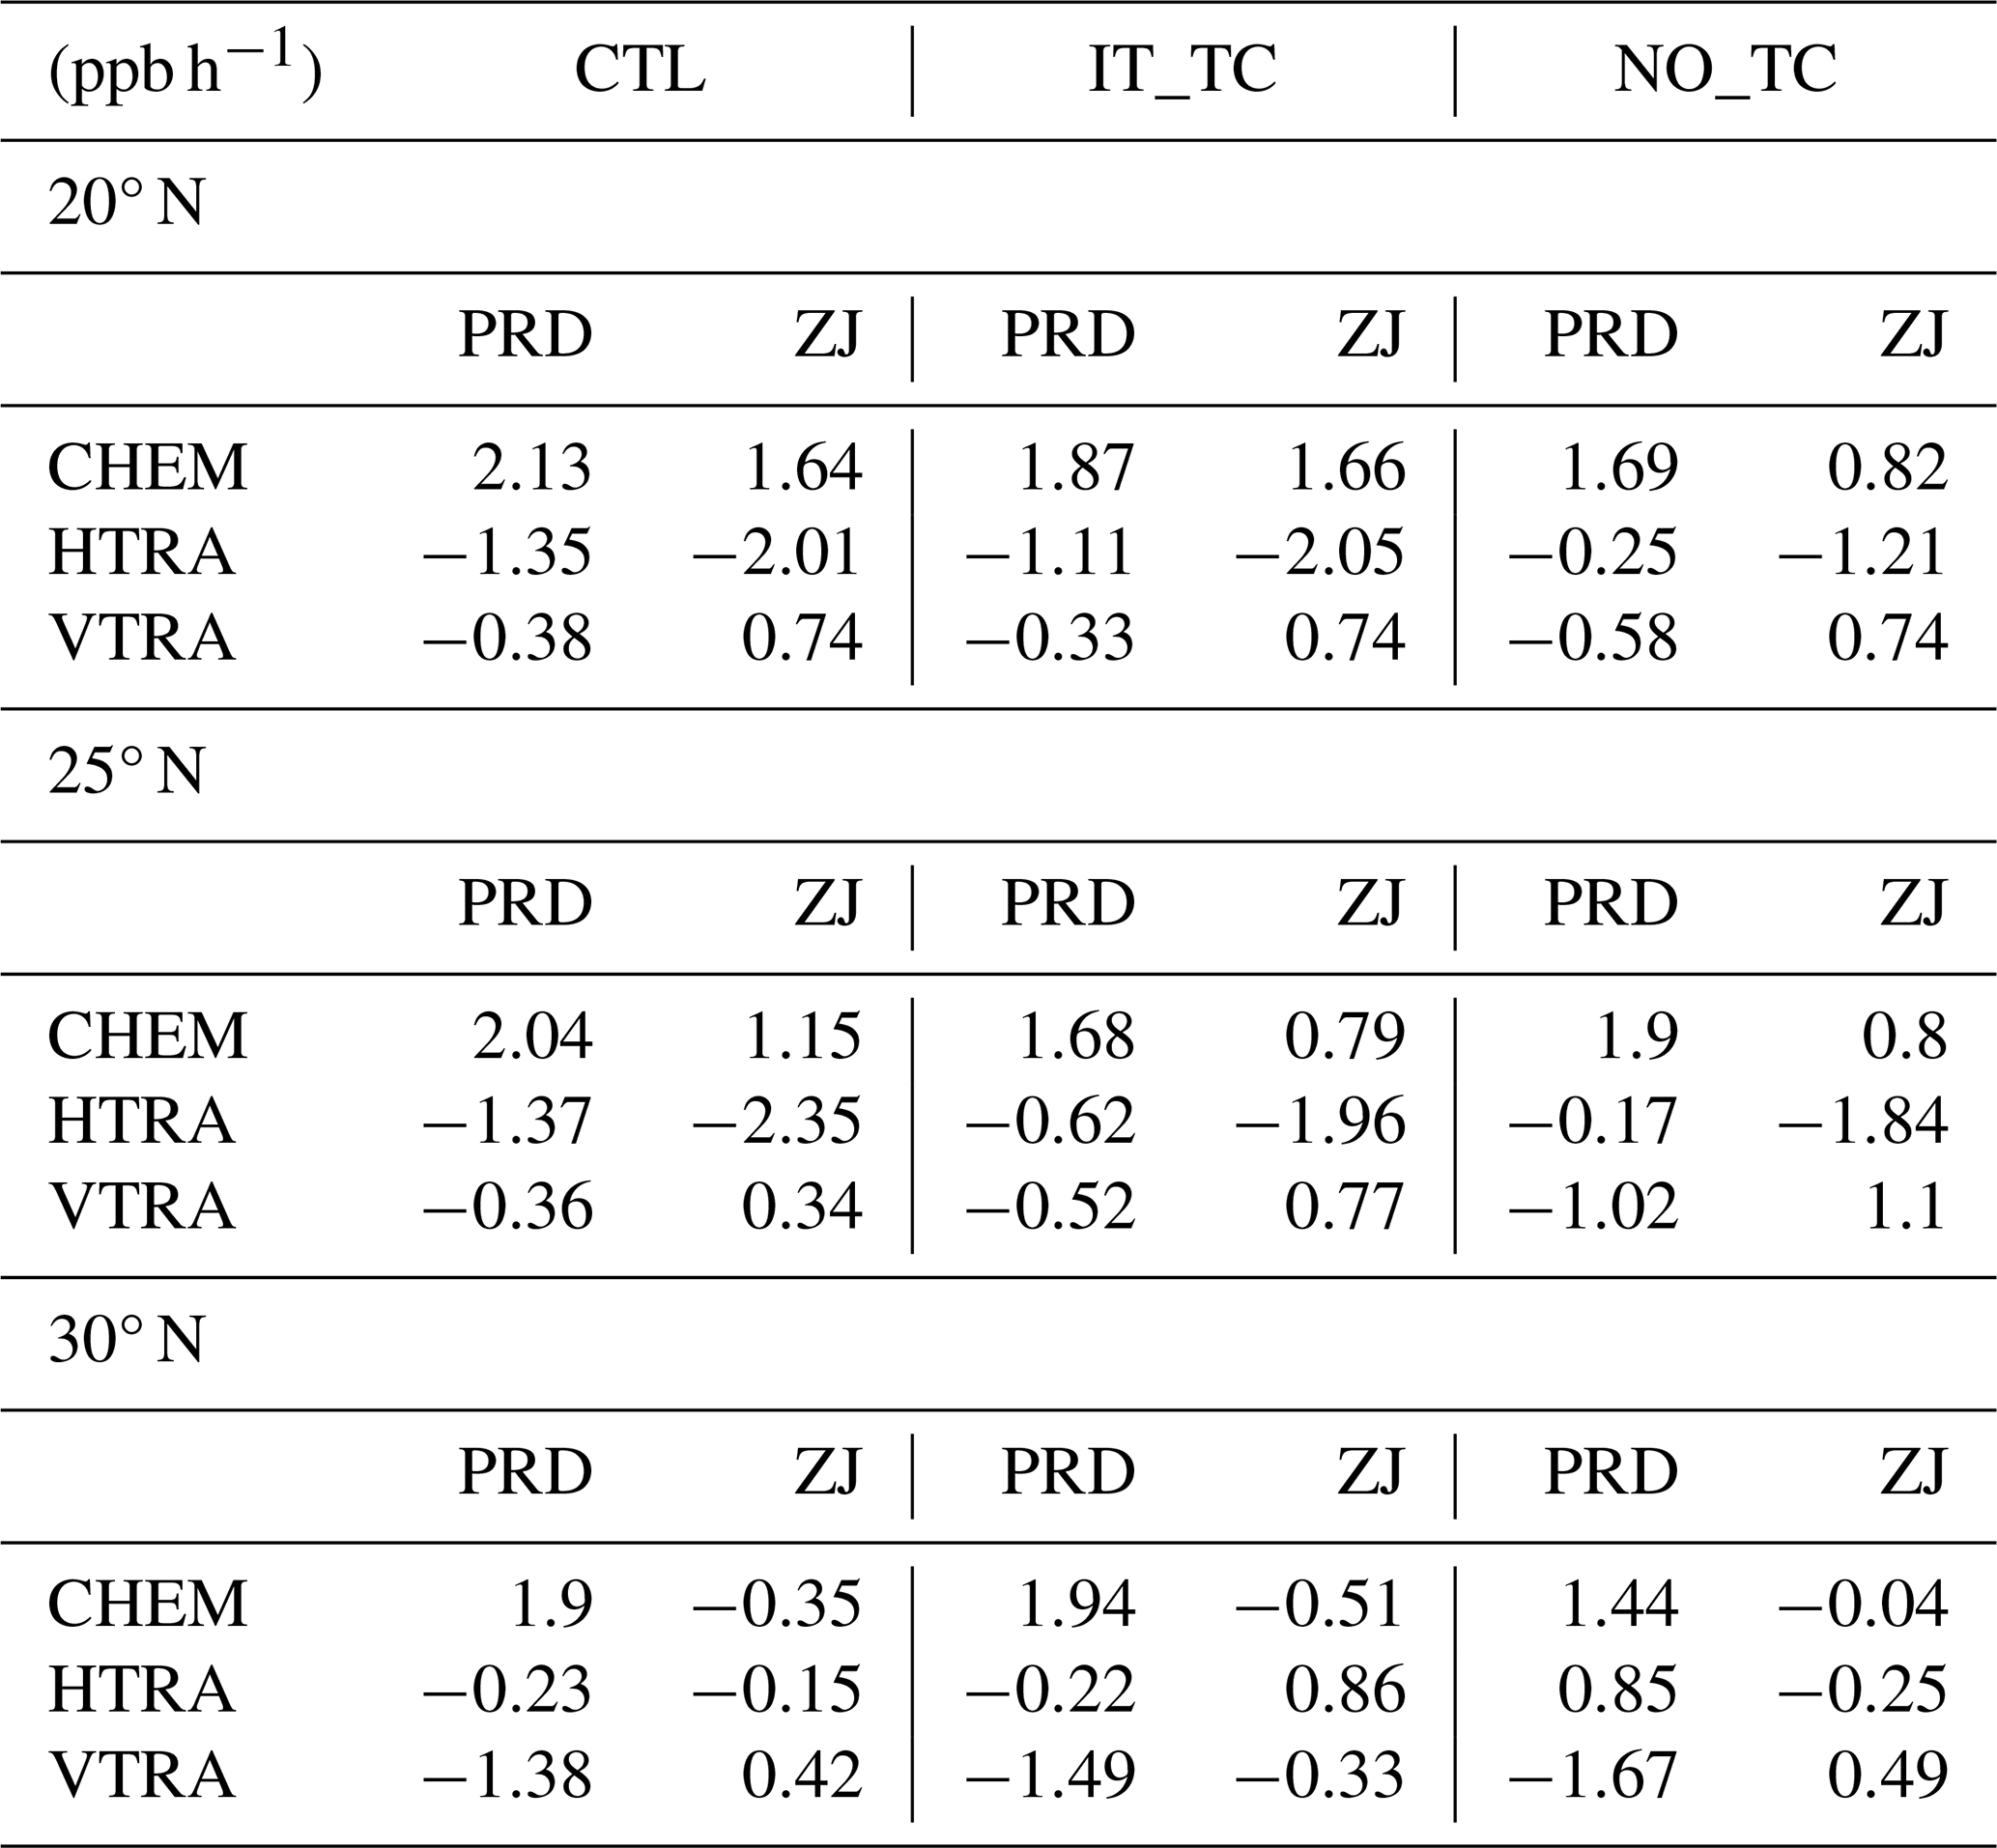
When the TC moved to 25° N, the contributions of various processes exhibited regional divergence with changes in TC intensity. Compared to CTL, both regions in IT_TC showed reduced CHEM contributions (a slight decrease in 2 m temperature), with ZJ experiencing a more pronounced decrease. The change in HTRA is similar to that when the TC is at 20° N. This indicates that although TC enhancement still facilitated outward horizontal transport, the increase in relative humidity (Fig. S3b) simultaneously suppressed photochemical production of ozone. In NO_TC, the lack of TC-induced uplifting compensation resulted in stronger subsidence over ZJ (VTRA: 1.1 ppb h−1), whereas PRD was dominated by localized updraft, yielding a more negative VTRA (−1.02 ppb h−1).
As the TC made landfall at 30° N, PRD showed minimal variations in individual process contributions between CTL and IT_TC (CHEM: 1.9 and 1.94 ppb h−1; HTRA: −0.23 and −0.22 ppb h−1; VTRA: −1.38 and −1.49 ppb h−1) due to weaker TC circulation influence. In contrast, ZJ exhibited significantly enhanced negative CHEM (lower 2 m temperature, higher 2 m relative humidity, and reduced solar radiation) contribution in IT_TC resulting from TC landfall-induced precipitation. Meanwhile, intensified convergence airflows caused HTRA in ZJ to shift from negative to positive (0.86 ppb h−1). Under NO_TC, with the disappearance of TC-induced disturbances, the HTRA contribution in PRD transitioned from negative to positive, while CHEM in ZJ rebounded to −0.04 ppb h−1 (higher solar radiation and 2 m temperature, and lower 2 m relative humidity).
These results indicate that, when the TC is at 20° N, photochemical production dominates ozone formation, with TC enhancement primarily promoting southward transport of ozone. TC removal leads to concurrent radiation reduction and transport weakening, collectively decreasing regional ozone levels. As the TC moves to 25° N, while the enhanced TC favors horizontal transport, the accompanying relative humidity increase suppresses the photochemical production of ozone. Without TC, strengthened subsidence occurs over ZJ, while ozone in the boundary layer of PRD diffuses outward to a greater extent. During TC landfall at 30° N, individual process contributions in PRD remain relatively stable as the TC intensifies, whereas ZJ shows intensified chemical consumption due to precipitation and strong winds. The photochemical production in ZJ roughly recovers when TC influences are removed.
Autumn ozone pollution episodes in SEC are often associated with northward TCs in the Northwest Pacific Ocean. Based on observational and reanalysis data during autumn from 2014 to 2024, this study systematically examines the impacts of relevant meteorological variables and atmospheric circulation patterns associated with northward TCs of varying intensities on ozone in the SEC. Additionally, by carrying out the WRF-CMAQ model simulations with TC intensity sensitivity experiments, we quantitatively explore the contributions of TC intensity and position to ozone variations across different regions of the SEC during two severe ozone pollution episodes. Results show that the interannual variation of MDA8 ozone in autumn (2014–2024) over the SEC is consistent with TC activity, with relatively intense northward TCs playing a crucial role, especially when they are located within 120–130° E and 20–30° N. Under the influence of these TCs within the key subregion, ozone concentration exceeds 50 ppb at nearly all intensities. As TC intensity reaches TY, stronger subsidence, fewer clouds, stronger solar radiation, higher boundary layer height, lower relative humidity, and weaker precipitation collectively lead to peak ozone concentration. Further intensification to STY and SSTY does not lead to continued improvement in meteorological conditions conducive to ozone, and ozone over SEC therefore remains high but decreases slightly instead of increasing further.
By applying a vortex filtering method in the WRF numerical model to intensify the meteorological variables related to the TC vortex, or to remove them followed by an additional 37 % reduction in solar radiation and photolysis rate during two severe ozone pollution episodes, we find that the intensification of TC enhanced northerly winds over the SEC caused a slight increase in ozone with southward transport. As TCs made landfall, improved diffusion conditions and precipitation led to a more pronounced ozone reduction in ZJ and surrounding areas. Conversely, TC removal weakened northerly wind transport and, combined with reduced solar radiation, led to a widespread ozone decrease across the SEC by more than 10 ppb. Changes in BVOCs emissions due to altered solar radiation contributed approximately 1–3 ppb. Moreover, the results of the process analysis show that when the TC is at 20° N, photochemical production dominates ozone formation, with TC enhancement promoting southward transport while TC removal reduces ozone concentration. As TC moved to 25° N, although an intensified TC facilitates horizontal transport, the increase in relative humidity suppresses photochemical production of ozone. TC removal induces pronounced regional divergence in vertical transport. When TC makes landfall at 30° N, PRD remains relatively unaffected, whereas enhanced TCs accelerate ozone depletion in ZJ, a pattern that reverses with TC removal and photochemical production largely recovers.
Previous studies have investigated the relationship between TCs and ozone in the SEC, but most focused on qualitative comparisons of ozone levels with and without TC influence. In this study, we reveal the impact of northward TC intensity on ozone in the SEC and quantitatively evaluate the contribution of TCs using a vortex filtering method, which is crucial for deepening the understanding of TC roles in ozone pollution and for optimizing emission control strategies. In the context of global warming, TCs are expected to become stronger (Wu et al., 2022; Xu et al., 2024b) and more likely to move northward (Cao et al., 2025; Nie et al., 2023), with extreme weather events projected to be frequent and intense. Therefore, the potential impacts of northward TCs and associated large-scale circulation on surface ozone in SEC merit further study. Notably, TC tracks and intensities are strongly modulated by non-linear interactions with large-scale circulation, particularly the WPSH (Pandey, 2025; Sun et al., 2015; Wu et al., 2020a). After the removal of the TCs associated with the two severe ozone pollution episodes selected in this study, the SEC returned to the control of the WPSH (not shown). More accurate quantification of TCs and WPSH impacts on ozone in the SEC and across eastern China can be achieved through further sensitivity experiments that simultaneously consider the WPSH influences.
Hourly surface ozone data were obtained from the China National Environmental Centre (http://www.cnemc.cn/en/). The TC best track dataset was available from the China Meteorological Administration Tropical Cyclone Data Centre (available at https://tcdata.typhoon.org.cn/). The meteorological data were acquired from European Centre for Medium-Range Weather Forecasts Reanalysis v5 dataset (https://cds.climate.copernicus.eu/). The model input meteorological data were taken from the National Centre for Environmental Prediction (https://rda.ucar.edu/, last access: 19 November 2025). Model output data of this paper are available upon request.
The supplement related to this article is available online at https://doi.org/10.5194/acp-26-8407-2026-supplement.
TD and SL proposed the essential research idea. SO and JC performed the model simulations work and carried out the model output data analysis. SO wrote the original paper with input from TD, SL, and RL. TD, SL, and RL helped to revise the paper. JY, YH, and XC discussed the results and offered valuable comments.
The contact author has declared that none of the authors has any competing interests.
Publisher's note: Copernicus Publications remains neutral with regard to jurisdictional claims made in the text, published maps, institutional affiliations, or any other geographical representation in this paper. The authors bear the ultimate responsibility for providing appropriate place names. Views expressed in the text are those of the authors and do not necessarily reflect the views of the publisher.
We would like to acknowledge the China National Environmental Centre, the European Centre for Medium-Range Weather Forecasts, and the National Centre for Environmental Prediction for providing datasets that made this work possible. The numerical calculations were performed on the Guangdong Meteorological Service. We also acknowledge the support of the College of Environment and Climate, Institute for Environmental and Climate Research, Jinan University and the Guangdong Provincial Key Laboratory of Regional Numerical Weather Prediction, Guangzhou Institute of Tropical and Marine Meteorology of China Meteorological Administration, GBA Academy of Meteorological Research.
This research was supported by the National Key Research and Development Program of China (grant nos. 2023YFC3709201 and 2023YFC3706204), the National Natural Science Foundation of China (grant nos. 42275123 and 42405194), Guangdong Provincial Science and Technology Collaborative Innovation Project for Social Development (grant no. 2024A1111120022), the Guangdong Basic and Applied Basic Research Foundation (grant nos. 2023A1515012448, 2023A1515012205, and 2024A1515510025), the Special Fund Project for Science and Technology Innovation Strategy of Guangdong Province (grant no. 2019B121205004), the Key Innovation Team of Key Innovation Team of China Meteorological Administration (grant no. CMA2023ZD08), the Science and Technology Research Project of Guangdong Meteorological Bureau (grant no. GRMC2025M18).
This paper was edited by Kevin Grise and reviewed by two anonymous referees.
Cao, X., Wu, R., Jiang, X., Dai, Y., Wang, P., Lin, C., Deng, D., Sun, Y., Wu, L., Chen, S., Wang, Y., and Xiao, X.: Future changes in tropical cyclone tracks over the western North Pacific under climate change, npj Climate and Atmospheric Science, 8, 148, https://doi.org/10.1038/s41612-025-01036-6, 2025.
Chen, Z., Liu, J., Cheng, X., Yang, M., and Wang, H.: Positive and negative influences of typhoons on tropospheric ozone over southern China, Atmos. Chem. Phys., 21, 16911–16923, https://doi.org/10.5194/acp-21-16911-2021, 2021.
Chen, Z., Liu, J., Qie, X., Cheng, X., Shen, Y., Yang, M., Jiang, R., and Liu, X.: Transport of substantial stratospheric ozone to the surface by a dying typhoon and shallow convection, Atmos. Chem. Phys., 22, 8221–8240, https://doi.org/10.5194/acp-22-8221-2022, 2022.
Deng, T., Wang, T., Wang, S., Zou, Y., Yin, C., Li, F., Liu, L., Wang, N., Song, L., Wu, C., and Wu, D.: Impact of typhoon periphery on high ozone and high aerosol pollution in the Pearl River Delta region, Sci. Total Environ., 668, 617–630, https://doi.org/10.1016/j.scitotenv.2019.02.450, 2019.
Ding, H., Kong, L., You, Y., Mao, J., Chen, W., Chen, D., Chang, M., and Wang, X.: Effects of tropical cyclones with different tracks on ozone pollution over the Pearl River Delta region, Atmos. Res., 286, https://doi.org/10.1016/j.atmosres.2023.106680, 2023.
Dong, W., Lin, Y., Wright, J. S., Xie, Y., Xu, F., Yang, K., Li, X., Tian, L., Zhao, X., and Cao, D.: Connections Between a Late Summer Snowstorm Over the Southwestern Tibetan Plateau and a Concurrent Indian Monsoon Low-Pressure System, J. Geophys. Res.-Atmos., 123, 13676–13691, https://doi.org/10.1029/2018jd029710, 2018.
Feng, L., Ma, D., Xie, M., and Xi, M. J. R. S.: Review on the Application of Remote Sensing Data and Machine Learning to the Estimation of Anthropogenic Heat Emissions, Remote Sens.-Basel, 17, 200, https://doi.org/10.3390/rs17020200, 2025.
Grulke, N. E. and Heath, R. L.: Ozone effects on plants in natural ecosystems, Plant Biol., 22, 12–37, https://doi.org/10.1111/plb.12971, 2020.
He, G., Deng, T., Wu, D., Wu, C., Huang, X., Li, Z., Yin, C., Zou, Y., Song, L., Ouyang, S., Tao, L., and Zhang, X.: Characteristics of boundary layer ozone and its effect on surface ozone concentration in Shenzhen, China: A case study, Sci. Total Environ., 791, https://doi.org/10.1016/j.scitotenv.2021.148044, 2021.
Hu, T., Lin, Y., Liu, R., Xu, Y., Ouyang, S., Wang, B., Zhang, Y., and Liu, S. C.: What caused large ozone variabilities in three megacity clusters in eastern China during 2015–2020?, Atmos. Chem. Phys., 24, 1607–1626, https://doi.org/10.5194/acp-24-1607-2024, 2024.
Hu, W., Liu, R., Chen, Z., Ouyang, S., Hu, T., Wang, Y., Cui, Z., Jiang, B., Chen, D., and Liu, S. C.: Processes conducive to high ozone formation in Pearl River Delta in the presence of Pacific tropical cyclones, Atmos. Environ., 307, https://doi.org/10.1016/j.atmosenv.2023.119859, 2023.
Huang, T., Yang, Y., O'Connor, E. J., Lolli, S., Haywood, J., Osborne, M., Cheng, J. C.-H., Guo, J., and Yim, S. H.-L.: Influence of a weak typhoon on the vertical distribution of air pollution in Hong Kong: A perspective from a Doppler LiDAR network, Environ. Pollut., 276, https://doi.org/10.1016/j.envpol.2021.116534, 2021.
Huang, Y., Xue, J., Feng, Y., Chen, Z., Zhang, C., Li, M., and Li, J.: An initialization scheme using forecast vortexes and its application in simulation of typhoons Linfa and Chan-hom in 2015, Journal of Tropical Meteorology, 34, 598–609, https://doi.org/10.16032/j.issn.1004-4965.2018.05.003, 2018 (in Chinese).
Jacob, D. J. and Winner, D. A.: Effect of climate change on air quality, Atmos. Environ., 43, 51–63, https://doi.org/10.1016/j.atmosenv.2008.09.051, 2009.
Kou, W., Gao, Y., Zhang, S., Cai, W., Geng, G., Davis, S., Wang, H., Guo, X., Cheng, W., Zeng, X., Mingchen, M., Wang, H., Wang, Q., Yao, X., Gao, H., and Wu, L.: High downward surface solar radiation conducive to ozone pollution more frequent under global warming, Sci. Bull., 68, https://doi.org/10.1016/j.scib.2023.01.022, 2023.
Kurihara, Y., Bender, M. A., and Ross, R. J.: An Initialization Scheme of Hurricane Models by Vortex Specification, Mon. Weather Rev., 121, 2030–2045, https://doi.org/10.1175/1520-0493(1993)121<2030:AISOHM>2.0.CO;2, 1993.
Kurihara, Y., Bender, M. A., Tuleya, R. E., and Ross, R. J.: Improvements in the GFDL Hurricane Prediction System, Mon. Weather Rev., 123, 2791–2801, https://doi.org/10.1175/1520-0493(1995)123<2791:IITGHP>2.0.CO;2, 1995.
Lam, Y. F., Cheung, H. M., and Ying, C. C.: Impact of tropical cyclone track change on regional air quality, Sci. Total Environ., 610, 1347–1355, https://doi.org/10.1016/j.scitotenv.2017.08.100, 2018.
Li, L., Cao, J., and Hao, Y.: Spatial and species-specific responses of biogenic volatile organic compound (BVOC) emissions to elevated ozone from 2014–2020 in China, Sci. Total Environ., 868, https://doi.org/10.1016/j.scitotenv.2023.161636, 2023a.
Li, T., Wu, N., Chen, J., Chan, P. W., Tang, J., and Wang, N.: Vertical exchange and cross-regional transport of lower-tropospheric ozone over Hong Kong, Atmos. Res., 292, 106877, https://doi.org/10.1016/j.atmosres.2023.106877, 2023b.
Li, Y., Zhao, X., Deng, X., and Gao, J.: The impact of peripheral circulation characteristics of typhoon on sustained ozone episodes over the Pearl River Delta region, China, Atmos. Chem. Phys., 22, 3861–3873, https://doi.org/10.5194/acp-22-3861-2022, 2022.
Lin, H., Ding, K., Huang, X., Lou, S., Xue, L., Wang, Z., Ma, Y., and Ding, A.: Impacts of Northward Typhoons on Autumn Haze Pollution Over North China Plain, J. Geophys. Res.-Atmos., 129, e2023JD040465, https://doi.org/10.1029/2023JD040465, 2024.
Liu, B., Li, Y., Wang, L., Zhang, L., Qiao, F., Nan, P., Ji, D., Hu, B., Xia, Z., and Lou, Z.: Evaluating the effects of meteorology and emission changes on ozone in different regions over China based on machine learning, Atmos. Pollut. Res., 102354, https://doi.org/10.1016/j.apr.2024.102354, 2024.
Liu, C., He, C., Wang, Y., He, G., Liu, N., Miao, S., Wang, H., Lu, X., and Fan, S.: Characteristics and mechanism of a persistent ozone pollution event in Pearl River Delta induced by typhoon and subtropical high, Atmos. Environ., 310, 119964, https://doi.org/10.1016/j.atmosenv.2023.119964, 2023a.
Liu, N., He, G., Wang, H., He, C., Wang, H., Liu, C., Wang, Y., Wang, H., Li, L., Lu, X., and Fan, S.: Rising frequency of ozone-favorable synoptic weather patterns contributes to 2015–2022 ozone increase in Guangzhou, J. Environ. Sci., 148, 502–514, https://doi.org/10.1016/j.jes.2023.09.024, 2025.
Liu, Y., Liang, P., and Sun, Y.: Chapter 5 – Characteristics of the Western Pacific Subtropical High and Summer Rainfall Anomalies, The Asian Summer Monsoon, 85–95, https://doi.org/10.1016/B978-0-12-815881-4.00005-6, 2019.
Liu, Y., Geng, G., Cheng, J., Liu, Y., Xiao, Q., Liu, L., Shi, Q., Tong, D., He, K., and Zhang, Q.: Drivers of Increasing Ozone during the Two Phases of Clean Air Actions in China 2013–2020, Environ. Sci. Technol., 57, 24, 8954–8964, https://doi.org/10.1021/acs.est.3c00054, 2023b.
Lu, X., Zhang, L., and Shen, L.: Meteorology and Climate Influences on Tropospheric Ozone: a Review of Natural Sources, Chemistry, and Transport Patterns, Current Pollution Reports, 5, 238–260, https://doi.org/10.1007/s40726-019-00118-3, 2019.
Lu, X., Yu, H., Ying, M., Zhao, B., Zhang, S., Lin, L., Bai, L., and Wan, R.: Western North Pacific Tropical Cyclone Database Created by the China Meteorological Administration, Adv. Atmos. Sci., 38, 690–699, https://doi.org/10.1007/s00376-020-0211-7, 2021.
Nie, X., Tan, H., Cai, R. and Gao, X.: Projection of the tropical cyclones landing in China in the future based on regional climate model, Climate Change Research, 19, 23–37, https://doi.org/10.12006/j.issn.1673-1719.2022.064, 2023 (in Chinese).
Ouyang, S., Deng, T., Liu, R., Chen, J., He, G., Leung, J. C.-H., Wang, N., and Liu, S. C.: Impact of a subtropical high and a typhoon on a severe ozone pollution episode in the Pearl River Delta, China, Atmos. Chem. Phys., 22, 10751–10767, https://doi.org/10.5194/acp-22-10751-2022, 2022.
Ouyang, S., Deng, T., Li, C., Chen, J., He, G., Zhang, X., Wang, Q., Zhang, Z., and Rao, G.: Impact of tropical cyclone intensity evolution under different tracks on ozone in the Pearl River Delta, China, Atmos. Res., 337, 108972, https://doi.org/10.1016/j.atmosres.2026.108972, 2026.
Pandey, R. S.: Role of Position of Pacific Subtropical High in Deciding Path of Tropical Storms, Atmosphere, 16, 322, https://doi.org/10.3390/atmos16030322, 2025.
Professional Committee of Ozone Pollution Control of Chinese Society for Environmental Sciences: The Bluebook: Prevention and Control of Ozone Pollution in China (2023), Science Press, Beijing, China, ISBN 978-7-03-078184-0, 2024 (in Chinese).
Qu, K., Wang, X., Yan, Y., Shen, J., Xiao, T., Dong, H., Zeng, L., and Zhang, Y.: A comparative study to reveal the influence of typhoons on the transport, production and accumulation of O3 in the Pearl River Delta, China, Atmos. Chem. Phys., 21, 11593–11612, https://doi.org/10.5194/acp-21-11593-2021, 2021.
Shu, L., Xie, M., Wang, T., Gao, D., Chen, P., Han, Y., Li, S., Zhuang, B., and Li, M.: Integrated studies of a regional ozone pollution synthetically affected by subtropical high and typhoon system in the Yangtze River Delta region, China, Atmos. Chem. Phys., 16, 15801–15819, https://doi.org/10.5194/acp-16-15801-2016, 2016.
Sun, Y., Zhong, Z., Yi, L., Li, T., Chen, M., Wan, H., Wang, Y., and Zhong, K.: Dependence of the relationship between the tropical cyclone track and western Pacific subtropical high intensity on initial storm size: A numerical investigation, J. Geophys. Res.-Atmos., 120, 11451–11467, https://doi.org/10.1002/2015JD023716, 2015.
Tang, J., Xu, X., Zhang, S., Xu, H., and Cai, W.: Response of remote water vapor transport to large topographic effects and the multi-scale system during the “7.20” rainstorm event in Henan Province, China, Front. Earth Sci., 11, https://doi.org/10.3389/feart.2023.1106990, 2023.
Trainer, M., Parrish, D. D., Goldan, P. D., Roberts, J., and Fehsenfeld, F. C.: Review of observation-based analysis of the regional factors influencing ozone concentrations, Atmos. Environ., 34, 2045–2061, https://doi.org/10.1016/S1352-2310(99)00459-8, 2000.
Wang, J., Wang, P., Tian, C., Gao, M., Cheng, T., and Mei, W.: Consecutive Northward Super Typhoons Induced Extreme Ozone Pollution Events in Eastern China, Npj Climate and Atmospheric Science, 7, https://doi.org/10.1038/s41612-024-00786-z, 2024a.
Wang, N., Huang, X., Xu, J., Wang, T., Tan, Z.-M., and Ding, A.: Typhoon-boosted biogenic emission aggravates cross-regional ozone pollution in China, Science Advances, 8, https://doi.org/10.1126/sciadv.abl6166, 2022.
Wang, N., Wang, H., Huang, X., Chen, X., Zou, Y., Deng, T., Li, T., Lyu, X., and Yang, F.: Extreme weather exacerbates ozone pollution in the Pearl River Delta, China: role of natural processes, Atmos. Chem. Phys., 24, 1559–1570, https://doi.org/10.5194/acp-24-1559-2024, 2024b.
Wu, L., Zhao, H., Wang, C., Cao, J., and Liang, J.: Understanding of the Effect of Climate Change on Tropical Cyclone Intensity: A Review, Adv. Atmos. Sci., 39, 205–221, https://doi.org/10.1007/s00376-021-1026-x, 2022.
Wu, Q., Wang, X., and Tao, L.: Interannual and interdecadal impact of Western North Pacific Subtropical High on tropical cyclone activity, Clim. Dynam., 54, 2237–2248, https://doi.org/10.1007/s00382-019-05110-7, 2020a.
Wu, Z., Zhang, J., Chen, J., Pang, B., Xia, Y., and Chen, F.: The study on the method of conditional typhoon vortex relocation for GRAPES regional ensemble prediction, Acta Meteorol. Sin., 78, 163–176, https://doi.org/10.11676/qxxb2020.027, 2020b (in Chinese).
Xi, M., Luo, Y., Li, Y., Ma, D., Feng, L., Zhang, S., Chen, S., and Xie, M.: Comprehensive analysis of prevailing weather patterns and high-impact typhoon tracks to reveal where and how tropical cyclone affects regional ozone pollution in the Yangtze River Delta region, China, Atmos. Environ., 361, 121498, https://doi.org/10.1016/j.atmosenv.2025.121498, 2025a.
Xi, M., Xie, M., Gao, D., Ma, D., Luo, Y., Feng, L., Chen, S., and Zhang, S.: The impact of tropical cyclones on regional ozone pollution and its future trend in the Yangtze River Delta of China, Atmos. Chem. Phys., 25, 14573–14590, https://doi.org/10.5194/acp-25-14573-2025, 2025b.
Xie, M., Liao, J., Wang, T., Zhu, K., Zhuang, B., Han, Y., Li, M., and Li, S.: Modeling of the anthropogenic heat flux and its effect on regional meteorology and air quality over the Yangtze River Delta region, China, Atmos. Chem. Phys., 16, 6071–6089, https://doi.org/10.5194/acp-16-6071-2016, 2016.
Xu, D., Zhang, B., Zeng, Q., Feng, Y., Zhang, Y., and Dai, G.: A typhoon initialization scheme based on incremental analysis updates technology, Acta Meteorol. Sin., 77, 1053–1061, https://doi.org/10.11676/qxxb2019.060, 2019 (in Chinese).
Xu, J., Zhou, D., Gao, J., Huang, X., Xue, L., Huo, J., Fu, Q., and Ding, A.: Biogenic emissions-related ozone enhancement in two major city clusters during a typical typhoon process, Appl. Geochem., 152, https://doi.org/10.1016/j.apgeochem.2023.105634, 2023.
Xu, J., Zhang, Z., Zhao, X., and Zhang, J.: Synthetically impacts of the topography and typhoon periphery on the atmospheric boundary layer structure and special regional pollution pattern of O3 in North China Plain, Atmos. Environ., 330, https://doi.org/10.1016/j.atmosenv.2024.120566, 2024a.
Xu, J., Zhao, P., Chan, J. C. L., Shi, M., Yang, C., Zhao, S., Xu, Y., Chen, J., Du, L., Wu, J., Ye, J., Xing, R., Wang, H., and Lu, L.: Increasing tropical cyclone intensity in the western North Pacific partly driven by warming Tibetan Plateau, Nat. Commun., 15, 310, https://doi.org/10.1038/s41467-023-44403-8, 2024b.
Ying, M., Zhang, W., Yu, H., Lu, X., Feng, J., Fan, Y., Zhu, Y., and Chen, D.: An Overview of the China Meteorological Administration Tropical Cyclone Database, J. Atmos. Ocean. Tech., 31, 287–301, https://doi.org/10.1175/jtech-d-12-00119.1, 2014.
Zhan, C. and Xie, M.: Exploring the link between ozone pollution and stratospheric intrusion under the influence of tropical cyclone Ampil, Sci. Total Environ., 828, https://doi.org/10.1016/j.scitotenv.2022.154261, 2022.
Zhan, C., Xie, M., Huang, C., Liu, J., Wang, T., Xu, M., Ma, C., Yu, J., Jiao, Y., Li, M., Li, S., Zhuang, B., Zhao, M., and Nie, D.: Ozone affected by a succession of four landfall typhoons in the Yangtze River Delta, China: major processes and health impacts, Atmos. Chem. Phys., 20, 13781–13799, https://doi.org/10.5194/acp-20-13781-2020, 2020.
Zhan, Y., Xie, M., Zhao, W., Wang, T., Gao, D., Chen, P., Tian, J., Zhu, K., Li, S., Zhuang, B., Li, M., Luo, Y., and Zhao, R.: Quantifying the seasonal variations in and regional transport of PM2.5 in the Yangtze River Delta region, China: characteristics, sources, and health risks, Atmos. Chem. Phys., 23, 9837–9852, https://doi.org/10.5194/acp-23-9837-2023, 2023.
Zhao, D., Lin, Y., Li, Y., and Gao, X.: An Extreme Heat Event Induced by Typhoon Lekima (2019) and Its Contributing Factors, J. Geophys. Res.-Atmos., 126, https://doi.org/10.1029/2021jd034760, 2021.
Zheng, J., Zheng, Z., Yu, Y., and Zhong, L.: Temporal, spatial characteristics and uncertainty of biogenic VOC emissions in the Pearl River Delta region, China, Atmos. Environ., 44, 1960–1969, https://doi.org/10.1016/j.atmosenv.2010.03.001, 2010.