the Creative Commons Attribution 4.0 License.
the Creative Commons Attribution 4.0 License.
 | 16 Jun 2026
Impacts of entrainment on secondary ice production in deep convective clouds
Bowen Z. Portman
Paul J. Connolly
Alan M. Blyth
Rachel L. James
Huihui Wu
The accurate representation of secondary ice production (SIP) is essential for describing the microphysics of deep convective clouds, yet the exact mechanisms and efficiencies of SIP are still uncertain. In this study, we used the University of Manchester bin microphysics parcel model to investigate four SIP parameterisations: rime splintering, ice-ice collisional breakup, spherical freezing fragmentation of drops (mode 1), and fragmentation between supercooled droplets and more massive ice particles (mode 2). We simulated air trajectories through deep convective clouds observed during the Deep Convective Microphysics EXperiment (DCMEX) field campaign. Our results show that mode 2, as currently understood and represented in the model, is the key mechanism for explaining the high ice particle concentrations observed. We also present the first systematic study of how different entrainment conditions (homogeneous and inhomogeneous mixing) affect SIP mechanisms. In our simulations, homogeneous and inhomogeneous mixing with aerosol entrainment provide reasonable agreement with cloud-core and cloud-edge microphysical properties observed during DCMEX, respectively. In addition, the peak liquid water content values in the adiabatic simulations was approximately 300 % of that in the entraining simulations. The entrainment of external aerosols was also found to accelerate the collision-coalescence process under homogeneous mixing, leading to earlier ice enhancement. Our results show that SIP mechanisms, which are dependent on large droplets, such as mode 2, are highly sensitive to different entrainment conditions, emphasising the importance of representing entrainment correctly when including SIP processes in large-scale models.
- Article
(3948 KB) - Full-text XML
-
Supplement
(5779 KB) - BibTeX
- EndNote


Ice formation in clouds significantly influences cloud properties and precipitation processes, thereby impacting weather systems and global climate (Planche et al., 2014; Field and Heymsfield, 2015; Tan et al., 2025). However, the formation pathways of ice crystals in clouds remain uncertain, as observed concentrations of ice particles often far exceed what can be explained by primary ice nucleation alone (Hallett et al., 1978; Blyth and Latham, 1993; Crawford et al., 2012; Ladino et al., 2017; Lasher-Trapp et al., 2021; Hu et al., 2024). Several secondary ice production (SIP) mechanisms have therefore been proposed to explain this discrepancy (Phillips et al., 2018a; Korolev et al., 2020). In our study, we focus on four SIP processes: rime splintering, ice-ice collisions, spherical freezing fragmentation of drops (mode 1), and fragmentation between supercooled droplets and more massive ice particles (mode 2).
Rime Splintering (RS), also known as the Hallett–Mossop process, is currently the most widely implemented SIP mechanism in cloud microphysics models. In this process, secondary ice splinters are produced when supercooled droplets collide with and freeze onto riming ice particles. It is active only within a narrow temperature range of −3 to −8 °C (Hallett and Mossop, 1974) and typically occurs when droplets smaller than 12 µm and larger than 24 µm in diameter are both present (Mossop, 1978; Harris-Hobbs and Cooper, 1987). However, the large amounts of ice observed in deep convective clouds cannot always be explained by RS, especially in cases where the increase in ice number is too rapid, the temperatures and crystal habits fall outside the RS window, or the necessary conditions for RS are not satisfied (Rangno and Hobbs, 1991; Lawson et al., 2015; Field et al., 2017). The interpretation is further complicated in deep convective clouds, where the role of RS may be difficult to identify because of cloud dynamics. A recent experiment by Seidel et al. (2024) also failed to reproduce the high SIP rates reported in earlier RS studies, thereby questioning the significance of rime splintering under mixed-phase convective conditions. As noted in the review by Korolev et al. (2020), the physical mechanism of RS remains poorly quantified and understood, with the parameterisation still highly uncertain. Other potential SIP mechanisms therefore need to be considered to better understand ice enhancement in deep convective clouds.
Ice–Ice Collisional Breakup (CB) is the second SIP mechanism investigated in this study. This process refers to the mechanical fragmentation of ice particles during collisions, leading to the formation of new ice crystals. This mechanism has been observed in both aircraft measurements (Schwarzenboeck et al., 2009) and laboratory experiments (Vardiman, 1978; Takahashi and Nagao, 1995; Grzegorczyk et al., 2023). Laboratory studies found that CB is most active near −16 °C (Takahashi and Nagao, 1995), and field observations also showed substantial secondary ice near −15 °C (Mignani et al., 2019; Billault-Roux et al., 2023). In simulations of deep convective clouds during the High Altitude Ice Crystals and High Ice Water Content (HAIC-HIWC) campaign, Grzegorczyk et al. (2025) found that CB was a key contributor to ice enhancement, and that only when combined with RS could the observed high ice crystal concentrations be reproduced. However, the collision efficiency and fragmentation probability of this mechanism remain poorly understood, and future parameterisations will need to be improved accordingly (see the discussion in Korolev et al., 2020).
Finally, we examine fragmentation of freezing drops, also known as drop shattering (DS), in which supercooled droplets fragment during freezing and produce secondary ice particles. To better characterise these processes, Phillips et al. (2018b) described DS as comprising two modes, with mode 1 (M1) representing fragmentation during the spherical freezing of droplets, and mode 2 (M2) representing fragmentation during collisions between supercooled droplets and more massive ice particles. According to Phillips et al. (2018b), fragment numbers in M1 depend strongly on both temperature and droplet size, exhibiting a pronounced thermal peak near −15 °C and increasing with droplet size. In contrast, M2 shows no clear evidence of a thermal peak and instead increases with dimensionless collision energy and supercooling, requiring the presence of large supercooled droplets and more massive ice particles. DS has increasingly been incorporated into numerical studies of SIP in recent years, reflecting that it may represent an important source of secondary ice. For example, James et al. (2023) investigated M2 within the framework of Phillips et al. (2018b) in parcel model simulations of idealised shallow convective clouds, and compared it with RS, M1, and CB. Their results suggest that, under conditions where RS is limited, M2 may represent an important source of secondary ice in shallow convective clouds, whereas the contribution from M1 is relatively small. In this study, we follow the framework of Phillips et al. (2018b) and James et al. (2023) and examine DS by separately analysing M1 and M2, given their distinct physical characteristics.
Many SIP mechanisms (e.g. RS, M1, and M2) are highly sensitive to warm-phase microphysical conditions in clouds, particularly liquid water content and droplet size distributions. Previous studies have shown that these properties can be strongly affected by entrainment in deep convective clouds, particularly by how entrained environmental air mixes with cloudy air (Morrison et al., 2022b; Chandrakar et al., 2021b). Homogeneous and inhomogeneous mixing are commonly regarded as two idealised limiting regimes of entrainment-mixing in clouds (Baker et al., 1980; Lehmann et al., 2009). Homogeneous mixing assumes that entrained air first mixes thoroughly with cloud air, after which the droplet population experiences an approximately uniform reduction in relative humidity, whereas in inhomogeneous mixing the mixing is incomplete and different droplets may be exposed to different local humidity conditions. Yeom et al. (2017) found that the microphysical relationships in most cloud segments of continental stratocumulus were more consistent with homogeneous mixing. However, other observational studies have suggested that homogeneous and inhomogeneous mixing can both occur in real clouds, depending on cloud region, environmental conditions, and cloud life cycle stage. For example, Lehmann et al. (2009) showed that homogeneous mixing was more likely near the cloud core, whereas inhomogeneous mixing tended to dominate in more diluted cloud regions.
Modelling studies of SIP in deep convective clouds have often reported contrasting conclusions regarding the dominant mechanisms. This may be because the relative importance of SIP processes can vary substantially over the cloud lifecycle. For example, Huang et al. (2022) found that DS dominated during the early stage of convection, whereas CB became more important at later stages, using the bulk P3 scheme in Weather Research and Forecasting (WRF). This variation in the dominant SIP mechanisms occurs even in studies based on the same observational case from the HAIC–HIWC campaign. For example, Qu et al. (2022) used a bulk microphysics scheme and suggested that DS was the dominant SIP mechanism during a later stage of their simulation (90 to 150 min). In contrast, Grzegorczyk et al. (2025) used a 3D bin microphysics model and found that RS and CB were more important, with DS having only a limited effect at the mature stage of the simulated cloud. This discrepancy may be explained by differences in how warm microphysical processes and entrainment are represented across models, thereby affecting simulated SIP. In many commonly used microphysics schemes, especially those employing simplified bulk representations, entrainment is often treated as homogeneous mixing (Xu et al., 2022). However, mixing can also be inhomogeneous in deep convective clouds because of their complex structure and strong spatial variability. It is therefore necessary to systematically examine how different representations of entrainment affect SIP.
The Deep Convective Microphysics EXperiment (DCMEX) campaign was conducted in July and August 2022 over the Magdalena Mountains near Socorro, New Mexico, with the aim of characterising the microphysics and dynamics of deep convective cloud formation, including improved understanding of SIP mechanisms (Finney et al., 2024). Conditions in this region are highly favourable for the development of multiple-thermal cumulus congestus. These clouds are typically confined to the mountain range and can transition into deeper thunderstorms (Finney et al., 2024). The occurrence of these clouds is strongly influenced by the North American Monsoon (NAM), during which moist inflows from the Gulf of Mexico and the eastern Pacific prevail between June and September (Adams and Comrie, 1997; Erfani and Mitchell, 2014).
A number of studies have investigated cloud processes during the DCMEX campaign. Among these, Wu et al. (2025) conducted a combined modelling and observational analysis of warm cloud processes in two DCMEX cases and found that aerosol entrainment plays a key role in broadening the droplet size distribution (DSD), which has important implications for subsequent investigations of the ice phase in clouds. Previous work at the same site by Blyth and Latham (1993) suggested that RS was responsible for the high ice crystal concentrations observed in these clouds. The contributions and relative importance of different SIP mechanisms in deep convective clouds in this region remain to be systematically assessed.
Section 2.1 describes the measurements used in this study, including the key instrumentation, while Sect. 2.2 introduces the case studies analysed in this work.
2.1 Measurements
A key component of DCMEX was the Facility for Airborne Atmospheric Measurements (FAAM) British Aerospace Engineering-146 (BAe-146) aircraft, which was equipped with a comprehensive suite of aerosol and cloud microphysics instruments. During the DCMEX flights, the aircraft followed a kite-shaped pattern around the Magdalena Mountains for the INP and aerosol sampling parts of the flight, while straight and level passes were made through the clouds during cloud sampling. The right panel of Fig. 1 shows the flight track for Flight C300 on 22 July 2022, which is representative of the other flights that followed a similar plan view. All flights followed a similar pattern, starting with low-level aerosol runs to characterise the boundary-layer inflow, followed by cloud passes through developing convection to investigate microphysical properties within the mixed-phase region. In addition, dropsondes were released near the Magdalena Mountains to obtain vertical profiles of thermodynamic and wind fields (Finney et al., 2024). Below, we briefly summarise the instruments used in this study.
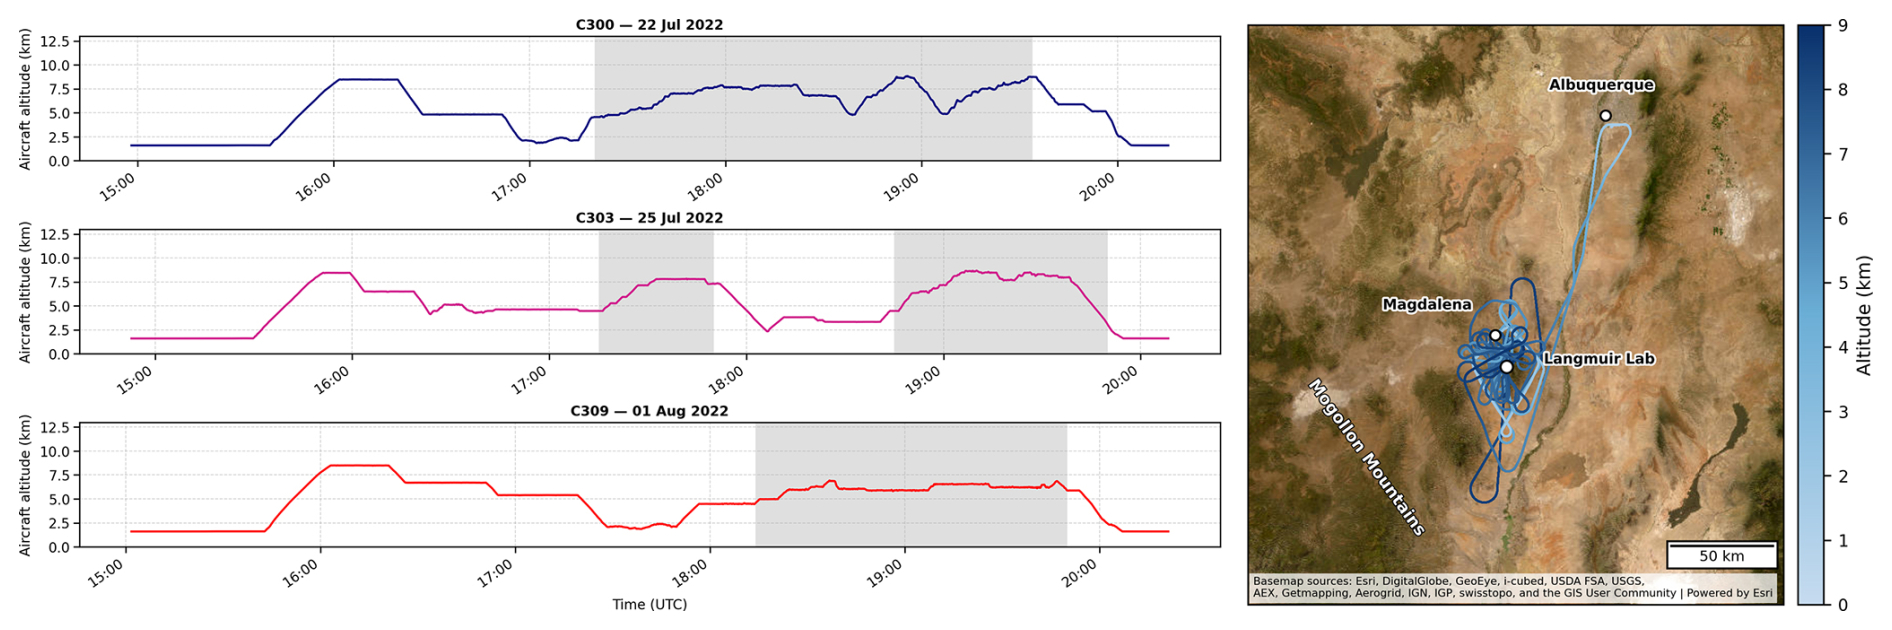
Figure 1The left panel shows the time series of aircraft altitude for the three selected DCMEX cases, with shaded periods indicating cloud penetration. The right panel shows the corresponding flight track for the case on 22 July 2022 (C300).
The Aerosol Mass Spectrometer (AMS) and the Scanning Mobility Particle Sizer (SMPS) were used to measure the composition and size distribution of sub-micron aerosol. The AMS provided estimates of the effective hygroscopicity parameter (κ) of the aerosol, which were used to derive their cloud condensation nuclei (CCN) properties for input into the Bin Microphysics Model (BMM). The SMPS was employed to characterise the aerosol size distribution near the cloud base, as shown in Wu et al. (2025).
The cloud droplet probe (CDP-2) was used to measure the droplet size distribution (DSD) over the size range 2 to 50 µm and to derive cloud droplet number concentration (CDNC) (Lance et al., 2010b). The relative dispersion of the DSD was also calculated as the ratio of the standard deviation of droplet diameter to the mean droplet diameter. Liquid water content (LWC) was obtained from a Nevzorov hot-wire probe following the Met Office processing method (Korolev et al., 1998; Abel et al., 2014).
The Cloud Particle Imager (CPI, version 2.5) was used to obtain high-resolution images of cloud particles larger than 8 µm and to derive ice particle concentration. Although the CPI has a relatively small sample volume compared with the 2D-S, data from multiple flight segments were averaged to make the results more reliable and representative. The high-resolution imagery was also used to identify potential SIP mechanisms in this study (Korolev and Leisner, 2020; Korolev et al., 2022), with further discussion is provided in Sect. 4.3.
2.2 Case Study
The data used in this study were collected from 19 July to 7 August 2022 (flight C298-C314). In the early phase of the campaign, from 19 to 22 July (Flight C298-C300), the airmass originated from north-western (NW) flow from the Pacific over the continent towards the Magdalena Mountains, resulting in relatively lower cloud-base temperatures (Tcb≈1.5 °C) and lower humidity compared to later in the campaign. Around 24 July, a shift to south-eastern (SE) flow from the Gulf of Mexico introduced warmer and moister conditions, marking a transition observed in the subsequent flights (Flights C302-C314). After 28 July, the clouds generally maintained relatively high cloud-base temperatures (Tcb≈5.67 °C) and relative humidity. In this study, 15 flight cases were simulated, as listed in Table 1. Three representative cases, 22 July (C300), 25 July (C303), and 1 August (C309), are selected for detailed analysis based on the evolution of the airmass characteristics described above. The flight altitude for the three cases is shown in the left panel of Fig. 1. The 22 July case was chosen as it represents typical convective clouds that developed under the NW flow during the early phase of the campaign, while the 25 July case represents the early stage of SE inflow.
The 1 August case represents the later phase with SE flow. It was selected because the cloud was in a relatively early stage of development, before the convection had penetrated the detrainment layer. The in-situ sounding revealed a pronounced temperature inversion at around 7 km. However, the observed cloud top reached approximately 14.4 km (Finney et al., 2024), suggesting that the convection was strong enough to break through the inversion and later developed up to the tropopause. Such inversion-breaking convection is commonly observed over the mountainous southwest United States during the summer monsoon (Adams and Souza, 2009; Fonseca-Hernandez et al., 2021).
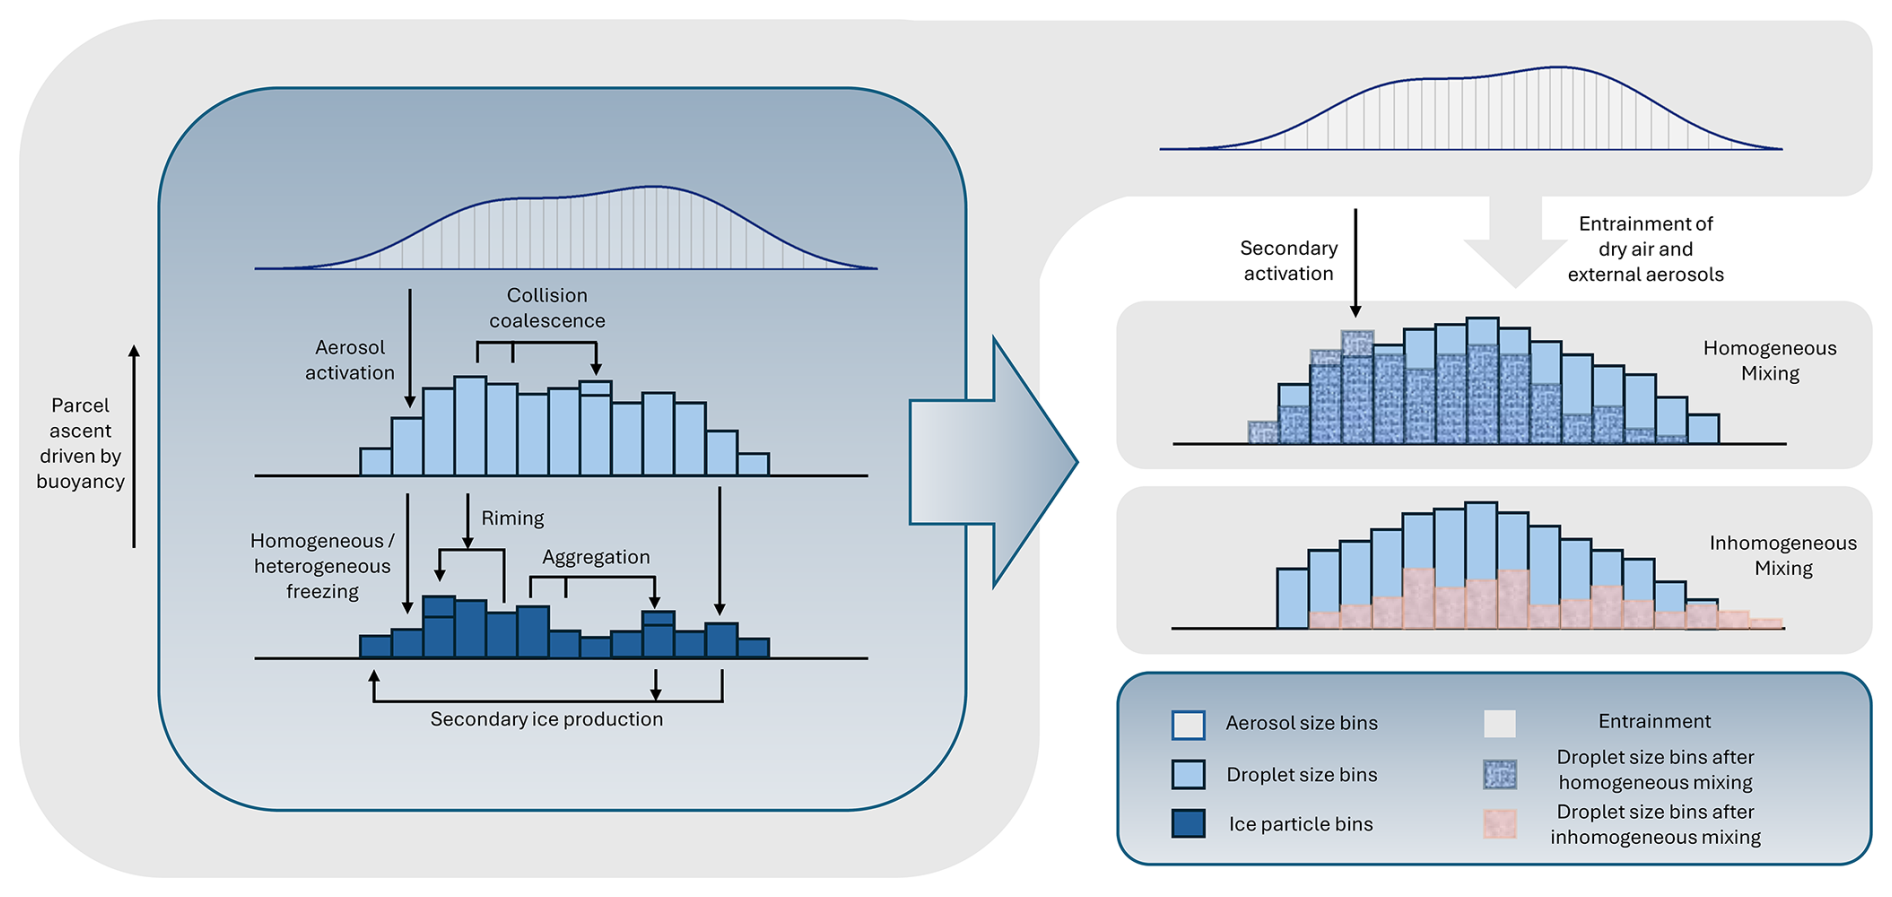
Figure 2Schematic representation of the BMM parcel model. The left-hand side shows the main model framework, including the key microphysical processes and representations of the aerosol, droplet, and ice particle size bins from top to bottom. The right-hand side illustrates the two entrainment-mixing representations in the BMM, homogeneous mixing and inhomogeneous mixing.
3.1 Model description
The model used in this study is the University of Manchester BMM, based on an updated version of the framework developed in previous studies (Topping et al., 2013; Fowler et al., 2020; James et al., 2023), with the source code available at https://github.com/UoM-maul1609/bin-microphysics-model (last access: 11 June 2026). A simplified schematic overview of the main BMM framework is shown on the left side of Fig. 2.
In the BMM, particles are represented by two particle size distributions, droplet size bins and ice particle bins, each comprising 80 bins. Both distributions additionally include 60 aerosol bins (10 nm to 3 µm). The aerosol bins are not defined using linear or logarithmic spacing in particle size. Instead, the bin edges are defined from the initial aerosol number concentration so that each bin contains approximately equal particle numbers. This approach is intended to reduce discretisation artefacts during aerosol activation, thereby avoiding step-like increases in activated particle number concentration in response to changes in updraft or supersaturation.
The aerosol population can be represented by one or more externally mixed components with different chemical compositions. For each externally mixed component, particles are assumed to be internally mixed across the size distribution, so that their chemical composition does not vary with particle size. In this study, only a single externally mixed component is considered. Its initial size distribution is represented as the sum of multiple lognormal modes, as follows:
where is the aerosol number size distribution (cm−3) for external mixture j, D is the particle diameter (m), is the total aerosol number concentration (cm−3) of mode i within external mixture j, is the geometric mean diameter (m), and is the geometric standard deviation of the lognormal mode. In this study, j=1 because only a single externally mixed component is considered, and M=2 denotes the two lognormal modes used to represent the initial aerosol size distribution: the Aitken and accumulation modes.
The hygroscopic growth of aerosol particles is described using κ-Köhler theory, in which particle hygroscopicity is represented by the parameter κ (Petters and Kreidenweis, 2007). In this study, κ is assumed to remain constant across all size bins. The initial wet diameter and corresponding liquid water mass of aerosol particles are determined by assuming equilibrium with the prescribed environmental relative humidity, based on κ-Köhler theory. This initial wet state is represented numerically on a mass-based bin structure, with the mass of adjacent bins increasing by a factor of .
The warm microphysical processes considered in this study include diffusional droplet growth and collision–coalescence of liquid particles. Diffusional growth rates account for kinetic effects and corrected diffusivity and thermal conductivity terms (Jacobson, 2005; Pruppacher and Klett, 1997), whereas collision–coalescence is described by the stochastic collection equation and solved using the method of Bott (1998). In addition, the model also includes entrainment of dry air and external aerosol, as described in Sect. 3.2.
The cold microphysical processes considered in this study include homogeneous and heterogeneous freezing, vapour depositional growth of ice particles, ice-ice aggregation, riming, and secondary ice production. Homogeneous freezing of supercooled droplets is represented following the formulation of Koop et al. (2000). Heterogeneous freezing in this study is represented using the parameterisation of Daily et al. (2026), a recently developed formulation constrained by observations from the DCMEX campaign. To assess the sensitivity of the results to the representation of ice-nucleating particles, DeMott et al. (2010) is also included for comparison. The differences between the two parameterisations are discussed in Sect. 4.3, with additional details provided in Sect. S2 of the Supplement.
In the BMM, ice particles are represented by a separate set of bins from liquid particles. Additional prognostic properties are tracked in each ice bin, including the aspect ratio, particle volume, rime mass, and the number of ice crystal monomers per ice particle. Riming and ice–ice aggregation are also represented by numerically solving the stochastic collection equation (SCE) using the exponential flux method of Bott (1998). A more detailed description of the ice particle bin representation is provided by James et al. (2023). The parameterisation of SIP is described in Sect. S1.
3.2 Entrainment Representation
In this study, two types of entrainment processes are considered: homogeneous and inhomogeneous mixing. In the model, homogeneous mixing is represented by continuously incorporating environmental air into the parcel and instantaneously mixing it at each time step, leading to a dilution of the parcel thermodynamic properties. This is implemented by including additional equations in the solver routine, which are integrated using the variable-coefficient ordinary differential equation (VODE) solver. The theory is described in Pruppacher and Klett (1997, chapter 12).
In this model, the parcel is represented as a jet, allowing entrainment to occur through the front interface of the plume. The evolution of the vertical velocity (W), parcel radius (Rj), and water vapour mixing ratio (qv) is explicitly represented, and the entrainment of ambient aerosol is also included. The entrainment rate (μJ) for the jet parcel is therefore defined as
where is the total mass flux of the rising parcel (kg s−1), ρ is the parcel density, CJ is the entrainment parameter, set to 0.2 based on previous laboratory studies, and RJ is the jet radius, which is set to 1000 m in this model.
The evolution of the parcel’s vertical velocity W (m s−1) is described by
where g is the gravitational acceleration (9.81 m s−2), γ≈0.5 is the moisture correction parameter accounting for the virtual effect of water vapour, T and T′ are the temperatures of the parcel and the environment (K), respectively, wL is the liquid water mixing ratio (kg kg−1).
The evolution of the jet radius is given by
All variables are as defined above.
Finally, the water vapour mixing ratio is calculated by a statement of conservation of water substance
where wv is the water-vapour mixing ratio within the parcel (kg kg−1); wi is the ice-water mixing ratio (kg kg−1); and is the water-vapour mixing ratio of the entrained environmental air (kg kg−1).
The BMM also allows entrainment to be represented as inhomogeneous mixing (Baker et al., 1980), in which environmental air is not instantaneously and uniformly mixed with the parcel air, but is instead entrained intermittently into the parcel in the form of discrete packets. The same mean entrainment rate as in the homogeneous case is applied. However, unlike the homogeneous mixing representation, the mixing process is not solved continuously within the VODE solver, but is instead implemented as discrete events over a longer 10 s timestep to represent intermittent entrainment. For inhomogeneous mixing, the droplet number concentrations in each size bin are adjusted to conserve parcel humidity, thereby preventing a uniform reduction in droplet size across the entire spectrum as occurs in homogeneous mixing. When inhomogeneous mixing causes droplet evaporation, the released aerosol particles are returned to the discrete packets of subsaturated air within the parcel, where they may become re-activated later. A simplified schematic of the two entrainment representations in the BMM is shown on the right of Fig. 2.
3.3 Initial conditions
In our study, simulations are initialised at cloud base with an initial relative humidity of 0.95. All simulations are run for about 2.2 h (8000 s) with a timestep of 10 s, and the parcel radius is set to 1000 m. The initial aerosol size distribution is represented by a two-mode lognormal fit derived from SMPS observations (see Fig. S1 and Table S1 in the Supplement). Table 1 summarises the initial aerosol and cloud-base conditions used to initialise the simulations, including the cloud-base pressure (Pcb), aerosol density (ρ), and κ.
Table 1Cloud-base thermodynamic and aerosol properties for the simulated cases, including the lifting condensation level (LCL), cloud-base temperature (Tcb), temperature perturbation (ΔT), cloud-base pressure (Pcb), updraught velocity (wcb), aerosol density (ρ), and hygroscopicity parameter (κ).
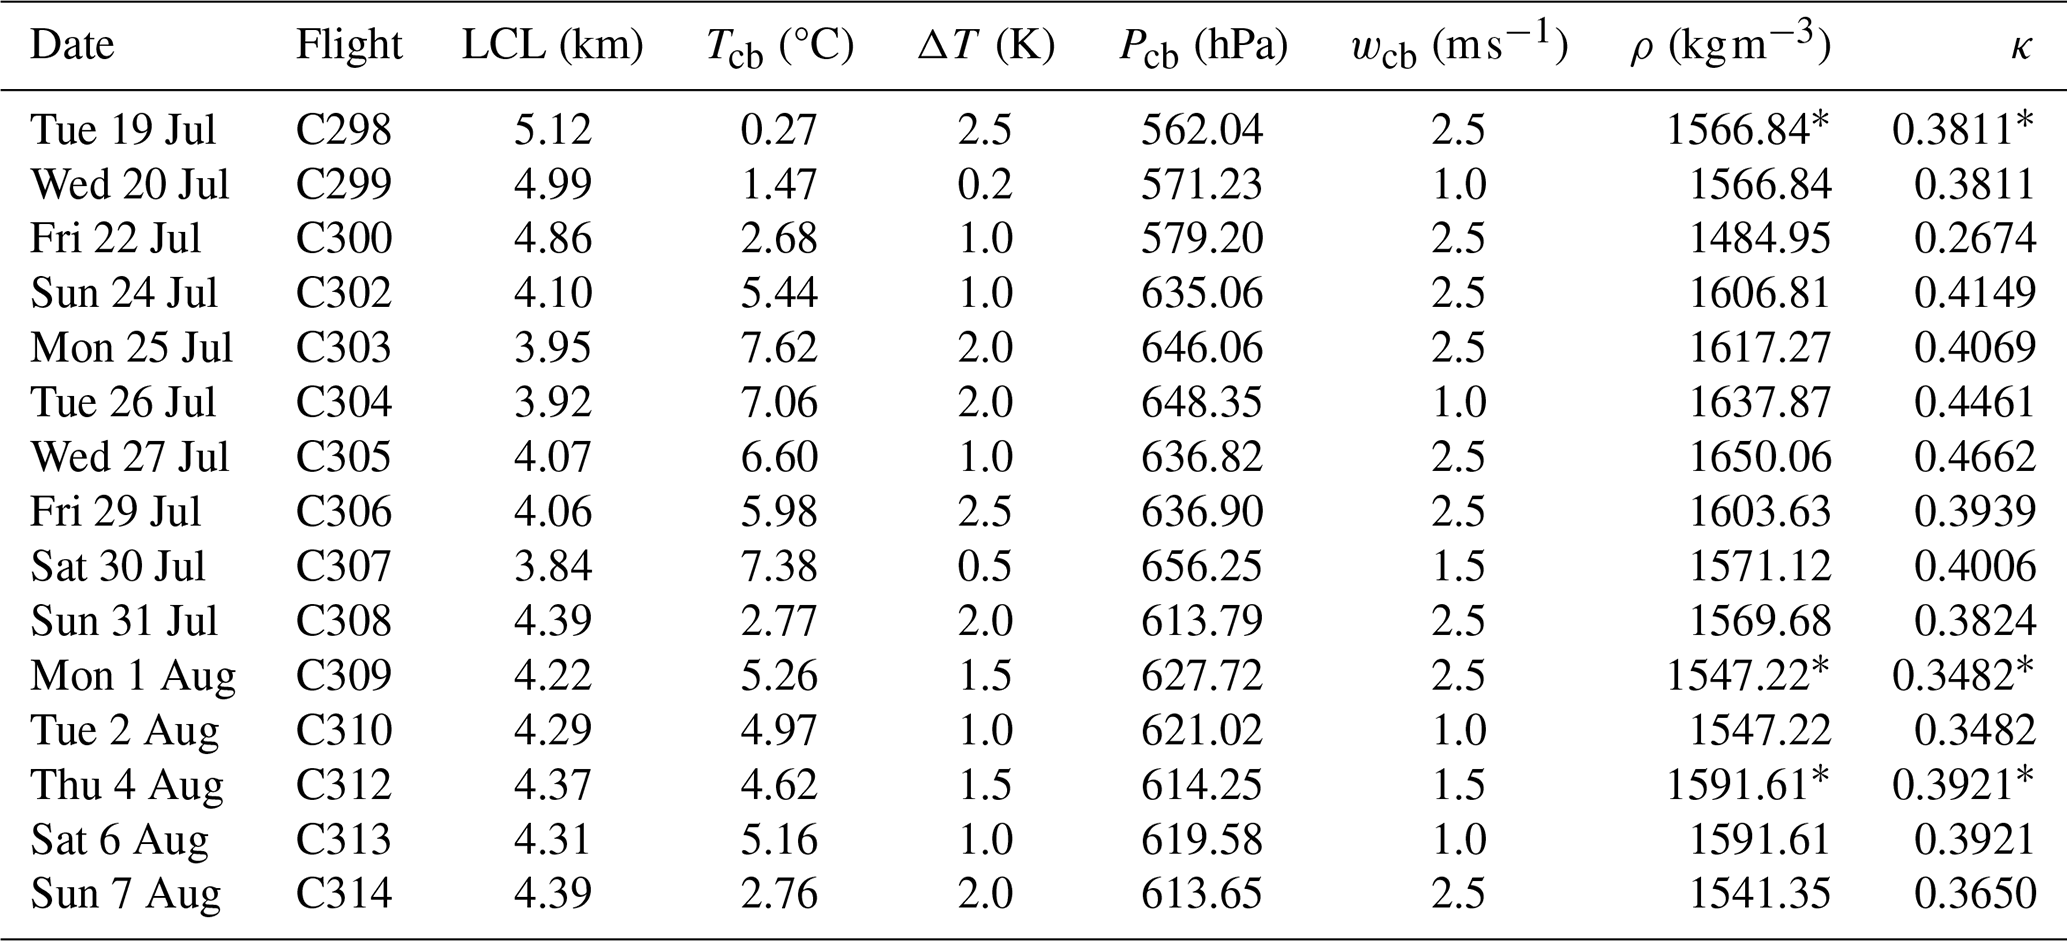
Values marked with an asterisk (*) were taken from the closest available DCMEX case with similar atmospheric conditions because case-specific data were not available.
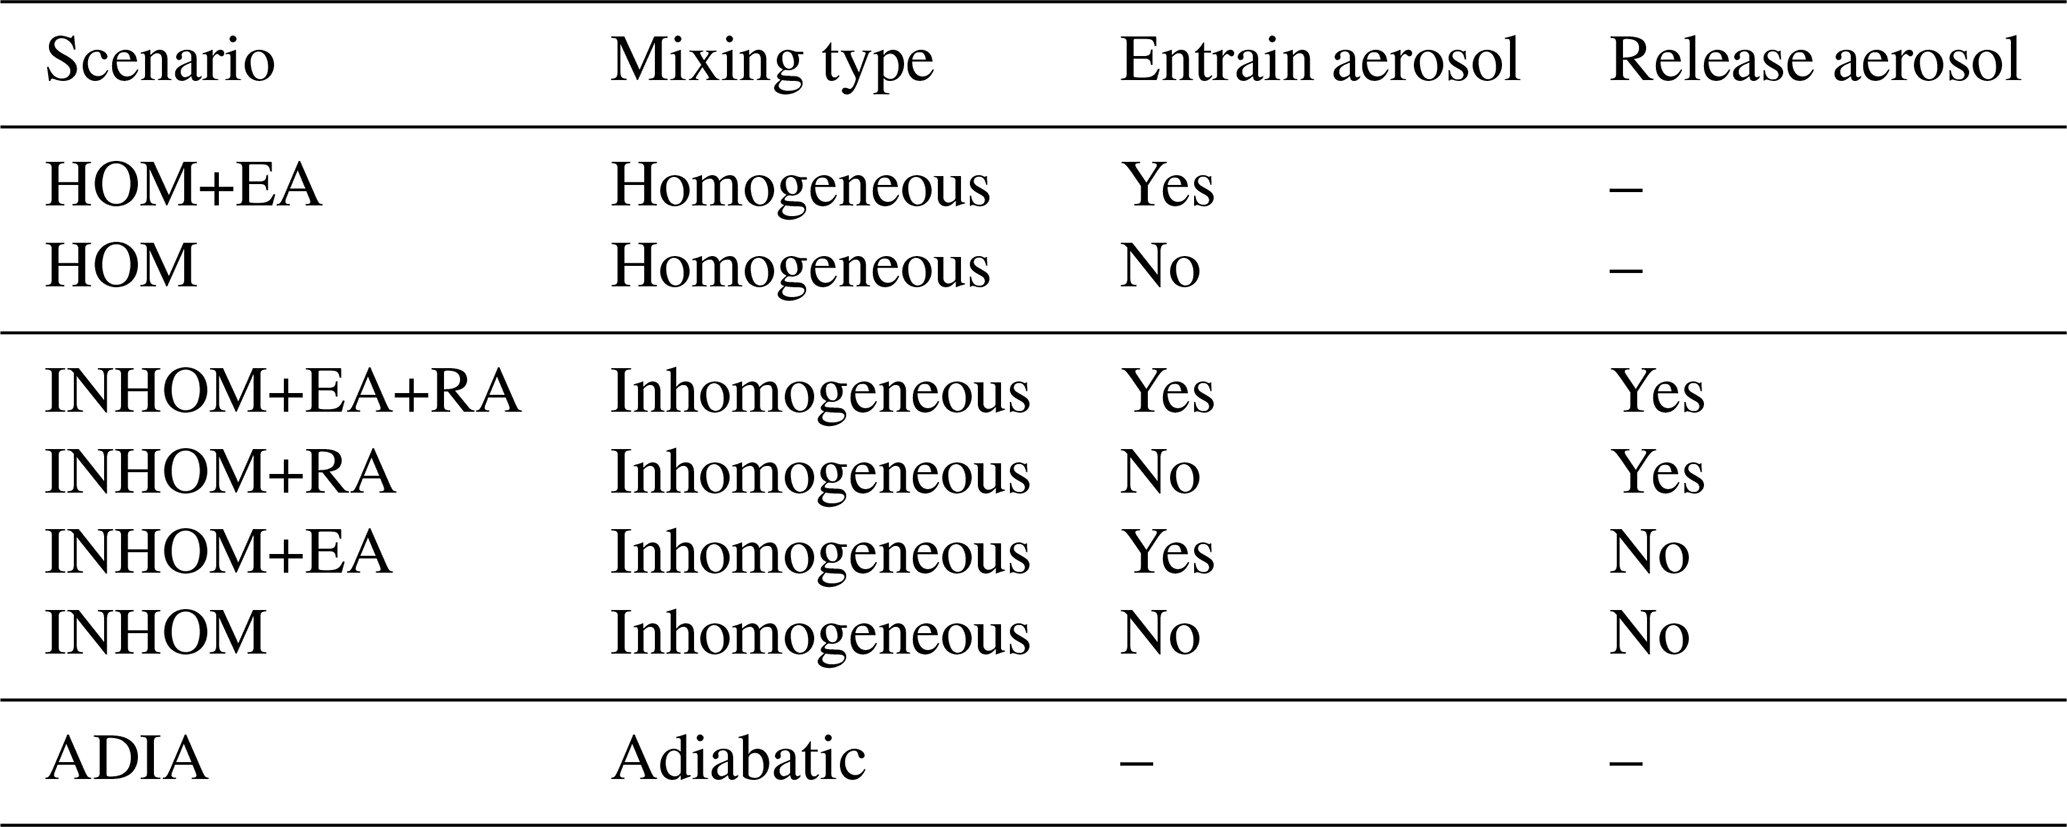
Seven simulations were performed for each case to represent the seven mixing scenarios considered in this study (see Table 2). These scenarios include two primary types of mixing, homogeneous (HOM) and inhomogeneous (INHOM), each examined with or without entrained aerosol (EA). For the inhomogeneous scenarios, we further distinguished whether the entrained aerosol particles were released (RA) following the mixing process. In addition, a fully adiabatic reference case (ADIA) was included.
In the BMM, the initial parcel temperature was set to the potential temperature with an added perturbation (ΔT). The value of ΔT and the initial updraught velocity at cloud base (wcb) were both adjusted until the simulated liquid water content (LWC) agreed with the upper boundary of the observed profiles, which aimed to model the cloud core where liquid water contents are typically high (Lehmann et al., 2009). For the adiabatic simulations, the ascent rate was constrained to match that in the non-adiabatic simulations, and the parcel was stopped at the same model cloud top. The entrainment parameter was set to 0 for the adiabatic simulations, while 0.2 was used for all non-adiabatic cases.
Table 2Summary of the mixing scenarios considered in this study. HOM: homogeneous mixing; INHOM: inhomogeneous mixing; EA: entrained aerosol; RA: released aerosol; ADIA: adiabatic case.
For each sensitivity experiment, the SIP mechanisms (RS, CB, M1, and M2) were investigated individually, as well as in simulations with all mechanisms switched off and with all mechanisms activated. We also performed sensitivity tests with the heterogeneous freezing parameterisations of Daily et al. (2026) and DeMott et al. (2010), given that SIP processes depend on the availability of primary ice crystals.
We used the BMM to simulate the trajectories of individual air parcels for all 15 cases from the DCMEX campaign. Each parcel was initialised at the model cloud base and triggered by a thermal perturbation. Once the parcel reached buoyancy equilibrium, it remained at that level, while the internal microphysical processes and associated calculations continued throughout the simulation. Figures S3–S5 present the vertical profiles of cloud droplet number concentration (CDNC), liquid water content (LWC), and effective diameter (Deff) for all simulated cases. Figure S9 shows the total ice crystal number concentration in the control simulation, where all SIP mechanisms were switched off and only primary ice from INP activation was considered, based on DCMEX INP measurements (Daily et al., 2026). Figures S10–S14 show the simulated ice enhancement for all 15 cases, for simulations in which each SIP mechanism (RS, CB, M1, M2) is activated individually and for the simulation in which all mechanisms are activated simultaneously. This section is organised into four parts. Section 4.1 presents the modelled evolution of liquid-phase properties (CDNC, LWC, and Deff) for the three selected cases, and Sect. 4.2 shows the impact of entrainment on the droplet size distribution (DSD), including the vertical evolution of dispersion within the cloud. Section 4.3 compares observed and simulated clouds with all SIP mechanisms activated, and Sect. 4.4 analyses how individual SIP mechanisms contribute to ice enhancement.
4.1 Bulk Liquid-Phase Cloud Properties
To quantify the effect of SIP on ice enhancement within the parcel, we first need to examine the liquid phase, including the vertical profiles of liquid water content (LWC), cloud droplet number concentration (CDNC), and Deff from both observations and simulations under seven different mixing assumptions. The left panel of Fig. 3 presents the evolution of LWC for the three selected cases, showing only small differences among the non-adiabatic simulations because the parcel model entrains the same total mass of environmental air in each case. These simulations closely reproduce the observed peak LWC values, with maxima of approximately 1.0, 1.25, and 1.25 g m−3 for the 22 July, 25 July, and 1 August cases, respectively, near the parcel maximum height. As expected, the observed values of LWC are much less than the adiabatic values due mainly to entrainment, while the ADIA simulations produce significantly higher LWC near the model cloud top, reaching approximately 300 % of those in the HOM and INHOM simulations.
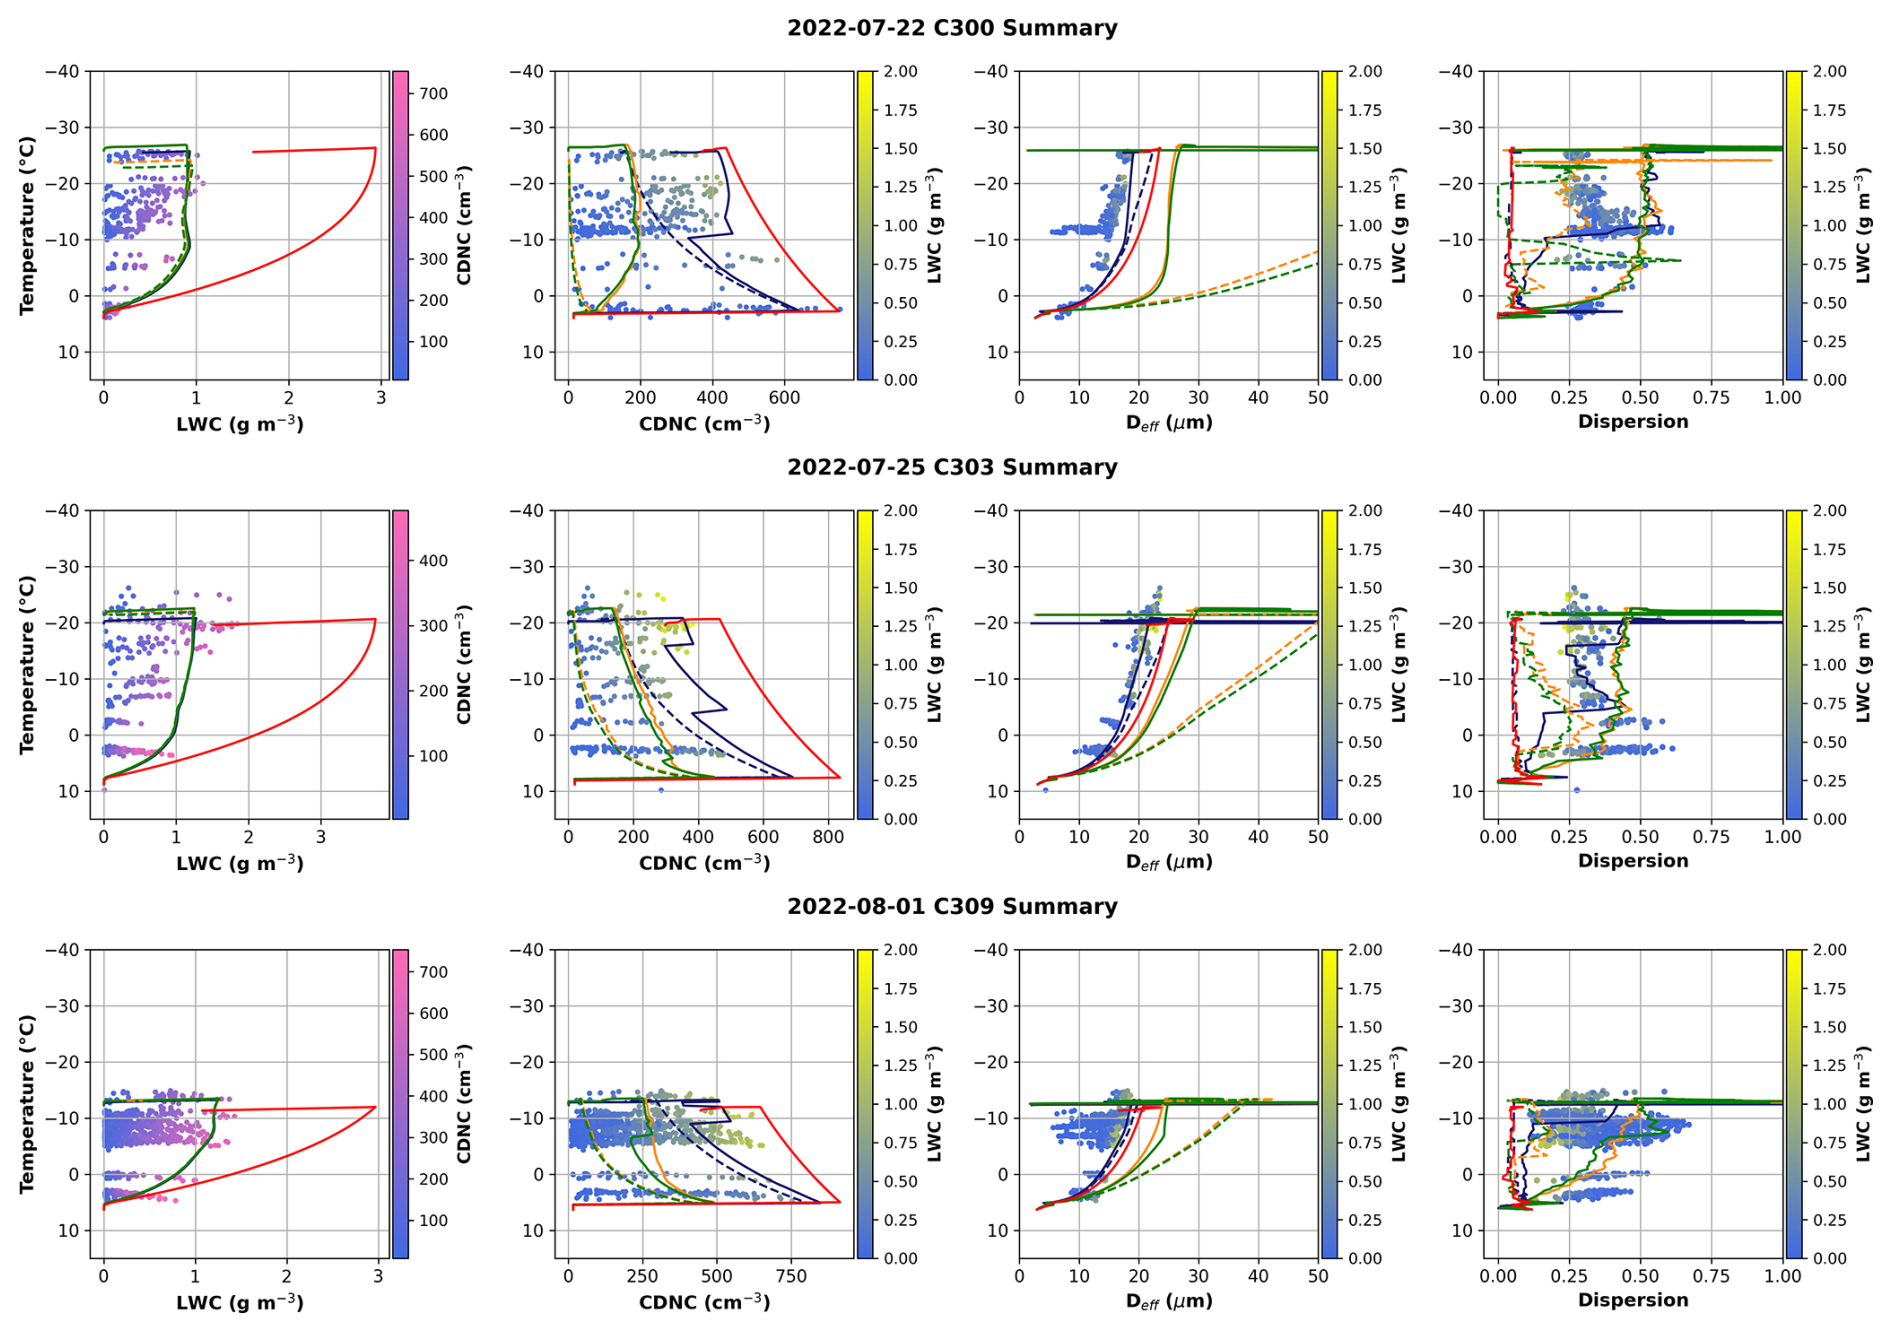
Figure 3Vertical profiles of (from left to right): liquid water content (LWC), cloud droplet number concentration (CDNC), effective diameter (Deff), and dispersion for three representative cases, C300 (22 July 2022), C303 (25 July 2022), and C309 (1 August 2022). Coloured dots indicate observations; red lines denote ADIA; solid blue lines HOM+EA; dashed blue lines HOM; solid orange lines INHOM+EA+RA; dashed orange lines INHOM+RA; solid green lines INHOM+EA; and dashed green lines INHOM.
It also should be noted that the CDP data collected during the DCMEX campaign represent instantaneous cloud measurements along the flight tracks, and the histories of the sampled cloud parcels cannot be determined. Therefore, the CDNC (middle-left panel), Deff (middle-right panel), and dispersion (right panel) distributions of Fig. 3 are interpreted in terms of LWC to identify cloud-core (yellow) and cloud-edge (blue) regions for each case. Following the findings of Lehmann et al. (2009), cloud-core regions are characterised by high liquid water content, as well as droplet concentrations and droplet size distributions that are broadly consistent with homogeneous mixing, whereas cloud-edge regions experience stronger evaporation, lower LWC, and are characterised by inhomogeneous mixing.
The evolution of CDNC within the parcel is shown in the middle-left panel of Fig. 3. For the ADIA simulations, the maximum CDNC values were reached near the model cloud base, with approximately 750, 850, and 900 cm−3 for the 22 July, 25 July, and 1 August cases, respectively. CDNC then decreased by approximately 20 %–40 % across all three cases from the peak values near the model cloud base towards the cloud top, mainly due to collision–coalescence, which remained active in the ADIA simulations. In contrast, for the homogeneous mixing simulations, CDNC reached a peak of approximately 650, 700, and 850 cm−3 near the model cloud base for the three cases, respectively. At temperatures warmer than −10 °C, the HOM and HOM+EA simulations showed similar decreasing trends, with CDNC in HOM+EA remaining slightly higher. Around −10 °C, a second CDNC peak of approximately 450, 500, and 550 cm−3 appeared in HOM+EA, likely due to secondary droplet activation triggered by entrained aerosols. Near the model cloud top, CDNC in the HOM simulations was approximately 50 % lower than in the HOM+EA simulations. Overall, the homogeneous mixing simulations with external aerosol entrainment (HOM+EA) show reasonable agreement with the upper envelope of the observed CDNC.
For the inhomogeneous mixing simulations, both INHOM+EA+RA and INHOM+EA were in reasonable agreement with the observed CDNC values associated with relatively low LWC, as indicated by the blue and green dots. When the entrainment of external aerosols was disabled (i.e., with EA turned off), CDNC in the INHOM+RA and INHOM simulations decreased significantly, with only a small number of droplets remaining near the model cloud top. The effect of RA on CDNC under inhomogeneous mixing conditions was found to be limited, whereas the EA significantly enhanced CDNC. This is likely because released aerosols form in regions of evaporation, where decreasing relative humidity and strong subsaturation prevents them from reaching the critical supersaturation required for activation. Among the inhomogeneous mixing simulations, INHOM+EA+RA showed reasonable agreement with the average observed CDNC.
The evolution of Deff within the parcel for the different simulations is shown in the middle-right panel of Fig. 3. Across all simulations, Deff generally increased with decreasing temperature as the cloud developed, as a result of continued droplet growth by collision–coalescence, and reached maximum values near the cloud top. For the ADIA simulations, maximum Deff values reached approximately 22, 29, and 23 µm for the 22 July, 25 July, and 1 August cases, respectively. In contrast, the HOM+EA simulations provided the best agreement with the observations, closely following the upper envelope, with peak Deff values of approximately 18, 21, and 19 µm for the three cases. It is worth noting that, in the 25 July case, a pronounced increase in large droplets was observed near cloud top at temperatures of approximately −15 to −20 °C, and a similar feature was reproduced by the HOM+EA simulations. Overall, the inhomogeneous mixing simulations produced larger Deff values than both the homogeneous mixing and ADIA simulations. This effect was particularly evident under inhomogeneous mixing without any entrained aerosol or aerosol recycling, where Deff became significantly larger, likely due to the removal of smaller droplets during inhomogeneous mixing, which shifted the droplet size distribution towards fewer but larger droplets.
4.2 Comparison of Observed and Modeled DSDs
Figures S6–S8 show the observed and simulated DSDs for three representative DCMEX cases, 22 July, 25 July, and 1 August, at nine selected temperature levels from cloud base to cloud top. In all three cases, the observed DSDs showed clear broadening with height, and bimodal, or even trimodal, structures were found at some temperature levels. This broadening of the DSD is also reflected in the dispersion, as shown in the right panel of Figure 3. The observed dispersion was generally smaller under higher-LWC conditions, which approximately correspond to cloud-core regions, and larger under lower-LWC conditions, shown in blue, which are more representative of cloud-edge regions.
This pattern suggests that the droplet distributions are likely broadened by entrainment, mixing, or turbulence. It should also be noted that some broadening in the observed DSDs may arise from measurement uncertainties, as discussed by Lance et al. (2010a). This is consistent with Faber et al. (2018), who found that the mean diameters generally agree within a few percent, whereas the median diameters are overestimated by about 5 %–15 %, resulting in an artificial broadening and skewing of the spectra. Overall, ADIA and HOM simulations both show narrow DSDs, whereas the HOM+EA simulation reproduces key observed features of the in-situ DSDs, including a broader spectral width, the persistence of small droplets at higher altitudes, and a bimodal structure, which highlights the role of entrainment in DSD broadening, consistent with Lasher-Trapp et al. (2005) and Morrison et al. (2022a).
The results show that homogeneous mixing (HOM+EA) alone cannot explain the observed droplet dispersion, particularly at the lower levels of the cloud. In contrast, inhomogeneous mixing (INHOM+EA+RA) can generate sufficiently broad droplet spectra but tends to overestimate the presence of large droplets, producing excessively wide distributions. This suggests that real cloud evolution may involve an initial inhomogeneous phase followed by more homogeneous mixing (Wu et al., 2025). For the 22 July case, additional simulations were performed, applying INHOM+EA+RA followed by HOM+EA to examine the influence of early inhomogeneous mixing on cloud development. As shown in Fig. 4, when the inhomogeneous phase lasts less than 30 s, the simulated results approach those of fully homogeneous mixing, while durations longer than 30 s result in behaviour consistent with inhomogeneous mixing. However, a major limitation of the parcel model in this study is its simplified treatment of ascending thermal trajectories. The model assumes isolated and internally uniform parcels, whereas in real thermals, parcel trajectories evolve dynamically, with varying turbulence, humidity, and mutual entrainment between neighbouring parcels. The transition from inhomogeneous to homogeneous mixing applied here should therefore be regarded as an idealised approximation.
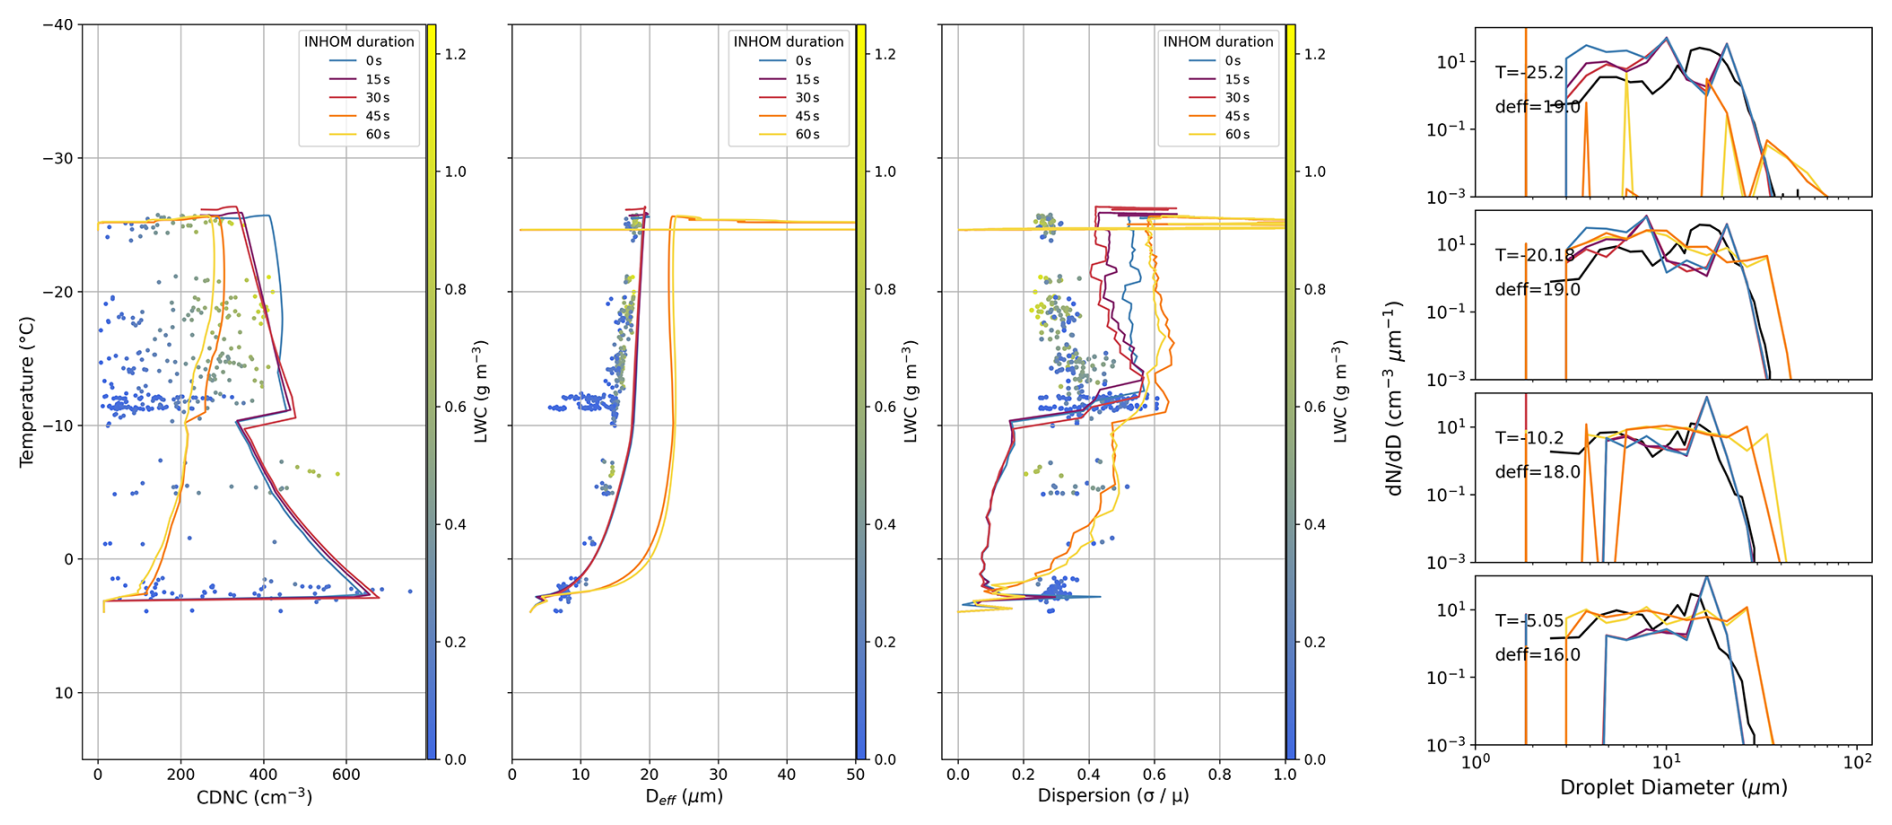
Figure 4Vertical profiles of observed and simulated CDNC (left), Deff (centre-left), and dispersion (centre-right), together with droplet size distributions (right) at four selected temperatures for the 22 July 2022 case. INHOM duration indicates the period of the INHOM+EA+RA phase in the combined INHOM+EA+RA–HOM+EA simulation.
4.3 Observed and Simulated Ice-Phase Properties
Figure 5 shows box plots of observed ice number concentration in different temperature intervals for the three selected cases, based on CPI data. Representative CPI images for each case are shown in Figs. S15–S17. To further assess and quantify the impact of SIP on ice number concentration, SIP-off and SIP-on simulations are also shown for the three model configurations, ADIA, HOM+EA, and INHOM+EA+RA, with dashed and solid lines denoting simulations without SIP, referred to here as NINP, and with SIP, referred to here as NICE, respectively. We also examine the temporal evolution of ice enhancement (here defined as NICE−NINP) for six entrainment simulations together with the adiabatic reference, as shown in Fig. 6.
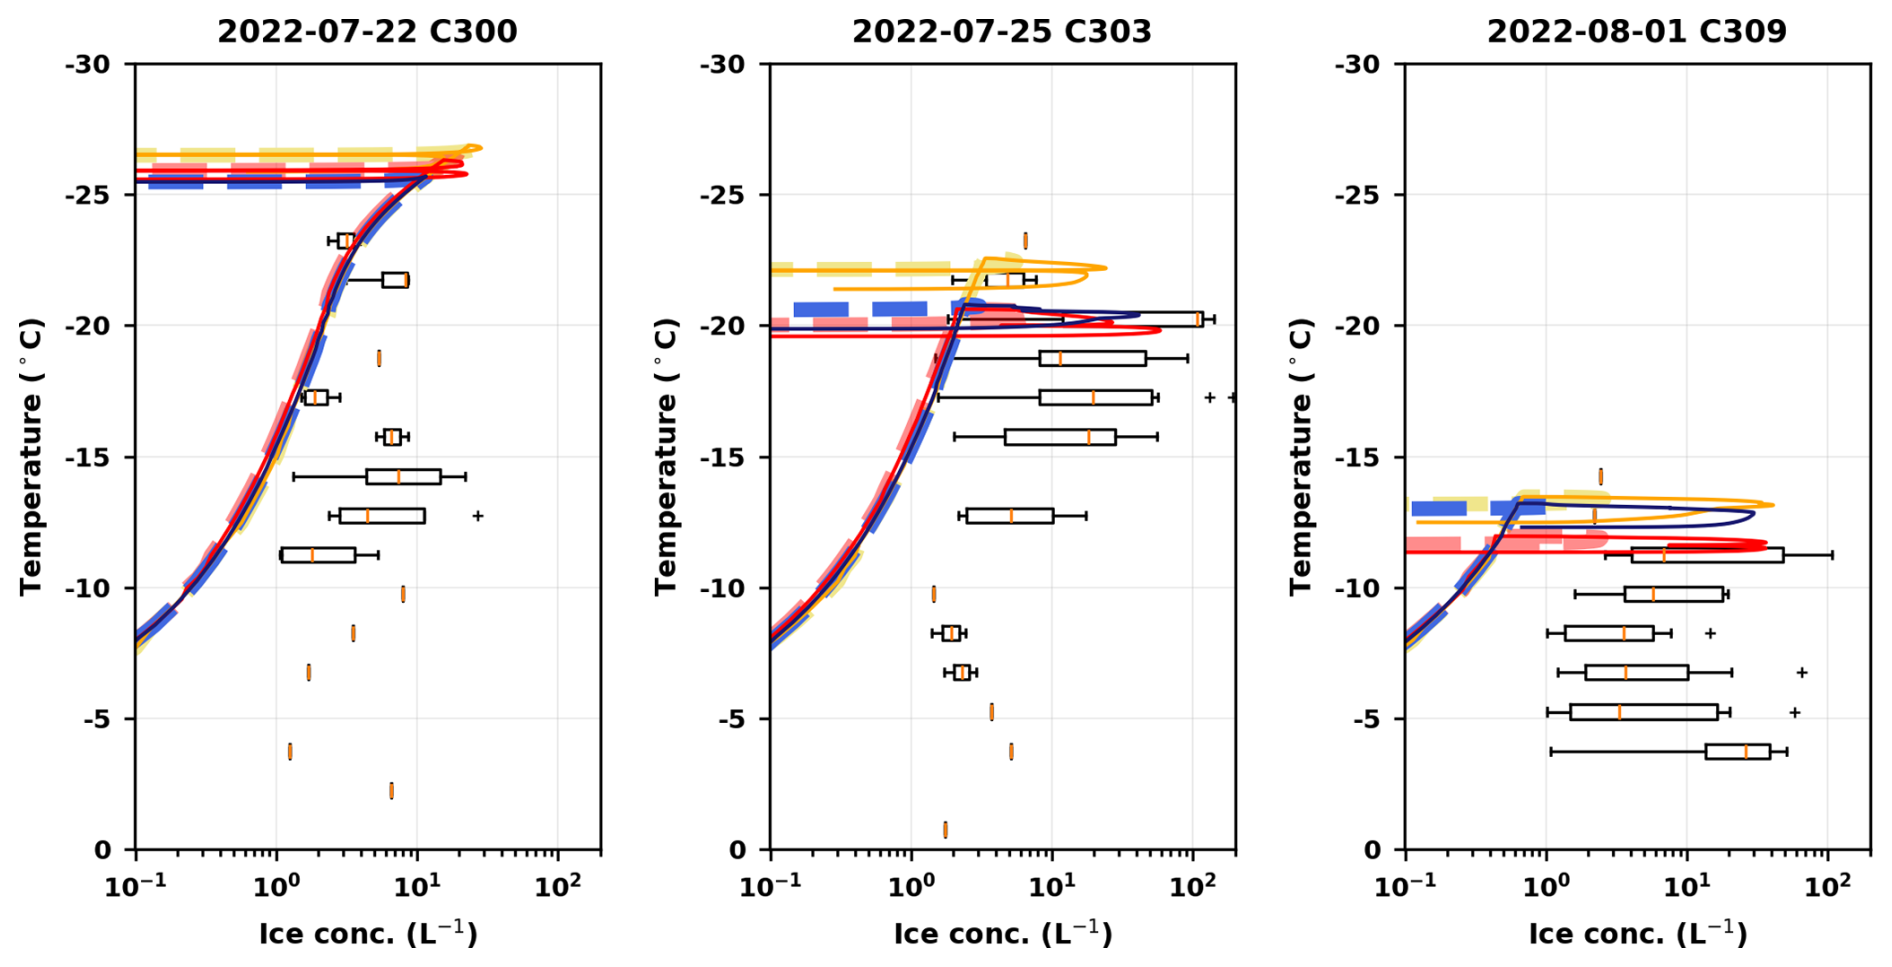
Figure 5Observed and simulated ice particle concentrations as a function of temperature for the three selected cases. In each panel, the boxplots show the observed ice concentrations based primarily on CPI data, and the coloured lines show the parcel model simulations under different entrainment scenarios. Blue, orange, and red lines represent the HOM+EA, INHOM+EA+RA, and ADIA simulations, respectively. Solid lines represent simulations with all SIP mechanisms activated, while dashed lines indicate simulations with SIP processes disabled.
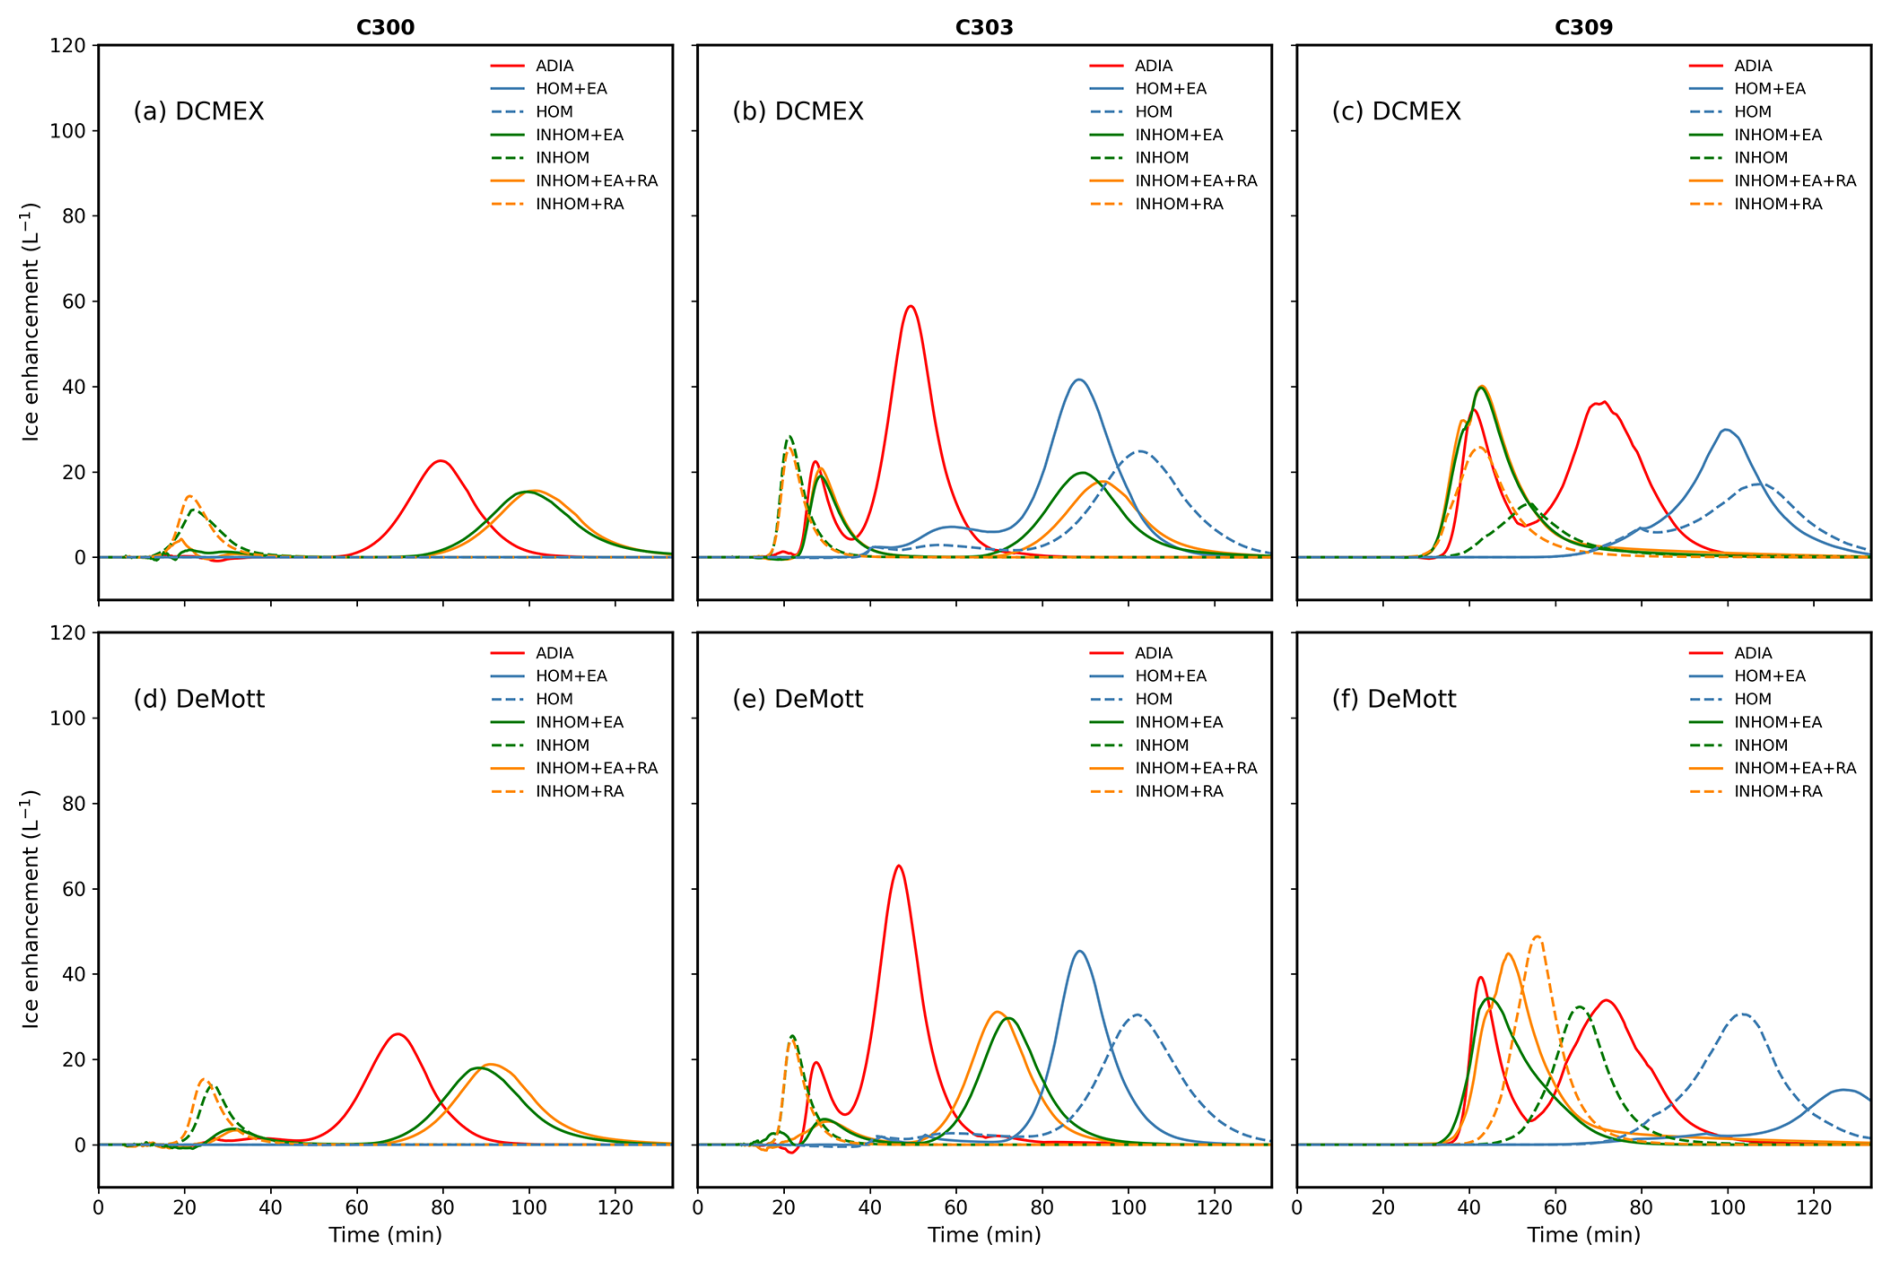
Figure 6Time series of ice enhancement for three representative cases: C300 (left), C303 (middle), and C309 (right). The top row (a–c) shows simulations using the heterogeneous freezing parameterisation of Daily et al. (2026), while the bottom row (d–f) shows results using the parameterisation of DeMott et al. (2010). Colour coding follows Fig. 5.
To assess the impact of SIP on ice number concentration, it is first necessary to establish the representation of primary ice production. In this study, primary ice production was parameterised following Daily et al. (2026). The resulting NINP profiles from the different model configurations, plotted as dashed lines in Fig. 5, were broadly consistent with the INP curve shown in the right panel of Fig. S2. For comparison, we also tested the parameterisation of DeMott et al. (2010). Only minor differences in ice enhancement were found between the two parameterisations, as shown in the upper and lower panels of Fig. 6.
For the 22 July case, as shown in the left panel of Fig. 5, NINP peaked at approximately 20, 10, and 25 L−1 near −26 °C in the ADIA, HOM+EA, and INHOM+EA+RA simulations, respectively. HOM+EA produced almost no ice enhancement, whereas both ADIA and INHOM+EA+RA showed increases of about 20 L−1, occurring at around 80 and 100 min, respectively, as shown in panel a of Fig. 6. Figure S15 shows representative CPI images for the 22 July case. Near −8 °C, the images were dominated by small, rounded particles, which are likely to be droplets. No obvious large droplets or well-developed ice crystals were observed at this temperature. At colder levels, some larger and more irregular ice particles were present. However, these were relatively few, and the particle population remained dominated overall by small, rounded particles.
For the 25 July case, panel (b) of Fig. 6 shows that ADIA, HOM+EA, and INHOM+EA+RA produced ice enhancement at around 50, 90, and 95 min, reaching approximately 60, 40, and 20 L−1, respectively. ADIA showed two peaks at about 25 and 50 min, with maxima of roughly 20 and 60 L−1. HOM showed a single peak of about 35 L−1 near 105 min, whereas HOM+EA peaked earlier, at around 90 min, with a maximum of about 45 L−1. In contrast, INHOM+RA and INHOM+EA+RA both exhibited two peaks, at approximately 25 and 90 min, each reaching about 20 L−1. Figure S16 shows representative CPI images for the 25 July case. At approximately −8 °C, the available CPI images were consistently dominated by rounded particles, with diameters mainly between 35 and 45 µm. No obvious faceted ice crystals were observed. At −16 °C, larger rounded particles became clearly visible, with diameters generally exceeding 100 µm, and are inferred to represent large droplets. This may reflect the relatively warm cloud base in the 25 July case, which would provide sufficient liquid water for the droplets to grow to larger sizes before reaching colder levels. Potential inhomogeneous mixing may also have promoted a broader droplet size distribution, favouring the formation of larger droplets. In the representative CPI images shown for this temperature, irregular particles and some larger ice crystals were also visible, including hexagonal crystals, columnar crystals, and their aggregates. The red-boxed region may indicate a possible droplet–ice collision event, together with the presence of several small ice crystals and small supercooled raindrops in the surrounding area over a short period. At −22 °C, larger droplets and irregular ice crystals were still observed, and partially developed hexagonal ice crystals were also present.
For the 1 August case, panel (c) of Fig. 6 shows that ADIA produced two peaks at around 40 and 70 min, both reaching approximately 40 L−1. INHOM+RA and INHOM+EA+RA also exhibited early ice enhancement at around 40 min, with their peak timing close to that of the first ADIA peak. HOM+EA reached a peak of about 40 L−1 at approximately 100 min, whereas the HOM peak occurred about 10 min later and reached only around 20 L−1. Notably, the result for HOM and HOM+EA was reversed in panel (f), where HOM showed greater ice enhancement and reached its peak earlier than HOM+EA. Figure S17 shows representative CPI images for the 1 August case. At approximately −5 °C, relatively large particles were observed, with sizes reaching 300 to 400 µm. Columnar ice crystals and some small irregular ice particles were also present. At approximately −8 °C, small supercooled raindrops were observed, while the images were dominated by aggregated ice particles, with the largest particle exceeding 500 µm in diameter. At the colder sampled level, at about −11 °C, few obvious ice crystals were observed, and the images were dominated mainly by smaller supercooled raindrops.
It is worth noting that, for the three selected cases, the ice number concentrations simulated near the modelled cloud top when SIP was included were generally consistent with the observed ice number concentrations near the highest aircraft passes. However, at warmer levels during parcel development, the simulated ice concentrations were less consistent with the observations (Fig. 5). This likely reflects limitations of the BMM as a one-dimensional model, which will be discussed in more detail in the Discussion section.
4.4 Analysis of Individual SIP Mechanisms
Figure 7 presents sensitivity tests for all three cases, designed to isolate the individual contribution of the four SIP mechanisms, RS, CB, M1, and M2. Primary ice formation was parameterised using Daily et al. (2026) in all simulations. In each test, only one SIP mechanism was activated, while the other three were switched off. Overall, RS and M1 were largely inactive and produced little ice enhancement in all three cases. By contrast, M2 was active in all cases, whereas CB was only active and produced ice enhancement in the 1 August case.
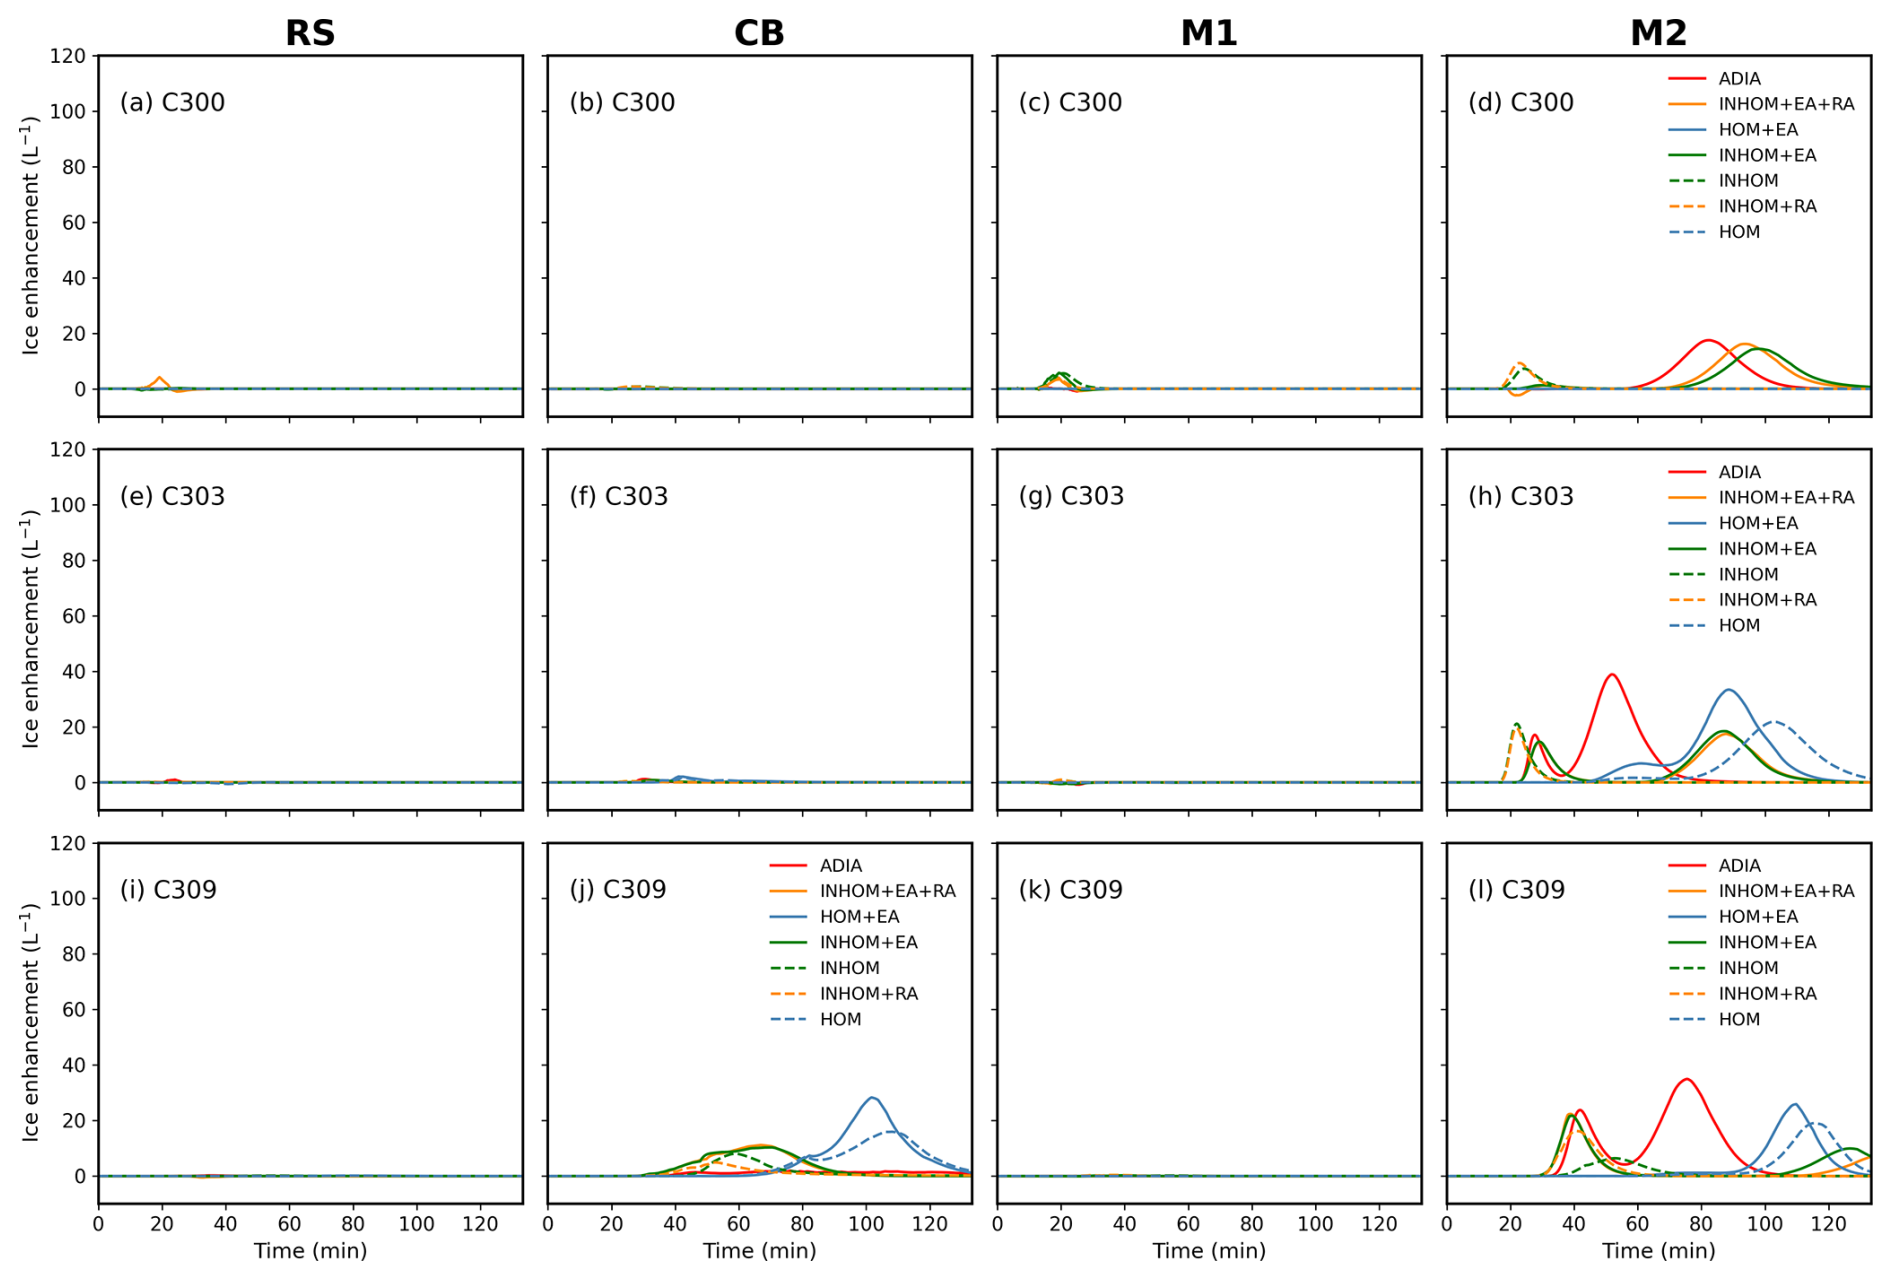
Figure 7Time series of ice enhancement from individual SIP mechanisms for three representative cases: 22 July (C300, top row), 25 July (C303, middle row), and 1 August (C309, bottom row). Panels show the results for RS (a, e, i), CB (b, f, j), M1 (c, g, k), and M2 (d, h, l). Colour coding follows Fig. 5.
For the 22 July case, when RS was activated, only INHOM+EA+RA produced a small ice enhancement of about 5 L−1 at around 20 min. The available CPI images within the temperature range favourable for RS also show no clear large rimed particles (Fig. S15). When M1 was activated, only the inhomogeneous mixing simulations showed a very small ice enhancement during the first 20 min of the simulation, reaching about 7 L−1. When M2 was activated, no ice enhancement was observed in the homogeneous simulations. In contrast, ADIA produced a peak ice enhancement of about 20 L−1 at around 80 min, while INHOM+EA and INHOM+EA+RA produced ice enhancements of about 18 L−1 at around 100 min.
For the 25 July case, no clear ice enhancement was produced when RS, CB, or M1 was activated individually. When M2 was activated, ADIA showed a double peak, reaching about 20 and 40 L−1 at around 30 and 50 min, respectively. The ice enhancements in INHOM and INHOM+RA occurred at times similar to the first peak in ADIA. By contrast, HOM+EA, INHOM+EA, and INHOM+EA+RA reached peak ice enhancements of about 40, 20, and 20 L−1, respectively, at around 85 min. HOM peaked about 10 min later than HOM+EA, and its peak ice enhancement was only about 25 L−1. In the CPI images for the 25 July case shown in Fig. S16, both large droplets and large ice particles were frequently observed, providing favourable conditions for M2. Within the red boxed region, a possible droplet–ice collision is visible, with numerous small ice crystals observed close to the possible collision feature. This feature is consistent with fragmentation during the freezing of supercooled droplets upon collision with a more massive ice particle, and this provides observational evidence that M2 may have occurred in this case. In addition, at around −22 °C, partially broken ice crystals with an incomplete hexagonal shape were observed. These features may reflect mechanical damage associated with ice–ice collisions, and could suggest a minor contribution from CB.
For the 1 August case, no ice enhancement was observed when RS or M1 was activated individually. When CB was activated, ADIA showed no ice enhancement, whereas INHOM+EA and INHOM+EA+RA produced ice enhancements of about 15 L−1 at around 65 min. HOM+EA and HOM reached about 30 and 15 L−1 at around 100 and 110 min, respectively. When M2 was activated, ADIA showed a double peak, with ice enhancement occurring at around 40 and 75 min. The inhomogeneous mixing simulations produced ice enhancement at times similar to the first ADIA peak, while HOM+EA and HOM reached about 30 and 25 L−1 at around 110 and 115 min, respectively. This is consistent with the CPI images shown in Fig. S17, in which large ice particles and relatively large droplets were frequently observed, providing favourable conditions for both M2 and CB.
In our study, we investigated four SIP mechanisms (RS, CB, M1, and M2) in 15 deep convective cloud cases observed during the DCMEX campaign from 22 July to 7 August 2022 using a parcel model. Two entrainment representations (homogeneous and inhomogeneous mixing) were incorporated into the model, extending the adiabatic framework of James et al. (2023) to better represent dilution effects on cloud microphysics. Our results suggest that M2 is likely a key mechanism for explaining the high ice particle concentrations observed in deep convective clouds during the DCMEX campaign (see Figs. S6–S10). As for the other mechanisms, RS and M1 remained largely inactive across all 15 cases, whereas CB contributed to ice enhancement in cases with warm cloud-top temperatures, as illustrated by the 1 August case (C309; Fig. S8). It should be noted that RS may be underestimated in our parcel model (see discussion later). However, observations during DCMEX indicate that RS contributed little to SIP in these clouds. This may partly result from the flight pattern adopted during the campaign, which could have limited sampling of regions where RS was active (P. J. Connolly, personal communication, 2026). The entrainment of aerosol was also found to accelerate the collision–coalescence process under homogeneous mixing conditions, leading to earlier ice enhancement, consistent with the hypothesis proposed by James et al. (2023).
To investigate the role of each SIP mechanism, it is first necessary to examine the development of the liquid phase during the early stages of cloud evolution. In our simulations, large droplets with diameters greater than 150 µm are critical for initiating M2, since droplets of this size with higher relative velocities are more likely to produce splashing during collisions. M2 becomes more active as the ratio of collision kinetic energy to surface energy increases in our BMM (Phillips et al., 2018a; James et al., 2023). Previous studies have also shown that different representations of liquid-phase microphysics, especially the contrast between bulk and bin schemes (Lee and Baik, 2018; Johnson et al., 2024), can substantially affect the simulated efficiency of SIP. Grzegorczyk et al. (2025) and Qu et al. (2022) both analysed the same observational case of tropical deep convective clouds from the HAIC/HIWC campaign but reached contrasting conclusions regarding the contribution of DS (corresponding to our M1+M2) to ice enhancement, which they indicate differences in the availability of large droplets.
We found that representing aerosol entrainment was essential for simulating the observed breadth of the droplet size distribution during the DCMEX campaign. The observations revealed a bimodal spectrum with a distinct minimum near 10 µm, suggesting the presence of a secondary activation mechanism. This type of distribution has also been reported in previous studies (Morrison et al., 2022a; Chandrakar et al., 2021a; Cooper et al., 2013). James et al. (2023) also employed a parcel model to investigate the role of M2 in idealised shallow convective clouds. Their modelling setup is similar to our adiabatic configuration. Although adiabatic assumption can sometimes provide a reasonable approximation, observational and large-eddy simulation (LES) studies have shown that entrainment can begin almost immediately after cloud formation, with turbulent mixing potentially diluting the parcel even within a few hundred metres above cloud base (Grabowski and Wang, 2013). We found that the adiabatic simulations produced narrower droplet size distributions and tended to substantially overestimate CDNC, as well as LWC by up to approximately 300 %. As a result, the efficiency of SIP was also overestimated, in some cases with relatively warm cloud-base temperatures and deeper cloud layers, such as C306 and C312 (see Fig. S14), the enhancement of ice production was even two to three times greater than in the simulations that included entrainment. Simulations with inhomogeneous mixing tend to lead to an underestimation of CDNC and an overestimation of Deff, as shown in Fig. 3. Although many previous studies suggest that inhomogeneous mixing tends to become more prevalent during later stages of the cloud life cycle, this is likely due to increased entrainment and evaporation near the cloud edges as the updraft weakens (e.g. Lehmann et al., 2009; Lim and Hoffmann, 2024; Xu et al., 2022). We did not find evidence supporting its dominance in our cases. This may be due to the aircraft tracking the developing clouds, thereby sampling them during the early stages of their lifecycle.
Despite the potential importance of entrainment for SIP, they have rarely been systematically evaluated in existing studies. Georgakaki et al. (2022) used the mesoscale model WRF with the Morrison double-moment microphysics scheme to investigate three SIP mechanisms, RS, CB and DS (corresponding to our M1 and M2) in two alpine clouds. They found CB to be the dominant contributor to SIP, while DS was inactive, likely due to the lack of large droplets. However, the Morrison double-moment scheme in WRF is closer to the homogeneous mixing limit in its evaporation-dilution representation. In our colder cloud-base case (C300), homogeneous mixing likewise produced no active SIP, whereas M2 became active under inhomogeneous mixing due to the production of large droplets. This suggests that the efficiency of DS in Georgakaki et al. (2022) may have been underestimated. A broad droplet size distribution can accelerate warm-rain formation through collision and coalescence, which can therefore affect SIP. Our results show that, across all SIP-active cases, HOM+EA leads to secondary ice enhancement occurring 15–20 min earlier and increasing in magnitude by approximately 30 %–40 % compared with HOM. Sotiropoulou et al. (2020) used a high-resolution LES with double-moment bulk microphysics and explicitly resolved turbulent entrainment to investigate the effects of RS, CB and droplet fragmentation on summer Arctic stratocumulus. However, even at such high resolutions, the grid-scale microphysics in these models typically assumes instantaneous homogeneous mixing (e.g. Morrison and Grabowski, 2008). They found DS to be ineffective, yet this assumption cannot resolve the detailed evolution of the droplet size distribution under local dilution and may underestimate spectral broadening caused by size-dependent evaporation, potentially leading to an underestimation of DS.
In this study, ice particle observations were primarily based on the processed CPI ice concentration variable, together with CPI imagery. The CPI imagery remains valuable for identifying larger particles and particle habits, and therefore for supporting the interpretation of SIP, as discussed in Sect. 4.4. For the three cases analysed in this study, the CPI images suggest that the coexistence of large droplets with small ice crystals was relatively uncommon, whereas coexistence with larger ice particles was observed more frequently, indirectly suggesting from an observational perspective that M1 may have been relatively inactive in these clouds, while M2 may have played a more important role. However, it should be acknowledged that the relatively limited sample volume of the CPI means that the inferred number concentrations are more strongly influenced by sampling noise, particularly when particle concentrations are low or spatial variability is pronounced (Baumgardner et al., 2017; McFarquhar et al., 2017). Further study including a more complete intercomparison across multiple probes would be useful to better constrain the observational uncertainty.
In an earlier study of summertime cumuli over the same region in New Mexico, Blyth and Latham (1993) observed high ice crystal concentrations. They concluded that this enhancement could be explained by the Hallett-Mossop (HM) process, based on the observed coexistence of graupel and supercooled drops larger than 24 µm in diameter near the RS temperature range. However, we did not find this in our results (see Fig. S10), as RS remains inactive throughout all 15 simulated cases. The clouds investigated in their study are similar to those observed during the DCMEX project in 2022. It also should be noted that the ice crystal concentrations reported by Blyth and Latham (1993) were likely significantly overestimated due to probe-induced shattering (Korolev et al., 2013; Jackson et al., 2014). In our simulations, the model results indicate that RS is not the dominant SIP mechanism in the early stage of cloud development. We also acknowledge that the parcel model, due to its simplified structure, may underestimate the contribution of the RS mechanism. During the Ice in Clouds Experiment-Tropical (ICE-T) field campaign, Lasher-Trapp et al. (2016) reported cases in tropical maritime cumuli where graupel ascended near cloud tops and was later observed falling back into the rime-splintering zone, suggesting that RS could have been enhanced. Observations and simulations of tropical convective clouds during the Ice in Clouds Experiment-Dust (ICE-D) campaign by Cui et al. (2022) showed that RS was more active under multi-thermal conditions.
It should also be noted that the simplified framework of the parcel model introduces several limitations in the representation of cloud microphysical processes. The aerosol hygroscopicity parameter, κ, used in this study was calculated following the Zdanovskii-Stokes-Robinson mixing rule described by Wu et al. (2025). The resulting bulk κ, which represents a volume-fraction-weighted average of the hygroscopicities of the individual aerosol components, was applied uniformly to all aerosol size bins. However, aerosol particles of different sizes may differ in chemical composition in the real atmosphere, and their κ values are therefore not necessarily identical (Petters and Kreidenweis, 2007; Xu et al., 2022). Because it was derived using volume weighting, this bulk κ value may be more reflective of the hygroscopicity of particles in the larger size bins than a number-weighted mean would be. However, applying a single κ value to all aerosol size bins neglects size-dependent aerosol hygroscopicity, introducing uncertainty into the simulated M2 activity, which is sensitive to the formation of larger cloud droplets.
Our 1D parcel model is also more representative of the evolution of a single local ascending trajectory than of the full cloud system, in which multiple air parcels interact continuously. In the observations (e.g. Figs. S15–S17), ice crystals observed in the lower part of the cloud may not arise solely from in situ formation within a single local ascending parcel, but may also reflect contributions from ice transported from other cloud regions through vertical or lateral exchange, together with redistribution associated with turbulent entrainment and mixing. In addition, as large ice particles formed in the model cannot leave the parcel through sedimentation, the local Nice in the upper part of the cloud may be overestimated. These results are therefore more suitable for interpreting local processes and the relative contributions of individual mechanisms than for being regarded as a complete representation of the three-dimensional ice-phase structure of the whole deep convective cloud.
To assess the impact of primary ice nucleation on SIP, we tested two INP parameterizations, Daily et al. (2026) and DeMott et al. (2010). The former is more appropriate for this study, as it was developed from measurements in the inflow clear air below cloud bases and in the environment around clouds during the DCMEX project, whereas the latter is a more general parameterization. However, our simulations showed negligible differences in SIP efficiency between the two, suggesting that once secondary ice multiplication is triggered, the choice of INP parameterization has limited influence on the final ice particle concentrations under these convective conditions.
In this study, we implemented entrainment parameterisations in the bin microphysics parcel model, including two different mixing representations (homogeneous and inhomogeneous) and external aerosol entrainment. These schemes were applied to simulations of summer continental deep convective clouds over New Mexico to assess the impacts of dry air and aerosol entrainment on cloud microphysical properties and secondary ice production. The representation of entrainment leads to systematic differences in secondary ice production by modifying liquid-phase microphysical properties (e.g. cloud droplet number concentration, liquid water content, and droplet size distribution), thereby affecting both the efficiency and onset of ice enhancement.
Our results show that the observed broad and bimodal droplet size distribution can only be reproduced when entrainment is included, particularly aerosol entrainment, within the parcel model framework for individual air trajectories. This is consistent with previous studies on the effects of dilution on the warm phase of clouds. In our adiabatic parcel simulations, cloud droplet number concentration and liquid water content are much higher than in simulations that include entrainment, with liquid water content exceeding entrainment cases by up to ∼ 300 %. As a result, ice enhancement is up to 2–3 times larger in some cases. Under homogeneous mixing, aerosol entrainment tends to result in a broader droplet size distribution, with the SIP peak occurring 15–20 min earlier and reaching a higher peak value (by about 25 %) than in simulations without aerosol entrainment. For shallow cloud cases, aerosol entrainment has little impact on SIP under inhomogeneous mixing. In deep cloud cases, inhomogeneous mixing results in an early SIP maximum (within ∼ 20 min) associated with an excess of large droplets; however, aerosol entrainment shifts the SIP peak to a timing comparable to that under homogeneous mixing. In our simulations of the DCMEX cases over New Mexico, most cases are best represented by homogeneous mixing combined with aerosol entrainment. We also find no evidence that inhomogeneous mixing dominates in the simulated clouds, which may be due to the aircraft primarily sampling clouds during their early stages of development.
When the four SIP mechanisms (RS, CB, M1 and M2) are examined separately, our results suggest that M2, as currently understood and represented in the model, is the most important contributor to ice enhancement in the DCMEX deep convective cloud cases. M1 remains largely inactive, likely due to limitations of the parcel model in which the absence of sedimentation leads to an accumulation of ice crystals and a progressive reduction in supercooled liquid water, thereby suppressing collisions between large droplets and small ice crystals required for efficient M1. CB contributes to ice enhancement in some shallower cloud cases but produces little ice enhancement in the deeper cloud cases. Our results suggest that RS alone cannot account for the high ice crystal concentrations observed during DCMEX. This contrasts with earlier interpretations for summertime cumuli over the same region, which attributed ice enhancement mainly to the Hallett–Mossop process (Blyth and Latham, 1993). In our simulations, RS is inefficient during the early stages of cloud development because the temperature range favourable for rime splintering does not coincide with the presence of sufficiently large droplets and ice particles. The contribution of RS may be underestimated in the parcel model framework, as multi-thermal circulations and interactions between different air parcels are not represented. Future extensions of the model that include sedimentation and interactions between different air parcels will therefore be required to better assess the potential role of RS in deep convective clouds.
Further progress in understanding M2 will require improved laboratory constraints on freezing-drop fragmentation and continued development of idealised parcel modelling frameworks that include sedimentation and interactions between different air parcels. Incorporating the effects of entrainment on secondary ice production will also be critical for achieving an accurate representation of ice-phase processes in numerical weather prediction and other large-scale models.
The version of the bin-microphysics model used in this study is archived on Zenodo at https://doi.org/10.5281/zenodo.20646114 (Portman and Connolly, 2026) and is also available from the corresponding GitHub repository at https://github.com/bowenzhuportman/bin-microphysics-model (last access: 11 June 2026). The FAAM aircraft observations used to initialise and evaluate the simulations are available from the Centre for Environmental Data Analysis (CEDA) archive at https://doi.org/10.5285/B1211AD185E24B488D41DD98F957506C (Facility for Airborne Atmospheric Measurements et al., 20224).
The supplement related to this article is available online at https://doi.org/10.5194/acp-26-8367-2026-supplement.
BZP and PJC conceived the original study. PJC developed the model code. BZP performed the simulations, analysed the data, and wrote the manuscript. HW provided key observational data. PJC, AMB and RLJ contributed to scientific discussions and provided comments on the manuscript.
The contact author has declared that none of the authors has any competing interests.
Publisher's note: Copernicus Publications remains neutral with regard to jurisdictional claims made in the text, published maps, institutional affiliations, or any other geographical representation in this paper. The authors bear the ultimate responsibility for providing appropriate place names. Views expressed in the text are those of the authors and do not necessarily reflect the views of the publisher.
Airborne data were obtained using the FAAM Airborne Laboratory BAe-146 Atmospheric Research Aircraft, operated by Airtask Ltd, managed by the National Centre for Atmospheric Science, leased through the University of Leeds, and owned by UK Research and Innovation and the Natural Environment Research Council.
The author used ChatGPT to assist with language editing and improving the clarity of the manuscript. All scientific analysis, interpretations, and conclusions were performed by the authors.
This research has been supported by the UK Natural Environment Research Council (grant nos. NE/T006420/1 and NE/T006439/1, Deep Convective Microphysics Experiment, DCMEX) and the European Union's Horizon Europe programme through the CERTAINTY project under grant agreement No. 101137680.
This paper was edited by Greg McFarquhar and reviewed by two anonymous referees.
Abel, S. J., Cotton, R. J., Barrett, P. A., and Vance, A. K.: A comparison of ice water content measurement techniques on the FAAM BAe-146 aircraft, Atmos. Meas. Tech., 7, 3007–3022, https://doi.org/10.5194/amt-7-3007-2014, 2014. a
Adams, D. K. and Comrie, A. C.: The north American monsoon, B. Am. Meteor. Soc., 78, 2197–2214, 1997. a
Adams, D. K. and Souza, E. P.: CAPE and convective events in the Southwest during the North American monsoon, Mon. Weather Rev., 137, 83–98, 2009. a
Baker, M. B., Corbin, R. G., and Latham, J.: The influence of entrainment on the evolution of cloud droplet spectra: I. A model of inhomogeneous mixing, Q. J. Roy. Meteor. Soc., 106, 581–598, https://doi.org/10.1002/qj.49710644914, 1980. a, b
Baumgardner, D., Abel, S., Axisa, D., Cotton, R., Crosier, J., Field, P., Gurganus, C., Heymsfield, A., Korolev, A., Kraemer, M., Lawson, P., McFarquhar, G., Ulanowski, Z., and Um, J.: Cloud ice properties: In situ measurement challenges, Meteor. Mon., 58, 9.1–9.23, https://doi.org/10.1175/AMSMONOGRAPHS-D-16-0011.1, 2017. a
Billault-Roux, A.-C., Georgakaki, P., Gehring, J., Jaffeux, L., Schwarzenboeck, A., Coutris, P., Nenes, A., and Berne, A.: Distinct secondary ice production processes observed in radar Doppler spectra: insights from a case study, Atmos. Chem. Phys., 23, 10207–10234, https://doi.org/10.5194/acp-23-10207-2023, 2023. a
Blyth, A. M. and Latham, J.: Development of ice and precipitation in New Mexican summertime cumulus clouds, Q. J. Roy. Meteor. Soc., 119, 91–120, https://doi.org/10.1002/qj.49711950905, 1993. a, b, c, d, e
Bott, A.: A flux method for the numerical solution of the stochastic collection equation, J. Atmos. Sci., 55, 2284–2293, 1998. a, b
Chandrakar, K. K., Grabowski, W. W., Morrison, H., and Bryan, G. H.: Impact of Entrainment Mixing and Turbulent Fluctuations on Droplet Size Distributions in a Cumulus Cloud: An Investigation Using Lagrangian Microphysics with a Subgrid-Scale Model, J. Atmos. Sci., 78, 2983–3005, https://doi.org/10.1175/JAS-D-20-0281.1, 2021a. a
Chandrakar, K. K., Grabowski, W. W., Morrison, H., and Bryan, G. H.: Impact of entrainment mixing and turbulent fluctuations on droplet size distributions in a cumulus cloud: An investigation using Lagrangian microphysics with a subgrid-scale model, J. Atmos. Sci., 78, 2983–3005, 2021b. a
Cooper, W. A., Lasher-Trapp, S. G., and Blyth, A. M.: The Influence of Entrainment and Mixing on the Initial Formation of Rain in a Warm Cumulus Cloud, J. Atmos. Sci., 70, 1727–1743, https://doi.org/10.1175/JAS-D-12-0128.1, 2013. a
Crawford, I., Bower, K. N., Choularton, T. W., Dearden, C., Crosier, J., Westbrook, C., Capes, G., Coe, H., Connolly, P. J., Dorsey, J. R., Gallagher, M. W., Williams, P., Trembath, J., Cui, Z., and Blyth, A.: Ice formation and development in aged, wintertime cumulus over the UK: observations and modelling, Atmos. Chem. Phys., 12, 4963–4985, https://doi.org/10.5194/acp-12-4963-2012, 2012. a
Cui, Z., Blyth, A., Huang, Y., Lloyd, G., Choularton, T., Bower, K., Field, P., Hawker, R., and Bennett, L.: Multi-thermals and high concentrations of secondary ice: a modelling study of convective clouds during the Ice in Clouds Experiment – Dust (ICE-D) campaign, Atmos. Chem. Phys., 22, 1649–1667, https://doi.org/10.5194/acp-22-1649-2022, 2022. a
Daily, M. I., Robinson, J., Finney, D. L., Raif, E. N., McQuaid, J. B., Sánchez-Marroquín, A., Hu, K., Lloyd, G., Flynn, M., Field, P. R., Bower, K. N., Coe, H., Gallagher, M. W., Blyth, A. M., and Murray, B. J.: Ice-nucleating particle and cloud ice crystal concentrations associated with developing summertime deep convective clouds in south-western USA, J. Geophys. Res.-Atmos., 131, e2024JD043236, https://doi.org/10.1029/2024JD043236, 2026. a, b, c, d, e, f, g
DeMott, P. J., Prenni, A. J., Liu, X., Kreidenweis, S. M., Petters, M. D., Twohy, C. H., Richardson, M. S., Eidhammer, T., and Rogers, D. C.: Predicting global atmospheric ice nuclei distributions and their impacts on climate, P. Natl. Acad. Sci. USA, 107, 11217–11222, https://doi.org/10.1073/pnas.0910818107, 2010. a, b, c, d, e
Erfani, E. and Mitchell, D.: A partial mechanistic understanding of the North American monsoon, J. Geophys. Res.-Atmos., 119, 13–096, 2014. a
Faber, S., French, J. R., and Jackson, R.: Laboratory and in-flight evaluation of measurement uncertainties from a commercial Cloud Droplet Probe (CDP), Atmos. Meas. Tech., 11, 3645–3659, https://doi.org/10.5194/amt-11-3645-2018, 2018. a
Facility for Airborne Atmospheric Measurements, Finney, D., Blyth, A., Gallagher, M., Wu, H., Nott, G. J., Biggerstaf, M., Sonnenfeld, R. G., Daily, M., Walker, D., Dufton, D., Bower, K., Boeing, S., Choularton, T., Crosier, J., Groves, J., Field, P., Coe, H., Murray, B. J., Lloyd, G., Marsden, N. A., Flynn, M., Hu, K., Thamban, N. M., Williams, P. I., Connolly, P. J., McQuaid, J. B., Robinson, J., Cui, Z., Burton, R. R., Carrie, G., Moore, R., Abel, S. J., Tiddeman, D., Aulich, G., Bennecke, D., Kelsey, V., Reger, R. S., Nowakowska, K., Bassford, J., Morris, F., and Hampton, J.: DCMEX: Collection of in-situ airborne observations, ground-based meteorological and aerosol measurements and cloud imagery for the Deep Convective Microphysics Experiment, CEDA Archive [data set], https://doi.org/10.5285/B1211AD185E24B488D41DD98F957506C, 2024. a
Field, P. R. and Heymsfield, A. J.: Importance of snow to global precipitation, Geophys. Res. Lett., 42, 9512–9520, https://doi.org/10.1002/2015GL065497, 2015. a
Field, P. R., Lawson, R. P., Brown, P. R. A., Lloyd, G., Westbrook, C., Moisseev, D., Miltenberger, A., Nenes, A., Blyth, A., Choularton, T., Connolly, P., Buehl, J., Crosier, J., Cui, Z., Dearden, C., DeMott, P., Flossmann, A., Heymsfield, A., Huang, Y., Kalesse, H., Kanji, Z. A., Korolev, A., Kirchgaessner, A., Lasher-Trapp, S., Leisner, T., McFarquhar, G., Phillips, V., Stith, J., and Sullivan, S.: Secondary Ice Production: Current State of the Science and Recommendations for the Future, Meteorol. Monogr., 58, 7.1–7.20, https://doi.org/10.1175/AMSMONOGRAPHS-D-16-0014.1, 2017. a
Finney, D. L., Blyth, A. M., Gallagher, M., Wu, H., Nott, G. J., Biggerstaff, M. I., Sonnenfeld, R. G., Daily, M., Walker, D., Dufton, D., Bower, K., Böing, S., Choularton, T., Crosier, J., Groves, J., Field, P. R., Coe, H., Murray, B. J., Lloyd, G., Marsden, N. A., Flynn, M., Hu, K., Thamban, N. M., Williams, P. I., Connolly, P. J., McQuaid, J. B., Robinson, J., Cui, Z., Burton, R. R., Carrie, G., Moore, R., Abel, S. J., Tiddeman, D., and Aulich, G.: Deep Convective Microphysics Experiment (DCMEX) coordinated aircraft and ground observations: microphysics, aerosol, and dynamics during cumulonimbus development, Earth Syst. Sci. Data, 16, 2141–2163, https://doi.org/10.5194/essd-16-2141-2024, 2024. a, b, c, d
Fonseca-Hernandez, M., Turrent, C., Mayor, Y. G., and Tereshchenko, I.: Using observational and reanalysis data to explore the southern Gulf of California boundary layer during the North American monsoon onset, J. Geophys. Res.-Atmos., 126, e2020JD033508, https://doi.org/10.1029/2020JD033508, 2021. a
Fowler, K., Connolly, P., and Topping, D.: Modelling the effect of condensed-phase diffusion on the homogeneous nucleation of ice in ultra-viscous particles, Atmos. Chem. Phys., 20, 683–698, https://doi.org/10.5194/acp-20-683-2020, 2020. a
Georgakaki, P., Sotiropoulou, G., Vignon, É., Billault-Roux, A.-C., Berne, A., and Nenes, A.: Secondary ice production processes in wintertime alpine mixed-phase clouds, Atmos. Chem. Phys., 22, 1965–1988, https://doi.org/10.5194/acp-22-1965-2022, 2022. a, b
Grabowski, W. W. and Wang, L.-P.: Growth of Cloud Droplets in a Turbulent Environment, Annu. Rev. Fluid Mech, 45, 293–324, https://doi.org/10.1146/annurev-fluid-011212-140750, 2013. a
Grzegorczyk, P., Yadav, S., Zanger, F., Theis, A., Mitra, S. K., Borrmann, S., and Szakáll, M.: Fragmentation of ice particles: laboratory experiments on graupel–graupel and graupel–snowflake collisions, Atmos. Chem. Phys., 23, 13505–13521, https://doi.org/10.5194/acp-23-13505-2023, 2023. a
Grzegorczyk, P., Wobrock, W., Canzi, A., Niquet, L., Tridon, F., and Planche, C.: Investigating secondary ice production in a deep convective cloud with a 3D bin microphysics model: Part I – Sensitivity study of microphysical processes representations, Atmos. Res., 313, 107774, https://doi.org/10.1016/j.atmosres.2024.107774, 2025. a, b, c
Hallett, J. and Mossop, S.: Production of secondary ice particles during the riming process, Nature, 249, 26–28, 1974. a
Hallett, J., Sax, R. I., Lamb, D., and Murty, A. R.: Aircraft measurements of ice in Florida cumuli, Q. J. Roy. Meteor. Soc., 104, 631–651, 1978. a
Harris-Hobbs, R. L. and Cooper, W. A.: Field evidence supporting quantitative predictions of secondary ice production rates, J. Atmos. Sci., 44, 1071–1082, 1987. a
Hu, K., Lloyd, G., Wu, H., Bower, K., Flynn, M., Marsden, N., Choularton, T., Daily, M., Murray, B., Coe, H., Connolly, P., Nott, G., Reed, C., Schledewitz, W., Gallagher, M., and Blyth, A.: Overview of Secondary Ice Production In the Deep Convective Microphysics Experiment (DCMEX), EGU General Assembly 2024, Vienna, Austria, 14–19 Apr 2024, EGU24-1493, https://doi.org/10.5194/egusphere-egu24-1493, 2024. a
Huang, Y., Wu, W., McFarquhar, G. M., Xue, M., Morrison, H., Milbrandt, J., Korolev, A. V., Hu, Y., Qu, Z., Wolde, M., Nguyen, C., Schwarzenboeck, A., and Heckman, I.: Microphysical processes producing high ice water contents (HIWCs) in tropical convective clouds during the HAIC-HIWC field campaign: dominant role of secondary ice production, Atmos. Chem. Phys., 22, 2365–2384, https://doi.org/10.5194/acp-22-2365-2022, 2022. a
Jackson, R. C., McFarquhar, G. M., Stith, J., Beals, M., Shaw, R. A., Jensen, J., Fugal, J., and Korolev, A.: An assessment of the impact of antishattering tips and artifact removal techniques on cloud ice size distributions measured by the 2D cloud probe, J. Atmos. Ocean. Tech., 31, 2567–2590, 2014. a
Jacobson, M. Z.: Fundamentals of Atmospheric Modeling, Cambridge University Press, 2 edn., https://doi.org/10.1017/CBO9781139165389, 2005. a
James, R. L., Crosier, J., and Connolly, P. J.: A bin microphysics parcel model investigation of secondary ice formation in an idealised shallow convective cloud, Atmos. Chem. Phys., 23, 9099–9121, https://doi.org/10.5194/acp-23-9099-2023, 2023. a, b, c, d, e, f, g, h
Johnson, M., Xue, M., and Jung, Y.: Comparison of a Spectral Bin and Two Multi-Moment Bulk Microphysics Schemes for Supercell Simulation: Investigation into Key Processes Responsible for Hydrometeor Distributions and Precipitation, Adv. Atmos. Sci., 41, 784–800, 2024. a
Koop, T., Luo, B., Tsias, A., and Peter, T.: Water activity as the determinant for homogeneous ice nucleation in aqueous solutions, Nature, 406, 611–614, https://doi.org/10.1038/35020537, 2000. a
Korolev, A. and Leisner, T.: Review of experimental studies of secondary ice production, Atmos. Chem. Phys., 20, 11767–11797, https://doi.org/10.5194/acp-20-11767-2020, 2020. a
Korolev, A., Strapp, J., Isaac, G., and Nevzorov, A.: The Nevzorov airborne hot-wire LWC–TWC probe: Principle of operation and performance characteristics, J. Atmos. Ocean. Tech., 15, 1495–1510, 1998. a
Korolev, A., Emery, E., and Creelman, K.: Modification and tests of particle probe tips to mitigate effects of ice shattering, J. Atmos. Ocean. Tech., 30, 690–708, 2013. a
Korolev, A., Heckman, I., Wolde, M., Ackerman, A. S., Fridlind, A. M., Ladino, L. A., Lawson, R. P., Milbrandt, J., and Williams, E.: A new look at the environmental conditions favorable to secondary ice production, Atmos. Chem. Phys., 20, 1391–1429, https://doi.org/10.5194/acp-20-1391-2020, 2020. a, b, c
Korolev, A., DeMott, P. J., Heckman, I., Wolde, M., Williams, E., Smalley, D. J., and Donovan, M. F.: Observation of secondary ice production in clouds at low temperatures, Atmos. Chem. Phys., 22, 13103–13113, https://doi.org/10.5194/acp-22-13103-2022, 2022. a
Ladino, L. A., Korolev, A., Heckman, I., Wolde, M., Fridlind, A. M., and Ackerman, A. S.: On the role of ice-nucleating aerosol in the formation of ice particles in tropical mesoscale convective systems, Geophys. Res. Lett., 44, 1574–1582, 2017. a
Lance, S., Brock, C. A., Rogers, D., and Gordon, J. A.: Water droplet calibration of the Cloud Droplet Probe (CDP) and in-flight performance in liquid, ice and mixed-phase clouds during ARCPAC, Atmos. Meas. Tech., 3, 1683–1706, https://doi.org/10.5194/amt-3-1683-2010, 2010a. a
Lance, S., Brock, C. A., Rogers, D., and Gordon, J. A.: Water droplet calibration of the Cloud Droplet Probe (CDP) and in-flight performance in liquid, ice and mixed-phase clouds during ARCPAC, Atmos. Meas. Tech., 3, 1683–1706, https://doi.org/10.5194/amt-3-1683-2010, 2010b. a
Lasher-Trapp, S., Cooper, W., and Blyth, A.: Broadening of droplet size distributions from entrainment and mixing in a cumulus cloud, Q. J. Roy. Meteor. Soc., 131, 195–220, 2005. a
Lasher-Trapp, S., Leon, D. C., DeMott, P. J., Villanueva-Birriel, C. M., Johnson, A. V., Moser, D. H., Tully, C. S., and Wu, W.: A multisensor investigation of rime splintering in tropical maritime cumuli, J. Atmos. Sci., 73, 2547–2564, 2016. a
Lasher-Trapp, S., Scott, E. L., Järvinen, E., Schnaiter, M., Waitz, F., DeMott, P. J., McCluskey, C. S., and Hill, T. C.: Observations and modeling of rime splintering in Southern Ocean cumuli, J. Geophys. Res.-Atmos., 126, e2021JD035479, https://doi.org/10.1029/2021JD035479, 2021. a
Lawson, R. P., Woods, S., and Morrison, H.: The Microphysics of Ice and Precipitation Development in Tropical Cumulus Clouds, J. Atmos. Sci., 72, 2429–2445, https://doi.org/10.1175/JAS-D-14-0274.1, 2015. a
Lee, H. and Baik, J.-J.: A Comparative Study of Bin and Bulk Cloud Microphysics Schemes in Simulating a Heavy Precipitation Case, Atmosphere, 9, https://doi.org/10.3390/atmos9120475, 2018. a
Lehmann, K., Siebert, H., and Shaw, R.: Homogeneous and Inhomogeneous Mixing in Cumulus Clouds: Dependence on Local Turbulence Structure, J. Atmos. Sci., 66, 3641–3659, https://doi.org/10.1175/2009JAS3012.1, 2009. a, b, c, d, e
Lim, J.-S. and Hoffmann, F.: Life cycle evolution of mixing in shallow cumulus clouds, J. Geophys. Res.-Atmos., 129, e2023JD040393, https://doi.org/10.1029/2023JD040393, 2024. a
McFarquhar, G. M., Baumgardner, D., Bansemer, A., Abel, S. J., Crosier, J., French, J., Rosenberg, P., Korolev, A., Schwarzoenboeck, A., Leroy, D., Um, J., Wu, W., Heymsfield, A. J., Twohy, C., Detwiler, A., Field, P., Neumann, A., Cotton, R., Axisa, D., and Dong, J.: Processing of ice cloud in situ data collected by bulk water, scattering, and imaging probes: Fundamentals, uncertainties, and efforts toward consistency, Meteorol. Monogr., 58, 11–1, 2017. a
Mignani, C., Creamean, J. M., Zimmermann, L., Alewell, C., and Conen, F.: New type of evidence for secondary ice formation at around −15 °C in mixed-phase clouds, Atmos. Chem. Phys., 19, 877–886, https://doi.org/10.5194/acp-19-877-2019, 2019. a
Morrison, H. and Grabowski, W. W.: Modeling supersaturation and subgrid-scale mixing with two-moment bulk warm microphysics, J. Atmos. Sci., 65, 792–812, 2008. a
Morrison, H., Lawson, P., and Chandrakar, K. K.: Observed and Bin Model Simulated Evolution of Drop Size Distributions in High-Based Cumulus Congestus Over the United Arab Emirates, J. Geophys. Res.-Atmos., 127, e2021JD035711, https://doi.org/10.1029/2021JD035711, 2022a. a, b
Morrison, H., Peters, J. M., Chandrakar, K. K., and Sherwood, S. C.: Influences of environmental relative humidity and horizontal scale of subcloud ascent on deep convective initiation, J. Atmos. Sci., 79, 337–359, 2022b. a
Mossop, S.: Some factors governing ice particle multiplication in cumulus clouds, J. Atmos. Sci., 35, 2033–2037, 1978. a
Petters, M. D. and Kreidenweis, S. M.: A single parameter representation of hygroscopic growth and cloud condensation nucleus activity, Atmos. Chem. Phys., 7, 1961–1971, https://doi.org/10.5194/acp-7-1961-2007, 2007. a, b
Phillips, V. T., Patade, S., Gutierrez, J., and Bansemer, A.: Secondary Ice Production by Fragmentation of Freezing Drops: Formulation and Theory, J. Atmos. Sci., 76, 3031–3070, https://doi.org/10.1175/JAS-D-17-0190.1, 2018a. a, b
Phillips, V. T., Patade, S., Gutierrez, J., and Bansemer, A.: Secondary ice production by fragmentation of freezing drops: Formulation and theory, J. Atmos. Sci., 75, 3031–3070, 2018b. a, b, c, d
Planche, C., Wobrock, W., and Flossmann, A. I.: The continuous melting process in a cloud-scale model using a bin microphysics scheme, Q. J. Roy. Meteor. Soc., 140, 1986–1996, 2014. a
Portman, B. Z. and Connolly, P. J.: Bin-microphysics model, Zenodo [code], https://doi.org/10.5281/zenodo.20646114, 2026. a
Pruppacher, H. R. and Klett, J. D.: Microphysics of clouds and precipitation, 2nd edn., Kluwer Academic Publishers, Dordrecht, https://doi.org/10.1007/978-0-306-48100-0, 1997. a, b
Qu, Z., Korolev, A., Milbrandt, J. A., Heckman, I., Huang, Y., McFarquhar, G. M., Morrison, H., Wolde, M., and Nguyen, C.: The impacts of secondary ice production on microphysics and dynamics in tropical convection, Atmos. Chem. Phys., 22, 12287–12310, https://doi.org/10.5194/acp-22-12287-2022, 2022. a, b
Rangno, A. L. and Hobbs, P. V.: Ice particle concentrations and precipitation development in small polar maritime cumuliform clouds, Q. J. Roy. Meteor. Soc., 117, 207–241, 1991. a
Schwarzenboeck, A., Shcherbakov, V., Lefevre, R., Gayet, J.-F., Pointin, Y., and Duroure, C.: Indications for stellar-crystal fragmentation in Arctic clouds, Atmos. Res., 92, 220–228, https://doi.org/10.1016/j.atmosres.2008.10.002, 2009. a
Seidel, J. S., Kiselev, A. A., Keinert, A., Stratmann, F., Leisner, T., and Hartmann, S.: Secondary ice production – no evidence of efficient rime-splintering mechanism, Atmos. Chem. Phys., 24, 5247–5263, https://doi.org/10.5194/acp-24-5247-2024, 2024. a
Sotiropoulou, G., Sullivan, S., Savre, J., Lloyd, G., Lachlan-Cope, T., Ekman, A. M. L., and Nenes, A.: The impact of secondary ice production on Arctic stratocumulus, Atmos. Chem. Phys., 20, 1301–1316, https://doi.org/10.5194/acp-20-1301-2020, 2020. a
Takahashi, T. and Nagao, Y.: Possible high ice particle production during Graupel-Graupel collisions, J. Atmos. Sci., 52, 4523–4527, https://doi.org/10.1175/1520-0469(1995)052<4523:PHIPPD>2.0.CO;2, 1995. a, b
Tan, I., Zhou, C., Lamy, A., and Stauffer, C. L.: Moderate climate sensitivity due to opposing mixed-phase cloud feedbacks, Npj Climate and Atmospheric Science, 8, 86, https://doi.org/10.1038/s41612-025-00948-7, 2025. a
Topping, D. O., Connolly, P. J., and McFiggans, G. B.: Cloud droplet number enhanced by co-condensation of organic vapours, Nat. Geosci., 6, 443–446, https://doi.org/10.1038/ngeo1809, 2013. a
Vardiman, L.: The generation of secondary ice particles in clouds by crystal–crystal collision, J. Atmos. Sci., 35, 2168–2180, 1978. a
Wu, H., Marsden, N., Connolly, P., Flynn, M., Williams, P. I., Finney, D., Hu, K., Nott, G. J., Thamban, N. M., Bower, K., Blyth, A., Gallagher, M., and Coe, H.: The role of aerosols and meteorological conditions in shaping cloud droplet development in New Mexico summer deep-convective systems, Atmos. Chem. Phys., 25, 18409–18429, https://doi.org/10.5194/acp-25-18409-2025, 2025. a, b, c, d
Xu, X., Lu, C., Liu, Y., Luo, S., Zhou, X., Endo, S., Zhu, L., and Wang, Y.: Influences of an entrainment–mixing parameterization on numerical simulations of cumulus and stratocumulus clouds, Atmos. Chem. Phys., 22, 5459–5475, https://doi.org/10.5194/acp-22-5459-2022, 2022. a, b
Xu, X., Lu, C., Liu, Y., Luo, S., Zhou, X., Endo, S., Zhu, L., and Wang, Y.: Influences of an entrainment–mixing parameterization on numerical simulations of cumulus and stratocumulus clouds, Atmos. Chem. Phys., 22, 5459–5475, https://doi.org/10.5194/acp-22-5459-2022, 2022. a
Yeom, J. M., Yum, S. S., Liu, Y., and Lu, C.: A study on the entrainment and mixing process in the continental stratocumulus clouds measured during the RACORO campaign, Atmos. Res., 194, 89–99, 2017. a