the Creative Commons Attribution 4.0 License.
the Creative Commons Attribution 4.0 License.
 | 12 Jun 2026
Ozone formation sensitivity based on the secondary formaldehyde-to-nitrogen dioxide ratio (FNRsec) derived from ground-based remote sensing measurements and a chemical transport model
Nguyen Doan Thien Chi
Satoshi Inomata
Kohei Ikeda
Yange Deng
Royston Uning
Tamaki Fujinawa
Astrid Müller
Masatomo Fujiwara
Shungo Kato
Hisahiro Takashima
Sensitivity analysis is essential for developing effective ozone (O3) mitigation strategies. This study aims to extensively investigate the diurnal, seasonal, and vertical chemical sensitivity of O3 using a photochemical indicator, the secondary formaldehyde (HCHO)-to-nitrogen dioxide (NO2) ratio (FNRsec) as measured by Pandora remote-sensing spectrometers located across Japan. Region-specific FNRsec thresholds were determined using the GEOS-Chem chemical transport model. Surface concentrations and vertical column amounts of HCHO and NO2 were obtained from in situ measurements and Pandora spectrometers. The concentrations of HCHO and NO2 varied with season and altitude. Moreover, external pollution transport affected the vertical profiles and likely contributed to elevated concentrations. During exceedance events, the O3 sensitivity analysis showed that NOx-limited conditions were dominant in summer, transitional regimes in spring and fall. Vertically, ROx-limited conditions typically formed near the surface layers, followed by transitional regimes in the mid-levels, and NOx-limited regimes aloft. Therefore, O3 mitigation strategies should target not only the surface level but also elevated altitudes. This study contributes to fostering a comprehensive understanding of O3 sensitivity in the troposphere using FNRsec retrieved from Pandora measurements.
- Article
(7649 KB) - Full-text XML
-
Supplement
(5018 KB) - BibTeX
- EndNote


Tropospheric ozone (O3) is a central secondary pollutant formed through photochemical reactions involving its main precursors: nitrogen oxides (NOx, including NO and NO2) and volatile organic compounds (VOCs) in the presence of sunlight. Increases in tropospheric O3 levels negatively affect human health (Liu et al., 2018; Nuvolone et al., 2018), crop productivity (Mahmood et al., 2020; Ramya et al., 2023), and ecosystems (Feng et al., 2021; Grulke and Heath, 2020). Due to its well-known impacts, enormous efforts have been made in many cities and countries to mitigate O3 pollution (Hu et al., 2024; Chang et al., 2025; Shi et al., 2025). A major challenge that hinders O3 pollution mitigation strategy is that O3 formation results from non-linear photochemical reactions of its precursors, rather than from direct emissions (Mishra et al., 2024; Sadanaga et al., 2017). Internally, O3 production is initiated by the formation of peroxyl radical (ROx), generated through reactions between VOCs and hydroxyl radical (OH). O3 is subsequently produced when ROx radicals (HO2 or RO2) react with NO, leading to radical propagation (Kleinman et al., 2001; Sillman and He, 2002). The radical termination proceeds control the O3 production. These proceeds occur either through the reaction of OH with NOx to form nitric acid (referred as LNOx) or through radical-radical reactions (referred as LROx) (Schroeder et al., 2017).
Sensitivity analysis is of significant importance for developing effective O3 mitigation strategies. Tropospheric O3 production is conventionally categorized into three regimes: NOx-limited (or NOx-sensitive) regime, transitional regime, and radical-limited (also referred to as VOC-limited, VOC-sensitive, or NOx-saturated) regime. Depending on the sensitivity regime, controlling either NOx or VOC emissions can be an effective approach to mitigating O3 pollution. Sensitivity analyses have been conducted using various approaches, including model-based methods (Thorp et al., 2021), absolute sensitivity analysis (Sakamoto et al., 2019), and photochemical indicators such as the formaldehyde-to-nitrogen dioxide ratio (FNR) (Jung et al., 2022; Qian et al., 2024; Souri et al., 2023b), the robust H2O2-to-HNO3 ratio (Hammer, et al., 2002; Souri et al., 2023a), and the ratio (Abdi-Oskouei et al., 2022; Schroeder et al., 2017). O3 formation sensitivity can be visually represented using empirical kinetics modeling approach (EKMA) that produces curves between NOx and VOCs (Tonnesen and Dennis, 2000). However, measuring hundreds of VOC species is impractical. Meanwhile, HCHO reflects the VOC oxidation strength and is widely used as a proxy for VOCs reactivity (Irie et al., 2021). It should be noted that only secondary HCHO, produced photochemically from VOCs, accurately reflects the VOC oxidation capacity (Xue et al., 2022). Primary HCHO is directly emitted from anthropogenic activities; therefore, considering primary HCHO may be misleading in the assessment of VOCs reactivity. Previously, the HCHO-to-NOy ratio was used as an indicator of the chemical sensitivity. NOy consists of NOx and NOz (including HNO3, HONO, organic nitrates, etc.). The HCHO-to-NO2 ratio has been proposed as a better indicator because HCHO and NO2 have similar lifetimes and better represent the competition for OH radicals (Santiago et al., 2021; Tonnesen and Dennis, 2000). The FNR has inherent limitations in representing O3 chemistry because it does not account for other atmospheric dimensions, such as photolysis rates and water vapor (Souri et al., 2023a, 2026). A wide transition/ambiguous range of FNR values has been reported compared with the more precise ratio (Schroeder et al., 2017). Consequently, under certain conditions, especially under low photolysis rates, FNR may misclassify O3 formation sensitivity. Nonetheless, FNR remains a commonly used indicator because it can be readily obtained. In this study, we discuss the application of FNR under conditions of strong photolysis rates to minimize potential misclassification.
O3 formation occurs not only at the surface but also at elevated altitudes in the troposphere (Hu et al., 2024). Moreover, due to atmospheric convection, elevated O3 can be dispersed downward to the near-surface layer (Souri et al., 2021). Indeed, study of O3 production within the planetary boundary layer (PBL) is more important than at the surface alone. VOCs, such as isoprene emitted from vegetation, can be vertically transported to higher layer, where they produce ROx radicals and secondarily formed HCHO through photochemical processes. The vertical distributions of HCHO is therefore primarily driven by vertical transport and chemistry, which complicates the vertical formation of tropospheric O3 (Souri et al., 2023b). To investigate the vertical sensitivity of O3 formation, previous studies have employed column FNR observed by multi-axis differential optical absorption spectroscopy (MAX-DOAS) (Irie et al., 2021; Zhang et al., 2021; Ryan et al., 2023; Wang et al., 2025). Other studies have applied satellite-based techniques to assess the spatial sensitivity of O3 formation (Duncan et al., 2010; Jin et al., 2017; Jung et al., 2022). By combining satellite and ground-based remote sensing, column FNR sheds light on the development of spatially and temporally targeted O3 mitigation strategies.
The Pandora instrument is a passive UV-VIS spectrometer that observes solar photons over the 280–530 nm spectral range (Herman et al., 2009). The Pandonia Global Network (PGN) is a joint project supported by NASA and ESA, providing real-time, standardized, calibrated, and verified air quality data along with associated uncertainty estimates (https://www.pandonia-global-network.org/, last access: 1 September 2025). With more than 200 operational stations worldwide, the PGN has been widely applied in atmospheric research. In particular, due to their high accuracy, Pandora instruments have served as Fiducial Reference Measurement (FRM) for validating satellite observations (Douros et al., 2023; Judd et al., 2020; Kim et al., 2023) and airborne spectrometers (Choo et al., 2023; Judd et al., 2019). Additionally, Pandora observations have successfully highlighted the seasonal and diurnal variations of air pollutants (Herman and Mao, 2025; Liu et al., 2024). Mouat et al. (2024) reported a complex, heterogeneous environment near an airport using Pandora data. With its two viewing geometries, namely direct-sun and sky-scan modes, Pandora quantitatively observes total column amounts and lower tropospheric column amounts of several trace gases, including NO2, HCHO, and SO2 (Cede et al., 2021a, b). Furthermore, the instrument provides both column and vertical distribution information, making it appropriate for investigating the O3 formation sensitivity. Nevertheless, no studies have employed Pandora to analyze O3 formation sensitivity.
Increased levels of air pollution not only influence health but also place a burden on socioeconomic costs and healthcare resources (Xu et al., 2025). Japan is facing the problem of an aging population that is more vulnerable to air pollution. A modeling study predicted that 80 % of Japan's population could be exposed to the highest levels of O3 between 2030 and 2050 if no climate change mitigation policies are implemented (Chen et al., 2024). Looking back on history, the first episode of photochemical air pollution occurred in 1970, leading to the hospitalization of schoolchildren and high school students (Akimoto, 2017). In response, the government has implemented stringent emission controls since the 1980s, leading to a 56 % reduction in NOx and a 50 % reduction in VOCs emissions from 2000 to 2019 (Chatani et al., 2023). Despite the emission reductions, O3 level remain unpredictable due to non-linear photochemical processes and an increase in transboundary transport (Akimoto, 2017; Irie et al., 2021). Therefore, extensive studies on O3 formation are needed to more efficiently mitigate human exposure.
In this study, we first utilized both Pandora direct-sun and sky-scan modes to analyze O3 formation sensitivity at different altitudes and latitudes across Japan. The Japan Pandora Network (JPN), as part of the PGN, has established more than 10 stations, providing real-time vertical measurements. Because FNR threshold values depend on the study region, meteorological conditions, and emissions, we applied the GEOS-Chem chemical transport model to determine region-specific FNR thresholds for Japan. To improve accuracy, we accounted for secondary HCHO contributions. The findings of this study provide scientific insights into the application of Pandora measurements for mitigating regional O3 pollution.
2.1 Surface measurements
To obtain surface concentrations of HCHO and NO2, we conducted in situ measurements at Tokyo Metropolitan University (Tokyo-TMU) during the summer (1–19 July) and fall (17–31 October) of 2022. NO2 was measured using a cavity attenuated phase shift (CAPS) analyzer, which directly detects NO2 by measuring absorption around 450 nm, with a detection limit of less than 0.1 ppb (Choi et al., 2020). Meanwhile, HCHO was obtained using a selected ion flow tube mass spectrometer (SIFT-MS). SIFT-MS utilizes precursor ions such as H3O+, NO+, and for ionization and detection of target substances (Langford et al., 2023; Roberts et al., 2022). This instrument is recommended as an efficient method for the measurement of HCHO in both indoor and outdoor environments (Zogka et al., 2022).
Surface O3 concentrations were obtained from nearby air monitoring stations using the UV absorption method. These stations are operated by the Atmospheric Environmental Regional Observation System (AEROS) (https://soramame.env.go.jp/, last access: 24 July 2025).
2.2 Tropospheric column amounts and vertical profiles derived from Pandora observations
Pandora spectrometer consists of a head sensor, an optical fiber transmission system, and a charge-coupled device (CCD) used as a spectral detector. The data retrieval begins with the raw measurement spectra (L0). The corrected signal (L1) is obtained by applying complex corrections, such as dark correction, latency correction, etc. Spectral fitting (L2Fit) is performed to derive slant column densities relative to a reference spectrum using the differential optical absorption spectroscopy (DOAS) method. Finally, L2 data is produced by converting slant columns into vertical columns utilizing geometrical air mass factors (AMFs) for the direct-sun mode and analytical methods for the sky-scan mode (Rawat et al., 2025). The direct-sun mode measures total NO2 column with high precision (2.7×10¹⁴ molecules cm−2) and accuracy (2.7×10¹⁵ molecules cm−2). For total HCHO column, a statistical error of 6 % and a systematic error of 26 % have been reported (Spinei et al., 2018). The bias of the sky-scan measurement is approximately molecules cm−2 for NO2 and molecules cm−2 for HCHO (Tirpitz et al., 2021; Verhoelst et al., 2021). In this study, we explored both the tropospheric column FNR and vertical FNR profile by combining the direct-sun and sky-scan modes of Pandora. In the direct-sun mode, the tropospheric columns of NO2 and HCHO were derived by subtracting the stratospheric contribution. This stratospheric information was derived from the GEOS-Chem model (Sect. 2.3). In addition to column densities in the lower troposphere (up to an altitude of 3 km), the sky-scan measurements provided vertical distributions from the surface up to an altitude of 3 km with several layers of measurements. These profiles are crucial for examining the vertical characteristics of NO2 and HCHO, as well as O3 production in the troposphere.
We used the Pandora data at four JPN stations, Sapporo, Tsukuba-NIES, Tokyo-TMU, and Fukuoka. These stations, listed from north to south, were chosen to investigate FNR across different latitude environments. A brief description of these Pandora stations is provided in Table S1 in the Supplement. These Pandora instruments routinely alternate between direct-sun and sky-scan modes on a standard schedule (Cede et al., 2021a). Data processing was performed using the Blick software, which converts L0 (raw measurement spectra) to L2 products (e.g., vertical column densities, profiles, etc.). For FNR calculations, L2 products were employed. To maximize the available scientific data, we applied a new filtering method adopted from Rawat et al. (2025). The cut-off values were defined as the mean plus three standard deviations of the independence uncertainty for data with a high-quality flag. Data with independence uncertainty exceeding the cut-off value was removed. We also excluded data with a solar zenith angle (SZA)>75° (Mouat et al., 2024). Using this filtering method, the data volume increased significantly by 5 %–30 % for NO2 and 20 %–70 % for HCHO, compared to the filtering method that uses high and medium data quality flags.
2.3 Model simulations and determination of FNR thresholds
To characterize the FNR thresholds, we investigated the response of O3 to emission perturbations using the GEOS-Chem model. GEOS-Chem is a three-dimensional chemical transport model driven by assimilated meteorological observations from the Goddard Earth Observing System (GEOS) of the NASA Global Modeling and Assimilation Office (GMAO) (http://www.geos-chem.org, last access: 29 May 2025). To simulate O3, HCHO, and NO2 for the year 2022, we used the high-performance GEOS-Chem (GCHP) model, version 14.4.0 (The International GEOS-Chem User Community, 2024). GCHP is described by Eastham et al. (2018). Improved advection, resolution, performance, and community access are described by Martin et al. (2022). In the current study, we configured four model runs.
For Run-1, global anthropogenic emissions were based on the Community Emissions Data System version 2 (CEDSv2) (McDuffie et al., 2020). We used the Regional Emission inventory in ASia version 3.2.1 (REASv3.2.1) (Kurokawa and Ohara, 2020), as the regional anthropogenic emissions override the global anthropogenic emissions for Japan. Biomass burning emissions were taken from the Global Fire Emissions Database version 4 (GFED4) (Van Der Werf et al., 2017). Additionally, dust, sea salt aerosol, soil NOx, lightning NOx, and biogenic VOCs emissions were computed offline (Weng et al., 2020). All emissions were configured at run-time using Harmonized Emissions Component (HEMCO, version 3.9.3) (Lin et al., 2021). Table S2 provides a detailed description of the emission inventories used in the model simulation. For meteorology, we used MERRA-2 (0.5°×0.625°), a global atmospheric reanalysis data product. The full-chem model simulations use chemical mechanism kinetics following JPL/IUPAC recommendations (Bates et al., 2024). Photolysis frequencies for stratospheric and tropospheric chemistry are calculated with Cloud-J v7.7.3 (Prather, 2015). Stratospheric chemistry is represented by a linear chemistry mechanism, the Linoz algorithm (McLinden et al., 2000). The Linoz stratospheric chemistry package is recommended for GEOS-Chem simulations of O3. More details on the chemical mechanisms are available at http://www.geos-chem.org (last access: 29 May 2025). In our study, the simulations were run using a 10 min time step for chemistry and a 5 min time step for transport. Moreover, we applied the grid-stretching capability to focus on the Japan region. The grid-stretching procedure followed Bindle et al. (2021), with an initial cubed-sphere grid of C90, a target latitude of 37°, a target longitude of 137°, and a stretch factor of 4. This procedure yielded an average horizontal resolution of 27.78 km over Japan. The simulation generated the vertical extent from the surface to approximately 80 km with a 72 vertical-layer grid. Surface concentrations were obtained from the first model layer. The tropospheric column and the stratospheric column were separated using tropopause information. Furthermore, this troposphere-stratosphere distribution was used to derive the tropospheric column from the Pandora direct-sun observations.
Run-2 was the same as Run-1 but with all anthropogenic HCHO emissions turned off. Secondary HCHO reflects the VOCs activity through photolysis reactions. Previous studies have highlighted the importance of separating secondary HCHO from anthropogenic HCHO for a more accurate interpretation of the FNR (Hong et al., 2022; Xing et al., 2022; Xue et al., 2022). By comparing Run-1 and Run-2, we determined the contribution of primary HCHO and excluded it from the FNR calculation.
Run-3 and Run-4 were the same as Run-2 but with a 20 % reduction in regional NOx and VOC emissions, respectively. Ozone concentrations result from both in situ photochemical creation and external transport processes (Hong et al., 2022; Qian et al., 2024). A key advantage of the model-based method is that it allows us to exclude external transport processes, leading to a more precise classification of the O3 chemical regime. The external O3 transport influence was eliminated by subtracting Run-3 or Run-4 from Run-2. This step further reflects the response of O3 to changes in NOx and VOCs. Figure S1 in the Supplement shows an example of the surface O3 response to VOC and NOx emission reductions, resulting from GEOS-Chem simulations. Both negative and positive O3 changes were observed in response to NOx emission reduction. In contrast, VOC emission reduction consistently led to decreases in O3 levels. The Greater Tokyo Metropolitan Area was strongly influenced by these emission perturbations.
Regarding the responses, the O3 sensitivity regime was categorized following the method of Jin et al. (2017) and Jung et al. (2022). Instead of the term VOC-limited regime, here we used the term “ROx-limited regime” for more accuracy present for the radical-limited regime. A negative change in O3 owing to NOx emission reduction indicates a ROx-limited regime. A NOx-limited regime is defined when the positive change in O3 owing to VOC emission reduction is smaller than that from NOx emission reduction. The FNR threshold values for ROx-limited and NOx-limited regimes were determined as those corresponding to the 95th percentile of the cumulative probability distribution for each regime.
3.1 Model simulations of HCHO, NO2, and O3
3.1.1 Comparison with in situ and Pandora measurements
The correlation statistics between the GEOS-Chem simulations (Run-1) and in situ measurements are shown in Fig. 1, and those with Pandora are shown in Fig. 2. The GEOS-Chem simulations underestimated the surface HCHO concentrations, with a slope of 0.37, a correlation coefficient (R) of 0.32, and a root mean square error (RMSE) of 1.56 ppbv. Meanwhile, the GEOS-Chem overestimated the surface NO2 concentrations, with a slope of 1.34, R=0.48, and RMSE=14.65 ppbv. However, the GEOS-Chem simulations aligned better with the Pandora tropospheric column densities. Specifically, the correlation coefficients between GEOS-Chem and Pandora for HCHO and NO2 were 0.51 and 0.56, respectively, for Sapporo, 0.87 and 0.72 for Tsukuba-NIES, 0.78 and 0.54 for Tokyo-TMU, and 0.69 and 0.70 for Fukuoka. The RMSE varied from 2.99 to 5.93 Pmolec cm−2 for HCHO and from 2.11 to 5.71 Pmolec cm−2 for NO2. The surface conditions are likely more complex compared to the tropospheric column, which could explain why the GEOS-Chem model imperfectly captured the surface characteristics. Additionally, the local emission inventory implemented in the model was based on the year 2015, which might cause a significant bias in the model results. The diurnal cycles of HCHO and NO2 simulated by the GEOS-Chem model were compared with in situ measurements (Fig. S2) and Pandora (Fig. S3). The GEOS-Chem model successfully reproduced the surface diurnal cycle of HCHO. For surface NO2, the simulation captured the diurnal cycle in October quite well, but dramatically overestimated NO2 concentrations in July. Both the Pandora observations and the GEOS-Chem simulations showed a midday decrease in tropospheric NO2 columns. The GEOS-Chem model also simulated the growth in HCHO from the morning; however, it showed a slight decrease after 14:00 JST. A larger difference between the model and Pandora was observed at Tokyo-TMU, where primary HCHO emissions are significant.
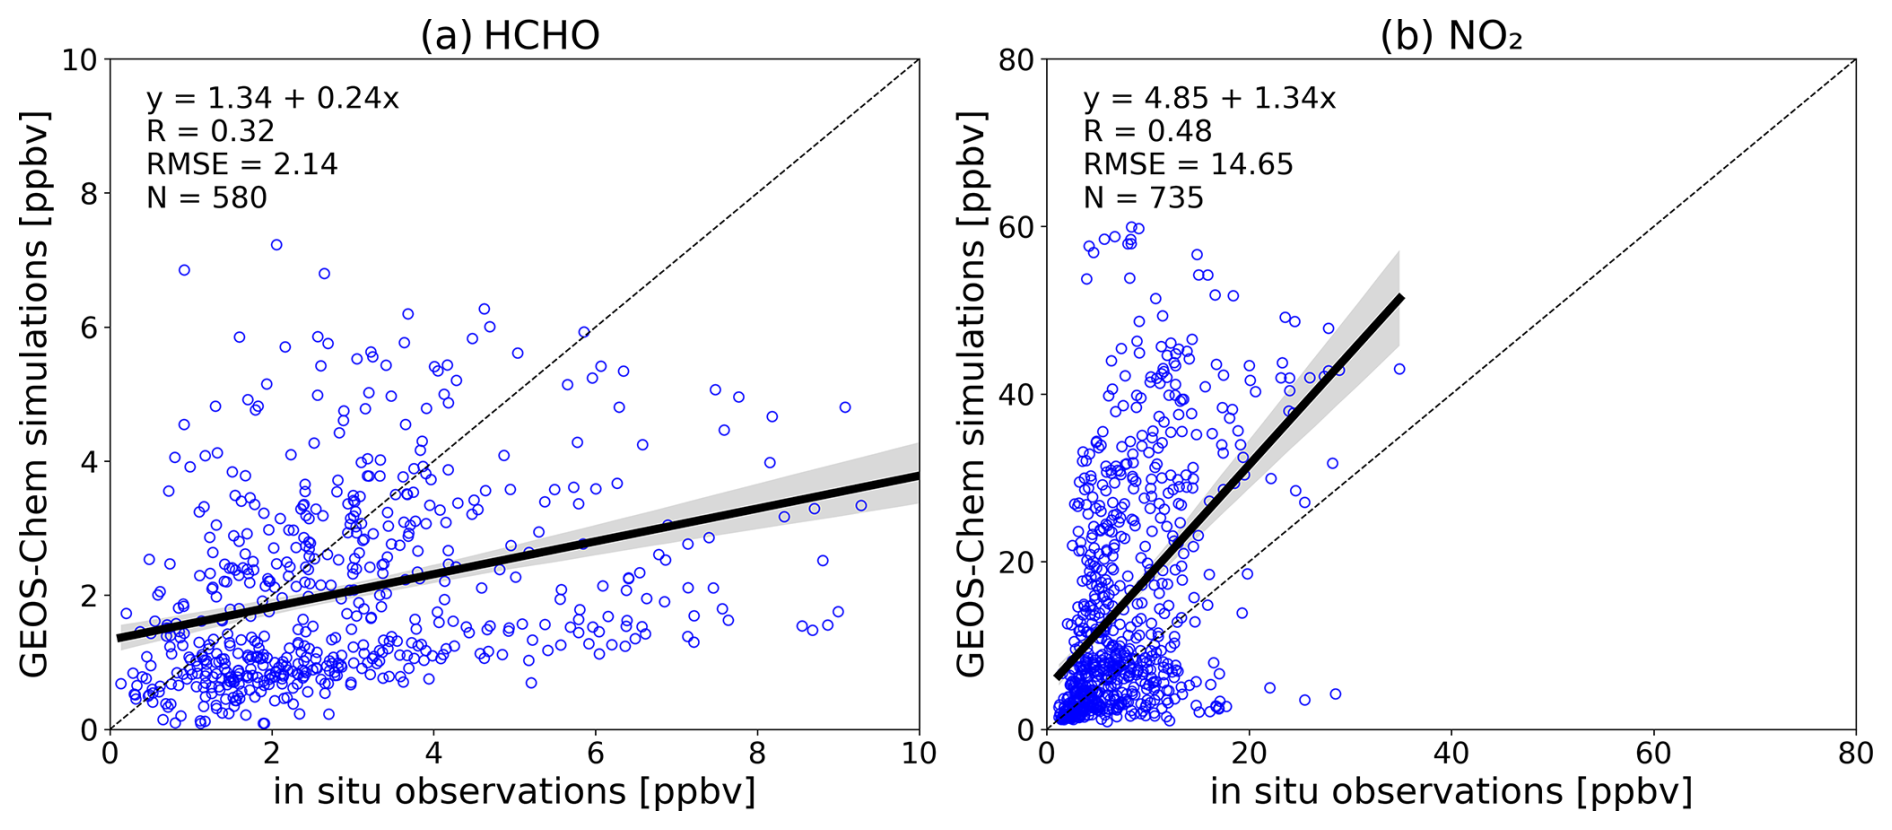
Figure 1Scatter plots of the surface HCHO (a) and NO2 (b) comparing in situ measurements with GEOS-Chem model simulation at Tokyo-TMU. The y axis represents GEOS-Chem simulations, and the x axis represents in situ observations. The dashed line indicates the 1:1 line.
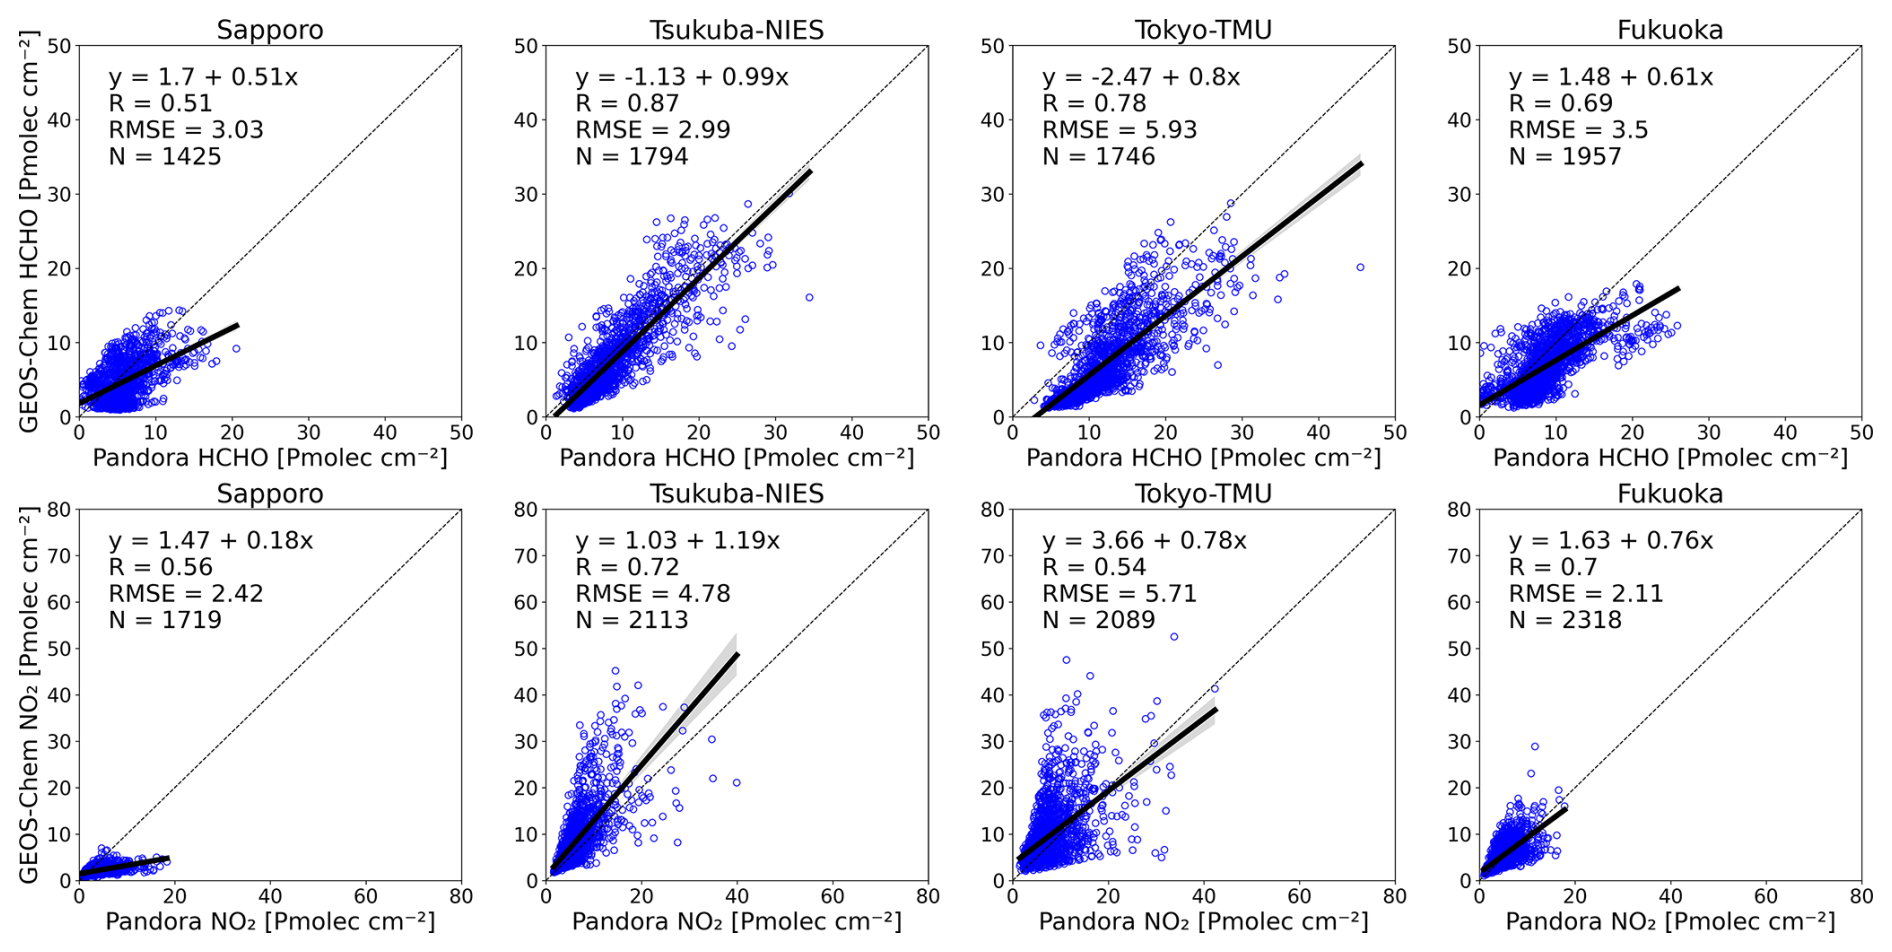
Figure 2Scatter plots of tropospheric vertical column densities of HCHO (top panels) and NO2 (bottom panels) between the Pandora direct-sun measurements and GEOS-Chem model simulations. The dashed line indicates the 1:1 line.
For surface O3, we compared the GEOS-Chem model performance with in situ measurements from nearby air monitoring stations at the four Pandora locations. The GEOS-Chem simulation was able to reproduce the inverted U-shaped pattern of O3 but showed positive biases (15–25 ppbv) (Fig. 3). The O3 depletion during nighttime was not well generated by the GEOS-Chem model, resulting in overestimated concentrations during photochemical periods. The faster nighttime depletion rate of O3 at Tokyo-TMU and Tsukuba-NIES suggests stronger deposition, which was not reflected by the model simulation. High positive biases in surface O3 have been reported in the literature (Travis et al., 2016; Travis and Jacob, 2019). The diurnal variations in mixed-layer dynamics and ozone deposition velocities in the model are one of the key factors contributing to this bias (Travis and Jacob, 2019). However, GEOS-Chem generally captured the observed variations in daytime O3, such as large fluctuations at Tokyo-TMU and Tsukuba-NIES, and narrower variations at Fukuoka and Sapporo. The agreement between model simulation and in situ measurements was moderate, with an R of 0.56, 0.61, 0.53, and 0.59 for Sapporo, Tsukuba-NIES, Tokyo-TMU, and Fukuoka, respectively. Overall, the GEOS-Chem model could capture O3 production at the study locations, indicating its suitability for investigating the O3 sensitivity regime.
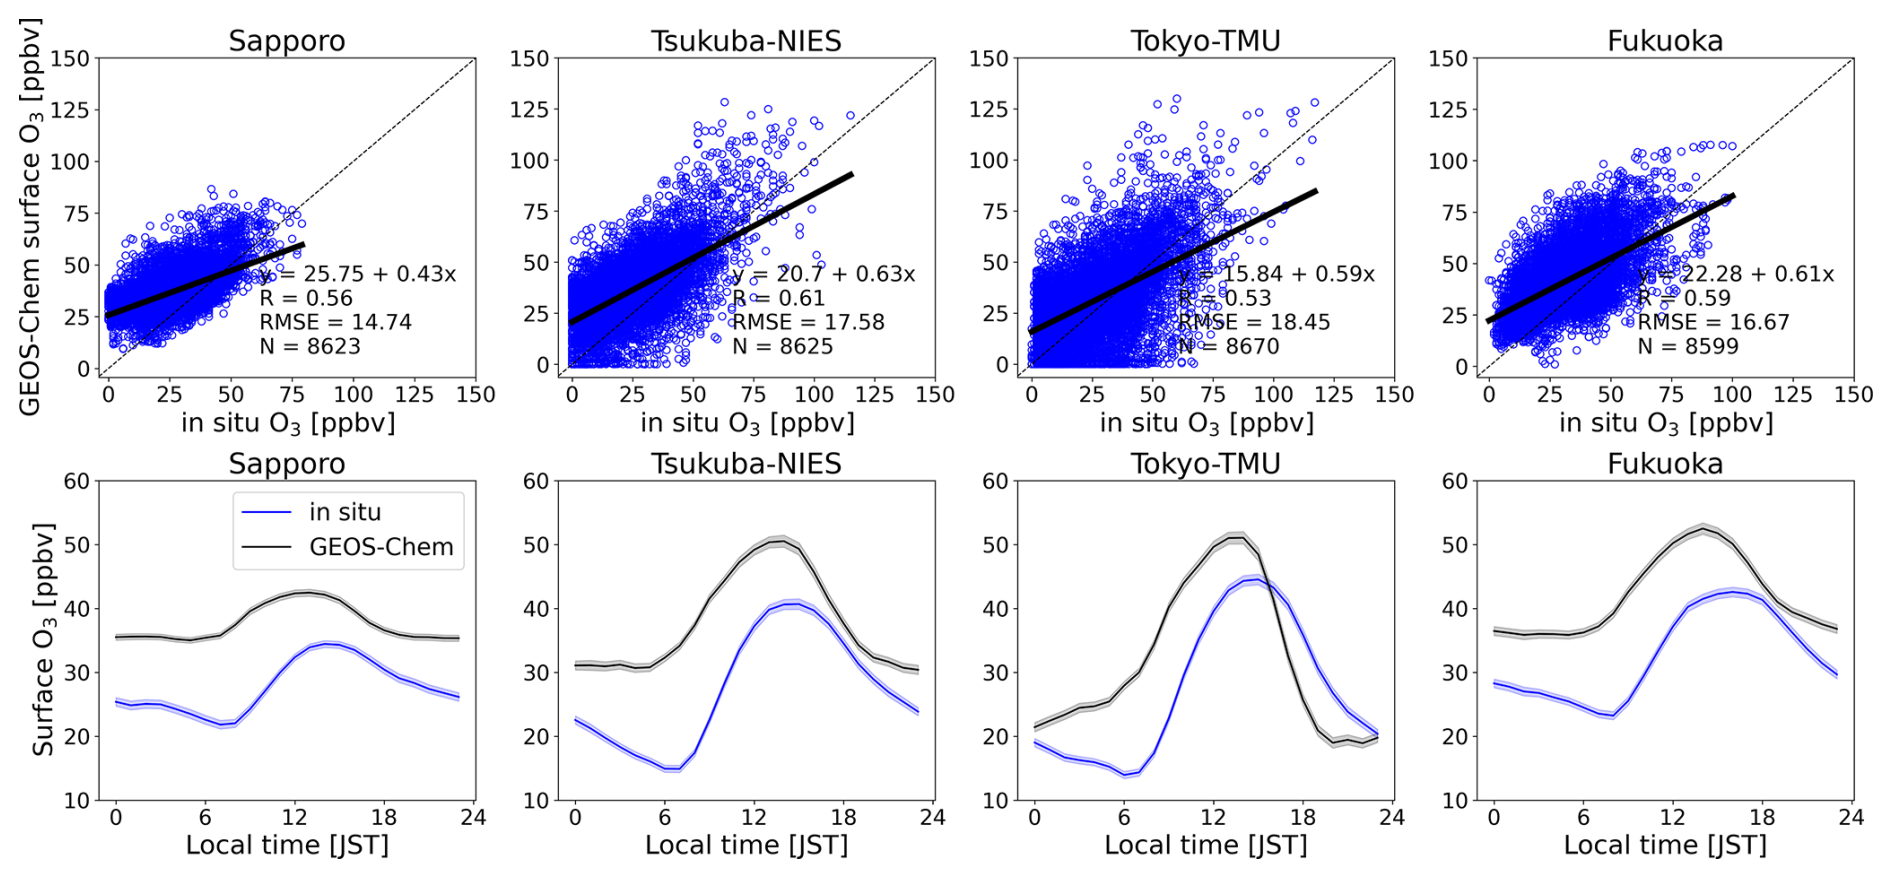
Figure 3Comparison of hourly surface O3 between the GEOS-Chem model and in situ measurements at the study locations. The top-row panels show scatterplots with linear regression equations. The bottom-row panels present the diurnal cycles of surface O3, with shaded error bands indicating ±1 standard error.
3.1.2 Contribution of secondary HCHO
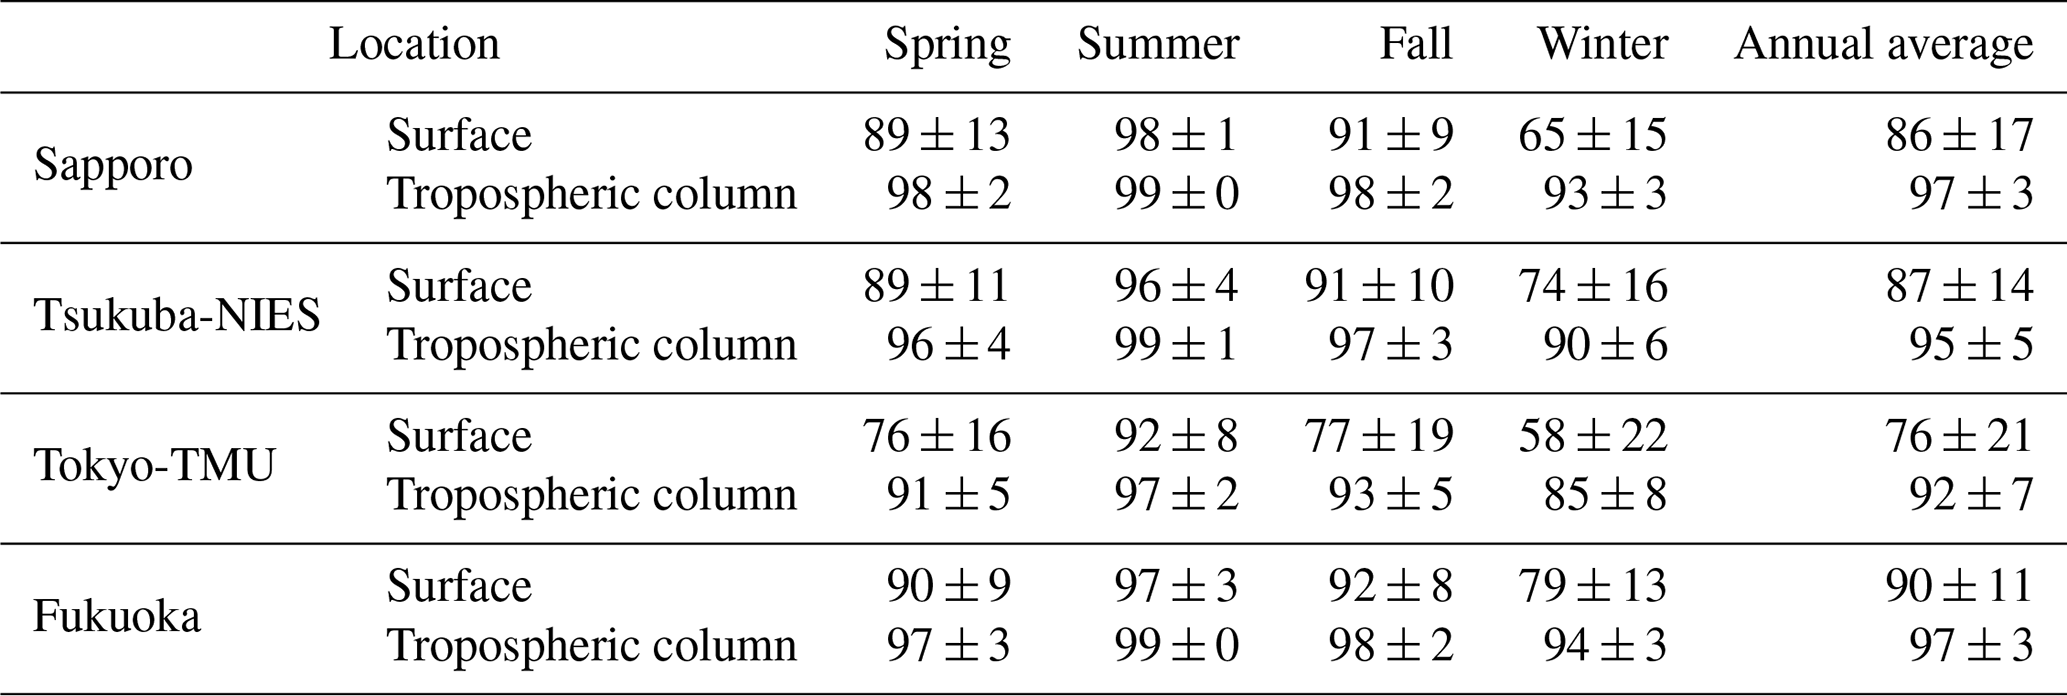
Table 1 shows the contributions of secondary HCHO at the study locations, derived from the GEOS-Chem simulations. We only considered daytime simulation from 08:00 to 16:00, when photochemical reactions actively occur. Basically, secondary HCHO contributed the majority at the surface level, with values of 86 %, 87 %, 76 %, and 90 % at Sapporo, Tsukuba-NIES, Tokyo-TMU, and Fukuoka, respectively. The contribution of primary HCHO was slightly higher at Tokyo-TMU (24 %). The secondary HCHO contribution increased in summer and decreased in winter. A diurnal variation of the contribution of secondary HCHO was observed, with the highest contribution around noon (not shown). For the tropospheric column, the seasonal contribution of secondary HCHO remained consistent. Additionally, the secondary HCHO contribution increased with altitude (Fig. S4a). The contribution at altitudes above 2 km was almost entirely attributed to secondary formation. This vertical distribution depends on primary emission sources, VOC oxidation, and photolysis rates. The higher photolysis frequency above 2 km compared to surface (Fig. S4b) therefore enhanced VOC oxidation as well as the magnitude of O3 production. Secondary HCHO effectively represents a proxy for VOC reactivity (Su et al., 2019; Xue et al., 2022). For more accurate FNR calculation, these secondary HCHO contributions from the model simulations were adopted for both in situ and Pandora measurements. The FNR using secondary HCHO is referred to as FNRsec. This approach is particularly important in areas with a high contribution of primary sources of HCHO, for example, urban and industrial areas.
Table 1Contribution of secondary HCHO (%) at the surface level and in the tropospheric columns, obtained from the GEOS-Chem model simulation at the JPN sites. The statistical values were considered only for 8 h daytime simulations (08:00 to 16:00).
3.2 Overall levels of HCHO and NO2
3.2.1 Surface levels
The diurnal plots of HCHO and NO2 obtained from in situ measurements at the Tokyo-TMU site are shown in Fig. S2. Near the surface, HCHO concentrations fluctuated within a narrow range of a few ppbv throughout the day. The minimum occurred at mid night, while the peak was observed around noon (in July) or late afternoon (in October). HCHO concentrations are generally expected to be higher in summer due to enhanced photochemical reactions driven by stronger solar irradiance and increased biogenic VOCs emissions from the local flora (Irie et al., 2021). However, interestingly, we found negligible differences in surface HCHO concentrations between July and October. The mean HCHO concentrations in July and October were 2.77 ± 1.73 and 3.06 ± 2.10 ppbv, respectively.
Surface NO2 concentrations were twice as high in October compared to July. In July, the NO2 mixing ratio ranged from 0.90 to 21.10 ppbv, with an average of 5.98 ppbv. In October, the surface NO2 ranged from 1.24 to 39.13 ppbv, with an average of 9.91 ppbv. Peaks in July were not clearly defined. In contrast, October showed a small peak in the morning and a larger one around 18:00, exhibiting traffic emissions, while minimum concentrations occurred at noon due to photochemical loss. The finding that the diurnal trend of NO2 was opposite to that of HCHO can be explained by photochemical reactions. These diurnal cycles have been well documented in previous studies (Irie et al., 2011; Itahashi and Irie, 2022).
3.2.2 Vertical column amounts
Figure 4 shows the variation in vertical column density (VCD) of HCHO measured by the Pandora spectrometer in 2022 at the study sites. The highest total VCD was observed at Tokyo-TMU, with a mean value of 12.30 ± 4.99 Pmolec cm−2. The levels at Sapporo, Tsukuba-NIES, and Fukuoka were 6.01 ± 2.84, 8.97 ± 5.05, and 9.05 ± 4.02 Pmolec cm−2, respectively. According to the GEOS-Chem simulations, the contribution of primary HCHO at Tokyo-TMU was higher than that at the other study sites (Table 1), indicating that the elevated column amount at Tokyo-TMU was largely influenced by local emission of anthropogenic sources. Clearly, the HCHO column amounts tended to be higher in summer and lower in winter. As discussed in Sect. 3.2.1, the difference in surface HCHO concentrations between July and October at Tokyo-TMU was not statistically significant. However, the total HCHO VCD measured by Pandora in July (16.47 ± 5.05 Pmolec cm−2) was 1.5 times higher than that in October (10.90 ± 2.05 Pmolec cm−2). Additionally, we found a strong relationship between column densities and surface concentrations, with a correlation of 0.7 for HCHO (Fig. S5). The correlation slope was about three times higher in July than in October, likely due to enhanced HCHO production at higher altitudes during summer. This suggests that column information is essential and complement to surface measurements for fully representing atmospheric HCHO.
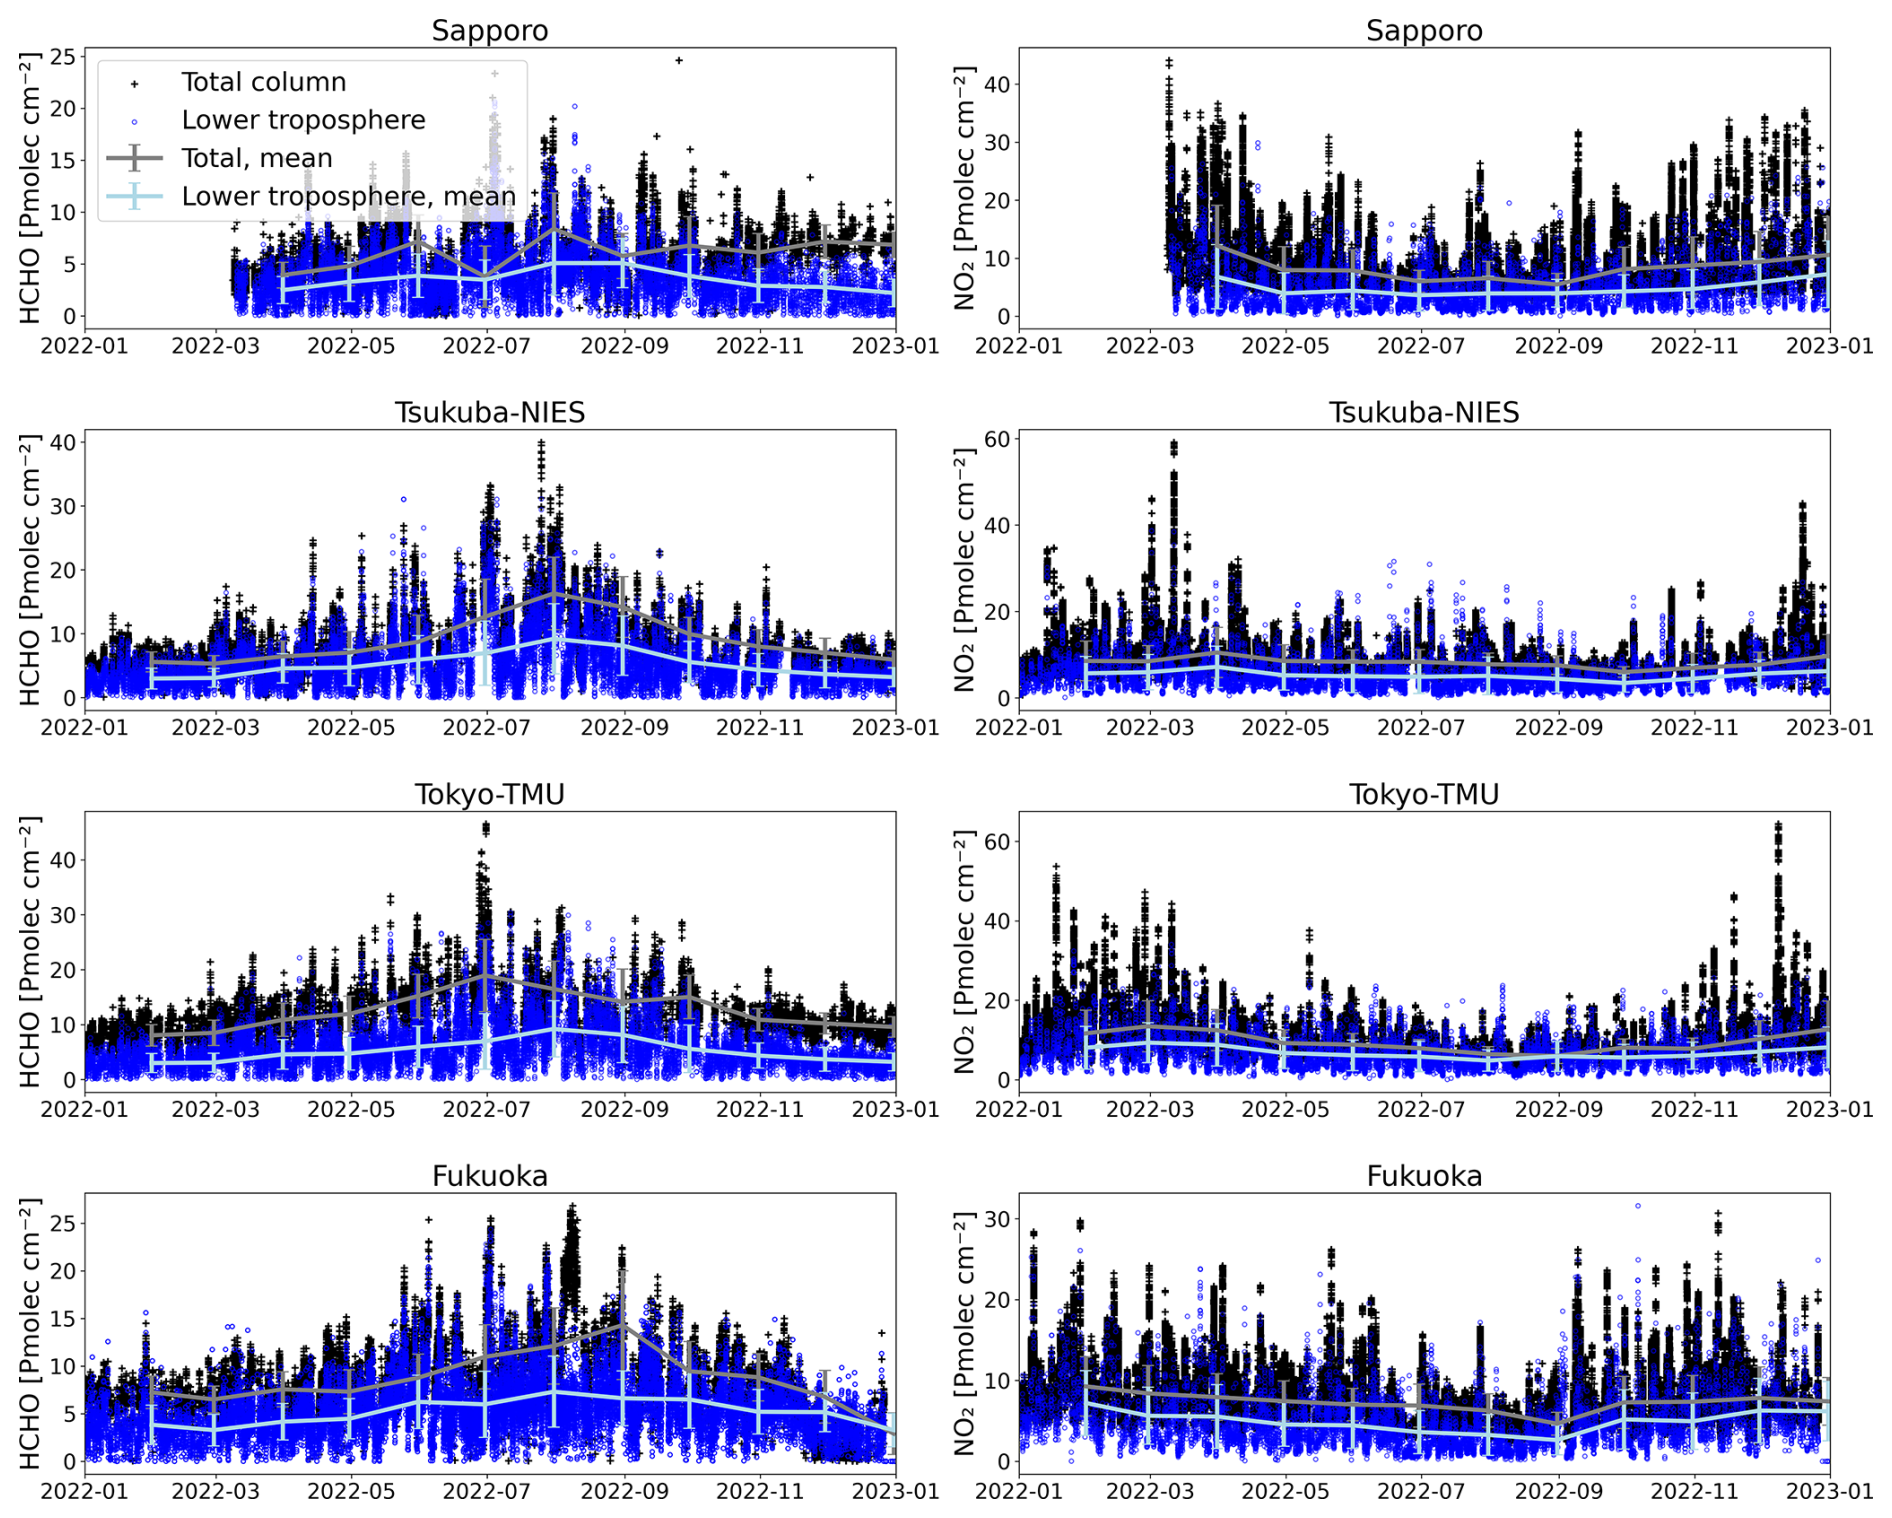
Figure 4Time series plots of vertical column densities of HCHO (left column) and NO2 (right column) at the study locations in 2022. Black plus signs represent total column densities derived from the Pandora direct-sun mode, whereas blue dots indicate lower tropospheric columns (up to an altitude of 3 km) derived from the Pandora sky-scan mode. Solid lines show monthly means, and error bars represent standard deviation. ( molecules cm−2).
The lower tropospheric column (up to an altitude of 3 km) of HCHO (obtained from the sky-scan mode) accounted for 59.14 % ± 18.83 % at Sapporo, 65.86 % ± 14.84 % at Tsukuba-NIES, 49.04 % ± 16.76 % at Tokyo-TMU, and 62.27 % ± 16.66 % at Fukuoka, relative to the total column amount (obtained from the direct-sun mode). This lower tropospheric contribution was dominant in summer, ranging from 61.27 % to 71.65 %, and decreased in winter, varying from 32.92 % to 54.93 %. However, it should be noted the error budget in Pandora direct-sun HCHO (Spinei et al., 2018). This error budget can overestimate the total column density. The diurnal cycle of the tropospheric HCHO column is shown in Fig. S3. The tropospheric column measured by Pandora exhibited a continuous increase from the morning to the afternoon. The accumulation of HCHO and the decreasing rate of photolysis in the afternoon can explain this daily cycle of HCHO (Souri et al., 2023b; Zhang et al., 2021).
In contrast to the HCHO trend, the NO2 column amounts reached their minimum in summer (Fig. 4). Tokyo-TMU was also polluted with NO2, with an average of 9.73 ± 4.99 Pmolec cm−2 (12.55 ± 6.52 Pmolec cm−2 in winter and 6.80 ± 2.17 Pmolec cm−2 in summer), followed by Tsukuba-NIES with an average of 8.33 ±3.88 Pmolec cm−2 (8.83 ± 4.42 Pmolec cm−2 in winter and 7.84 ± 2.50 Pmolec cm−2 in summer). The total NO2 VCDs at Sapporo and Fukuoka were 7.92 ±4.45 Pmolec cm−2 and 7.22 ± 3.01 Pmolec cm−2, respectively. The lower tropospheric column contributed 51.38 % ±20.86 %, 53.95 % ± 18.06 %, 59.55 % ± 16.79 %, and 56.29 % ± 18.83 % to the total column at Sapporo, Tsukuba-NIES, Tokyo-TMU, and Fukuoka, respectively. We also found good agreement for NO2 between lower tropospheric column densities and surface concentrations, with a correlation of 0.6 (Fig. S5). The slope was similar in July and October, reflecting that NO2 is mainly concentrated near the surface.
3.2.3 Vertical profiles
The Pandora sky-scan mode measures scattered sunlight at several angles, yielding the vertical profiles. The resolution of the vertical profiles depends on the number of scanning angles, referred to as elevation scan routines (i.e., detailed elevation scan and quick elevation scan). Here, we used detailed elevation scans around noon to investigate the vertical distribution of HCHO and NO2. The detailed elevation scan routine observes 14 angles without using filter and 12 angles using the U340 filter, respectively (Rawat et al., 2025). We converted these partial vertical columns to mixing ratios, assuming well-mixed conditions in each layer and the ideal gas law. To obtain the seasonal vertical distributions of HCHO and NO2, after extrapolating into 0.1 km bins, the profiles were averaged by altitude. Since the altitudes of these four Pandora stations ranged from 45 to 135 m, and the maximum vertical sensitivity of the sky-scan mode was generally within 2 km, we only considered the vertical profile from 0.2 to 2 km. Figures 5 and 6 present the seasonal and time-series vertical profiles of HCHO and NO2, respectively.
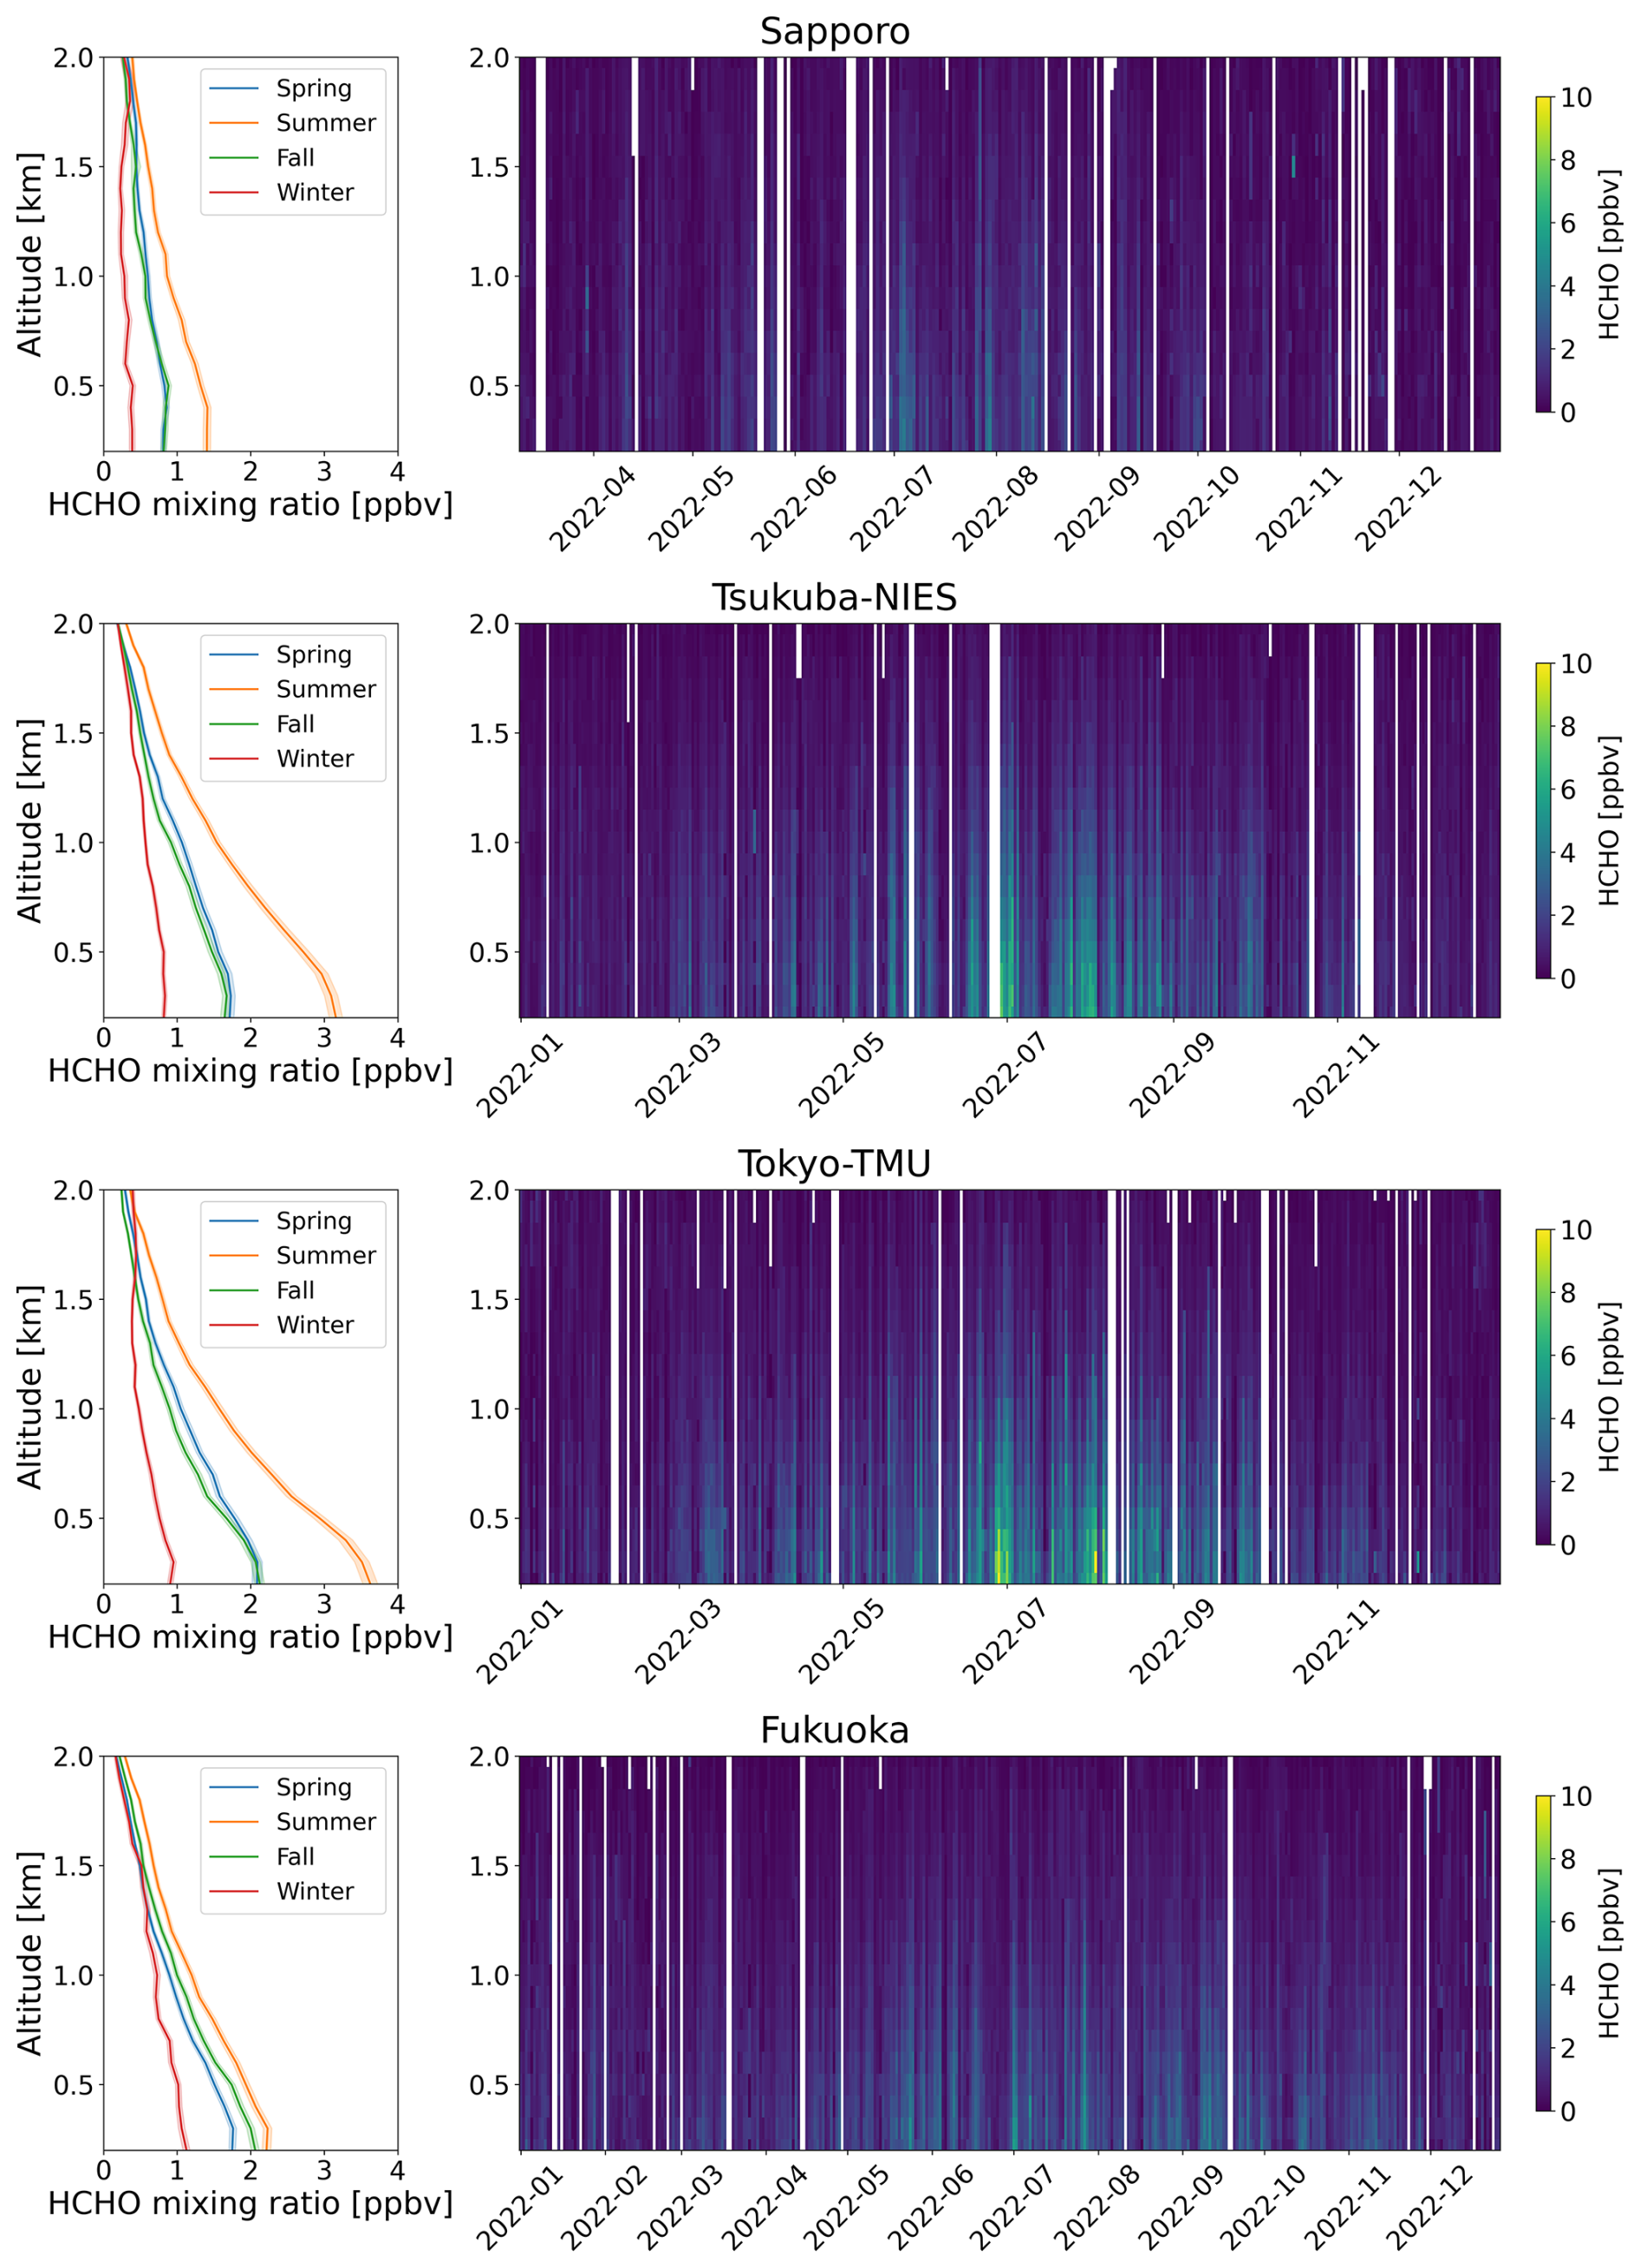
Figure 5Seasonal (first column) and time series (second column) vertical profiles of HCHO derived from the Pandora sky-scan observations around noon (12:00 ± 02:00). The seasonal vertical profiles are shaded with error bands indicating ±1 standard error. Color bars exhibit HCHO mixing ratio.
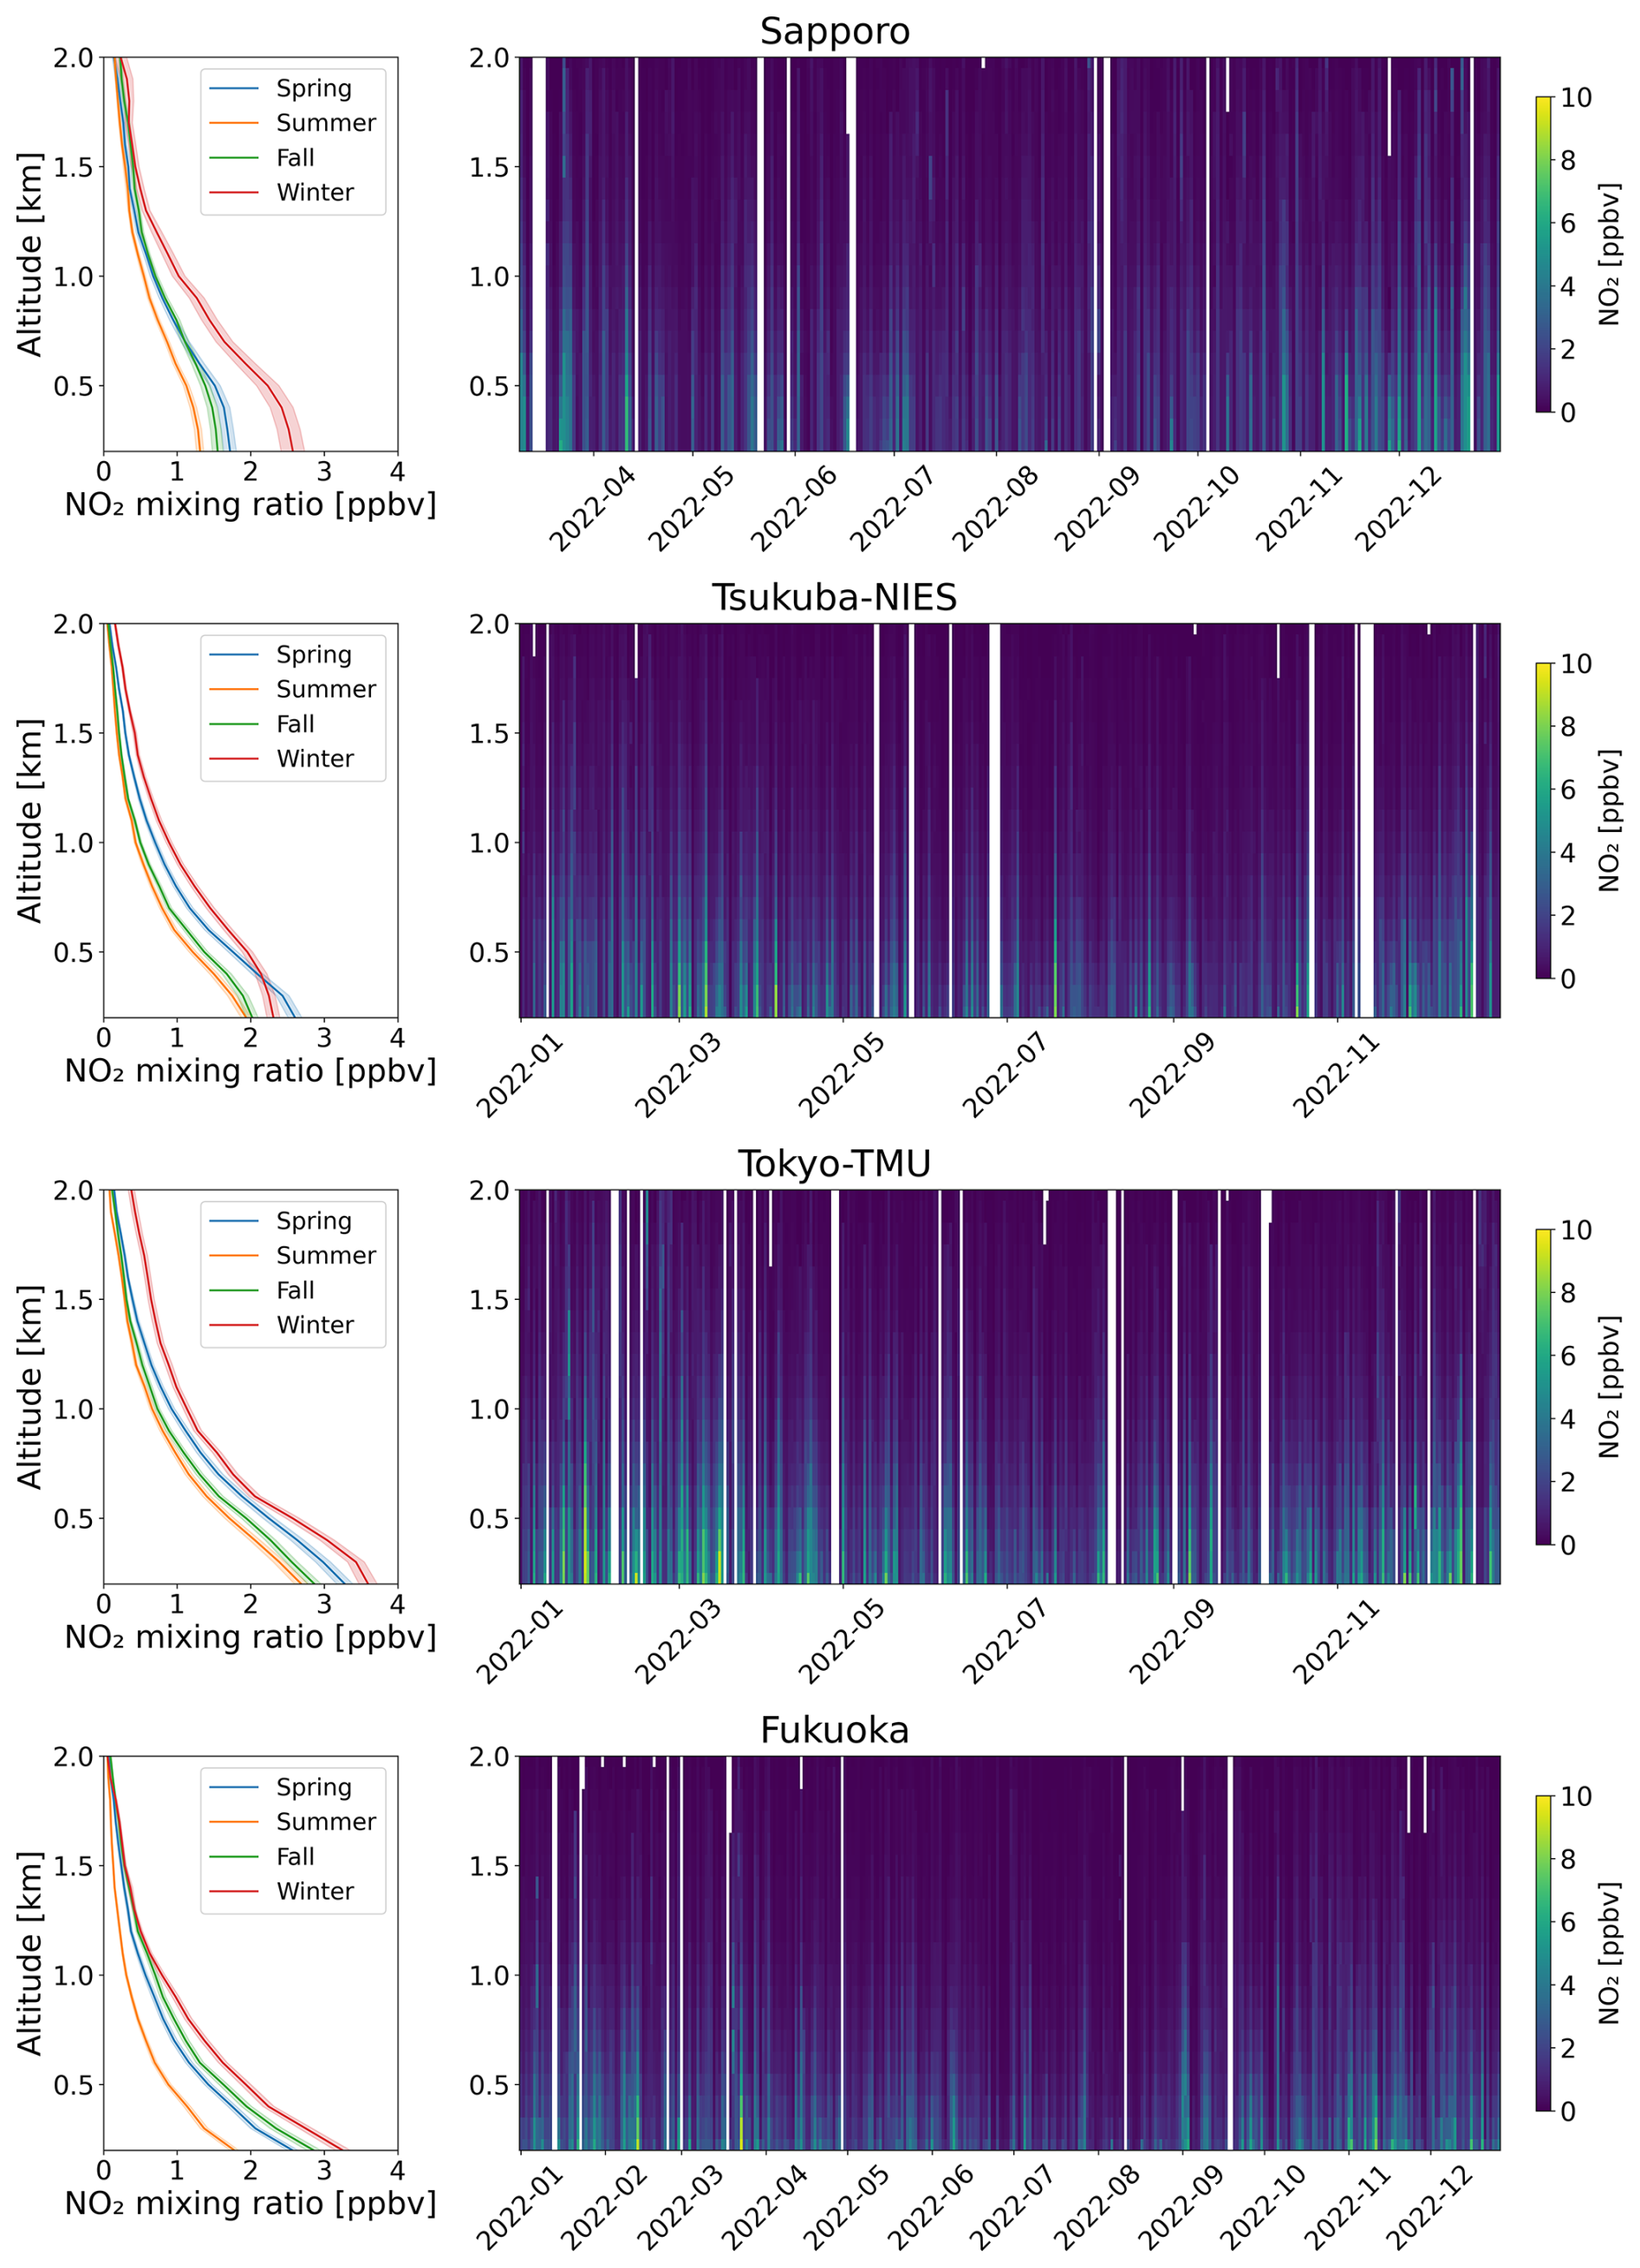
Figure 6Seasonal (first column) and time series (second column) vertical profiles of NO2 derived from the Pandora sky-scan observations around noon (12:00 ± 02:00). The seasonal vertical profiles are shaded with error bands indicating ±1 standard error. Color bars exhibit NO2 mixing ratio.
The HCHO productions were significantly enhanced during summer due to stronger solar intensity and increased biogenic VOCs emissions such as isoprene. Secondary HCHO is associated with isoprene emitted from vegetation (Ryan et al., 2023). Isoprene emissions exhibit a markedly positive exponential relationship with temperature (Ryan et al., 2023; Wang et al., 2024). At higher temperatures in summer, more isoprene is emitted, which triggers the formation of secondary HCHO. The higher HCHO production at Tsukuba-NIES and Tokyo-TMU compared to Fukuoka suggests that, in addition to biogenic VOCs, anthropogenic VOCs play an important role in HCHO production (Fig. S6). Anthropogenic VOC emission accounted for 20 % of the total emission at the two locations. The summertime increase in anthropogenic VOCs emissions is likely driven by enhanced evaporation processes (Wu et al., 2024). The vertical variation of HCHO appeared to be relatively heterogeneous in winter. However, we found less significant changes in the seasonal profiles at the highest latitude site (Sapporo). Vertically, HCHO formation was observed up to 2 km, which is consistent with previous studies (Lin et al., 2022; Shi et al., 2025). HCHO extended to higher altitudes could be attributed to vertical and horizontal transport and chemistry (Souri et al., 2023b). For a more accurate FNR analysis, it is essential to consider not only surface but also elevated measurements (Souri et al., 2025).
The NO2 distributions more rapidly decreased with increasing altitude compared to HCHO. Unlike HCHO, the bulk of NO2 was generally concentrated below 1 km because NOx emissions are mainly near the surface (i.e., traffic). Normally, the vertical NO2 profile was enhanced in winter. However, we also observed several spikes of NO2 during summer at Tsukuba-NIES. Generally, NO2 concentrations are low in summer because of photochemical loss. The enhanced NO2 profiles observed at Tsukuba-NIES during summer could be attributed to the transport of emissions from surrounding regions. Irie et al. (2021) reported that summertime air masses passing over Tokyo Bay area and reaching Tsukuba lead to a greater O3 concentrations at this site.
To investigate whether any external transport affected the vertical profiles, we applied the Hybrid Single-Particle Lagrangian Integrated Trajectory (HYSPLIT) model for the Tsukuba-NIES case. The model, developed by the National Oceanic and Atmospheric Administration (NOAA) Air Resources Laboratory (ARL), has been widely used for atmospheric trajectory and dispersion calculations (Stein et al., 2015). We simulated 48 h backward trajectories for the year 2022, with endpoints at 13:00 local time (JST) at Tsukuba-NIES, as a case study. The backward trajectories were assigned into four clusters: c1, c2, c3, and c4. The number of clusters was optimized using total spatial variance (TSV) analysis. The cluster frequencies were 15 %, 40 %, 36 %, and 9 % for c1, c2, c3, and c4, respectively (Fig. S7). Figure S8 shows the vertical profiles of NO2 at Tsukuba-NIES during summer as a function of air mass clusters. During summer, cluster c1 occurred on only one day, clusters c2, c3, and c4 occurred on 34, 33, and 24 d, respectively. Thus, we observed elevated in NO2 profiles during cluster c4, in which air masses passed through urban Tokyo and industrial areas, transporting anthropogenic pollutants to the Tsukuba-NIES site. This suggests that external pollution transport affected the vertical distributions of NO2, and consequently, O3 production.
3.3 Identification of the O3 sensitivity regime
The O3, HCHO, and NO2 outputs from the GEOS-Chem model simulations were utilized to identify the O3 sensitivity regime (Fig. 7). From the scatter plots, the responses of surface O3 to NOx and VOC emission reductions at Sapporo and Fukuoka were within 5 ppbv, which were less pronounced than those at Tsukuba-NIES and Tokyo-TMU (within 10 ppbv). A positive O3 difference indicates that the emission reduction results in a decrease in surface O3. Conversely, a negative difference means that the emission reduction enhances surface O3 concentrations. In our study, generally, VOC emission reductions led to a decrease in surface O3 concentrations. NOx emission reductions could either decrease O3 through photochemical reaction or increase it due to reduced LNOx processes.
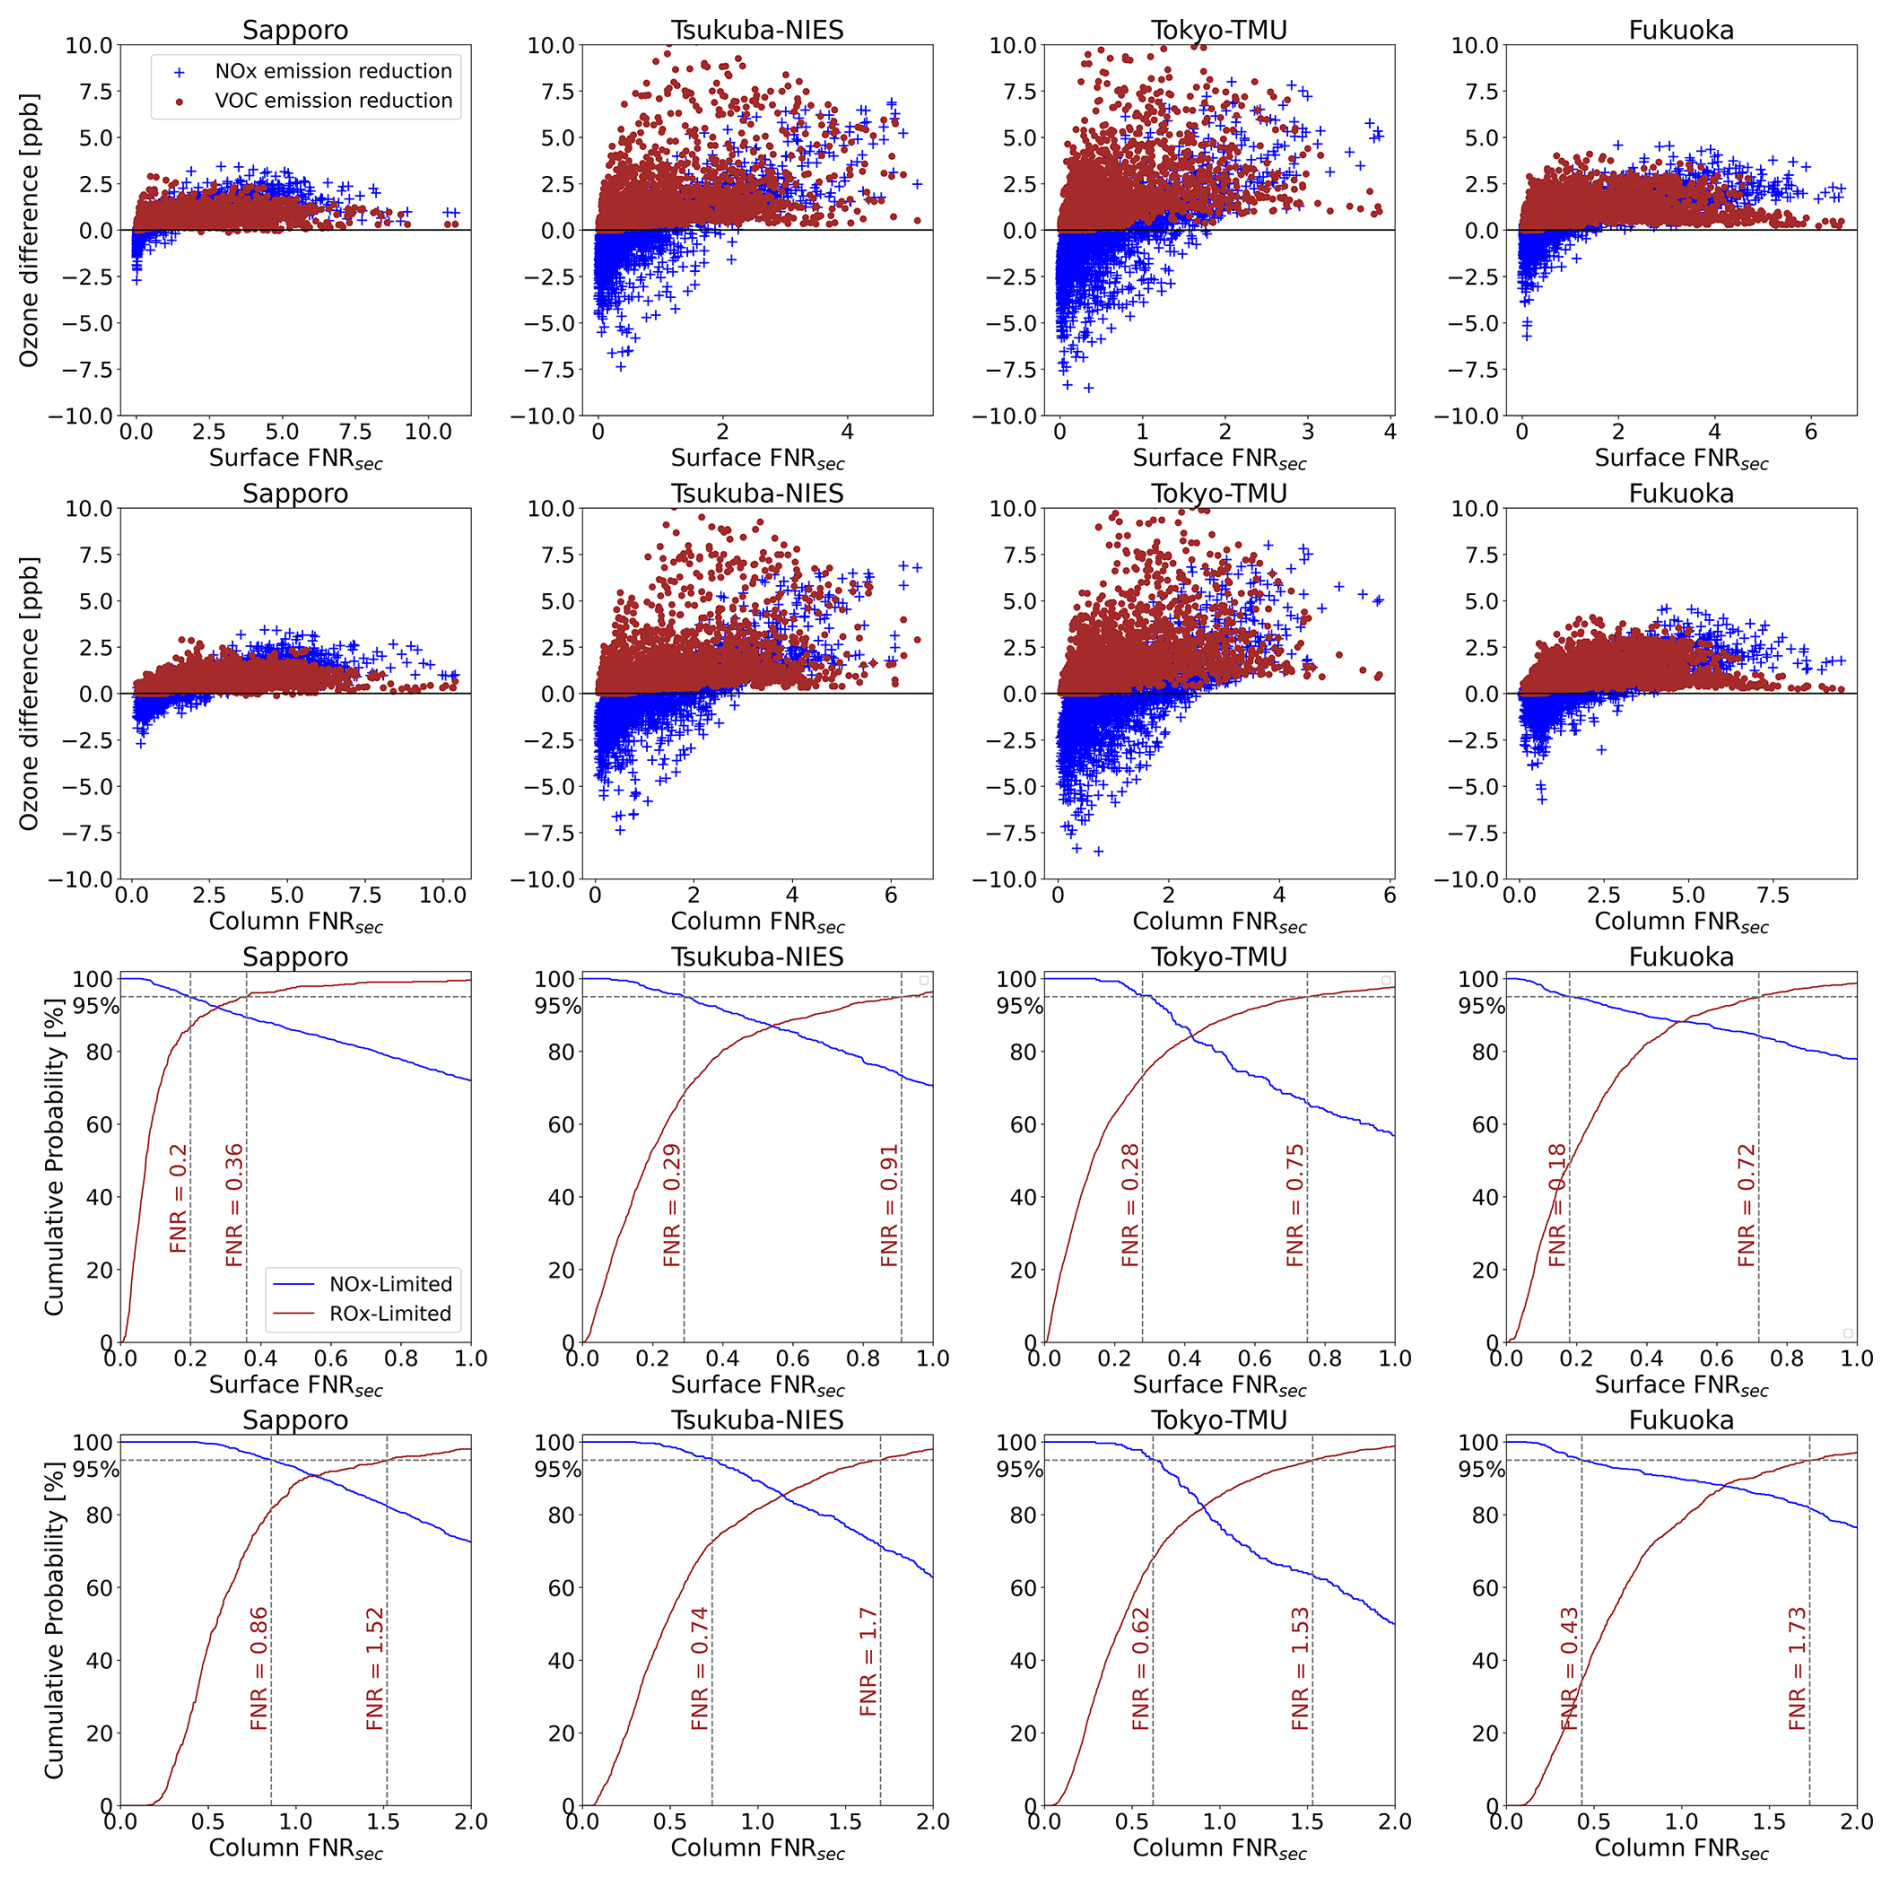
Figure 7Response of surface O3 to NOx and VOC emission perturbations resulting from the GEOS-Chem simulations. The scatter plots depict the O3 difference between GEOS-Chem Run-2 and Run-3 (blue), and between Run-2 and Run-4 (brown), as a function of surface FNRsec (first row) and tropospheric column FNRsec (second row). The VOC-limited regime was associated with negative change in O3 due to NOx emission reduction. The NOx-limited regime was identified when the positive change in O3 due to VOC emission reductions was smaller than that from NOx emission reductions. Line plots show the cumulative probability of NOx-limited (blue) and VOC-limited (brown) conditions as a function of surface FNRsec (third row) and tropospheric column FNRsec (fourth row). The FNRsec threshold values (vertical dashed lines) for VOC-limited and NOx-limited regimes were determined as those corresponding to the 95th percentile (horizontal dashed lines) of the cumulative probability distribution for each regime.
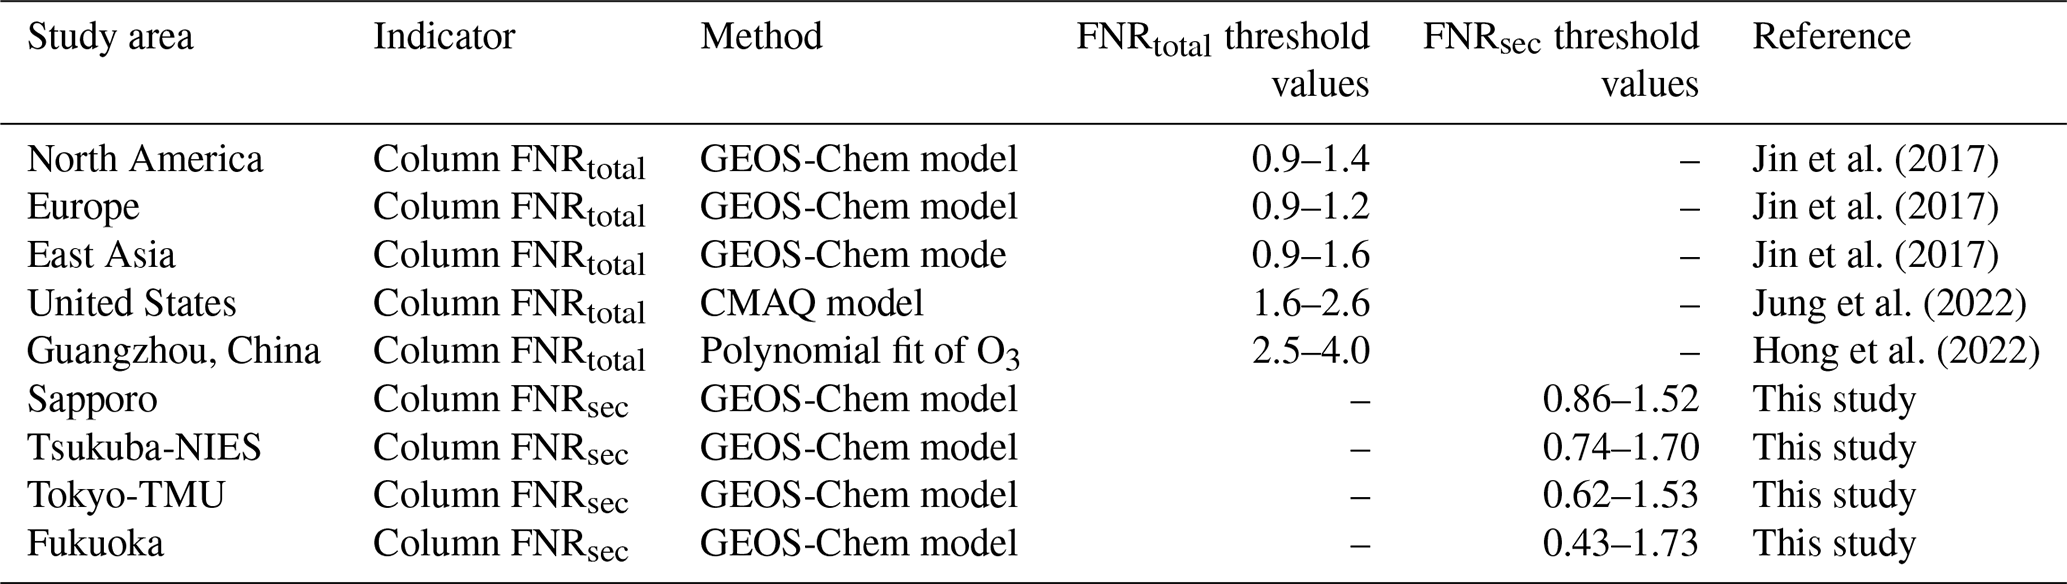
The FNRsec threshold values were determined using both surface and column information (Fig. 7, cumulative graphs). Based on surface FNRsec, the ROx-limited conditions were distinguished with thresholds of FNRsec<0.2 for Sapporo, <0.29 for Tsukuba-NIES, <0.28 for Tokyo-TMU, and <0.18 for Fukuoka. The NOx-limited regimes were associated with FNRsec>0.36 for Sapporo, and >0.91, >0.75, and >0.72 for Tsukuba-NIES, Tokyo-TMU, and Fukuoka, respectively. The surface FNRsec thresholds were generally lower than the column FNRsec. The finding of higher column FNR is consistent with previous studies (Jin et al., 2017; Souri et al., 2023a). The column FNRsec thresholds for the ROx-limited regimes and NOx-limited regimes at the Sapporo site were <0.86 and >1.52, respectively. The corresponding column FNRsec threshold ranges for Tsukuba-NIES, Tokyo-TMU, and Fukuoka were 0.74–1.7, 0.62–1.53, and 0.43–1.73, respectively. The transitional regime seemed to occur over a wider range of column FNRsec values at lower latitudes (e.g., Fukuoka) compared to higher latitudes (e.g., Sapporo). The differences between surface and tropospheric column FNRsec could be attributed to the vertical characteristics of HCHO and NO2. NO2 molecules were concentrated near the surface, while HCHO was present in the higher layers. As a result, surface FNRsec did not account for HCHO at higher layers, leading to lower threshold values. The surface and column FNRsec thresholds identified in this study are consistent with those reported by Jin et al. (2017) for East Asia (Table 2).
For the column, the transition range for Sapporo was defined as 0.86–1.52 where the cumulative probability of NOx-limited and ROx-limited condition reached 95 %, corresponding to a 5 % probability of misclassification. Consequently, 15 % of NOx-limited and 15 % of ROx-limited conditions were incorrectly classified as transitional (Fig. 7). Similarly, the probabilities of misclassifying NOx-limited and ROx-limited conditions as transitional were 20 % and 25 %, respectively, for Tsukuba-NIES, 35 % and 25 % for Tokyo-TMU, and 15 % and 60 % for Fukuoka. Notably, the probability of misclassification of ROx-limited condition at Fukuoka was higher than at the other locations. Because we simulated for the year 2022, this uncertainty could be reduced by extending the model simulations to longer time periods.
Table 2 presents the column FNR regime thresholds related to surface O3 sensitivity from previous studies. These threshold values vary depending on the methodology, geographic region, and atmospheric conditions. The FNR thresholds using both primary and secondary HCHO (FNRtotal) are higher than those using only secondary HCHO (FNRsec). The transitional regimes are reported for a column FNRtotal of 2.5–4.0 in Guangzhou, China (Hong et al., 2022), and 1.6–2.6 in United States (Jung et al., 2022), whereas the column FNRsec thresholds identified in our study were lower than 2. Column FNR regime threshold values are useful for examining global O3 production, as both satellite and ground-based remote sensing techniques offer extensive spatial coverage (Inoue et al., 2019; Ryan et al., 2023; Santiago et al., 2021).
Table 2Comparison of column FNR threshold values for O3 sensitivity in previous studies using different methods.
3.4 O3 sensitivity during exceedance events
The diurnal and seasonal cycles of surface and column FNR are shown in Figs. S9 and S10. Surface FNRsec developed in the early morning and decreased in the afternoon. During the 8 h daytime period (08:00 to 16:00), the average surface FNRsec was 0.99 ± 0.46 in July and 0.72 ± 0.64 in October. Using tropospheric vertical column densities derived from Pandora sky-scan observations, the column FNRsec exhibited a higher value compared to those from surface measurements. Like surface FNRsec, the tropospheric column FNRsec grew during the morning. The highest column FNRsec values were found during the summer months (JJA). In contrast, these values were normally below 1 in winter (DJF).
In this section, we analyze the O3 formation sensitivity focusing on polluted days when the maximum daily 8 h averaged surface O3 (MDA8) exceeded 60 ppbv. We identified 8, 30, 38, and 43 exceedance events in 2022 at Sapporo, Tsukuba-NIES, Tokyo-TMU, and Fukuoka, respectively. During O3 exceedance events, photochemical reactions were typically strong, allowing us to determine the sensitive regime with minimum biases. Because the model simulations did not reproduce surface NO2 and HCHO as well as the column densities, we will focus only on column FNR. Although Pandora direct-sun mode provides highly accurate NO2 measurements, the HCHO retrieval attains non-negligible error budget, which can cause more uncertainty and bias in the FNR. In contrast, Pandora sky-scan mode provides lower tropospheric columns of NO2 and HCHO and yields lower uncertainty in the HCHO data product. Additionally, the sensitivity diagnosis within the boundary layer is better represent tropospheric O3 production processes. Therefore, we discuss instead the column FNRsec derived from Pandora sky-scan observations which is sensitive to the boundary layer. We averaged available sky-scan observations around noon (12:00 ± 02:00), when photolysis rates are highest. Figures 8–11 present column FNRsec during O3 polluted events at Sapporo, Tsukuba-NIES, Tokyo-TMU, and Fukuoka, respectively. The advantage of Pandora observations is the ability to examine daily O3 production in greater detail and investigate specific periods such as exceedance events. Based on the analysis of these events, policy strategies could be proposed to help mitigate O3 pollution.
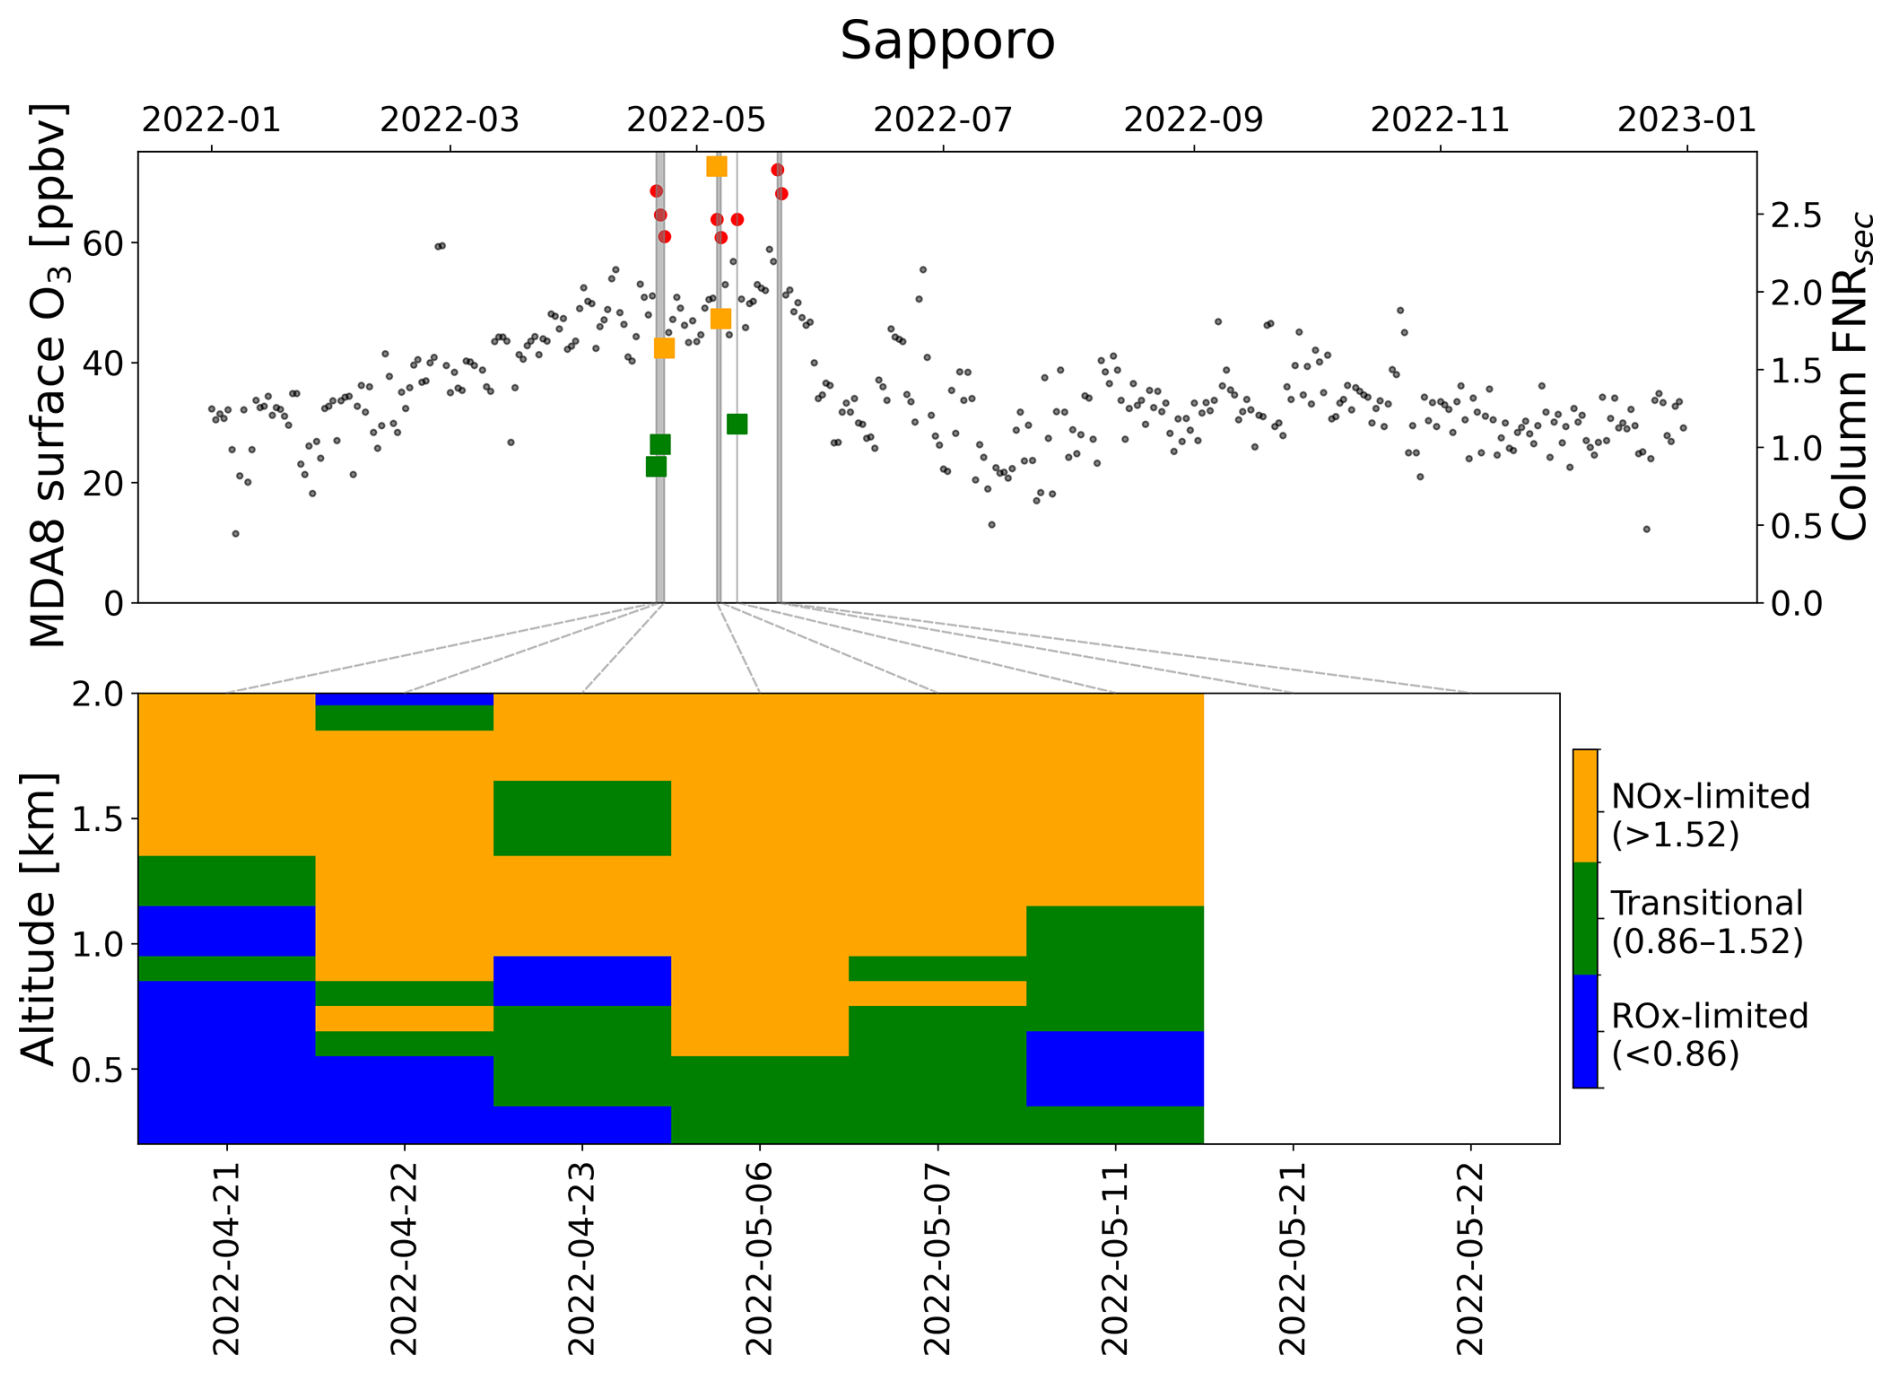
Figure 8Sensitivity analysis of O3 during MDA8 exceedance events at Sapporo. The top panel presents MDA8 surface O3, with non-exceedance days indicated by black dots and exceedance days shown as red points with grey shadows. Squares depict the column FNRsec derived from Pandora sky-scan measurements around local noon (12:00 ± 02:00). The bottom panel illustrates the vertical formation sensitivity of O3 corresponding to exceedance events. The squares and color bars are colored according to FNRsec threshold values determined from the GEOS-Chem model.
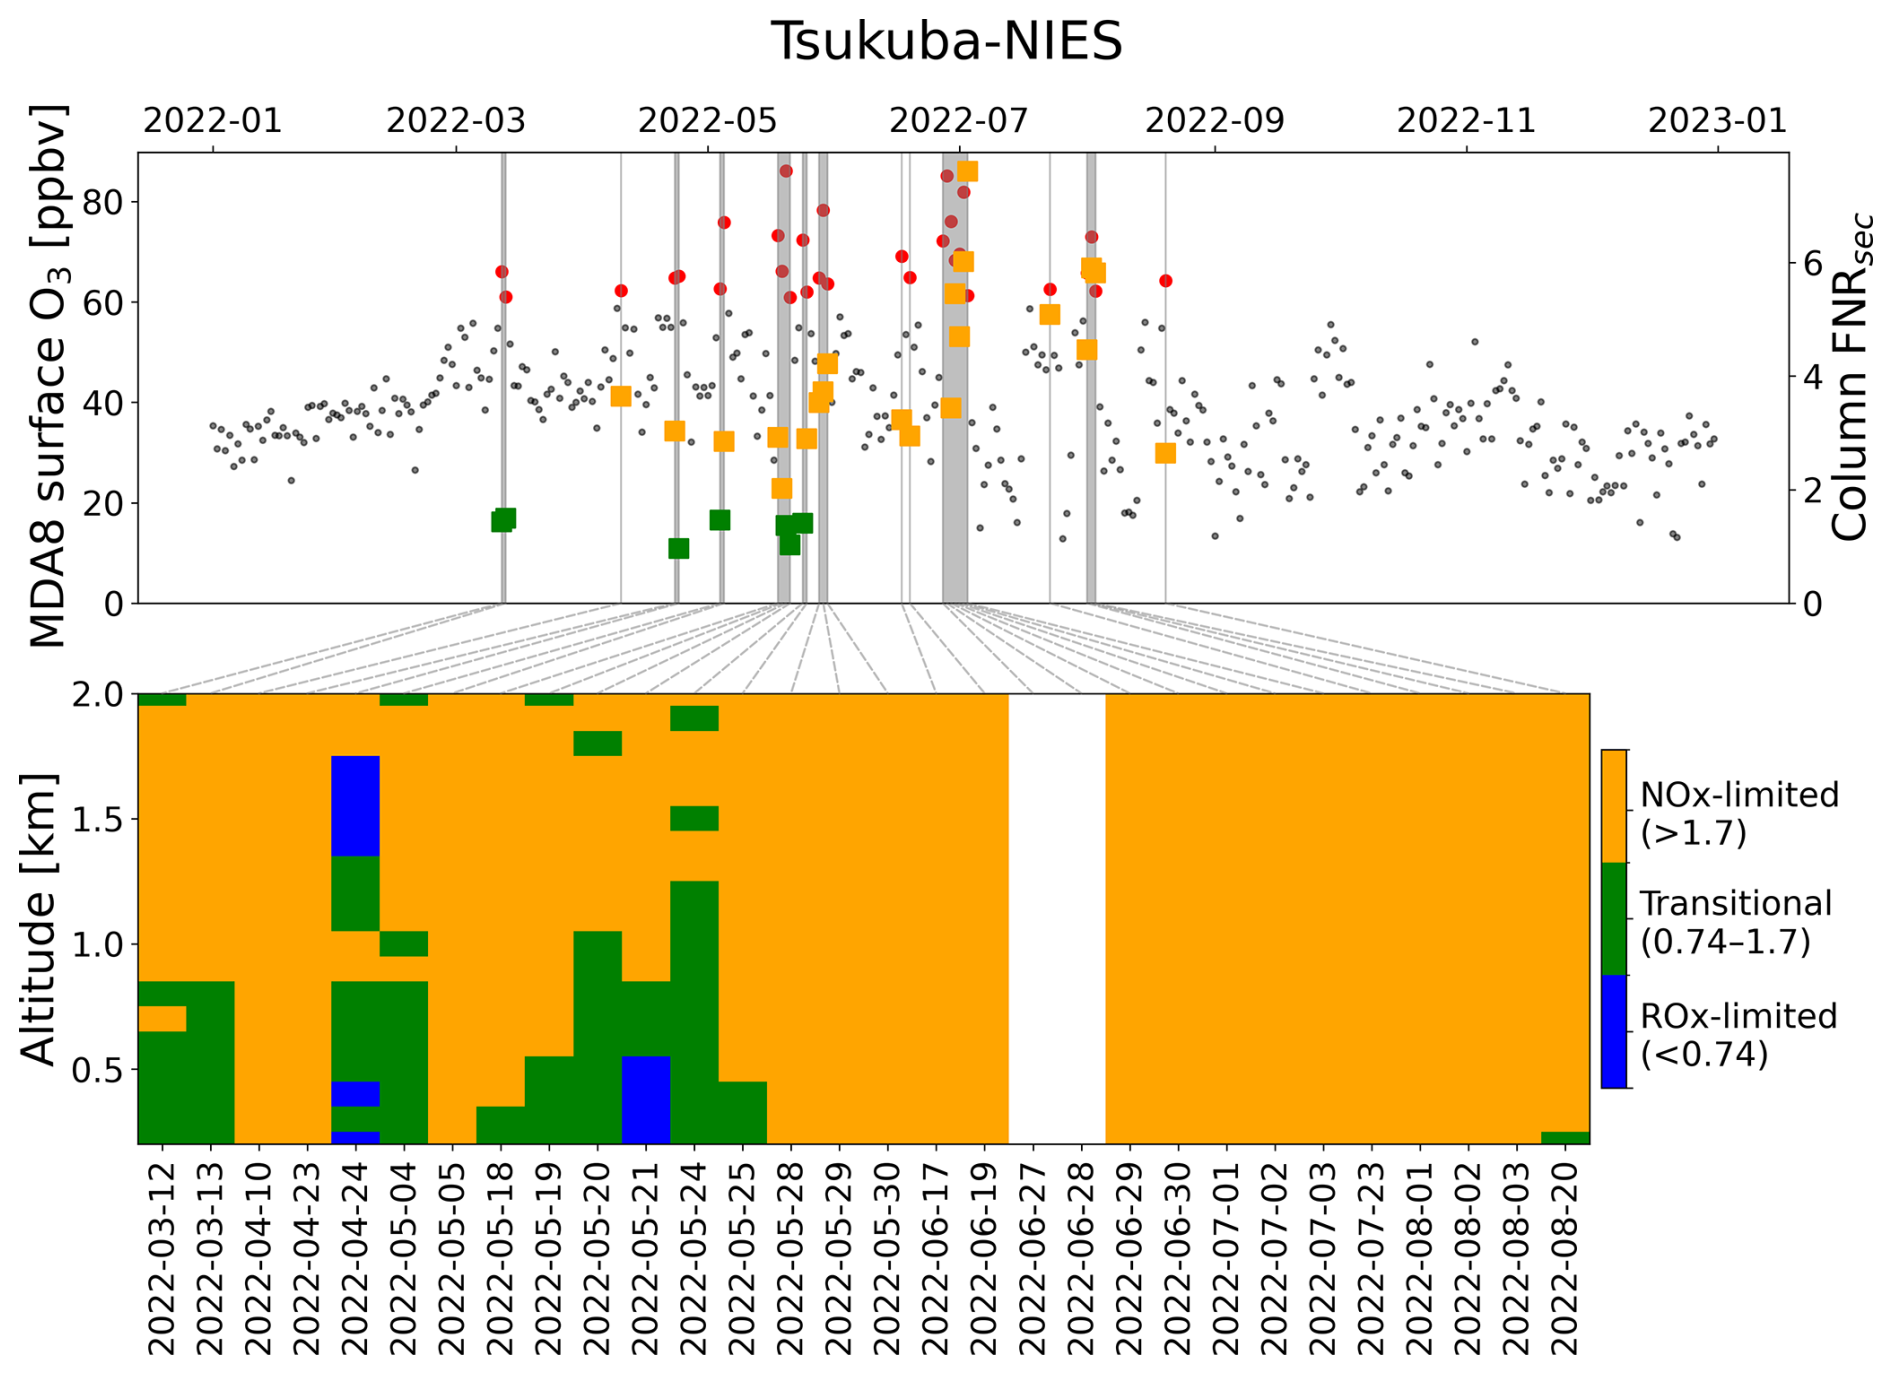
Figure 9Sensitivity analysis of O3 during MDA8 exceedance events at Tsukuba-NIES. The top panel presents MDA8 surface O3, with non-exceedance days indicated by black dots and exceedance days shown as red points with grey shadows. Squares depict the column FNRsec derived from Pandora sky-scan measurements around local noon (12:00 ± 02:00). The bottom panel illustrates the vertical formation sensitivity of O3 corresponding to exceedance events. The squares and color bars are colored according to FNRsec threshold values determined from the GEOS-Chem model.
At Sapporo, the O3 concentrations increased during spring (Fig. 8). All eight events with MDA8 O3 exceeding 60 ppbv occurred in April and May 2022. Pandora observations were unavailable on 21 and 22 May 2022. Given the transition range determined at Sapporo (), the column FNRsec exhibited O3 sensitivity in transitional and NOx-limited regime. Therefore, reducing NOx emission would be the optimal strategy for mitigating O3 levels. The vertical sensitivity indicated that the ROx-limited regime was typically confined to the near surface layer during events classified as transitional using column FNRsec. Concurrently, the NOx-limited regime frequently formed aloft, whereas the transitional regime formed in the mid-levels. Figure S11 illustrates the corresponding HCHO and NO2 profiles for these exceedance events. Higher concentration of NO2 on 21 and 22 April, concentrated below 0.5 km, led to a ROx-limited regime within this layer. For events categorized as NOx-limited (6–7 May) according to the column FNRsec, the NOx-limited regime dominated at higher altitudes and expanded downward to the surface, while the ROx-limited regime retreated. Even during periods of high MDA8, the vertical profiles of both NO2 and HCHO on 23 April and 6 May were low, suggesting that O3 could be influenced by regional or vertical transport. This influence could be recognized using Pandora HCHO and NO2 observations; however, further studies are needed to distinguish these events from local photochemical O3 production.
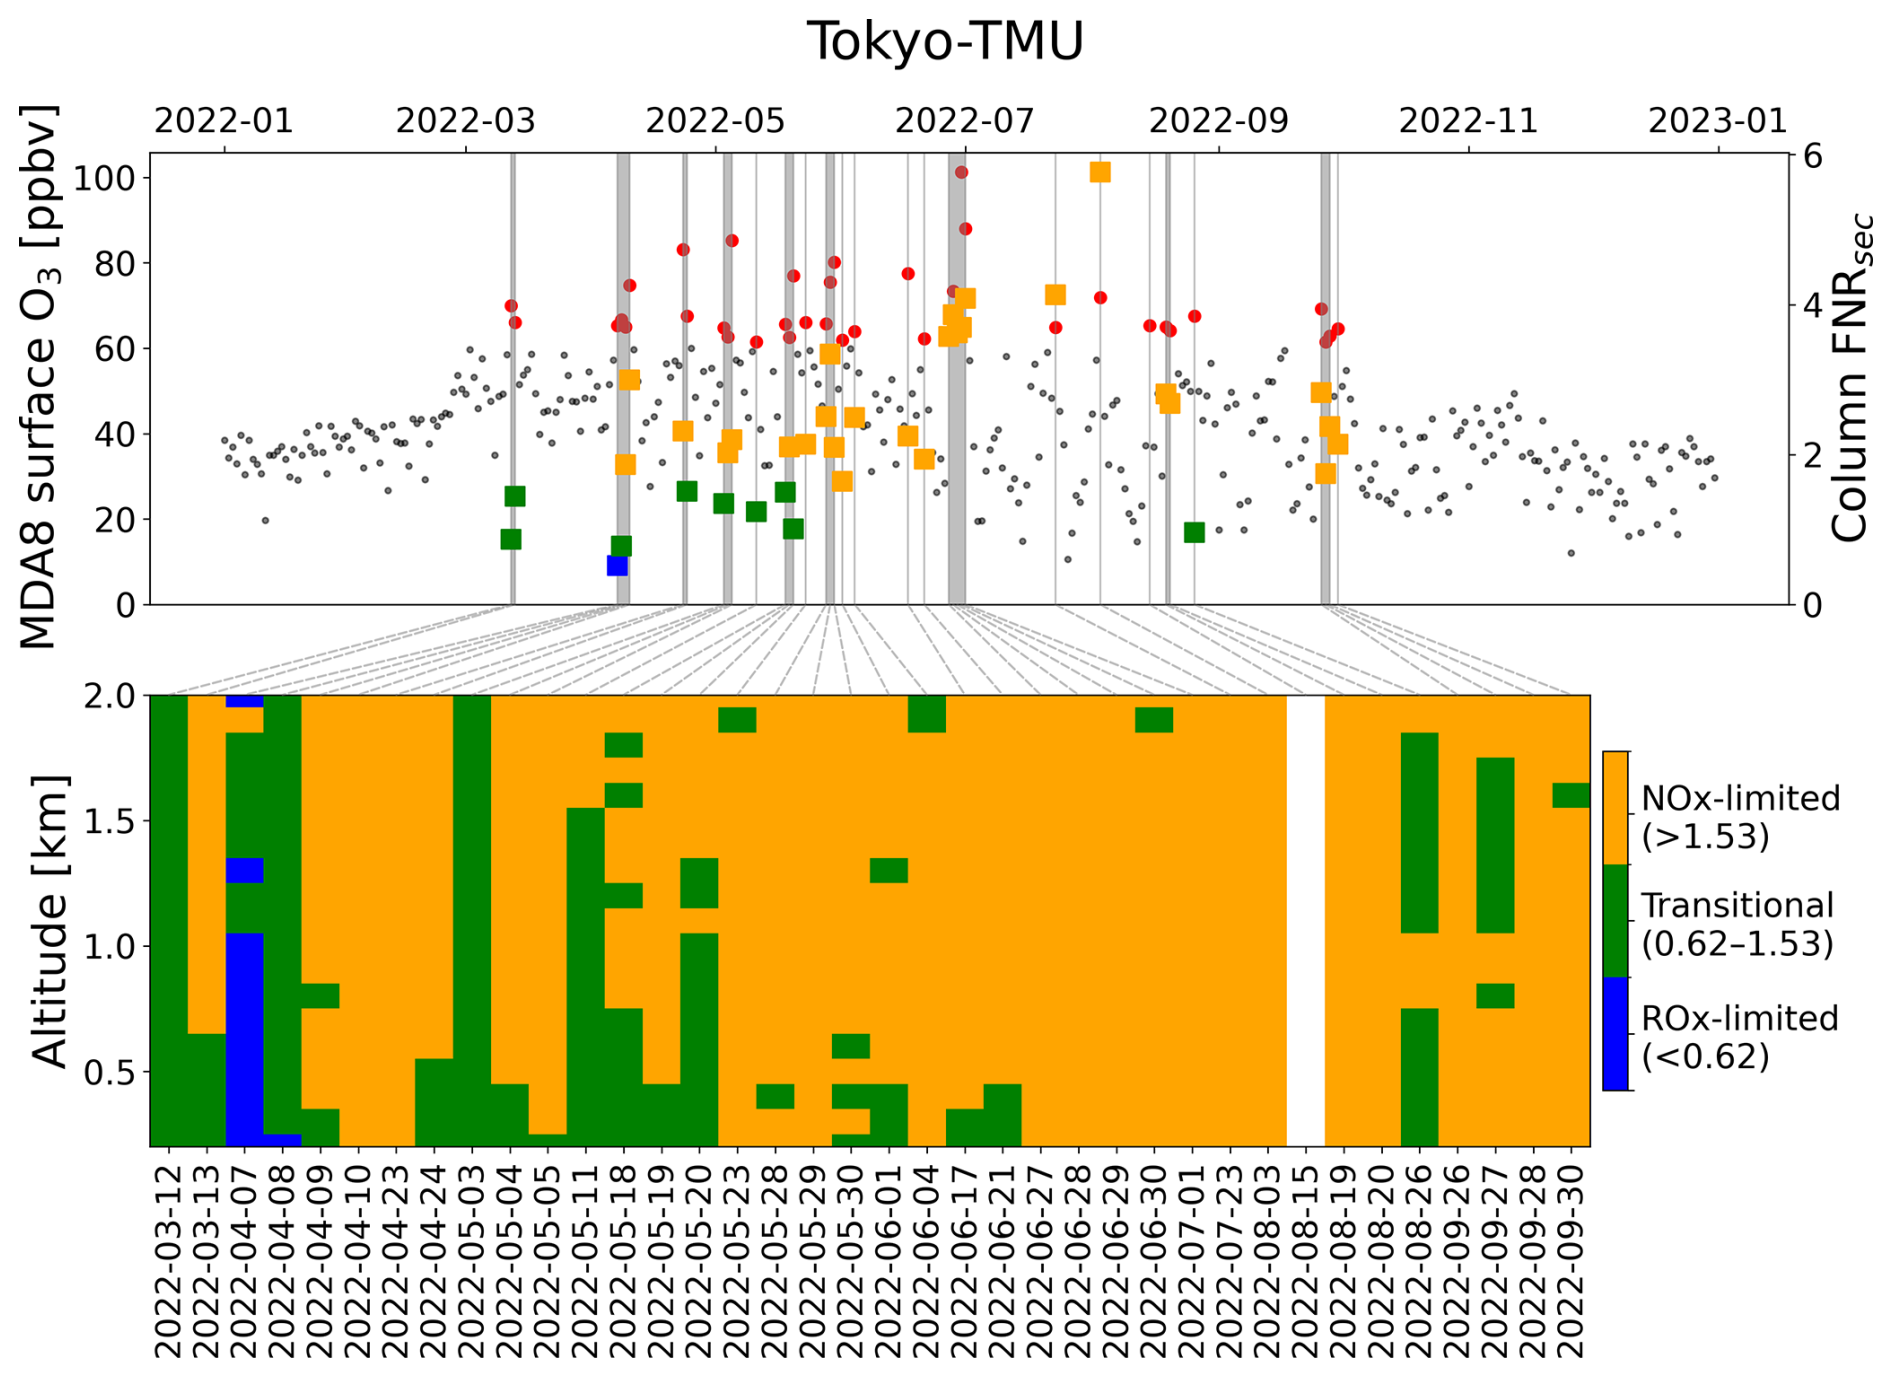
Figure 10Sensitivity analysis of O3 during MDA8 exceedance events at Tokyo-TMU. The top panel presents MDA8 surface O3, with non-exceedance days indicated by black dots and exceedance days shown as red points with grey shadows. Squares depict the column FNRsec derived from Pandora sky-scan measurements around local noon (12:00 ± 02:00). The bottom panel illustrates the vertical formation sensitivity of O3 corresponding to exceedance events. The squares and color bars are colored according to FNRsec threshold values determined from the GEOS-Chem model.
Figure 9 is similar to Fig. 8, but for Tsukuba-NIES. Compare with Sapporo, more O3 exceedance events were found at Tsukuba-NIES, with 30 events in 2022. These events primarily took place during spring and summer. Like the results at Sapporo, the column FNRsec exhibited transitional and NOx-limited conditions during spring events, whereas O3 chemistry was almost entirely NOx-limited during summer events, likely due to substantial enhancement in HCHO production (Fig. S11). Regarding vertical sensitivity, we determined a lower probability of ROx-limited regime during the spring events. During summer events, O3 formation sensitivity throughout the lower troposphere was consistently NOx-limited, consistent with the column FNRsec classification. Thus, emission policies focusing on continued reductions in NOx would effectively improve tropospheric O3 pollution during summer.
The exceedance events of O3 spanned a broad period from spring through fall at both Tokyo-TMU and Fukuoka (Figs. 10 and 11). The column FNRsec were higher during summer leading to a dominant classification in the NOx-limited regime. Transitional conditions were observed more frequently during spring and fall. At Tokyo-TMU, only one exceedance event (7 April) was found to be sensitive to ROx radicals. The locally elevated NOx emissions on that event shifted the chemical environment downward to lower FNRsec values (Fig. S12). Vertical sensitivity profiles showed a ROx-limited regime within the lower 1 km on 7–8 April. For Fukuoka, the transitional condition occurred more frequently during the exceedance events, emphasizing the need for simultaneous control strategies targeting both NOx and VOCs in this region.
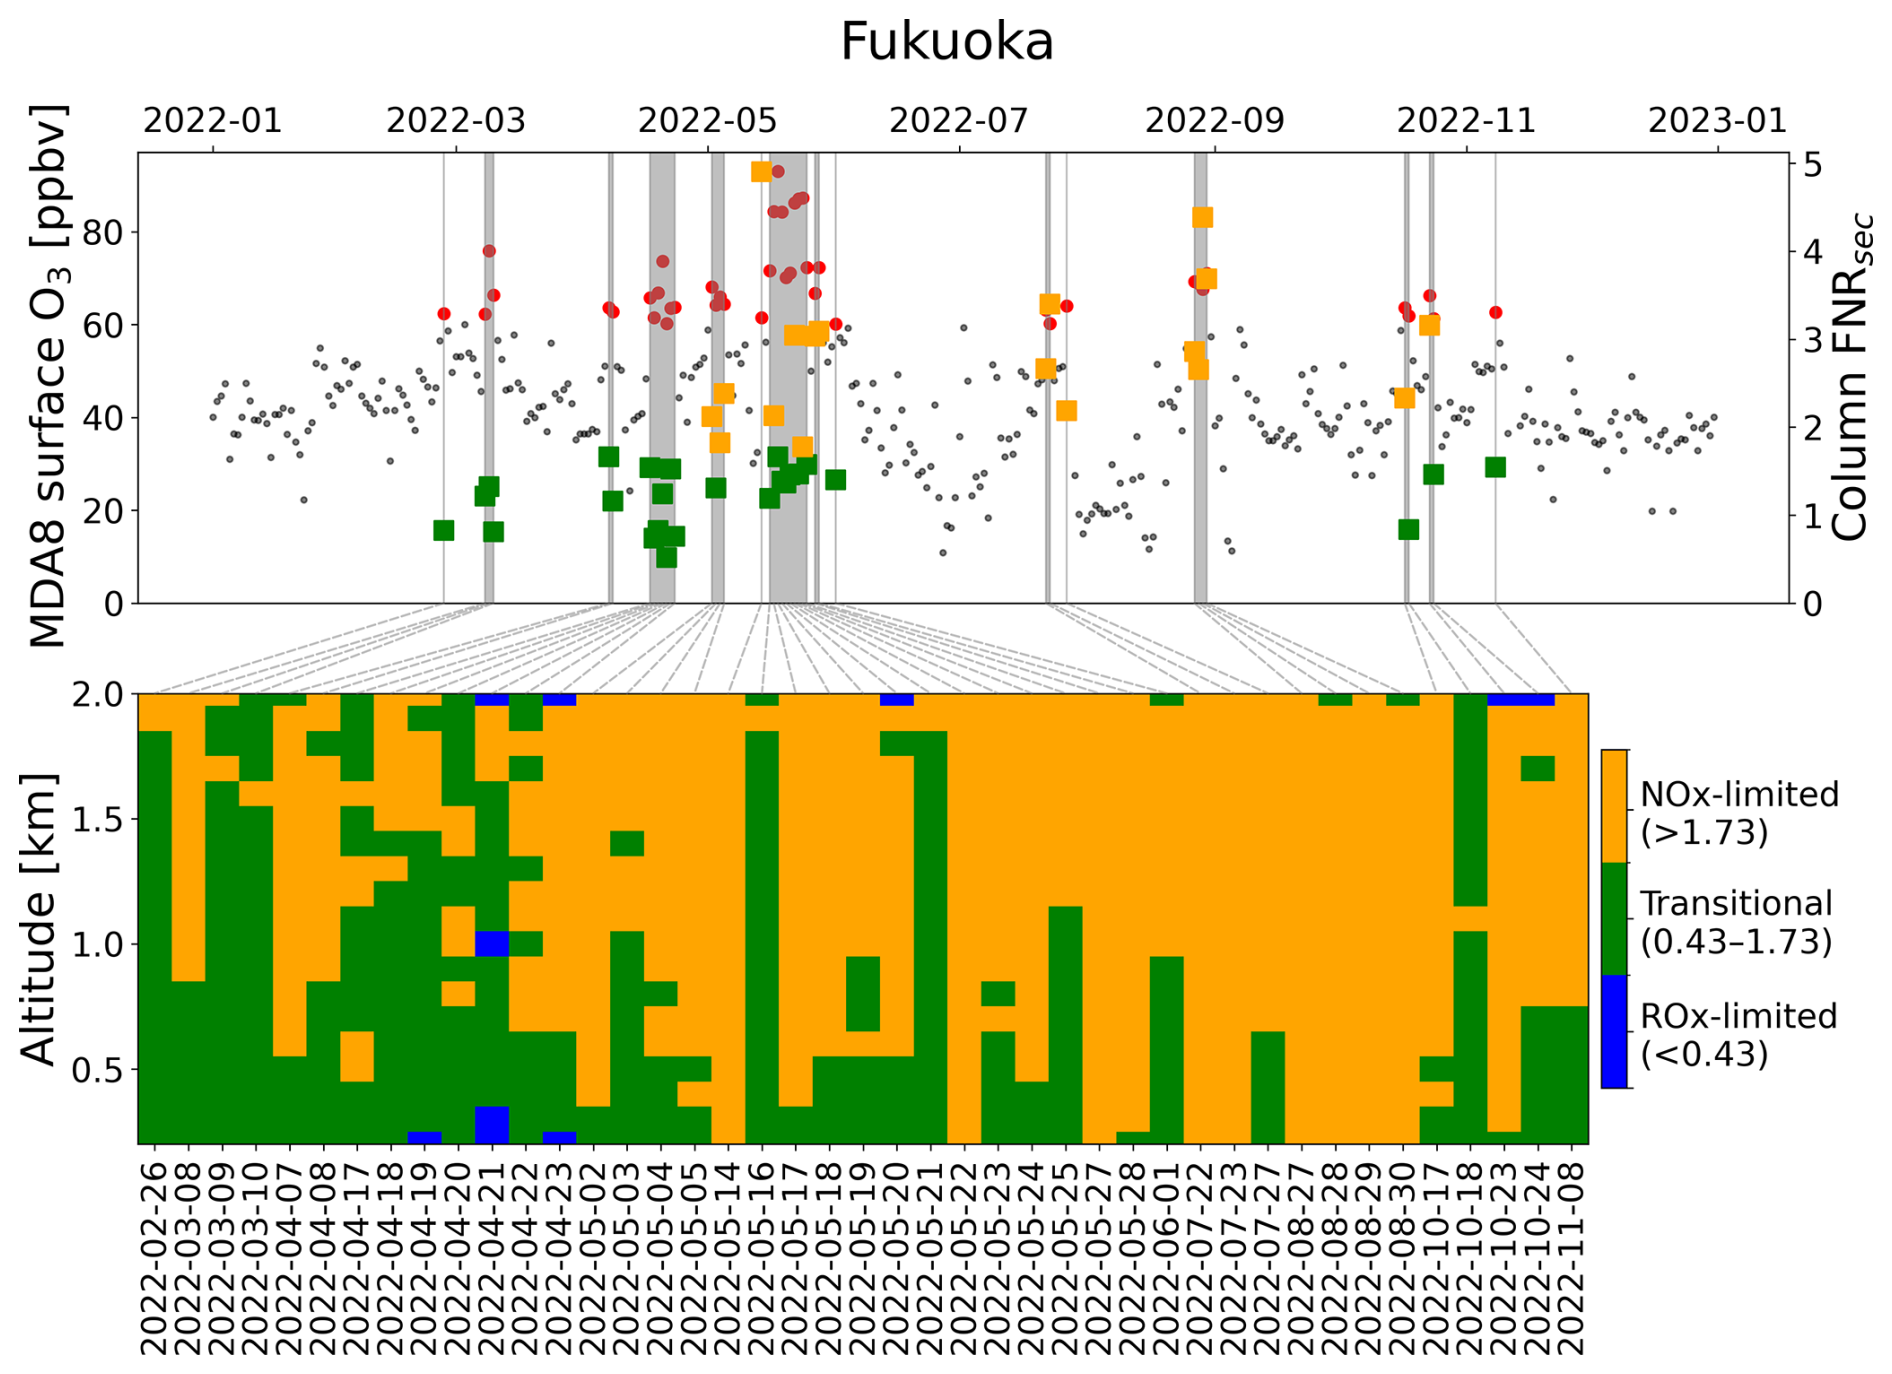
Figure 11Sensitivity analysis of O3 during MDA8 exceedance events at Fukuoka. The top panel presents MDA8 surface O3, with non-exceedance days indicated by black dots and exceedance days shown as red points with grey shadows. Squares depict the column FNRsec derived from Pandora sky-scan measurements around local noon (12:00 ± 02:00). The bottom panel illustrates the vertical formation sensitivity of O3 corresponding to exceedance events. The squares and color bars are colored according to FNRsec threshold values determined from the GEOS-Chem model.
Limitations and future scopes
The use of FNR indicator with satellite and ground-based observations can be readily implemented. However, FNR has inherent limitations in inferring the complex interactions among O3 production, its precursors, photolysis rates, and water vapor (Jin et al., 2025; Schroeder et al., 2017; Souri et al., 2026; Yang et al., 2026). For example, during the early morning and late afternoon, weak light intensity can lead to large biases in the interpretation of FNR because O3 production is less sensitive to its precursors under low photolysis conditions. In this study, we minimized the potential biases in predicting O3 chemistry by using Pandora data under conditions of strong photolysis rates. This may underutilize the rich hourly observations provided by Pandora and geostationary satellites. Jin et al. (2025) developed an approach to link the FNR with O3 chemistry using a steady-state O3-NOx-VOC model combined with GOES-CF simulations, and applied it to TEMPO observations. Additionally, Souri et al. (2026) optimized the OMI and TROPOMI data to investigate the daily mapping of net O3 production using a deep neural network approach. A similar approach could also be applied to Pandora data to derive accurate hourly net O3 production estimates.
This study demonstrates the use of Pandora measurements to investigate O3 sensitivity. Pandora provides vertical column densities and profiles of NO2 and HCHO, which are valuable for a comprehensive understanding of O3 production in the lower to mid-troposphere. Additionally, with the aid of the GEOS-Chem chemical transport model, we identified the region-specific thresholds to improve sensitivity analysis.
By applying the grid-stretching capability of the high-performance GEOS-Chem model, the diurnal cycles of NO2, HCHO, and O3 were generally well reproduced. The correlation coefficients between the model and in situ surface measurements were 0.48 for NO2 and 0.32 for HCHO, and from 0.53 to 0.61 for O3. For the tropospheric columns, the correlations between GEOS-Chem and Pandora ranged from 0.54 to 0.72 for NO2, and from 0.51 to 0.87 for HCHO.
According to the GEOS-Chem simulations, secondary HCHO was the dominant contributor to total HCHO, with its contribution increasing with altitude. Furthermore, the region-specific thresholds for the O3 sensitivity regime were identified. The surface FNRsec values tended to be lower compared to the column FNRsec. The column FNRsec threshold ranges were 0.86–1.52 in Sapporo, 0.74–1.7 in Tsukuba-NIES, 0.62–1.53 in Tokyo-TMU, and 0.43–1.73 in Fukuoka.
Using the tropospheric column FNRsec during high O3 episodes, the formation regime was found to be mainly NOx-limited during summer, due to increasing VOCs emissions and strong photochemical activity. The vertical distribution of O3 sensitivity regimes was also obtained from the Pandora vertical profile. The diagnostics could assist regulators in reducing the frequency of O3 exceedance events.
To mitigate O3 exposure, particularly for sensitive groups, policymakers should prioritize VOC emission controls near the surface layers in higher-latitude locations. During summertime, greater attention should be paid to controlling local NOx emissions. Moreover, regional transport of NOx from large emission sources can contribute to elevated NOx, where the NOx-limited regime is dominant, thereby enhancing O3 production.
The FNR indicator can be readily obtained from both satellite and ground-based observations, enabling quick assessment of O3 chemistry. However, the FNR indicator lacks consideration of other factors, such as photolysis rates and water vapor. For more precise interpretation, future studies should incorporate these indicators and others atmospheric dimensions. The combination of both modeling and machine learning could also be beneficial for the interpretation.
The Pandora data are available at the PGN website (https://www.pandonia-global-network.org, last access: 1 September 2025).
The supplement related to this article is available online at https://doi.org/10.5194/acp-26-8275-2026-supplement.
NDTC: Conceptualization, Formal analysis, Writing (original draft preparation). HirT: Conceptualization, Supervision, Writing (review and editing). SI: Conceptualization, Writing (review and editing). TF, MF, SK, and HisT: Data curation, Writing (review and editing). KI, YD, AM and RU: Writing (review and editing).
The contact author has declared that none of the authors has any competing interests.
Publisher's note: Copernicus Publications remains neutral with regard to jurisdictional claims made in the text, published maps, institutional affiliations, or any other geographical representation in this paper. The authors bear the ultimate responsibility for providing appropriate place names. Views expressed in the text are those of the authors and do not necessarily reflect the views of the publisher.
We thank the principal investigators, support staff, and funding for establishing and maintaining the Sapporo, Tsukuba-NIES, Tokyo-TMU, and Fukuoka sites of the PGN used in this investigation. The PGN is a bilateral project supported by funding from NASA and ESA. The model simulations were run using the NIES scalar processing supercomputer (HPE Apollo 2000). We thank Ms. Kimiko Suto (NIES) for managing the air monitoring data. We acknowledge Professor Armin Sorooshian (University of Arizona) for invaluable discussions and suggestions. This work was financially supported by JST SPRING (grant no. JPMJSP2125). Nguyen Doan Thien Chi would like to take this opportunity to thank the “THERS Make New Standards Program for the Next Generation Researchers”.
This work was financially supported by JST SPRING (grant no. JPMJSP2125).
This paper was edited by Andreas Hofzumahaus and reviewed by Amir Souri and one anonymous referee.
Abdi-Oskouei, M., Roozitalab, B., Stanier, C. O., Christiansen, M., Pfister, G., Pierce, R. B., McDonald, B. C., Adelman, Z., Janseen, M., Dickens, A. F., and Carmichael, G. R.: The Impact of Volatile Chemical Products, Other VOCs, and NOx on Peak Ozone in the Lake Michigan Region, J. Geophys. Res.-Atmos., 127, e2022JD037042, https://doi.org/10.1029/2022JD037042, 2022.
Akimoto, H.: Overview of policy actions and observational data for PM2.5 and O3 in Japan: a study of urban air quality improvement in Asia, JICA-RI Working Paper, 137, https://www.jica.go.jp/Resource/jica-ri/publication/workingpaper/l75nbg0000048r3z-att/JICA-RI_WP_No_137.pdf (last access: 14 April 2025), 2017.
Bates, K. H., Evans, M. J., Henderson, B. H., and Jacob, D. J.: Impacts of updated reaction kinetics on the global GEOS-Chem simulation of atmospheric chemistry, Geosci. Model Dev., 17, 1511–1524, https://doi.org/10.5194/gmd-17-1511-2024, 2024.
Bindle, L., Martin, R. V., Cooper, M. J., Lundgren, E. W., Eastham, S. D., Auer, B. M., Clune, T. L., Weng, H., Lin, J., Murray, L. T., Meng, J., Keller, C. A., Putman, W. M., Pawson, S., and Jacob, D. J.: Grid-stretching capability for the GEOS-Chem 13.0.0 atmospheric chemistry model, Geosci. Model Dev., 14, 5977–5997, https://doi.org/10.5194/gmd-14-5977-2021, 2021.
Cede, A., Tiefengraber, M., Gebetsberger, M., and Kreuter, M.: Manual for Blick Software Suite 1.8, https://www.pandonia-global-network.org/assets/manuals/BlickSoftwareSuite_Manual_v1-8-4.pdf (last access: 29 November 2024), 2021a.
Cede, A., Tiefengraber, M., Gebetsberger, M., and Spinei, E.: Pandonia Global Network Data Products Readme Document, https://www.pandonia-global-network.org/assets/manuals/PGN_DataProducts_Readme_v1-8-5.pdf (last access: 25 September 2024), 2021b.
Chang, L.-S., Ahn, S., Bae, M.-S., Park, S.-M., Gil, J., Kim, K.-R., Lee, G., Lee, T., Woo, J.-H., Park, R., Kwon, H.-A., Choo, G.-H., and Song, C.-K.: Role of factors controlling diurnal variation of cold-season formaldehyde during Satellite Integrated Joint Monitoring of Air Quality 2021 campaign, Sci. Total Environ., 960, 178283, https://doi.org/10.1016/j.scitotenv.2024.178283, 2025.
Chatani, S., Kitayama, K., Itahashi, S., Irie, H., and Shimadera, H.: Effectiveness of emission controls implemented since 2000 on ambient ozone concentrations in multiple timescales in Japan: An emission inventory development and simulation study, Sci. Total Environ., 894, 165058, https://doi.org/10.1016/j.scitotenv.2023.165058, 2023.
Chen, Z., Sun, L., Huang, L., Xie, Y., Yang, S., Sun, L., Xue, J., and Yan, F.: Inequality of exposure to PM2.5 and ozone among age groups and cities in Japan in 2030 and 2050, Urban Clim., 55, 101935, https://doi.org/10.1016/j.uclim.2024.101935, 2024.
Choi, S., Lamsal, L. N., Follette-Cook, M., Joiner, J., Krotkov, N. A., Swartz, W. H., Pickering, K. E., Loughner, C. P., Appel, W., Pfister, G., Saide, P. E., Cohen, R. C., Weinheimer, A. J., and Herman, J. R.: Assessment of NO2 observations during DISCOVER-AQ and KORUS-AQ field campaigns, Atmos. Meas. Tech., 13, 2523–2546, https://doi.org/10.5194/amt-13-2523-2020, 2020.
Choo, G.-H., Lee, K., Hong, H., Jeong, U., Choi, W., and Janz, S. J.: Highly resolved mapping of NO2 vertical column densities from GeoTASO measurements over a megacity and industrial area during the KORUS-AQ campaign, Atmos. Meas. Tech., 16, 625–644, https://doi.org/10.5194/amt-16-625-2023, 2023.
Douros, J., Eskes, H., van Geffen, J., Boersma, K. F., Compernolle, S., Pinardi, G., Blechschmidt, A.-M., Peuch, V.-H., Colette, A., and Veefkind, P.: Comparing Sentinel-5P TROPOMI NO2 column observations with the CAMS regional air quality ensemble, Geosci. Model Dev., 16, 509–534, https://doi.org/10.5194/gmd-16-509-2023, 2023.
Duncan, B. N., Yoshida, Y., Olson, J. R., Sillman, S., Martin, R. V., Lamsal, L., Hu, Y., Pickering, K. E., Retscher, C., Allen, D. J., and Crawford, J. H.: Application of OMI observations to a space-based indicator of NOx and VOC controls on surface ozone formation, Atmos. Environ., 44, 2213–2223, https://doi.org/10.1016/j.atmosenv.2010.03.010, 2010.
Eastham, S. D., Long, M. S., Keller, C. A., Lundgren, E., Yantosca, R. M., Zhuang, J., Li, C., Lee, C. J., Yannetti, M., Auer, B. M., Clune, T. L., Kouatchou, J., Putman, W. M., Thompson, M. A., Trayanov, A. L., Molod, A. M., Martin, R. V., and Jacob, D. J.: GEOS-Chem High Performance (GCHP v11-02c): a next-generation implementation of the GEOS-Chem chemical transport model for massively parallel applications, Geosci. Model Dev., 11, 2941–2953, https://doi.org/10.5194/gmd-11-2941-2018, 2018.
Feng, Z., Agathokleous, E., Yue, X., Oksanen, E., Paoletti, E., Sase, H., Gandin, A., Koike, T., Calatayud, V., Yuan, X., Liu, X., De Marco, A., Jolivet, Y., Kontunen-Soppela, S., Hoshika, Y., Saji, H., Li, P., Li, Z., Watanabe, M., and Kobayashi, K.: Emerging challenges of ozone impacts on asian plants: actions are needed to protect ecosystem health, Ecosyst. Health Sustain., 7, 1911602, https://doi.org/10.1080/20964129.2021.1911602, 2021.
Grulke, N. E. and Heath, R. L.: Ozone effects on plants in natural ecosystems, Plant Biol., 22, 12–37, https://doi.org/10.1111/plb.12971, 2020.
Hammer, M.-U., Vogel, B., and Vogel, H.: Findings on H2O2/HNO3 as an indicator of ozone sensitivity in Baden-Württemberg, Berlin-Brandenburg, and the Po valley based on numerical simulations, J. Geophys. Res., 107, https://doi.org/10.1029/2000JD000211, 2002.
Herman, J. and Mao, J.: Seasonal variation of total column formaldehyde, nitrogen dioxide, and ozone over various Pandora spectrometer sites with a comparison of OMI and diurnally varying DSCOVR-EPIC satellite data, Atmos. Meas. Tech., 18, 4165–4182, https://doi.org/10.5194/amt-18-4165-2025, 2025.
Herman, J., Cede, A., Spinei, E., Mount, G., Tzortziou, M., and Abuhassan, N.: NO2 column amounts from ground-based Pandora and MFDOAS spectrometers using the direct-sun DOAS technique: Intercomparisons and application to OMI validation, J. Geophys. Res.-Atmos., 114, 2009JD011848, https://doi.org/10.1029/2009JD011848, 2009.
Hong, Q., Zhu, L., Xing, C., Hu, Q., Lin, H., Zhang, C., Zhao, C., Liu, T., Su, W., and Liu, C.: Inferring vertical variability and diurnal evolution of O3 formation sensitivity based on the vertical distribution of summertime HCHO and NO2 in Guangzhou, China, Sci. Total Environ., 827, 154045, https://doi.org/10.1016/j.scitotenv.2022.154045, 2022.
Hu, Q., Ji, X., Hong, Q., Li, J., Li, Q., Ou, J., Liu, H., Xing, C., Tan, W., Chen, J., Chang, B., and Liu, C.: Vertical Evolution of Ozone Formation Sensitivity Based on Synchronous Vertical Observations of Ozone and Proxies for Its Precursors: Implications for Ozone Pollution Prevention Strategies, Environ. Sci. Technol., acs.est.4c00637, https://doi.org/10.1021/acs.est.4c00637, 2024.
Inoue, K., Tonokura, K., and Yamada, H.: Modeling study on the spatial variation of the sensitivity of photochemical ozone concentrations and population exposure to VOC emission reductions in Japan, Air Qual. Atmos. Hlth., 12, 1035–1047, https://doi.org/10.1007/s11869-019-00720-w, 2019.
Irie, H., Takashima, H., Kanaya, Y., Boersma, K. F., Gast, L., Wittrock, F., Brunner, D., Zhou, Y., and Van Roozendael, M.: Eight-component retrievals from ground-based MAX-DOAS observations, Atmos. Meas. Tech., 4, 1027–1044, https://doi.org/10.5194/amt-4-1027-2011, 2011.
Irie, H., Yonekawa, D., Damiani, A., Hoque, H. M. S., Sudo, K., and Itahashi, S.: Continuous multi-component MAX-DOAS observations for the planetary boundary layer ozone variation analysis at Chiba and Tsukuba, Japan, from 2013 to 2019, Prog. Earth Planet. Sci., 8, 31, https://doi.org/10.1186/s40645-021-00424-9, 2021.
Itahashi, S. and Irie, H.: Surface and aloft NO2 pollution over the greater Tokyo area observed by ground-based and MAX-DOAS measurements bridged by kilometer-scale regional air quality modeling, Prog. Earth Planet. Sci., 9, 15, https://doi.org/10.1186/s40645-022-00474-7, 2022.
Jin, X., Fiore, A. M., Murray, L. T., Valin, L. C., Lamsal, L. N., Duncan, B., Folkert Boersma, K., De Smedt, I., Abad, G. G., Chance, K., and Tonnesen, G. S.: Evaluating a Space-Based Indicator of Surface Ozone-NOx-VOC Sensitivity Over Midlatitude Source Regions and Application to Decadal Trends, J. Geophys. Res.-Atmos., 122, https://doi.org/10.1002/2017JD026720, 2017.
Jin, X., Yang, Y., Gonzalez Abad, G., Nowlan, C., and Liu, X.: Observing the Diurnal Variations of Ozone-NOx-VOC Chemistry Over the U. S. From the Geostationary TEMPO Instrument, Geophys. Res. Lett., 52, e2025GL116394, https://doi.org/10.1029/2025GL116394, 2025.
Judd, L. M., Al-Saadi, J. A., Janz, S. J., Kowalewski, M. G., Pierce, R. B., Szykman, J. J., Valin, L. C., Swap, R., Cede, A., Mueller, M., Tiefengraber, M., Abuhassan, N., and Williams, D.: Evaluating the impact of spatial resolution on tropospheric NO2 column comparisons within urban areas using high-resolution airborne data, Atmos. Meas. Tech., 12, 6091–6111, https://doi.org/10.5194/amt-12-6091-2019, 2019.
Judd, L. M., Al-Saadi, J. A., Szykman, J. J., Valin, L. C., Janz, S. J., Kowalewski, M. G., Eskes, H. J., Veefkind, J. P., Cede, A., Mueller, M., Gebetsberger, M., Swap, R., Pierce, R. B., Nowlan, C. R., Abad, G. G., Nehrir, A., and Williams, D.: Evaluating Sentinel-5P TROPOMI tropospheric NO2 column densities with airborne and Pandora spectrometers near New York City and Long Island Sound, Atmos. Meas. Tech., 13, 6113–6140, https://doi.org/10.5194/amt-13-6113-2020, 2020.
Jung, J., Choi, Y., Mousavinezhad, S., Kang, D., Park, J., Pouyaei, A., Ghahremanloo, M., Momeni, M., and Kim, H.: Changes in the ozone chemical regime over the contiguous United States inferred by the inversion of NOx and VOC emissions using satellite observation, Atmos. Res., 270, 106076, https://doi.org/10.1016/j.atmosres.2022.106076, 2022.
Kim, S., Kim, D., Hong, H., Chang, L.-S., Lee, H., Kim, D.-R., Kim, D., Yu, J.-A., Lee, D., Jeong, U., Song, C.-K., Kim, S.-W., Park, S. S., Kim, J., Hanisco, T. F., Park, J., Choi, W., and Lee, K.: First-time comparison between NO2 vertical columns from Geostationary Environmental Monitoring Spectrometer (GEMS) and Pandora measurements, Atmos. Meas. Tech., 16, 3959–3972, https://doi.org/10.5194/amt-16-3959-2023, 2023.
Kleinman, L. I., Daum, P. H., Lee, Y., Nunnermacker, L. J., Springston, S. R., Weinstein-Lloyd, J., and Rudolph, J.: Sensitivity of ozone production rate to ozone precursors, Geophys. Res. Lett., 28, 2903–2906, https://doi.org/10.1029/2000GL012597, 2001.
Kurokawa, J. and Ohara, T.: Long-term historical trends in air pollutant emissions in Asia: Regional Emission inventory in ASia (REAS) version 3, Atmos. Chem. Phys., 20, 12761–12793, https://doi.org/10.5194/acp-20-12761-2020, 2020.
Langford, V. S., Dryahina, K., and Španìl, P.: Robust Automated SIFT-MS Quantitation of Volatile Compounds in Air Using a Multicomponent Gas Standard, J. Am. Soc. Mass Spectr., 34, 2630–2645, https://doi.org/10.1021/jasms.3c00312, 2023.
Lin, H., Jacob, D. J., Lundgren, E. W., Sulprizio, M. P., Keller, C. A., Fritz, T. M., Eastham, S. D., Emmons, L. K., Campbell, P. C., Baker, B., Saylor, R. D., and Montuoro, R.: Harmonized Emissions Component (HEMCO) 3.0 as a versatile emissions component for atmospheric models: application in the GEOS-Chem, NASA GEOS, WRF-GC, CESM2, NOAA GEFS-Aerosol, and NOAA UFS models, Geosci. Model Dev., 14, 5487–5506, https://doi.org/10.5194/gmd-14-5487-2021, 2021.
Lin, H., Xing, C., Hong, Q., Liu, C., Ji, X., Liu, T., Lin, J., Lu, C., Tan, W., Li, Q., and Liu, H.: Diagnosis of Ozone Formation Sensitivities in Different Height Layers via MAX-DOAS Observations in Guangzhou, J. Geophys. Res.-Atmos., 127, e2022JD036803, https://doi.org/10.1029/2022JD036803, 2022.
Liu, H., Liu, S., Xue, B., Lv, Z., Meng, Z., Yang, X., Xue, T., Yu, Q., and He, K.: Ground-level ozone pollution and its health impacts in China, Atmos. Environ., 173, 223–230, https://doi.org/10.1016/j.atmosenv.2017.11.014, 2018.
Liu, O., Li, Z., Lin, Y., Fan, C., Zhang, Y., Li, K., Zhang, P., Wei, Y., Chen, T., Dong, J., and de Leeuw, G.: Evaluation of the first year of Pandora NO2 measurements over Beijing and application to satellite validation, Atmos. Meas. Tech., 17, 377–395, https://doi.org/10.5194/amt-17-377-2024, 2024.
Mahmood, F., Khokhar, M. F., and Mahmood, Z.: Examining the relationship of tropospheric ozone and climate change on crop productivity using the multivariate panel data techniques, J. Environ. Manage., 272, 111024, https://doi.org/10.1016/j.jenvman.2020.111024, 2020.
Martin, R. V., Eastham, S. D., Bindle, L., Lundgren, E. W., Clune, T. L., Keller, C. A., Downs, W., Zhang, D., Lucchesi, R. A., Sulprizio, M. P., Yantosca, R. M., Li, Y., Estrada, L., Putman, W. M., Auer, B. M., Trayanov, A. L., Pawson, S., and Jacob, D. J.: Improved advection, resolution, performance, and community access in the new generation (version 13) of the high-performance GEOS-Chem global atmospheric chemistry model (GCHP), Geosci. Model Dev., 15, 8731–8748, https://doi.org/10.5194/gmd-15-8731-2022, 2022.
McDuffie, E., Smith, S., O'Rourke, P., Tibrewal, K., Venkataraman, C., Marais, E., Zheng, B., Crippa, M., Brauer, M., and Martin, R.: CEDS_GBD-MAPS: Global Anthropogenic Emission Inventory of NOx, SO2, CO, NH3, NMVOCs, BC, and OC from 1970–2017 (2020_v1.0), https://doi.org/10.5281/ZENODO.3754964, 2020.
McLinden, C. A., Olsen, S. C., Hannegan, B., Wild, O., Prather, M. J., and Sundet, J.: Stratospheric ozone in 3-D models: A simple chemistry and the cross-tropopause flux, J. Geophys. Res.-Atmos., 105, 14653–14665, https://doi.org/10.1029/2000JD900124, 2000.
Mishra, M., Chen, P.-H., Lin, G.-Y., Nguyen, T.-T.-N., Le, T.-C., Dejchanchaiwong, R., Tekasakul, P., Shih, S.-H., Jhang, C.-W., and Tsai, C.-J.: Photochemical oxidation of VOCs and their source impact assessment on ozone under de-weather conditions in Western Taiwan, Environ. Pollut., 346, 123662, https://doi.org/10.1016/j.envpol.2024.123662, 2024.
Mouat, A. P., Spinei, E., and Kaiser, J.: Informing Near-Airport Satellite NO2 Retrievals Using Pandora Sky-Scanning Observations, ACS EST Air, 1, 1617–1628, https://doi.org/10.1021/acsestair.4c00158, 2024.
Nuvolone, D., Petri, D., and Voller, F.: The effects of ozone on human health, Environ. Sci. Pollut. R., 25, 8074–8088, https://doi.org/10.1007/s11356-017-9239-3, 2018.
Prather, M. J.: Photolysis rates in correlated overlapping cloud fields: Cloud-J 7.3c, Geosci. Model Dev., 8, 2587–2595, https://doi.org/10.5194/gmd-8-2587-2015, 2015.
Qian, Y., Wang, D., Li, Z., Liu, H., Zhou, H., Dou, K., Xi, L., Tang, F., Si, F., and Luo, Y.: Ground-based MAX-DOAS observations of tropospheric formaldehyde and nitrogen dioxide: Insights into ozone formation sensitivity, Atmos. Pollut. Res., 15, 102285, https://doi.org/10.1016/j.apr.2024.102285, 2024.
Ramya, A., Dhevagi, P., Poornima, R., Avudainayagam, S., Watanabe, M., and Agathokleous, E.: Effect of ozone stress on crop productivity: A threat to food security, Environ. Res., 236, 116816, https://doi.org/10.1016/j.envres.2023.116816, 2023.
Rawat, P., Crawford, J. H., Travis, K. R., Judd, L. M., Demetillo, M. A. G., Valin, L. C., Szykman, J. J., Whitehill, A., Baumann, E., and Hanisco, T. F.: Maximizing the scientific application of Pandora column observations of HCHO and NO2, Atmos. Meas. Tech., 18, 2899–2917, https://doi.org/10.5194/amt-18-2899-2025, 2025.
Roberts, I. J., Carpenter, L. J., Shaw, M. D., and Langford, V. S.: Selected Ion Flow Tube – Mass Spectrometry (SIFT-MS) study of the reactions of H3O+, NO+ and with a range of oxygenated volatile organic carbons (OVOCs), Int. J. Mass Spectrom., 479, 116892, https://doi.org/10.1016/j.ijms.2022.116892, 2022.
Ryan, R. G., Marais, E. A., Gershenson-Smith, E., Ramsay, R., Muller, J.-P., Tirpitz, J.-L., and Frieß, U.: Measurement report: MAX-DOAS measurements characterise Central London ozone pollution episodes during 2022 heatwaves, Atmos. Chem. Phys., 23, 7121–7139, https://doi.org/10.5194/acp-23-7121-2023, 2023.
Sadanaga, Y., Kawasaki, S., Tanaka, Y., Kajii, Y., and Bandow, H.: New System for Measuring the Photochemical Ozone Production Rate in the Atmosphere, Environ. Sci. Technol., 51, 2871–2878, https://doi.org/10.1021/acs.est.6b04639, 2017.
Sakamoto, Y., Sadanaga, Y., Li, J., Matsuoka, K., Takemura, M., Fujii, T., Nakagawa, M., Kohno, N., Nakashima, Y., Sato, K., Nakayama, T., Kato, S., Takami, A., Yoshino, A., Murano, K., and Kajii, Y.: Relative and Absolute Sensitivity Analysis on Ozone Production in Tsukuba, a City in Japan, Environ. Sci. Technol., 53, 13629–13635, https://doi.org/10.1021/acs.est.9b03542, 2019.
Santiago, J. V., Inoue, K., and Tonokura, K.: Diagnosis of ozone formation sensitivity in the Mexico City Metropolitan Area using column ratios from the ozone monitoring instrument, Environ. Adv., 6, 100138, https://doi.org/10.1016/j.envadv.2021.100138, 2021.
Schroeder, J. R., Crawford, J. H., Fried, A., Walega, J., Weinheimer, A., Wisthaler, A., Müller, M., Mikoviny, T., Chen, G., Shook, M., Blake, D. R., and Tonnesen, G. S.: New insights into the column ratio as an indicator of near-surface ozone sensitivity, J. Geophys. Res.-Atmos., 122, 8885–8907, https://doi.org/10.1002/2017JD026781, 2017.
Shi, Y., Wang, S., Zhang, S., Liu, J., Jin, D., Huo, J., Xue, R., Zhu, J., Gu, C., and Zhou, B.: HCHO and NO2 profile characteristics under different synoptic patterns in Shanghai, China, J. Environ. Sci., S1001074225000427, https://doi.org/10.1016/j.jes.2025.01.028, 2025.
Sillman, S. and He, D.: Some theoretical results concerning O3-NOx-VOC chemistry and NOx-VOC indicators, J. Geophys. Res., 107, https://doi.org/10.1029/2001JD001123, 2002.
Souri, A. H., Chance, K., Bak, J., Nowlan, C. R., González Abad, G., Jung, Y., Wong, D. C., Mao, J., and Liu, X.: Unraveling pathways of elevated ozone induced by the 2020 lockdown in Europe by an observationally constrained regional model using TROPOMI, Atmos. Chem. Phys., 21, 18227–18245, https://doi.org/10.5194/acp-21-18227-2021, 2021.
Souri, A. H., Johnson, M. S., Wolfe, G. M., Crawford, J. H., Fried, A., Wisthaler, A., Brune, W. H., Blake, D. R., Weinheimer, A. J., Verhoelst, T., Compernolle, S., Pinardi, G., Vigouroux, C., Langerock, B., Choi, S., Lamsal, L., Zhu, L., Sun, S., Cohen, R. C., Min, K.-E., Cho, C., Philip, S., Liu, X., and Chance, K.: Characterization of errors in satellite-based HCHO ∕ NO2 tropospheric column ratios with respect to chemistry, column-to-PBL translation, spatial representation, and retrieval uncertainties, Atmos. Chem. Phys., 23, 1963–1986, https://doi.org/10.5194/acp-23-1963-2023, 2023a.
Souri, A. H., Kumar, R., Chong, H., Golbazi, M., Knowland, K. E., Geddes, J., and Johnson, M. S.: Decoupling in the vertical shape of HCHO during a sea breeze event: The effect on trace gas satellite retrievals and column-to-surface translation, Atmos. Environ., 309, 119929, https://doi.org/10.1016/j.atmosenv.2023.119929, 2023b.
Souri, A. H., González Abad, G., Wolfe, G. M., Verhoelst, T., Vigouroux, C., Pinardi, G., Compernolle, S., Langerock, B., Duncan, B. N., and Johnson, M. S.: Feasibility of robust estimates of ozone production rates using a synergy of satellite observations, ground-based remote sensing, and models, Atmos. Chem. Phys., 25, 2061–2086, https://doi.org/10.5194/acp-25-2061-2025, 2025.
Souri, A. H., González Abad, G., Duncan, B. N., and Oman, L. D.: Beyond binary maps from HCHO∕NO2: a deep neural network approach to global daily mapping of net ozone production rates and sensitivities constrained by satellite observations (2005–2023), Atmos. Chem. Phys., 26, 809–837, https://doi.org/10.5194/acp-26-809-2026, 2026.
Spinei, E., Whitehill, A., Fried, A., Tiefengraber, M., Knepp, T. N., Herndon, S., Herman, J. R., Müller, M., Abuhassan, N., Cede, A., Richter, D., Walega, J., Crawford, J., Szykman, J., Valin, L., Williams, D. J., Long, R., Swap, R. J., Lee, Y., Nowak, N., and Poche, B.: The first evaluation of formaldehyde column observations by improved Pandora spectrometers during the KORUS-AQ field study, Atmos. Meas. Tech., 11, 4943–4961, https://doi.org/10.5194/amt-11-4943-2018, 2018.
Stein, A. F., Draxler, R. R., Rolph, G. D., Stunder, B. J. B., Cohen, M. D., and Ngan, F.: NOAA's HYSPLIT Atmospheric Transport and Dispersion Modeling System, B. Am. Meteorol. Soc., 96, 2059–2077, https://doi.org/10.1175/BAMS-D-14-00110.1, 2015.
Su, W., Liu, C., Hu, Q., Zhao, S., Sun, Y., Wang, W., Zhu, Y., Liu, J., and Kim, J.: Primary and secondary sources of ambient formaldehyde in the Yangtze River Delta based on Ozone Mapping and Profiler Suite (OMPS) observations, Atmos. Chem. Phys., 19, 6717–6736, https://doi.org/10.5194/acp-19-6717-2019, 2019.
The International GEOS-Chem User Community: geoschem/GCHP: GCHP 14.4.0, https://doi.org/10.5281/ZENODO.11403806, 2024.
Thorp, T., Arnold, S. R., Pope, R. J., Spracklen, D. V., Conibear, L., Knote, C., Arshinov, M., Belan, B., Asmi, E., Laurila, T., Skorokhod, A. I., Nieminen, T., and Petäjä, T.: Late-spring and summertime tropospheric ozone and NO2 in western Siberia and the Russian Arctic: regional model evaluation and sensitivities, Atmos. Chem. Phys., 21, 4677–4697, https://doi.org/10.5194/acp-21-4677-2021, 2021.
Tirpitz, J.-L., Frieß, U., Hendrick, F., Alberti, C., Allaart, M., Apituley, A., Bais, A., Beirle, S., Berkhout, S., Bognar, K., Bösch, T., Bruchkouski, I., Cede, A., Chan, K. L., den Hoed, M., Donner, S., Drosoglou, T., Fayt, C., Friedrich, M. M., Frumau, A., Gast, L., Gielen, C., Gomez-Martín, L., Hao, N., Hensen, A., Henzing, B., Hermans, C., Jin, J., Kreher, K., Kuhn, J., Lampel, J., Li, A., Liu, C., Liu, H., Ma, J., Merlaud, A., Peters, E., Pinardi, G., Piters, A., Platt, U., Puentedura, O., Richter, A., Schmitt, S., Spinei, E., Stein Zweers, D., Strong, K., Swart, D., Tack, F., Tiefengraber, M., van der Hoff, R., van Roozendael, M., Vlemmix, T., Vonk, J., Wagner, T., Wang, Y., Wang, Z., Wenig, M., Wiegner, M., Wittrock, F., Xie, P., Xing, C., Xu, J., Yela, M., Zhang, C., and Zhao, X.: Intercomparison of MAX-DOAS vertical profile retrieval algorithms: studies on field data from the CINDI-2 campaign, Atmos. Meas. Tech., 14, 1–35, https://doi.org/10.5194/amt-14-1-2021, 2021.
Tonnesen, G. S. and Dennis, R. L.: Analysis of radical propagation efficiency to assess ozone sensitivity to hydrocarbons and NOx: 2. Long-lived species as indicators of ozone concentration sensitivity, J. Geophys. Res.-Atmos., 105, 9227–9241, https://doi.org/10.1029/1999jd900372, 2000.
Travis, K. R. and Jacob, D. J.: Systematic bias in evaluating chemical transport models with maximum daily 8 h average (MDA8) surface ozone for air quality applications: a case study with GEOS-Chem v9.02, Geosci. Model Dev., 12, 3641–3648, https://doi.org/10.5194/gmd-12-3641-2019, 2019.
Travis, K. R., Jacob, D. J., Fisher, J. A., Kim, P. S., Marais, E. A., Zhu, L., Yu, K., Miller, C. C., Yantosca, R. M., Sulprizio, M. P., Thompson, A. M., Wennberg, P. O., Crounse, J. D., St. Clair, J. M., Cohen, R. C., Laughner, J. L., Dibb, J. E., Hall, S. R., Ullmann, K., Wolfe, G. M., Pollack, I. B., Peischl, J., Neuman, J. A., and Zhou, X.: Why do models overestimate surface ozone in the Southeast United States?, Atmos. Chem. Phys., 16, 13561–13577, https://doi.org/10.5194/acp-16-13561-2016, 2016.
van der Werf, G. R., Randerson, J. T., Giglio, L., van Leeuwen, T. T., Chen, Y., Rogers, B. M., Mu, M., van Marle, M. J. E., Morton, D. C., Collatz, G. J., Yokelson, R. J., and Kasibhatla, P. S.: Global fire emissions estimates during 1997–2016, Earth Syst. Sci. Data, 9, 697–720, https://doi.org/10.5194/essd-9-697-2017, 2017.
Verhoelst, T., Compernolle, S., Pinardi, G., Lambert, J.-C., Eskes, H. J., Eichmann, K.-U., Fjæraa, A. M., Granville, J., Niemeijer, S., Cede, A., Tiefengraber, M., Hendrick, F., Pazmiño, A., Bais, A., Bazureau, A., Boersma, K. F., Bognar, K., Dehn, A., Donner, S., Elokhov, A., Gebetsberger, M., Goutail, F., Grutter de la Mora, M., Gruzdev, A., Gratsea, M., Hansen, G. H., Irie, H., Jepsen, N., Kanaya, Y., Karagkiozidis, D., Kivi, R., Kreher, K., Levelt, P. F., Liu, C., Müller, M., Navarro Comas, M., Piters, A. J. M., Pommereau, J.-P., Portafaix, T., Prados-Roman, C., Puentedura, O., Querel, R., Remmers, J., Richter, A., Rimmer, J., Rivera Cárdenas, C., Saavedra de Miguel, L., Sinyakov, V. P., Stremme, W., Strong, K., Van Roozendael, M., Veefkind, J. P., Wagner, T., Wittrock, F., Yela González, M., and Zehner, C.: Ground-based validation of the Copernicus Sentinel-5P TROPOMI NO2 measurements with the NDACC ZSL-DOAS, MAX-DOAS and Pandonia global networks, Atmos. Meas. Tech., 14, 481–510, https://doi.org/10.5194/amt-14-481-2021, 2021.
Wang, H., Welch, A. M., Nagalingam, S., Leong, C., Czimczik, C. I., Tang, J., Seco, R., Rinnan, R., Vettikkat, L., Schobesberger, S., Holst, T., Brijesh, S., Sheesley, R. J., Barsanti, K. C., and Guenther, A. B.: High temperature sensitivity of Arctic isoprene emissions explained by sedges, Nat. Commun., 15, 6144, https://doi.org/10.1038/s41467-024-49960-0, 2024.
Wang, Z., Zhang, H., Shi, C., Ji, X., Zhu, Y., Xia, C., Sun, X., Zhang, M., Lin, X., Yan, S., Zhou, Y., Xing, C., Chen, Y., and Liu, C.: Vertical and spatial differences in ozone formation sensitivities under different ozone pollution levels in eastern Chinese cities, npj Clim. Atmos. Sci., 8, 30, https://doi.org/10.1038/s41612-024-00855-3, 2025.
Weng, H., Lin, J., Martin, R., Millet, D. B., Jaeglé, L., Ridley, D., Keller, C., Li, C., Du, M., and Meng, J.: Global high-resolution emissions of soil NOx, sea salt aerosols, and biogenic volatile organic compounds, Sci. Data, 7, 148, https://doi.org/10.1038/s41597-020-0488-5, 2020.
Wu, W., Fu, T.-M., Arnold, S. R., Spracklen, D. V., Zhang, A., Tao, W., Wang, X., Hou, Y., Mo, J., Chen, J., Li, Y., Feng, X., Lin, H., Huang, Z., Zheng, J., Shen, H., Zhu, L., Wang, C., Ye, J., and Yang, X.: Temperature-Dependent Evaporative Anthropogenic VOC Emissions Significantly Exacerbate Regional Ozone Pollution, Environ. Sci. Technol., 58, 5430–5441, https://doi.org/10.1021/acs.est.3c09122, 2024.
Xing, C., Liu, C., Hong, Q., Liu, H., Wu, H., Lin, J., Song, Y., Chen, Y., Liu, T., Hu, Q., Tan, W., and Lin, H.: Vertical distributions and potential sources of wintertime atmospheric pollutants and the corresponding ozone production on the coast of Bohai Sea, J. Environ. Manage., 319, 115721, https://doi.org/10.1016/j.jenvman.2022.115721, 2022.
Xu, X., Huang, L., Yao, L., Yoshida, Y., and Long, Y.: Rising socio-economic costs of PM2.5 pollution and medical service mismatching, Nat. Sustain., 8, 265–275, https://doi.org/10.1038/s41893-025-01509-9, 2025.
Xue, J., Zhao, T., Luo, Y., Miao, C., Su, P., Liu, F., Zhang, G., Qin, S., Song, Y., Bu, N., and Xing, C.: Identification of ozone sensitivity for NO2 and secondary HCHO based on MAX-DOAS measurements in northeast China, Environ. Int., 160, 107048, https://doi.org/10.1016/j.envint.2021.107048, 2022.
Yang, Q., Jin, X., Wang, H., Fiore, A. M., Tao, M., Kim, J., Cho, Y., Lee, W., Lee, D., Yuan, Q., Zhang, C., Liu, C., Li, K., Lu, X., and Gao, M.: Geostationary Air Quality Monitoring Substantiates Column NO2 as a Better O3 Formation Regime Indicator in China, J. Geophys. Res.-Atmos., 131, e2025JD045271, https://doi.org/10.1029/2025JD045271, 2026.
Zhang, S., Wang, S., Zhang, R., Guo, Y., Yan, Y., Ding, Z., and Zhou, B.: Investigating the Sources of Formaldehyde and Corresponding Photochemical Indications at a Suburb Site in Shanghai From MAX-DOAS Measurements, J. Geophys. Res.-Atmos., 126, e2020JD033351, https://doi.org/10.1029/2020JD033351, 2021.
Zogka, A. G., Romanias, M. N., and Thevenet, F.: Formaldehyde and glyoxal measurement deploying a selected ion flow tube mass spectrometer (SIFT-MS), Atmos. Meas. Tech., 15, 2001–2019, https://doi.org/10.5194/amt-15-2001-2022, 2022.