the Creative Commons Attribution 4.0 License.
the Creative Commons Attribution 4.0 License.
 | 11 Jun 2026
Observation of the lunar tide in the middle atmosphere by the Aura Microwave Limb Sounder
Klemens Hocke
Because of the near-polar, sun-synchronous orbit of the Aura satellite, the Microwave Limb Sounder (Aura/MLS) observes the lunar tide as a lunar semimonthly variation of geopotential height and temperature in the middle atmosphere. The FFT spectrum of the mesospheric geopotential height time series from 2004 to 2021 shows a significant spectral peak at a period of 14.7653 d which is a half lunar month. The lunar tidal signal is clearer in geopotential height than in temperature. For the first time, the characteristics of the lunar tide in geopotential height (or pressure) are observed for the middle atmosphere. The latitudinal dependence of the observed mesospheric lunar tidal amplitude is in a good agreement with the numerical simulation of Geller. The climatology of the lunar tide shows larger amplitudes in January than in July at low latitudes, in agreement with the simulation. Generally, the observed lunar tide in geopotential height is smalller by a factor 2–3 than the simulated lunar tide. The vertical phase gradient of the observed lunar tide agrees well with the simulated vertical phase gradient.
- Article
(6885 KB) - Full-text XML
- BibTeX
- EndNote


Compared to solar thermal tides, the amplitudes of atmospheric lunar tides are small. In spite of this, Vial and Forbes (1994) emphasized that atmospheric lunar tides are attractive for theoretical and observational studies because their frequencies and forcing are better determined than for any other atmospheric waves. The main lunar tide is the semidiurnal tide M2 which has a period of 12.42 h and a zonal wavenumber 2. The lunar tide is maximal in the tropics where its surface air pressure variation is between 5 and 10 Pa (Schindelegger et al., 2023; Hagan et al., 2003; Lindzen and Chapman, 1969). This pressure variation could be transformed to an oscillation of the geopotential height of a fixed pressure level close to the ground. Assuming a pressure gradient of 9 Pa m−1, the geopotential height amplitude would be about 0.5 to 1.1 m at the ground level. The simulation of Geller (1970) has values of about 0.4 m as oscillation of geopotential height of the pressure level at ground.
Similar to atmospheric gravity waves, the lunar tide strongly amplifies during its way upward to the lower thermosphere. Recently, it has been recognized that the lunar tide is amplified in addition by a factor 2 or 3 during sudden stratospheric warmings (SSWs), so that the lunar tide should be considered for a better modeling and understanding of space weather (Zhang et al., 2014; Pedatella et al., 2016). Conte et al. (2019) emphasized that the lunar tide is only amplified during SSWs that are accompanied by strong polar night jet oscillations (PJO).
Hocke (2025) showed that the amplification of the lunar tide by the perigee transit of the Moon can be utilized as a signal to retrieve the average travel time of the lunar tide from the surface to the ionosphere. With a delay of about 3 d the lunar tide arrives in the dynamo region where it induces ionospheric electric currents. These currents are associated with magnetic field variations which can be observed by ground-based magnetometers. Bartels and Johnston (1940) reported about big L days where the lunar tidal variation in horizontal intensity of the geomagnetic field is stronger than usual. Hocke and Ma (2025) found a close relationship between the big L days in ionospheric total electron content (TEC) and the occurrence of SSWs. The spatio-temporal variations of TEC are monitored by ground stations of the Global Navigation Satellite System (GNSS). The lunar tide-induced TEC variations are mainly due to electrodynamic lifting of the equatorial ionospheric plasma as a consequence of the electric field variations in the dynamo region (Yamazaki and Richmond, 2013; Lieberman et al., 2022). A relationship between geomagnetic lunar tides and SSWs was previously detected in magnetometer data by Yamazaki (2013) who found that the M2 amplitude during SSW events is approximately 3 times as large as that for non-SSW winters.
Observations of the lunar tide in the middle atmosphere have been reported for the parameters temperature and horizontal wind, and articles about numerical simulations of lunar tides in the middle atmosphere are usually focusing on these parameters (Vial and Forbes, 1994; Pedatella et al., 2012; Forbes et al., 2013). An exception is the study of Geller (1970) who performed a numerical simulation of the lunar tide from the ground to 100 km height and who presented all the simulations results for the lunar semidiurnal tide in geopotential height. Thus, the results of the present observational study of Aura/MLS can be compared to the simulation by Geller (1970).
Geller showed that the lunar tidal amplitude in geopotential height at the equator is about 220 m at 90 km height in January and about 99 m in July. This amplitude variation is due to a change of the vertical thermal structure which favors a more propagating wave (smaller vertical wavelength) in January and a more standing wave (larger vertical wavelength) in July. The phase progression with height is a bit larger in January than in July (Geller, 1970). However, the phase profiles are relatively steep in both months favouring a (2,2) wave mode of the lunar tide. (2,2) refers to the tidal wave mode (m,n) where m is the zonal wave number and n is the meridional mode number. The latitude structure is described by the Hough function with n–m internal nodes where the tidal amplitude is zero. The (2,2) mode is symmetric with a maximum of the tidal amplitude at the equator and a decrease of the amplitude towards the poles. While the (2,2) mode propagates vertically with a long wavelength of about 300 km, the (2,4) mode has a shorter vertical wavelength. Forbes (1982) found that the (2,2) mode of the lunar tide is dominant below 70 km height. Above, the (2,4) wave mode with a short vertical wavelength of 40–60 km increases in amplitude. Observational studies from ground-based radars often identify a (2,4) mode of the lunar tide with vertical wavelengths less than 60 km in the mesosphere (Tsuda et al., 1981; Sandford et al., 2006). However, observations by Paulino et al. (2012) show both: in some months vertical wavelengths larger than 100 km and in other months vertical wavelengths less than 60 km.
The lunar tide in temperature is about 0.008 K at ground in Batavia (Chapman, 1951) and increases to about 0.6 K in 90 km height above the equator (TIMED/SABER observation in Forbes et al., 2013). Schlapp (1981) reported a lunar tidal amplitude of 0.4 K in 80 km height in NIMBUS satellite data. The simulation of Geller (1970) showed an amplitude of 0.45 K in July above the equator and 1.7 K in January. The small value of the lunar temperature tidal amplitude at ground observed by Chapman (1951) was confirmed in a new study by Sakazaki and Hamilton (2018) who found a lunar tidal amplitude of 0.007 K observed by 38 buoys across the tropical Pacific and Atlantic. The phase of the lunar temperature tide is quite close to the phase of the lunar tide in geopotential height (Geller, 1970). The lunar temperature tide has in first order an adiabatic relationship to the lunar tide in pressure (or geopotential height) (Chapman, 1932).
The present study will focus on the lunar tide in geopotential height in the mesosphere observed by Aura/MLS from 2004 to 2021. The reason is that the lunar tidal signal is significant at mesospheric heights and we will see that the lunar tidal signal in geopotential height is clearer than in temperature. The reason is possibly that the pressure perturbation by the gravitational forcing of the Moon is the primary perturbation and the temperature perturbation is a consequence of the pressure perturbation. It seems that the present study is the first observational investigation of the lunar tide in geopotential height (or pressure) in the middle atmosphere. The study describes the Aura/MLS mission and the data analysis in Sect. 2. The results are presented in Sect. 3. A discussion of the results is in Sect. 4, and the conclusions are given in Sect. 5.
2.1 Aura/MLS Observation
The Microwave Limb Sounder (MLS) on the NASA satellite Aura observes the temperature and geopotential height profiles in the middle atmosphere. The Aura satellite was launched in 2004, and the technical details of the instrument were described by Waters et al. (2006). Aura has a Sun-synchronous orbit in 705 km height with two equator overpasses at 01:45 and 13:45 local solar time (LST) in 2004. After 17 years of observation, the equator crossing times were 01:44 and 13:44 LST in 2021. Aura is in a near-polar orbit with an inclination of about 98°. The atmospheric profiles are sampled along the orbit with a distance of 1.48° in latitude. The orbit revolution time of Aura is about 99 min.
The present study is based on Level 2 data of Aura/MLS of the retrieval version 5. The data screening and quality check according to Livesey et al. (2022) were applied in the data analysis. The vertical range of the atmospheric profiles is from about 15 to 95 km. The Aura/MLS retrieval is performed on 41 pressure levels for the temperature and 42 pressure levels for the geopotential height. The temperature and geopotential height profiles are retrieved from the Aura/MLS measurements of the thermal microwave limb emissions of the O2 lines at 118 and 234 GHz (Schwartz et al., 2008). The a priori profile of mesospheric temperature and geopotential height originates from the COSPAR International Reference Atmosphere CIRA-86 (Schwartz et al., 2008).
The present study does not interpolate the retrieved values from pressure levels to altitude levels for two reasons. Firstly, to avoid errors due to interpolations. Secondly, the numerical simulation by Geller (1970) also presents the results on pressure levels, and so an intercomparison between model and Aura/MLS observation is better on pressure levels. The present study only uses the data from 2004 to the end of 2021, since in 2022 the number of the pressure levels of the retrieved Aura/MLS profiles was reduced from 42 to 37 because of a technical degradation of the MLS instrument. Again, in order to avoid interpolation errors between the different pressure grids before and after 2022, it is better to restrict the data analysis to the high quality profiles before 2022 and to omit the Aura/MLS observations from 2022 to 2025 in the present study.
The precision of the temperature profiles is about 1 K in the stratosphere and about 3 K in the mesosphere (Schwartz et al., 2008). Precision of geopotential height is 35 m from 316 to 100 hPa, 44 m at 1 hPa, and 110 m at 0.001 hPa (Schwartz et al., 2008). The precision characterizes the instrumental noise. Since the study is using 17 years of data and averages of latitudinal belts, the error of the mean (precision divided by square root of the number of atmospheric profiles) is much smaller than for example the 1 K of the precision in the stratosphere. However, at stratospheric heights, the spectral peak of the lunar tide disappears in the atmospheric noise background. In this case, the amplitude of the atmospheric noise background can serve as an upper boundary value for the lunar tide.
The lunar tide is sampled by Aura/MLS in a different manner as by a ground-based radar. While a ground-based radar observes the lunar tide as a lunar semidiurnal variation, Aura/MLS observes the lunar tide as a lunar semimonthly variation. This important difference in the observation of the lunar tide is illustrated in Fig. 1.
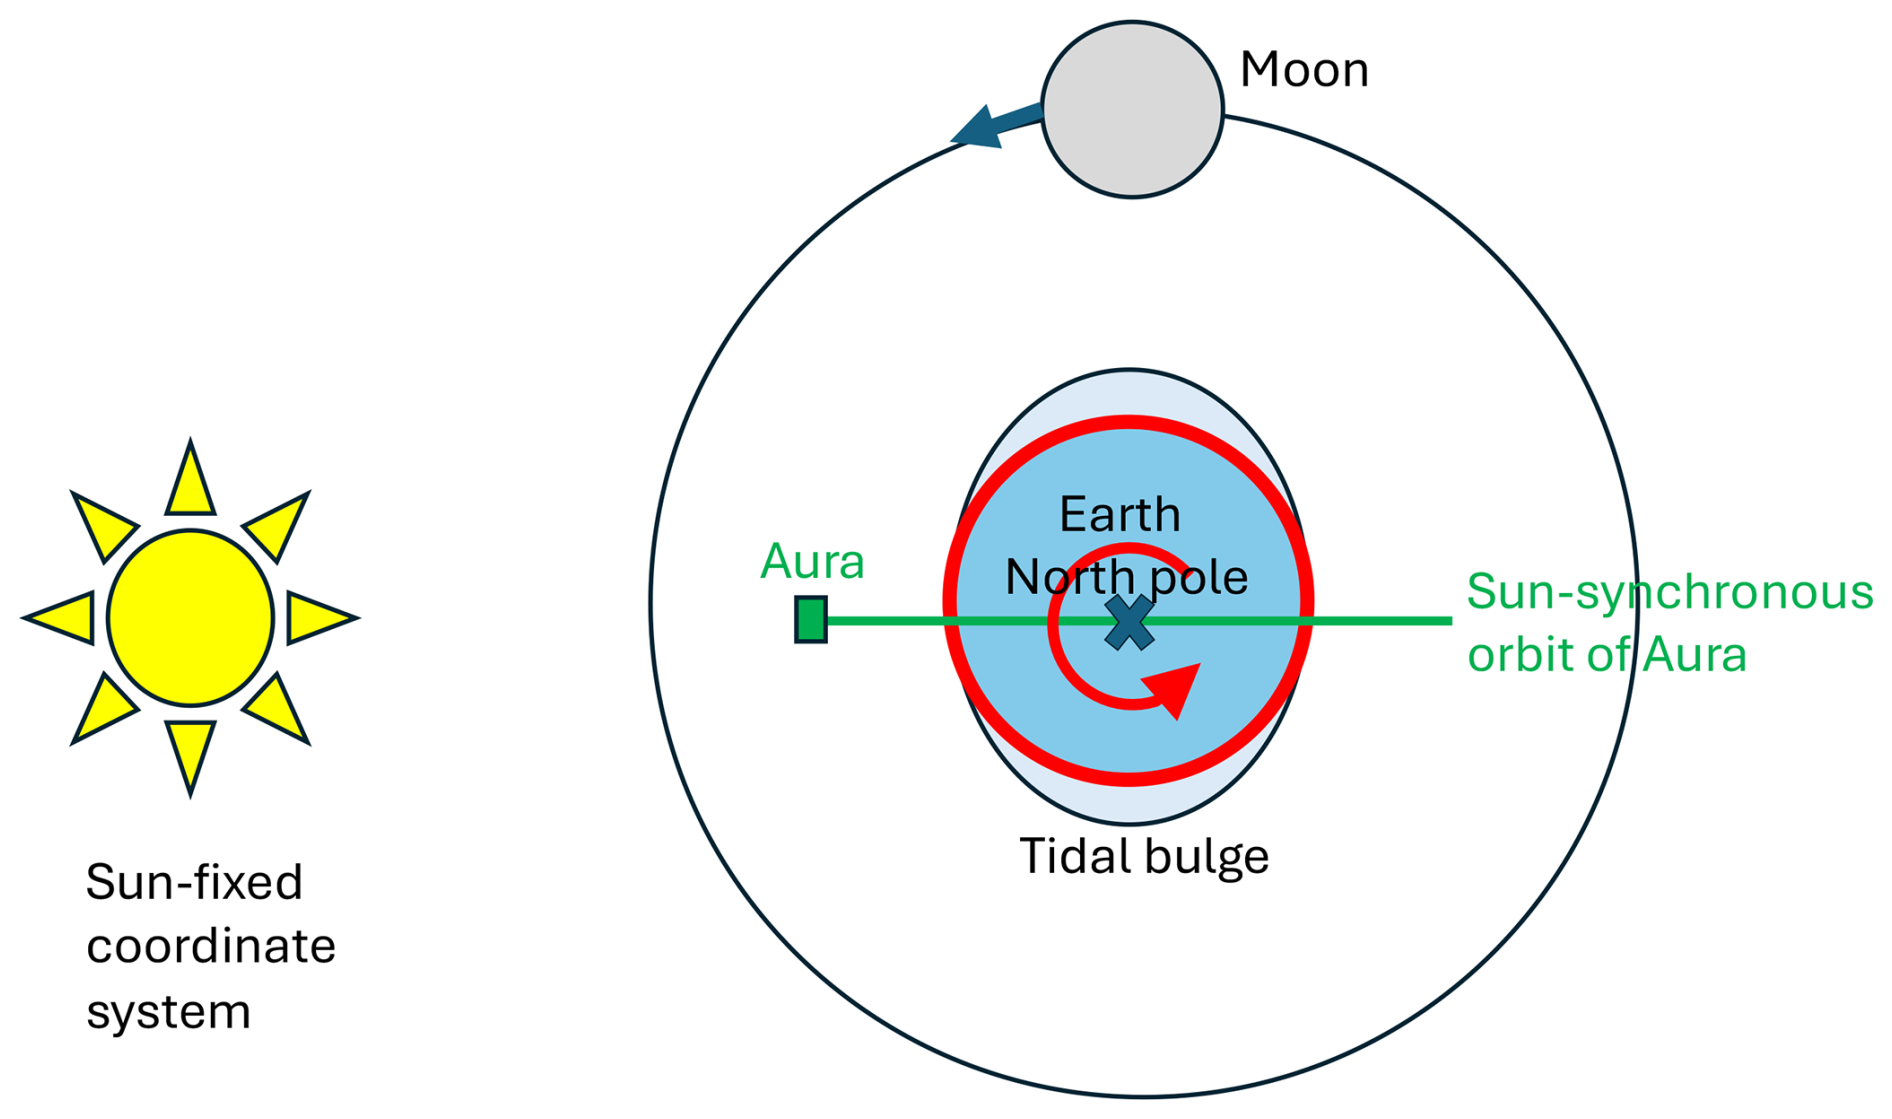
Figure 1Scheme of the observation geometry of the lunar tide measured by the Aura satellite in a near-polar, sun-synchronous orbit. The tidal bulges rotate with the Moon and appear in the Aura orbit with a period of a half lunar month.
The scheme shows two tidal bulges of the lunar M2 tide in the atmosphere. The bulge towards the Moon is due to the gravitational pull by the Moon, and the bulge in opposite direction is due to enhanced centrifugal forcing of the atmosphere when the Earth rotates around the center of mass of the Earth-Moon system. The aliasing frequency falias is defined as . In the Sun-fixed coordinate system of Fig. 1 the green line of the Aura orbit is fixed (no azimuthal rotation) so that fAura=0. The frequency of the tidal bulge ftidal bulge in the Sun-fixed coordinate system is . Thus, the aliasing frequency is equal to . The corresponding aliasing period of the lunar tide in the Aura dataset is = 14.7653 d.
The simplified scheme does not show that the tidal bulge varies with height. The tidal bulge is aligned with the Moon position at stratospheric heights but in the mesosphere there will be a phase delay of the tidal bulge with respect to the Moon. This phase delay is noticed by an observer at ground as the downward progression of the phase front of the lunar M2 tide. The amplitude profiles of the lunar semimonthly tide are comparable to those of the lunar semidiurnal tide. The comparison of the phase profiles is more difficult but at least the vertical gradient of the phase profile is comparable for both. In the present article, the results are shown for the lunar semimonthly tide which can be considered generally as lunar tide. Only the absolute value of the phase profile is not comparable to the lunar semidiurnal tide. The selected data analysis favours the detection of the M2 tide in the Aura/MLS data since the M2 tide appears with the same phase in the noon and midnight observations of Aura/MLS. Thus, the dominant lunar tidal perturbation with zonal wavenumber 2 remains in place in the average of the noon and midnight data of Aura at a given location.
2.2 Data Analysis
In the beginning of the investigation, the Aura/MLS data of the equatorial belt from 10° S to 10° N are analysed. For each day, the arithmetic mean of all observed atmospheric profiles is computed. The local time of the atmospheric profiles is either around noon or midnight. Since the lunar tide has a zonal wavenumber 2, the tidal bulges will appear similarly in both, in the atmospheric profile at noon and at midnight. Thus, the lunar tide is fully contained in the daily means of the selected atmospheric profiles. This results into a time series of daily profiles from 2004 to 2021. At each pressure level, the FFT spectrum of the whole time series (subtracted by the mean) is computed. The FFT frequency sample density is enhanced by zero padding where we add about 17 years of zeros before and after the time series subtracted by its mean value. The magnitude of spectral artifacts is reduced by means of a Hamming window which is applied to the series before the zero padding. The relative proportion of data gaps in the 17 years of Aura/MLS observations is only 1 %, and these gaps were closed by linear interpolation. The amplitude spectra is calibrated by means of a synthetic sine wave with known amplitude. The phase of the lunar semimonthly component is calibrated in such a way that phase 0° corresponds to New Moon and phase 180° corresponds to First Quarter Moon. For example, phase 180° means that Aura/MLS observed a maximum of the lunar tide when the Moon was at First Quarter Moon. The FFT spectrum of the whole series is possibly the best way to pronounce the spectral component of the lunar tide with the period of a half lunar month. Figs. 2 to 6 and 8 are based on the FFTs of the whole series, and the amplitudes and phases are determined from the FFT spectral peak at the period of a half lunar month, as explained above.
For analysis of the seasonal behaviour of the lunar tide (only for Figs. 7 and 9), digital filtering was applied to the time series of geopotential height or temperature. The time series are filtered with a digital non-recursive, finite impulse response bandpass filter. Zero-phase filtering is ensured by processing the time series in forward and reverse directions. A Hamming window was selected for the filter. The number of filter coefficients corresponds to a time window of 5 times the central period, so that the bandpass filter has a moderate response time to temporal changes in the data series. The bandpass cut-off frequencies are at , where fc is the cut off frequency and fp is the central frequency ( cycles d−1). Further details about the bandpass filtering are provided by Studer et al. (2012). The calculation of the amplitude envelope of the bandpass filtered series is described by Eq. (3) in Hocke (2008).
The FFT amplitude spectrum of the oscillations of geopotential height z of a fixed pressure level (0.0046 hPa) in about 82 km height is computed for the Aura/MLS measurements in the equatorial latitude belt (10° S to 10° N) from 2004 to 2021. Figure 2 shows a significant spectral peak at the expected Moon period ( lunar month indicated by the red line). The z amplitude of the lunar tidal variation reaches a value of about 38 m which is high above the spectrum continuum of 1 m or less. In addition, there are significant spectral peaks at the frequency of the annual oscillation and its harmonics (green lines in Fig. 2).
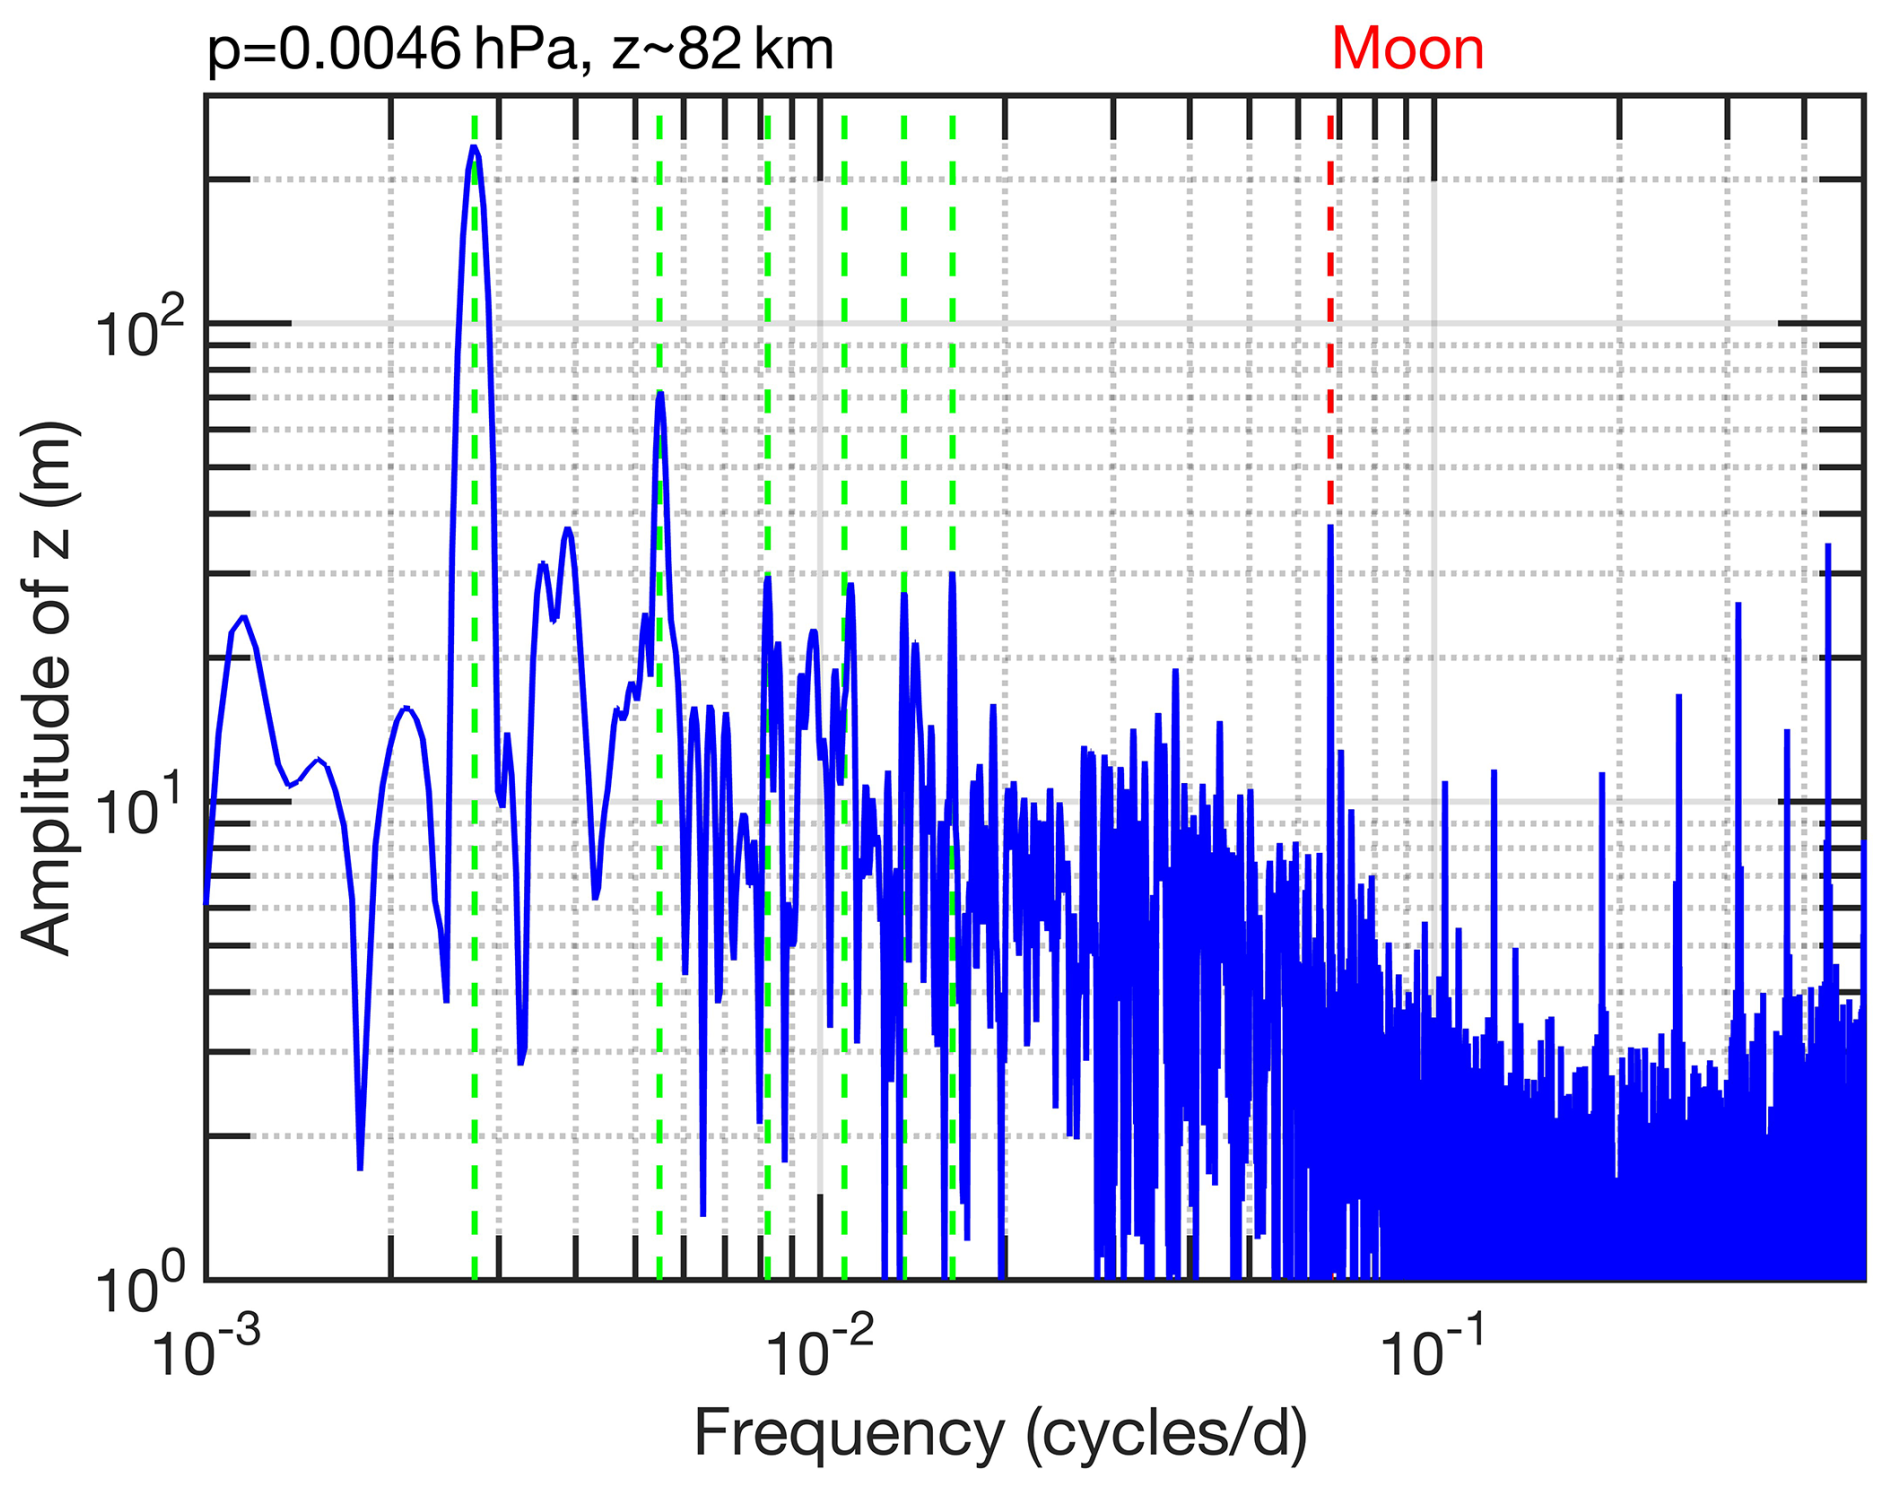
Figure 2FFT amplitude spectrum of oscillations of geopotential height z of a fixed pressure level (0.0046 hPa) in about 82 km height. Aura/MLS data from the equatorial latitude belt (10° S to 10° N) were taken for the time interval from 2004 to 2021. The vertical red dashed line indicates the frequency of the lunar semimonthly tide. The green dashed lines indicate the annual oscillation and its harmonics.
The FFT amplitude spectrum of the oscillations of temperature T of a fixed pressure level (0.0046 hPa) in about 82 km height is depicted in Fig. 3. The spectral line at the Moon period is still significant and reaches an amplitude of about 0.35 K while the spectrum continuum is at 0.15 K or less. Compared to the lunar z peak in Fig. 2, one can say that the lunar tidal peak in temperature in Fig. 3 is not so prevailing as that in geopotential height. Figure 3 shows further significant spectral peaks at the periods 2.3, 2.7, 3.2, 4.0, 5.3, and 8.0 d. These planetary wave-like oscillations also occur in the geopotential height fluctuations in Fig. 2. It is not clear why these oscillations of the equatorial zonal mean series appear at these discrete frequencies. In the literature, there are only a few reports about zonal mean oscillations in the middle atmosphere or planetary waves with zonal wave number zero (Ebel et al., 1978). A further investigation of these oscillations in Figs. 2 and 3 is beyond the scope of the present study which is focused on the lunar tide.
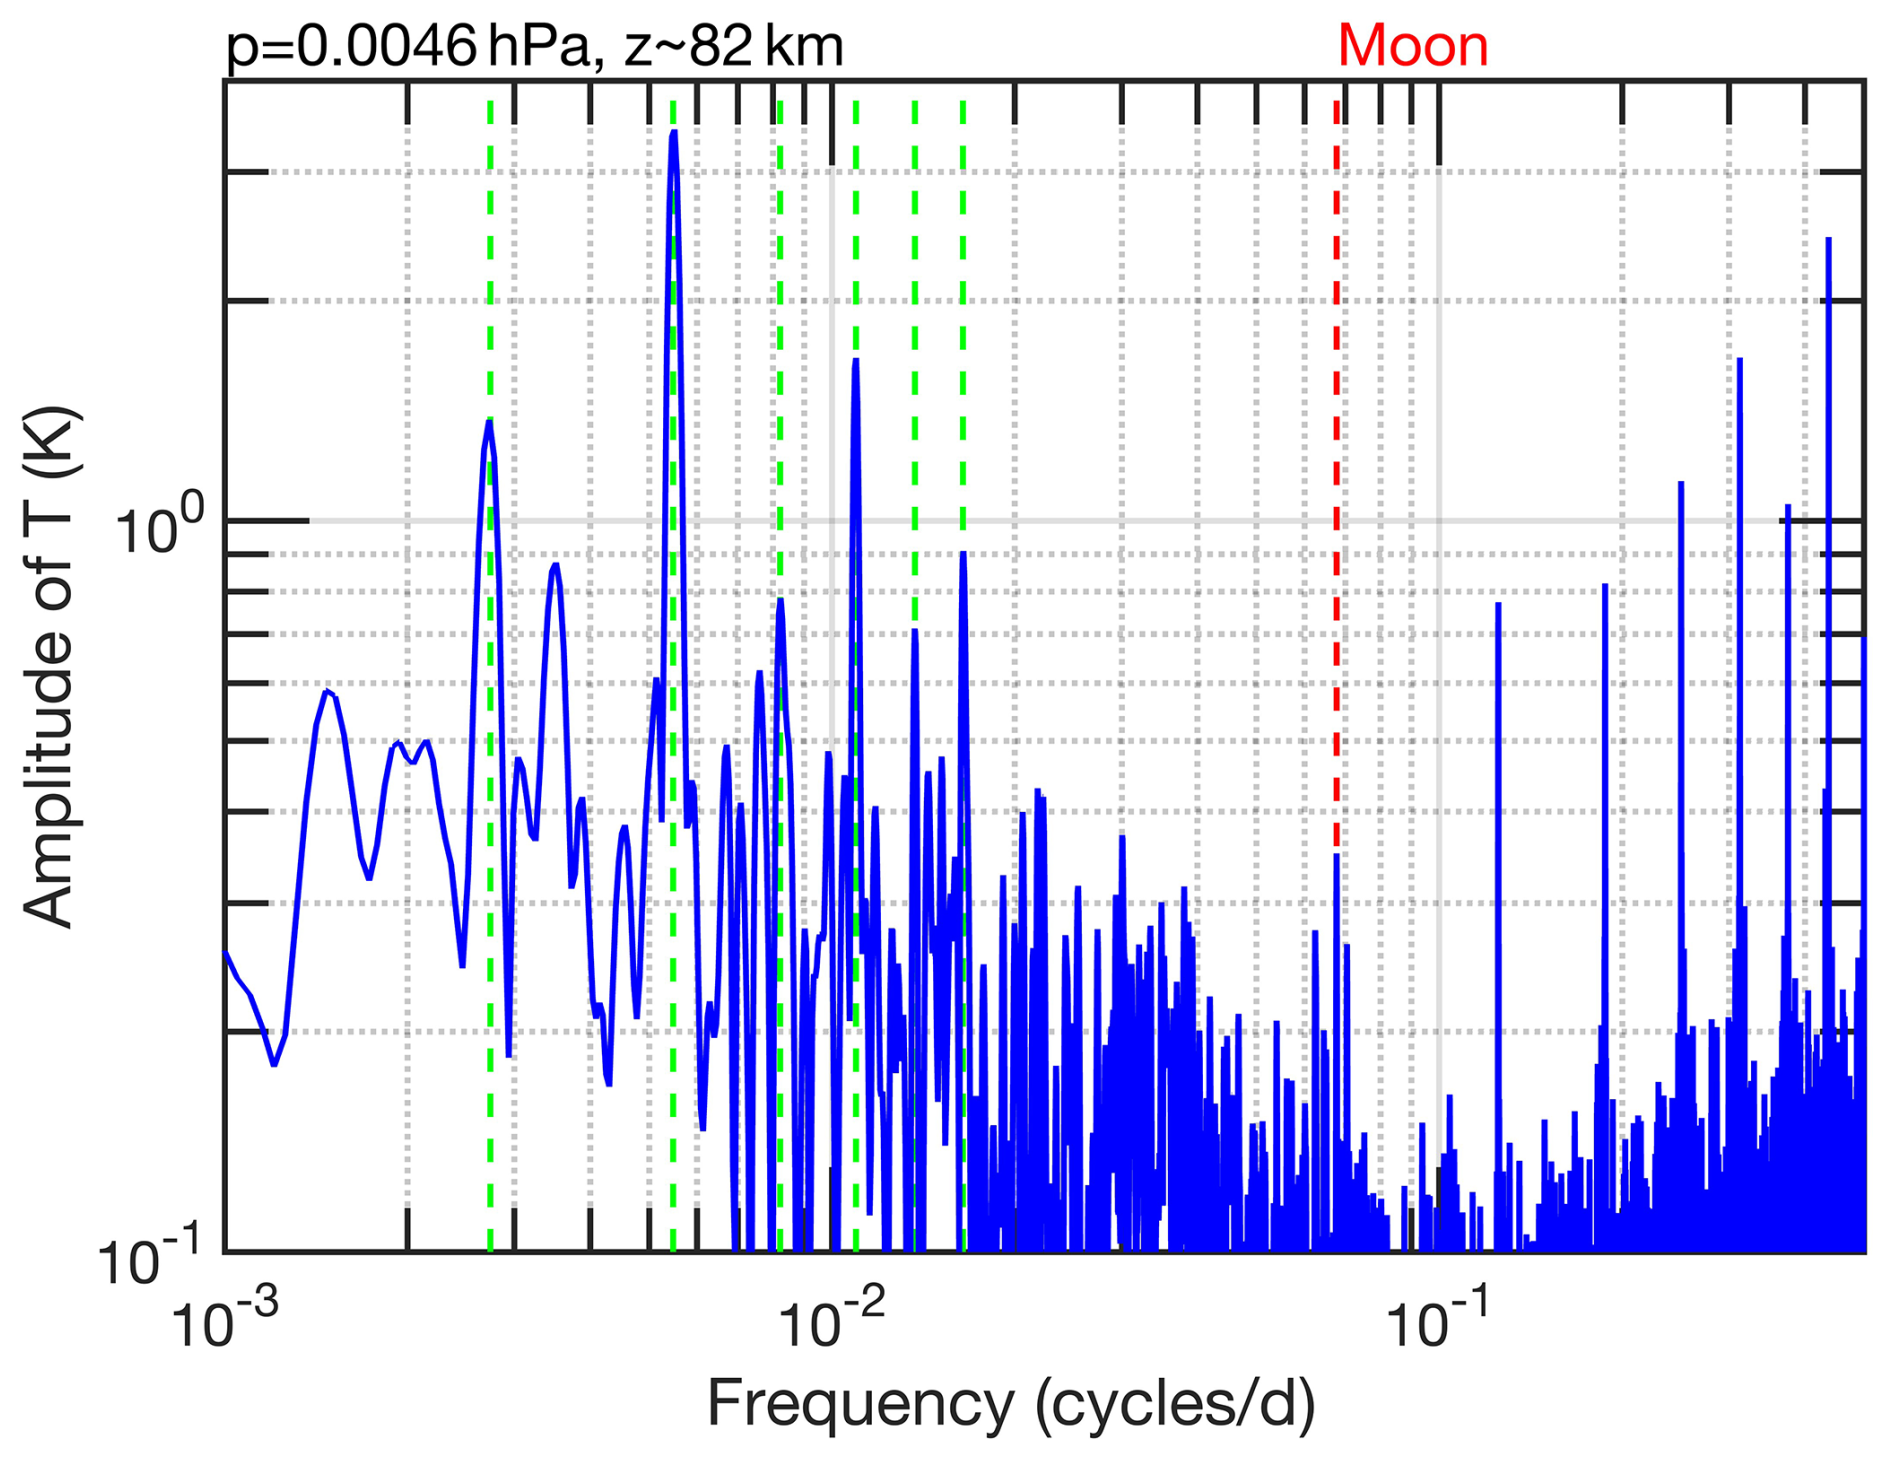
Figure 3FFT amplitude spectrum of oscillations of temperature T of a fixed pressure level (0.0046 hPa) in about 82 km height. Aura/MLS data from the equatorial latitude belt (10° S to 10° N) were taken for the time interval from 2004 to 2021. The vertical red dashed line indicates the frequency of the lunar semimonthly tide. The green dashed lines indicate the annual oscillation and its harmonics.
Using the FFT spectra at each pressure level, the vertical profile of the lunar tidal amplitude in geopotential height z is derived and shown in Fig. 4.
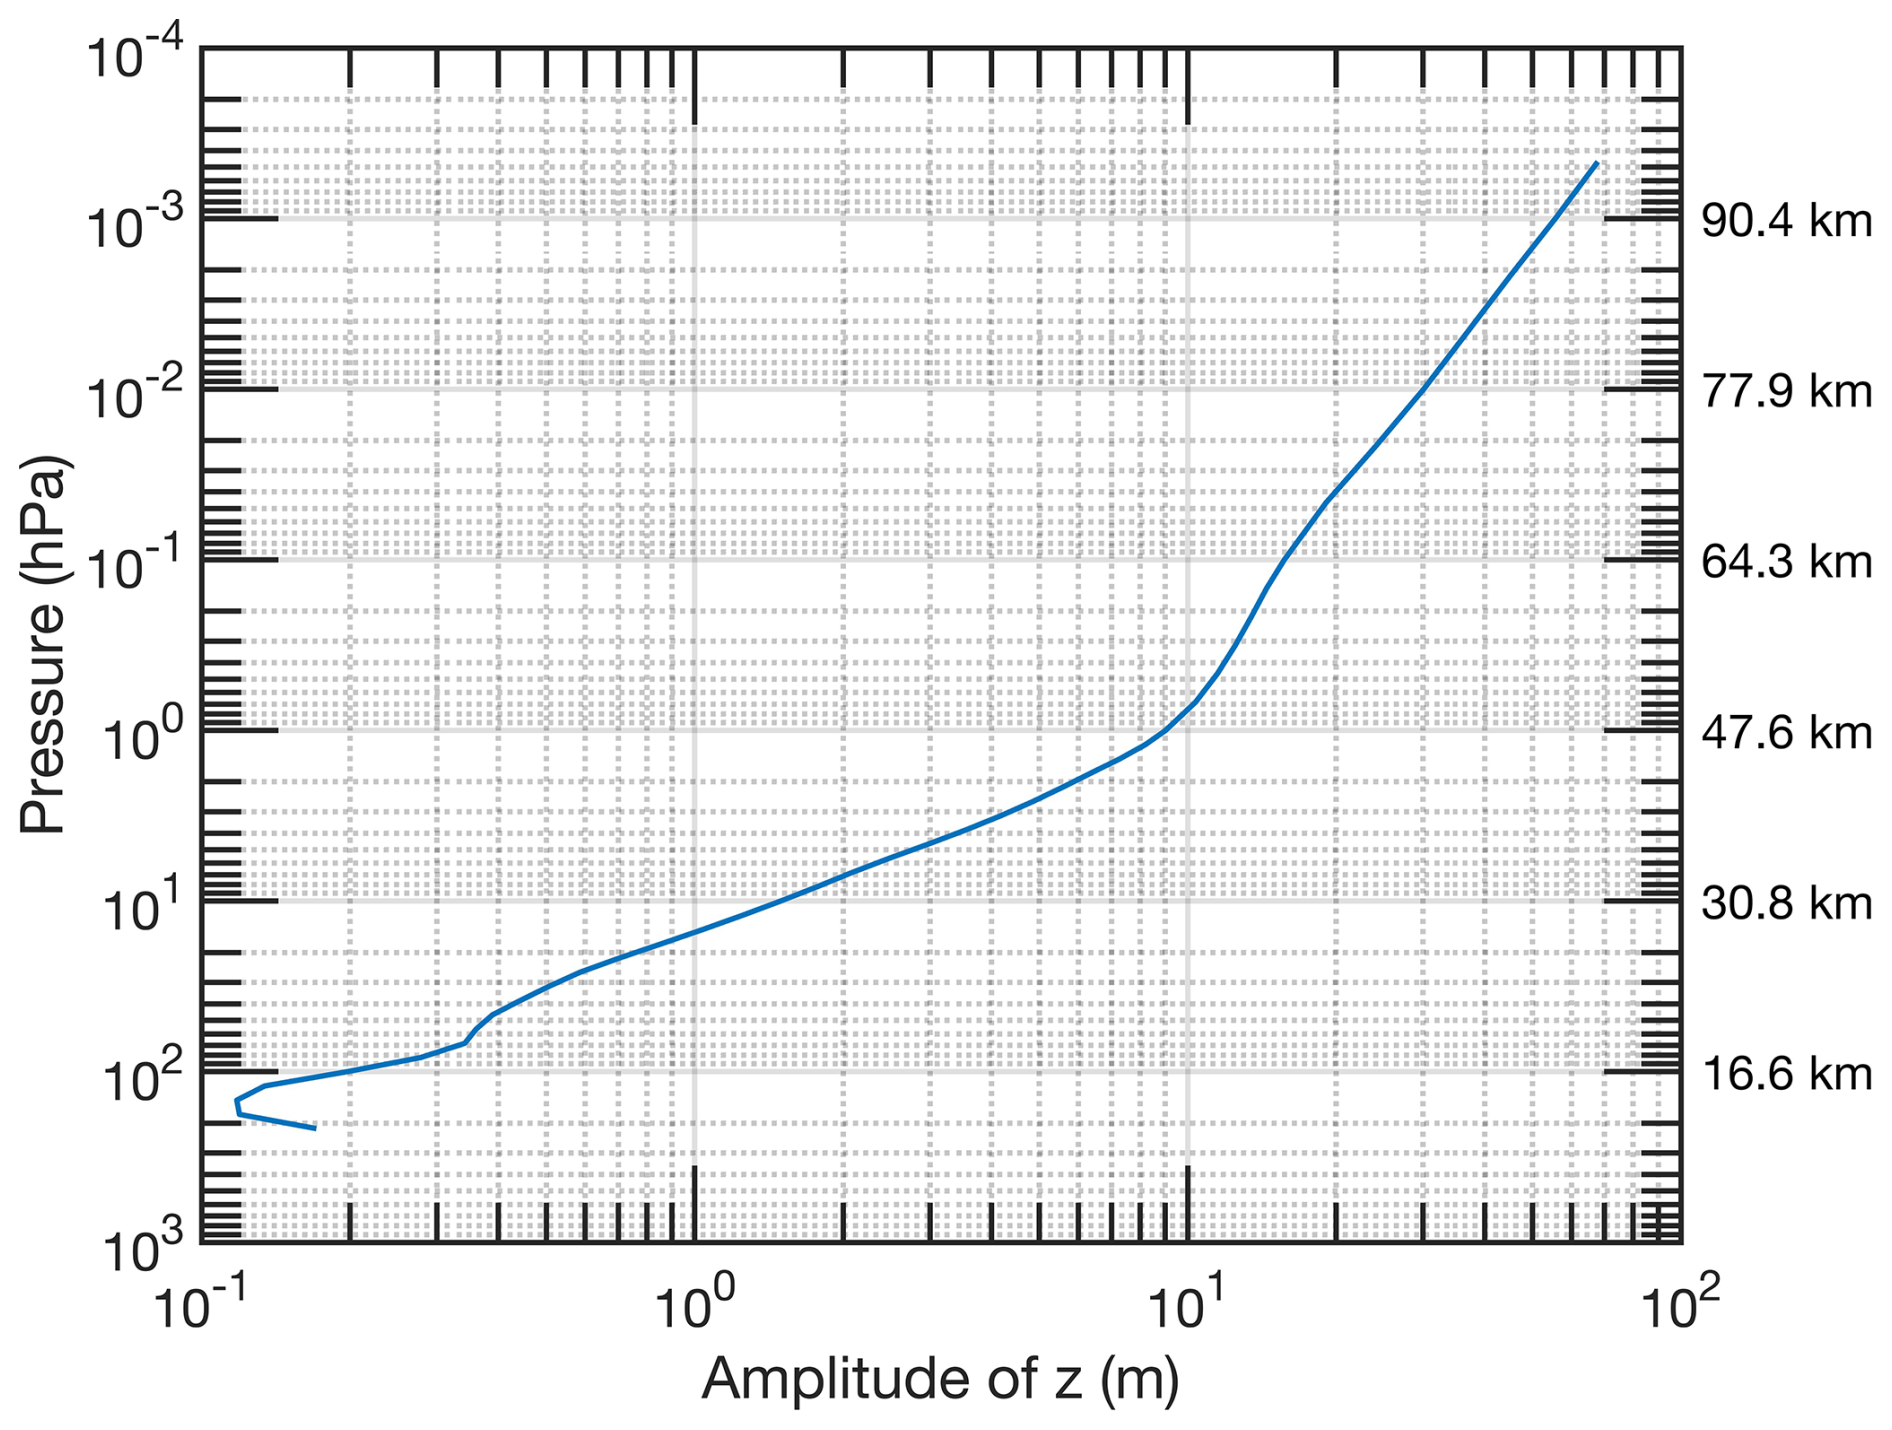
Figure 4Vertical profile of lunar tidal amplitude in geopotential height z. Aura/MLS data from the equatorial latitude belt (10° S to 10° N) were taken for the time interval from 2004 to 2021. The approximated heights of the pressure levels are given by labels at the right-hand side.
The z amplitude of the lunar tide in the Aura/MLS observations goes from 0.2 m at 16.6 km height to 55 m at 90.4 km height. The simulation of Geller (1970) showed z amplitudes of the lunar tide from 0.55 m at 15 km height to 99 m at 90 km height in July while these values increase to 0.71 m at 15 km and 220 m at 90 km height in January. Thus, the mean values of the lunar tide in geopotential height observed by Aura/MLS are roughly smaller by a factor of about 2–3 than the lunar tide in geopotential height simulated by Geller (1970). I assumed here that the mean of the January and July value of the z amplitude from Geller (1970) can be roughly compared to the annual mean of the z amplitude from Aura/MLS.
The vertical profile of the lunar tidal amplitude in temperature T is shown in Fig. 5. The T amplitude of the lunar tide in the Aura/MLS observations goes from 0.02 K at 16.6 km height to 0.68 K at 90.4 km height. The simulation of Geller (1970) showed T amplitudes of the lunar tide from 0.01 K at 15 km height to 1.1 K at 90 km height in July while these values are 0.01 K at 15 km and 3.0 K at 90 km height in January. Again, the simulated lunar tidal amplitudes in the upper mesosphere at 90 km height are roughly stronger by a factor 2–3 than the Aura observations of the mean lunar tide. The mean lunar tidal amplitude of about 0.68 K at 90.4 km height observed by Aura/MLS is in a good agreement with the temperature lunar tide in TIMED/SABER observations which are about 0.6 K at 90 km height Forbes et al. (2013). Also, the small value of 0.02 K in the lower stratosphere roughly fits to the 0.007 K amplitude of the lunar tide at the surface (Sakazaki and Hamilton, 2018) assuming an increase of the lunar tidal amplitude with height.
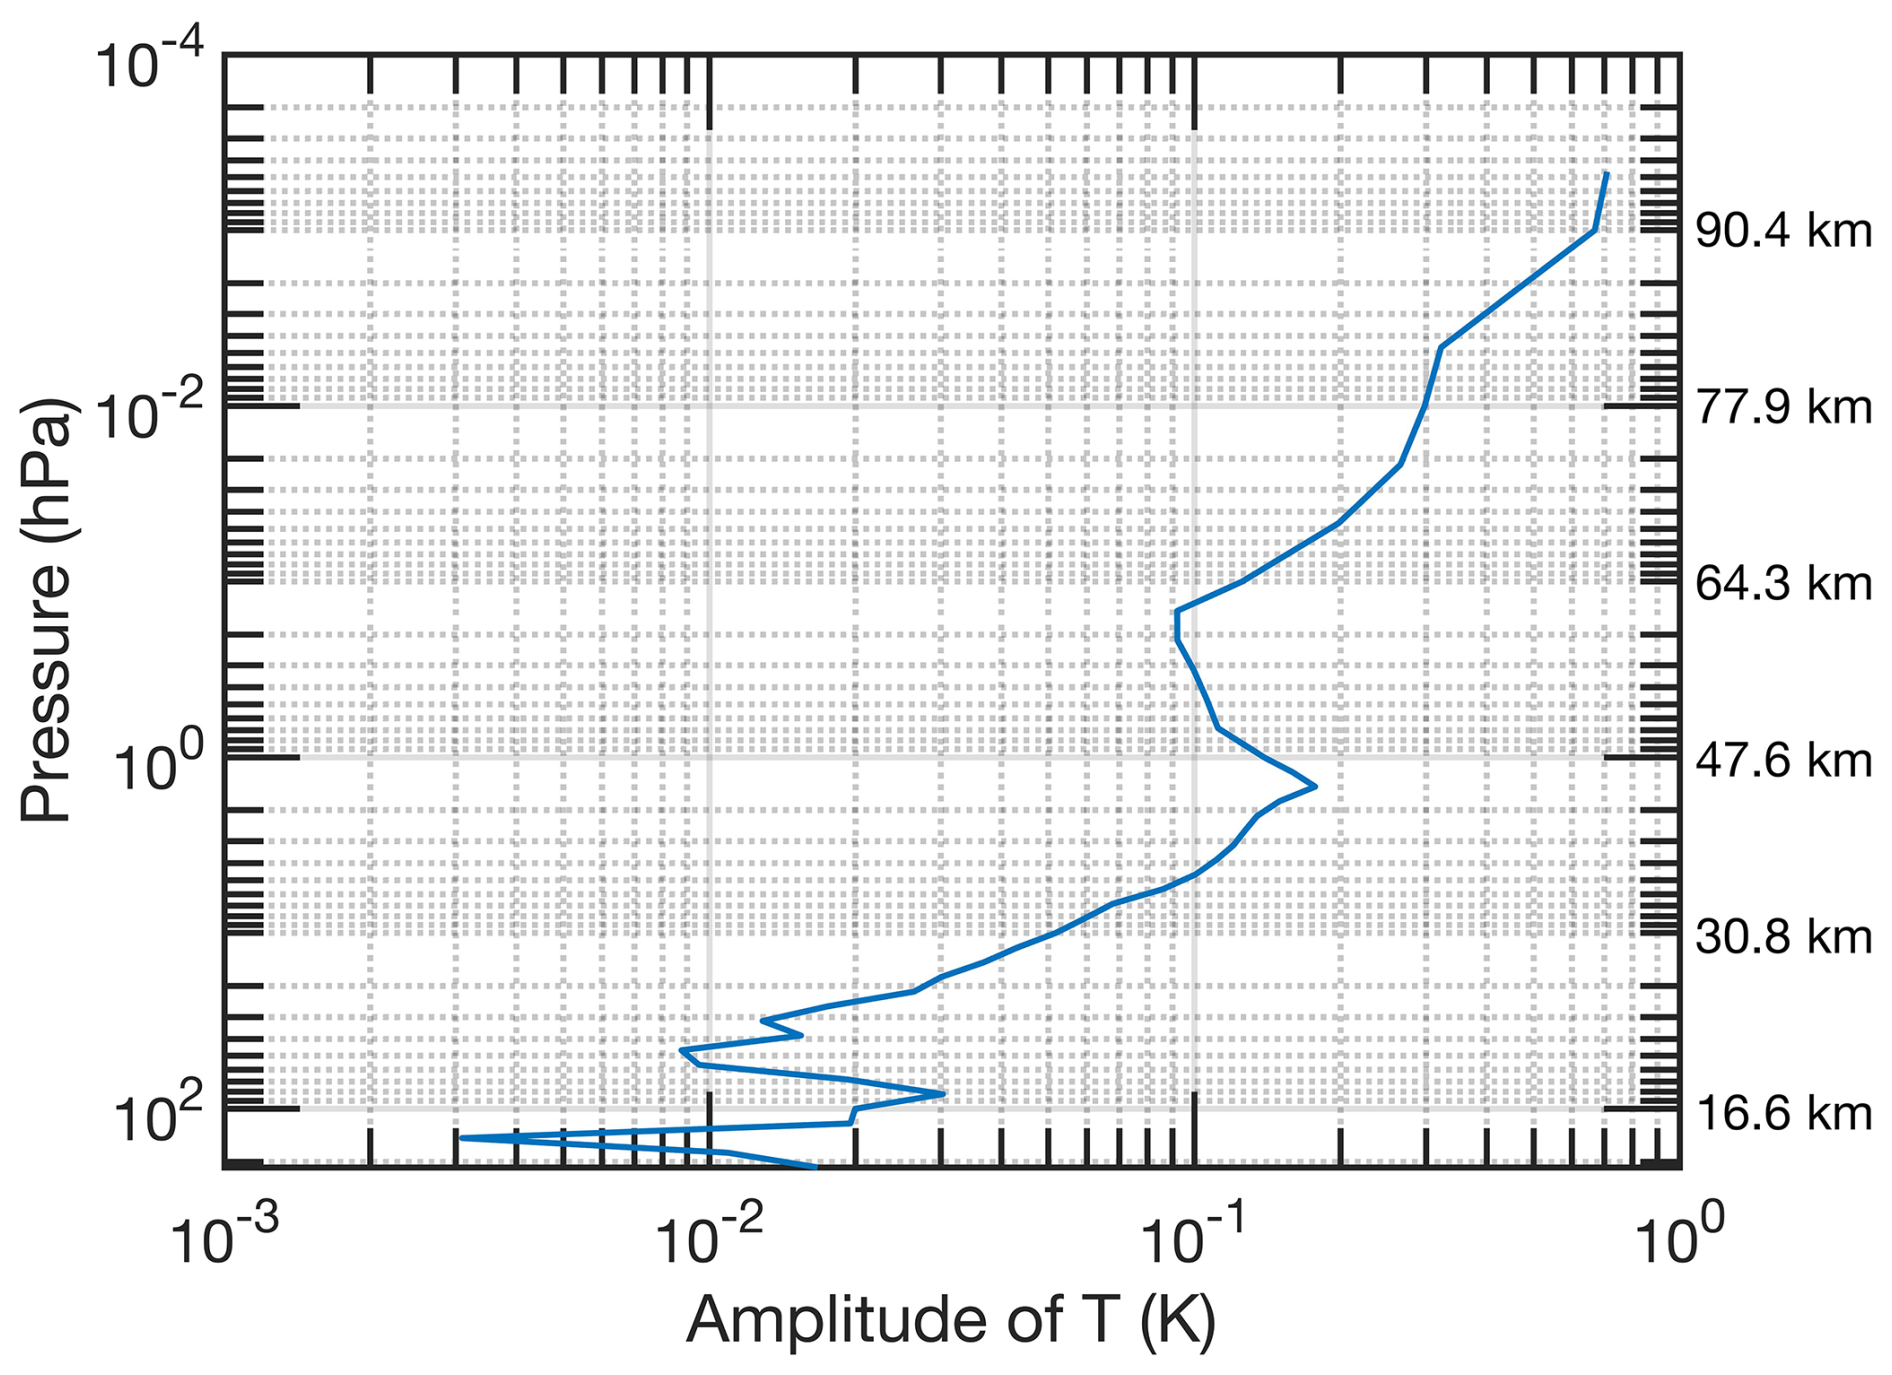
Figure 5Vertical profile of lunar tidal amplitude in temperature T. Aura/MLS data from the equatorial latitude belt (10° S to 10° N) were taken for the time interval from 2004 to 2021. The approximated heights of the pressure levels are given by labels at the right-hand side.
The vertical profiles of lunar tidal phase in geopotential height (red line) and temperature (blue line) are shown in Fig. 6. Similar to Geller (1970), both phase profiles are close together and slowly increase with height (as for a gravity wave with downward phase progression). The vertical wavelength is roughly around 500 km in the mesosphere but in case of the temperature phase profile a shorter vertical wavelength of about 80 km is present from 77 to 95 km. The simulation of Geller (1970) shows vertical phase gradients at mesospheric heights which indicate a vertical wavelength of about 500 km.
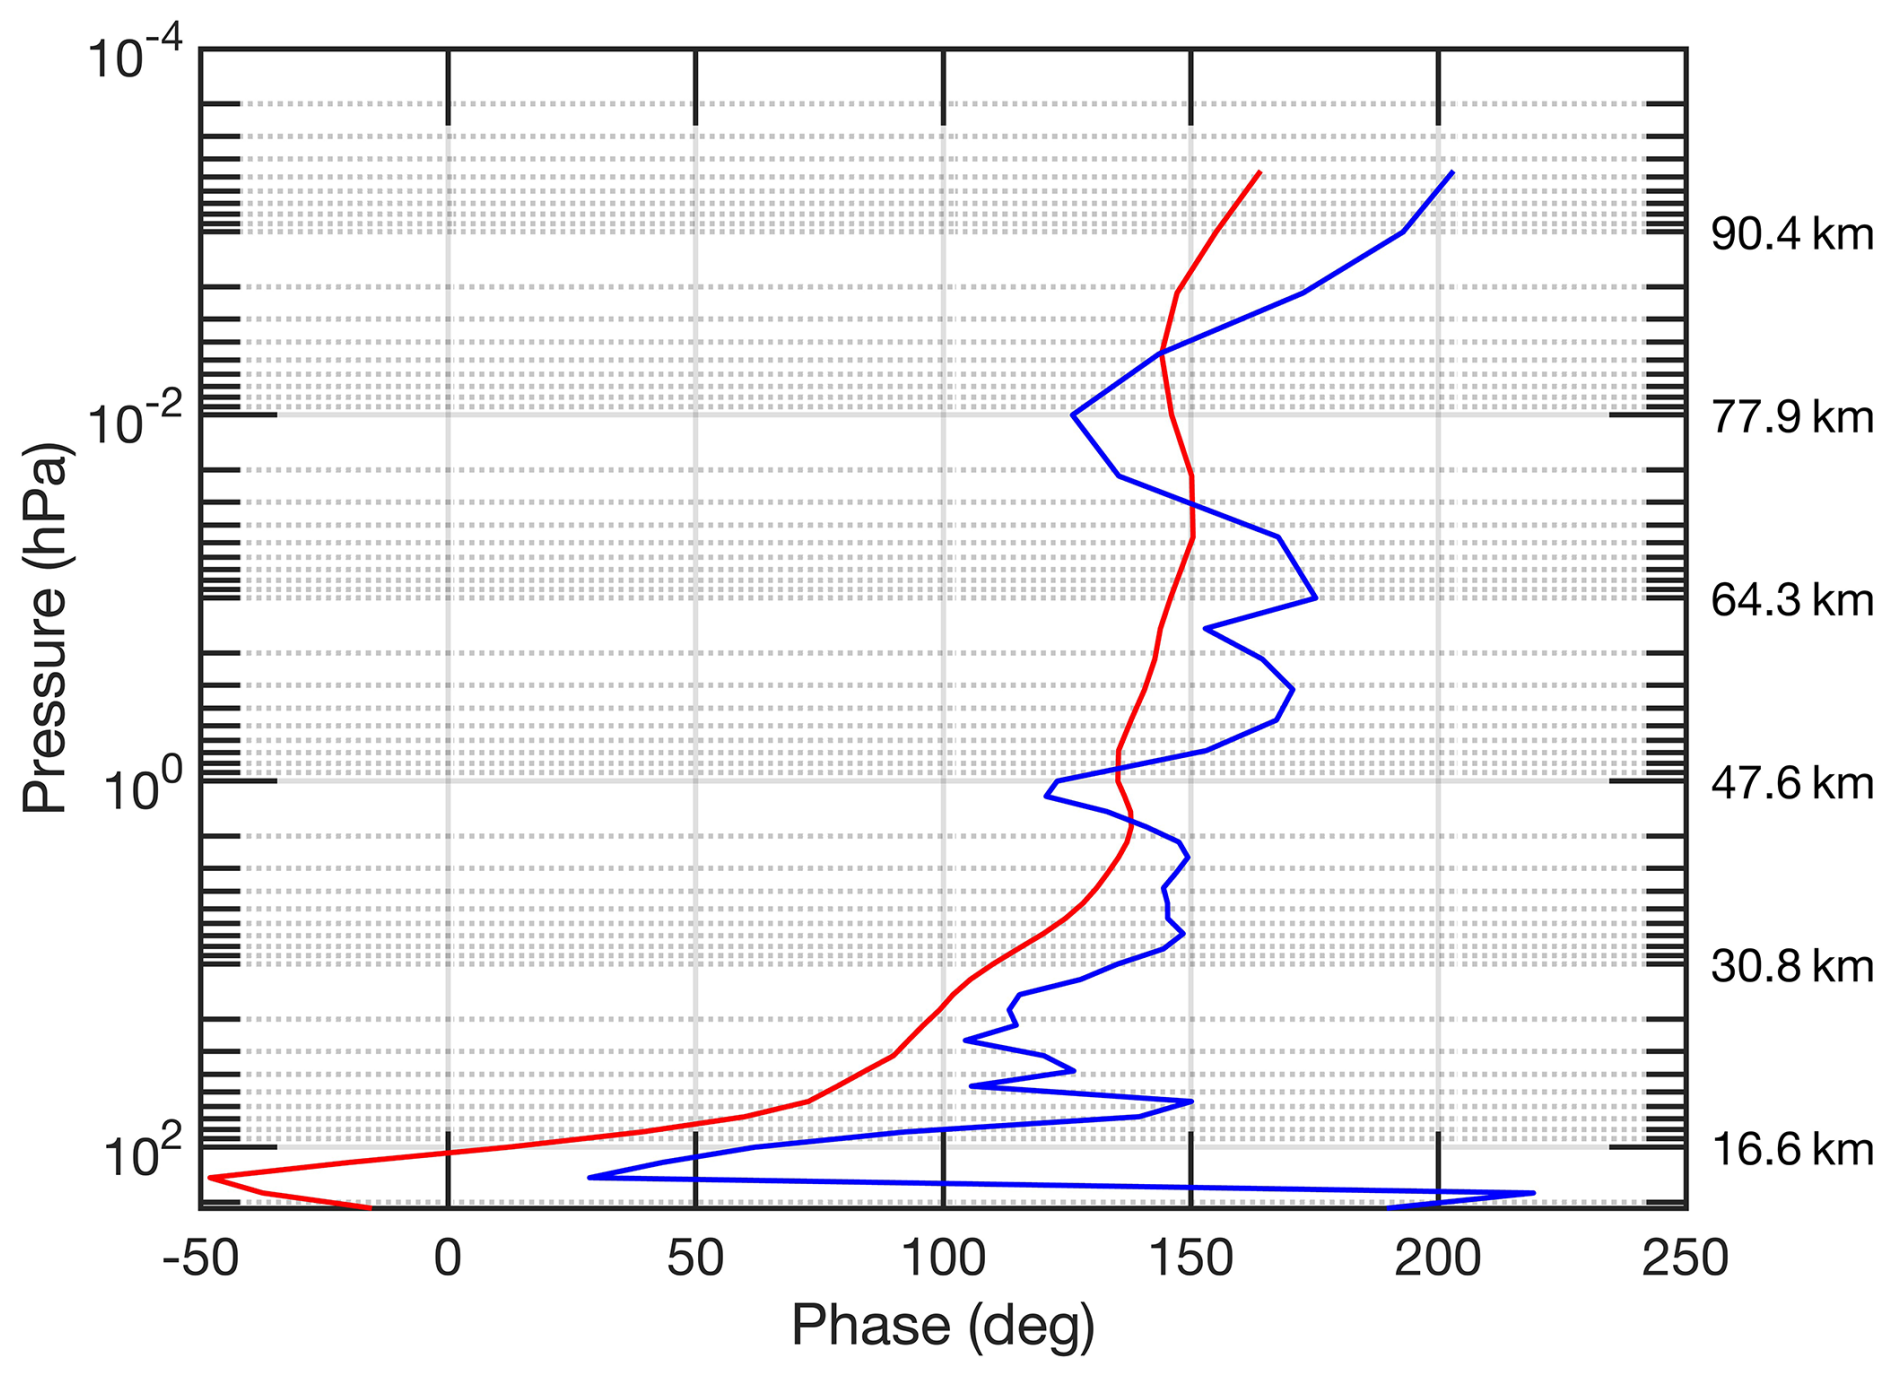
Figure 6Vertical profiles of lunar tidal phase in geopotential height (red line) and temperature (blue line). Aura/MLS data from the equatorial latitude belt (10° S to 10° N) were taken for the time interval from 2004 to 2021. The approximated heights of the pressure levels are given by labels at the right-hand side. Phase 0° means that Aura/MLS measures the maximum of the tidal wave at New Moon. Phase 180° means that Aura/MLS measures the maximum of the tidal wave at First Quarter Moon.
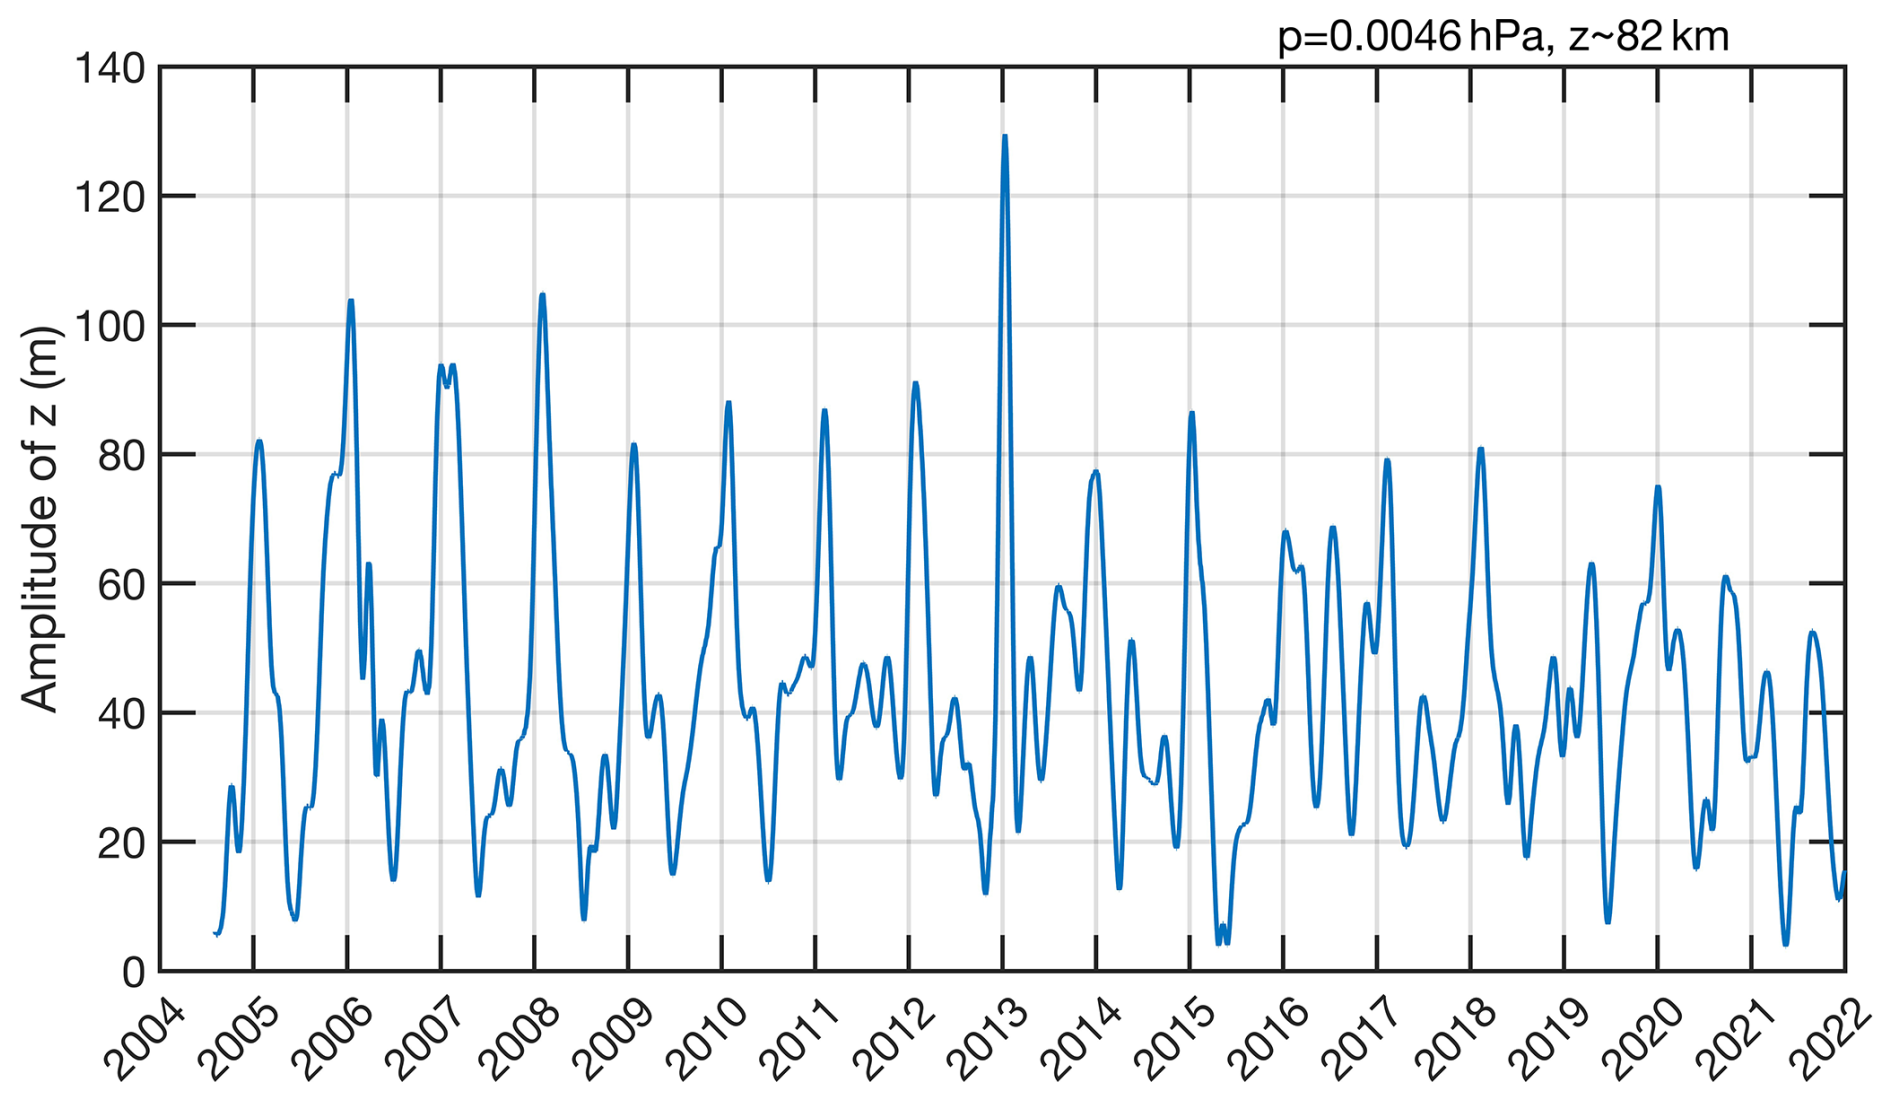
Figure 7Time series of lunar tidal amplitude in geopotential height z in about 82 km height. Aura/MLS data from the equatorial latitude belt (10° S to 10° N) were taken for the time interval from 2004 to 2021. The lunar tide is larger in January than in July (xticks are on 1 January).
For the derivation of the seasonal and interannual variations of the lunar tidal amplitude in geopotential height, digital filtering was applied. Figure 7 shows the time series of the lunar z amplitude in about 82 km height. In agreement with the simulation by Geller (1970), the lunar tide is about 2–3 times stronger in January than in July. The amplitude is around 80 m in January and around 30 m in July. A maximum of 130 m is achieved in January 2013. Larger amplitudes could be reached if the number of filter coefficients would be reduced so that a faster response of the digital filter to the seasonal variation would be obtained. However, the penalty of a faster response time of the filter would be that the separation of the lunar tide from other planetary wave-like oscillations would be less reliable.
The Aura/MLS observations also permit the study of the latitudinal dependence of the lunar tidal amplitude. Here, Fig. 8 only shows the mean lunar tidal amplitude in geopotential height z in about 82 km height as derived from the FFT spectra at latitudinal belts from 80° S to 80° N where the belts are 10° wide in latitude with a spacing of 10°. Figure 8 shows that the lunar tidal amplitude z is maximal at 0–10° N. This equatorial maximum decreases to the half at about 30° N (or 30° S). This shape (full width at half maximum) well agrees with the lunar tide simulation of Geller (1970) (Fig. 10 in Geller's article). The only differences are the slight increase of the amplitude at high latitudes in the Aura/MLS observations of Fig. 8 and the slight interhemispheric asymmetry of the curve (maximum is shifted by 5° to the Northern Hemisphere. Both effects could be due to the amplification of lunar tides by SSWs (with strong PJO) which are more common in the northern winter hemisphere.
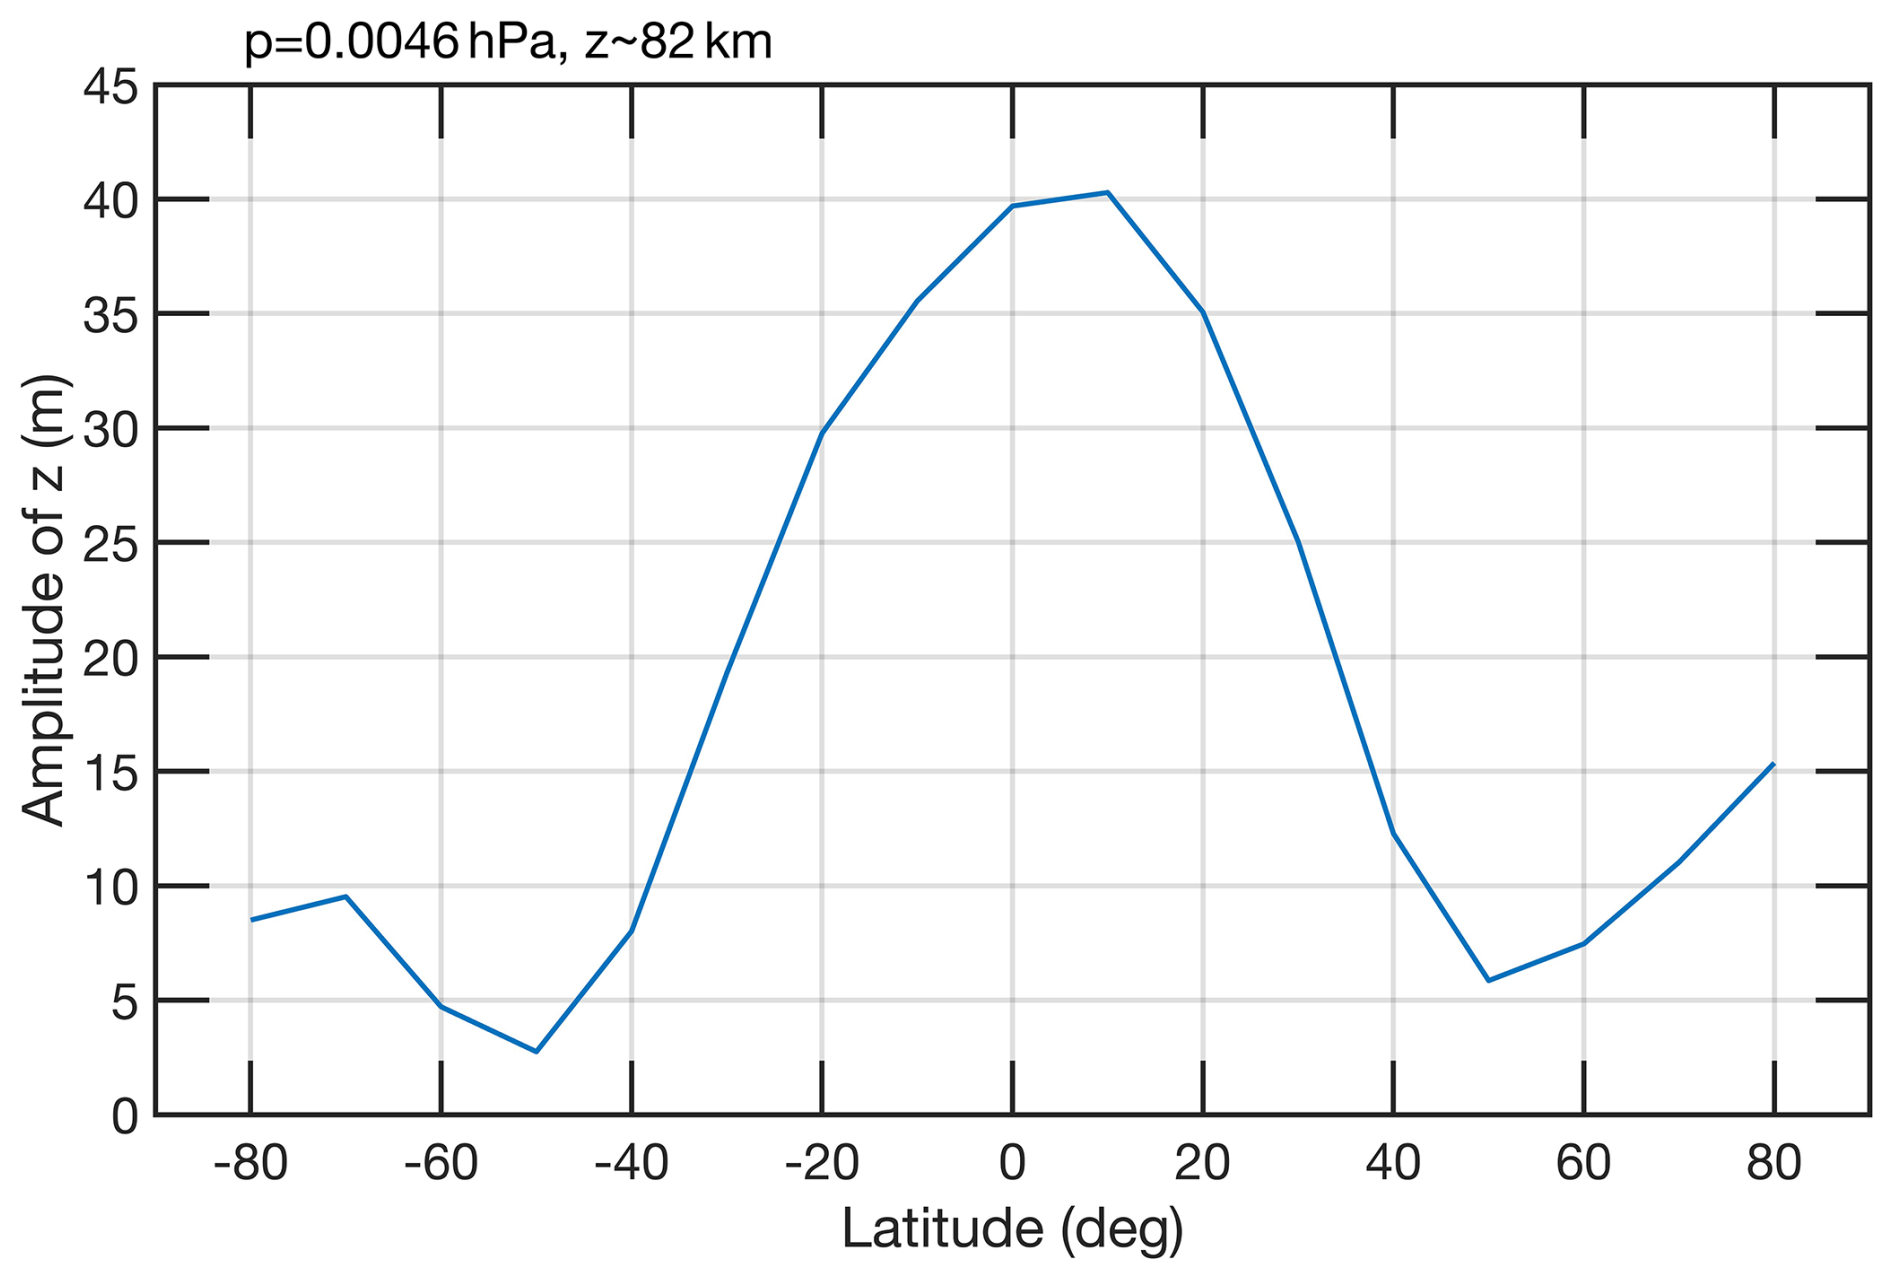
Figure 8Latitudinal dependence of lunar tidal amplitude in geopotential height z in about 82 km height. Aura/MLS data were analysed by means of FFT for the time interval from 2004 to 2021.
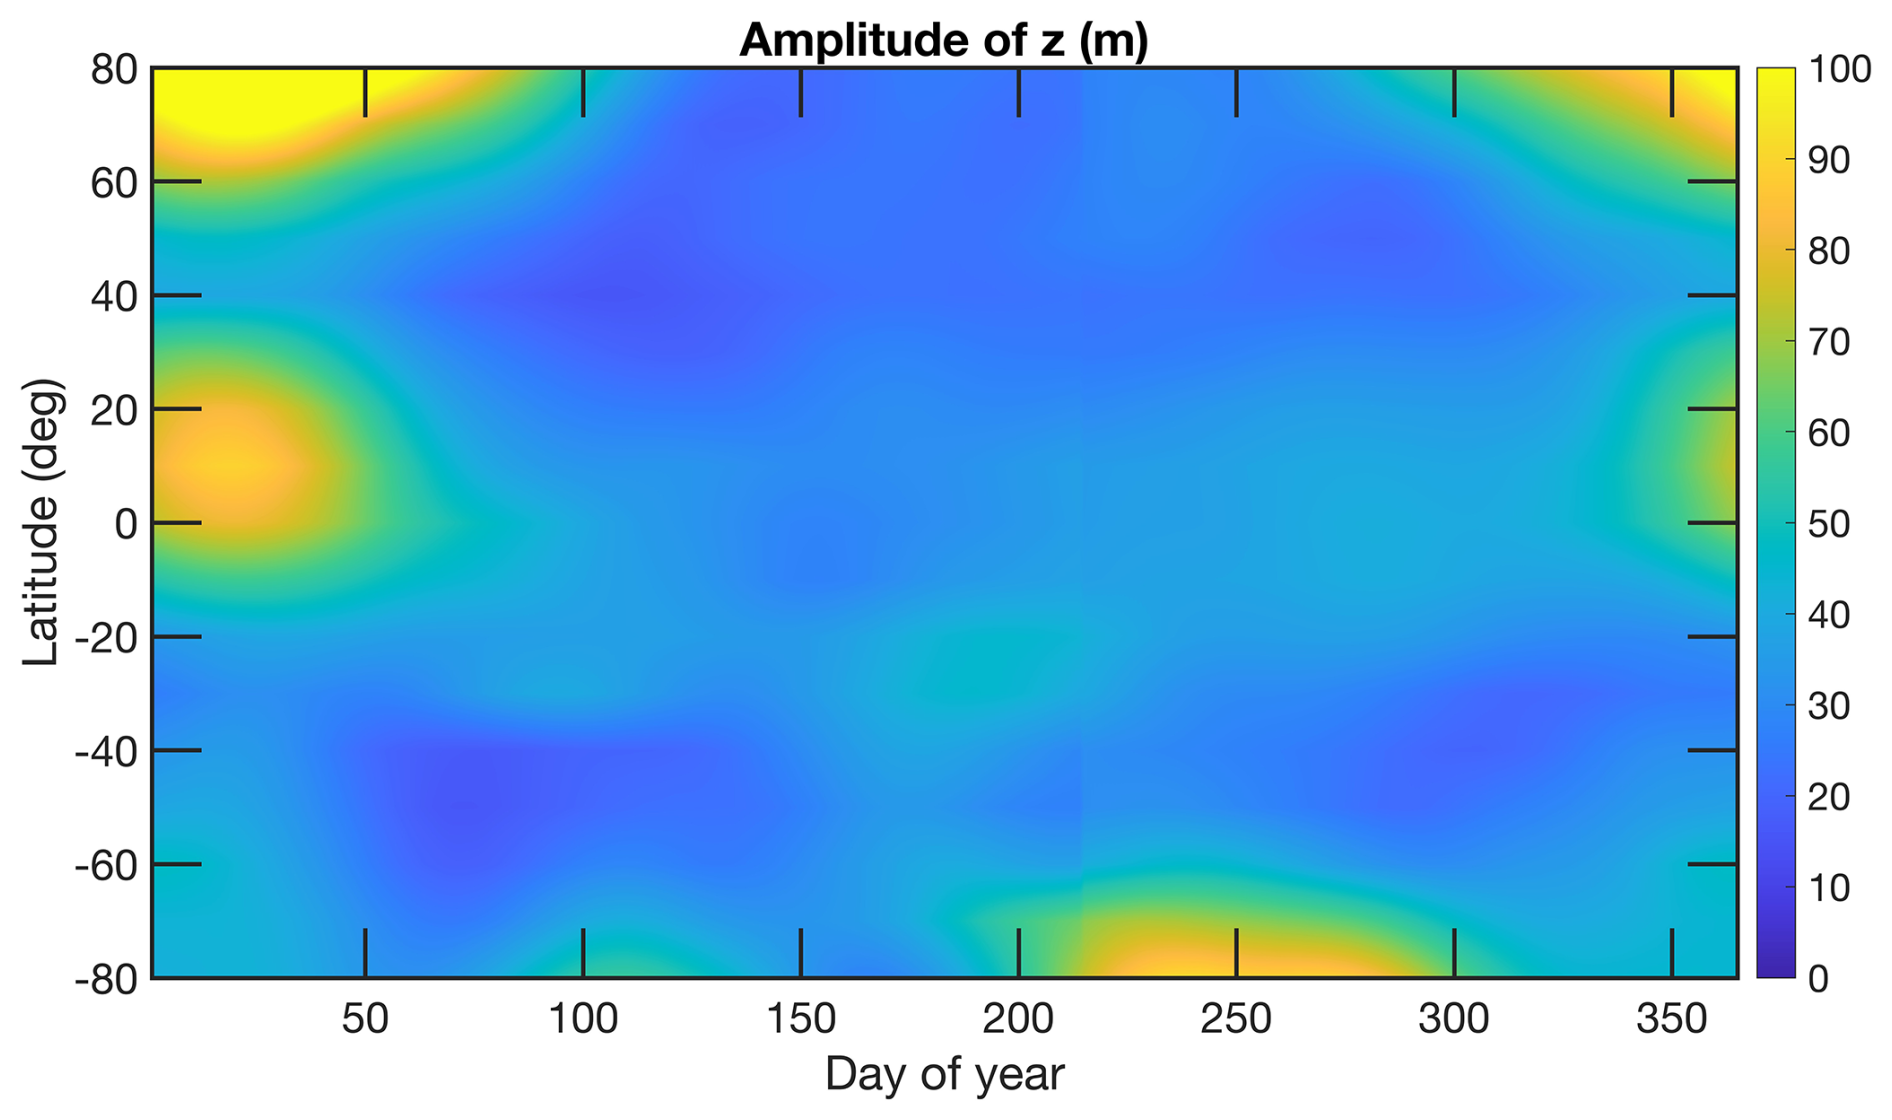
Figure 9Climatology and latitudinal dependence of lunar tidal amplitude in geopotential height z in about 82 km height. Aura/MLS data were analysed with a digital filter for the time interval from 2004 to 2021. Contamination by planetary wave-like oscillations might be possible at high latitudes in winter where amplitudes up to 148 m are reached.
Finally, the climatology of the lunar tidal amplitude is derived by digital filtering as function of latitude (Fig. 9). The seasonal variation is obtained by bandpass-filtering of the time series at the period of a half lunar month and by sorting the 17 years-long amplitude envelope as function of Day of Year. The lunar tide is strong at high latitudes in polar winter. It is not certain if this effect is due to the lunar tide or to stronger planetary wave-like oscillations of the winter hemisphere at high latitudes. From 0 to 20° N, a maximal tidal amplitude of about 80 m is present in January and February (in agreement with the time series in Fig. 7). This result is in agreement with numerous reports on the lunar tide and the geomagnetic lunar tide which is stronger in January than in July (Bartels and Johnston, 1940; Hocke and Ma, 2025; Yamazaki, 2013; Forbes and Zhang, 2012; Pedatella et al., 2016; Conte et al., 2019). A new result might be the maxima of the lunar tide at March equinox at mid-latitudes. In the past, there was a study about the geomagnetic lunar tide which emphasized that the lunar tide was amplified around the December solstice and the equinoxes (Onwumechilli, 1964).
This study evaluated for the first time the signal of the lunar tide in Aura/MLS data of the middle atmosphere. In addition, it was the first time that the lunar tide in geopotential height was analysed in observations of the middle atmosphere. The results showed that the Aura/MLS data are appropriate and convenient for the study of the lunar tide. At mesospheric heights, significant spectral peaks are observed at a period of a half lunar month, particularly in the spectra of geopotential height but also in temperature. This lunar semimonthly variation of the lunar tide is due to the near-polar, sun-synchronous orbit of the Aura satellite (Fig. 1).
Generally, it seems that the geopotential height measurements are more valuable for investigations of the lunar tide than the temperature observations because the lunar tidal signal is stronger in geopotential height than in temperature. It also can be argued that the geopotential height perturbation is the primary effect of the lunar tide and the temperature lunar tide arises from the adiabatic relationship to the pressure lunar tide (Chapman, 1932).
The vertical profiles of the lunar tides in geopotential height and temperature of the Aura/MLS observations are smaller by a factor 2–3 compared to the simulation of Geller (1970). The vertical gradient of the observed lunar tidal amplitudes are similar to the simulated gradient in Geller (1970). The amplitude of the temperature lunar tide at mesospheric heights derived from Aura/MLS well agrees with the temperature lunar tide of TIMED/SABER observations (Forbes et al., 2013).
The Aura/MLS observations at the equator also showed that the lunar tide in January is about 2–3 times stronger than in July. This agrees with the simulation of Geller (1970). In addition, observations of the geomagnetic lunar tide and the lunar tide in GNSS TEC showed that the lunar tide is more amplified in January than in July. Particularly, the SSWs in northern hemispheric winter amplify the lunar tide by a factor of 2–3 at least when strong PJOs are present (Hocke and Ma, 2025; Yamazaki, 2013; Forbes and Zhang, 2012; Pedatella et al., 2016; Conte et al., 2019).
The phase profile of geopotential height is close to the phase profile in temperature. The phase profiles indicate a long vertical wavelength of about 500 km in the mesosphere, in agreement with Geller (1970). A long vertical wavelength may indicate a prevailing (2,2) mode of the lunar tide. Simulations of Forbes (1982) showed that the (2,2) mode is dominant at altitudes below 70 km. The phase profile of the temperature lunar tide of Aura/MLS shows more variations on short vertical scales than that in geopotential height. In the upper mesosphere, a vertical wavelength of about 80 km is present in the temperature data. The observed increase of the phase with height is in agreement with the downward phase progression of a gravity wave with upward energy propagation.
A convincing agreement between simulation (Geller, 1970) and Aura/MLS is obtained for the latitudinal dependence of the lunar tide in geopotential height. The amplitude peaks a bit northward of the equator and the full width at half maximum is about 60°. Differences between the simulation and the observations are only at high latitudes in winter where relatively large amplitudes are obtained (Fig. 9). According to the simulation the amplitudes of the lunar tide are very small at high latitudes. However, ground-based radar observations showed that the lunar tide at high latitudes in winter is a relevant phenomenon (Sandford et al., 2006; Chau et al., 2015; Siddiqui et al., 2015; Conte et al., 2019). On the other hand, it cannot be excluded that the climatology of the lunar tidal amplitude in Fig. 9 is partly contaminated by planetary wave-like oscillations which the digital filter did not separate from the lunar tidal signal. In addition, the annual mean of the lunar tide in Fig. 8 is just around 15 m at northern polar latitudes. This seems to be not consistent with the large tidal amplitude values (up to 148 m) at northern polar latitudes in winter in Fig. 9. The retrieval of the annual mean of the lunar tide is certainly more reliable than the retrieval of the monthly means of the lunar tide, since the lunar tide signal can be better separated from atmospheric noise in case of the FFT of the whole time series (Fig. 8).
The climatology of the lunar tide in Fig. 9 at low latitudes (0–20° N) agrees with the well-known observational fact that the lunar tide is stronger in January than in July. The simulation of Geller (1970) also showed this characteristic which is due to a difference in the vertical thermal structure of the middle atmosphere. A change in the temperature profile can shift the resonance period of the atmosphere to the frequency of the lunar tide, so that an amplification of the lunar tide occurs (Pekeris, 1937; Forbes and Zhang, 2012).
For the first time, the lunar tide in geopotential height was observed by Aura/MLS. The observations were compared to the simulation of the lunar tide by Geller (1970). The observed mean lunar tide is up to 55 m (geopotential height amplitude) in the mesosphere while the simulation shows amplitudes between 99 m in July and 220 m in January at 90 km height. Thus, the observed amplitude is in average about 3 times smaller than predicted by the simulation. It can be that the boundary conditions and the vertical thermal structure of the model atmosphere have to be adjusted for a better agreement.
The amplitude of the mesospheric lunar temperature tide of Aura/MLS is about 0.68 K and agrees well with those of TIMED/SABER which is about 0.6 K at 90 km height (Forbes et al., 2013).
Generally, the vertical profiles of the lunar tidal amplitudes in Aura/MLS data are reasonable down to the tropical tropopause. That means, comparable small values are retrieved in the lower stratosphere as reported by Geller (1970) or observed at ground (Sakazaki and Hamilton, 2018). The vertical phase gradients suggest a (2,2) mode of the lunar tide with a vertical wavelength of about 500 km, in agreement with simulation results of Geller (1970) and Forbes (1982).
The latitudinal dependence of the mesospheric lunar tide in geopotential height agrees well with the simulation of Geller (1970) having a maximum at the equator and a reduction to the half of the maximum at 30° N. The climatology shows that the equatorial lunar tidal amplitude is stronger in January than in July. At high latitudes in winter, the lunar tide in geopotential height was up to 148 m (Fig. 9). However, a contamination of the lunar tidal signal by planetary wave-like oscillations cannot be excluded.
Generally, the present study showed that the lunar tide might be best studied in the parameter geopotential height. Unfortunately, there was only one published article which showed a simulated lunar tide in geopotential height (Geller, 1970). The Aura/MLS observations of the lunar tide are valuable for future simulations of the lunar tide.
The Aura/MLS data are available at the Aura Validation Data Center (AVDC) https://avdc.gsfc.nasa.gov/ (last access: 20 January 2026).
The contact author has declared that none of the authors has any competing interests.
Publisher's note: Copernicus Publications remains neutral with regard to jurisdictional claims made in the text, published maps, institutional affiliations, or any other geographical representation in this paper. The authors bear the ultimate responsibility for providing appropriate place names. Views expressed in the text are those of the authors and do not necessarily reflect the views of the publisher.
I thank the Aura/MLS team for the data. The reviewers and the editor are thanked for their work.
This research has been supported by the University of Bern (Open access fund).
This paper was edited by John Plane and reviewed by three anonymous referees.
Bartels, J. and Johnston, H. F.: Geomagnetic tides in horizontal intensity at Huancayo, Terrestrial Magnetism and Atmospheric Electricity, 45, 269–308, https://doi.org/10.1029/TE045i003p00269, 1940. a, b
Chapman, S.: On the theory of the lunar tidal variation of atmospheric temperature, Mem. Roy. Met. Soc., 4, 35–40, 1932. a, b
Chapman, S.: Atmospheric Tides and Oscillations, American Meteorological Society, Boston, MA, pp. 510–530, https://doi.org/10.1007/978-1-940033-70-9_43, 1951. a, b
Chau, J. L., Hoffmann, P., Pedatella, N. M., Matthias, V., and Stober, G.: Upper mesospheric lunar tides over middle and high latitudes during sudden stratospheric warming events, J. Geophys. Res.-Space, 120, 3084–3096, https://doi.org/10.1002/2015JA020998, 2015. a
Conte, J. F., Chau, J. L., and Peters, D. H. W.: Middle- and High-Latitude Mesosphere and Lower Thermosphere Mean Winds and Tides in Response to Strong Polar-Night Jet Oscillations, J. Geophys. Res.-Atmos., 124, 9262–9276, https://doi.org/10.1029/2019JD030828, 2019. a, b, c, d
Ebel, A., Ghazi, A., and Bätz, W.: Evidence of global-scale waves with zonal wave number zero in the stratosphere, Pure Appl. Geophys., 116, 8–31, https://doi.org/10.1007/BF00878982, 1978. a
Forbes, J. M.: Atmospheric tide: 2. The solar and lunar semidiurnal components, J. Geophys. Res.-Space, 87, 5241–5252, https://doi.org/10.1029/JA087iA07p05241, 1982. a, b, c
Forbes, J. M. and Zhang, X.: Lunar tide amplification during the January 2009 stratosphere warming event: Observations and theory, J. Geophys. Res.-Space, 117, https://doi.org/10.1029/2012JA017963, 2012. a, b, c
Forbes, J. M., Zhang, X., Bruinsma, S., and Oberheide, J.: Lunar semidiurnal tide in the thermosphere under solar minimum conditions, J. Geophys. Res.-Space, 118, 1788–1801, https://doi.org/10.1029/2012JA017962, 2013. a, b, c, d, e
Geller, M. A.: An Investigation of the Lunar Semidiurnal Tide in the Atmosphere, J. Atmos. Sci., 27, 202–218, https://doi.org/10.1175/1520-0469(1970)027<0202:AIOTLS>2.0.CO;2, 1970. a, b, c, d, e, f, g, h, i, j, k, l, m, n, o, p, q, r, s, t, u, v, w, x, y, z
Hagan, M., Forbes, J., and Richmond, A.: Atmospheric tides, in: Encyclopedia of Atmospheric Sciences, edited by: Holton, J. R., Academic Press, Oxford, pp. 159–165, https://doi.org/10.1016/B0-12-227090-8/00409-7, 2003. a
Hocke, K.: Oscillations of global mean TEC, J. Geophys. Res.-Space, 113, https://doi.org/10.1029/2007JA012798, 2008. a
Hocke, K.: Modulation of the lunar semidiurnal tide in GNSS TEC by the variable Earth-Moon distance, Frontiers in Astronomy and Space Sciences, 12, https://doi.org/10.3389/fspas.2025.1585247, 2025. a
Hocke, K. and Ma, G.: Big L Days in GNSS TEC Data, Atmosphere, 16, https://doi.org/10.3390/atmos16101191, 2025. a, b, c
Lieberman, R. S., Harding, B. J., Heelis, R. A., Pedatella, N. M., Forbes, J. M., and Oberheide, J.: Atmospheric Lunar Tide in the Low Latitude Thermosphere-Ionosphere, Geophys. Res. Lett., 49, e2022GL098078, https://doi.org/10.1029/2022GL098078, 2022. a
Lindzen, R. S. and Chapman, S.: Atmospheric tides, Space Sci. Rev., 10, 3–188, https://doi.org/10.1007/BF00171584, 1969. a
Livesey, N. J., Read, W. G., Wagner, P. A., Froidevaux, L., Santee, M. L., Schwartz, M. J., Lambert, A., Valle, L. F. M., Pumphrey, H. C., Manney, G. L., Fuller, R. A., Jarnot, R. F., Knosp, B. W., and Lay, R. R.: Earth Observing System (EOS) Aura Microwave Limb Sounder (MLS) Version 5.0x Level 2 and 3 data quality and description document, Technical report, JPL D-105336 Rev. B, https://mls.jpl.nasa.gov/data/v5-0_data_quality_document.pdf (last access: 11 June 2026), 2022. a
Onwumechilli, A.: On the existence of days with extraordinary geomagnetic lunar tide, J. Atmos. Terr. Phy., 26, 729–748, https://doi.org/10.1016/0021-9169(64)90161-8, 1964. a
Paulino, A., Batista, P., and Clemesha, R.: Lunar tides in the mesosphere and lower thermosphere over Cachoeira Paulista (22.7° S; 45.0° W), J. Atmos. Sol.-Terr. Phy., 78–79, 31–36, https://doi.org/10.1016/j.jastp.2011.04.018, 2012. a
Pedatella, N. M., Liu, H.-L., and Richmond, A. D.: Atmospheric semidiurnal lunar tide climatology simulated by the Whole Atmosphere Community Climate Model, J. Geophys. Res.-Space, 117, https://doi.org/10.1029/2012JA017792, 2012. a
Pedatella, N. M., Richmond, A. D., Maute, A., and Liu, H.-L.: Impact of semidiurnal tidal variability during SSWs on the mean state of the ionosphere and thermosphere, J. Geophys. Res.-Space, 121, 8077–8088, https://doi.org/10.1002/2016JA022910, 2016. a, b, c
Pekeris, C. L.: Atmospheric oscillations, Proc. Roy. Soc. London, 158A, 650–671, 1937. a
Sakazaki, T. and Hamilton, K.: Discovery of a lunar air temperature tide over the ocean: a diagnostic of air-sea coupling, npj Clim. Atmos. Sci., 1, 25, https://doi.org/10.1038/s41612-018-0033-9, 2018. a, b, c
Sandford, D. J., Muller, H. G., and Mitchell, N. J.: Observations of lunar tides in the mesosphere and lower thermosphere at Arctic and middle latitudes, Atmos. Chem. Phys., 6, 4117–4127, https://doi.org/10.5194/acp-6-4117-2006, 2006. a, b
Schindelegger, M., Sakazaki, T., and Green, M.: Chapter 16 – Atmospheric tides – An Earth system signal, in: A Journey Through Tides, edited by: Green, M. and Duarte, J. C., Elsevier, pp. 389–416, https://doi.org/10.1016/B978-0-323-90851-1.00007-8, 2023. a
Schlapp, D.: Lunar tides in the stratosphere and mesosphere from NIMBUS 6 data, J. Atmos. Terr. Phy., 43, 205–207, https://doi.org/10.1016/0021-9169(81)90039-8, 1981. a
Schwartz, M. J., Lambert, A., Manney, G. L., Read, W. G., Livesey, N. J., Froidevaux, L., Ao, C. O., Bernath, P. F., Boone, C. D., Cofield, R. E., Daffer, W. H., Drouin, B. J., Fetzer, E. J., Fuller, R. A., Jarnot, R. F., Jiang, J. H., Jiang, Y. B., Knosp, B. W., Krüger, K., Li, J.-L. F., Mlynczak, M. G., Pawson, S., Russell III, J. M., Santee, M. L., Snyder, W. V., Stek, P. C., Thurstans, R. P., Tompkins, A. M., Wagner, P. A., Walker, K. A., Waters, J. W., and Wu, D. L.: Validation of the Aura Microwave Limb Sounder temperature and geopotential height measurements, J. Geophys. Res.-Atmos., 113, https://doi.org/10.1029/2007JD008783, 2008. a, b, c, d
Siddiqui, T. A., Stolle, C., Luhr, H., and Matzka, J.: On the relationship between weakening of the northern polar vortex and the lunar tidal amplification in the equatorial electrojet, J. Geophys. Res.-Space, 120, 10006–10019, https://doi.org/10.1002/2015JA021683, 2015. a
Studer, S., Hocke, K., and Kämpfer, N.: Intraseasonal oscillations of stratospheric ozone above Switzerland, J. Atmos. Sol.-Terr. Phy., 74, 189–198, https://doi.org/10.1016/j.jastp.2011.10.020, 2012. a
Tsuda, T., Tanii, J., Aso, T., and Kato, S.: Lunar tides at meteor heights, Geophys. Res. Lett., 8, 191–194, https://doi.org/10.1029/GL008i003p00191, 1981. a
Vial, F. and Forbes, J.: Monthly simulations of the lunar semi-diurnal tide, J. Atmos. Terr. Phy., 56, 1591–1607, https://doi.org/10.1016/0021-9169(94)90089-2, 1994. a, b
Waters, J. W., Froidevaux, L., Harwood, R. S., Jarnot, R. F., Pickett, H. M., Read, W. G., Siegel, P. H., Cofield, R. E., Filipiak, M. J., Flower, D. A., Holden, J. R., Lau, G. K. K., Livesey, N. J., Manney, G. L., Pumphrey, H. C., Santee, M. L., Wu, D. L., Cuddy, D. T., Lay, R. R., Loo, M. S., Perun, V. S., Schwartz, M. J., Stek, P. C., Thurstans, R. P., Boyles, M. A., Chandra, K. M., Chavez, M. C., Chen, G. S., Chudasama, B. V., Dodge, R., Fuller, R. A., Girard, M. A., Jiang, J. H., Jiang, Y. B., Knosp, B. W., LaBelle, R. C., Lam, J. C., Lee, K. A., Miller, D., Oswald, J. E., Patel, N. C., Pukala, D. M., Quintero, O., Scaff, D. M., Van Snyder, W., Tope, M. C., Wagner, P. A., and Walch, M. J.: The Earth Observing System Microwave Limb Sounder (EOS MLS) on the Aura satellite, IEEE T. Geosci. Remote, 44, 1075–1092, 2006. a
Yamazaki, Y.: Large lunar tidal effects in the equatorial electrojet during northern winter and its relation to stratospheric sudden warming events, J. Geophys. Res.-Space, 118, 7268–7271, https://doi.org/10.1002/2013JA019215, 2013. a, b, c
Yamazaki, Y. and Richmond, A. D.: A theory of ionospheric response to upward-propagating tides: Electrodynamic effects and tidal mixing effects, J. Geophys. Res.-Space, 118, 5891–5905, https://doi.org/10.1002/jgra.50487, 2013. a
Zhang, J. T., Forbes, J. M., Zhang, C. H., Doornbos, E., and Bruinsma, S. L.: Lunar tide contribution to thermosphere weather, Space Weather, 12, 538–551, https://doi.org/10.1002/2014SW001079, 2014. a