the Creative Commons Attribution 4.0 License.
the Creative Commons Attribution 4.0 License.
 | 10 Jun 2026
Dependence of CCN closure relationship with organic fraction from two airborne field campaigns over mid-latitude land and ocean
Guangxin Ai
Hailong Wang
Minghuai Wang
This study investigates the relationship between measured and calculated cloud condensation nuclei (CCN) number concentration and its dependence with organic fraction utilizing aircraft observations from The Aerosol and Cloud Experiments in the Eastern North Atlantic (ACE-ENA, 2017–2018) and The Holistic Interactions of Shallow Clouds, Aerosols, and Land Ecosystems (HI-SCALE, 2016) campaigns, which represent midlatitude marine and continental environments, respectively. For the ACE-ENA marine region, aerosol and CCN concentrations were significantly higher in summer than in winter, whereas at continental site for HI-SCALE, aerosol and CCN concentrations showed no pronounced differences between spring and autumn. Using aerosol chemical composition and number size distribution data, CCN concentrations at various supersaturations are calculated based on Köhler theory and then compared with observations from CCN counter. The results show that CCN closure performs well at both sites with a slight overestimation, with mean closure ratio (CR) of 1.13 and 1.17, respectively. Further investigation reveals that CR at lower supersaturation perform better than that at higher supersaturation. The dependence of CR on organic mass fraction (MForg) varies by environment: for marine aerosols, CR decreases with increasing organic fraction at lower supersaturations, whereas continental aerosols exhibit a consistent overestimation, with CR decreasing as organic fraction increases at higher supersaturations. This study provides key insights into CCN characteristics over midlatitude marine and continental environments, emphasizing the necessity of incorporating size-resolved chemical composition and mixing states into future model parameterizations, and contributing to a better understanding of aerosol–cloud interactions.
- Article
(6392 KB) - Full-text XML
- BibTeX
- EndNote


Atmospheric aerosols, defined as tiny solid or liquid particles suspended in the atmosphere, exert substantial influence on the Earth's climate system (Intergovernmental Panel On Climate Change (IPCC), 2023). Aerosols modulate the energy budget of the Earth through two primary pathways: direct and indirect radiative effects. The direct effect stems from aerosol scattering and absorption of incoming solar shortwave radiation, altering the Earth's radiative balance and thereby modifying heating rates in the surface–atmosphere system (Charlson et al., 1992). The indirect effect arises because aerosols act as cloud condensation nuclei (CCN) and/or ice nuclei (IN), participating in cloud formation and consequently modifying cloud microphysical (Twomey, 1974) and macrophysical (Albrecht, 1989) properties, further influencing cloud radiative effects. The highly nonlinear and complex nature of aerosol–cloud interactions makes aerosol indirect effect one of the largest uncertainty sources in global climate models (GCMs) (Fan et al., 2016; Li et al., 2022).
CCN are aerosol particles that can be activated to form cloud droplets under supersaturated water vapor conditions, serving as the critical linkage between aerosols and clouds. The ability of aerosol particles to act as CCN is governed chiefly by their size distribution, chemical composition, and mixing state (Petters and Kreidenweis, 2007). Larger particles with higher solubility generally activate at lower supersaturations; compositional differences (e.g., sulfate, organics, black carbon) influence hygroscopicity and thus the size threshold of aerosol activation; mixing state (internal vs. external) alters effective solubility and surface characteristics, further modulating activation efficiency (Dusek et al., 2006; McFiggans et al., 2006; Petters and Kreidenweis, 2007; Pöschl, 2005; Vu et al., 2019). With these complexities, there is no single parameter of aerosols can be used to estimate CCN number concentration.
GCMs usually calculate CCN number concentration using κ-Köhler theory (Chang et al., 2010; Ghan et al., 2013). It needs size and composition information of aerosols, with prescribed hygroscopicity of each composition and assuming certain mixing state (e.g., Liu et al. 2016). These aerosol parameters can be measured in the real world to estimate CCN number concentration. Moreover, CCN number concentration can be directly measured by controlling supersaturation level and counting how many cloud droplets form due to aerosol activation. Therefore, one can use observations to conduct CCN closure analysis, which compares measured and calculated CCN number concentration, to inform whether the aerosol parameters and mixing assumptions in GCMs are realistic (Fountoukis and Nenes, 2005; Gunthe et al., 2009; Moore et al., 2013).
Previous CCN closure studies have been conducted across various regions utilizing airborne, ship, and ground-based platforms. For instance, early ground-based observations by Snider et al. (2003) in the Sub-tropical North-East Atlantic (Tenerife) revealed that closure was only achieved in air masses unaffected by continental pollution, with calculations typically overestimating measured CCN. Similarly, Broekhuizen et al. (2006) found that closure improved in Toronto, Canada, when accounting for samples containing two distinct modes. Subsequently, airborne measurements by Asa-Awuku et al. (2011) over Eastern Texas and the Northern Gulf of Mexico highlighted the influence of industrial and urban emissions, emphasizing the importance of the water-soluble organic carbon fraction for accurate CCN calculations. In Hong Kong, Meng et al. (2014) demonstrated that assuming internally mixed particles produced calculated CCN concentrations within 10 % of ground-based measurements. More recently, Redemann and Gao (2024) applied machine learning to global airborne and satellite data, calculated aerosol light absorption and CCN concentrations with mean relative errors of 21 % and 13 %, respectively; however, as the model initially performed poorly in clean conditions (CCN < 100 cm−3), these measurements required higher weighting in the algorithm to improve accuracy. Collectively, these studies have advanced the diagnosis of physical mechanisms governing aerosol–cloud interactions, optimized parameterization schemes, and reduced associated uncertainties. Specifically, for the US Southern Great Plains (SGP) region, which we analyzed in this study, Kulkarni et al. (2023) evaluated the sensitivity of calculated CCN (they call it prediction) to different mixing state assumptions – including single-component, internal, and external mixtures – and further explored how variations in hygroscopicity and particle density assumptions affect the accuracy of CCN closure. However, no previous work has examined whether variations in aerosol composition – particularly the fraction of organics – influence closure accuracy, leaving a key uncertainty in calculating CCN under diverse atmospheric conditions.
Aircraft-based observations play an indispensable role in CCN closure studies. Compared to ground-based or remote sensing techniques, aircraft platforms can sample in-situ aerosol and cloud parameters from near the surface to the mid/upper troposphere, filling critical observational gaps (Schmale et al., 2018). Aircraft also provide spatial and environmental flexibility, enabling targeted sampling over oceanic, continental, polluted, and biomass burning regimes – essential for scientific research under a wide range of aerosol conditions. Simultaneous in-situ measurements of size distributions, chemical composition, and CCN number concentrations allow direct testing and refinement of κ-Köhler theory and related activation models under realistic conditions (Petters and Kreidenweis, 2007). Therefore, conducting CCN closure analysis based on aircraft observations is a powerful means to deepen understanding of aerosol–cloud microphysical mechanisms, reduce uncertainties in parameterizations, and improve the performance of climate model projections (Li et al., 2022).
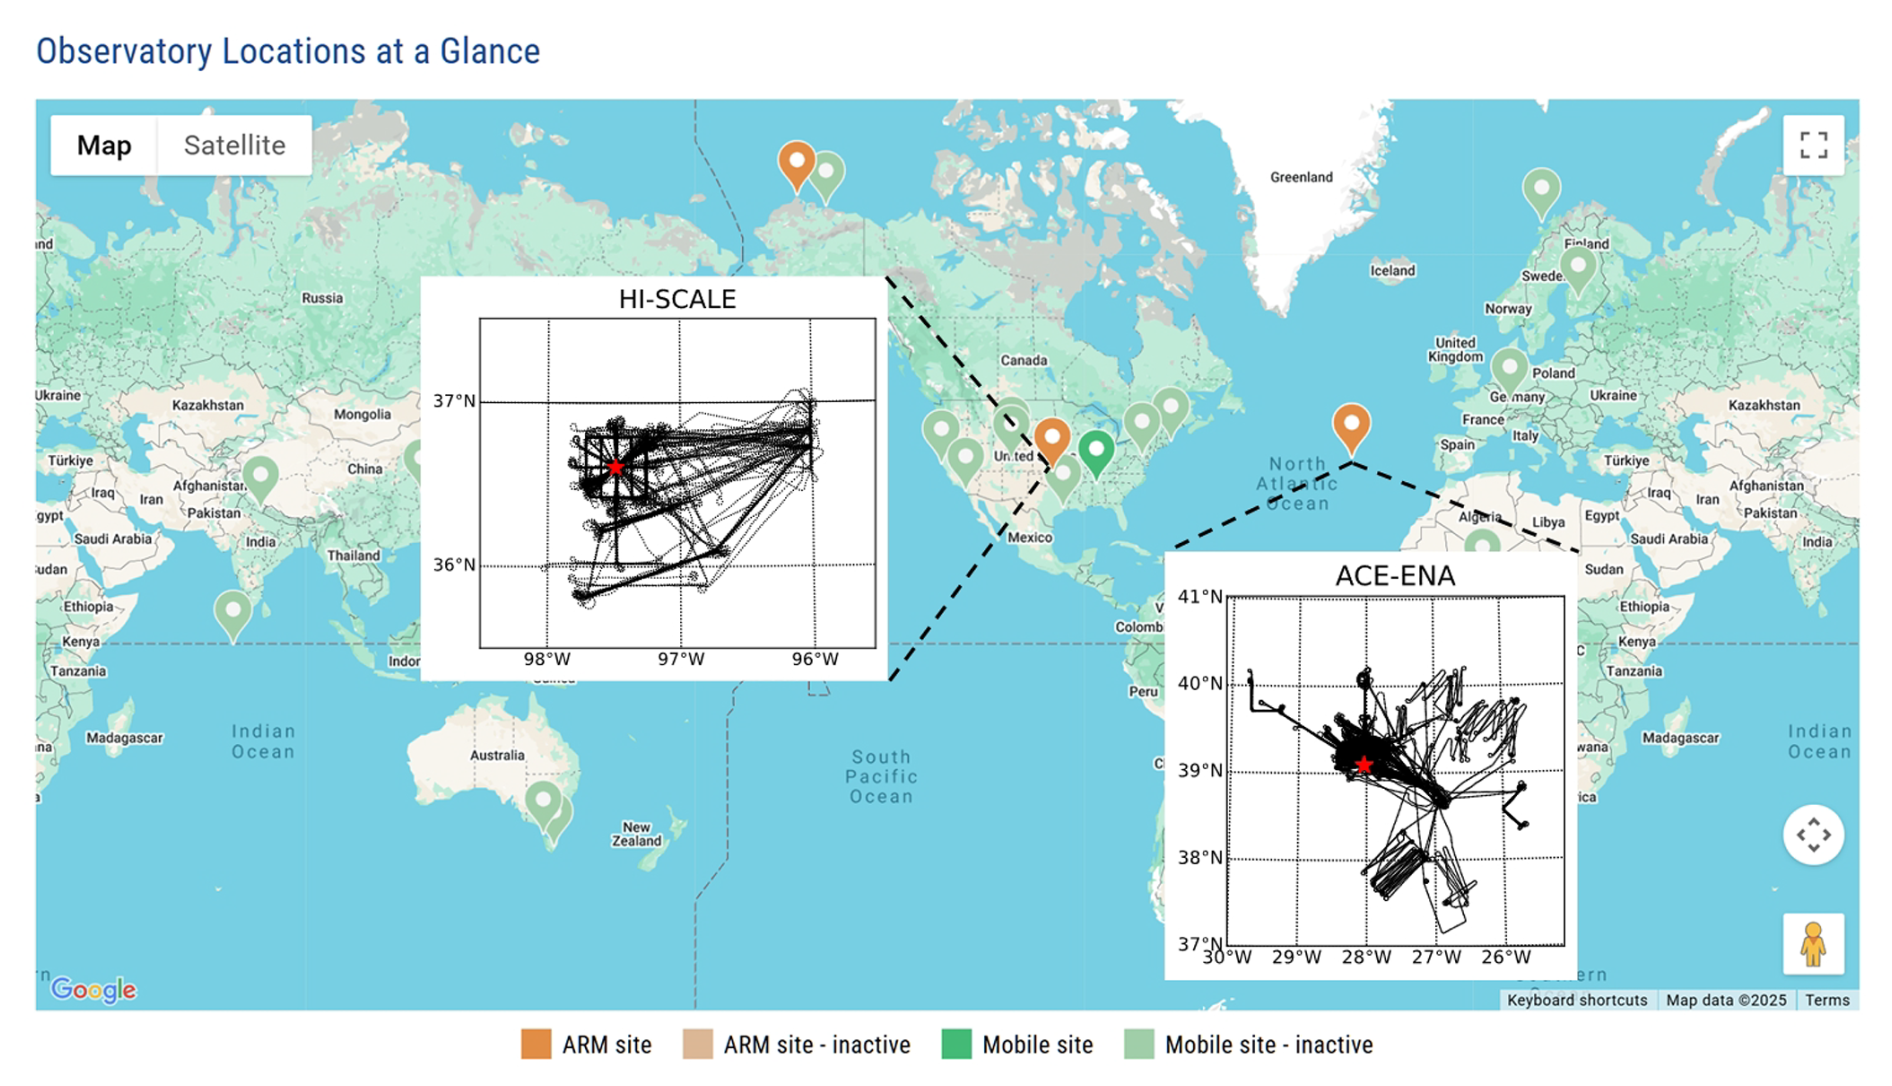
Figure 1Locations of HI-SCALE and ACE-ENA field campaigns and the flight trajectories, overlaid on historical locations of the ARM field campaigns. Map is adapted from the ARM website (https://arm.gov/capabilities/observatories, last access: 30 December 2025).
In this study, we analyzed aircraft measurements of aerosols and CCN collected at two mid-latitude locations: the Azores over the Eastern North Atlantic (ENA) and SGP at north-central Oklahoma. After comparing aerosol composition and concentrations at different locations across different seasons, we assessed the consistency between observed CCN and calculated CCN based on aerosol size distributions and chemical composition under the internal mixing assumption. Furthermore, we examine the relationships between aerosol and CCN concentrations, aerosol size distribution, and closure ratio (CR) with organic mass fraction (MForg). Summary of main findings and discussions are given at last.
The US Department of Energy's Atmospheric Radiation Measurements (ARM) program supported an instrumented Gulfstream 1 (G-1) aircraft for atmospheric field campaigns since 2010. It has been carried out in seven field campaigns between 2013 and 2018, and retired in 2019. We use the aircraft data from two field campaigns in this study and will introduce them in this section.
2.1 Field Campaigns
The two aircraft field campaigns used in this study are the Aerosol and Cloud Experiments in the Eastern North Atlantic (ACE-ENA, Wang et al., 2022) at ENA site and the Holistic Interactions of Shallow Clouds, Aerosols, and Land Ecosystems (HI-SCALE, Fast et al., 2019) at SGP site (Fig. 1). Both field campaigns include two intensive observation periods (IOPs): in ACE-ENA, the aircraft completed a summer deployment of 20 flights from 21 June to 20 July 2017 and a winter deployment of 19 flights from 19 January to 19 February 2018, “to measure key aerosol and cloud processes under various meteorological and cloud conditions with different aerosol sources” across the two seasons (Mei et al., 2024a). In HI-SCALE, it consisted of two 4-week intensive campaigns in spring (April–May 2016) and late summer (late August–September 2016) (regarded as early autumn), providing an extensive dataset “geared toward coupled processes that affect the life cycle of shallow clouds through the interaction among aerosol, cloud, the land surface, and ecosystems” (Mei et al., 2024a). SGP represents a typical continental mixed-air environment with complex aerosol sources including background pollution, agricultural emissions, and biogenic contributions (Liu et al., 2021), while ENA samples a relatively clean marine-influenced regime that captures interactions between oceanic aerosols and long-range transported background aerosols, these data enable systematic assessment of CCN activation behaviour under both continental and marine backgrounds and different seasons, thereby enhancing the generality and physical interpretability of closure results (Mather and Voyles, 2013; McFarlane et al., 2002).
2.2 Aircraft data preprocessing
The G-1 aircraft was equipped with in situ sensors to sample aerosol properties, cloud microphysics, and atmospheric state variables. In this study, we use aerosol number size distribution, chemical composition, and CCN number concentration data to conduct closure analysis. CCN data was measured by a Continuous-Flow Streamwise Thermal Gradient CCN Counter (CCN-200, Droplet Measurement Technologies) at prescribed supersaturation levels, for the ACE-ENA campaign, SS was set to 0.14 % (channel A) and 0.32 %/0.37 % (channel B); for HI-SCALE, the levels were 0.24 % (channel A) and 0.46 % (channel B). The supersaturations were determined at 600 mbar for two distinct temperature settings, with each temperature setting corresponding to one column. To ensure reliable and consistent measurements, the instruments were calibrated before and after each deployment, and twice during the field campaign. Throughout the flights, the CCN instrument was operated with a constant-pressure inlet carefully maintained at 600 mbar. The measurements were then converted to ambient temperature and pressure conditions. Aerosol chemical composition was measured by a High-Resolution Time-of-Flight Aerosol Mass Spectrometer (AMS), quantifying major non-refractory submicron components. To estimate aerosol hygroscopicity, we adopt values from the 3-mode version of Modal Aerosol Module (MAM3, Liu et al., 2012): κorg = 0.1 and κinorg = 0.507 (applied to sulfate, nitrate, ammonium, and chloride), assuming an internal mixing state to link results to GCM biases. Fixed densities were assigned at 1.0 g cm−3 for organics, 1.77 g cm−3 for inorganic salts, and 2.2 g cm−3 for chloride. Aerosol number size distributions were derived from the Best Estimate Aerosol Size Distribution (BEASD) product, which harmonizes observations from multiple complementary sensors. Each instrument contributed data within its “most reliable size range,” with overlapping regions carefully reconciled to yield a continuous distribution spanning from a few nanometers to several micrometers. Specifically, for the ACE-ENA campaign, the FIMS covered 10–600 nm and the PCASP spanned 0.095–2.9 µm, while the super-micron range was supplemented by the CAS (0.55–12.73 µm) and FCDP (0.75–13.49 µm). During the HI-SCALE campaign, the FIMS provided coverage from 10 to 400 nm, the PCASP from 0.095 (or 0.125) to 2.9 µm, and the CAS and FCDP extended the distribution up to approximately 11–12 µm. Furthermore, aerosol chemical composition measured by the HR-ToF-AMS was utilized to estimate the refractive index (RI). This allowed for the correction of equivalent optical sizes into geometric sizes, ensuring physical consistency across the integrated spectrum of different sensors (Mei et al., 2024a). The total aerosol number concentration measured by CPC (the condensation particle counter) 3772 (> 10 nm) and CPC 3025 (> 3 nm) are also used to verify the integrated aerosol size distribution from BEASD. Together, these data products provide the key inputs for the subsequent κ–Köhler parameterization and CCN closure analysis.
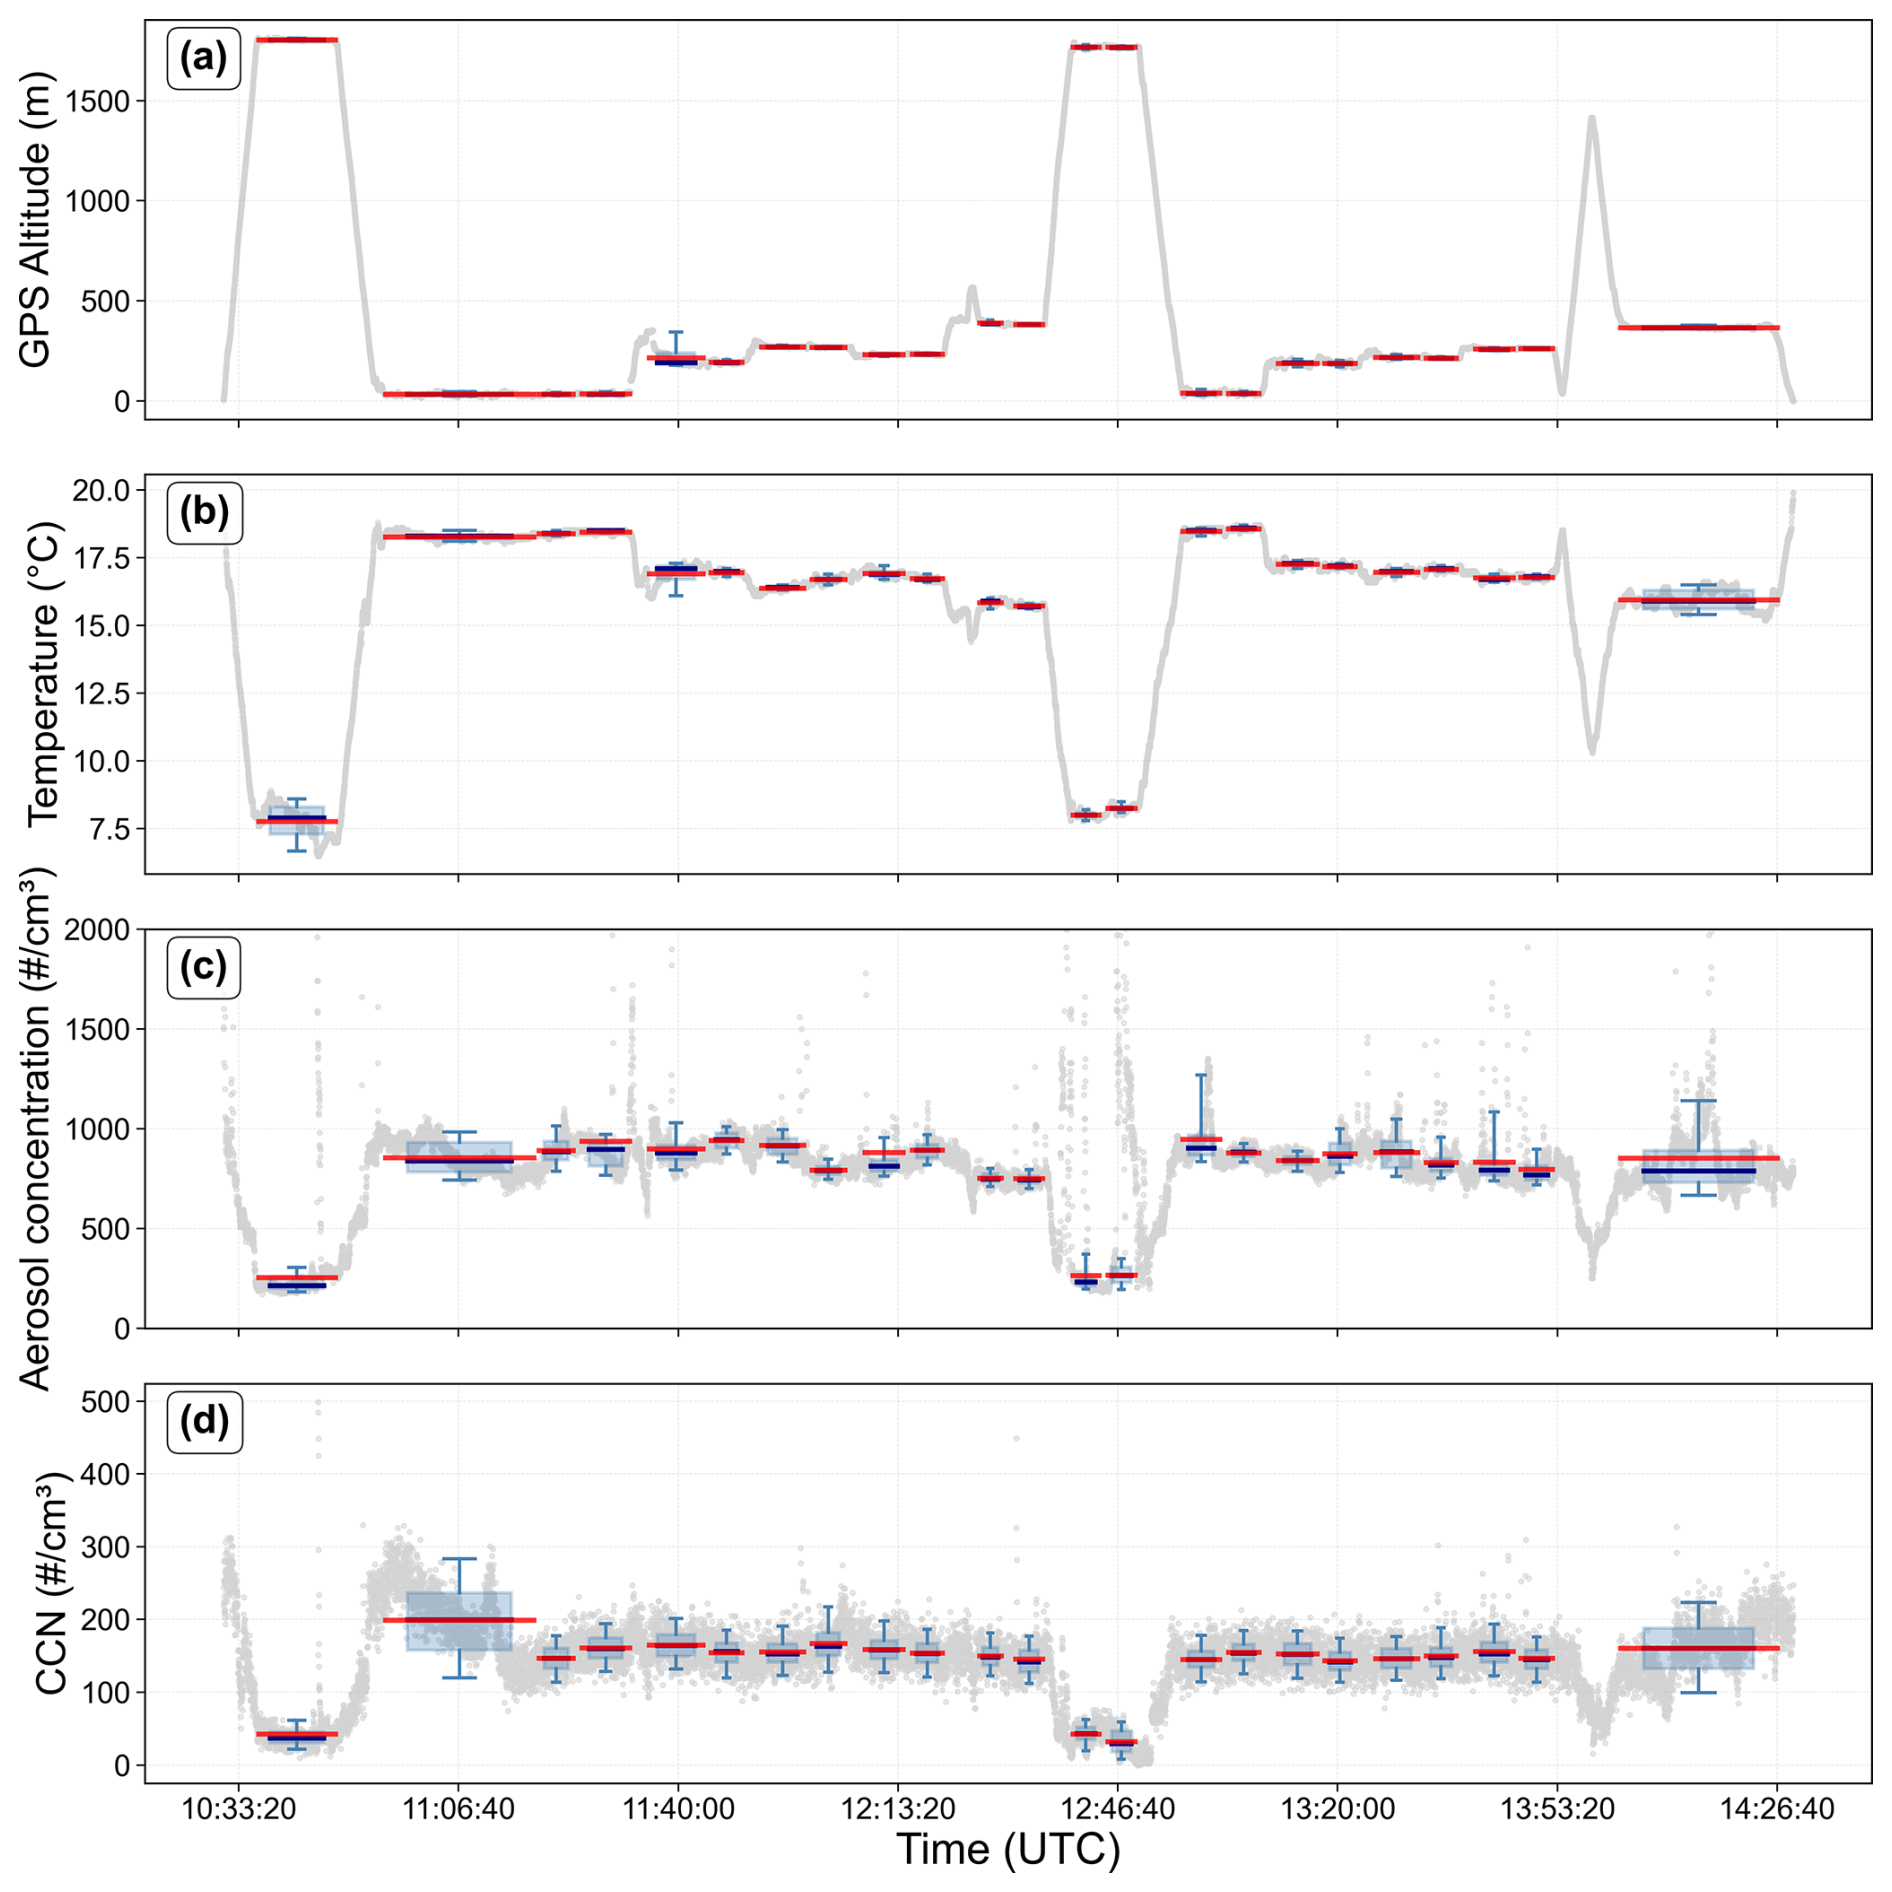
Figure 2Example of leg-mean (red) and percentiles (blue box, with box representing 25th and 75th percentiles and bars representing 5th and 95th percentiles) on 25 June 2017 during ACE-ENA: (a) GPS altitude; (b) ambient temperature; (c) aerosol number concentration (size > 10 nm) measured by CPC 3772; and (d) CCN concentration. Gray dots denote the original 1 Hz measurements.
All these measurements are in 1 Hz frequency, which exhibit strong instantaneous fluctuations caused by turbulence and instrument noise. In order to obtain statistical robustness or compare with coarse-resolution models, temporal resolution coarsening is needed (e.g., Tang et al., 2022; Mei et al., 2024a). In this study, we perform calculation of flight-leg statistics to obtain more robust values of aerosols across a wider spatial region. In airborne observations, a flight leg typically refers to a continuous segment of the aircraft's trajectory under relatively stable conditions, such as maintaining constant altitude and heading, thus the measurements within one flight leg usually represent the same environmental condition. We perform leg-mean values and percentiles (5, 10, 25, 50, 75, 90, 95) for measurements obtained in each flight leg, and use leg-mean values throughout of this study. The results are robust if median values (50 percentile) are used (not shown). Figure 2 shows an example of the raw data and leg-statistics for one-day measurements. Extreme values in raw aerosol and CCN measurements can be effectively smoothed out by conducting leg-statistical processing.
2.3 CCN Closure Calculation
2.3.1 CCN Calculation from Aerosol Size Distribution and Composition
In the CCN–closure workflow, the calculated CCN concentration (CCNcalc) combines bulk chemical composition with the κ–Köhler activation criterion. First, AMS-resolved mass concentrations Ci (organics, sulfate, nitrate, ammonium, chloride) are converted to volumes via Eq. (1) using fixed densities given by Liu et al. (2012) for MAM3. (organics: ρorg = 1.0 g cm−3; sulfate/nitrate/ammonium: ρsalt = 1.77 g cm−3 ; chloride: ρchl = 2.2 g cm−3). Summing over species yields the total particle volume Vtotal and the corresponding organic/inorganic volume fractions.
the bulk hygroscopicity is then computed as a volume-fraction–weighted κ (Eq. 2), adopting fixed component values κorg = 0.1 and κinorg = 0.507 (for all species except organics in AMS measurements) (also obtained from Liu et al., (2012).
the κ obtained from Eq. (2) is denoted as κAMS in this study. The assumption of complete internal mixing was adopted primarily to maintain consistency with the parameterization schemes utilized in mainstream global climate models, such as MAM3 (Liu et al., 2012). An external mixing assumption has also been discussed in many previous studies (Broekhuizen, 2006; Kulkarni et al., 2023; Lathem et al., 2013; Moore et al., 2011; Schulze et al., 2020; Wang et al., 2010), in which aerosol species are treated as compositionally distinct particle populations rather than internally mixed particles. Compared with the internal mixing assumption, external mixing generally reduces the effective hygroscopicity and CCN activation efficiency, resulting in lower predicted CCN concentrations. However, accurately representing external mixing states requires detailed particle-resolved compositional information that is not available from the AMS measurements used in this study. Therefore, evaluating alternative mixing-state representations is beyond the scope of this study and warrants further investigation using single-particle observational constraints. Given κ and a prescribed supersaturation SS (in percent), the critical dry diameter Dc is obtained from the κ–Köhler condition = 0. In practice, we solve for Dc numerically by locating the maximum of S(D)−1 using a Newton-type iteration,
where the Kelvin term is expressed with a constant Kelvin length A = 2.1 × 10⁻⁹ m, corresponding to pure-water surface tension at ∼ 298 K. Finally, CCN is calculated by integrating the dry number size distribution N(D) greater than Dc (Eq. 4): we sum all bins whose lower bound exceeds Dc and add the linear fractional contribution from the bin containing Dc. All calculations use nanometer units for Dc and bin edges to ensure consistency. This procedure is applied at each supersaturation considered in CCN counter (ACE-ENA: supersaturation from A channel (SSa) = 0.14 %, supersaturation from B channel (SSb) = 0.32 % in IOP1 and 0.37 % in IOP2; HI-SCALE: SSa = 0.24 %, SSb = 0.46 %), producing leg-mean CCNcalc values directly comparable to in-situ CCN counter measurements for closure assessment, i.e.,
where f = is the linear fractional area of bin i greater than Dc, assuming uniform number density within each bin.
2.3.2 Kappa from CCN (κccn) Calculation
To infer the hygroscopicity parameter κ implied by the observed CCN concentration (κccn), we also invert the κ–Köhler activation criterion using the leg-mean aerosol dry size distribution and the in-situ CCN measurements.
For each flight leg, CCN concentrations measured at supersaturation SS (for channel A or B) are matched against the leg-mean dry number size distribution N(D). The size distribution is expressed in discrete bins with lower and upper bounds Dmin,i and Dmax,i, and bin-integrated number concentrations Ni (cm−3). We first construct the cumulative number concentration above each bin:
which approximates .
Given the observed CCN concentration CCNobs, we determine the diameter Dc for which the cumulative number equals CCNobs. In practice, this is achieved by monotonic interpolation between adjacent cumulative points: all bins with Dmin,j > Dc are fully counted, the bin containing Dc contributes a fractional number assuming uniform number density within the bin,
so that
Legs where CCNobs exceeds the total aerosol number concentration are rejected from inversion.
Once Dc (nm) is obtained, κ is determined by inverting the κ–Köhler activation relationship.
For a dry particle of diameter Ds = Dc (converted to meters), the equilibrium saturation ratio over a droplet of wet diameter D under κ–Köhler theory is
where A = 2.1 × 10⁻⁹ m is the Kelvin length.
For a given κ, the critical supersaturation is obtained by locating the maximum of over all D>Ds:
This maximum corresponds to the peak of the Köhler curve, representing the activation barrier that a haze droplet must overcome to transition into a stable cloud droplet. To invert for κ, we tabulate SScrit (κ) for a sequence of trial κ values (0.01–2.0 in increments of 0.01) and then interpolate that mapping to find the κ corresponding to the leg-mean supersaturation SS:
The resulting κccn represents the hygroscopicity implied by the observed CCN activation under the measured size distribution. Legs where Dc≤0, SS≤0, the inversion fails, or the retrieved κ falls outside a physically plausible range (0.01–2.0) are flagged and excluded.
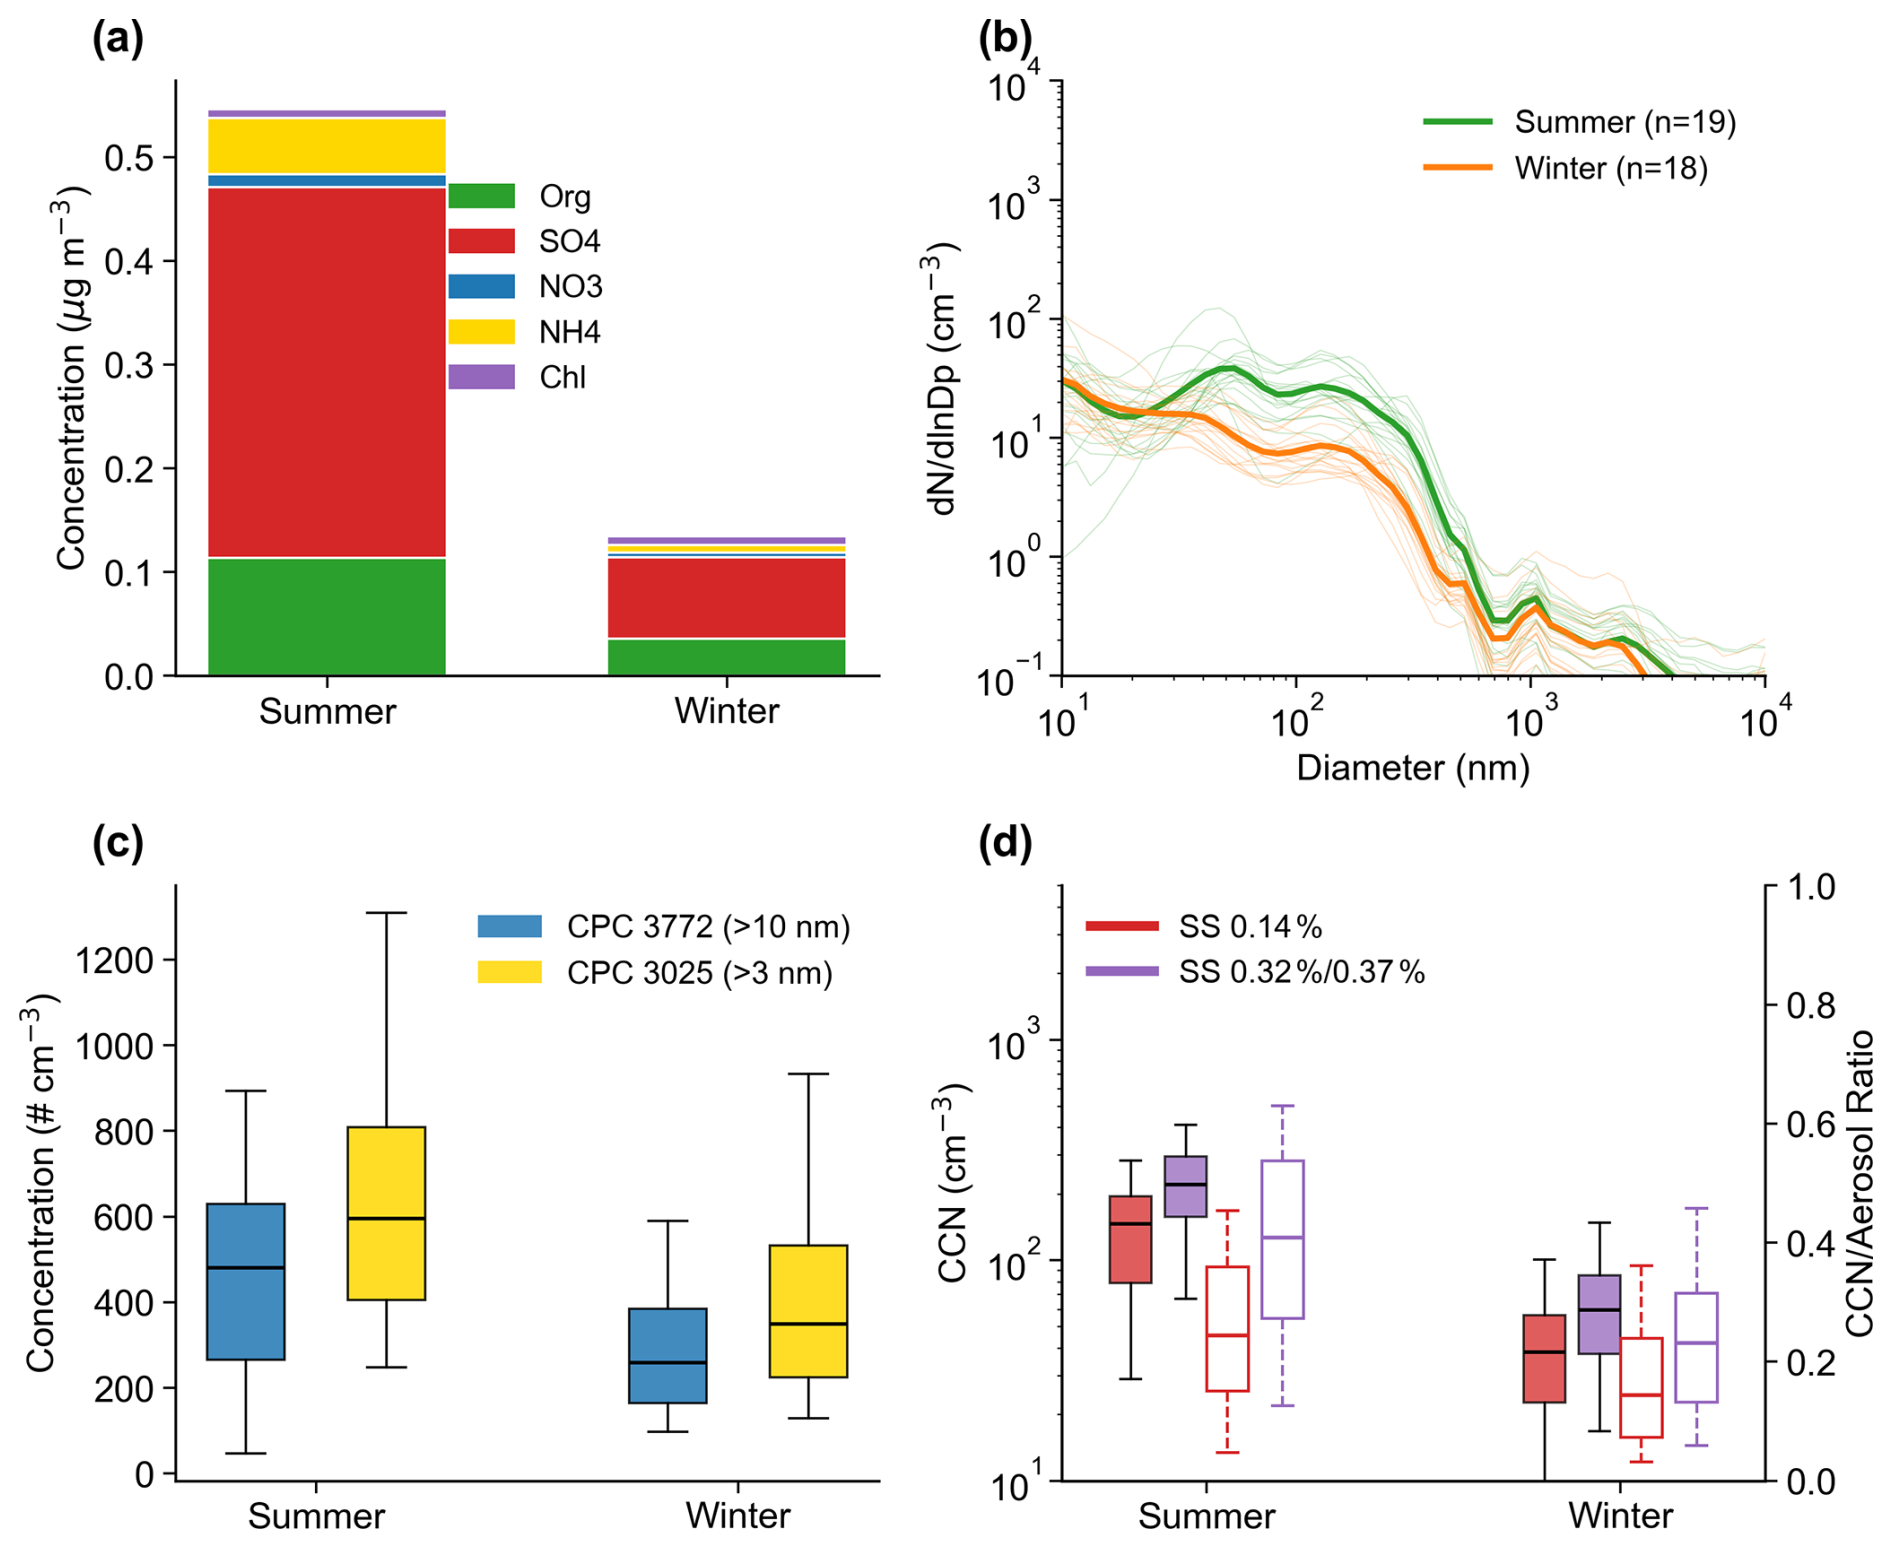
Figure 3Seasonal variations of aerosol and CCN properties during the ACE-ENA campaign (marine environment). (a) Aerosol chemical composition measured by AMS. (b) Seasonal-mean (thick) and flight-mean (thin) aerosol number size distributions from BEASD, n refers to the number of dates. (c) Total aerosol number concentrations measured by CPC 3772 (> 10 nm) and CPC 3025 (> 3 nm). (d) CCN number concentrations and activation fraction (the ratio of CCN number concentration over aerosol number concentrations, dashed lines) at two supersaturations (SSa = 0.14 %, SSb = 0.32 % in summer and 0.37 % in winter, respectively). Summer is for IOP1 (21 June–20 July 2017) and winter is for IOP2 (19 January–19 February 2018). In the box plots, the center line represents the median, the box boundaries denote the 25th and 75th percentiles, and the whiskers extend to the 5th and 95th percentiles of the data.
3.1 Aerosol and CCN Characteristics
During the ACE-ENA, both aerosol and CCN concentrations exhibited a pronounced “summer-high and winter-low” pattern. The mean total aerosol mass concentration measured by the AMS was approximately 0.13 µg m−3 in winter and increased to about 0.55 µg m−3 in summer (Fig. 3a). In both seasons, aerosols over the ENA region were mainly composed of sulfate (65.3 % in summer, 57.8 % in winter) and organics (20.8 % in summer, 26.7 % in winter), whereas nitrate, ammonium, and chloride each contributed less than 10 %. Although both organic and sulfate aerosols are much more numerous in summer, the oxidation of biogenic dimethyl sulfide (DMS) emissions is likely contributed more to aerosol formation in summer, causing higher sulfate fraction over this region (Zawadowicz et al., 2021). Accordingly, mean condensation nuclei (CN) concentrations increased from roughly 260 cm−3 (> 10 nm) in winter to about 480 cm−3 in summer, while mean concentration of CN larger than 3 nm rose from 350 cm−3 to nearly 600 cm−3 (Fig. 3c). In addition to the greater emission rates of aerosol precursors in summer, stronger wet-scavenging effects due to thicker clouds and more frequent precipitation in winter is also a reason of the seasonal aerosol contrast (Gallo et al., 2023; Zheng et al., 2024). This is also consistent with Fig. 3b, showing that the accumulation-mode aerosols were much more numerous in summer than in winter while the Aitken-mode aerosols were similar or even slightly less for particles of ∼ 20 nm in diameter. The higher particle number concentration in summer resulted in much higher CCN concentrations under both supersaturation conditions (0.14 % and 0.32/0.37 %) (Fig. 3d).
Figure 3d also shows aerosol activation fraction, which is the proportion of aerosol particles that can be activated into cloud droplets at a given supersaturation. A higher activation fraction indicates larger and/or more hygroscopic particles, whereas lower values suggest smaller or less soluble aerosols. As shown in Fig. 3d, activation fraction is much higher in summer than in winter. The contrast highlights differences in aerosol properties and cloud microphysical conditions in different seasons. In summer season, there are much more accumulation mode aerosols and slightly less Aitken mode aerosols than in the winter season (Fig. 3b). Associated with slightly higher sulfate fraction and thus higher hygroscopicity (Fig. 3a), a much larger fraction of aerosol particles can be activated to form cloud droplets. It is also straightforward that the activation fraction at higher supersaturation is higher than at lower supersaturation.
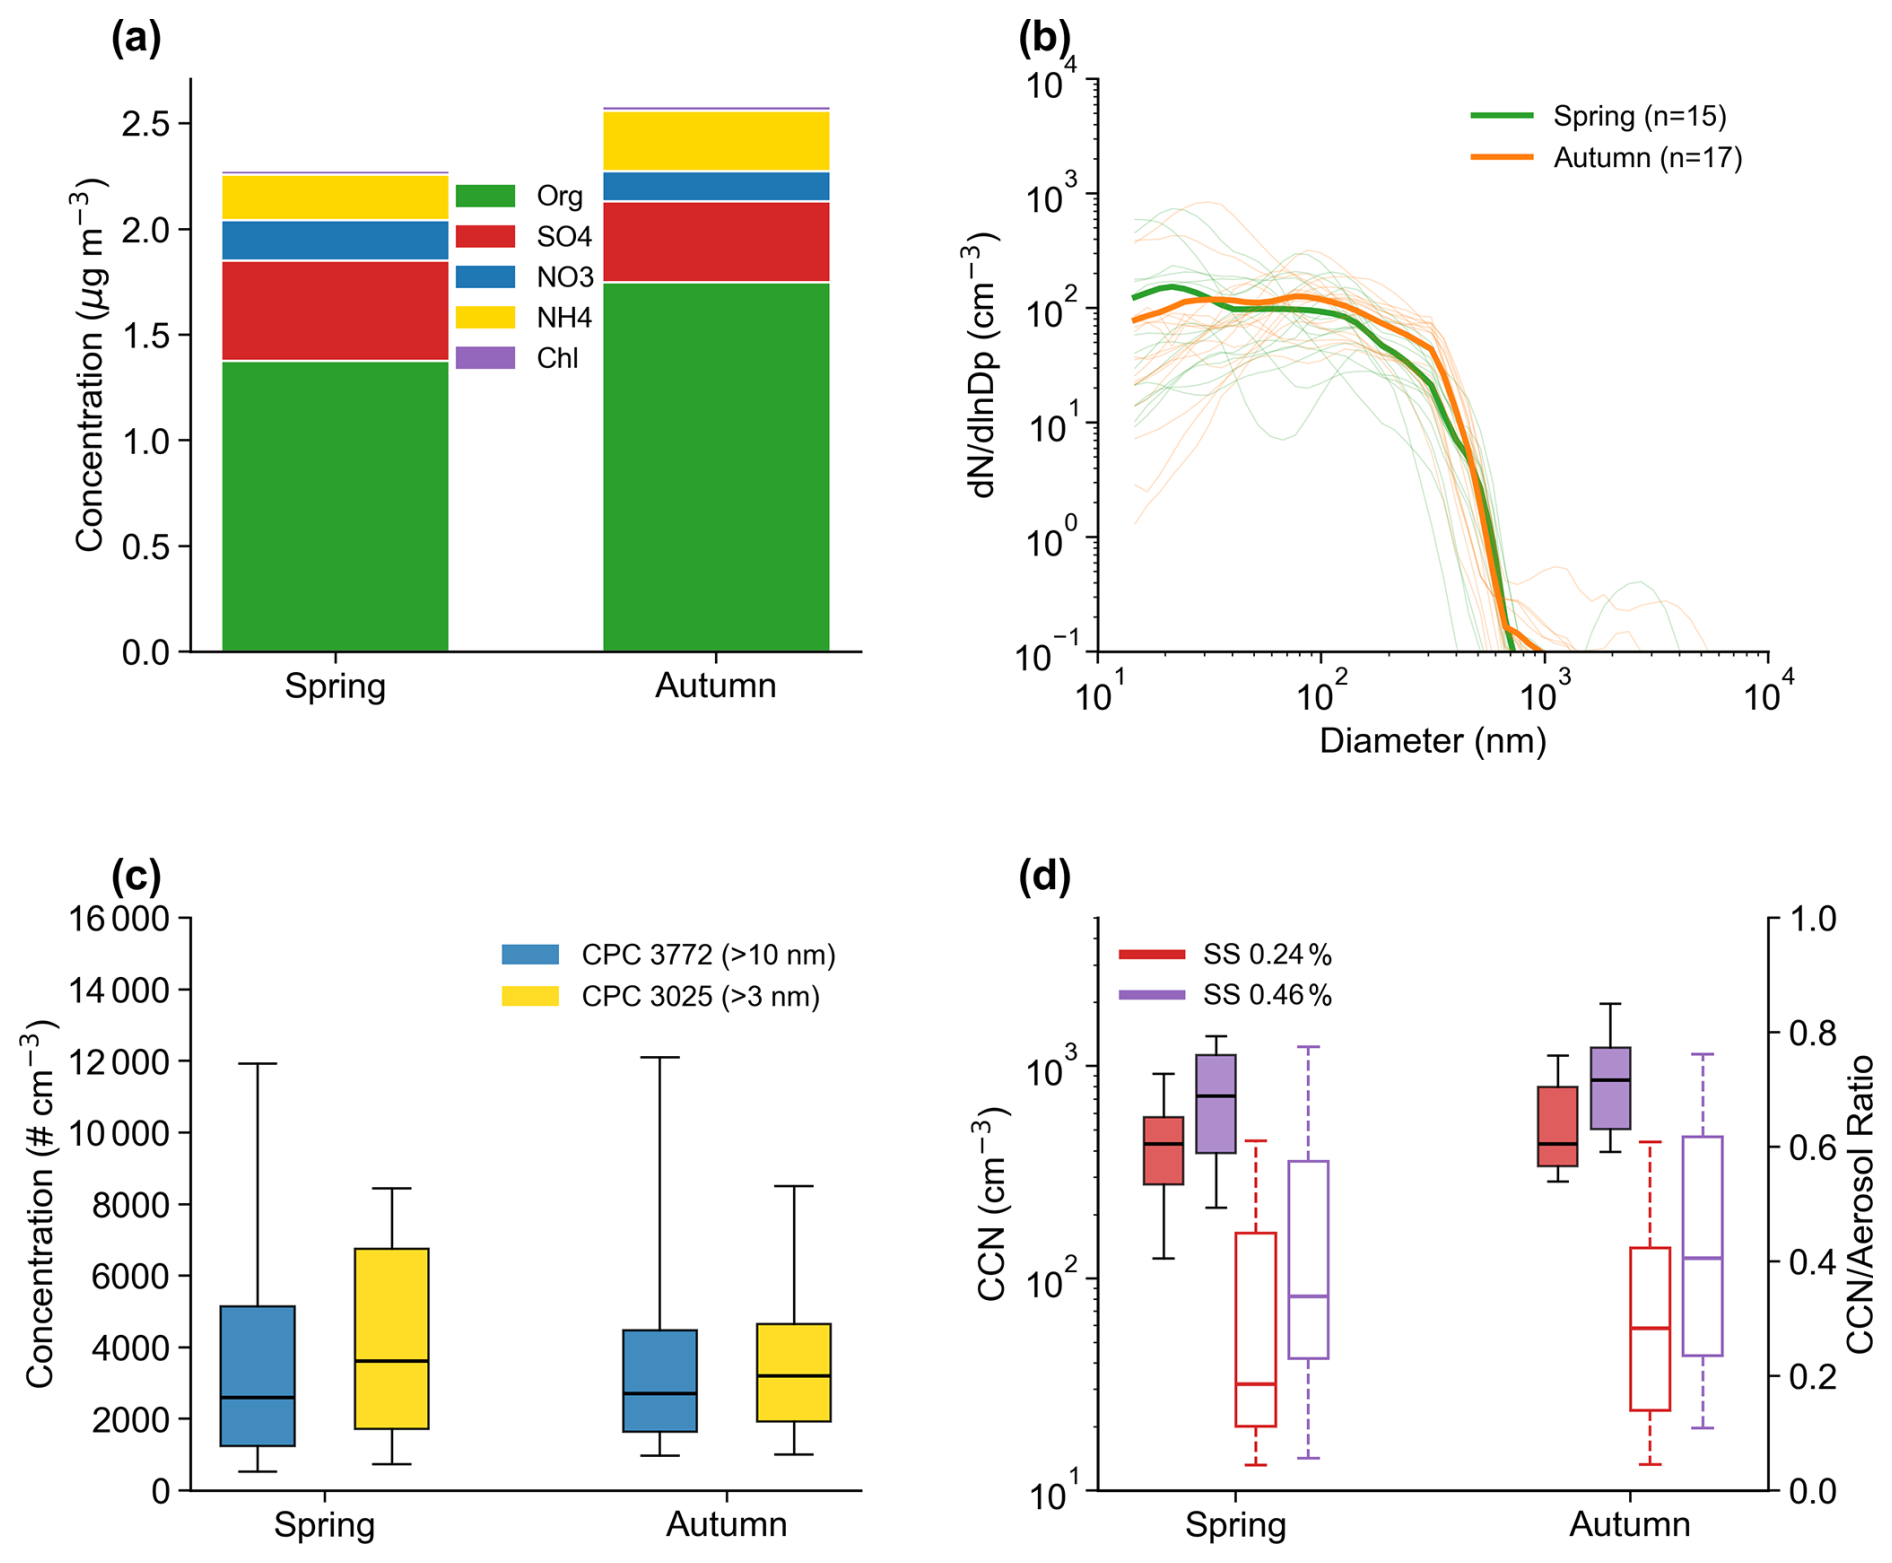
Figure 4Same as Fig. 3, but for the HI-SCALE campaign (continental environment) and here spring is for IOP1 (5 April–20 May 2016) and autumn is for IOP2 (29 August–17 September 2016).
For HI-SCALE, the two IOPs are in spring and autumn seasons, respectively. As shown in Fig. 4a, the total aerosol mass concentrations averaged in the two IOPs were similar, approximately 2.3 and 2.6 µg m−3 , respectively. In both seasons, aerosols were dominated by organic matter (accounting for 60.4 % in spring and 67.7 % in autumn), then sulfate (20.9 % in spring and 14.8 % in autumn). The slightly higher concentration of organics is likely due to more local or near-local emission accumulated under weaker winds (Liu et al., 2021). According to CPC instrument measurements, in both seasons, the concentrations of CN (> 10 nm) and CN (> 3 nm) remained at the same order of magnitude; the median values were 2600 (> 10 nm, spring), 2708 (> 10 nm, autumn), 3608 (> 3 nm, spring), and 3198 (> 3 nm, autumn), respectively. Accordingly, the CCN concentration and activation fraction showed no systematic seasonal dependence. CCN number concentration at SS = 0.24 % shows very small seasonal contrast (429.7 cm−3 in spring and 430.5 cm−3 in autumn), but the spring season has much smaller 10th percentile value, indicating stronger wet deposition in occasional spring storms. At SS = 0.46 %, CCN number concentration is higher in autumn, consistent with the higher concentration of aerosols around 100 nm (Fig. 4b). The seasonal difference of CCN concentration is smaller than the seasonal difference of accumulation-mode aerosols as shown in Fig. 4b, which is likely due to the higher relative organic content in autumn reduces the overall hygroscopicity of the aerosols (Saliba et al., 2023).
Comparing the measurements at ACE-ENA and HI-SCALE, both the aerosol number concentration and CCN concentration over the continental site are higher than the marine site by an order of magnitude. This is consistent with the surface observations (Wilbourn et al., 2023), contributed by various terrestrial sources in agricultural region (Liu et al., 2021) and minimal local pollution at the remote marine environment (Wang et al., 2021; Wilbourn et al., 2023; Zheng et al., 2018, 2024). In terms of chemical composition, aerosols at ENA are dominated by marine biogenic sources and long-range transport (Wang et al., 2022; Zawadowicz et al., 2021), with substantial sulfate produced from DMS oxidation, extremely low nitrate, chloride, and ammonium concentrations, and overall acidic particles; organic aerosol levels are relatively low and mainly associated with transported continental air masses (Nah et al., 2021). In contrast, HI-SCALE reflects a mixture of regional sources, where secondary organic aerosol from isoprene oxidation is prominent, abundant NH3 emissions from agriculture and livestock create an alkaline environment that enhances ammonium sulfate and ammonium nitrate formation, and episodic biomass burning further elevates organic aerosol mass (Liu et al., 2021). Size distributions also differ markedly: at ACE-ENA, Aitken-mode particles partly arise from marine new particle formation and a distinct coarse-mode sea-salt peak extends to several micrometers (Zheng et al., 2021), whereas at HI-SCALE, Aitken-mode particles are more strongly influenced by continental new particle formation (NPF) and combustion emissions and coarse particles are generally scarce except during dust or biomass-burning events (Zheng et al., 2024). Overall, the marine environment tends to exhibit relatively larger particles due to sea-salt contributions, while the continental environment is dominated by submicron particles with a much higher fraction of small particles.
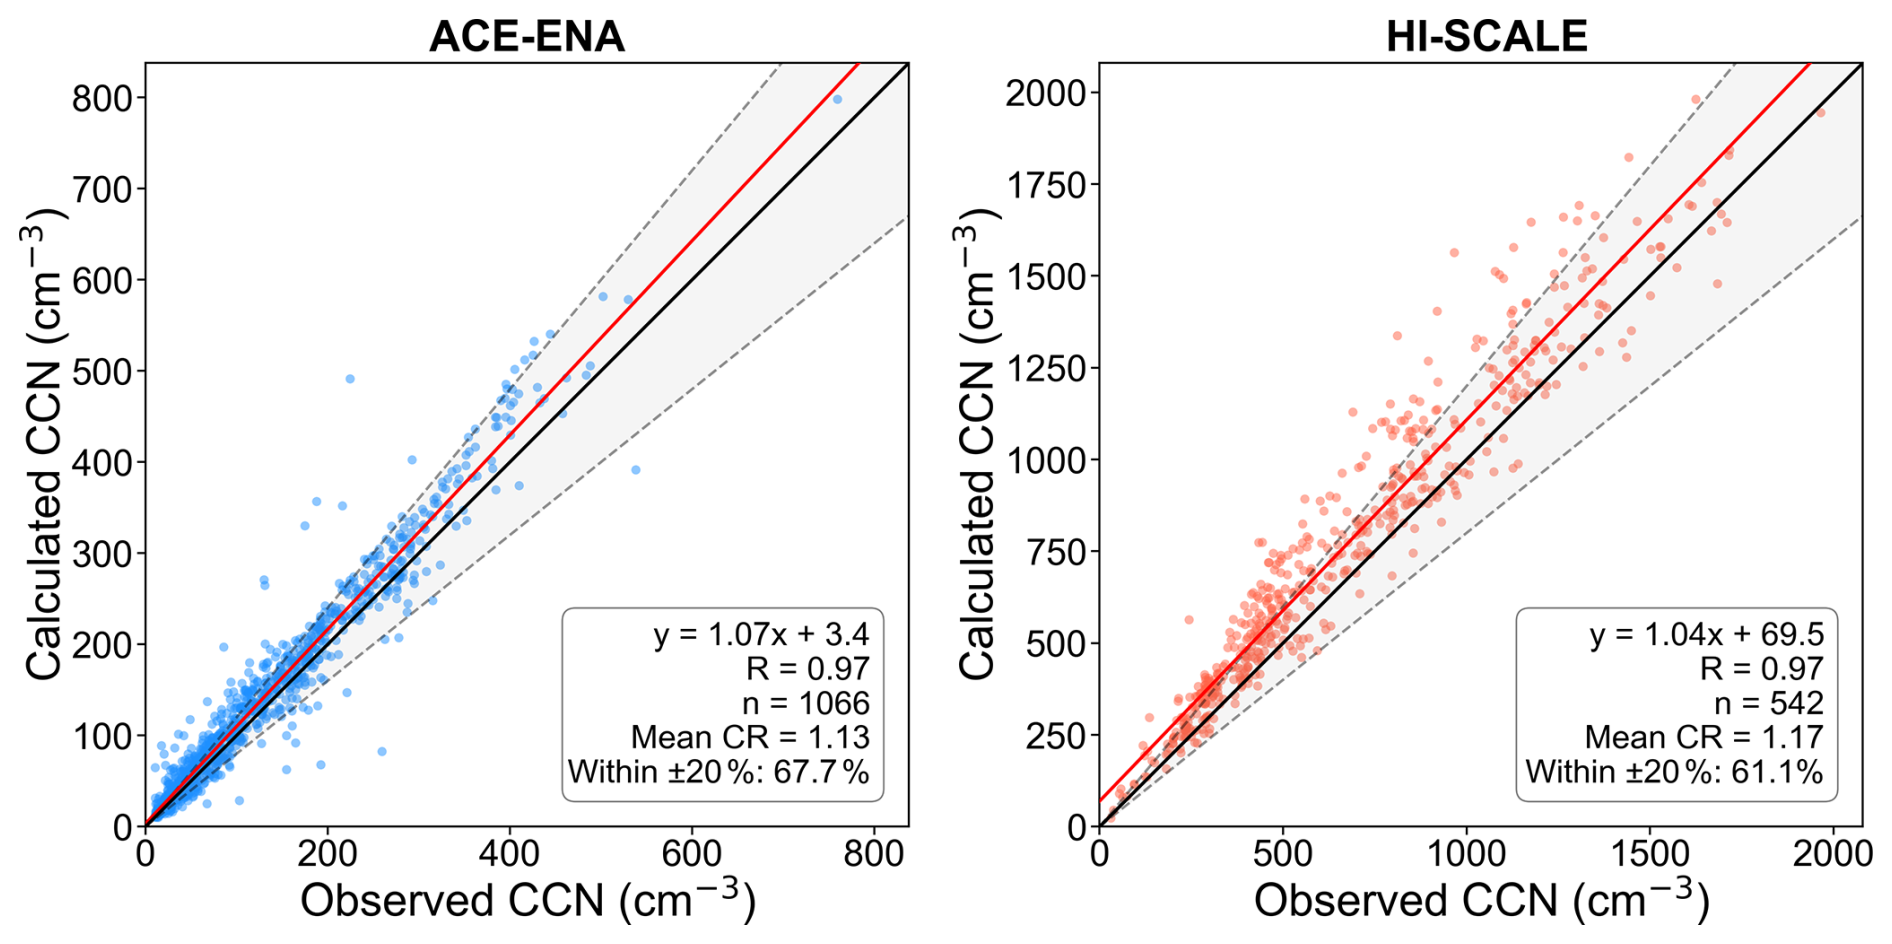
Figure 5Comparison of observed and calculated CCN number concentrations for ACE-ENA (left) and HI-SCALE (right). Each dot represents mean CCN concentration of one flight leg. The black line denotes the 1:1 reference line, with the gray shaded area represents the ± 20 % range. The red line indicates the best-fit linear regression. The linear fitting function, R value, sample number, mean Closure Ratio (CR = calculated CCN/observed CCN) and percentage of samples within ± 20 % range are given in the figure inserts.
3.2 CCN Closure Analysis
Figure 5 presents the scatter plots of observed and calculated CCN for all data from ACE-ENA and HI-SCALE (excluding extreme values where CCN concentrations are less than 10 cm−3 or more than 2000 cm−3). Overall, under the Köhler theoretical framework, CCN closure fitting performs well, with 67.7 % (ACE-ENA) and 61.1 % (HI-SCALE) of the data points fall within the ± 20 % closure interval. Calculated CCN slightly overestimates observed CCN, with CR values of 1.13 for ACE-ENA and 1.17 for HI-SCALE. The overestimation of calculated CCN for ACE-ENA is concentrated in relatively clean conditions (below 200 cm−3), while the overestimation for HI-SCALE is more frequently occurred in higher concentration conditions (400–1600 cm−3). Wex et al. (2010) suggests that complete internal mixing tends to overestimate CCN concentrations especially when less hygroscopic species dominates. Organics coating outside the more hygroscopic aerosol particles, which has been observed over regions, including SGP, with different organic emission sources, may decrease the overall hygroscopicity estimated using internal mixing assumption (Li et al., 2023; Mei et al., 2024b).
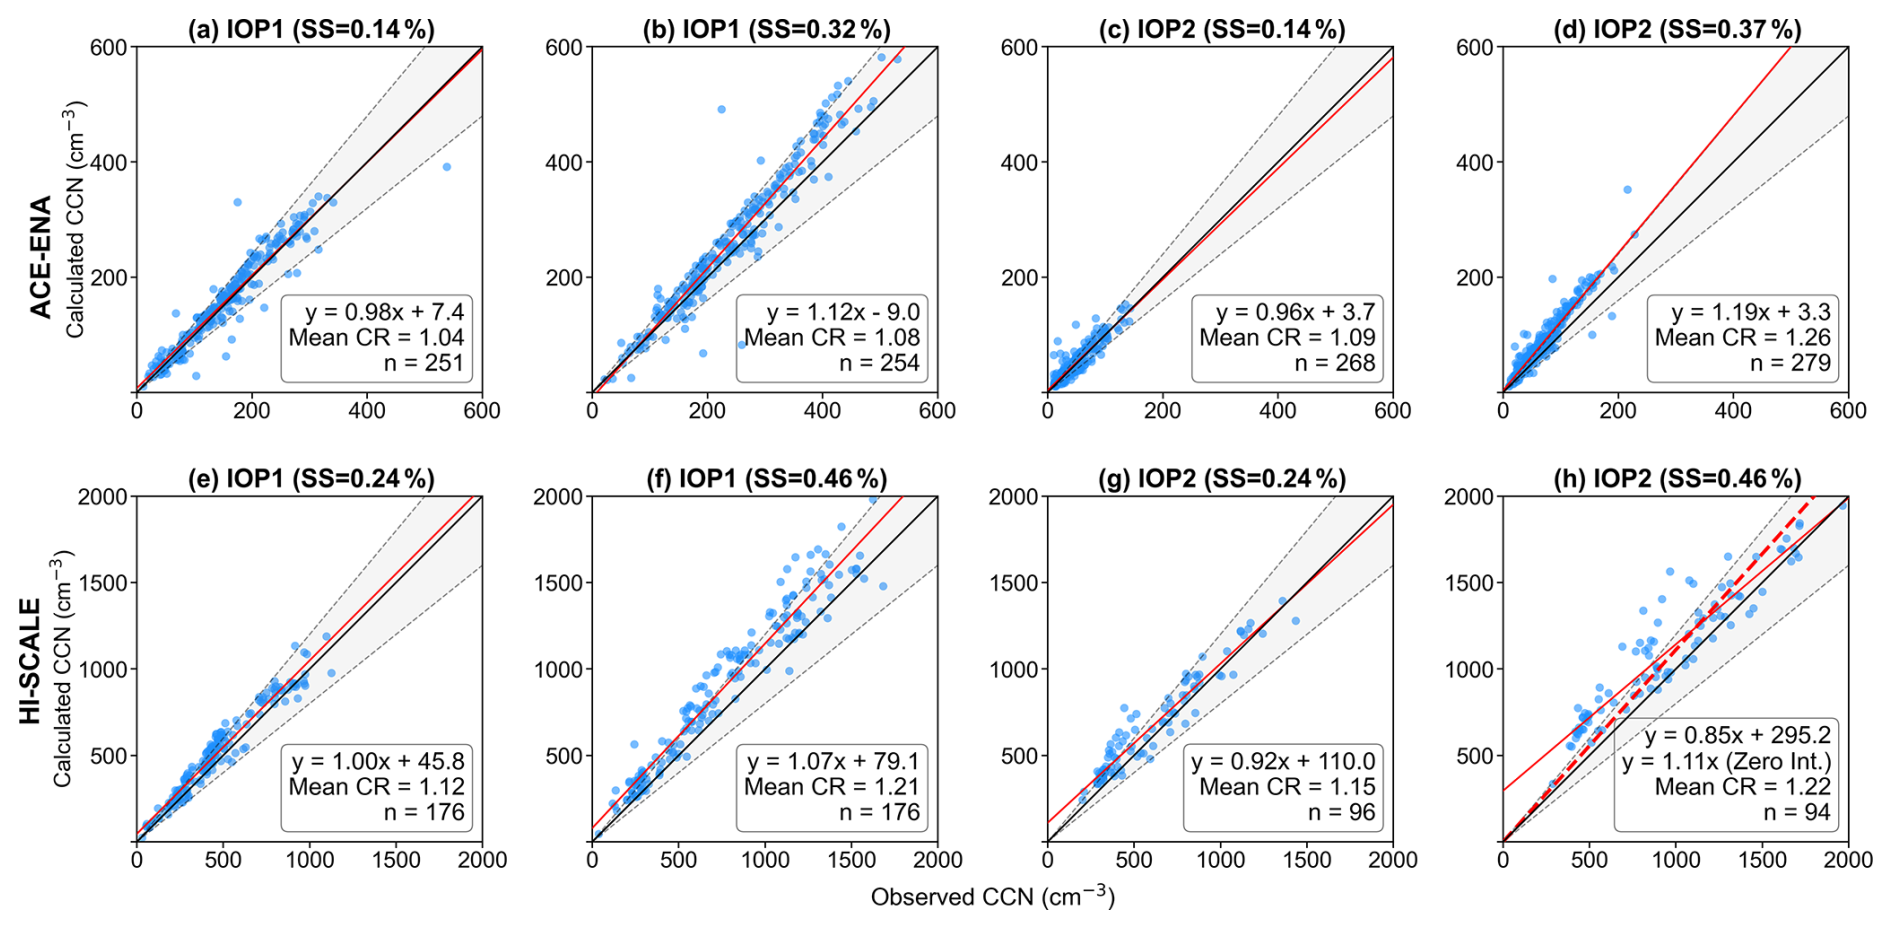
Figure 6a–d and e–h shows the CCN closure performance for ACE-ENA and HI-SCALE, respectively, separated by season and supersaturation. Consistent with the results in Sect. 3.1, both the observed and calculated CCN concentrations during IOP2 of ACE-ENA are clearly lower than those during IOP1, whereas no significant difference in CCN concentration is observed between the two intensive observation periods in HI-SCALE.
Because CCN concentrations during HI-SCALE IOP2 are generally higher, applying the original form of linear regression () results in an unrealistically large y-axis intercept (Fig. 6h, red solid line). Therefore, a zero-intercept regression (y=ax) is adopted instead (Fig. 6h, red dashed line).
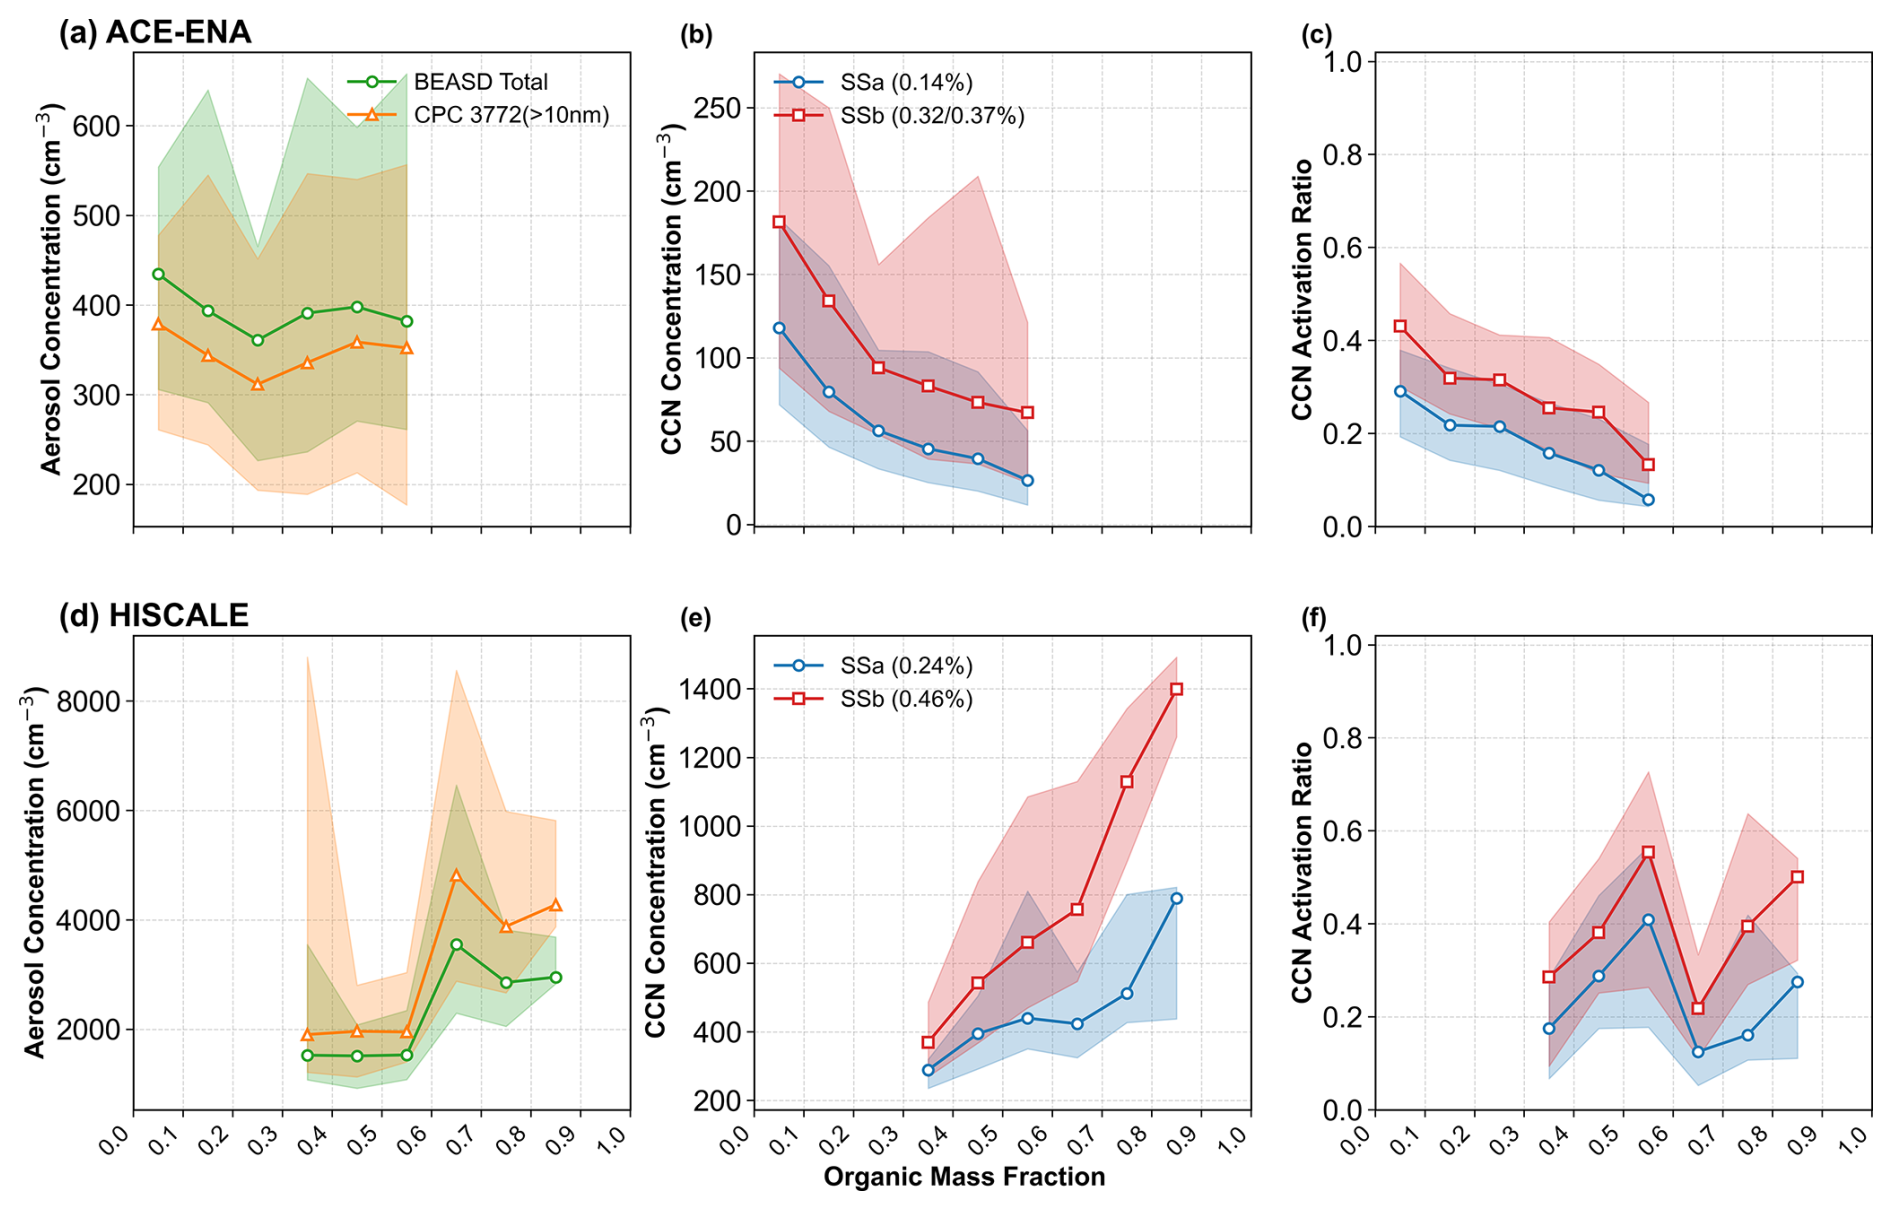
Figure 7Dependence of (left) total aerosol number concentration, (middle) CCN concentration, and (right) CCN activation ratio on MForg for ACE-ENA (top) and HI-SCALE (bottom). Shaded areas indicate interquartile ranges (IQRs) and the lines show the median values across all flight legs.
Overall, CCN closure performs better under low supersaturation (SS) conditions, whereas at higher SS the performance degrades slightly and exhibits a systematic overestimation, with slopes generally exceeding 1. Within the κ–Köhler framework, increasing SS reduces the critical activation diameter and enhances sensitivity to the small-particle end of the size distribution; consequently, any bias in the counting or measurement of small particles (e.g., from the FIMS instrument) is amplified, which may lead to systematic CCN overestimation (Wang et al., 2018; Xu et al., 2021). In addition, assuming a constant κ value derived from bulk AMS composition tends to overestimate aerosol hygroscopicity because the AMS does not detect certain non-volatile or low-κ components, such as weakly oxidized organic matter or refractory species. A notable limitation in this approach is the exclusion of black carbon (BC). Since the AMS exclusively measures non-refractory submicron components, the volume fraction of hydrophobic BC (κ≈0) is omitted from the volume-weighted average in Eq. (2). This omission artificially inflates the bulk hygroscopicity of the particles, rendering the modeled internal mixture more hygroscopic than the actual ambient population. Such an effect is particularly relevant in environments influenced by combustion or long-range transport of continental pollution, further contributing to the systematic overestimation of CCN activation. (Ren et al., 2023; Saliba et al., 2023; Soloff et al., 2025).
3.3 CCN Relation with Organic Mass Fraction
As shown before, the bulk hygroscopicity of aerosols are primarily determined by the ratio of two groups of aerosols: hydrophilic inorganic particles including sulfate, nitrate, and ammonia aerosols, and hydrophobic particles including primary and secondary organic matters. Therefore, here we further investigate the relationship of CCN concentration and CR with the MForg, calculated by the mass ratio of total organics with total aerosols from the AMS measurements.
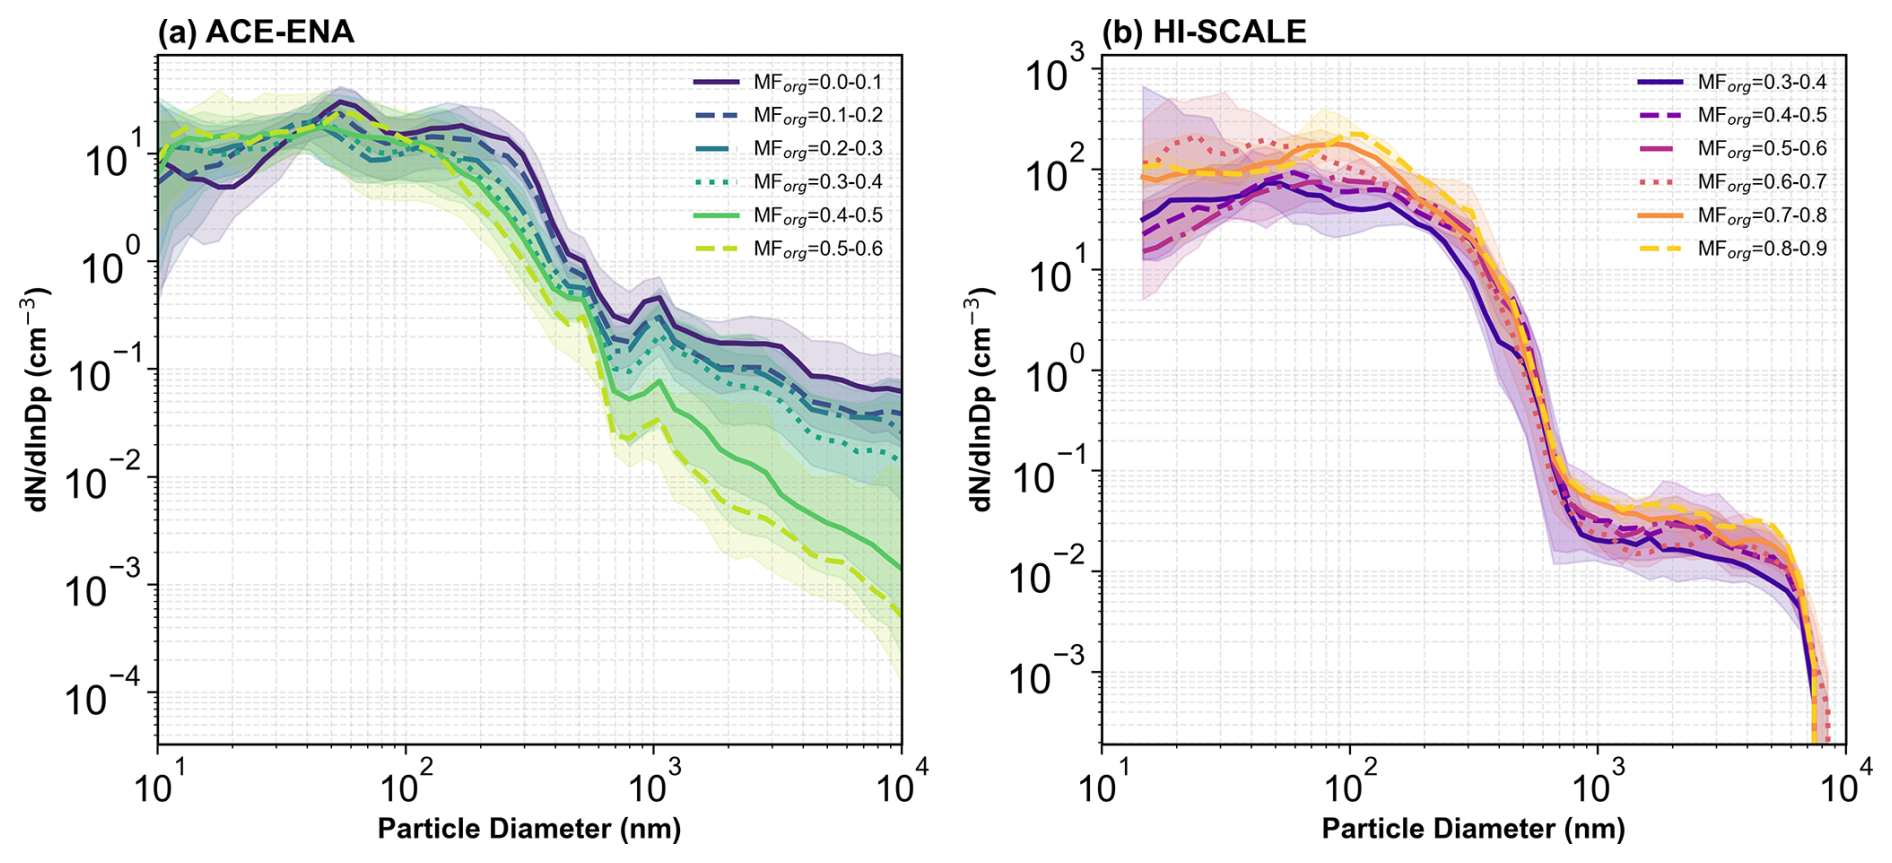
Figure 8Aerosol particle size distribution in different MForg ranges in (a) ACE-ENA and (b) HI-SCALE.
3.3.1 Variation of CCN Concentration with MForg
Figure 7 shows the dependence of aerosol number concentration, CCN number concentration, and CCN activation ratio (the ratio of CCN and aerosol number concentration) on MForg for ACE-ENA and HI-SCALE. It is surprising that the relationships with MForg are dramatically different at the two sites. For ACE-ENA, along with MForg increasing from low (∼ 0.1) to moderate (∼ 0.6) values, total aerosol number remained nearly constant (Fig. 7a), while median CCN concentrations decreased by roughly 70 %–80 % in both supersaturations (SSa = 0.14 %, SSb = 0.32/0.37 %) (Fig. 7b). Therefore, the CCN activation ratio declined correspondingly from about 0.3 to below 0.1 (Fig. 7c). This phenomenon has also been reported in several previous studies (Dusek et al., 2010; Liu et al., 2023; Martin et al., 2011; Mei et al., 2013) and some explained it as the decrease of the bulk hygroscopicity by an increase of organic fraction, which increases the critical activation diameter, and decreases the fraction of particles that can activate at a given supersaturation (Dusek et al., 2010; Liu et al., 2023; Martin et al., 2011). However, decreasing hygroscopicity alone may not explain the large differences in CCN activation ratio shown in Fig. 7c. Figure 8a shows the aerosol size distribution in different MForg bins for ACE-ENA. It is clearly seen that when MForg is greater, large particles are much less numerous while Aitken mode aerosols are more numerous. This is likely because organic aerosols at the ENA site are primarily secondary aerosols. When there is a large fraction of organics, the atmospheric condition must favor NPF, that is calm winds and less cloudy with strong solar radiation. Under this condition, aerosol dry deposition is also strong thus less large-size particles may stay in the atmosphere. This feature of more Aitken-mode and less accumulation-mode aerosol leads to much smaller fraction of aerosols above the critical diameter for activation, therefore decreasing the CCN activation ratio.
In contrast to ACE-ENA, observations for HI-SCALE show much more organic aerosols: MForg varies from 0.3 to 0.9 (Fig. 7d). As MForg increases, aerosol number concentration first remained nearly constant and then rose sharply when MForg is around 0.6 to 0.7 (Fig. 7d). However, CCN number concentration increases continuously as MForg increases. Therefore, CCN activation fraction exhibited two distinct increasing windows, occurring over the ranges MForg = 0.3–0.6 and 0.7–0.9 (Fig. 7f). Figure 8b shows that when the MForg is between 0.6 and 0.7, the Aitken-mode particles are the most abundant. Because these particles are too small, they cannot be activated as CCN under normal supersaturations. Due to the increase of these small particles, when MForg is within the range of 0.6–0.7, the total aerosol number concentration increases sharply. However, the aerosols at ∼ 100 nm diameter increase continuously when MForg increases, leading to a continuous increase in CCN concentration with rising MForg during the HI-SCALE campaign.
Organic aerosols at SGP may be influenced by multiple sources and processes, including local emissions and secondary production associated with NPF. Therefore, the relationship between MForg, particle size distribution, and CCN activity is not expected to be controlled by organic fraction alone. Figure 8b suggests that changes in aerosol size distribution provide an important explanation for the non-monotonic variation in CCN activation ratio. In particular, the MForg = 0.6–0.7 bin is characterized by enhanced Aitken-mode particles and relatively fewer accumulation-mode particles. These small particles can substantially increase the total aerosol number concentration but are less likely to activate as CCN under the measured supersaturation conditions. As a result, the CCN activation ratio decreases abruptly (Fig. 7f). At higher MForg, the increased abundance of larger, CCN-relevant particles likely contributes to the recovery of the activation ratio. These results indicate that the dependence of CCN activity on MForg is strongly modulated by particle size distribution and should not be interpreted as a purely compositional effect.
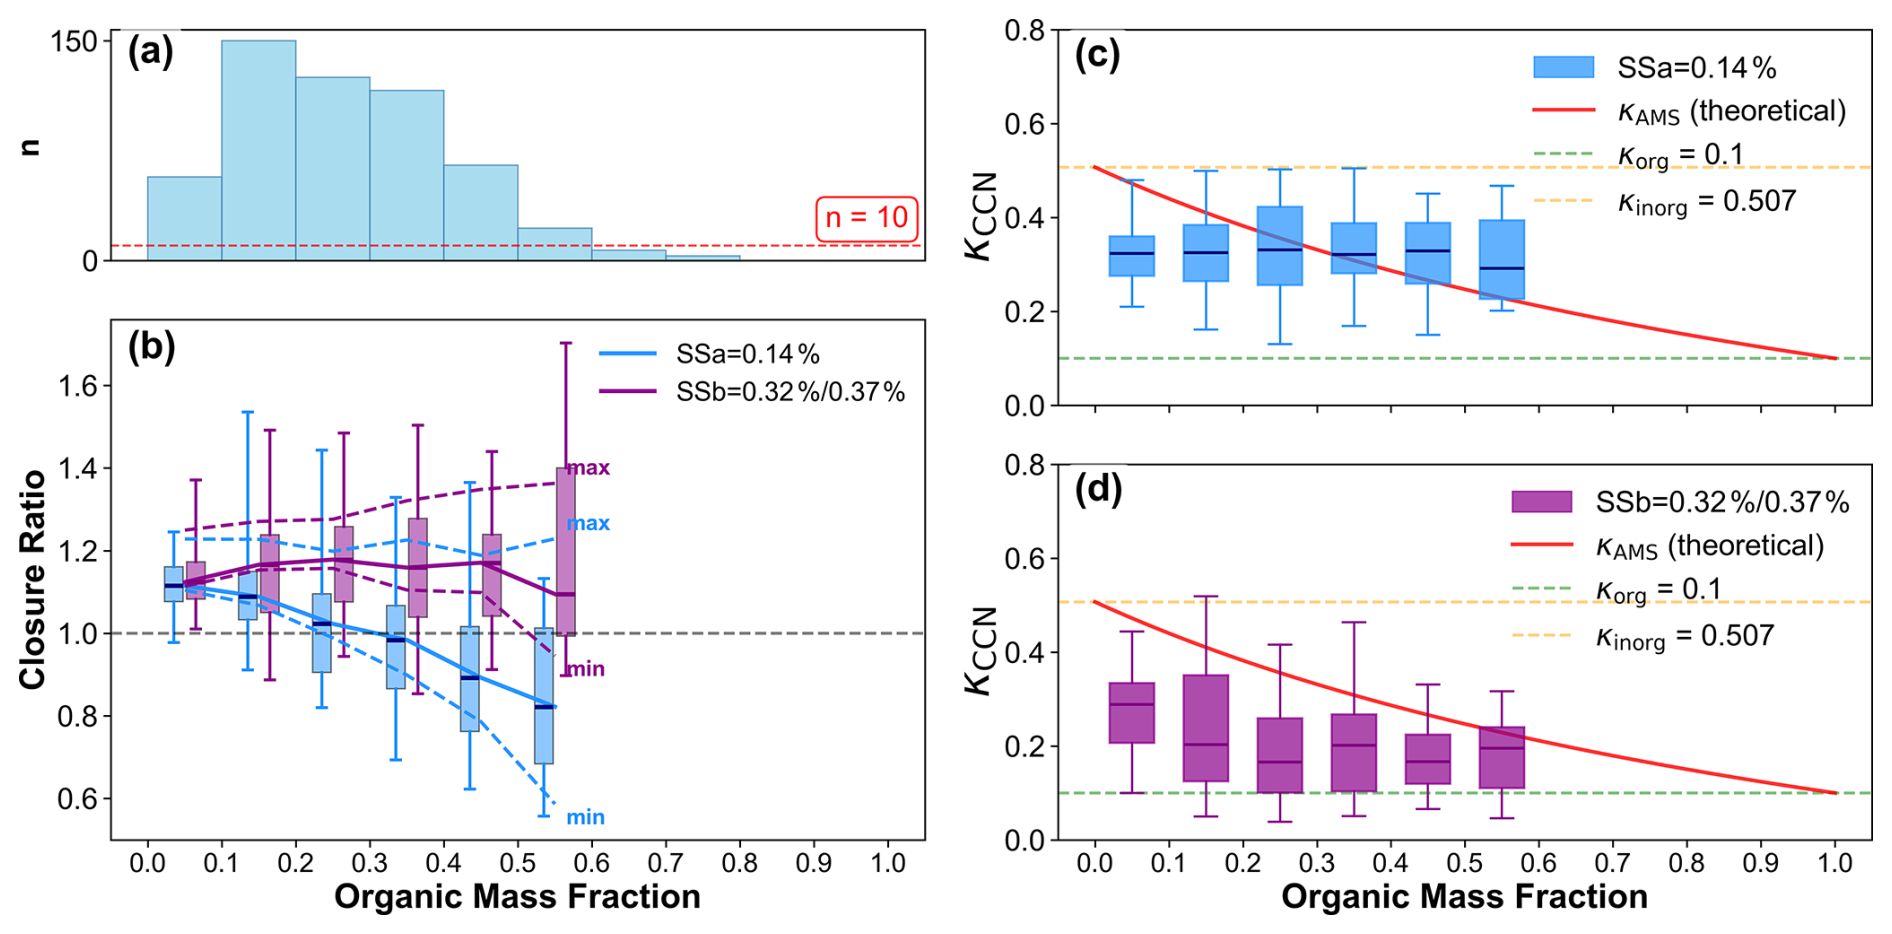
Figure 9Relationship between CR and observed hygroscopicity (κccn) with MForg for ACE-ENA. (a) Number of flight legs in each MForg bins. (b) Box plots of CR as a function of MForg at two supersaturations (SSa = 0.14 %, SSb = 0.32/0.37 %). Dashed lines represent the sensitivity results of maximum and minimum values of median CR derived from the extreme range of density and hygroscopicity parameters reported in literature. (c, d) Comparison between κ derived from aerosol and CCN number concentration (κccn, box plots) and from AMS-measured chemical composition (κAMS, red line), (c) for SSa and (d) for SSb. The pre-defined hygroscopicity for organics and inorganics (κinorg = 0.507, κorg = 0.1) are also plotted in dash. In all box plots, the horizontal line indicates the median, the box boundaries represent the 25th and 75th percentiles, and the whiskers extend to the 5th and 95th percentiles. Only data sample number > 10 was plotted in (b), (c) and (d).
3.3.2 Variation of CCN Closure Ratio with MForg
Figure 9b shows the relations of CR with MForg for the two supersaturations during the ACE-ENA campaign. At low supersaturation (SS = 0.14 %), CR exhibits a clear decreasing trend with increasing MForg. The CR decreases from slightly above unity at low MForg values to below unity at MForg ≈ 0.3–0.35, indicating a transition from model overestimation to underestimation. As the CCN calculation uses bulk hygroscopicity based on composition, this transition means that the actual hygroscopicity at this SS may not be solely dependent on aerosol composition. We calculated the hygroscopicity inversely based on CCN number concentration and aerosol size distribution (κccn), and compared with AMS-based hygroscopicity (κAMS) in Fig. 9c. It shows that the median κccn is rarely dependent on MForg, which is inconsistent with the assumption of internal mixing and fixed hygroscopicity for each AMS-measured composition. As a result, κccn is smaller than κAMS in small MForg and greater than κAMS in large MForg, causing the transition of CCN closure performance in changing MForg.
In contrast, at higher supersaturations (SS = 0.32/0.37 %), the dependence of CR on MForg is much weaker, remaining nearly constant around 1.1 with a slight positive bias. The inversely calculated hygroscopicity (κccn) based on CCN number concentration and aerosol size distribution shows a negative correlation with MForg (Fig. 9d), indicating MForg indeed plays a role in determining the overall aerosol hygroscopicity. However, κccn is always smaller than κAMS regardless of MForg. This indicates that either the fraction of organic aerosols that can be activated at this SS is greater than the overall organic fraction, or the prescribed hygroscopicity of organics or inorganics is too large.
The different behaviours of CR as a function of MForg under different supersaturations reflect that the composition structure of marine aerosols is size-dependent. Lower supersaturation represents larger critical diameter thus only larger-size particles (e.g., accumulation mode) can be activated, while higher supersaturation means more small-size (even the Aitken mode) particles can be activated. The above results indicate that the variation of organic fraction is mainly for small particles, while accumulation-mode particles are dominated by more hygroscopic inorganic aerosols such as sulfate and sea salt. In current atmospheric models, a bulk-averaged hygroscopicity parameter is used to represent the entire aerosol population or a bulk aerosol mode with a wide size range, the compositional heterogeneity across particle sizes is neglected. This averaging artificially incorporates the low hygroscopicity of small particles into the overall value, thereby may underestimate the effective κ of the larger, more CCN-relevant particles. Size-dependent aerosol composition and hygroscopicity measurements are needed to improve our understanding of aerosol activation processes and to further design size-dependent parameterizations for better representing aerosol activation in models.
Moreover, some studies suggest that surface tension σ may be lower than the value assumed here due to the influence of surface-active organics (Facchini et al., 1999; Forestieri et al., 2018; Nozière et al., 2014; Ovadnevaite et al., 2017; Vepsäläinen et al., 2022). Because the Kelvin length (A) scales linearly with σ, the use of a constant pure water σ may overestimate A in Eq. (3), leading to an overestimation of the critical diameter. As a result, the calculated CCN concentrations may be further underestimated at low supersaturation, contributing to a lower CR.
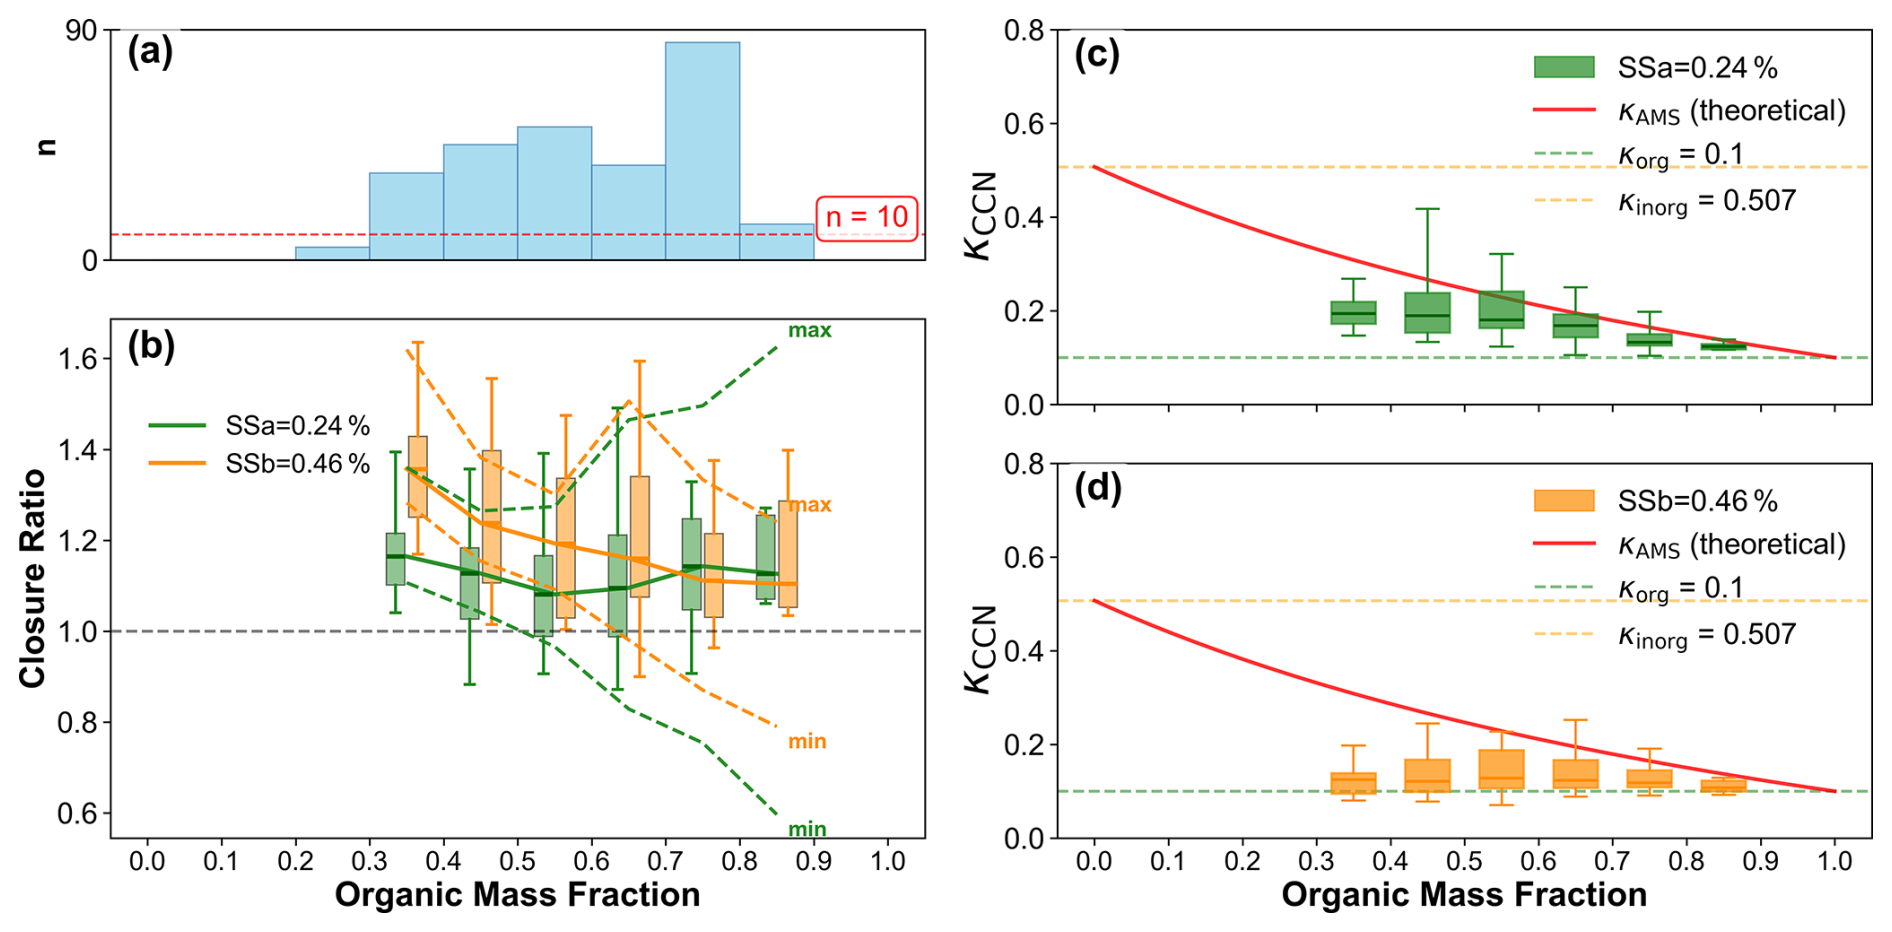
For HI-SCALE CR under both SS conditions is greater than 1 across all MForg ranges (Fig. 10b), indicating overall overestimation of CCN number concentration, as also shown in Sect. 3.2. Organic aerosol fractions at this site are consistently higher than ACE-ENA, driven by biogenic SOA formation and frequent NPF events (Marinescu et al., 2019). Such events enrich small particles in organics with intrinsically low κ regardless of the overall MForg (Fig. 10d). Therefore, when the closure model applies a single bulk composition and κ to all particle sizes, it overestimates κ for the fine-mode particles that dominate activation at high supersaturations, rendering them “too hygroscopic” and leading to CCN overestimation (CR > 1). The overestimation is more severe when MForg is smaller (Fig. 10b).
At lower supersaturations, the critical diameter is larger and only larger particles (accumulation mode) can be activated. The overall hygroscopicity of the accumulation model aerosols is then dependent on MForg, with smaller organic fraction has larger κ value (Fig. 10c). Therefore, the CR in lower SS is weakly dependent on MForg, with the overall overestimation of CR. Previous studies found that the internal mixing assumption can lead to overestimation of CCN concentrations Kulkarni et al. (2023), with evidences showed that organic matter may form a coating layer over inorganic components (Li et al., 2023; Mei et al., 2024b; You et al., 2012; Zelenyuk et al., 2010), reducing the overall hygroscopicity of the aerosols than assuming internal mixing.
Overall, the influence of the MForg on CCN closure is dependent on the environmental conditions, aerosols sources, and supersaturation levels. Aerosol composition and bulk hygroscopicity are size-dependent, so a single bulk κ value for the mixture may not fully describe the aerosol activation behaviour under different supersaturation levels. It is suggested that CCN closure studies must carefully account for the relationship between particle size and chemical composition at each observational site in order to increase the accuracy of CCN calculations.
To quantify the potential influence of model parameter assumptions – such as density and hygroscopicity – on the closure results, sensitivity tests were conducted based on typical ranges reported in literature. The density of organic aerosol typically varies from 1.0 to 1.5 g cm−3 (Broekhuizen, 2006; Cerully et al., 2015; Medina et al., 2007; Meng et al., 2014; Padró et al., 2012), while the organic hygroscopicity parameter (κorg) ranges from 0.01 (nearly insoluble) (Bougiatioti et al., 2009; Medina et al., 2007) to 0.2 (Cerully et al., 2015). Additionally, the maximum assumed κinorg for inorganic species can reach 0.7 (Kulkarni et al., 2023). The dashed lines in Figs. 9b and 10b represent the range of closure ratios (CR) under the combination of these assumptions. A prominent common feature observed at both ACE-ENA and HI-SCALE is that the uncertainty range of CR expands significantly as MForg increases. At low MForg, the variations in assumed parameters result in minimal CR differences due to the dominance of inorganic particles. Conversely, at high MForg, the uncertainty regarding the physicochemical properties of organic aerosols becomes the primary source of error in CCN estimations. This underscores the necessity of obtaining accurate, size-resolved organic composition and property data, particularly in organic-rich environments.
CCN statistics, closure performance, and their dependences with MForg are examined using airborne observations from the ACE-ENA and HI-SCALE campaigns, focusing on how aerosol composition and size distribution influence CCN activation across contrasting marine and continental environments and under different supersaturation levels. The key findings are summarized below.
During the ACE-ENA campaign, aerosols were dominated by sulfate and organics. The mean aerosol mass concentration was 0.55 µg m−3 in summer and 0.13 µg m−3 in winter. Accordingly, CCN concentrations were substantially higher in summer than in winter, with median values of 146.1 cm−3 at 0.13 % supersaturation and 220.6 cm−3 at 0.32 %, compared to 38.2 cm−3 and 59.3 cm−3, respectively, in winter. Large size particles are relatively more abundant, mainly contributed by sea salt aerosols. In contrast, aerosols at the continental site are more abundant. Mean aerosol mass concentrations for HI-SCALE were 2.3 µg m−3 in spring and 2.6 µg m−3 in autumn, showing little seasonal variation. CCN concentrations exhibited no significant seasonal difference either, with median values of 429.7 cm−3 (spring) and 430.5 cm−3 (autumn) at 0.24 % supersaturation, and 720.2 cm−3 (spring) and 857.6 cm−3 (autumn) at 0.46 % supersaturation. More Aitken model aerosols are observed at this location, indicating more frequent new particle formation. The different geographical locations and aerosol sources at the two sites lead to differences in terms of aerosol and CCN number concentrations, chemical composition, and particle size distributions.
CCN closure at both field campaigns shows a systematic overestimation, particularly under higher supersaturation level. No significant seasonal difference was found. The use of internal mixing assumption in CCN calculation is shown to overestimate the bulk aerosol hygroscopicity and cause overestimation of CCN concentration. The overestimation of calculated CCN for ACE-ENA is more prominent in relatively clean conditions, while the overestimation for HI-SCALE more frequently occurs in higher CCN concentration conditions, indicating that the mechanisms of CCN closure bias may be different under the continental and marine environments.
The MForg was primarily distributed between 0 and 0.6 during the ACE-ENA campaign, whereas for HI-SCALE it ranged mainly from 0.3 to 0.9. However, CCN number concentration exhibits different correlations with MForg for the two field campaigns. For ACE-ENA, the total aerosol concentration shows no clear dependence on MForg, while both CCN concentration and activation fraction decreased with increasing MForg under both supersaturation levels. This is attributed to the increase of less hygroscopic organic content shifting the size distribution toward a smaller, Aitken-mode population that cannot activate as CCN at normal supersaturations, while large-size particles become much less along with increasing organic aerosols. For HI-SCALE, aerosol concentration exhibited little variation between MForg ranges of 0.3–0.6 and 0.6–0.9; however, when MForg increased from 0.5–0.6 to 0.6–0.7, the aerosol number concentration exhibits a sharp jump from 1532.7 to 3550.7 cm−3. Large MForg usually indicates stronger emissions of local organic aerosols. More aerosols increase the total number of CCN, while the sudden jump of Aitken mode aerosol number concentration due to NPF lowers the fraction of total aerosols that can be activated into CCN. This complexity suggests the importance of considering size-dependent aerosol properties in aerosol activation studies.
The relationship between MForg and CR varies significantly based on environmental conditions, aerosol sources, and supersaturation levels. For ACE-ENA campaign, CR decreased with increasing MForg at 0.14 % supersaturation, with a transition from CCN overestimation to underestimation at approximately MForg = 0.35. At 0.32 % and 0.37 % supersaturations, CR showed no significant dependence on MForg and remained greater than 1 across all MForg bins. For HI-SCALE, CR at 0.46 % supersaturation decreased with increasing MForg, yet remained above 1 throughout. At 0.24 % supersaturation, CR exhibits little variation with MForg and stays consistently greater than 1. These results show that organic-inorganic variation is size dependent: small particles at ENA and large particles at SGP are more likely from a single source, with a certain κ value independent of the overall MForg. Large particles at ENA and small particles at SGP are the main contributors of MForg, thus MForg influences the overall hygroscopicity and CR is independent of MForg.
It should be noted that as the ACE-ENA and HI-SCALE campaigns were conducted in different seasons, seasonal variability might potentially influence the observed results. However, given that the aerosol mass loading differs by nearly an order of magnitude between the two sites, and the chemical characteristics exhibit a fundamental contrast between terrestrial organic dominance at SGP and marine sulfate dominance at ENA, the environmental regime plays a more central role in determining CCN activation properties and their sensitivity to composition. Seasonality, by comparison, acts as a secondary modulation within the established framework of each site.
Taken together, these findings emphasize the importance of considering size dependence of aerosol properties in aerosol activation studies. While changes in bulk aerosol composition, such as MForg, are often associated with shifts in aerosol size distribution, neither composition nor size distribution alone is sufficient to accurately calculate CCN concentrations. Increasing MForg does not universally enhance or suppress CCN activity, depending on the source of the increased aerosols. Depending on the environmental context, increased organic mass may result from larger, more readily activatable primary aerosols or from an increase in the number of smaller particles generated through new particle formation. Consequently, aerosol activation processes are highly sensitive to both primary aerosol sources – varying by location and season – and supersaturation levels, which dictate the size of aerosols most susceptible to activation. Ignoring this size dependence introduces significant uncertainties and limits the predictive skill of current aerosol activation parameterizations.
Accurately representing aerosol activation in numerical models requires moving beyond crude assumptions about aerosol properties. Current models often employ simple representations of aerosol mixing state and fixed hygroscopicity values for aerosol species, failing to account for processes like aging that alter composition over time and coating effects where only a portion of the aerosol composition is directly available for activation. While the internal mixing assumption serves as a practical baseline consistent with current global climate models, it inherently simplifies the complexity of atmospheric aerosols. To overcome these limitations, future studies could employ particle-resolved models, such as PartMC (Riemer et al., 2009), to explicitly track the dynamic evolution of diverse mixing states. Furthermore, the assumption of homogeneous mixing neglects complex particle morphologies. Recent evidence demonstrates that liquid-liquid phase separation (LLPS) within organic-inorganic mixtures can actively drive aerosol droplet growth in supersaturated regimes, significantly altering effective hygroscopicity (Malek et al., 2023). Although integrating such advanced frameworks is currently constrained by the bulk nature of AMS measurements, combining these modelling approaches with single-particle observational techniques remains a critical frontier for refining aerosol activation parameterizations. Future model development should prioritize more sophisticated representations of aerosol composition, size distribution, and microphysics, with detailed descriptions of particle formation, growth, aging, condensation, and deposition processes across all relevant size modes. This necessitates more detailed observational capabilities capable of resolving the full aerosol size distribution, enabling improved process-level understanding of aerosol activation and robust model evaluation. Ultimately, bridging the gap between observations and model parameterizations is crucial for reducing uncertainties in our understanding of aerosol–cloud interactions and their roles in the Earth system.
The aircraft measurements are obtained from the Atmospheric Radiation Measurement (ARM)Aerial Facility (AAF) Merged value added product (VAP) at https://doi.org/10.5439/1999133 (Atmospheric Radiation Measurement (ARM) User Facility, 2025).
GA and ST designed the research in consultation with HW and MW; FM processed and provided the aircraft observations; HW and MW provided supervision and project administration; GA and ST performed data analysis and prepared the original manuscript. All authors contributed to the reviewing and editing of the manuscript.
At least one of the (co-)authors is a member of the editorial board of Atmospheric Chemistry and Physics. The peer-review process was guided by an independent editor, and the authors also have no other competing interests to declare.
Publisher's note: Copernicus Publications remains neutral with regard to jurisdictional claims made in the text, published maps, institutional affiliations, or any other geographical representation in this paper. The authors bear the ultimate responsibility for providing appropriate place names. Views expressed in the text are those of the authors and do not necessarily reflect the views of the publisher.
This work has been supported by the National Key Research and Development Program of China (grant no. 2024YFF0809403). The Pacific Northwest National Laboratory (PNNL) is operated for the U.S. Department of Energy by Battelle Memorial Institute under Contract DE-AC0576RLO1830.
This research has been supported by the National Key Research and Development Program of China (grant no. 2024YFF0809403).
This paper was edited by Benjamin A Nault and reviewed by three anonymous referees.
Albrecht, B. A.: Aerosols, Cloud Microphysics, and Fractional Cloudiness, Science, 245, 1227–1230, https://doi.org/10.1126/science.245.4923.1227, 1989.
Atmospheric Radiation Measurement (ARM) User Facility: ARM Aerial Facility Merged VAP, Atmospheric Radiation Measurement User Facility [data set], https://doi.org/10.5439/1999133, 2025.
Asa-Awuku, A., Moore, R. H., Nenes, A., Bahreini, R., Holloway, J. S., Brock, C. A., Middlebrook, A. M., Ryerson, T. B., Jimenez, J. L., DeCarlo, P. F., Hecobian, A., Weber, R. J., Stickel, R., Tanner, D. J., and Huey, L. G.: Airborne cloud condensation nuclei measurements during the 2006 Texas Air Quality Study, J. Geophys. Res., 116, D11201, https://doi.org/10.1029/2010JD014874, 2011.
Bougiatioti, A., Fountoukis, C., Kalivitis, N., Pandis, S. N., Nenes, A., and Mihalopoulos, N.: Cloud condensation nuclei measurements in the marine boundary layer of the Eastern Mediterranean: CCN closure and droplet growth kinetics, Atmos. Chem. Phys., 9, 7053–7066, https://doi.org/10.5194/acp-9-7053-2009, 2009.
Broekhuizen, K., Chang, R. Y.-W., Leaitch, W. R., Li, S.-M., and Abbatt, J. P. D.: Closure between measured and modeled cloud condensation nuclei (CCN) using size-resolved aerosol compositions in downtown Toronto, Atmos. Chem. Phys., 6, 2513–2524, https://doi.org/10.5194/acp-6-2513-2006, 2006.
Cerully, K. M., Bougiatioti, A., Hite Jr., J. R., Guo, H., Xu, L., Ng, N. L., Weber, R., and Nenes, A.: On the link between hygroscopicity, volatility, and oxidation state of ambient and water-soluble aerosols in the southeastern United States, Atmos. Chem. Phys., 15, 8679–8694, https://doi.org/10.5194/acp-15-8679-2015, 2015.
Chang, R. Y.-W., Slowik, J. G., Shantz, N. C., Vlasenko, A., Liggio, J., Sjostedt, S. J., Leaitch, W. R., and Abbatt, J. P. D.: The hygroscopicity parameter (κ) of ambient organic aerosol at a field site subject to biogenic and anthropogenic influences: relationship to degree of aerosol oxidation, Atmos. Chem. Phys., 10, 5047–5064, https://doi.org/10.5194/acp-10-5047-2010, 2010.
Charlson, R. J., Schwartz, S. E., Hales, J. M., Cess, R. D., Coakley, J. A., Hansen, J. E., and Hofmann, D. J.: Climate Forcing by Anthropogenic Aerosols, Science, 255, 423–430, https://doi.org/10.1126/science.255.5043.423, 1992.
Dusek, U., Frank, G. P., Hildebrandt, L., Curtius, J., Schneider, J., Walter, S., Chand, D., Drewnick, F., Hings, S., Jung, D., Borrmann, S., and Andreae, M. O.: Size Matters More Than Chemistry for Cloud-Nucleating Ability of Aerosol Particles, Science, 312, 1375–1378, https://doi.org/10.1126/science.1125261, 2006.
Dusek, U., Frank, G. P., Curtius, J., Drewnick, F., Schneider, J., Kürten, A., Rose, D., Andreae, M. O., Borrmann, S., and Pöschl, U.: Enhanced organic mass fraction and decreased hygroscopicity of cloud condensation nuclei (CCN) during new particle formation events, Geophys. Res. Lett., 37, 2009GL040930, https://doi.org/10.1029/2009GL040930, 2010.
Facchini, M. C., Mircea, M., Fuzzi, S., and Charlson, R. J.: Cloud albedo enhancement by surface-active organic solutes in growing droplets, Nature, 401, 257–259, https://doi.org/10.1038/45758, 1999.
Fan, J., Wang, Y., Rosenfeld, D., and Liu, X.: Review of Aerosol–Cloud Interactions: Mechanisms, Significance, and Challenges, J. Atmos. Sci., 73, 4221–4252, https://doi.org/10.1175/JAS-D-16-0037.1, 2016.
Fast, J. D., Berg, L. K., Alexander, L., Bell, D., D'Ambro, E., Hubbe, J., Kuang, C., Liu, J., Long, C., Matthews, A., Mei, F., Newsom, R., Pekour, M., Pinterich, T., Schmid, B., Schobesberger, S., Shilling, J., Smith, J. N., Springston, S., Suski, K., Thornton, J. A., Tomlinson, J., Wang, J., Xiao, H., and Zelenyuk, A.: Overview of the HI-SCALE Field Campaign: A New Perspective on Shallow Convective Clouds, B. Am. Meteorol. Soc., 100, 821–840, https://doi.org/10.1175/BAMS-D-18-0030.1, 2019.
Forestieri, S. D., Staudt, S. M., Kuborn, T. M., Faber, K., Ruehl, C. R., Bertram, T. H., and Cappa, C. D.: Establishing the impact of model surfactants on cloud condensation nuclei activity of sea spray aerosol mimics, Atmos. Chem. Phys., 18, 10985–11005, https://doi.org/10.5194/acp-18-10985-2018, 2018.
Fountoukis, C. and Nenes, A.: Continued development of a cloud droplet formation parameterization for global climate models, J. Geophys. Res., 110, 2004JD005591, https://doi.org/10.1029/2004JD005591, 2005.
Gallo, F., Uin, J., Sanchez, K. J., Moore, R. H., Wang, J., Wood, R., Mei, F., Flynn, C., Springston, S., Azevedo, E. B., Kuang, C., and Aiken, A. C.: Long-range transported continental aerosol in the eastern North Atlantic: three multiday event regimes influence cloud condensation nuclei, Atmos. Chem. Phys., 23, 4221–4246, https://doi.org/10.5194/acp-23-4221-2023, 2023.
Ghan, S. J., Smith, S. J., Wang, M., Zhang, K., Pringle, K., Carslaw, K., Pierce, J., Bauer, S., and Adams, P.: A simple model of global aerosol indirect effects, J. Geophys. Res.-Atmos., 118, 6688–6707, https://doi.org/10.1002/jgrd.50567, 2013.
Gunthe, S. S., King, S. M., Rose, D., Chen, Q., Roldin, P., Farmer, D. K., Jimenez, J. L., Artaxo, P., Andreae, M. O., Martin, S. T., and Pöschl, U.: Cloud condensation nuclei in pristine tropical rainforest air of Amazonia: size-resolved measurements and modeling of atmospheric aerosol composition and CCN activity, Atmos. Chem. Phys., 9, 7551–7575, https://doi.org/10.5194/acp-9-7551-2009, 2009.
Intergovernmental Panel On Climate Change (IPCC): Climate Change 2021 – The Physical Science Basis: Working Group I Contribution to the Sixth Assessment Report of the Intergovernmental Panel on Climate Change, 1st edn., Cambridge University Press, https://doi.org/10.1017/9781009157896, 2023.
Kulkarni, G., Mei, F., Shilling, J. E., Wang, J., Reveggino, R. P., Flynn, C., Zelenyuk, A., and Fast, J.: Cloud Condensation Nuclei Closure Study Using Airborne Measurements Over the Southern Great Plains, J. Geophys. Res.-Atmos., 128, e2022JD037964, https://doi.org/10.1029/2022JD037964, 2023.
Lathem, T. L., Beyersdorf, A. J., Thornhill, K. L., Winstead, E. L., Cubison, M. J., Hecobian, A., Jimenez, J. L., Weber, R. J., Anderson, B. E., and Nenes, A.: Analysis of CCN activity of Arctic aerosol and Canadian biomass burning during summer 2008, Atmos. Chem. Phys., 13, 2735–2756, https://doi.org/10.5194/acp-13-2735-2013, 2013.
Li, J., Carlson, B. E., Yung, Y. L., Lv, D., Hansen, J., Penner, J. E., Liao, H., Ramaswamy, V., Kahn, R. A., Zhang, P., Dubovik, O., Ding, A., Lacis, A. A., Zhang, L., and Dong, Y.: Scattering and absorbing aerosols in the climate system, Nat. Rev. Earth Environ., 3, 363–379, https://doi.org/10.1038/s43017-022-00296-7, 2022.
Li, Y., Zhou, Y., Guo, W., Zhang, X., Huang, Y., He, E., Li, R., Yan, B., Wang, H., Mei, F., Liu, M., and Zhu, Z.: Molecular Imaging Reveals Two Distinct Mixing States of PM2.5 Particles Sampled in a Typical Beijing Winter Pollution Case, Environ. Sci. Technol., 57, 6273–6283, https://doi.org/10.1021/acs.est.2c08694, 2023.
Liu, J., Alexander, L., Fast, J. D., Lindenmaier, R., and Shilling, J. E.: Aerosol characteristics at the Southern Great Plains site during the HI-SCALE campaign, Atmos. Chem. Phys., 21, 5101–5116, https://doi.org/10.5194/acp-21-5101-2021, 2021.
Liu, Q., Shen, X., Li, L., Sun, J., Liu, Z., Zhu, W., Zhong, J., Zhang, Y., Hu, X., Liu, S., Che, H., and Zhang, X.: Impacts of Aerosol Chemical Composition on Cloud Condensation Nuclei (CCN) Activity during Wintertime in Beijing, China, Remote Sens., 15, 4119, https://doi.org/10.3390/rs15174119, 2023.
Liu, X., Easter, R. C., Ghan, S. J., Zaveri, R., Rasch, P., Shi, X., Lamarque, J.-F., Gettelman, A., Morrison, H., Vitt, F., Conley, A., Park, S., Neale, R., Hannay, C., Ekman, A. M. L., Hess, P., Mahowald, N., Collins, W., Iacono, M. J., Bretherton, C. S., Flanner, M. G., and Mitchell, D.: Toward a minimal representation of aerosols in climate models: description and evaluation in the Community Atmosphere Model CAM5, Geosci. Model Dev., 5, 709–739, https://doi.org/10.5194/gmd-5-709-2012, 2012.
Liu, X., Ma, P.-L., Wang, H., Tilmes, S., Singh, B., Easter, R. C., Ghan, S. J., and Rasch, P. J.: Description and evaluation of a new four-mode version of the Modal Aerosol Module (MAM4) within version 5.3 of the Community Atmosphere Model, Geosci. Model Dev., 9, 505–522, https://doi.org/10.5194/gmd-9-505-2016, 2016.
Malek, K., Gohil, K., Olonimoyo, E. A., Ferdousi-Rokib, N., Huang, Q., Pitta, K. R., Nandy, L., Voss, K. A., Raymond, T. M., Dutcher, D. D., Freedman, M. A., and Asa-Awuku, A.: Liquid–Liquid Phase Separation Can Drive Aerosol Droplet Growth in Supersaturated Regimes, ACS Environ. Au, 3, 348–360, https://doi.org/10.1021/acsenvironau.3c00015, 2023.
Marinescu, P. J., Levin, E. J. T., Collins, D., Kreidenweis, S. M., and van den Heever, S. C.: Quantifying aerosol size distributions and their temporal variability in the Southern Great Plains, USA, Atmos. Chem. Phys., 19, 11985–12006, https://doi.org/10.5194/acp-19-11985-2019, 2019.
Martin, M., Chang, R. Y.-W., Sierau, B., Sjogren, S., Swietlicki, E., Abbatt, J. P. D., Leck, C., and Lohmann, U.: Cloud condensation nuclei closure study on summer arctic aerosol, Atmos. Chem. Phys., 11, 11335–11350, https://doi.org/10.5194/acp-11-11335-2011, 2011.
Mather, J. H. and Voyles, J. W.: The Arm Climate Research Facility: A Review of Structure and Capabilities, B. Am. Meteorol. Soc., 94, 377–392, https://doi.org/10.1175/BAMS-D-11-00218.1, 2013.
McFarlane, S. A., Evans, K. F., and Ackerman, A. S.: A Bayesian algorithm for the retrieval of liquid water cloud properties from microwave radiometer and millimeter radar data, J. Geophys. Res., 107, https://doi.org/10.1029/2001JD001011, 2002.
McFiggans, G., Artaxo, P., Baltensperger, U., Coe, H., Facchini, M. C., Feingold, G., Fuzzi, S., Gysel, M., Laaksonen, A., Lohmann, U., Mentel, T. F., Murphy, D. M., O'Dowd, C. D., Snider, J. R., and Weingartner, E.: The effect of physical and chemical aerosol properties on warm cloud droplet activation, Atmos. Chem. Phys., 6, 2593–2649, https://doi.org/10.5194/acp-6-2593-2006, 2006.
Medina, J., Nenes, A., Sotiropoulou, R. P., Cottrell, L. D., Ziemba, L. D., Beckman, P. J., and Griffin, R. J.: Cloud condensation nuclei closure during the International Consortium for Atmospheric Research on Transport and Transformation 2004 campaign: Effects of size-resolved composition, J. Geophys. Res., 112, 2006JD007588, https://doi.org/10.1029/2006JD007588, 2007.
Mei, F., Setyan, A., Zhang, Q., and Wang, J.: CCN activity of organic aerosols observed downwind of urban emissions during CARES, Atmos. Chem. Phys., 13, 12155–12169, https://doi.org/10.5194/acp-13-12155-2013, 2013.
Mei, F., Comstock, J. M., Pekour, M. S., Fast, J. D., Gaustad, K. L., Schmid, B., Tang, S., Zhang, D., Shilling, J. E., Tomlinson, J. M., Varble, A. C., Wang, J., Leung, L. R., Kleinman, L., Martin, S., Biraud, S. C., Ermold, B. D., and Burk, K. W.: Atmospheric Radiation Measurement (ARM) airborne field campaign data products between 2013 and 2018, Earth Syst. Sci. Data, 16, 5429–5448, https://doi.org/10.5194/essd-16-5429-2024, 2024a.
Mei, F., Wang, H., Zhu, Z., Zhang, D., Zhang, Q., Fast, J. D., Gustafson, W. I., Li, X.-Y., Schmid, B., Niedek, C., Tomlinson, J., and Flynn, C.: Bridging New Observational Capabilities and Process-Level Simulation: Insights into Aerosol Roles in the Earth System, B. Am. Meteorol. Soc., 105, E709–E724, https://doi.org/10.1175/BAMS-D-23-0110.1, 2024b.
Meng, J. W., Yeung, M. C., Li, Y. J., Lee, B. Y. L., and Chan, C. K.: Size-resolved cloud condensation nuclei (CCN) activity and closure analysis at the HKUST Supersite in Hong Kong, Atmos. Chem. Phys., 14, 10267–10282, https://doi.org/10.5194/acp-14-10267-2014, 2014.
Moore, R. H., Bahreini, R., Brock, C. A., Froyd, K. D., Cozic, J., Holloway, J. S., Middlebrook, A. M., Murphy, D. M., and Nenes, A.: Hygroscopicity and composition of Alaskan Arctic CCN during April 2008, Atmos. Chem. Phys., 11, 11807–11825, https://doi.org/10.5194/acp-11-11807-2011, 2011.
Moore, R. H., Karydis, V. A., Capps, S. L., Lathem, T. L., and Nenes, A.: Droplet number uncertainties associated with CCN: an assessment using observations and a global model adjoint, Atmos. Chem. Phys., 13, 4235–4251, https://doi.org/10.5194/acp-13-4235-2013, 2013.
Nah, T., Yang, J., Wang, J., Sullivan, A. P., and Weber, R. J.: Fine Aerosol Acidity and Water during Summer in the Eastern North Atlantic, Atmosphere, 12, 1040, https://doi.org/10.3390/atmos12081040, 2021.
Nozière, B., Baduel, C., and Jaffrezo, J.-L.: The dynamic surface tension of atmospheric aerosol surfactants reveals new aspects of cloud activation, Nat. Commun., 5, 3335, https://doi.org/10.1038/ncomms4335, 2014.
Ovadnevaite, J., Zuend, A., Laaksonen, A., Sanchez, K. J., Roberts, G., Ceburnis, D., Decesari, S., Rinaldi, M., Hodas, N., Facchini, M. C., Seinfeld, J. H., and O' Dowd, C.: Surface tension prevails over solute effect in organic-influenced cloud droplet activation, Nature, 546, 637–641, https://doi.org/10.1038/nature22806, 2017.
Padró, L. T., Moore, R. H., Zhang, X., Rastogi, N., Weber, R. J., and Nenes, A.: Mixing state and compositional effects on CCN activity and droplet growth kinetics of size-resolved CCN in an urban environment, Atmos. Chem. Phys., 12, 10239–10255, https://doi.org/10.5194/acp-12-10239-2012, 2012.
Petters, M. D. and Kreidenweis, S. M.: A single parameter representation of hygroscopic growth and cloud condensation nucleus activity, Atmos. Chem. Phys., 7, 1961–1971, https://doi.org/10.5194/acp-7-1961-2007, 2007.
Pöschl, U.: Atmospheric Aerosols: Composition, Transformation, Climate and Health Effects, Angew. Chem. Int. Ed., 44, 7520–7540, https://doi.org/10.1002/anie.200501122, 2005.
Redemann, J. and Gao, L.: A machine learning paradigm for necessary observations to reduce uncertainties in aerosol climate forcing, Nat. Commun., 15, 8343, https://doi.org/10.1038/s41467-024-52747-y, 2024.
Ren, J., Chen, L., Liu, J., and Zhang, F.: The density of ambient black carbon retrieved by a new method: implications for cloud condensation nuclei prediction , Atmos. Chem. Phys., 23, 4327–4342, https://doi.org/10.5194/acp-23-4327-2023, 2023.
Riemer, N., West, M., Zaveri, R. A., and Easter, R. C.: Simulating the evolution of soot mixing state with a particle-resolved aerosol model, J. Geophys. Res., 114, 2008JD011073, https://doi.org/10.1029/2008JD011073, 2009.
Saliba, G., Bell, D. M., Suski, K. J., Fast, J. D., Imre, D., Kulkarni, G., Mei, F., Mülmenstädt, J. H., Pekour, M., Shilling, J. E., Tomlinson, J., Varble, A. C., Wang, J., Thornton, J. A., and Zelenyuk, A.: Aircraft measurements of single particle size and composition reveal aerosol size and mixing state dictate their activation into cloud droplets, Environ. Sci. Atmos., 3, 1352–1364, https://doi.org/10.1039/D3EA00052D, 2023.
Schmale, J., Henning, S., Decesari, S., Henzing, B., Keskinen, H., Sellegri, K., Ovadnevaite, J., Pöhlker, M. L., Brito, J., Bougiatioti, A., Kristensson, A., Kalivitis, N., Stavroulas, I., Carbone, S., Jefferson, A., Park, M., Schlag, P., Iwamoto, Y., Aalto, P., Äijälä, M., Bukowiecki, N., Ehn, M., Frank, G., Fröhlich, R., Frumau, A., Herrmann, E., Herrmann, H., Holzinger, R., Kos, G., Kulmala, M., Mihalopoulos, N., Nenes, A., O'Dowd, C., Petäjä, T., Picard, D., Pöhlker, C., Pöschl, U., Poulain, L., Prévôt, A. S. H., Swietlicki, E., Andreae, M. O., Artaxo, P., Wiedensohler, A., Ogren, J., Matsuki, A., Yum, S. S., Stratmann, F., Baltensperger, U., and Gysel, M.: Long-term cloud condensation nuclei number concentration, particle number size distribution and chemical composition measurements at regionally representative observatories, Atmos. Chem. Phys., 18, 2853–2881, https://doi.org/10.5194/acp-18-2853-2018, 2018.
Schulze, B. C., Charan, S. M., Kenseth, C. M., Kong, W., Bates, K. H., Williams, W., Metcalf, A. R., Jonsson, H. H., Woods, R., Sorooshian, A., Flagan, R. C., and Seinfeld, J. H.: Characterization of Aerosol Hygroscopicity Over the Northeast Pacific Ocean: Impacts on Prediction of CCN and Stratocumulus Cloud Droplet Number Concentrations, Earth Space Sci., 7, e2020EA001098, https://doi.org/10.1029/2020EA001098, 2020.
Snider, J. R., Guibert, S., Brenguier, J., and Putaud, J. -P.: Aerosol activation in marine stratocumulus clouds: 2. Köhler and parcel theory closure studies, J. Geophys. Res., 108, 2002JD002692, https://doi.org/10.1029/2002JD002692, 2003.
Soloff, C., Crosbie, E. C., Diskin, G. S., Gao, L., Kirschler, S., Lenhardt, E. D., Moore, R. H., Redemann, J., Shook, M. A., Tang, S., Thornhill, K. L., Voigt, C., Wang, H., Winstead, E. L., Ziemba, L. D., and Sorooshian, A.: Cloud Condensation Nuclei Behavior and Closure Assessment for the Northwest Atlantic Ocean, ACS EST Air, 2, 2388–2400, https://doi.org/10.1021/acsestair.5c00151, 2025.
Tang, S., Fast, J. D., Zhang, K., Hardin, J. C., Varble, A. C., Shilling, J. E., Mei, F., Zawadowicz, M. A., and Ma, P.-L.: Earth System Model Aerosol–Cloud Diagnostics (ESMAC Diags) package, version 1: assessing E3SM aerosol predictions using aircraft, ship, and surface measurements, Geosci. Model Dev., 15, 4055–4076, https://doi.org/10.5194/gmd-15-4055-2022, 2022.
Twomey, S.: Pollution and the planetary albedo, Atmos. Environ., 8, 1251–1256, https://doi.org/10.1016/0004-6981(74)90004-3, 1974.
Vepsäläinen, S., Calderón, S. M., Malila, J., and Prisle, N. L.: Comparison of six approaches to predicting droplet activation of surface active aerosol – Part 1: moderately surface active organics, Atmos. Chem. Phys., 22, 2669–2687, https://doi.org/10.5194/acp-22-2669-2022, 2022.
Vu, D., Gao, S., Berte, T., Kacarab, M., Yao, Q., Vafai, K., and Asa-Awuku, A.: External and internal cloud condensation nuclei (CCN) mixtures: controlled laboratory studies of varying mixing states, Atmos. Meas. Tech., 12, 4277–4289, https://doi.org/10.5194/amt-12-4277-2019, 2019.
Wang, J., Cubison, M. J., Aiken, A. C., Jimenez, J. L., and Collins, D. R.: The importance of aerosol mixing state and size-resolved composition on CCN concentration and the variation of the importance with atmospheric aging of aerosols, Atmos. Chem. Phys., 10, 7267–7283, https://doi.org/10.5194/acp-10-7267-2010, 2010.
Wang, J., Wood, R., Jensen, M. P., Chiu, J. C., Liu, Y., Lamer, K., Desai, N., Giangrande, S. E., Knopf, D. A., Kollias, P., Laskin, A., Liu, X., Lu, C., Mechem, D., Mei, F., Starzec, M., Tomlinson, J., Wang, Y., Yum, S. S., Zheng, G., Aiken, A. C., Azevedo, E. B., Blanchard, Y., China, S., Dong, X., Gallo, F., Gao, S., Ghate, V. P., Glienke, S., Goldberger, L., Hardin, J. C., Kuang, C., Luke, E. P., Matthews, A. A., Miller, M. A., Moffet, R., Pekour, M., Schmid, B., Sedlacek, A. J., Shaw, R. A., Shilling, J. E., Sullivan, A., Suski, K., Veghte, D. P., Weber, R., Wyant, M., Yeom, J., Zawadowicz, M., and Zhang, Z.: Aerosol and Cloud Experiments in the Eastern North Atlantic (ACE-ENA), B. Am. Meteorol. Soc., 103, E619–E641, https://doi.org/10.1175/BAMS-D-19-0220.1, 2022.
Wang, Y., Li, Z., Zhang, Y., Du, W., Zhang, F., Tan, H., Xu, H., Fan, T., Jin, X., Fan, X., Dong, Z., Wang, Q., and Sun, Y.: Characterization of aerosol hygroscopicity, mixing state, and CCN activity at a suburban site in the central North China Plain, Atmos. Chem. Phys., 18, 11739–11752, https://doi.org/10.5194/acp-18-11739-2018, 2018.
Wang, Y., Zheng, G., Jensen, M. P., Knopf, D. A., Laskin, A., Matthews, A. A., Mechem, D., Mei, F., Moffet, R., Sedlacek, A. J., Shilling, J. E., Springston, S., Sullivan, A., Tomlinson, J., Veghte, D., Weber, R., Wood, R., Zawadowicz, M. A., and Wang, J.: Vertical profiles of trace gas and aerosol properties over the eastern North Atlantic: variations with season and synoptic condition, Atmos. Chem. Phys., 21, 11079–11098, https://doi.org/10.5194/acp-21-11079-2021, 2021.
Wex, H., McFiggans, G., Henning, S., and Stratmann, F.: Influence of the external mixing state of atmospheric aerosol on derived CCN number concentrations, Geophys. Res. Lett., 37, 2010GL043337, https://doi.org/10.1029/2010GL043337, 2010.
Wilbourn, E. K., Lacher, L., Guerrero, C., Vepuri, H. S. K., Höhler, K., Nadolny, J., Möhler, O., and Hiranuma, N.: Measurement Report: A comparison of ice-nucleating particle and cloud condensation nuclei sources and properties during autumn at contrasting marine and terrestrial locations, EGUsphere [preprint], https://doi.org/10.5194/egusphere-2023-1456, 2023.
Xu, W., Fossum, K. N., Ovadnevaite, J., Lin, C., Huang, R.-J., O'Dowd, C., and Ceburnis, D.: The impact of aerosol size-dependent hygroscopicity and mixing state on the cloud condensation nuclei potential over the north-east Atlantic, Atmos. Chem. Phys., 21, 8655–8675, https://doi.org/10.5194/acp-21-8655-2021, 2021.
You, Y., Renbaum-Wolff, L., Carreras-Sospedra, M., Hanna, S. J., Hiranuma, N., Kamal, S., Smith, M. L., Zhang, X., Weber, R. J., Shilling, J. E., Dabdub, D., Martin, S. T., and Bertram, A. K.: Images reveal that atmospheric particles can undergo liquid–liquid phase separations, P. Natl. Acad. Sci. USA, 109, 13188–13193, https://doi.org/10.1073/pnas.1206414109, 2012.
Zawadowicz, M. A., Suski, K., Liu, J., Pekour, M., Fast, J., Mei, F., Sedlacek, A. J., Springston, S., Wang, Y., Zaveri, R. A., Wood, R., Wang, J., and Shilling, J. E.: Aircraft measurements of aerosol and trace gas chemistry in the eastern North Atlantic, Atmos. Chem. Phys., 21, 7983–8002, https://doi.org/10.5194/acp-21-7983-2021, 2021.
Zelenyuk, A., Ezell, M. J., Perraud, V., Johnson, S. N., Bruns, E. A., Yu, Y., Imre, D., Alexander, M. L., and Finlayson-Pitts, B. J.: Characterization of organic coatings on hygroscopic salt particles and their atmospheric impacts, Atmos. Environ., 44, 1209–1218, https://doi.org/10.1016/j.atmosenv.2009.11.047, 2010.
Zheng, G., Wang, Y., Aiken, A. C., Gallo, F., Jensen, M. P., Kollias, P., Kuang, C., Luke, E., Springston, S., Uin, J., Wood, R., and Wang, J.: Marine boundary layer aerosol in the eastern North Atlantic: seasonal variations and key controlling processes, Atmos. Chem. Phys., 18, 17615–17635, https://doi.org/10.5194/acp-18-17615-2018, 2018.
Zheng, G., Wang, Y., Wood, R., Jensen, M. P., Kuang, C., McCoy, I. L., Matthews, A., Mei, F., Tomlinson, J. M., Shilling, J. E., Zawadowicz, M. A., Crosbie, E., Moore, R., Ziemba, L., Andreae, M. O., and Wang, J.: New particle formation in the remote marine boundary layer, Nat. Commun., 12, 527, https://doi.org/10.1038/s41467-020-20773-1, 2021.
Zheng, X., Dong, X., Xi, B., Logan, T., and Wang, Y.: Distinctive aerosol–cloud–precipitation interactions in marine boundary layer clouds from the ACE-ENA and SOCRATES aircraft field campaigns, Atmos. Chem. Phys., 24, 10323–10347, https://doi.org/10.5194/acp-24-10323-2024, 2024.