the Creative Commons Attribution 4.0 License.
the Creative Commons Attribution 4.0 License.
 | 10 Jun 2026
Exploring the processes of liquid water path sensitivity to aerosol-cloud interactions using output from a high-resolution large-eddy simulation
Sudhakar Dipu
Johannes Mülmenstädt
Johannes Quaas
Diagnostics from high-resolution Large-Eddy Simulations (LES) are used to investigate aerosol impacts on the liquid water path (LWP) sensitivity in a non-precipitating, single-layer liquid cloud regime. In two LES simulations, the 2013 conditions represent a low aerosol scenario, while the 1985 conditions represent a high aerosol scenario. Joint histograms of cloud droplet number concentration (Nd) and LWP reveal a non-linear relationship, with positive LWP sensitivity (increasing LWP with Nd) at low Nd and negative sensitivity at high Nd. The transition from positive to negative LWP sensitivity occurs at higher Nd values in the 1985 simulation (≈ 300 cm−3) compared to the 2013 simulation (≈ 100 cm−3), indicating that enhanced aerosol loading shifts the transition point. This shift reflects stronger droplet activation and sustained LWP growth under high cloud condensation nuclei (CCN) conditions. Diagnostics of the cloud dilution indicate that negative LWP sensitivity is linked to enhanced cloud-top entrainment. The temporal evolution of the Nd–LWP relationship confirms increasing dominance of negative sensitivity in the 2013 case, while the 1985 case exhibits weaker LWP depletion. Additionally, aerosol perturbations also influence thermodynamic properties such as the apparent heating/cooling (Q1) and the moisture sink (Q2). Specifically, during negative LWP sensitivity phases, stronger cloud-top drying (moisture sinks) is simulated, particularly at high Nd in 2013, consistent with enhanced entrainment/mixing and evaporation-driven cloud dilution. Aerosol perturbations thus modulate both microphysical and thermodynamic processes, producing distinct LWP sensitivity regimes with important implications for understanding aerosol–cloud–climate interactions.
- Article
(5948 KB) - Full-text XML
- BibTeX
- EndNote


The aerosol cloud interactions (ACI) and the resulting effective radiative forcing remain a large source of uncertainty when assessing anthropogenic climate change (Forster et al., 2021; Quaas et al., 2020a). The uncertainty in ACI stems from the response of the clouds to the aerosol perturbation (Forster et al., 2020). In liquid clouds, cloud droplets form on an aerosol particle, which can serves as cloud condensation nucleus (Charlson et al., 1992). An increase in atmospheric aerosol leads to an increase in the cloud droplet number concentration (Nd). Twomey (1974) hypothesised that at a constant liquid water path (LWP), an increased aerosol burden leads to clouds with more numerous small droplets, which increase the cloud albedo. In addition, smaller droplets delay the precipitation formation by reducing the collision–coalescence efficiency and increasing the cloud lifetime (Albrecht, 1989). The increase in the response in the Nd also leads to further rapid adjustment of the cloud properties. It includes the alteration of cloud drop size distribution, changes in the LWP, cloud fraction, and dynamic process (Ackerman et al., 2000; Mülmenstädt and Feingold, 2018). Thus, the instantaneous Twomey effect and cloud rapid adjustments contribute to the effective radiative forcing due to ACI (Bellouin et al., 2020; Quaas et al., 2024).
The response of cloud water path, the vertical integral of cloud water, to aerosol perturbation is a key component of cloud adjustments, and yet it is uncertain. This is particularly because of the elusive sign of the LWP adjustment/sensitivity to aerosol perturbations and its regime dependency (Fons et al., 2023; Dipu et al., 2022; Glassmeier et al., 2021; Possner et al., 2020; Gryspeerdt et al., 2019). A positive LWP adjustment is mainly observed in precipitating clouds, in which an increase in the aerosol results in enhanced Nd and smaller droplets, suppressing the precipitation and allowing for an accumulation of LWP (Albrecht, 1989). Thus, the positive LWP adjustment results in thicker and more reflective clouds with a stronger cooling effect. On the other hand, a negative LWP adjustment is associated with cloud droplet evaporation. Aerosol perturbations increase Nd, yielding smaller droplets that evaporate more efficiently during mixing and reduce droplet sedimentation, thereby redistributing liquid water toward the inversion and potentially strengthening cloud-top long-wave radiative cooling. As radiative cooling occurs within a relatively thin layer near the cloud-top, it also promotes the entrainment of warm, dry free-tropospheric air, further enhancing evaporation and potentially reducing LWP - a negative LWP adjustment (Williams and Igel, 2021; Wood, 2012; Bretherton et al., 2007; Ackerman et al., 2004; Wang et al., 2003). Notably, entrainment can reduce LWP even when droplet mass decreases approximately homogeneously, not just due to the preferential evaporation of smaller droplets. Both observational and modelling studies demonstrate a strong offsetting warming effect from negative LWP adjustment (Gryspeerdt et al., 2021; Possner et al., 2020). However, the strength of the net LWP adjustment is modulated by the environmental condition. As a net result of the opposing LWP adjustment mechanisms, their net impact on the large-scale integral remains relatively small or neutral (Zhang et al., 2022). Thus, the bidirectional LWP adjustment/sensitivity, precipitation suppression, and droplet evaporations are difficult to disentangle as these processes coexist in the cloud (Fons et al., 2023).
Recent studies have focused on the sensitivity of LWP to Nd to quantify the impact of aerosols on LWP (Dipu et al., 2022; Gryspeerdt et al., 2019; Bellouin et al., 2020). Using satellite observations, Gryspeerdt et al. (2019) demonstrated that the Nd–LWP relation is non-linear over the global ocean. The LWP adjustment is also regime-dependent (Glassmeier et al., 2021). In marine stratocumulus clouds, the Nd–LWP relationship is non-linear, and the apparent coupling largely reflects co-variability between aerosol loading and meteorological conditions, which fundamentally drives variations in both Nd and LWP (Goren et al., 2025). The LWP adjustment estimated based on satellite observations may be highly uncertain and negatively biased (Arola et al., 2022) because of the retrieval errors and also due to correlated errors in the Nd and LWP retrievals (Quaas et al., 2020b; Gryspeerdt et al., 2019; Grosvenor et al., 2018). In contrast, modelling studies often reported positive LWP adjustments (Quaas et al., 2008; Gryspeerdt et al., 2020). However, high-resolution modelling evidence has also shown negative LWP adjustment, in which the altered Nd leads to enhancement of entrainment mixing, thereby reducing the LWP (Glassmeier et al., 2021; Ackerman et al., 2004). Mülmenstädt et al. (2024a) reported that the latest generation of general circulation models (GCMs) are able to produce negative LWP adjustment besides positive LWP adjustment through precipitation suppression in response to increased Nd. However, the earlier-generation GCMs fail to show negative LWP adjustments in response to anthropogenic aerosols.
Previous studies focused on the Nd–LWP relationship to assist in understanding ACI. Observational studies use natural events where the aerosol perturbation is known and compared with unperturbed cloud regimes (Christensen et al., 2022). Such studies suggest an unchanged LWP or negative LWP adjustment (Malavelle et al., 2017; Toll et al., 2019); however, such cases are limited. Modelling studies, specifically high-resolution Large-eddy simulations (LES), are ideal for improving the understanding of the LWP adjustment by varying aerosol concentration while keeping the other boundary conditions constant. However, the LES simulations are computationally expensive, and the simulations are regime-dependent. Most of the previous LES studies suggest that a positive LWP adjustment is associated with precipitating cloud regimes and a negative LWP adjustment is simulated for non-precipitating cloud regimes (Glassmeier et al., 2021; Ackerman et al., 2004; Hill et al., 2009; Lee et al., 2009; Wang et al., 2011). In this study, we investigate LWP sensitivity in a non-precipitating continental cloud regime using high-resolution LES simulations in numerical weather prediction mode, with initial and boundary conditions from a real weather situation and an interactive land surface (Heinze et al., 2017; Costa-Surós et al., 2020). Aerosol–cloud interaction effects are quantified using control and aerosol-perturbed simulations that differ only in the prescribed cloud condensation nuclei (CCN) fields for droplet activation, while the meteorology is kept identical across the simulations. The following methodology section describes the model setup and aerosol perturbation. Using the same LES simulations, Dipu et al. (2022) demonstrated that the Nd–LWP sensitivity is bidirectional. Using the perturbed aerosol simulation of the same cloud regime, here we investigate the impact of aerosol on bidirectional LWP sensitivity. This allows us to infer the degree to which the Nd–LWP relationship represents a causal influence of Nd on LWP. We examine the impact of aerosol on positive and negative LWP sensitivity and investigate the microphysical and thermodynamic processes controlling the sign and magnitude of LWP sensitivity.
LES using the ICOsahedral Nonhydrostatic (ICON) model (Dipankar et al., 2015; Zängl et al., 2015) are analysed in this study. The atmospheric model ICON has been configured to a large-eddy simulation framework (Dipankar et al., 2015), and has been evaluated against standard LES models and multiple observations (Heinze et al., 2017). The high resolution, ICON-LES simulation has been performed as part of the High Definition Clouds and Precipitation for advancing Climate Prediction (HD(CP)2) project. The simulation ran over a large domain (over Germany) in a weather prediction mode, which uses realistic boundary conditions from the operational COSMOS-DE (Consortium for Small Scale Modelling, Baldauf et al., 2011), with a fully interactive land surface (Costa-Surós et al., 2020). The model is configured with a horizontal resolution of 156 m and 150 vertical levels with a model top at 21 km. A sub-grid scale turbulence scheme based on the classical Smagorinsky scheme is used in the model, which also accounts for thermal stratification (Lilly, 1962). The model uses a two-moment liquid and ice-phase bulk microphysics scheme (Seifert and Beheng, 2006). In the two-moment microphysical scheme the grid-scale cloud droplet nucleation rate is estimated as a function of CCN concentration, vertical velocity, and supersaturation (Eq. 7 of Seifert and Beheng, 2006). Following Kogan and Martin (1994), the two-moment scheme applies the standard saturation adjustment technique to treat condensational growth of cloud droplets. The CCN concentrations in the model are prescribed as a spatially and temporally varying distribution. The control simulation uses CCN concentrations as estimated for 2 May 2013 (Costa-Surós et al., 2020), and for the perturbed simulation, CCN concentrations valid for the year approximately 1985 were selected, in which the pollution level in Europe was at its peak (Smith et al., 2011). The 2013 CCN concentrations are generated from 2013 emissions using a regional coupled model system (Wolke et al., 2004, 2012). The 1985 CCN concentrations are obtained by scaling the 2013 CCN concentrations with species-dependent factors derived from emission ratios following Genz et al. (2020). A detailed description is provided in Costa-Surós et al. (2020). The simulations were performed over Germany for selected dates, of which the date 2 May 2013 is considered in the study based on the evaluation results from Heinze et al. (2017). The 2 May 2013 has been one of the extensive measurement campaigns for the HD(CP)2 Observational Prototype Experiment (HOPE, Löhnert et al., 2015; Madhavan et al., 2016) and the evaluation results from Heinze et al. (2017) suggest the presence of a wide range of cloud regimes, compared to other HD(CP)2 simulations. A detailed description of the ICON-LES model and HD(CP)2 simulations can be obtained from Dipankar et al. (2015), Heinze et al. (2017), and Costa-Surós et al. (2020).
Here, we have used the coarse-gridded data with a resolution of 1.2 km (grid size of 589 × 637), a standard reduced-volume product that has been used in previous studies and evaluations (Costa-Surós et al., 2020; Dipu et al., 2022). The actual ICON-LES simulation was performed with 156 m horizontal resolution, though. Our results rely on regime-conditioned, cloud-only statistics that mitigate grey-zone smoothing. While coarse-gridding may influence quantitative values, the qualitative sensitivities remain robust. Five-minute instantaneous model output from 1000 to 2000 h is considered for the study. The analysis is restricted to single-layered liquid clouds by excluding the clouds with a cloud-top temperature below 273 K. Cloud-top is defined as the uppermost model level with liquid cloud water present (liquid water content, LWC kg kg−1). We additionally constrained Nd>2 cm−3 and restricted the analysis to overcast and optically detectable clouds (cloud fraction = 1 at 1.2 km and cloud optical thicknesses greater than 2) to minimise cloud-edge contamination. In this study, Nd is primarily intended as a consistent metric for comparing aerosol perturbations and linking to cloud-top processes (radiative cooling and entrainment) that control LWP adjustments. Therefore, the cloud-top Nd is not interpreted as a volume-mean value but as an indicator of the droplet population near the region most relevant for the LWP adjustment mechanisms. In the specific ICON-LES, entrainment is not parameterised; it arises from resolved advection and subgrid turbulent mixing. In the selected case, the cloud-top height is at ≈ 1700–2000 m, with an effective vertical resolution of ≈ 50–80 m. Because of the high model resolution and high frequency of model output, the Nd is divided into logarithmic bin sizes of 1000 numbers. The corresponding bin mean cloud microphysical properties are used for the analysis. Additionally, to quantify the grid scale impact of aerosol, cloud properties at the same grid points for both simulations are considered, assuming that the initialization of the cloud fields leads to approximately in the same location in both simulations.
The apparent heating (Q1) and the moisture sink (Q2) at the cloud-top are calculated by following Yanai et al. (1973). Q1 represents the apparent heating/cooling of the atmospheric layer due to various processes such as radiation, condensation, and convection. The corresponding equation is given by,
where, , the static stability, p is the pressure, V is the horizontal velocity vector, ∇ horizontal gradient operator, cp is the specific heat of dry air at constant pressure, T is the temperature, ω is the vertical p velocity, and t is the time. Additionally, Q2 represents the drying/moistening due to condensation or evaporation and moisture flux convergence, and it is represented as,
where q is the specific humidity and L is the latent heat of condensation. The adiabatic fraction (fad) is a measure of cloud dilution, which is primarily due to entrainment, turbulent mixing and evaporation, and is defined as the ratio of LWP to adiabatic LWP (LWPad), and is expressed as
Where, LWP is the liquid water path and LWPad is the adiabatic liquid water path (see Appendix A). The joint histograms analysed in this study are constructed as conditional probabilities (CP [%]) following Gryspeerdt et al. (2016) and are defined as the probability of finding a certain LWP given that a certain Nd has been observed (CP = [P (LWP ∣ Nd) × 100 %]). For joint histogram analysis, the variables are binned with a bin size (number of bins) of 1000. In the following analysis, Nd-bin mean variables are used, which means at certain Nd bins (P (variable ∣ Nd) ). Because the joint histograms use the conditional probability, they provide a regime-conditioned, distribution-based statistics that is less sensitive to the exact spatial co-location of individual clouds. In a large LES domain, environmental heterogeneity and aerosol–meteorology co-variability can still influence the apparent Nd–LWP relationship. However, our experimental design compares a control and an aerosol-perturbed simulation with identical meteorological forcing, differing only in the imposed CCN fields. Consistent with the HD(CP)2 approach, Costa-Surós et al. (2020) showed that aerosol signals can be quantified in such large-domain LES using domain-wide, regime-conditioned statistics rather than pointwise cloud matching. Accordingly, we use regime-conditioned statistics and distribution-based metrics to mitigate meteorological confounding while retaining the aerosol signal/contrast imposed by the CCN perturbation. Even with the identical large-scale forcing, the vertical velocity w would respond if the aerosol perturbation changes cloud-top cooling/evaporation and precipitation sufficiently. So, in this particular simulation, some dynamical differences (in vertical velocity) are expected in at least parts of the domain/time.
The aerosol perturbation in the 1985 simulations results in a significant increase in the number of cloud droplets, as demonstrated by the shift in the Nd probability density function (PDF) distribution (Fig. 1a) towards higher Nd. In 2013, the Nd is primarily distributed between 2 and 700 cm−3. In contrast, the 1985 simulation shows a broader distribution that extends up to 1000 cm−3, suggesting greater activation of Nd due to aerosol perturbation. Furthermore, this perturbation results in a 120 % increase in the mean Nd compared to the 2013 simulation. However, the LWP distribution shows relatively small shifts towards higher LWP in the 1985 simulation compared to 2013 (Fig. 1b). The relatively small shift in 1985 indicates that aerosol perturbation has less impact on the LWP, contributing only to a 5 % increase in the mean LWP when compared to the 2013 simulation. The contrasting response of the Nd and LWP to the aerosol perturbation suggests that higher droplet activation alone does not directly translate into proportional increases in bulk water content, highlighting the importance of compensating microphysical and dynamical processes (e.g., entrainment/mixing and cloud dilution) that can offset LWP increases.
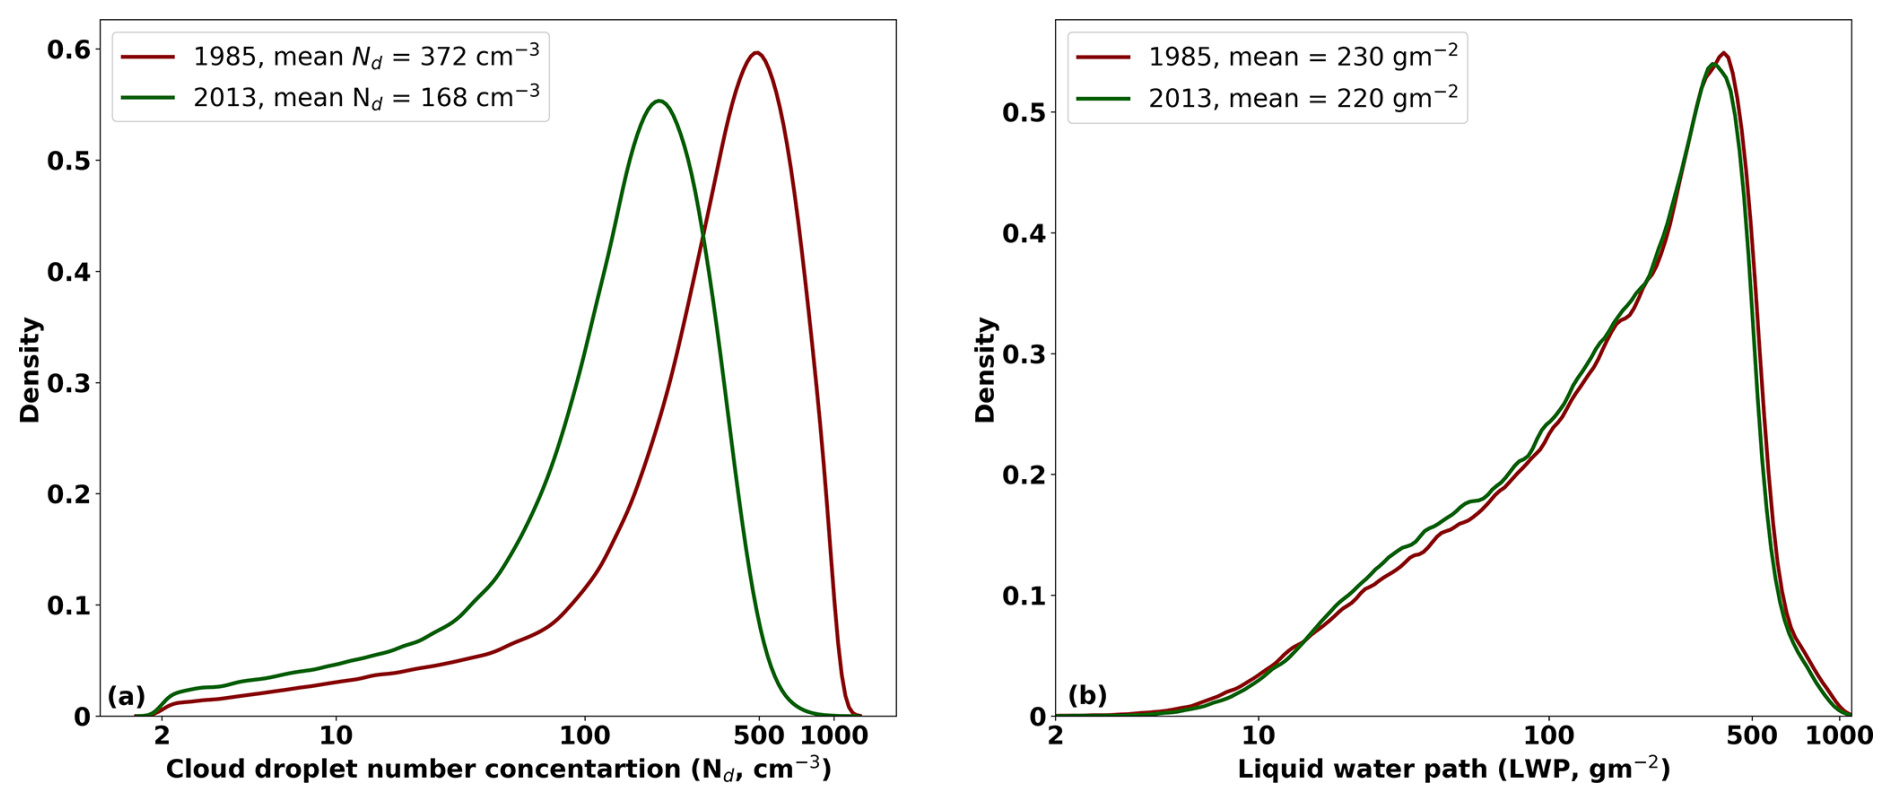
Figure 1Comparison of (a) Nd (cm−3) and (b) LWP (gm−2) probability density function (PDF) for the 2013 and 1985 simulations. The green line denotes the 2013 simulation using present-day (2013) CCN concentrations, while the 1985 simulation applies CCN concentrations representative of peak aerosol loading over Europe around 1985.
To disentangle these processes, we have extended the analysis to the joint histogram of LWP and Nd. Figure 2 shows the joint histogram between LWP and Nd for the 1985 and 2013 simulations. In both cases, the maximum CP depicts a spread for LWP values ranging from 10 to 500 gm−2, particularly at low Nd (< 100 cm−3). At the middle Nd values (between 100 and 500 cm−3), the CP narrows, with the highest values occurring in this range for both simulations. At higher Nd, the CP spread increases further, especially in 2013, though CP values above 700 cm−3 remain low. This low CP shows that there are limited cloud regimes with high Nd in the 2013 simulation. It is also evident in the Nd distribution (PDF) shown in Fig. 1a.
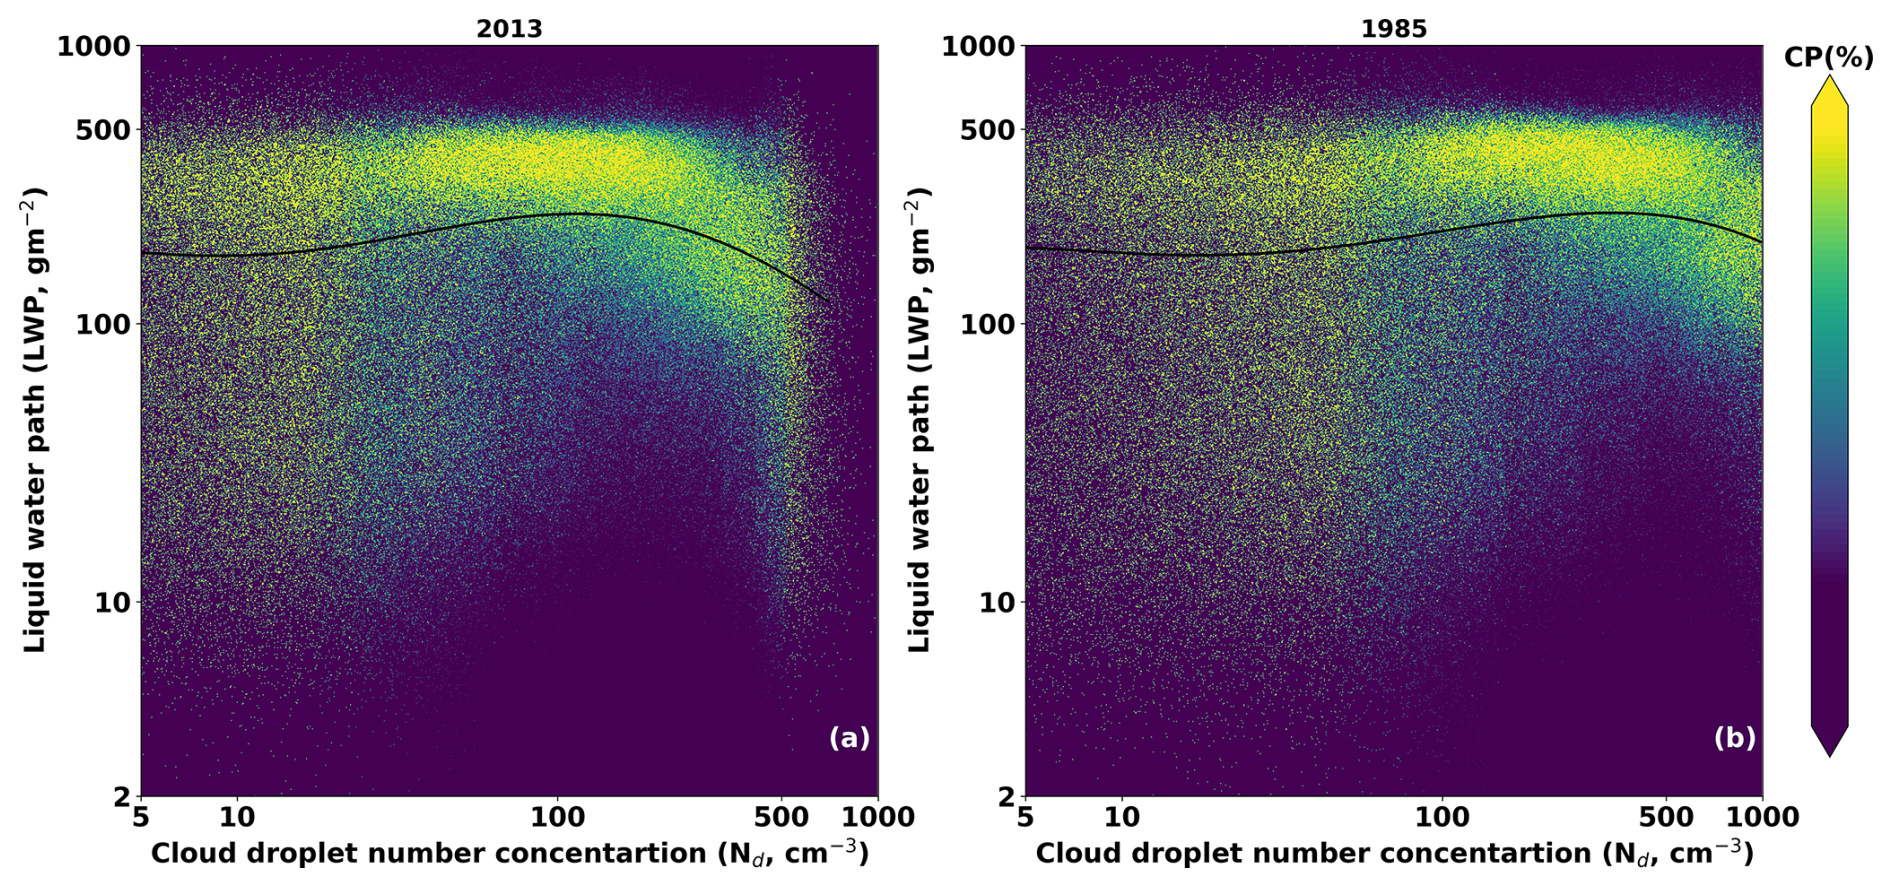
Figure 2The Nd-LWP joint histogram for the (a) 2013 and (b) 1985 simulations. The thick black line in each plot shows the smoothed mean LWP () at certain Nd bins (P (LWP ∣ Nd)). CP(%) is condition probability: the probability of finding a certain LWP given certain Nd. The green line denotes the 2013 simulation using present-day (2013) CCN concentrations, while the 1985 simulation applies CCN concentrations representative of peak aerosol loading over Europe around 1985.
The Nd-bin mean LWP () in the joint histogram implies the tendency of the Nd-LWP relation. For both simulations, the shows a non-linear relationship consistent with prior studies (Gryspeerdt et al., 2019; Dipu et al., 2022), but the magnitude and the Nd threshold of the transition differ due to differences in meteorological regime, sampling/aggregation scale, and aerosol loading. This non-linear relation implies a positive LWP sensitivity ( increasing with Nd) for lower Nd values and a negative LWP sensitivity ( decreases with increasing Nd) for higher Nd values. The transition point where the positive LWP sensitivity shifts to negative varies with the aerosol perturbation. In the 2013 simulation, the transition from positive to negative LWP sensitivity is simulated around Nd ≈ 100 cm−3 and in the 1985 simulation, it shifts to Nd ≈ 300 cm−3. This shift toward higher Nd reflects higher CCN concentrations in 1985, which enhanced droplet activation during cloud formation, increasing Nd and delaying LWP depletion. Since the two simulations have identical meteorological forcing and initial conditions, and differ only in CCN, the shift in the transition point is attributed to the aerosol perturbation rather than thermodynamic warming. The effect of aerosol perturbation is also evident in the Reff. In the 2013 simulation, peaks at low Nd and then declines sharply beyond ≈ 100 cm−3 indicating stronger cloud depletion. Conversely, in the 1985 simulation, the decreases at larger Nd ≈ 300 cm−3 indicating thicker, less diluted clouds (figure not shown). The adiabatic fraction (fad), defined as the ratio of LWP to the adiabatic LWP (LWPad), is a measure of dilution/subadiabaticity, which is primarily due to entrainment, turbulent mixing, and evaporation. Values of fad ≈ 1 indicate near-adiabatic, weakly diluted clouds (typically cloud cores), whereas fad ≪ 1 denotes strongly diluted, subadiabatic conditions, most commonly near cloud-top and cloud edges. In general, fad can increase with Nd at low to moderate Nd when enhanced droplet number delays collision–coalescence and reduces precipitation loss, allowing liquid water to accumulate. At higher Nd, the droplets are smaller and tend to evaporate more efficiently during entrainment/mixing, especially near the cloud-top, leading to cloud dilution and reducing fad. Figure 3 shows the relation between bin mean and the . In both simulations, the lower represent subadiabatic cloud regime. For positive LWP sensitivity, increases slightly with increasing in both simulations. At higher , in the 1985 simulation, continues to increase with , particularly during positive LWP sensitivity, indicating a relatively weaker dilution (i.e., more adiabatic). However, in the 2013 simulation, the shows a decrease at higher , suggesting that a more subadiabatic cloud regime implies cloud dilution driven by entrainment/mixing. The analysis further suggests that in the 1985 simulation, the aerosol perturbation leads to thicker, higher LWP clouds at high Nd with weaker cloud-top dilution, whereas the 2013 simulation exhibits thinner clouds at high Nd, indicative of more effective entrainment-driven dilution.
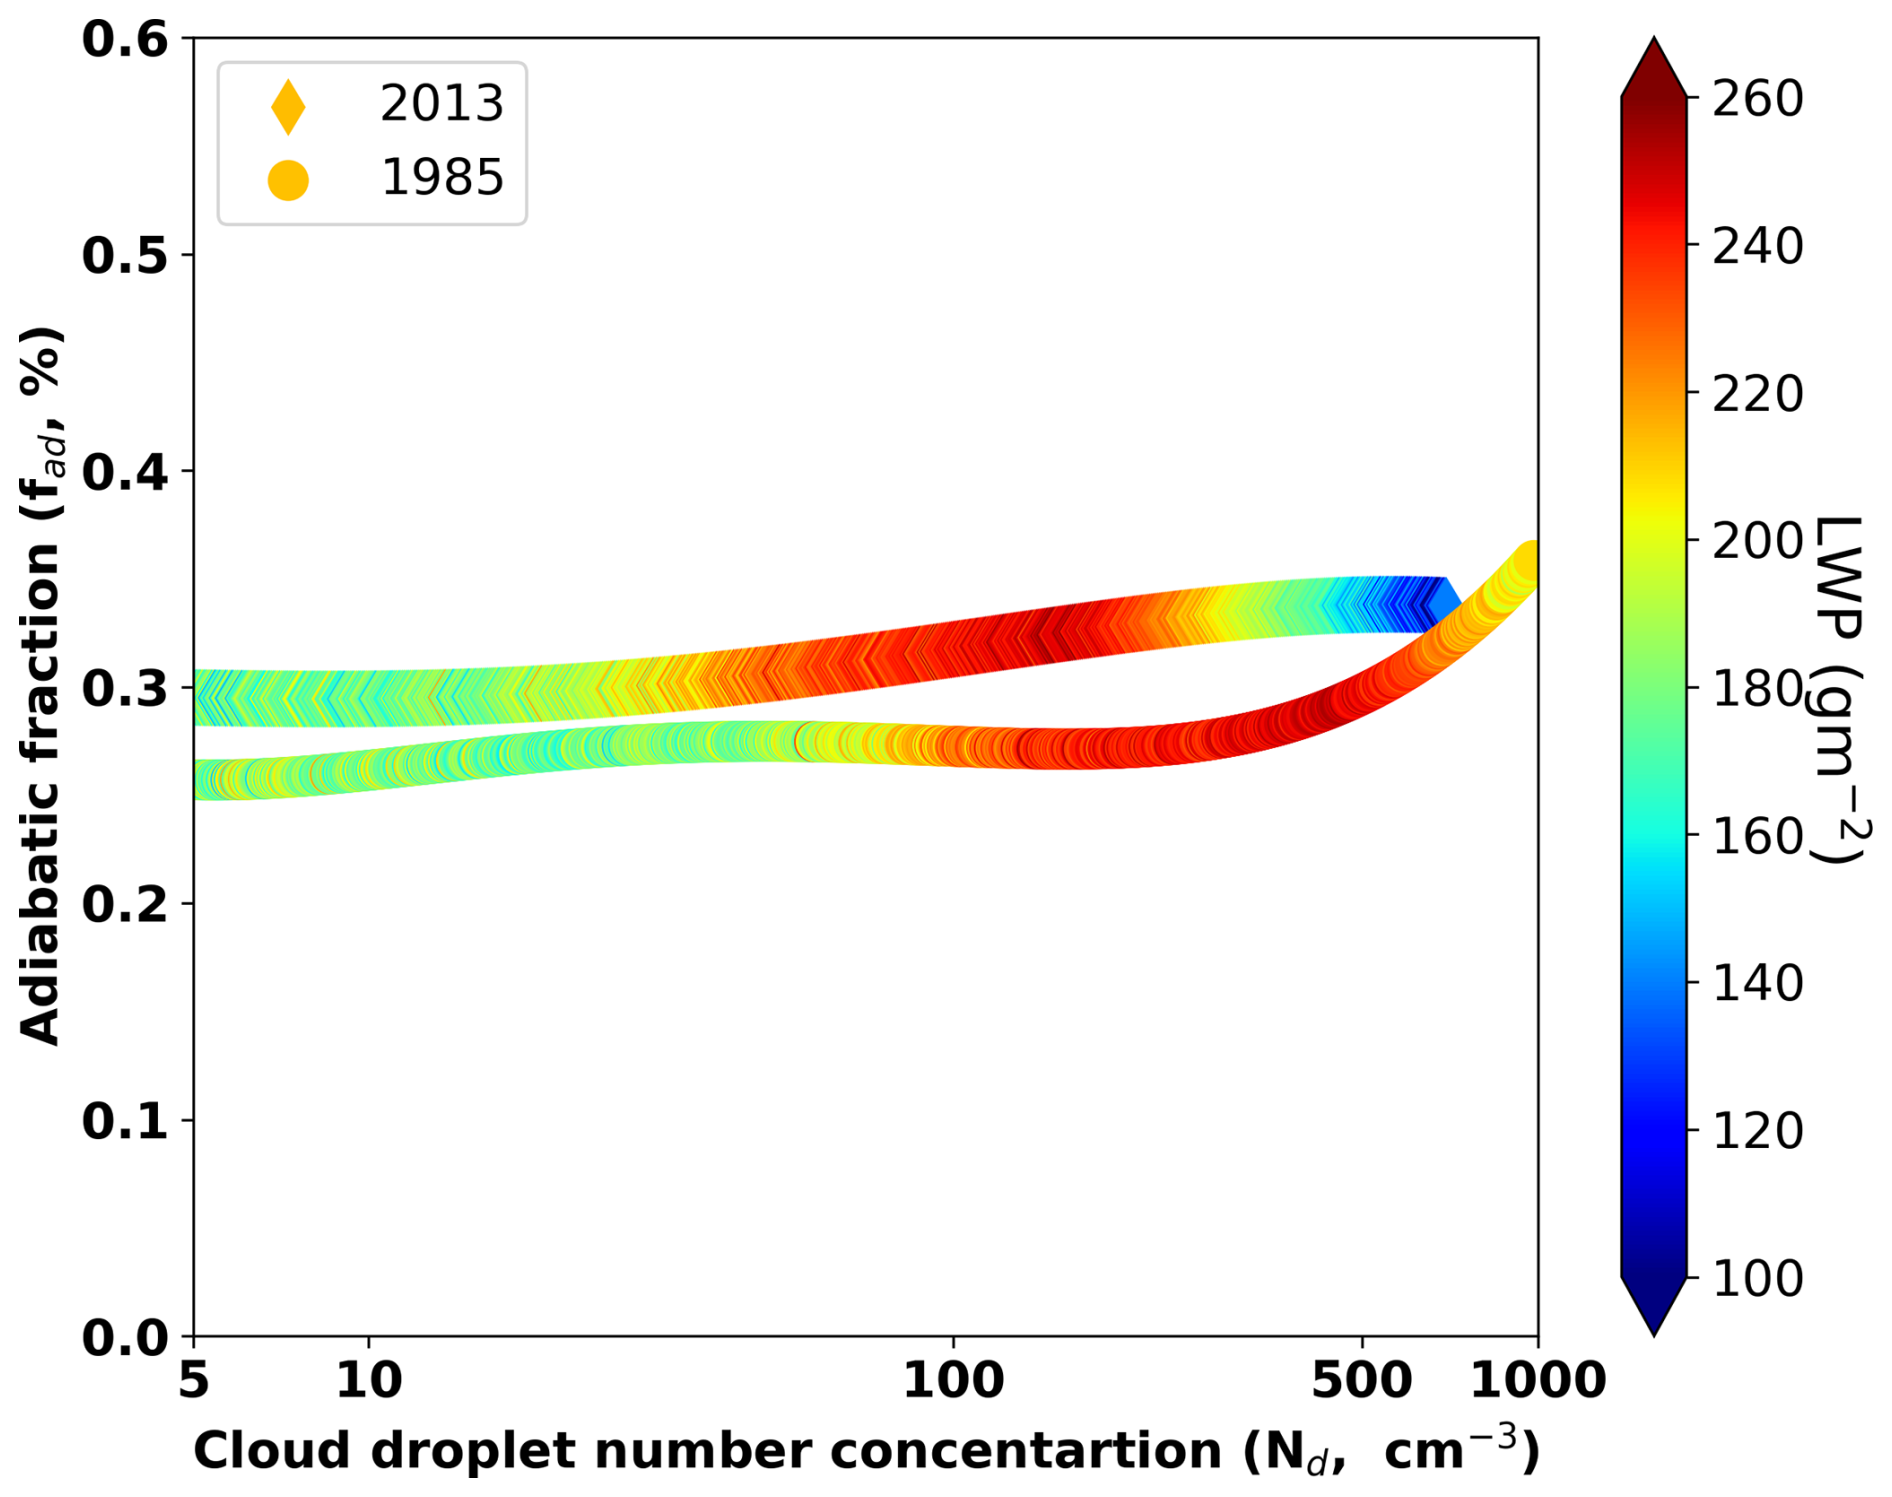
Figure 3The Nd-bin mean adiabatic fraction (fad, %) for the 2013 and 1985 simulations. The points represent the at certain P (fad ∣ Nd ). The diamond and the circle shape denote the corresponding mean LWP () for 2013 and 1985 simulations, respectively.
Furthermore, the temporal evolution of the cloud field in both simulations illustrates time-dependent LWP sensitivity during the simulations. Figure 4 illustrates the temporal evolution of the LWP sensitivity (time evolution of the joint histogram between and Nd) for both simulations. Initially, both simulations exhibit positive LWP sensitivity because CCN acts to elevate Nd, reduce droplet size, and suppress or delay warm-rain formation, allowing LWP to accumulate (Albrecht, 1989). Both simulations use identical initial conditions and forcing and differ only in the prescribed CCN, so this positive LWP sensitivity reflects rapid microphysical adjustment rather than differences in initialisation. Over time, however, the relationship becomes more non-linear, with an increasing contribution from negative sensitivity. In the 1985 simulation, the positive LWP sensitivity dominates due to the high CCN concentration, which accounts for the activation of numerous smaller droplets. Additionally, the transition of positive to negative LWP sensitivity shifts toward a much higher Nd value in the 1985 simulation over time. Glassmeier et al. (2021) reported that the LWP sensitivity becomes increasingly negative over time in stratocumulus clouds. Likewise, the LWP sensitivity becomes more negative in both simulations over time. The numerical value of the negative LWP sensitivity is derived as the slope of the linear regression through the in the specific Nd-bins, depicted in Fig. 5. Notably, the 2013 simulation exhibits a steeper negative slope than the 1985 simulation, indicating a more rapid LWP depletion. Although the transition to negative LWP sensitivity shifts to higher Nd in 1985, the magnitude of the negative slope is smaller than in 2013. The steeper negative slope in 2013 suggests that the cloud field enters drying/entrainment-driven depletion more readily, leading to more rapid LWP depletion. In contrast, the 1985 perturbation primarily shifts the transition to higher Nd and delays the onset of the depletion regime. Importantly, a higher aerosol loading does not necessarily imply a more negative Nd–LWP slope. The strength of the negative LWP sensitivity is state-dependent and depends on whether the clouds are in a dilution-dominated (entrainment–evaporation) state.
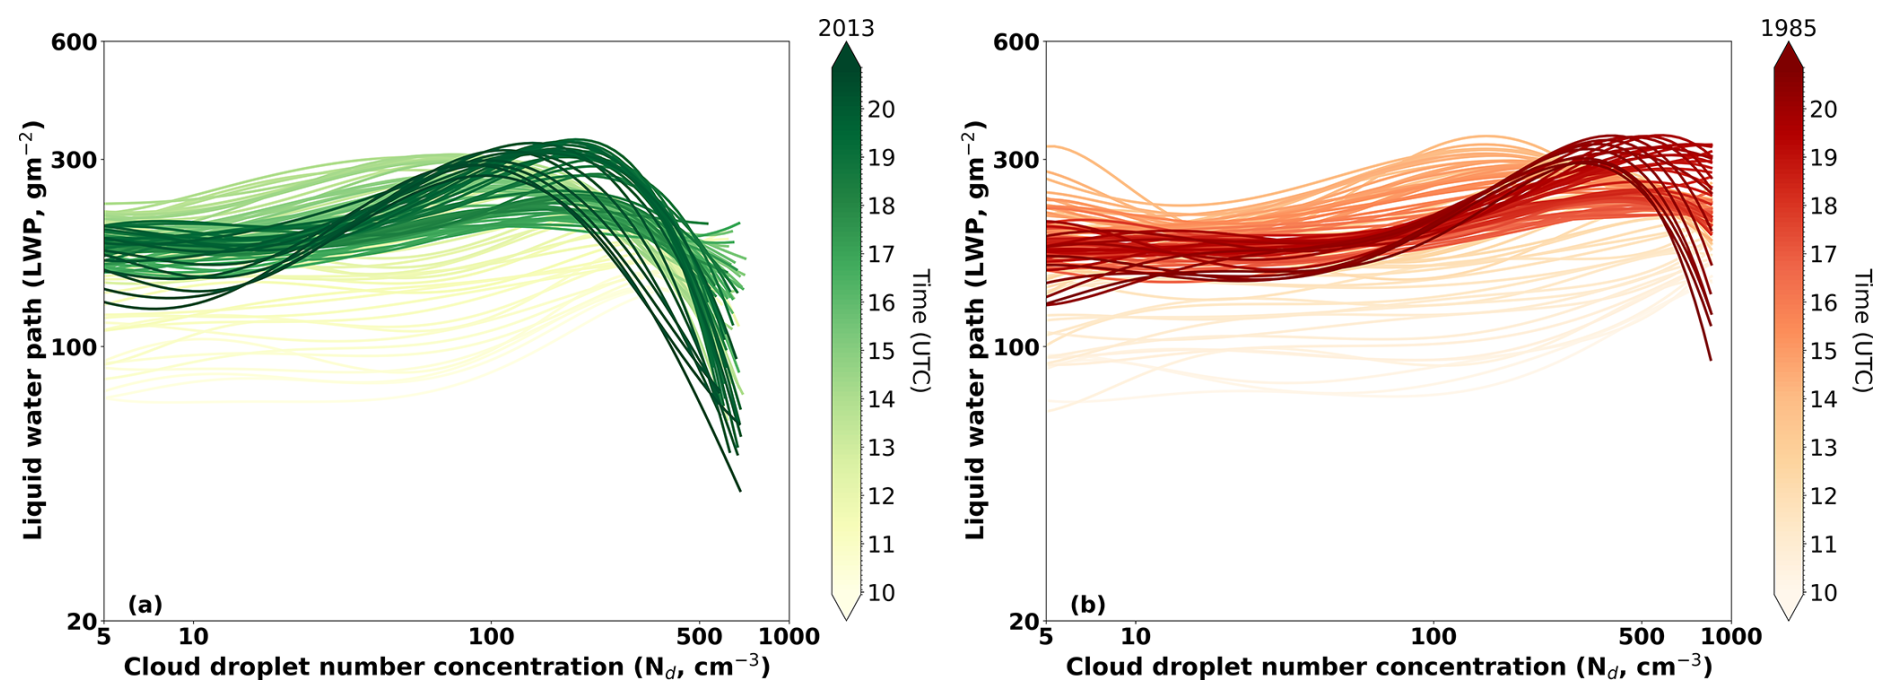
Figure 4Temporal evolution of the mean LWP () at certain Nd bins (P (LWP ∣ Nd) ) for (a) 2013 and (b) 1985 simulations. Each line indicates the Nd-LWP relationship at every model time step (5 min interval), and the colour gradient indicates the temporal evolution of the Nd-LWP relationship (from 10:00 UTC to 20:00 UTC).
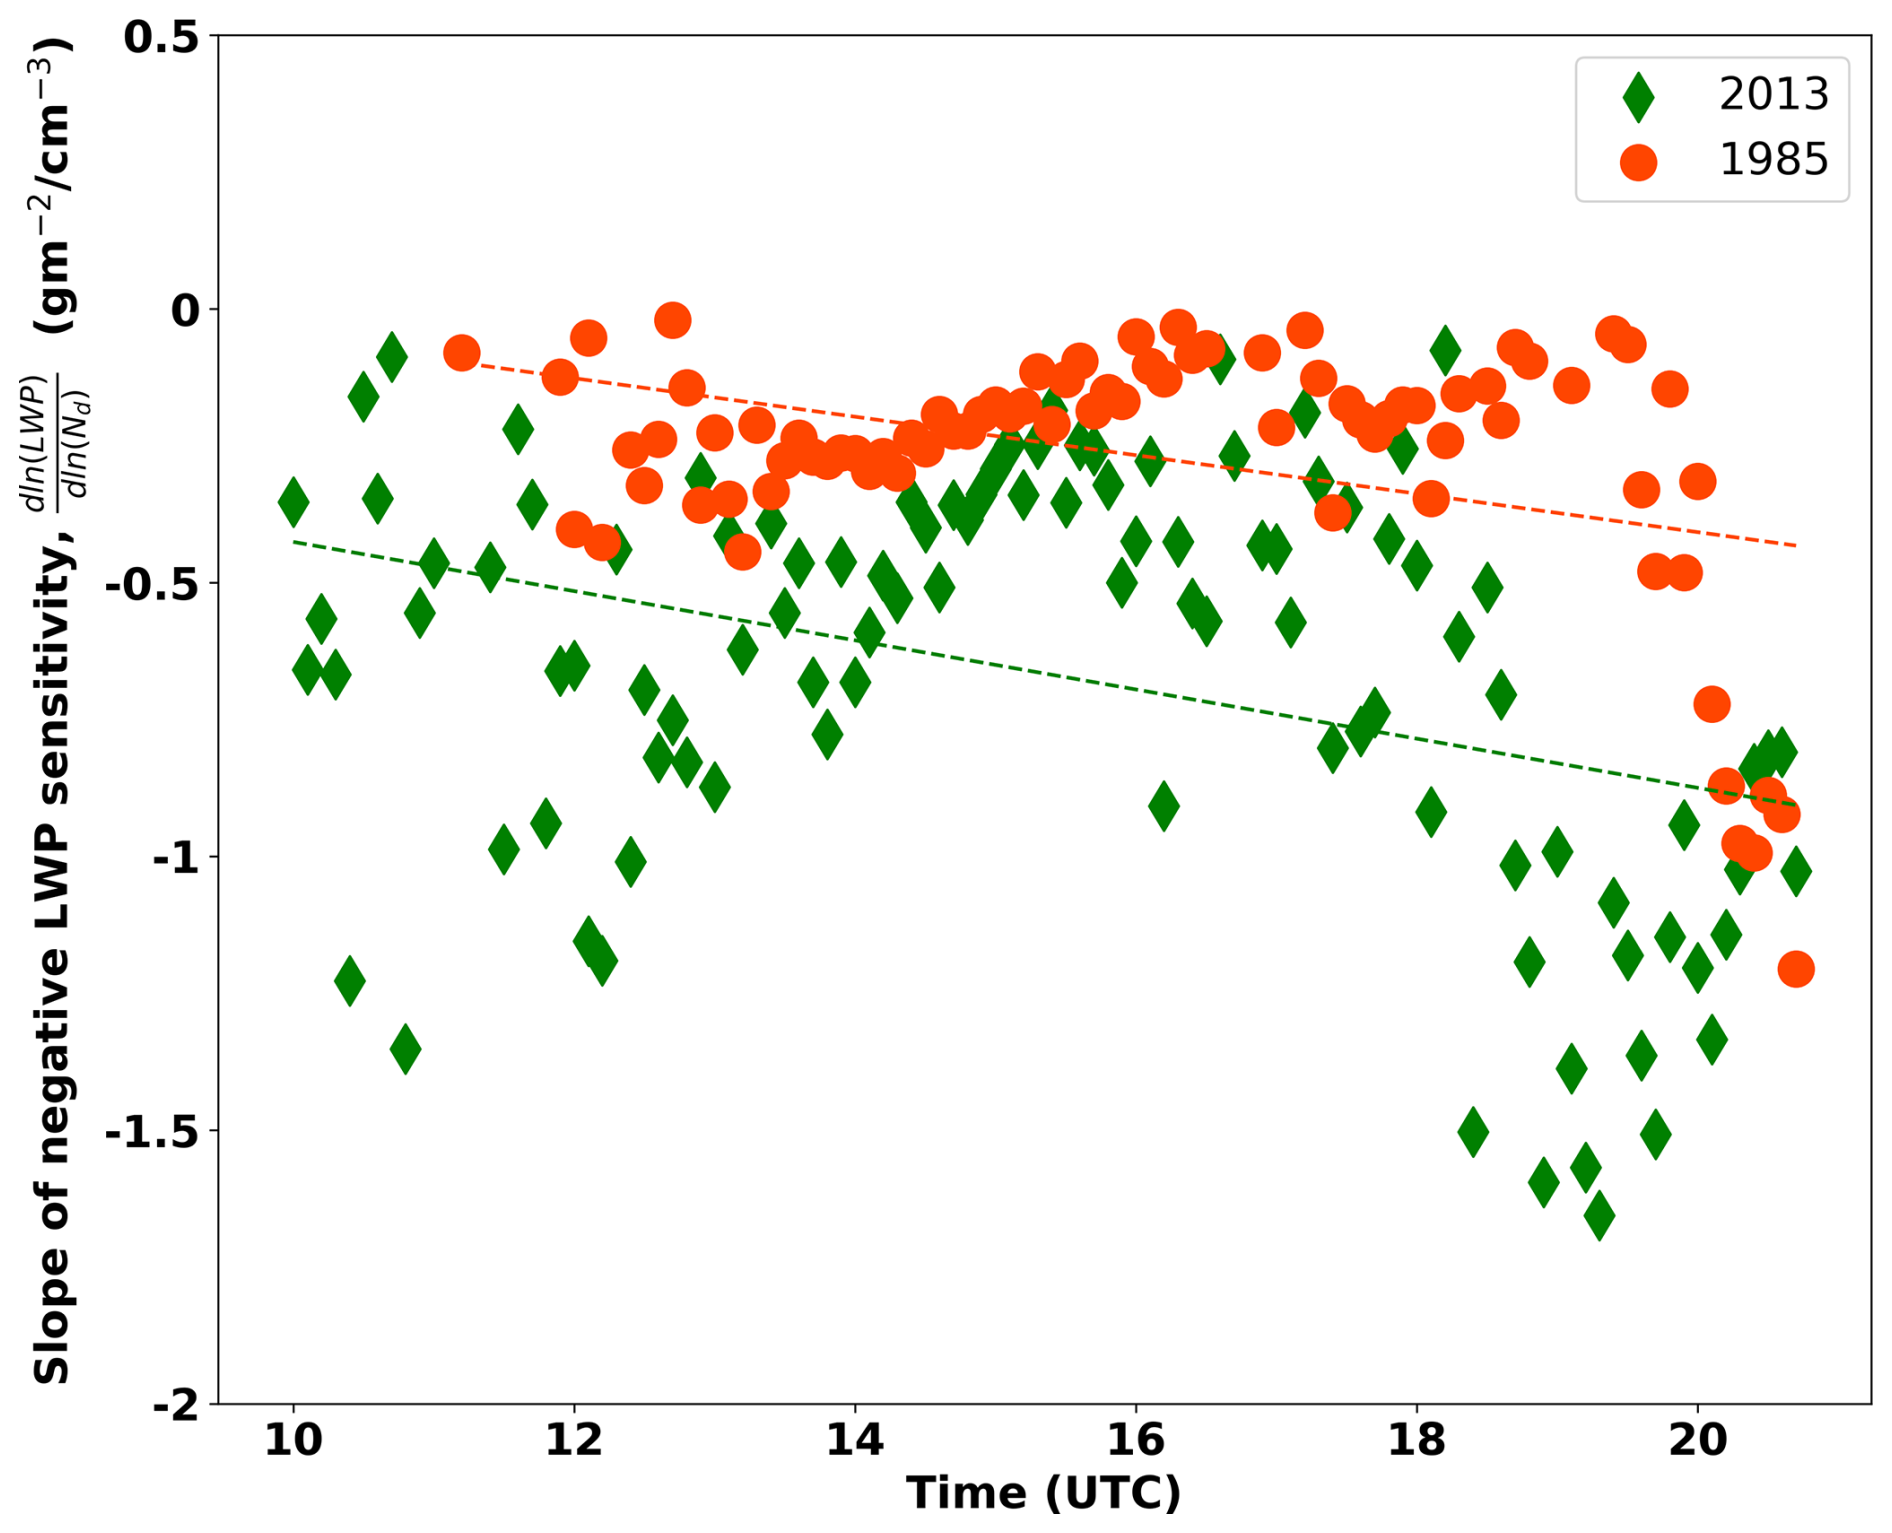
Figure 5The magnitude of negative LWP (g m−2) adjustment, as calculated by the Nd-LWP slope over time. The green diamond shape denote 2013 simulation, and the red circles denote the 1985 simulation. The respective dotted line indicates the linear regression.
From the temporal evolution of the LWP sensitivity, the critical and values are estimated. The critical values are specified only for time steps at which the domain-wide exhibits a non-linear dependence on Nd, with a clear maximum (i.e., a transition from positive to negative LWP sensitivity). From the time the temporal evolution of the LWP sensitivity (Fig. 4), if a non-linear relationship is present, the mean Nd Reff of the bin at which LWP reaches its maximum (sign change in sensitivity) is taken as the critical value for that time step. If no clear non-linear relationship exists, no critical values are assigned. They are derived across the same spatial domain and time interval. Figure 6 illustrates the critical and the corresponding at the transition between positive and negative LWP sensitivity. In the 2013 simulation, the critical is mostly distributed between 48 and 490 cm−3, with maximum density centred around 100 to 200 cm−3, whereas in 1985, it ranges from 140 to 711 cm−3, with the maximum density centred around 400 cm−3 in the 1985 simulation. This confirms the rightward shift in the LWP transition point under high-aerosol conditions. At this critical , shows a relatively widespread distribution, between 4.7 and 8 µm , in the 2013 simulation. Meanwhile, the 1985 simulation shows a relatively small spread in the distribution, between 4.2 and 6.5 µm further reflecting the more variable cloud dilution in the low-aerosol case.
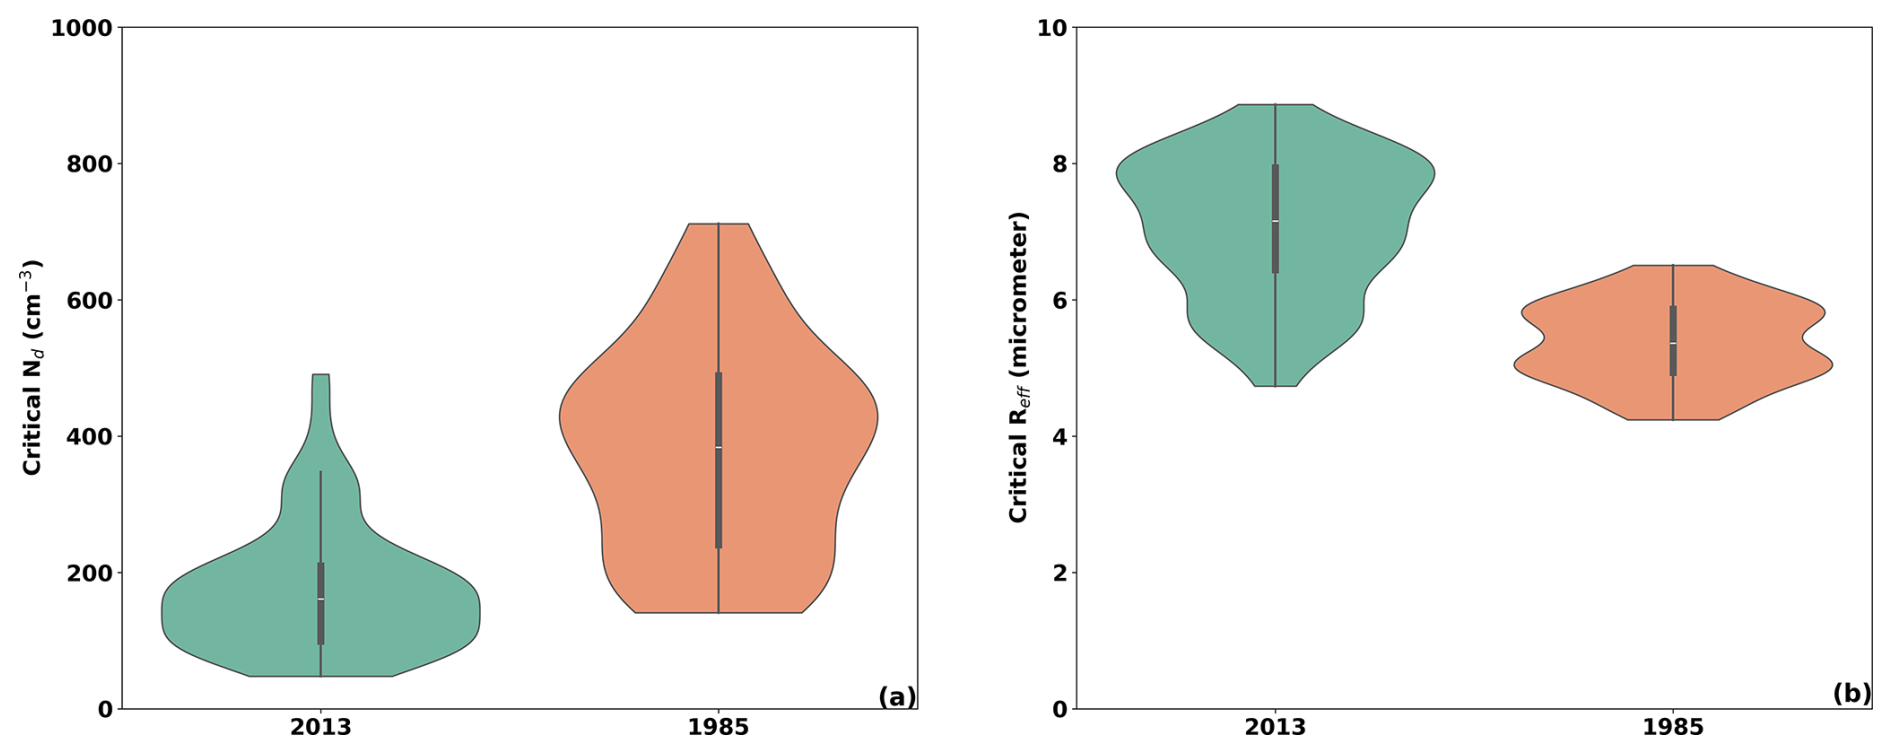
Figure 6Violin plots for critical (a) Nd (cm−3) and (b) Reff (µm). The critical indicates the Nd Reff at which the LWP adjustment becomes negative over time. The green colour denote 2013 simulation, and the red colour denotes the 1985 simulation. On each side, the grey line indicates the distribution shape of the data (PDF). The white dot on the violin plot represents the median, the back bar in the centre represents the interquartile range (first and third quartile), and the lower and upper parts of the violin plot represent the lower/upper adjacent values.
Further insights into aerosol-induced cloud changes are revealed by analysing thermodynamic diagnostics, particularly the apparent heating (Q1) and the moisture sink (Q2) at the cloud-top. The Q1 in a cloud layer is associated with various processes, local temperature changes, advection, and vertical motion. A substantial part of apparent heating/cooling is also associated with cloud microphysical processes in clouds. In liquid clouds, condensation of water vapour contributes to microphysical heating, and cloud droplet evaporation contributes to cooling (Keshtgar et al., 2023). Figure 7a shows the relationship between (Nd-bin mean) and Nd at the cloud-top. For lower Nd values, the is negative, implying apparent cooling in both simulations. A negative is mainly associated with cloud droplet evaporation, rising motion, and cold air advection in a cloudy layer. Specifically, in the selected case, at lower Nd, the is negative, though it becomes less negative as Nd increases. The negative observed at lower Nd may be related to processes such as droplet evaporation and/or rising motion. As the cloud develops, collision–coalescence shifts the droplet spectrum toward larger and promotes precipitation processing. As a result, the relative contribution of evaporative cooling associated with mixing/entrainment decreases, and becomes less negative with increasing Nd. This is consistent with concurrent increases in LWC and decreases in specific humidity at lower Nd (Fig. A2 in the Appendix). In the 2013 simulation, as Nd increases (> 200 cm−3), becomes positive, indicating apparent heating. However, this apparent heating is only simulated at higher Nd (> 800 cm−3) in the 1985 simulation. A positive is associated with processes such as condensation and latent heat release, sinking motion, and entrainment/mixing of warm, dry air. In the 2013 simulation, however, the specific humidity increases, and the water content (LWC/LWP) decreases as Nd > 200 cm−3. Therefore, the only possible mechanism left to explain the positive is the entrainment/mixing of warm, dry air and the resulting cloud droplet evaporation, which is in agreement with the dilution of clouds with higher Nd (Fig. 3). Similarly, in the 1985 simulation, the negative further decreases (less negative) for higher Nd (> 300 cm−3) and a positive is simulated only at higher Nd (> 800 cm−3), suggesting that aerosol perturbation shifts the onset of entrainment-induced cloud depletion to higher Nd.
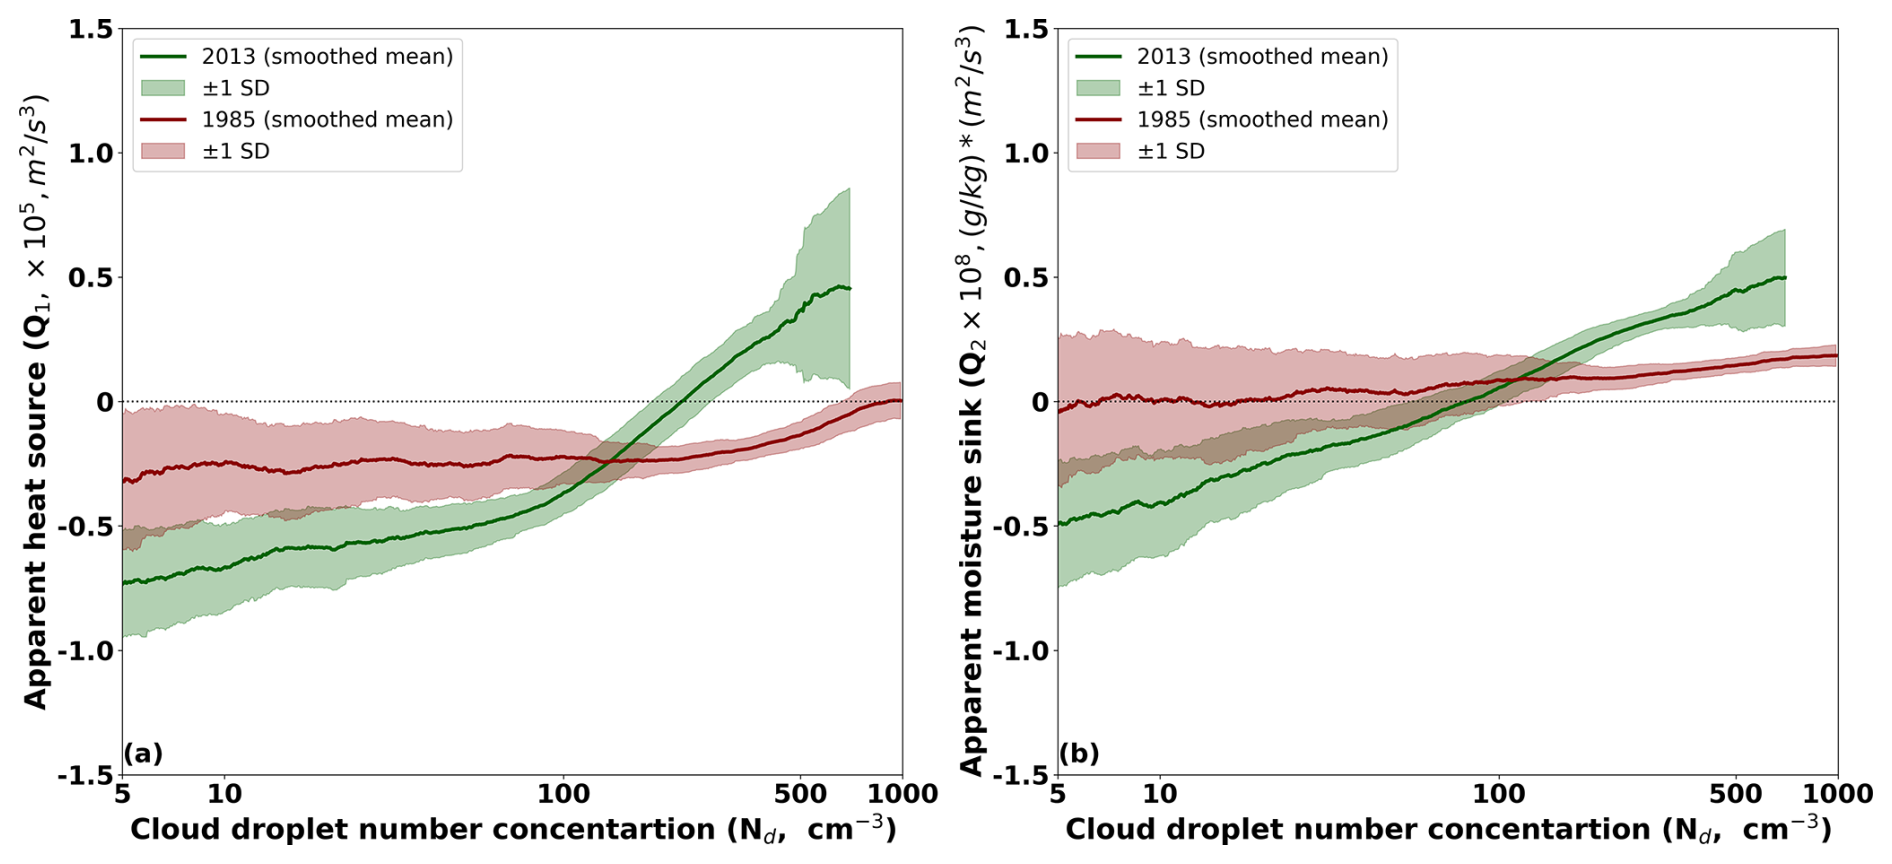
Figure 7The Nd-bin mean (a) Q1 and (b) Q2 for the 2013 and 1985 simulations. The solid lines represent the smoothed mean of the mean Q1 () and mean Q2 () at certain Nd bins (same as Fig. 1). The shaded region represents the rolling standard deviation of the respective Nd-bin mean values. The green line denotes the 2013 simulation using present-day (2013) CCN concentrations, while the 1985 simulation applies CCN concentrations representative of peak aerosol loading over Europe around 1985.
The apparent moisture sink, Q2 (Nd-bin mean, ), for the two simulations is depicted in Fig. 7b, which also supports the above interpretation. Generally, a positive Q2 indicates moisture removal through condensation or dry air advection, while a negative Q2 implies moisture addition through evaporation or moist air advection. In the 2013 simulation, is negative for the lower Nd (< 100 cm−3), indicating the dominant influence of moist air advection, along with cloud dilution. Simultaneously, the increases as Nd increases for lower Nd, suggesting a reduction in cloud dilution, which correlates with an increase in LWC and a decrease in specific humidity (Fig. A1 in the Appendix). In contrast, for higher (Nd >100 cm−3), in the 2013 simulation, tends to be positive, indicating moisture removal, consistent with entrainment-driven evaporation. The 1985 simulation shows predominantly positive , except for very low Nd (> 10 cm−3). The positive for Nd values less than 300 cm−3 is driven by condensation. At higher Nd (> 300 cm−3), however, the same positive results from cloud water removal through dry air entrainment. This is also consistent with a concurrent increase in specific humidity and a decrease in LWC, indicating cloud dilution associated with entrainment.
The ambiguity in the LWP adjustment/sensitivity due to aerosols varies with individual clouds (Smalley et al., 2024; Christensen et al., 2020), which adds uncertainty to effective radiative forcing due to the aerosol-cloud interactions (Mülmenstädt and Feingold, 2018). Recent studies utilise the sensitivity of Nd to LWP to improve the understanding of the aerosol-cloud interaction using modelling and observations (Gryspeerdt et al., 2019; Dipu et al., 2022; Mülmenstädt et al., 2024b), in which Nd represents an indirect proxy for aerosols. In a specific cloud regime, a positive LWP sensitivity implies a systematic increase of LWP with increasing aerosols, and a negative LWP sensitivity indicates cloud depletion. Here, we have investigated the significance of aerosol perturbation to the LWP sensitivity using the ICON-LES model.
In the selected cloud regime, the 1985 simulation, representing a high-aerosol scenario, consistently showed systematically higher Nd values under identical meteorological conditions compared to the 2013 simulation (low-aerosol scenario). The high CCN in the 1985 simulation led to more numerous and smaller droplets, sustaining positive LWP sensitivity compared to 2013. As a result, the transition point from positive to negative to positive LWP sensitivity has shifted to a higher Nd (>300 cm−3), compared to that (>100 cm−3) in 2013. This shift in the negative LWP sensitivity is also visible in the time evolution of the LWP sensitivity in the respective simulation. Despite this shift, both simulations exhibited negative LWP sensitivity at higher Nd, linked to cloud dilution due to entrainment. Analysis of the thermodynamic diagnostics further reveals that in both simulations, cloud-top Q1 (apparent heating) and Q2 (moisture sink) became increasingly positive with Nd, indicating warm, dry air entrainment and associated evaporation. The positive trend is more pronounced in 2013, consistent with stronger dilution. Meanwhile, in 1985, Q1 and Q2 remained less positive, suggesting a more buffered response to entrainment due to sustained cloud development under high aerosol loading. Additional diagnostics of the temperature tendency term in Q1 (Eq. 1) at cloud-top reveal that it becomes increasingly negative as Nd increases, particularly for negative LWP sensitivity (Fig. A2a). The positive advection terms (the sum of horizontal and vertical advection) in Q1 (Eq. 1) for low Nd indicating net warming due to advection, which later transitioned to neutral or negative values at higher Nd, indicating reduced warming and as entrainment increases (Fig. A2c). The high CCN in the 1985 simulations resulted in a less negative temperature tendency (less cooling) and advection-induced cooling compared to the 2013 simulation. Similarly, specific humidity tendencies term in Q2 (Eq. 2) also showed increased moisture loss at higher Nd, particularly in 2013, further confirming the role of entrainment-driven drying. In the 2013 case, the net moisture advection term in Q2 (Eq. 2) is initially positive at lower Nd, and it becomes negative at higher Nd, consistent with entrainment-induced drying (Fig. A2b). Conversely, in the 1985 simulation, net moisture advection remains persistently negative and intensifies slightly with increasing Nd, suggesting a weak drying tendency under high aerosol conditions (Fig. A2d).
The analysis shows that the aerosol perturbation induces a clear microphysical and thermodynamic response and modulates the regime-conditioned Nd–LWP sensitivity, while the change in the bulk LWP distribution remains modest. In the 2013 simulation, Q1 becomes less negative and positive for negative LWP sensitivity (Nd > 100 cm−3). Here, entrainment refers to turbulent mixing of relatively warm, dry free-tropospheric air across the inversion into the cloud-top layer, which promotes subsaturation and evaporation. Since Q1 is an apparent heating residual that includes advection and vertical motion, its sign reflects the net balance of warming and evaporative cooling rather than evaporation alone. Moreover, this evaporation, along with a decrease in local specific humidity, contributes to a moisture sink (Q2 > 0), particularly for the negative LWP sensitivity. However, in the 1985 simulation, aerosol perturbations led to a less positive tendency in Q2 for negative LWP sensitivity compared to prior simulations. This can be further explained by the weaker temperature tendencies, reduced local specific humidity, and decreased moisture sink in the 1985 simulation for negative LWP sensitivity. Furthermore, in the 1985 simulation, condensation processes dominate (positive Q2), which helps maintain a positive LWP sensitivity even at higher Nd. Nonetheless, as Nd increases further, Q2 also increases, which may be due to enhanced droplet evaporation linked to warm air entrainment. It should be emphasised, however, that evaporation and advection are not the only processes associated with negative LWP sensitivity. While they appear to be the dominant mechanisms in the above simulations, additional processes such as cloud-top radiative cooling, droplet sedimentation, and turbulence entrainment feedbacks may also play important roles in driving cloud depletion at high Nd. We also note that numerical diffusion can affect the magnitudes of the diagnosed apparent heating and moisture sink near cloud edges, which is a limitation of the present analysis and should be considered when interpreting the results. Future studies should aim to disentangle and quantify the relative contributions of these pathways, for example, by combining targeted LES experiments with process-level diagnostics and Lagrangian cloud tracking.
This study uses the ICON-LES model as part of the HD(CP)2 project to investigate the effect of aerosols on LWP sensitivity. Simulations were conducted over Germany on 2 May 2013, with high (1985 CCN condition) and low aerosol (2013 CCN condition) scenarios. The joint histogram analysis reveals a non-linear relationship between Nd and LWP in both simulations, which is consistent with previous studies. The non-linear relationship implies for low Nd values, LWP increases with Nd (positive LWP sensitivity), while at higher Nd, LWP decreases (negative LWP sensitivity). The transition from positive to negative LWP sensitivity occurs at a lower Nd (≈ 100 cm−3) in the 2013 simulation and shifts to higher Nd (≈ 300 cm−3) under the 1985 aerosol scenario. This indicates that increased aerosol concentration leads to sustained droplet activation, thereby shifting the cloud depletion to higher Nd. The 1985 simulation exhibits more persistent positive LWP sensitivity, associated with enhanced droplet activation and thicker clouds. In contrast, the 2013 simulation reveals a greater degree of cloud dilution, as indicated by a more pronounced decrease in the Reff and fad at higher Nd. Temporal analysis of the Nd-LWP joint histogram further illustrates a non-linear relationship with negative LWP sensitivity becomes dominant over time in 2013. However, in the 1985 simulation, the positive LWP sensitivity is dominant, with weaker negative LWP sensitivity observed over time.
Furthermore, thermodynamic features such as cloud-top apparent heating (Q1) and moisture sink (Q2) also reveal a significant impact of aerosol perturbation. Our analysis suggests that negative Q1 dominates at low Nd, due to droplet evaporation and/or rising motion. In contrast, the apparent heating (positive Q1) observed at higher Nd is attributed to cloud dilution and warm air advection. In the 2013 simulation, we found apparent heating or positive Q1 for Nd > 200 cm−3. In contrast, the 1985 simulation showed positive Q1 only at a much higher Nd value (> 800 cm−3). Thus, the aerosol perturbation results in sustained negative Q1 for higher Nd, with a weaker positive Q1 or cloud dilution through entrainment. Similarly, negative Q2 or moisture gain is simulated at low Nd despite the negative Q1, indicating dominant cloud growth. While positive Q2 or moisture sink is simulated at higher Nd, indicating a drying effect through warm air entrainment. Our analysis suggests that high CCN concentration in the 1985 simulation exhibits greater moisture retention (negative Q2), supporting sustained cloud growth and positive LWP sensitivity to higher Nd. In contrast, the moisture sink (positive Q2) is observed in relatively higher Nd (> 800 cm−3) in the 1985 simulation.
Both simulations reinforce the hypotheses that negative LWP sensitivity at high Nd are closely associated with entrainment-driven cloud dilution, evidenced by increased Q1 (warming), increased Q2 (moisture loss), reduced LWC, and droplet evaporation. However, the threshold Nd for dilution shifts to higher Nd in the 1985 simulation, indicating the enhanced effect of aerosol perturbation on mitigating cloud depletion. The response in the Nd–LWP relationship under aerosol perturbations implies a modified cloud radiative response, with sustained positive LWP sensitivity enhancing cloud albedo towards high Nd with weaker cloud depletion through entrainment at higher Nd. These dynamics are critical for quantifying the effective radiative forcing of aerosol-cloud interactions in convective cloud regimes. Future studies will focus on investigating Nd-LWP sensitivity and its effect on aerosol perturbation using Lagrangian cloud tracking, which can improve the understanding of the aerosol effect on LWP sensitivity.
Following Toledo et al. (2021), the adiabatic liquid water path is computed from the standard adiabatic assumption, in which the adiabatic LWC increases linearly with height above cloud-base and corresponding equation is given by,
where γad is the vertical gradient of adiabatic LWC, and the cloud depth H is
The adiabatic LWC gradient γad is evaluated at cloud-base using the cloud-base temperature Tb (K) and the pressure pb (Pa):
where Γw is the moist-adiabatic temperature lapse rate (units: K m−1), ρd is the dry-air density (units: kg m−3), ws is the saturation mixing ratio (units: kg kg−1), es=es(Tb) is the saturation vapour pressure (units: Pa) at Tb (cloud base temperature), and pb (cloud base pressure).
The moist-adiabatic lapse rate is given by
the dry-air density by
and the saturation mixing ratio by
with .
The saturation vapour pressure is computed using the Bolton formulation (Bolton, 1980):
The constants used are
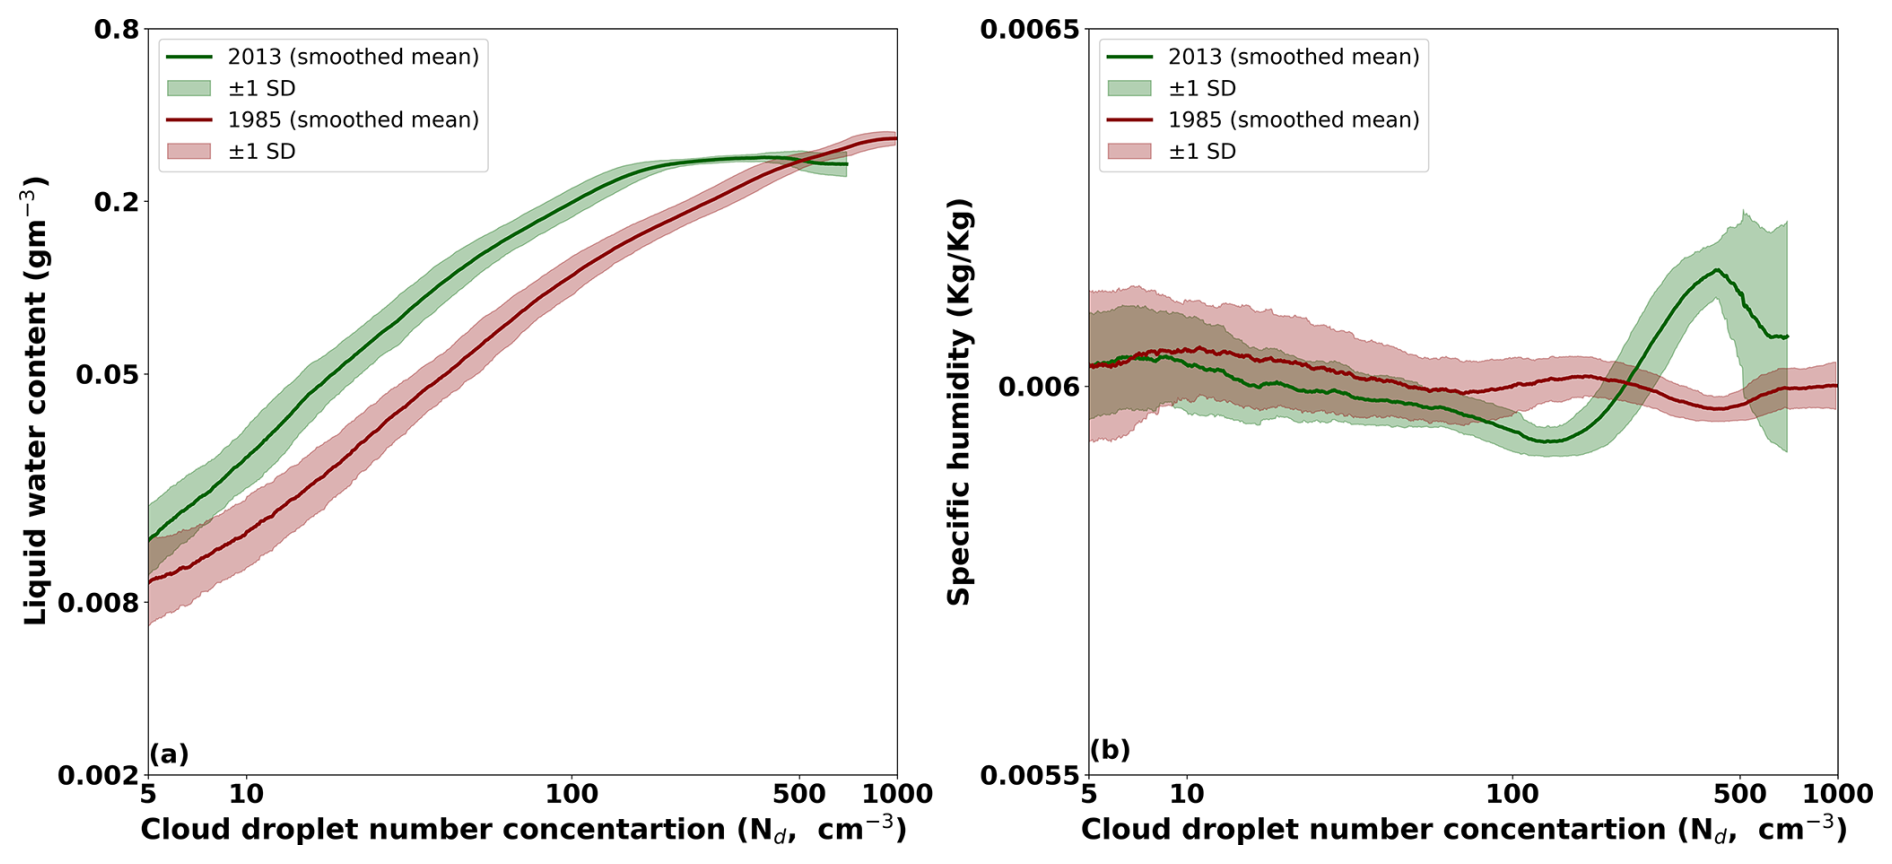
Figure A1The Nd-bin mean (a) and (b) Specific humidity () for the 2013 and 1985 simulations. The solid lines represent the smoothed mean of the mean LWC and specific humidity at certain Nd bins (same as Fig. 1). The shaded region represents the rolling standard deviation of the respective Nd-bin mean values. The green line denotes the 2013 simulation using present-day (2013) CCN concentrations, while the 1985 simulation applies CCN concentrations representative of peak aerosol loading over Europe around 1985.
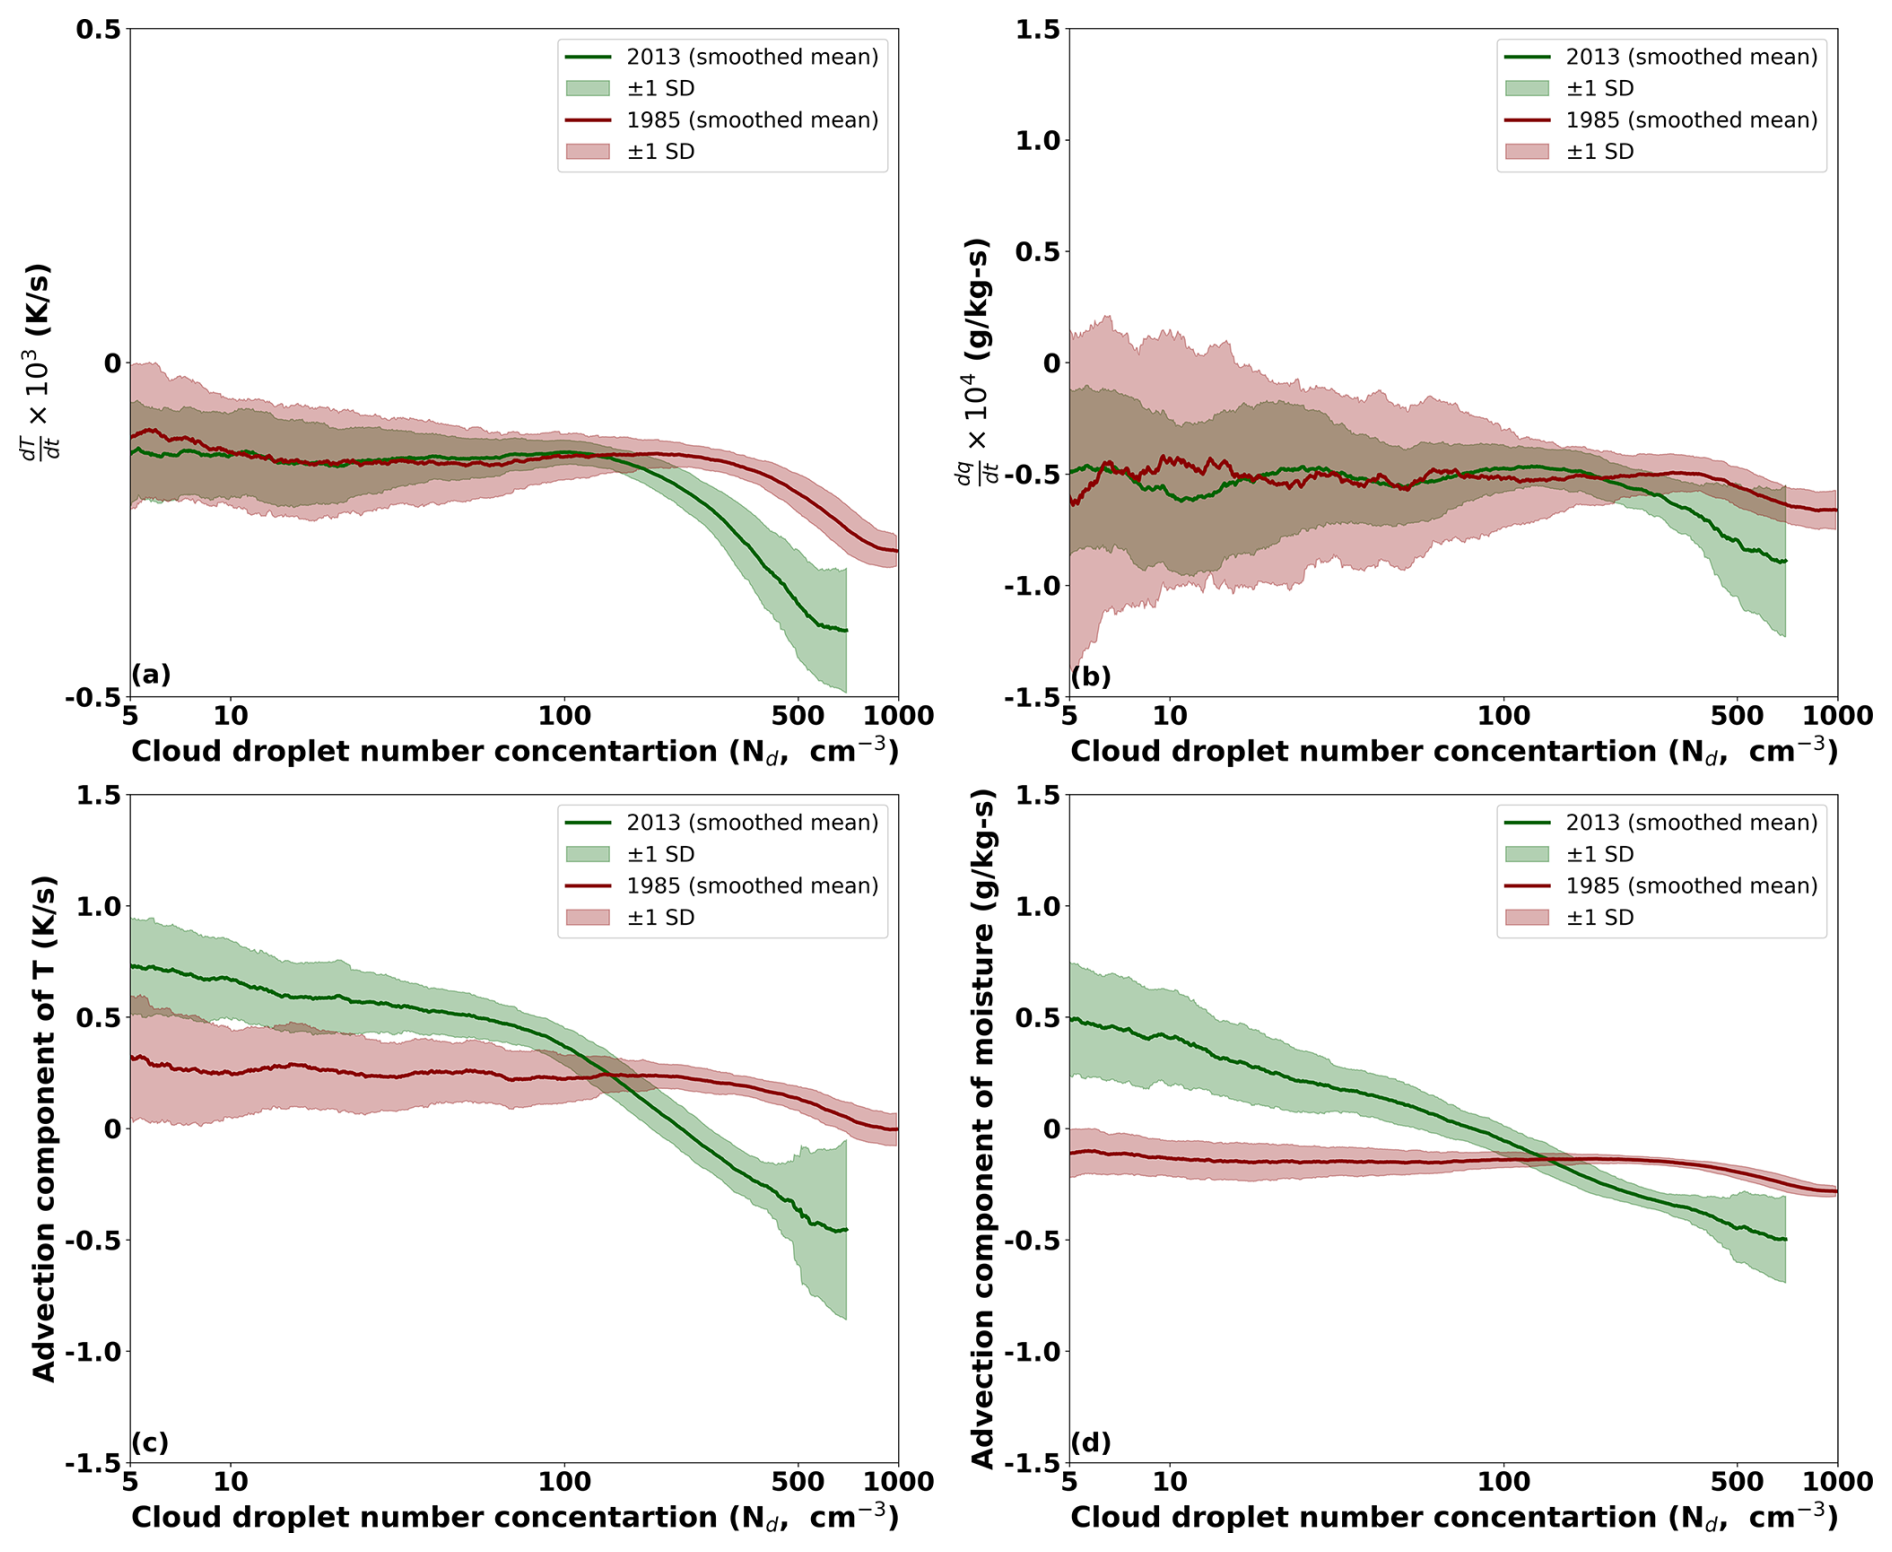
Figure A2The Nd-bin mean (a) , (b) , (c) advection component of temperature, and (d) advection component of moisture for the 2013 and 1985 simulations. The solid lines represent the smoothed mean of the mean values of the above variables at certain Nd bins (same as Fig. 1). The shaded region represents the rolling standard deviation of the respective Nd-bin mean values. The green line denotes the 2013 simulation using present-day (2013) CCN concentrations, while the 1985 simulation applies CCN concentrations representative of peak aerosol loading over Europe around 1985.
The model output data used for the development of the research in the frame of this scientific article is securely saved in the tape archives at the Deutsches Klimarechenzentrum (DKRZ), which will be accessible for 10 years. Additionally, backup copies are stored in the University of Leipzig and University of Cologne backup services.
All authors participated in the design of the study. DS and JQ conceived and refined the overall structure of the investigation based on discussions with and feedback from all co-authors. All authors assisted in the interpretation of the results and commented on the paper. All authors have read and agreed to the published version of the manuscript.
At least one of the (co-)authors is a member of the editorial board of Atmospheric Chemistry and Physics. The peer-review process was guided by an independent editor, and the authors also have no other competing interests to declare.
Publisher's note: Copernicus Publications remains neutral with regard to jurisdictional claims made in the text, published maps, institutional affiliations, or any other geographical representation in this paper. The authors bear the ultimate responsibility for providing appropriate place names. Views expressed in the text are those of the authors and do not necessarily reflect the views of the publisher.
This study has been carried out under the project “FORCeS”, which is funded by the European Union’s Horizon 2020 research and innovation programme under grant agreement No 821205. Further funding from the DFG-ANR project “CDNC4aci” (Deutsche Forschungsgemeinschaft, DFG GZ QU 311/27-1) is acknowledged. We thank the High Definition Clouds and Precipitation for Advancing Climate Prediction (HD(CP)2) project (funded by the German Federal Ministry of Education and Research (BMBF; http://www.fona.de/, last access: 29 April 2026) under grant no. 01LK1504B) for providing the model simulations. The authors thank anonymous reviewers for their valuable comments on an earlier version of this manuscript.
This research has been supported by the European Union’s Horizon 2020 research and innovation programme (GA No: 821205) and by the CleanCloud (GA No: 101137639), the Horizon Europe programme.
This paper was edited by Luisa Ickes and reviewed by Sudarsan Bera and one anonymous referee.
Ackerman, A. S., Toon, O. B., Taylor, J. P., Johnson, D. W., Hobbs, P. V., and Ferek, R. J.: Effects of Aerosols on Cloud Albedo: Evaluation of Twomey’s Parameterization of Cloud Susceptibility Using Measurements of Ship Tracks, J. Atmos. Sci., 57, 2684–2695, https://doi.org/10.1175/1520-0469(2000)057<2684:EOAOCA>2.0.CO;2, 2000. a
Ackerman, A. S., Kirkpatrick, M. P., Stevens, D. E., and Toon, O. B.: The impact of humidity above stratiform clouds on indirect aerosol climate forcing, Nature, 432, 1014–1017, https://doi.org/10.1038/nature03174, 2004. a, b, c
Albrecht, B. A.: Aerosols, Cloud Microphysics, and Fractional Cloudiness, Science, 245, 1227–1230, https://doi.org/10.1126/science.245.4923.1227, 1989. a, b, c
Arola, A., Lipponen, A., Kolmonen, P., Virtanen, T. H., Bellouin, N., Grosvenor, D. P., Gryspeerdt, E., Quaas, J., and Kokkola, H.: Aerosol effects on clouds are concealed by natural cloud heterogeneity and satellite retrieval errors, Nat. Commun., 13, 7357, https://doi.org/10.1038/s41467-022-34948-5, 2022. a
Baldauf, M., Seifert, A., Förstner, J., Majewski, D., Raschendorfer, M., and Reinhardt, T.: Operational Convective-Scale Numerical Weather Prediction with the COSMO Model: Description and Sensitivities, Mon. Weather Rev., 139, 3887–3905, https://doi.org/10.1175/MWR-D-10-05013.1, 2011. a
Bellouin, N., Quaas, J., Gryspeerdt, E., Kinne, S., Stier, P., Watson-Parris, D., Boucher, O., Carslaw, K., Christensen, M., Daniau, A.-L., Dufresne, J.-L., Feingold, G., Fiedler, S., Forster, P., Gettelman, A., Haywood, J. M., Lohmann, U., Malavelle, F., Mauritsen, T., McCoy, D., Myhre, G., Mülmenstädt, J., Neubauer, D., Possner, A., Rugenstein, M., Sato, Y., Schulz, M., Schwartz, S. E., Sourdeval, O., Storelvmo, T., Toll, V., Winker, D., and Stevens, B.: Bounding global aerosol radiative forcing of climate change, Rev. Geophys., 58, e2019RG000 660, https://doi.org/10.1029/2019RG000660, 2020. a, b
Bolton, D.: The Computation of Equivalent Potential Temperature, Mon. Weather Rev., 108, 1046–1053, https://doi.org/10.1175/1520-0493(1980)108<1046:TCOEPT>2.0.CO;2, 1980. a
Bretherton, C. S., Blossey, P. N., and Uchida, J.: Cloud droplet sedimentation, entrainment efficiency, and subtropical stratocumulus albedo, Geophys. Res. Lett., 34, https://doi.org/10.1029/2006GL027648, 2007. a
Charlson, R. J., Schwartz, S. E., Hales, J. M., Cess, R. D., Coakley, J. A., Hansen, J. E., and Hofmann, D. J.: Climate Forcing by Anthropogenic Aerosols, Science, 255, 423–430, https://doi.org/10.1126/science.255.5043.423, 1992. a
Christensen, M. W., Jones, W. K., and Stier, P.: Aerosols enhance cloud lifetime and brightness along the stratus-to-cumulus transition, Proc. Natl. Acad. Sci. USA, 117, 17591–17598, https://doi.org/10.1073/pnas.1921231117, 2020. a
Christensen, M. W., Gettelman, A., Cermak, J., Dagan, G., Diamond, M., Douglas, A., Feingold, G., Glassmeier, F., Goren, T., Grosvenor, D. P., Gryspeerdt, E., Kahn, R., Li, Z., Ma, P.-L., Malavelle, F., McCoy, I. L., McCoy, D. T., McFarquhar, G., Mülmenstädt, J., Pal, S., Possner, A., Povey, A., Quaas, J., Rosenfeld, D., Schmidt, A., Schrödner, R., Sorooshian, A., Stier, P., Toll, V., Watson-Parris, D., Wood, R., Yang, M., and Yuan, T.: Opportunistic experiments to constrain aerosol effective radiative forcing, Atmos. Chem. Phys., 22, 641–674, https://doi.org/10.5194/acp-22-641-2022, 2022. a
Costa-Surós, M., Sourdeval, O., Acquistapace, C., Baars, H., Carbajal Henken, C., Genz, C., Hesemann, J., Jimenez, C., König, M., Kretzschmar, J., Madenach, N., Meyer, C. I., Schrödner, R., Seifert, P., Senf, F., Brueck, M., Cioni, G., Engels, J. F., Fieg, K., Gorges, K., Heinze, R., Siligam, P. K., Burkhardt, U., Crewell, S., Hoose, C., Seifert, A., Tegen, I., and Quaas, J.: Detection and attribution of aerosol–cloud interactions in large-domain large-eddy simulations with the ICOsahedral Non-hydrostatic model, Atmos. Chem. Phys., 20, 5657–5678, https://doi.org/10.5194/acp-20-5657-2020, 2020. a, b, c, d, e, f, g
Dipankar, A., Stevens, B., Heinze, R., Moseley, C., Zn̈gl, G., Giorgetta, M., and Brdar, S.: Large eddy simulation using the general circulation model ICON, J. Adv. Model. Earth Syst., 7, 963–986, https://doi.org/10.1002/2015MS000431, 2015. a, b, c
Dipu, S., Schwarz, M., Ekman, A. M. L., Gryspeerdt, E., Goren, T., Sourdeval, O., Mülmenstädt, J., and Quaas, J.: Exploring Satellite-Derived Relationships between Cloud Droplet Number Concentration and Liquid Water Path Using a Large-Domain Large-Eddy Simulation, Tellus B, https://doi.org/10.16993/tellusb.27, 2022. a, b, c, d, e, f
Fons, E., Runge, J., Neubauer, D., and Lohmann, U.: Stratocumulus adjustments to aerosol perturbations disentangled with a causal approach, npj Clim. Atmos. Sci., 6, 130, https://doi.org/10.1038/s41612-023-00452-w, 2023. a, b
Forster, P., Storelvmo, T., Armour, K., Collins, W., Dufresne, J. L., Frame, D., Lunt, D., Mauritsen, T., Palmer, M., Watanabe, M., Wild, M., and Zhang, H.: The Earth's Energy Budget, Climate Feedbacks, and Climate Sensitivity. In Climate Change 2021: The Physical Science Basis. Contribution of Working Group I to the Sixth Assessment Report of the Intergovernmental Panel on Climate Change, edited by: Masson-Delmotte, V., et al., Cambridge University Press, Cambridge, United Kingdom and New York, NY, USA, 923–1054, https://doi.org/10.1017/9781009157896.009, 2021. a
Forster, P. M., Forster, H. I., Evans, M. J., Gidden, M. J., Jones, C. D., Keller, C. A., Lamboll, R. D., Quéré, C. L., Rogelj, J., Rosen, D., Schleussner, C.-F., Richardson, T. B., Smith, C. J., and Turnock, S. T.: Current and future global climate impacts resulting from COVID-19, Nat. Clim. Chang., 10, 913–919, https://doi.org/10.1038/s41558-020-0883-0, 2020. a
Genz, C., Schrödner, R., Heinold, B., Henning, S., Baars, H., Spindler, G., and Tegen, I.: Estimation of cloud condensation nuclei number concentrations and comparison to in situ and lidar observations during the HOPE experiments, Atmos. Chem. Phys., 20, 8787–8806, https://doi.org/10.5194/acp-20-8787-2020, 2020. a
Glassmeier, F., Hoffmann, F., Johnson, J. S., Yamaguchi, T., Carslaw, K. S., and Feingold, G.: Aerosol-cloud-climate cooling overestimated by ship-track data, Science, 371, 485–489, https://doi.org/10.1126/science.abd3980, 2021. a, b, c, d, e
Goren, T., Choudhury, G., Kretzschmar, J., and McCoy, I.: Co-variability drives the inverted-V sensitivity between liquid water path and droplet concentrations, Atmos. Chem. Phys., 25, 3413–3423, https://doi.org/10.5194/acp-25-3413-2025, 2025. a
Grosvenor, D. P., Sourdeval, O., Zuidema, P., Ackerman, A., Alexandrov, M. D., Bennartz, R., Boers, R., Cairns, B., Chiu, J. C., Christensen, M., Deneke, H., Diamond, M., Feingold, G., Fridlind, A., Hünerbein, A., Knist, C., Kollias, P., Marshak, A., McCoy, D., Merk, D., Painemal, D., Rausch, J., Rosenfeld, D., Russchenberg, H., Seifert, P., Sinclair, K., Stier, P., van Diedenhoven, B., Wendisch, M., Werner, F., Wood, R., Zhang, Z., and Quaas, J.: Remote Sensing of Droplet Number Concentration in Warm Clouds: A Review of the Current State of Knowledge and Perspectives, Rev. Geophys., 56, 409–453, https://doi.org/10.1029/2017RG000593, 2018. a
Gryspeerdt, E., Quaas, J., and Bellouin, N.: Constraining the aerosol influence on cloud fraction, J. Geophys. Res. Atmos., 121, 3566–3583, https://doi.org/10.1002/2015JD023744, 2016. a
Gryspeerdt, E., Goren, T., Sourdeval, O., Quaas, J., Mülmenstädt, J., Dipu, S., Unglaub, C., Gettelman, A., and Christensen, M.: Constraining the aerosol influence on cloud liquid water path, Atmos. Chem. Phys., 19, 5331–5347, https://doi.org/10.5194/acp-19-5331-2019, 2019. a, b, c, d, e, f
Gryspeerdt, E., Mülmenstädt, J., Gettelman, A., Malavelle, F. F., Morrison, H., Neubauer, D., Partridge, D. G., Stier, P., Takemura, T., Wang, H., Wang, M., and Zhang, K.: Surprising similarities in model and observational aerosol radiative forcing estimates, Atmos. Chem. Phys., 20, 613–623, https://doi.org/10.5194/acp-20-613-2020, 2020. a
Gryspeerdt, E., Goren, T., and Smith, T. W. P.: Observing the timescales of aerosol–cloud interactions in snapshot satellite images, Atmos. Chem. Phys., 21, 6093–6109, https://doi.org/10.5194/acp-21-6093-2021, 2021. a
Heinze, R., Dipankar, A., Henken, C. C., Moseley, C., Sourdeval, O., Trömel, S., Xie, X., Adamidis, P., Ament, F., Baars, H., Barthlott, C., Behrendt, A., Blahak, U., Bley, S., Brdar, S., Brueck, M., Crewell, S., Deneke, H., Di Girolamo, P., Evaristo, R., Fischer, J., Frank, C., Friederichs, P., Göcke, T., Gorges, K., Hande, L., Hanke, M., Hansen, A., Hege, H.-C., Hoose, C., Jahns, T., Kalthoff, N., Klocke, D., Kneifel, S., Knippertz, P., Kuhn, A., van Laar, T., Macke, A., Maurer, V., Mayer, B., Meyer, C. I., Muppa, S. K., Neggers, R. A. J., Orlandi, E., Pantillon, F., Pospichal, B., Röber, N., Scheck, L., Seifert, A., Seifert, P., Senf, F., Siligam, P., Simmer, C., Steinke, S., Stevens, B., Wapler, K., Weniger, M., Wulfmeyer, V., Zängl, G., Zhang, D., and Quaas, J.: Large-eddy simulations over Germany using ICON: a comprehensive evaluation, Q. J. R. Meteorol. Soc., 143, 69–100, https://doi.org/10.1002/qj.2947, 2017. a, b, c, d, e
Hill, A. A., Feingold, G., and Jiang, H.: The Influence of Entrainment and Mixing Assumption on Aerosol–Cloud Interactions in Marine Stratocumulus, J. Atmos. Sci., 66, 1450–1464, https://doi.org/10.1175/2008JAS2909.1, 2009. a
Keshtgar, B., Voigt, A., Hoose, C., Riemer, M., and Mayer, B.: Cloud-radiative impact on the dynamics and predictability of an idealized extratropical cyclone, Weather Clim. Dynam., 4, 115–132, https://doi.org/10.5194/wcd-4-115-2023, 2023. a
Kogan, Y. L. and Martin, W. J.: Parameterization of Bulk Condensation in Numerical Cloud Models, J. Atmos. Sci., 51, 1728–1739, https://doi.org/10.1175/1520-0469(1994)051<1728:POBCIN>2.0.CO;2, 1994. a
Lee, S. S., Penner, J. E., and Saleeby, S. M.: Aerosol effects on liquid-water path of thin stratocumulus clouds, J. Geophys. Res. Atmos., 114, https://doi.org/10.1029/2008JD010513, 2009. a
Lilly, D. K.: On the numerical simulation of buoyant convection, Tellus, 14, 148–172, https://doi.org/10.1111/j.2153-3490.1962.tb00128.x, 1962. a
Löhnert, U., Schween, J. H., Acquistapace, C., Ebell, K., Maahn, M., Barrera-Verdejo, M., Hirsikko, A., Bohn, B., Knaps, A., O’Connor, E., Simmer, C., Wahner, A., and Crewell, S.: JOYCE: Jülich Observatory for Cloud Evolution, Bull. Amer. Meteor. Soc., 96, 1157–1174, https://doi.org/10.1175/BAMS-D-14-00105.1, 2015. a
Madhavan, B. L., Kalisch, J., and Macke, A.: Shortwave surface radiation network for observing small-scale cloud inhomogeneity fields, Atmos. Meas. Tech., 9, 1153–1166, https://doi.org/10.5194/amt-9-1153-2016, 2016. a
Malavelle, F. F., Haywood, J. M., Jones, A., Gettelman, A., Clarisse, L., Bauduin, S., Allan, R. P., Karset, I. H. H., Kristjánsson, J. E., Oreopoulos, L., Cho, N., Lee, D., Bellouin, N., Boucher, O., Grosvenor, D. P., Carslaw, K. S., Dhomse, S., Mann, G. W., Schmidt, A., Coe, H., Hartley, M. E., Dalvi, M., Hill, A. A., Johnson, B. T., Johnson, C. E., Knight, J. R., O'Connor, F. M., Partridge, D. G., Stier, P., Myhre, G., Platnick, S., Stephens, G. L., Takahashi, H., and Thordarson, T.: Strong constraints on aerosol–cloud interactions from volcanic eruptions, Nature, 546, 485–491, https://doi.org/10.1038/nature22974, 2017. a
Mülmenstädt, J. and Feingold, G.: The Radiative Forcing of Aerosol-Cloud Interactions in Liquid Clouds: Wrestling and Embracing Uncertainty, Curr. Clim. Chang. Rep., 4, 23–40, https://doi.org/10.1007/s40641-018-0089-y, 2018. a, b
Mülmenstädt, J., Gryspeerdt, E., Dipu, S., Quaas, J., Ackerman, A. S., Fridlind, A. M., Tornow, F., Bauer, S. E., Gettelman, A., Ming, Y., Zheng, Y., Ma, P.-L., Wang, H., Zhang, K., Christensen, M. W., Varble, A. C., Leung, L. R., Liu, X., Neubauer, D., Partridge, D. G., Stier, P., and Takemura, T.: General circulation models simulate negative liquid water path–droplet number correlations, but anthropogenic aerosols still increase simulated liquid water path, Atmos. Chem. Phys., 24, 7331–7345, https://doi.org/10.5194/acp-24-7331-2024, 2024a. a
Mülmenstädt, J., Gryspeerdt, E., Dipu, S., Quaas, J., Ackerman, A. S., Fridlind, A. M., Tornow, F., Bauer, S. E., Gettelman, A., Ming, Y., Zheng, Y., Ma, P.-L., Wang, H., Zhang, K., Christensen, M. W., Varble, A. C., Leung, L. R., Liu, X., Neubauer, D., Partridge, D. G., Stier, P., and Takemura, T.: General circulation models simulate negative liquid water path–droplet number correlations, but anthropogenic aerosols still increase simulated liquid water path, Atmos. Chem. Phys., 24, 7331–7345, https://doi.org/10.5194/acp-24-7331-2024, 2024b. a
Possner, A., Eastman, R., Bender, F., and Glassmeier, F.: Deconvolution of boundary layer depth and aerosol constraints on cloud water path in subtropical stratocumulus decks, Atmos. Chem. Phys., 20, 3609–3621, https://doi.org/10.5194/acp-20-3609-2020, 2020. a, b
Quaas, J., Boucher, O., Bellouin, N., and Kinne, S.: Satellite-based estimate of the direct and indirect aerosol climate forcing, J. Geophys. Res. Atmos., 113, https://doi.org/10.1029/2007JD008962, 2008. a
Quaas, J., Arola, A., Cairns, B., Christensen, M., Deneke, H., Ekman, A. M. L., Feingold, G., Fridlind, A., Gryspeerdt, E., Hasekamp, O., Li, Z., Lipponen, A., Ma, P.-L., Mülmenstädt, J., Nenes, A., Penner, J. E., Rosenfeld, D., Schrödner, R., Sinclair, K., Sourdeval, O., Stier, P., Tesche, M., van Diedenhoven, B., and Wendisch, M.: Constraining the Twomey effect from satellite observations: issues and perspectives, Atmos. Chem. Phys., 20, 15079–15099, https://doi.org/10.5194/acp-20-15079-2020, 2020a. a
Quaas, J., Arola, A., Cairns, B., Christensen, M., Deneke, H., Ekman, A. M. L., Feingold, G., Fridlind, A., Gryspeerdt, E., Hasekamp, O., Li, Z., Lipponen, A., Ma, P.-L., Mülmenstädt, J., Nenes, A., Penner, J. E., Rosenfeld, D., Schrödner, R., Sinclair, K., Sourdeval, O., Stier, P., Tesche, M., van Diedenhoven, B., and Wendisch, M.: Constraining the Twomey effect from satellite observations: issues and perspectives, Atmos. Chem. Phys., 20, 15079–15099, https://doi.org/10.5194/acp-20-15079-2020, 2020. a
Quaas, J., Andrews, T., Bellouin, N., Block, K., Boucher, O., Ceppi, P., Dagan, G., Doktorowski, S., Eichholz, H. M., Forster, P., Goren, T., Gryspeerdt, E., Hodnebrog, Ø., Jia, H., Kramer, R., Lange, C., Maycock, A. C., Mülmenstädt, J., Myhre, G., O’Connor, F. M., Pincus, R., Samset, B. H., Senf, F., Shine, K. P., Smith, C., Stjern, C. W., Takemura, T., Toll, V., and Wall, C. J.: Adjustments to Climate Perturbations–Mechanisms, Implications, Observational Constraints, AGU Advances, 5, e2023AV001144, https://doi.org/10.1029/2023AV001144, 2024. a
Seifert, A. and Beheng, K. D.: A two-moment cloud microphysics parameterization for mixed-phase clouds. Part 1: Model description, Meteorol. Atmos. Phys., 92, 45–66, https://doi.org/10.1007/s00703-005-0112-4, 2006. a, b
Smalley, K. M., Lebsock, M. D., and Eastman, R.: Diurnal Patterns in the Observed Cloud Liquid Water Path Response to Droplet Number Perturbations, Geophys. Res. Lett., 51, e2023GL107323, https://doi.org/10.1029/2023GL107323, 2024. a
Smith, S. J., van Aardenne, J., Klimont, Z., Andres, R. J., Volke, A., and Delgado Arias, S.: Anthropogenic sulfur dioxide emissions: 1850–2005, Atmos. Chem. Phys., 11, 1101–1116, https://doi.org/10.5194/acp-11-1101-2011, 2011. a
Toledo, F., Haeffelin, M., Wærsted, E., and Dupont, J.-C.: A new conceptual model for adiabatic fog, Atmos. Chem. Phys., 21, 13099–13117, https://doi.org/10.5194/acp-21-13099-2021, 2021. a
Toll, V., Christensen, M., Quaas, J., and Bellouin, N.: Weak average liquid-cloud-water response to anthropogenic aerosols, Nature, 572, 51–55, https://doi.org/10.1038/s41586-019-1423-9, 2019. a
Twomey, S.: Pollution and the planetary albedo, Atmos. Environ., 8, 1251–1256, https://doi.org/10.1016/0004-6981(74)90004-3, 1974. a
Wang, H., Rasch, P. J., and Feingold, G.: Manipulating marine stratocumulus cloud amount and albedo: a process-modelling study of aerosol-cloud-precipitation interactions in response to injection of cloud condensation nuclei, Atmos. Chem. Phys., 11, 4237–4249, https://doi.org/10.5194/acp-11-4237-2011, 2011. a
Wang, S., Wang, Q., and Feingold, G.: Turbulence, Condensation, and Liquid Water Transport in Numerically Simulated Nonprecipitating Stratocumulus Clouds, J. Atmos. Sci., 60, 262–278, https://doi.org/10.1175/1520-0469(2003)060<0262:TCALWT>2.0.CO;2, 2003. a
Williams, A. S. and Igel, A. L.: Cloud Top Radiative Cooling Rate Drives Non-Precipitating Stratiform Cloud Responses to Aerosol Concentration, Geophys. Res. Lett., 48, e2021GL094740, https://doi.org/10.1029/2021GL094740, 2021. a
Wolke, R., Knoth, O., Hellmuth, O., Schröder, W., and Renner, E.: The parallel model system LM-MUSCAT for chemistry-transport simulations: Coupling scheme, parallelization and applications, in: Parallel Computing, edited by Joubert, G., Nagel, W., Peters, F., and Walter, W., vol. 13 of Advances in Parallel Computing, pp. 363–369, North-Holland, https://doi.org/10.1016/S0927-5452(04)80048-0, 2004. a
Wolke, R., Schröder, W., Schrödner, R., and Renner, E.: Influence of grid resolution and meteorological forcing on simulated European air quality: A sensitivity study with the modeling system COSMO–MUSCAT, Atmos. Environ., 53, 110–130, https://doi.org/10.1016/j.atmosenv.2012.02.085, 2012. a
Wood, R.: Stratocumulus Clouds, Mon. Weather Rev., 140, 2373–2423, https://doi.org/10.1175/MWR-D-11-00121.1, 2012. a
Yanai, M., Esbensen, S., and Chu, J.-H.: Determination of Bulk Properties of Tropical Cloud Clusters from Large-Scale Heat and Moisture Budgets, J. Atmos. Sci., 30, 611–627, https://doi.org/10.1175/1520-0469(1973)030<0611:DOBPOT>2.0.CO;2, 1973. a
Zängl, G., Reinert, D., Rípodas, P., and Baldauf, M.: The ICON (ICOsahedral Non-hydrostatic) modelling framework of DWD and MPI-M: Description of the non-hydrostatic dynamical core, Q. J. R. Meteorol. Soc., 141, 563–579, https://doi.org/10.1002/qj.2378, 2015. a
Zhang, J., Zhou, X., Goren, T., and Feingold, G.: Albedo susceptibility of northeastern Pacific stratocumulus: the role of covarying meteorological conditions, Atmos. Chem. Phys., 22, 861–880, https://doi.org/10.5194/acp-22-861-2022, 2022. a