the Creative Commons Attribution 4.0 License.
the Creative Commons Attribution 4.0 License.
 | 05 Jun 2026
Comparing secondary organic aerosols schemes implemented in current chemical transport models and the policy implications of uncertainties
Ling Huang
Benjie Chen
Zi'ang Wu
Katie Tuite
Pradeepa Vennam
Secondary organic aerosol (SOA) constitutes a major component of fine particulate matter (PM2.5) that models must account for to assess how human activities influence air quality, climate, and public health. We characterize the current state of SOA modeling by analyzing eight SOA schemes implemented in five widely used air quality models: CAMx, CMAQ, GEOS-Chem, WRF-Chem and CHIMERE. We performed offline calculations to compare non-aged SOA yields, the effects of SOA aging processes, and the influence of NOx conditions on yields. Our objective is to understand variation rather than to identify a superior scheme. We find significant discrepancies in SOA yields with the ratio of maximum to minimum non-aged yield spans from 1.8 to over 1000, depending upon precursor. The impact of nitrogen oxide (NOx) conditions on SOA yields is also highly variable among schemes. While some schemes include SOA aging, their treatments differ substantially, with some schemes showing large increases in SOA mass, while others exhibit minimal changes. Box model simulations confirmed the substantial discrepancies in predicted SOA concentrations and their responses to precursor emission changes. The substantial differences among current SOA schemes highlight a lack of consensus within the air quality modelling community. Evaluating model simulation results using ambient measurements is unlikely to resolve these discrepancies because uncertainties in SOA formation and precursor emissions are deeply intertwined. The limitations of current SOA schemes should be recognized and acknowledged because model choice can greatly influence predicted SOA concentrations and their evolution, ultimately impacting air quality forecasts, assessments, and regulatory decisions.
- Article
(1854 KB) - Full-text XML
-
Supplement
(1149 KB) - BibTeX
- EndNote


Organic Aerosol (OA) contributes a large fraction of fine particulate matter (PM2.5) due to primary OA emissions (POA) and the formation of secondary OA (SOA) from anthropogenic, biogenic, and biomass burning sources (Donahue et al., 2006; Huang et al., 2014; Tsimpidi et al., 2016). SOA precursor emissions include traditional volatile organic compounds (VOC) as well as non-traditional intermediate and semi-volatile VOC (IVOC and SVOC, respectively) whereas POA are directly emitted from combustion sources. Recent studies report that volatile chemical products (VCPs) are increasingly important contributors to SOA formation (Pennington et al., 2021; Sasidharan et al., 2023). Chemical transport models (CTMs) are essential tools for understanding the sources and transport of OA as well as assessing the effectiveness of mitigation strategies (e.g. Pye et al., 2021; Chang et al., 2022; Chen et al., 2024; Pennington et al., 2024; Vitali et al., 2024). However, accurately modeling SOA formation in CTMs has posed persistent challenges due to the intricate nature of SOA formation processes (Li et al., 2023). Scientific understanding of SOA formation pathways is continuously evolving. Therefore, it is crucial to review the state of science on SOA formation implemented in different CTMs and identify existing knowledge gaps.
In general, CTMs adopt one of two approaches for SOA simulation: the two-product scheme (Fig. 1) or the volatility basis set (VBS) scheme (Fig. 2a). Two-product schemes apply the absorptive gas-particle partitioning theory of Pankow (1994) using only two surrogate products to represent all of the condensable gases (CGs) formed when SOA precursors are oxidized in the gas phase by OH radical, ozone (O3), or NO3 radical, e.g.:
where CG1 and CG2 have different saturation concentration (C*); α1 and α2 are molar stoichiometric yields. The α and C* values for CG1 and CG2 are fitted to SOA formation observed in chamber experiments. SOA formation depends on the total amount of OA present (Pankow, 1994) and consequently SOA formation depends on POA. POA is usually treated as non-volatile in two-product schemes (e.g., Strader et al., 1999; Schell et al., 2001) but can be treated as semi-volatile in a modified two-product scheme (e.g. Huang et al., 2024).
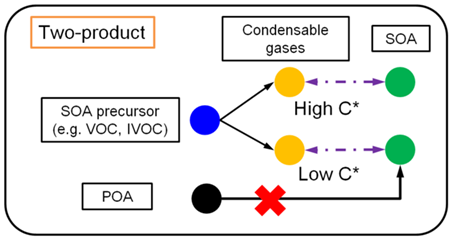
Figure 1Illustration of a “two-product” SOA scheme combined with a non-volatile treatment of POA.
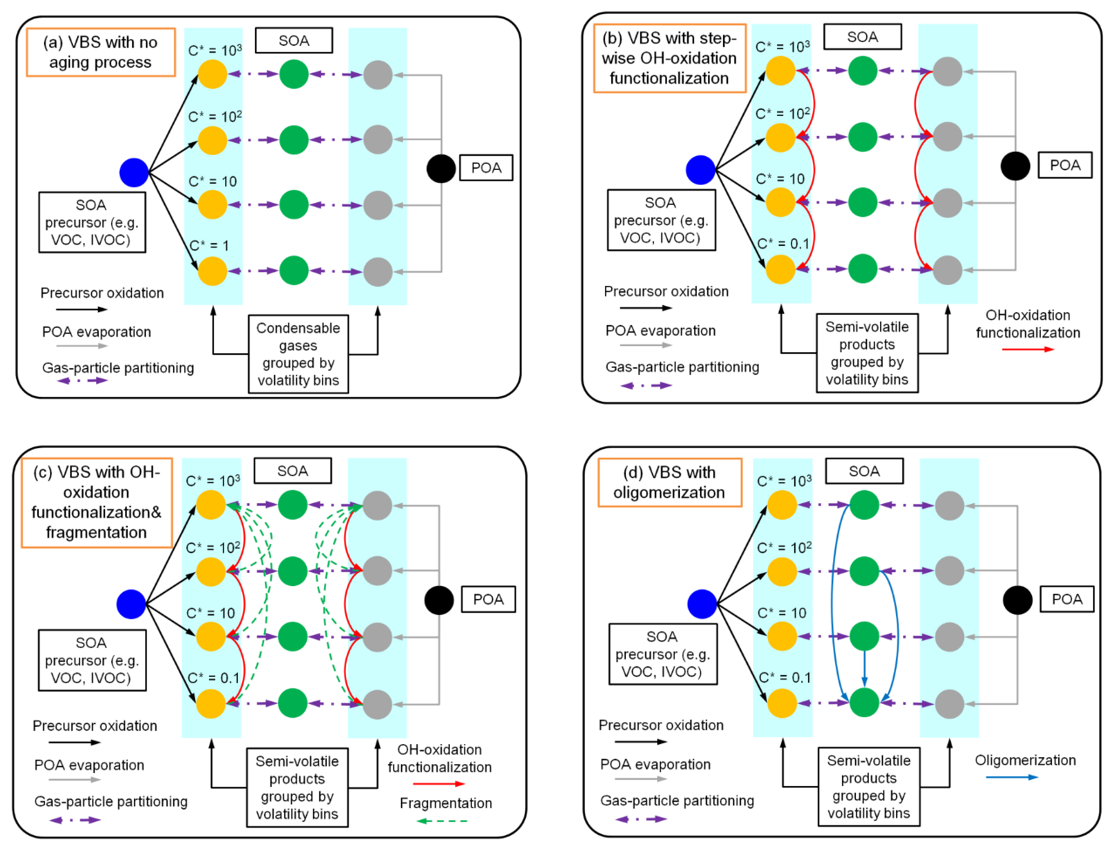
Figure 2Illustration of VBS schemes with alternative treatments of aging: (a) no aging; (b) with step-wise OH oxidation causing functionalization only; (c) with OH-oxidation causing both functionalization and fragmentation; and (d) with condensed-phase oligomerization.
The VBS framework (Donahue et al., 2006) expands the two-product model by having more condensable gases that are systematically organized by volatility (i.e., C*). Condensable organic compounds are categorized based on their volatility into bins that are typically separated by a factor of 10, e.g., four bin with C* of 1, 10, 100, 1000 µg m−3:
Similar to the two-product model, the VBS framework is based on the absorptive partitioning theory and the CG yield (α) for each volatility bin can be obtained by fitting the results of laboratory studies. Many VBS schemes treat POA as being semi-volatile and able to dynamically partition between the gas and particle phase depending on environmental factors, similar to SOA. Figure 2 illustrates the “1-dimensional” (1-D) VBS framework where volatility is the dimension that varies (discretized to volatility bins) and panels (a)–(d) illustrate various treatments of SOA aging. In the 2-D VBS introduced by Donahue et al. (2011), both volatility and oxidation state can vary independently. The 1.5-D VBS introduced by Koo et al. (2014) represents variations in volatility and oxidation state as a single coordinate by assuming they are related.
Figure 2a depicts a four-bin VBS framework with no aging of OA after the initial formation of SOA. Emitted SOA precursors (e.g., VOC, IVOC) undergo initial gas-phase oxidation and produce four types of CGs which can immediately condense to form SOA. Beyond initial oxidation, multi-generational aging processes can occur and include functionalization and/or fragmentation of gas-phase CGs, oligomerization of condensed-phase SOA, SOA photolysis, and heterogeneous SOA oxidation. Functionalization and oligomerization typically increase SOA mass by lowering volatility, whereas fragmentation and photolysis decrease SOA mass. Figure 2b depicts a VBS framework incorporating a step-wise OH-oxidation functionalization process as included in many VBS schemes, where CGs undergo gas-phase reactions (usually parameterized as OH-oxidation) that add oxygen-containing functional groups and successively lower volatility. This functionalization increases molecular weight with each oxidation generation, which can be parameterized as a percentage increase (usually 7.5 % or 15 %) to account for added oxygen (Robinson et al., 2007; Shrivastava et al., 2015). Gas-phase reactions of CGs can cause molecular fragmentation as well as functionalization. As SOA ages, fragmentation reactions may gain significance (Cappa and Wilson, 2012). Figure 2c shows a VBS framework with both functionalization and fragmentation. In this scheme, OH-oxidation of the CGs forms products across lower (due to functionalization) and higher (due to fragmentation) volatility bins that are often parameterized using predefined fractions. Particle-phase oligomerization, as illustrated by Fig. 2d, is another SOA aging process where condensed SOA molecules join together and form larger SOA molecules with extremely low volatility. Some schemes refer to oligomerization as polymerization. Typically, the rate of oligomerization is modeled as independent of the gas-phase oxidant level.
Given the diverse treatments of SOA formation employed in CTMs, it is both necessary and important to comprehensively understand and quantify the similarities and differences among schemes/models. Direct comparisons of simulated SOA concentrations across different CTMs can be both time-consuming and resource-intensive. Furthermore, variations in other model configurations, such as physical processes, may obscure the distinctions associated with the SOA schemes themselves. To address this issue, we performed offline calculations outside the selected CTMs to focus on SOA formation and aging processes, as described in Sect. 2. Details of each SOA model/scheme reviewed are presented in Sect. 3. Section 4 provides a comparative analysis of the non-aged SOA yields from typical precursors as simulated by each model/scheme. Furthermore, we explore how SOA aging is treated by different schemes and how NOx conditions impact SOA yields. Results from this study underscore the variability in SOA yields and highlight the need for careful consideration of model selection and application in the context of air quality studies.
2.1 CTMs and SOA schemes reviewed
To understand the current state of SOA modelling in CTMs, we reviewed schemes implemented in several regional models that are used in the US, Europe, and Asia as well as one global model. We review eight SOA schemes implemented in five models, namely the Comprehensive Air Quality with Extensions (CAMx, https://www.camx.com/, last access: 15 February 2024), the Community Multiscale Air Quality (CMAQ, https://github.com/USEPA/CMAQ/, last access: 15 February 2024), GEOS-Chem (https://geos-chem.readthedocs.io/en/stable/, last access: 15 February 2024), WRF-Chem (NOAA, 2022, https://www2.acom.ucar.edu/wrf-chem, last access: 30 May 2026), and CHIMERE (https://www.lmd.polytechnique.fr/chimere/docs/, last access: 15 February 2024). For each model/scheme (hereafter “scheme” for simplicity), we reviewed the official documentation (e.g., user's guide), peer-reviewed publications, and, in some cases, the model source code to understand each SOA parameterization and gather parameter data. A comparative overview of the SOA schemes is presented in Table 1 while comprehensive details regarding their specific parameterizations can be found in Sect. S1 of the Supplement.
Table 1Summary of SOA schemes implemented in CTMs reviewed in this study*.
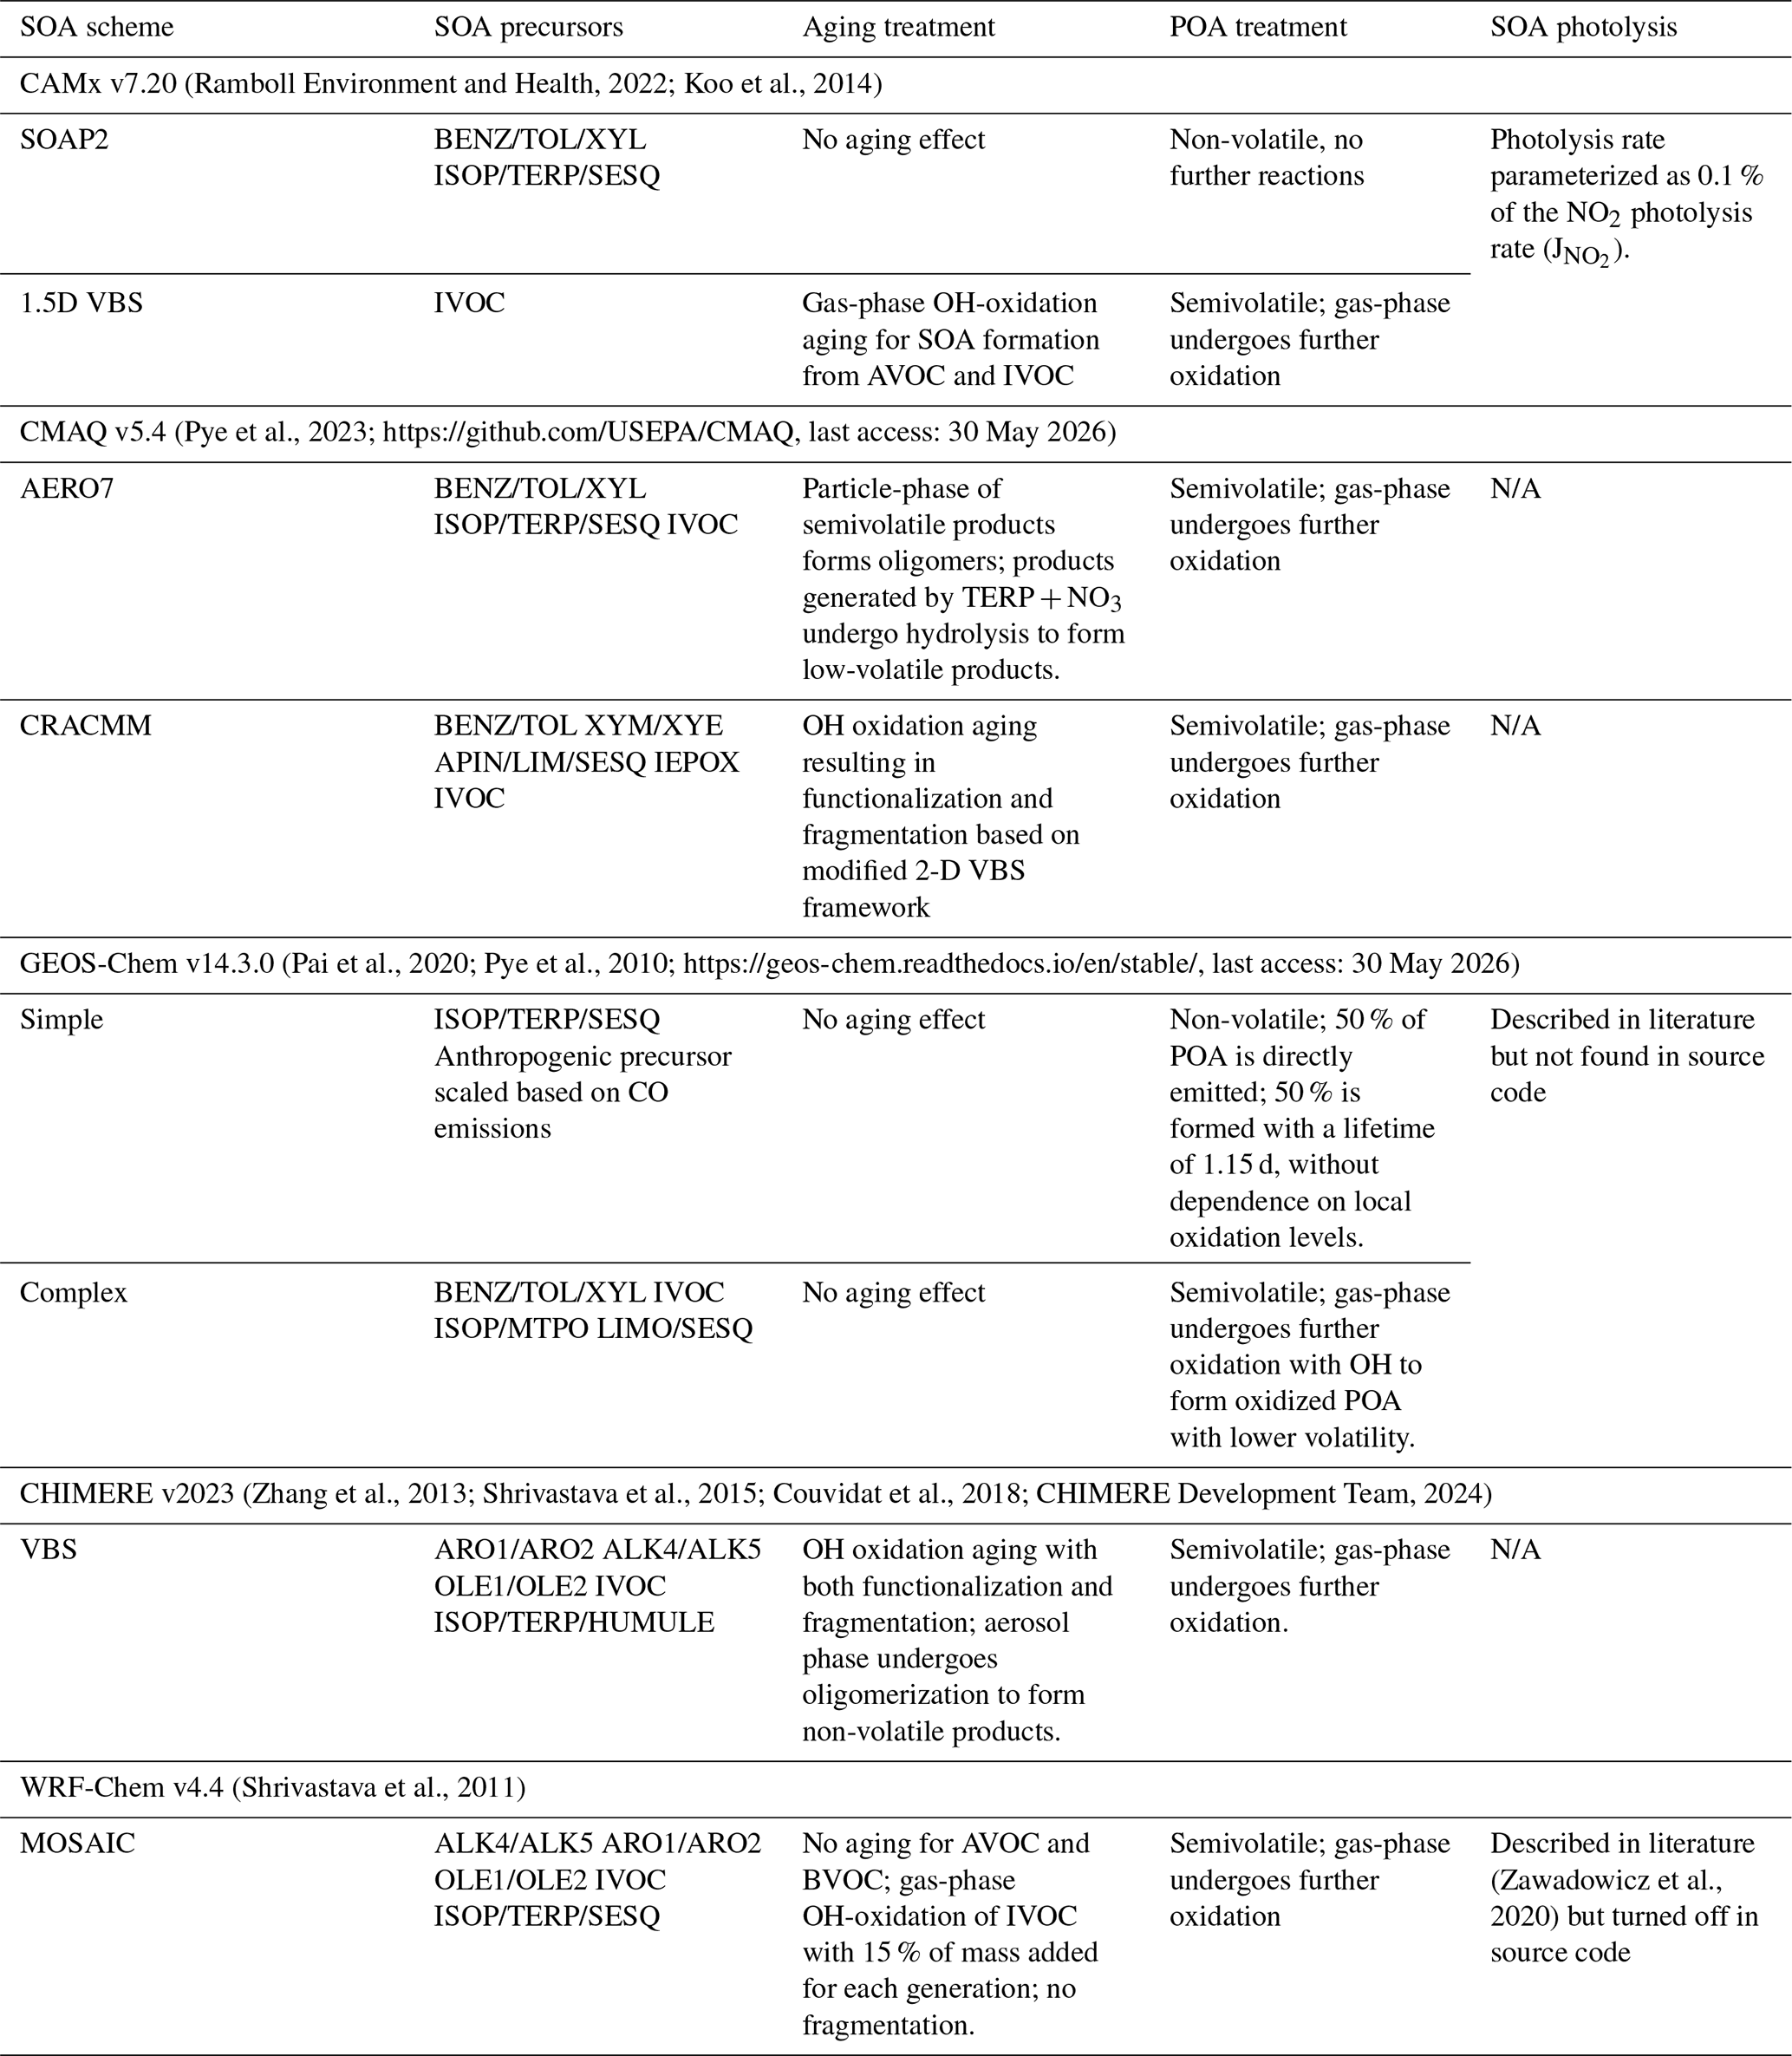
* See abbreviations in Supplement.
The review of these SOA schemes reveals diverse parameterizations ranging from simplified, non-volatile assumptions to complex, multi-dimensional volatility basis sets. CAMx offers two distinct approaches: the SOAP2 scheme (based on Strader et al., 1999) and the 1.5-D VBS (Koo et al., 2014). SOAP2 has non-volatile POA and a two product SOA scheme (Fig. 1) with yields fitted to the aged VBS scheme of Hodzic et al. (2016), effectively treating aging as implicit. The 1.5-D VBS treats POA as semi-volatile and explicitly models gas-phase aging for anthropogenic and intermediate volatility precursors via OH-oxidation (Fig. 2b), although this stepwise aging is disabled for biogenic precursors to prevent aerosol mass overprediction. The CMAQ model also provides alternative schemes: the established AERO7 scheme (Appel et al., 2021) and the newer CRACMM scheme (Pye et al., 2023). AERO7 utilizes a 1-D VBS framework for POA and SOA that incorporates aging primarily through particle-phase processes (Fig. 2d), specifically the oligomerization of anthropogenic and biogenic precursors and the hydrolysis of organic nitrates derived from monoterpenes. CRACMM also utilizes a 1-D VBS framework for POA and SOA and simulates aging through sequential gas-phase oxidation reactions involving functionalization and/or fragmentation (Fig. 2c; Pye et al., 2023). GEOS-Chem includes a “Simple” scheme that treats SOA as non-volatile with fixed yields that are linked to ambient measurements, alongside a “Complex” 1-D VBS scheme without additional aging processes (Fig. 2a; Pai et al., 2020). CHIMERE's 1-D VBS scheme is notable for its comprehensive aging scheme with functionalization, fragmentation, and oligomerization (Fig. 2d) where oxidation products are redistributed across volatility bins (CHIMERE Development Team, 2024). The WRF-Chem MOSAIC scheme employs a 1-D VBS for most VOCs but applies a specific stepwise gas-phase aging mechanism exclusively to IVOCs (Shrivastava et al., 2011).
Despite these structural differences, the schemes share foundational similarities, particularly in the reliance on absorptive partitioning theory by most schemes. With the exception of the GEOS-Chem Simple scheme, which assumes irreversible condensation, all models utilize either a two-product or VBS framework to describe the equilibrium partitioning of semi-volatile organic compounds. However, the treatment of aging remains the most significant source of divergence. Approaches vary from neglecting aging entirely (GEOS-Chem Complex, CAMx SOAP2) to implementing distinct mechanisms such as gas-phase oxidation (CAMx VBS, CMAQ CRACMM) versus particle-phase oligomerization (CMAQ AERO7). Additionally, the representation of IVOCs varies substantially, ranging from omission from the GEOS-Chem Simple scheme, a single lumped IVOC in most schemes, and several lumped IVOCs in the CRACMM scheme.
2.2 Offline calculation of non-aged SOA yields
The direct comparison of simulated SOA concentrations across different schemes through conducting full simulations is time-consuming and uncertain because configuring all models consistently is challenging. Furthermore, differences in the non-SOA physical and chemical processes between models may obscure the distinctions attributable specifically to the SOA schemes themselves. To address this issue, an offline calculation (Huang et al., 2023, 2024) is employed to compare the non-aged SOA yield (i.e., prior to any aging effects) associated with different precursors across various schemes. For a two-product scheme, the non-aged SOA yield (Y) is calculated by combing the gas-particle partitioning theory with the stoichiometric coefficients αi:
where COA is the total ambient concentration of organic compounds (i.e., POA + SOA) and α1, α2, C and C represent the stoichiometric coefficients and the effective saturation concentrations of the above two products, which is obtained by fitting the results of laboratory studies. Similarly, for a four-bin VBS scheme with no aging effects, the SOA yield is calculated as:
where αi is the non-aged oxidation yield for each volatility bin i (). Utilizing either Eq. (1) or Eq. (2), the SOA yields under high- and low-NOx conditions can be determined at 298 K and total OA concentrations ranging from 0.1 to 50 µg m−3, using the stoichiometric coefficients provided by each scheme (see detailed parameters in Sect. S1 of the Supplement).
The non-aged SOA yield Y is always calculated as mass-based in this study while the stoichiometric coefficients αi could either be expressed in mass-base (g g−1) or molar-base (ppm ppm−1). An illustrative calculation is provided in Sect. S2 of the Supplement, with calculation spreadsheet publicly available (see “Data availability” section). The non-aged SOA yields for CMAQ CRACMM are calculated slightly differently (details presented in Sect. S3 of the Supplement), given its special treatment of partially combining gas-phase chemistry and SOA formation. Our analysis included calculations for anthropogenic precursors (benzene, toluene, and xylene), IVOC and biogenic precursors (isoprene, monoterpene, and sesquiterpenes).
2.3 The effect of SOA aging
Some schemes, such as CAMx two-product and GEOS-Chem Simple, do not account for SOA aging while others adopt varying approaches to represent the aging process (for a comprehensive discussion, refer to Sect. 3). For schemes that include aging effects, we calculated the aged SOA yields for each precursor at a given time t by summing over the particle fraction of all the relevant volatility bins (i) using Eq. (3):
where is the particle-phase fraction of each volatility bin (calculated based on Eq. 4) and is the bin total SOA mass (gas-phase + particle-phase) at time t; n is the total number of bins.
For gas-phase OH-oxidation style aging (e.g., Fig. 2b and c), the SOA mass is stepped through time as follows:
The first term on the right hand side is the SOA mass in volatility bin (i) from the previous time step (t−1) multiplied by the fractions that remain after Δt in the particle-phase () and gas-phase (; ) considering OH-oxidation. The second term is the SOA mass gain from OH-oxidation summed across all n volatility bins. Here, is the mass yield coefficient from bin k to bin i and the term is the gas-phase fraction of SOA in bin k oxidized by OH during Δt.
For particle-phase oligomerization-style aging (e.g. Fig. 2d and the CMAQ AERO7 scheme), the aged SOA yield includes the mass of a non-reactive and non-volatile oligomer bin (OLIG) in addition to the semi-volatile bins:
The SOA mass (gas-phase + particle-phase) in each volatility bin (i) steps through time following Eq. (7) and the mass of the non-volatile oligomer bin () grows with mass-transfer from semi-volatile bins according to Eq. (8):
kOLIG is the oligomerization rate and βi is the mass yield coefficient from bin i to the non-volatile bin OLIG.
To compare the aging effects of different schemes, we applied Eqs. (3) to (8) for 1 d of aging with an OH concentration of 3×10⁶ molec. cm−3 with kOH and/or kOLIG for each scheme when applicable. A time step (Δt) of 0.2 h was used. Any additional calculations and assumptions associated with each scheme are further described below.
2.4 Box model tests based on different SOA schemes
We implemented three updated SOA schemes in CAMx and performed 2-layer box modeling of two locations with varied anthropogenic emissions to quantify how differences between schemes can influence predicted SOA concentrations and their response to emission changes. The alternate SOA schemes use the existing CAMx SOAP2 code with updated SOA yield parameters so that model results clearly depend on yield assumptions rather than scheme formulation or coding. Two regions of Texas were selected to capture contrasting emission environments: Dallas-Fort Worth (DFW), a major urban area dominated by anthropogenic emissions (e.g., aromatics and IVOCs), and Tyler (TYL), a rural area in Northeast Texas characterized by high biogenic activity. The box model has a surface layer and a residual layer with time-varying surface layer depth to provide a simple representation of pollutant accumulation, carry-over, and diurnal variation. Simulations were conducted over a 5 d period, utilizing meteorological inputs and initial conditions derived from the Texas Commission on Environmental Quality (TCEQ) 2019 3-D CAMx modeling platform (https://www.tceq.texas.gov/airquality/airmod/data/tx2019, last access: 30 May 2026).
We implemented three new SOA schemes into CAMx that emulate SOA yields produced by the CMAQ AERO7, CMAQ CRACMM and Simple schemes. Each scheme was implemented by updating the yield parameters used by the CAMx SOAP2 scheme. For the CMAQ AERO7 and CRACMM schemes, yield curves were fitted to the respective data (Fig. S3 in the Supplement) for each SOA precursor. These yields were mapped to the volatility bins defined by CAMx SOAP2 to obtain the corresponding molar-based stoichiometric coefficients (Tables S11–S14). Like the GEOS-Chem Simple scheme, the CAMx Simple scheme treats SOA as non-volatile with fixed yields that are based on multi-model averages and work by Seltzer et al. (2021). Detailed descriptions of the fitting procedures, updated Simple yields, and box model configurations are provided in the Sect. S3 of the Supplement.
We further investigate the response of SOA concentrations to varying anthropogenic VOC and NOx emissions by performing a matrix of 100 simulations for each location and SOA scheme. This approach allows for a comparison of scheme performance across a wider range of atmospheric concentrations and VOC NOx ratios. Anthropogenic emissions in the sensitivity runs were based on weekday rates, while the biogenic emissions remained unscaled and varied by date, consistent with the base case simulations. Anthropogenic VOC emissions were scaled from 0.1 to 1.0 (in increments of 0.1), while anthropogenic NOx emissions were scaled from 0 to 9 (in increments of 1) which caused oxidant production to transition between NO-limited and VOC-limited conditions. An additional simulation with a 50 % reduction in NOx emissions was conducted to examine SOA response to NOx abatement, which is a critical consideration for current and future air quality planning.
3.1 Comparison of non-aged SOA yields
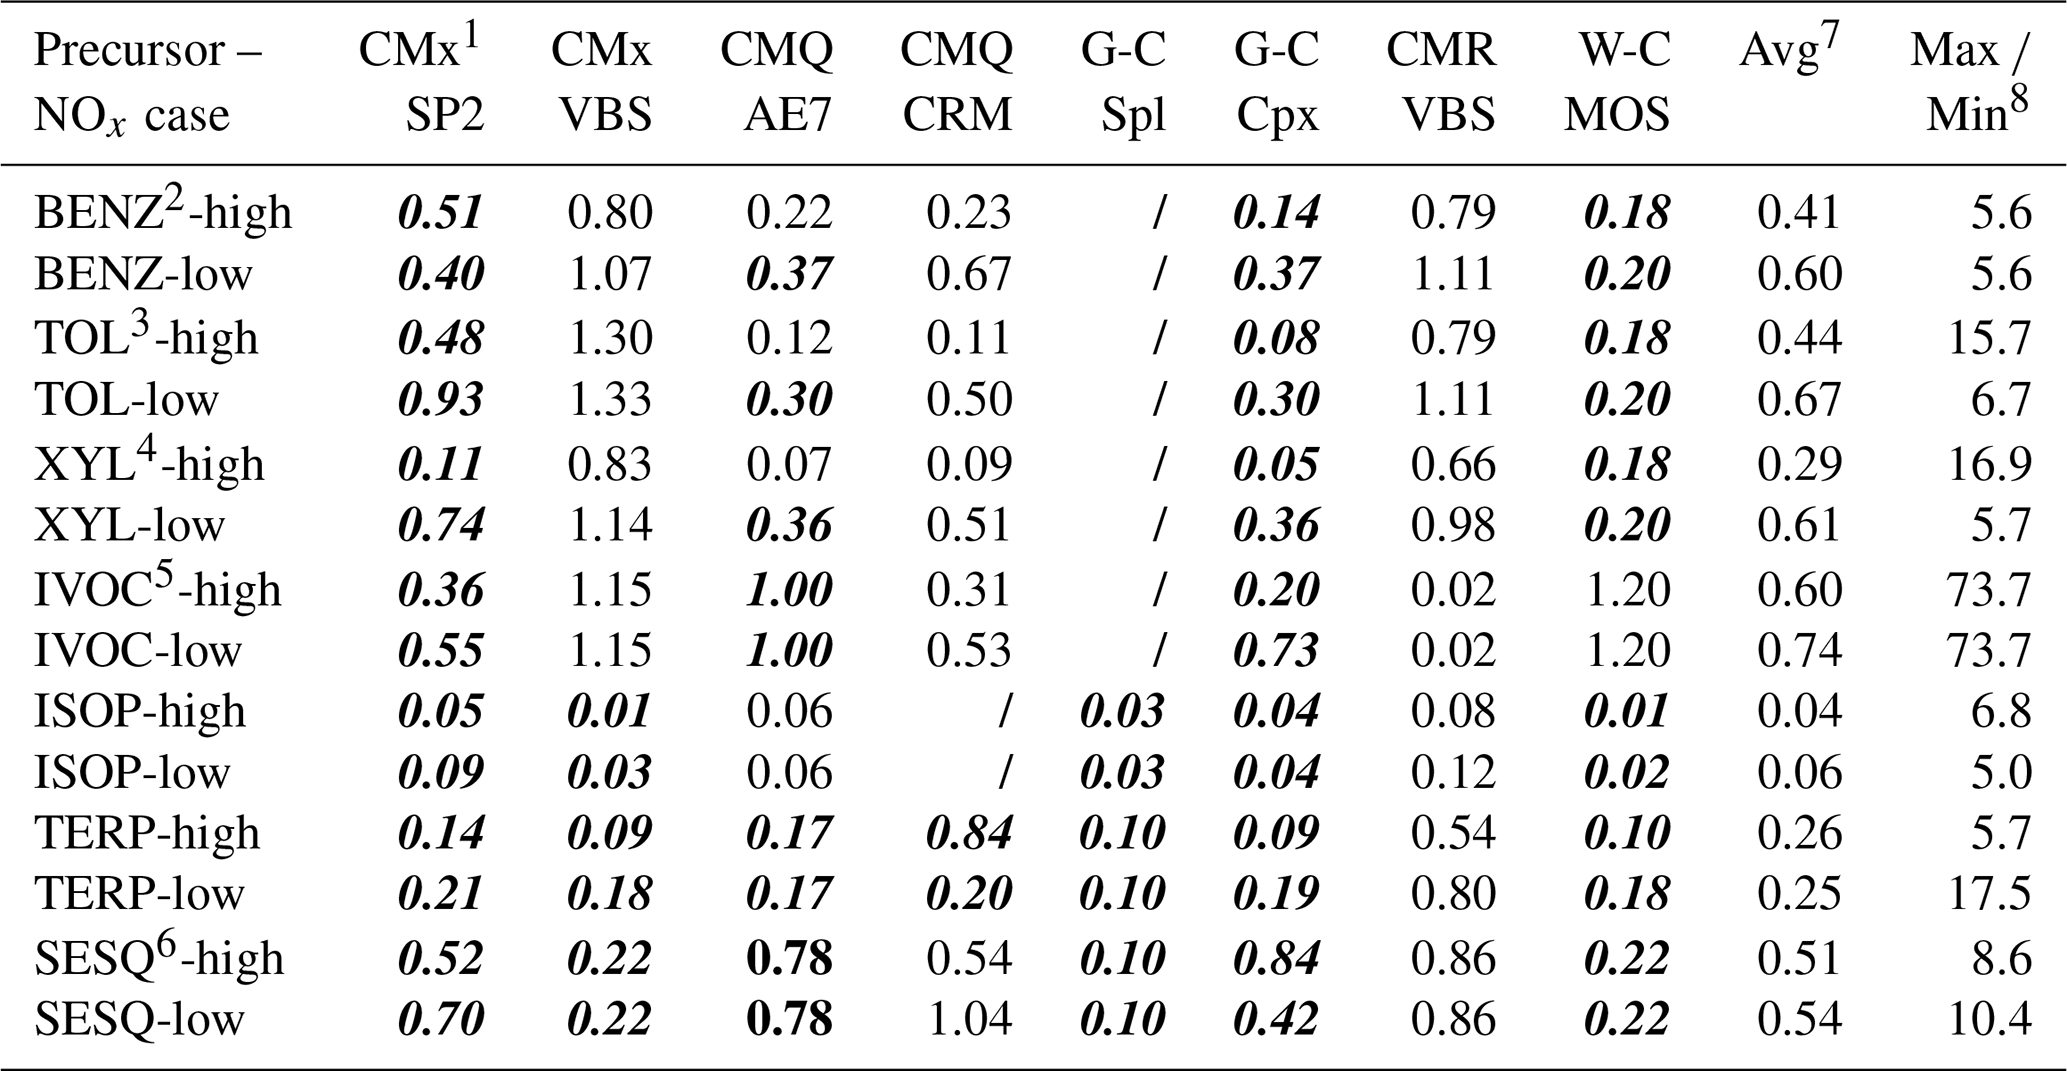
Non-aged SOA mass yields (g g−1) for all schemes (except CMAQ CRACMM) are summarized in Table 2. Non-aged refers to the yields immediately following precursor oxidation and before any subsequent SOA aging process. Since mass yields can vary with COA, we assume COA of 10 µg m−3 in Table 2, which is relevant to ambient air quality and often used as a reference COA for SOA yield comparisons. The ratio of maximum to minimum non-aged SOA yields for a same precursor shows wide variations across different schemes, with the least variation (factor of 1.8) observed for monoterpene at low NOx conditions and over three orders of magnitude for IVOC (factor of 3715). These variations can become greater when COA is either increased or decreased from 10 µg m−3 (as assumed for Table 2) and when effects of aging processes on non-aged yields are included (as shown in Sect. 4.2).
Table 2Non-aged SOA yields (g g−1) for different precursors across schemes at 298 K and COA of 10 µg m−3.
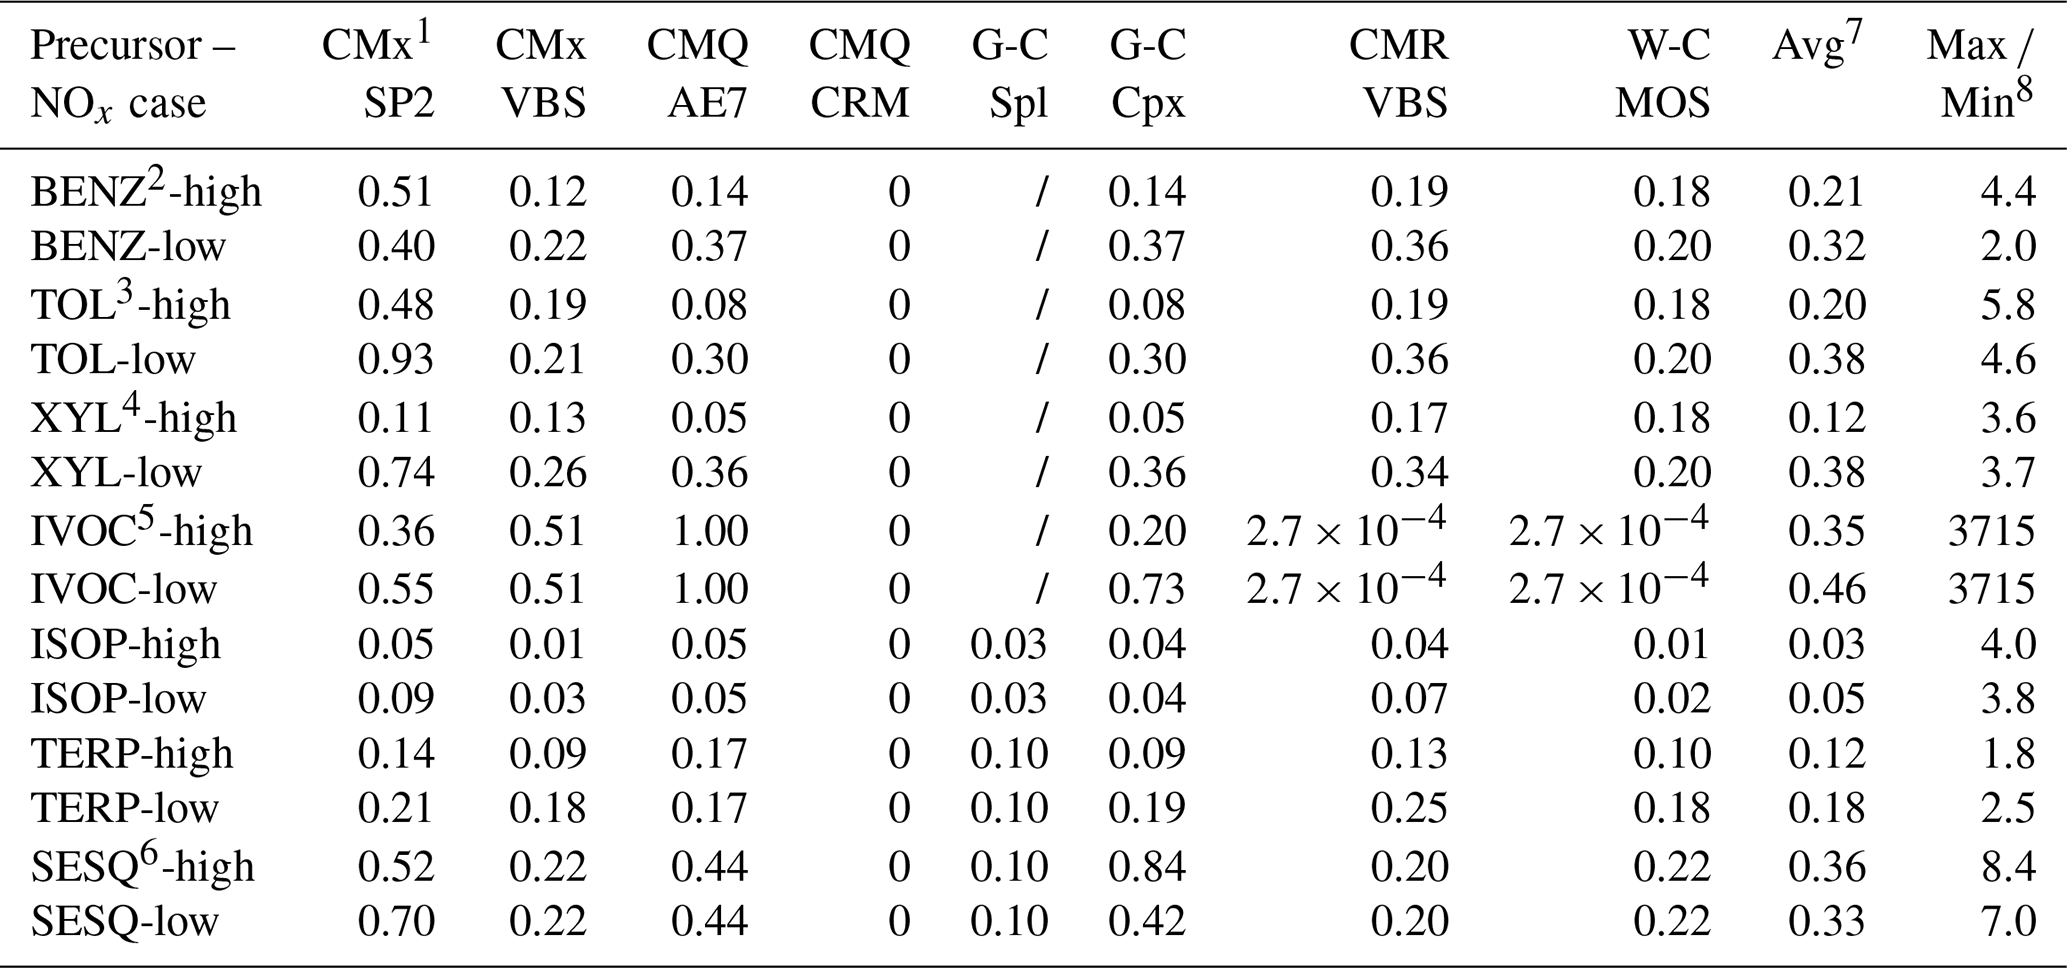
1 Model name abbreviations are CMx for CAMx, CMQ for CMAQ, G-C for GEOS-Chem, CMR for CHIMERE, and W-C for WRF-Chem. Scheme name abbreviations are SP2 for SOAP2, AE7 for AERO7, Spl for Simple, Cpx for Complex, and MOS for MOSAIC.
2 For WRF-Chem and CHIMERE, results for BENZ are based on ARO1.
3 For WRF-Chem and CHIMERE, results for TOL are based on ARO1.
4 For WRF-Chem and CHIMERE, results for XYL are based on ARO2. For CMAQ CRACMM, results for XYL are averages of XYE and XYM.
5 For CMAQ CRACMM, IVOC yields are average of alkane and oxygenated IVOCs (see details in Table S17). For WRF-Chem MOSAIC, IVOC is assumed to have 50 % oxygen.
6 For CHIMERE, results for SESQ are based on humulene.
7 Multi-model average yield excluding GEOS-Chem Simple for aromatics and IVOC, and excluding CRACMM for ISOP.
8 Ratio of maximum to minimum yield.
3.1.1 Non-aged SOA yields from anthropogenic VOC
Figure 3 shows how the non-aged SOA mass yields depend on COA for three anthropogenic VOC (AVOC), namely benzene (BENZ), toluene (TOL), and xylene (XYL). For WRF-Chem and CHIMERE, the SOA yields for model species ARO1 are used to represent BENZ and TOL whereas those of ARO2 are used for XYL. As illustrated by Fig. 3, the SOA yields from aromatics generally increase with COA, except for GEOS-Chem Simple. The SOA yields become independent of COA when the product is treated as non-volatile as exemplified by the GEOS-Chem Simple scheme, which assumes constant SOA yields of 100 % for all three precursors. Conversely, the SOA yields increase strongly with COA when the SOA is treated as semi-volatile. The CAMx SOAP2 scheme is an intermediate case with SOA yields increasing more gradually with COA than the CHIMERE scheme. CMAQ AERO7 and GEOS-Chem Complex predict almost identical SOA yields (due to close stoichiometric coefficients) and exhibit no dependence on COA under low NOx conditions. Overall, schemes consistently show higher ASOA yields from aromatics under low NOx than high NOx conditions but diverge in the magnitude of these yields (max. min. yields at 10 µg m−3 ranging from 2.0 to 5.8) and diverge in how yields depend on COA (ranging from independent to strongly increasing).
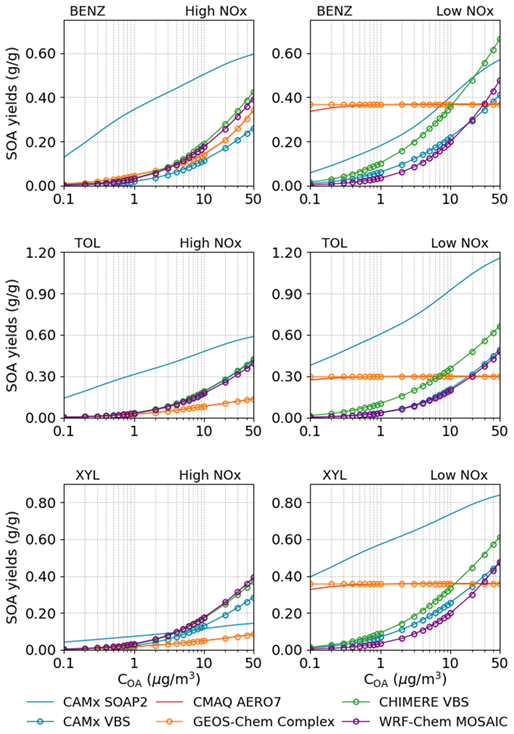
Figure 3Comparison of the non-aged SOA yields (g g−1) as functions of COA for three anthropogenic VOC among different schemes (CMAQ CRACMM not included). SOA yields are calculated at 298 K. Note that y-axis scales vary by precursor to highlight scheme discrepancies across different yield magnitudes.
3.1.2 Non-aged SOA yields from biogenic VOC
Figure 4 shows how the non-aged SOA mass yields depend on COA for three biogenic VOC (BVOC), namely isoprene (ISOP), monoterpenes (TERP), and sesquiterpenes (SESQ). For isoprene, CMAQ includes heterogeneous SOA formation from IEPOX (Pye et al., 2013), which is outside the scope of this evaluation and thus is not discussed in this study.
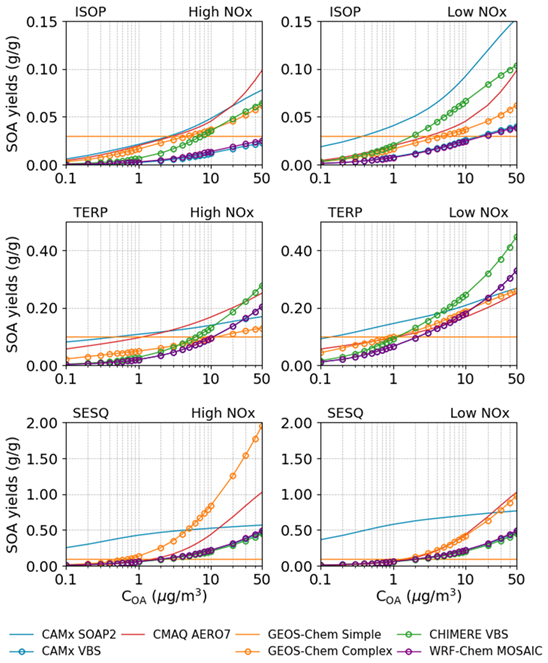
Figure 4Comparison of the non-aged SOA yields (g g−1) as functions of COA for three biogenic VOC among different schemes (CMAQ CRACMM not included). SOA yields are calculated at 298 K. Note that y-axis scales vary by precursor to highlight scheme discrepancies across different yield magnitudes.
Overall, the BSOA yield patterns closely resemble those of ASOA. All schemes, except for GEOS-Chem Simple, predict an increase in yields associated with COA. However, the magnitude of SOA yields varies significantly across schemes, ranging from 1.8 to 8.4 under high NOx conditions and 2.5 to 7.0 under low NOx conditions. Additionally, model predictions regarding the influence of NOx on BSOA yields are inconsistent, with some indicating an increase, others a decrease, and some showing no effect. For instance, SOA yields from ISOP under high NOx conditions, as simulated by two CAMx schemes, WRF-Chem MOSAIC, and CHIMERE VBS, are approximately half of those under low NOx conditions. In contrast, CMAQ AERO7 and GEOS-Chem schemes suggest that SOA yields are independent of NOx levels. Regarding TERP-derived SOA, all schemes, except for CMAQ AERO7 and GEOS-Chem Simple, predict more than 50 % higher yields under low NOx conditions compared to high NOx conditions. The latter two schemes show no difference between NOx regimes. For SESQ, four models (CAMx VBS, CMAQ AERO7, CHIMERE VBS, and WRF-Chem MOSAIC) predict no distinction in SOA yields between high and low NOx conditions. Conversely, CAMx SOAP2 suggests higher yields under low NOx conditions, whereas the GEOS-Chem Complex scheme predicts the opposite.
3.1.3 Non-aged SOA yields from intermediate volatility organic compounds (IVOC)
IVOC emissions make important contributions to ASOA formation (Zhao et al., 2016; Ma et al., 2017; Zhao et al., 2014). The SOA yields from IVOC, referred to as IV-SOA, predicted by each scheme are shown in Fig. 5. The GEOS-Chem Simple scheme is omitted since it does not explicitly account for IVOC. Additionally, the results for CMAQ CRACMM are discussed separately in Sect. 4.2.3, due to its distinct treatment of several IVOC types.
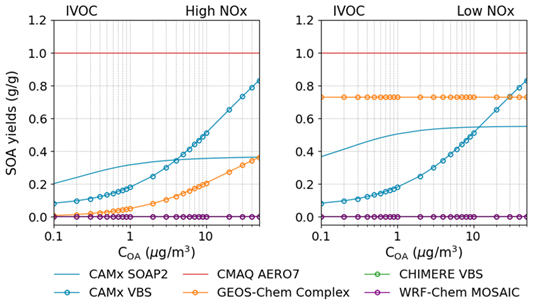
Figure 5Comparison of the non-aged SOA yields (g g−1) as functions of COA for IVOC among different schemes (CMAQ CRACMM and GEOS-Chem Simple not included). SOA yields are calculated at 298 K.
SOA yields from IVOC in the CAMx VBS scheme shows a strong positive dependence on COA whereas CAMx SOAP2 and GEOS-Chem Complex exhibit much weaker responses. Constant SOA yields of 1.0 g g−1 are set in CMAQ AERO7, regardless of NOx levels, surpassing the values predicted by other schemes. SOA formation from IVOC in CHIMERE VBS and WRF-Chem MOSAIC is treated as multi-generational oxidation (Reactions R13–R18 in Supplement), resulting in extremely low non-aged SOA yields (<0.001 g g−1).
3.2 Comparison of SOA aging
Among the eight schemes we evaluated, the CAMx SOAP2, GEOS-Chem Simple, and GEOS-Chem Complex schemes do not incorporate explicit SOA aging processes. However, the SOAP2 yields are derived from a VBS parameterization that includes aging (Hodzic et al., 2016) and may therefore be considered pre-aged (Emery et al., 2024). The remaining schemes account for SOA aging using one or more of three mechanisms: gas-phase OH-oxidation, condensed-phase oligomerization, and condensed-phase hydrolysis. Gas-phase OH-oxidation aging is typically parameterized as functionalization reactions that generate less volatile products (e.g. Fig. 2b) and/or fragmentation reactions that produce more volatile products (e.g. Fig. 2c). This mechanism is adopted in CAMx VBS (for AVOC and IVOCs only), CMAQ CRACMM, WRF-Chem MOSAIC and CHIMERE VBS, with implementation being specific to each scheme. Condensed-phase oligomerization aging (e.g. Fig. 2d) is characterized as a first-order particle-phase reaction, usually assuming a lifetime of 30 h, leading to non-volatile product formation independent of oxidant concentrations. CMAQ AERO7 applies this process for SOA formed from all precursors except monoterpenes. For SOA derived from NO3 oxidation of monoterpenes, AERO7 instead applies condensed-phase hydrolysis, yielding non-volatile products with a lifetime of ∼3 h.
To compare the aging effects on SOA yields across different schemes, we assumed a 24 h exposure to an OH concentration of 3×10⁶ molec. cm−3 (equivalent to 2.6×10¹¹ molec. s−1 cm−3) for the OH-oxidation aging process or a 24 h of condensed-phase oligomerization/hydrolysis when calculating the aged SOA yields (details presented below). Table 3 summarizes the aged SOA yields (when applicable) at 298 K with a COA of 10 µg m−3 as simulated by each scheme. Figures 6 and 7 further compare the non-aged and aged SOA yields for each scheme and SOA precursor, while Fig. 8 separately illustrates the aging effects on IVOC-derived SOA across different schemes.
Table 3Aged SOA yields (g g−1) for different precursors across schemes at 298 K and COA of 10 µg m−3. Values in italics and bold indicate no aging effect (i.e. identical to Table 2).
1 Model name abbreviations are CMx for CAMx, CMQ for CMAQ, G-C for GEOS-Chem, CMR for CHIMERE, and W-C for WRF-Chem. Scheme name abbreviations are SP2 for SOAP2, AE7 for AERO7, Spl for Simple, Cpx for Complex, and MOS for MOSAIC.
2 For WRF-Chem and CHIMERE, results for BENZ are based on ARO1.
3 For WRF-Chem and CHIMERE, results for TOL are based on ARO1.
4 For WRF-Chem and CHIMERE, results for XYL are based on ARO2. For CMAQ CRACMM, results for XYL are averages of XYE and XYM.
5 For CMAQ CRACMM, IVOC yields are average of alkane and oxygenated IVOCs (see details in Table S17). For WRF-Chem MOSAIC, IVOC is assumed to have 50 % oxygen.
6 For CHIMERE, results for SESQ are based on humulene.
7 Multi-model average yield excluding GEOS-Chem Simple for aromatics and IVOC, and excluding CRACMM for ISOP.
8 Ratio of maximum to minimum yield.
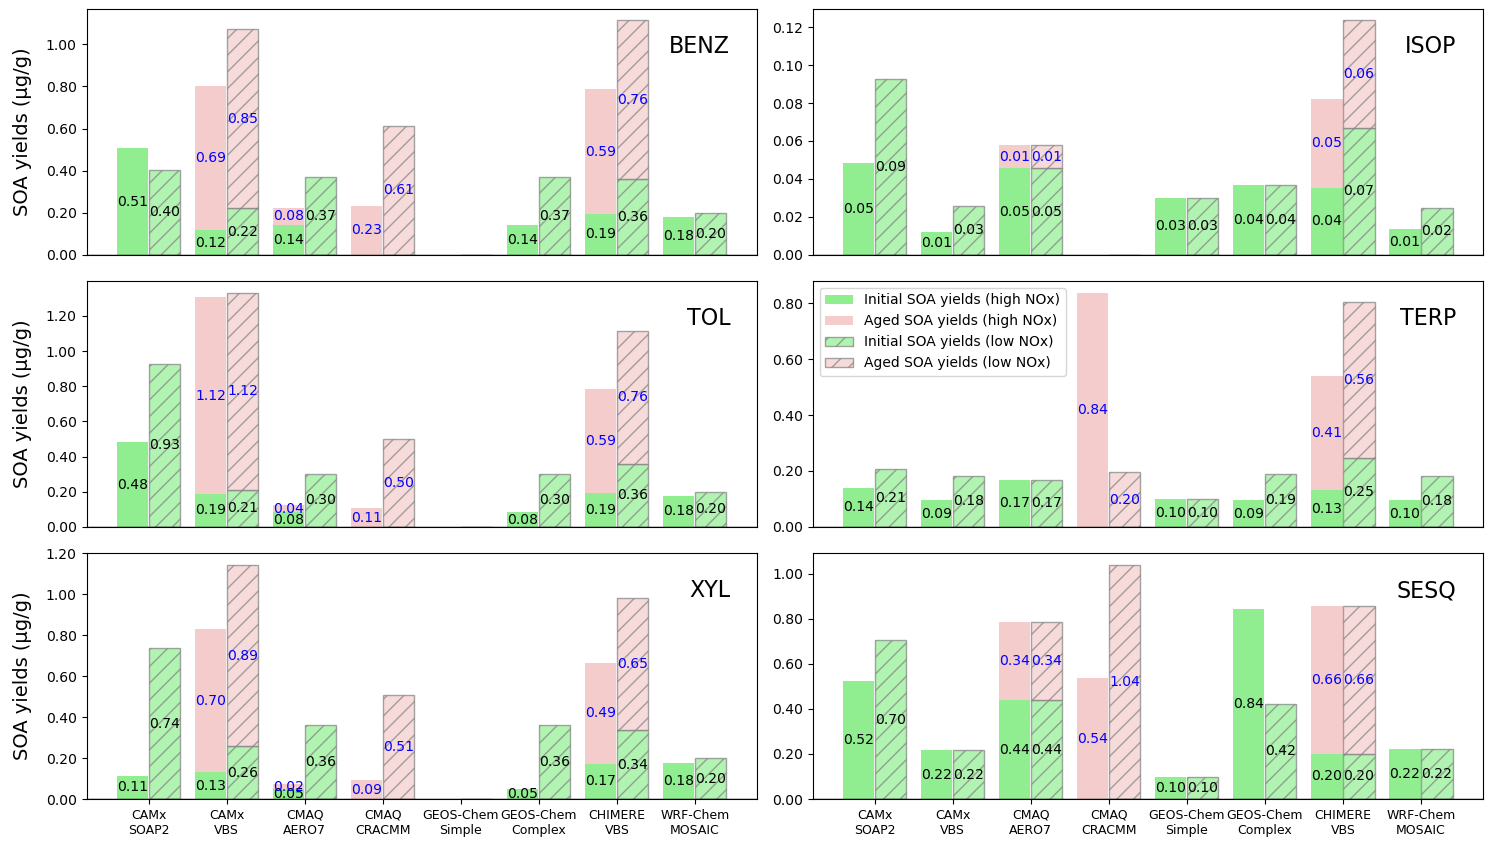
Figure 6Effect of aging on SOA yields (g g−1) for different precursors under high and low NOx conditions. Note that y-axis scales vary by precursor to highlight scheme discrepancies across different yield magnitude.
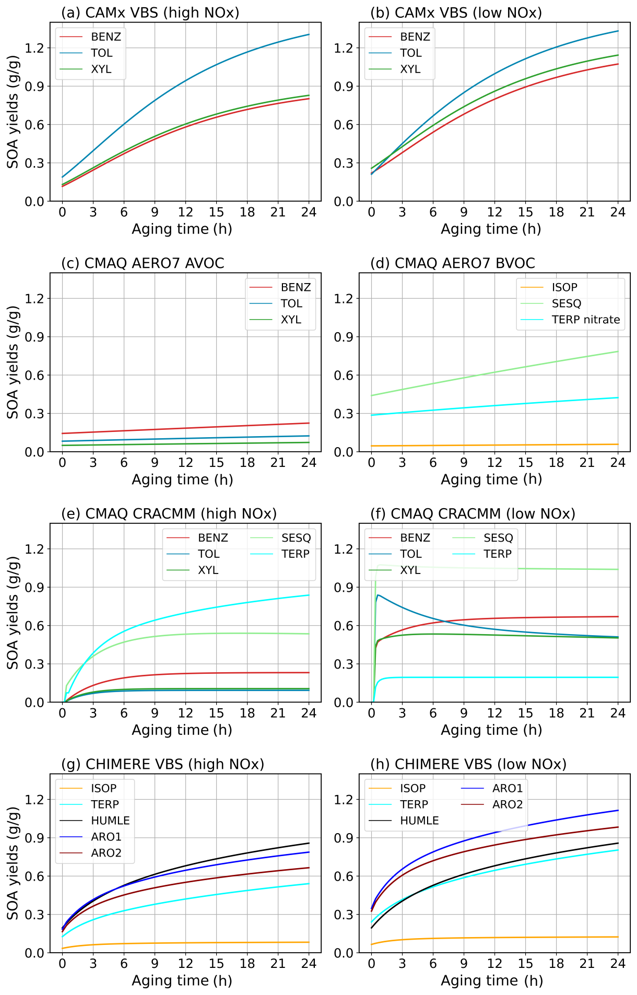
Figure 7Effect of aging on SOA yields (g g−1) from different precursors as a function of OH exposure or aging time in different schemes. (a–b) CAMx VBS; (c–d) CMAQ AERO7; (e–f) CMAQ CRACMM; and (g–h) CHIMERE VBS. The numbers in the brackets indicate the relative change of SOA yields at hour 24 to hour 0.
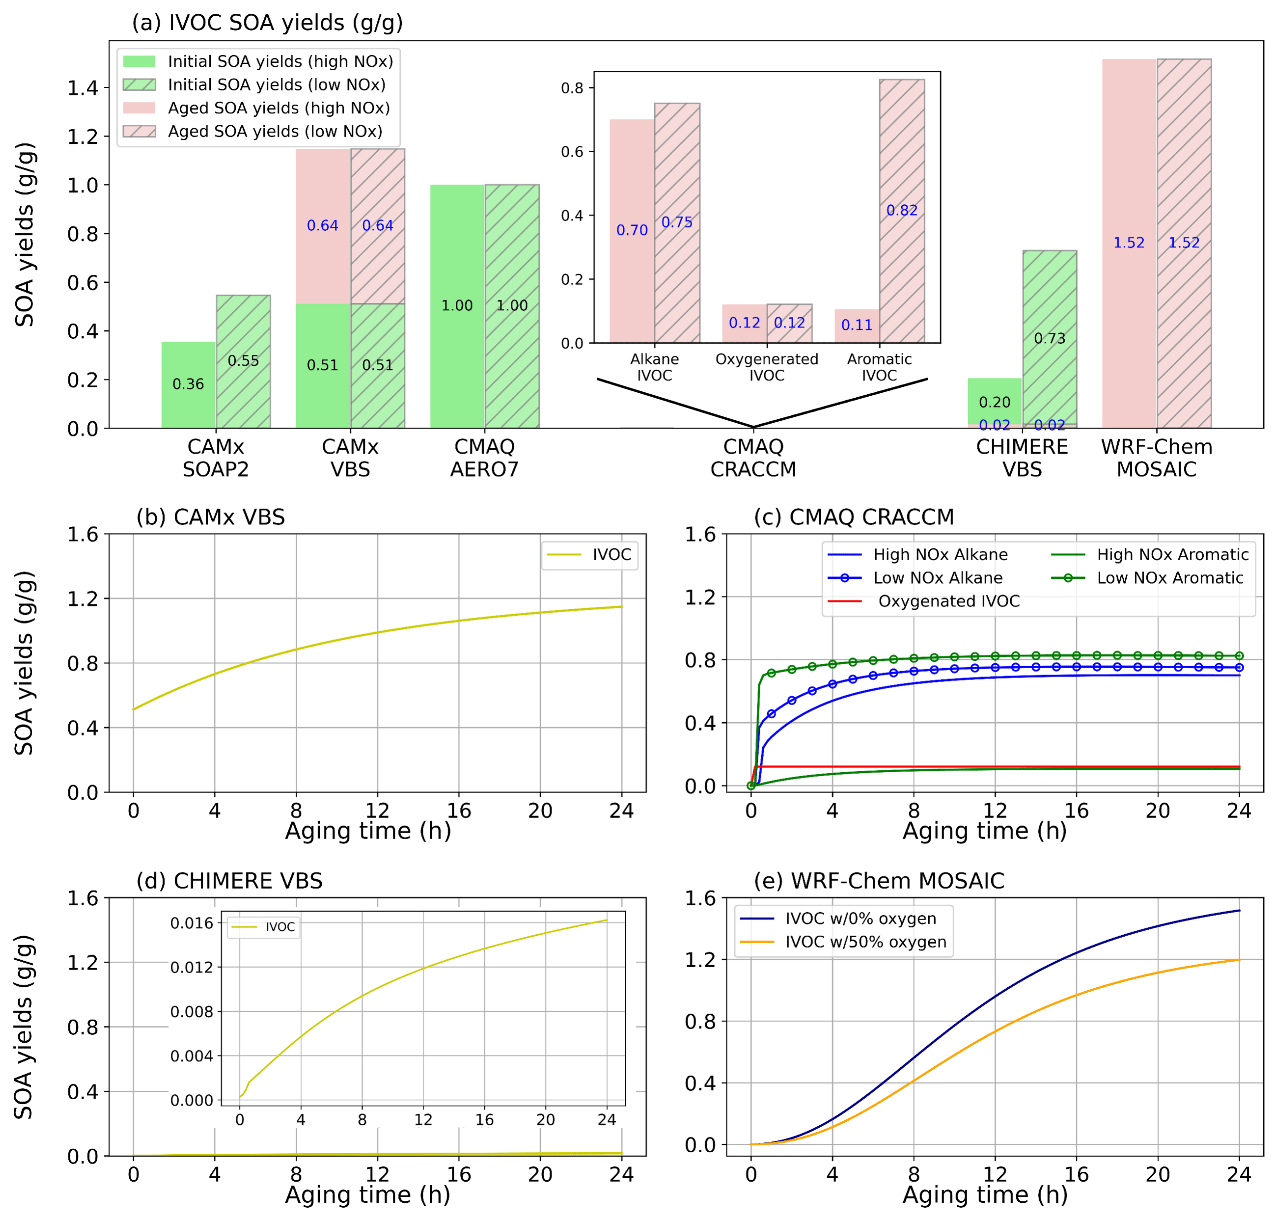
Figure 8Effect of aging on SOA yields (g g−1) for IVOC precursors under high and low NOx conditions for different schemes.
3.2.1 Aging in CAMx VBS
The CAMx VBS scheme incorporates step-wise gas-phase OH-oxidation aging for AVOC and IVOC without accounting for fragmentation processes (Fig. 2b). The calculation of aged SOA yields follows Eqs. (3) to (5), using a kOH value of cm3 molec. s−1 and an OH concentration of 3×10⁶ molec. cm−3. Figure 7a–b illustrates how SOA yields change as a function of accumulated OH exposure under high and low NOx conditions for different precursors. In the CAMx VBS scheme, SOA yields increase with OH exposure though the rate of aging slows as the OH exposure increases. With a 24 h period (corresponding to an OH exposure of 2.6×10¹¹ molec. s−1 cm−3), SOA yields from aromatics increase by a factor of 5–6 under high NOx conditions and 3–5 under low NOx conditions compared to their non-aged yields. For IVOC, aged SOA yields increase by 125 % relative to the non-aged yields (Fig. 8b). These findings highlight the significant influence of aging processes implemented in the CAMx VBS scheme.
3.2.2 Aging in CMAQ AERO7
The SOA aging process in the CMAQ AERO7 scheme involves particle-phase oligomerization (Fig. 2d) and hydrolysis. Oligomerization applies to SOA formed from ISOP, SESQ, and aromatics (only under high-NOx conditions) while hydrolysis affects SOA formed from monoterpenes oxidation by NO3 radical. The aged SOA yields resulting from oligomerization and hydrolysis follows Eqs. (6) to (8), with rate constants s−1 and s−1. Figure 7b illustrates the evolution of SOA yields over 24 h of oligomerization, showing increases of 27 %, 79 %, and 46 %–57 % for ISOP, SESQ, and aromatics, respectively. This increase results from the reduced volatility of SOA due to oligomerization. The hydrolysis reaction, assuming a shorter lifetime of approximately 3 h, leads to a 48 % increase in SOA yield from monoterpene-derived organic nitrates over 1 d. Although the hydrolysis rate is nearly ten times faster than that of oligomerization, the overall yield increase is moderated because the hydrolysis products have lower molecular weights than their parent compounds.
3.2.3 Aging in CMAQ CRACMM
The aging processes in CMAQ CRACMM involve the gas-phase OH-oxidation reactions of secondary oxygenated L/S/IVOCs, leading to both fragmentation and functionalization, and resulting in products with varying volatilities. As illustrated in Fig. 7e–f, the impact of aging on SOA yields depends on the precursor and varies between high NOx and low NOx conditions. Under high NOx conditions, SOA yields from all precursors increase substantially during the first 6–8 h, after which the growth rate becomes negligible (except for TERP, which continues to increase). After 24 h of aging, SOA yields under high NOx conditions range from 0.093 g g−1 for XYL to 0.838 g g−1 for TERP (Table 3). In contrast, under low NOx conditions, all precursors show a sharp increase in SOA yields within the first 30 min. Subsequently, SOA yields from XYL begin to decline, gradually reaching a minimum value of approximately 0.511 g g−1 after 16 h. On the contrary, BENZ yields continue to increase slightly, peaking around 0.670 g g−1. TERP, TOL, and SESQ yields exhibit minimal change after their initial increase. After 24 h, SOA yields under low NOx conditions range from 0.195 g g−1 for TERP to 1.039 g g−1 for SESQ.
Unlike other schemes, the CMAQ CRACMM scheme classifies IVOC into alkanes, aromatics, and oxygenated IVOC based on their functional groups. Emitted oxygenated IVOC do not exhibit aging effects, as their oxidation products are assumed to be non-volatile (Fig. 8c). In contrast, SOA yields from alkane and aromatic IVOC increase with the aging time, with the growth rate becoming negligible after approximately 10 h. SOA yields from oxygenated IVOC (0.121 g g−1) are independent of NOx conditions. The other two IVOC types show higher SOA yields under low NOx conditions, particularly for aromatic IVOC, where the SOA yields under low NOx conditions (0.825 g g−1) are nearly 8 times that under high NOx conditions (0.105 g g−1).
3.2.4 Aging in CHIMERE VBS
The CHIMERE VBS scheme accounts for aging through gas-phase functionalization and fragmentation, as well as condensed-phase oligomerization, as shown in Supplement Reactions (R9) to (R12). Figure 7d presents the combined aging effects on SOA over a 24 h period under this scheme. Among BVOC, the aging effect is more pronounced for TERP and humulenes (HUMULE) than for ISOP. Under high NOx conditions, the SOA yields from ISOP, TERP, and HUMULE increase by 141 %, 331 %, and 341 %, respectively, over 1 d. In contrast, under low NOx conditions, the aging effect is generally less significant, except for HUMULE, which exhibits a similar level of aging under both NOx regimes. Aromatics show substantial increase in SOA yields – over 300 % under high NOx and 200 % under low NOx conditions.
Aging of SOA from IVOC results in a dramatic increase in yields – by nearly a factor of 60 within 1 d, as shown by Fig. 8d. However, the absolute SOA yields from IVOC remain low (approximately 0.01 g g−1), which is attributed to the non-aged low SOA formation (∼ 10−4 g g−1) and the dominance of fragmentation at higher oxidation generations. From the third oxidation generation onward, 75 % of the condensable gases undergo fragmentation into more volatile products, while only 15 % undergo functionalization, as described in Supplement Reaction (R14).
3.2.5 Aging in WRF-Chem MOSAIC
The WRF-Chem MOSAIC scheme does not include SOA aging processes for AVOC and BVOC. SOA formation from IVOC is parameterized as a stepwise gas-phase OH-oxidation process. For the non-oxygen component of condensable gases, a 15 % mass gain is assumed for each generation (as per Supplement Reactions R15 and R16). Meanwhile, the oxygenated component shifts to lower volatility bins without mass gain (as per Supplement Reactions R17 and R18). The scheme does not consider fragmentation or condensed-phase oligomerization. Figure 8e illustrates aging effects under two scenarios: IVOC with hydrocarbon-like characteristics (0 % oxygen by mass at t=0, representing of diesel emissions) and IVOC with 50 % oxygen by mass (representing of biomass burning emissions). In both cases, the non-fragmenting stepwise aging process in WRF-Chem results in substantial increases in SOA yields. At an OH exposure of 2.6×10¹¹ molec. s−1 cm−3 (i.e. a 24 h period), SOA formed from hydrocarbon-like IVOC exceeds 1 g g−1, despite an initially negligible yield.
3.3 NOx effects on SOA yields
Evaluating SOA yields for seven precursor types across eight modeling schemes results in 56 potential characterizations of how NOx levels influence SOA formation. Tables S18 and S19 present the ratios of non-aged and aged SOA yields under high and low NOx conditions. For non-aged SOA yields, 11 of the 56 cases are missing and 14 cases are designed to exhibit no NOx dependence, leaving 31 meaningful comparisons. Among these, 29 cases show lower SOA yields under high NOx conditions. For aged SOA yields, 5 cases are missing and 14 are designed with no NOx effect, leaving 37 meaningful comparisons, of which 34 also show lower SOA yields under high NOx conditions. These results indicate a general trend of higher SOA yields under low NOx conditions, although a few exceptions are observed. In some cases, the NOx effect is reversed – that is, SOA yields are higher under high NOx conditions than under low NOx conditions. This is seen for BENZ in the CAMx SOAP2 scheme, TERP in CMAQ CRACMM, and SESQ in the GEOS-Chem Complex scheme. The NOx effect on terpene-derived SOA in CRACMM is particularly noteworthy: the model predicts an eightfold increase in SOA yields under high NOx conditions compared to low NOx. This is significant given that terpenes are key SOA precursors in many forested regions, such as the Eastern US, where anthropogenic NOx emissions may change due to ongoing urban development (which could increase NOx levels) or the implementation of emission control technologies (which may reduce them). Experimental studies, including those by Sarrafzadeh et al. (2016) and Wildt et al. (2014), have consistently found that terpene-derived SOA yields are higher under low NOx conditions, a result that aligns with most of the evaluated schemes but contrasts with the predictions made by CRACMM.
3.4 SOA variations in box model simulations
The box model simulations reveal significant discrepancies in predicted SOA concentration and composition among the selected schemes at both the urban (DFW) and rural (TYL) locations (Fig. 9). The total SOA concentrations can vary by a factor of 2–3 between schemes even under identical meteorological and emission inputs. Overall, SOA concentrations are higher at DFW than at TYL. At both locations, all schemes exhibit a consistent diurnal profile characterized by SOA accumulation throughout the day and night, followed by a sharp decline in the early morning (beginning around 06:00 LST) caused by expansion of the planetary boundary layer (PBL). At DFW, the temporal trends are similar across the four schemes; however, the magnitude varies, with Simple and AERO7 predicting the highest concentrations, while CRACMM predicts the lowest. At TYL, the inter-model spread is narrower than at DFW. Notable differences in diurnal dominance emerge: SOAP2 and CRACMM predict the highest concentrations overnight – a pattern distinct from DFW – while Simple and CRACMM produce the highest values during daytime hours. Figure 9c–d shows the maximum and minimum average SOA concentrations. At DFW, Simple and CRACMM predict the highest and lowest total SOA concentrations, respectively. Conversely, at TYL, CRACMM predicts the highest average concentration, while AERO7 predicts the lowest.
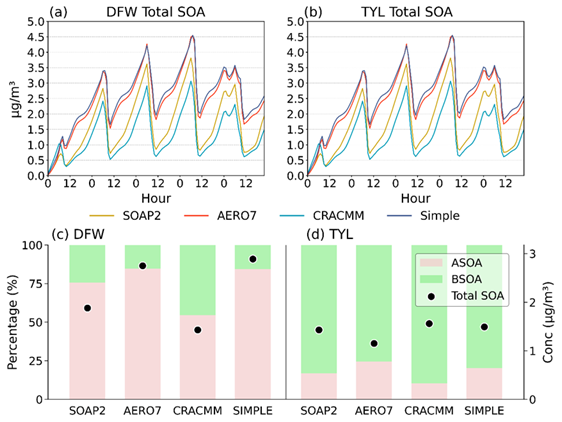
Figure 9Diurnal profiles of total SOA (µg m−3) from the 5 d box model base simulations at (a) DFW and (b) TYL. Average SOA concentrations (µg m−3) averaged over days 2 through 5 of base model simulations for each SOA scheme (circles) and average contributions of ASOA and BSOA (bars).
Response surface plots for 24 h average SOA concentrations derived from the matrix of simulations with varied anthropogenic NOx and VOC emissions are presented in Figs. S4–S5. At DFW, total SOA concentrations generally decrease as anthropogenic NOx emissions increase relative to the base case (scaling factors 2–9) for all schemes, with the notable exception of CRACMM. CRACMM predicts negligible changes or a slight increase in SOA as NOx rises from low to mid scaling factors and a decrease is observed only when NOx emissions are increased by about a factor of 7 or greater. CRACMM also predicts the lowest SOA concentrations across all scaling factors. AERO7 and SIMPLE are very similar in both response surface shape and magnitude. For each scheme, SOA concentrations decrease as the anthropogenic VOC emissions decrease. At TYL, the response surfaces for AERO7, Simple, and SOAP3 are similar, with SOA concentrations remaining relatively constant at NOx scaling factors greater than 1. In contrast, CRACMM demonstrates a much stronger response, with SOA mass increasing concurrently with NOx emissions. At this biogenic-dominated site, SOA concentrations in all schemes are minimally sensitive to variations in anthropogenic VOC emissions.
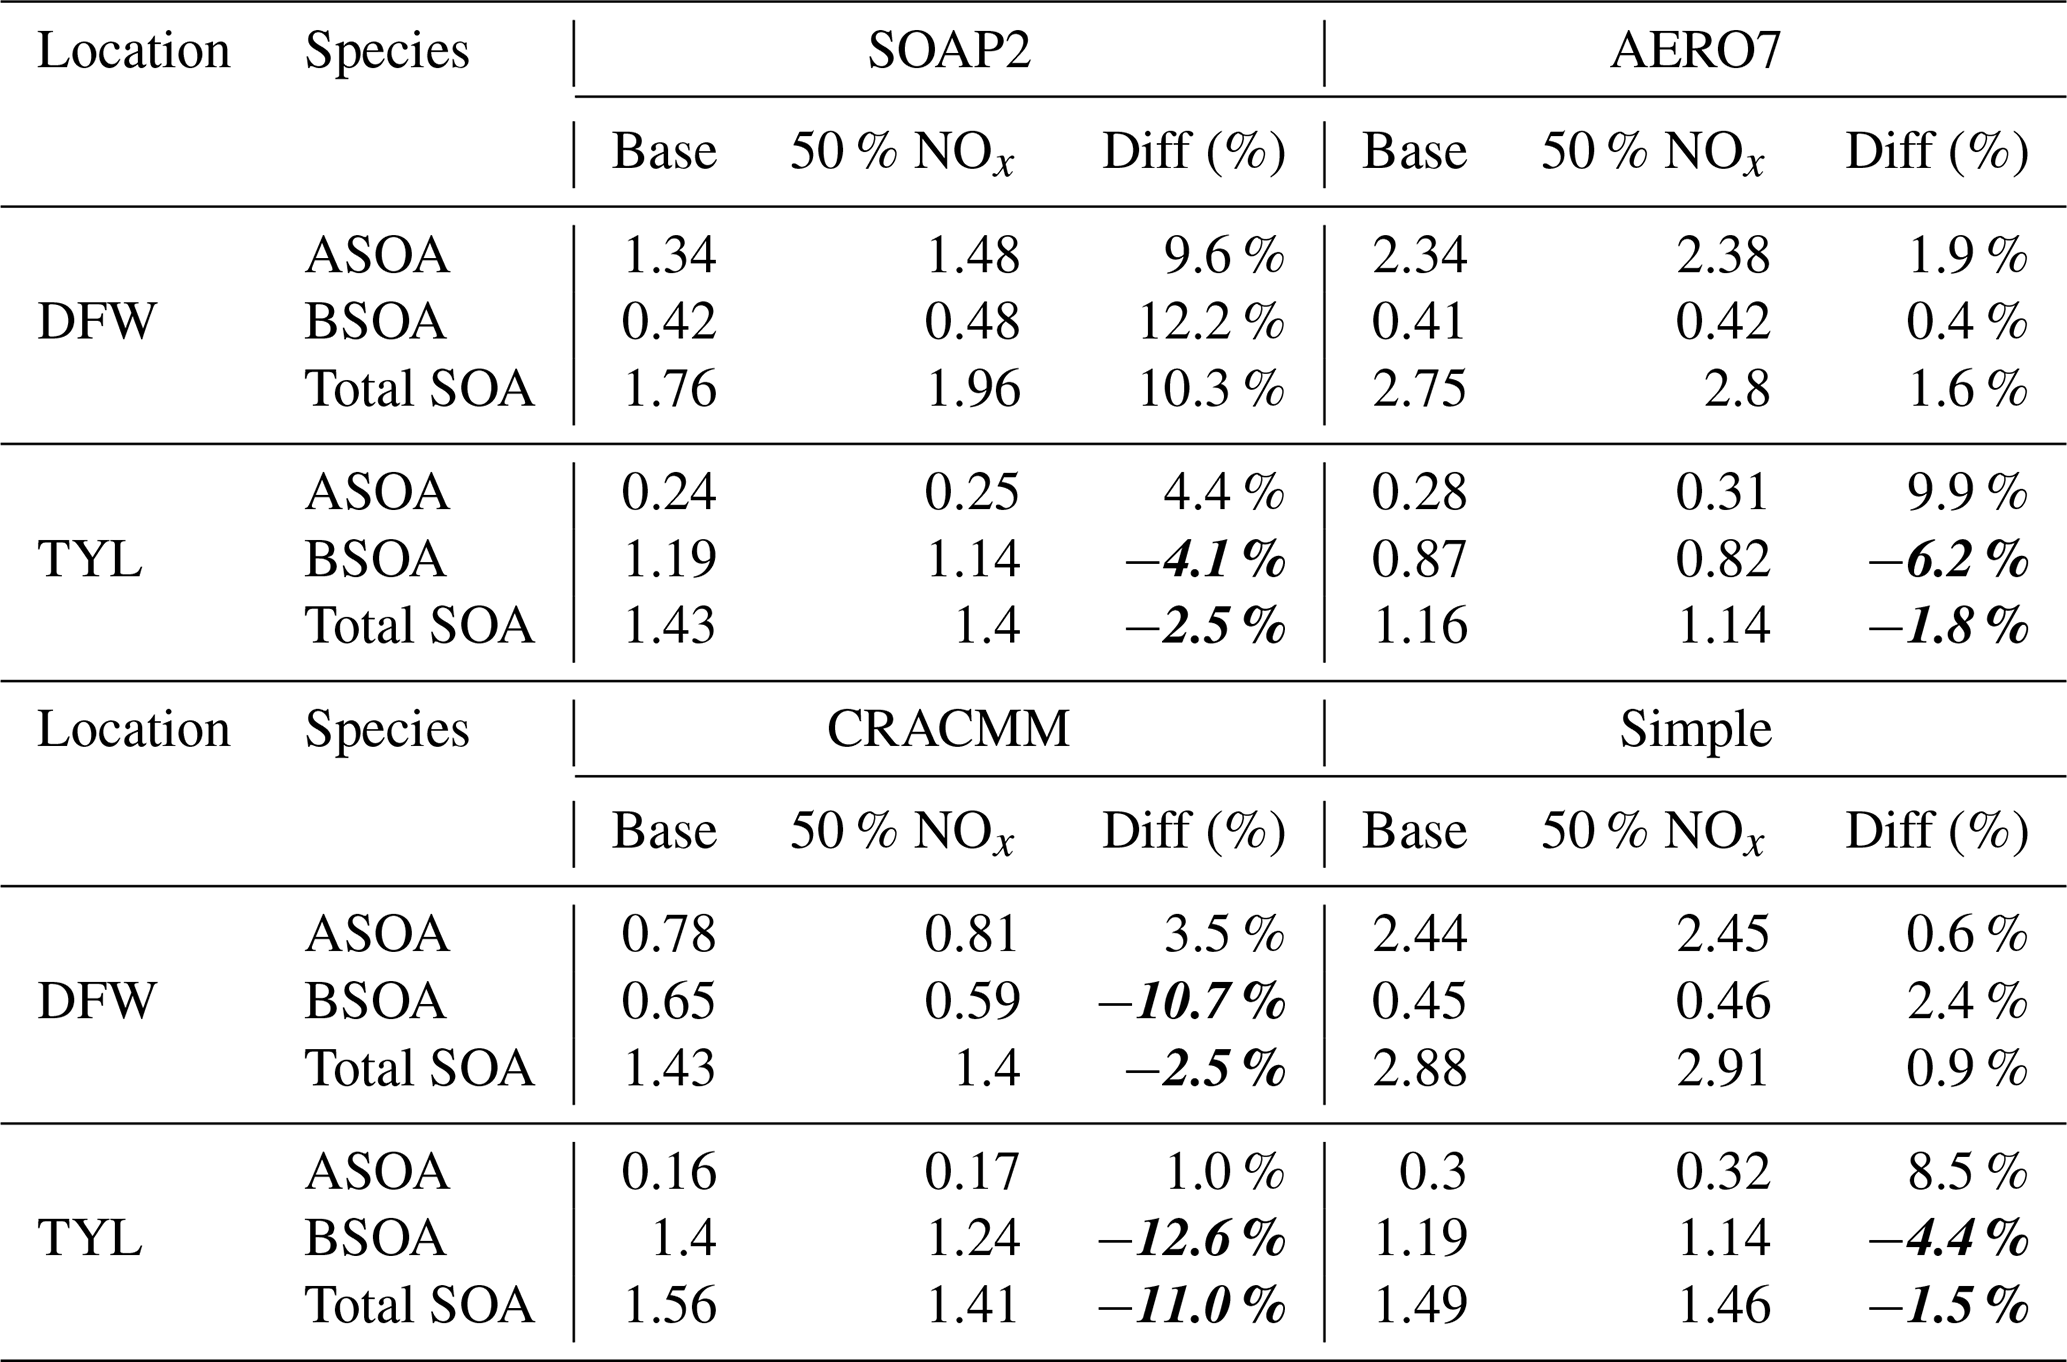
Understanding how SOA responds to NOx reductions is critical for near-term air quality planning, as many regulatory strategies (e.g., cleaner vehicles, energy transition) produce substantial NOx emissions abatement (Crippa et al., 2016; EPA, 2017; Li et al., 2024). Table 4 summarizes the impact of a 50 % reduction in NOx emissions on total SOA, ASOA, and BSOA. In all schemes, reducing NOx leads to increased ASOA concentrations, with the most pronounced increase predicted by SOAP2. SIMPLE predicts the smallest increase in ASOA at DFW, while CRACMM predicts the smallest increase at TYL. At DFW, this NOx reduction also drives an increase in BSOA concentrations across most schemes, with the notable exception of CRACMM. Consistent with the ASOA results, SOAP2 predicts the largest increase in BSOA. The distinct behavior in CRACMM is driven by its monoterpene SOA parameterization; contrary to other schemes and experimental evidence (Lane et al., 2008; Sarrafzadeh et al., 2016; Zhao et al., 2018), CRACMM predicts decreasing yields under lower NOx conditions. Consequently, the substantial reduction in BSOA predicted by CRACMM at DFW results in a net decrease in total SOA, a trend opposite to that observed in the other schemes. At TYL, all schemes predict a decrease in both BSOA and total SOA, with the most significant reductions observed in the CRACMM simulation. The dominance of biogenic emissions at TYL compared to DFW is reflected in the significantly higher BSOA concentrations. The differing SOA responses to NOx reduction between the two sites are attributable to the distinct biogenic emission regimes producing different VOC NOx emission ratios.
Table 4Average concentrations (µg m−3) of anthropogenic SOA (ASOA) and biogenic SOA (BSOA) over days 2 through 5 for the base and reduced NOx model simulations. Values in italics and bold indicate a decrease in SOA concentrations in the reduced NOx model runs compared to the base runs.
4.1 SOA schemes implemented in CTMs are diverse, making quantitative comparisons inherently challenging
CTMs employ diverse approaches to simulate SOA, from simple schemes that treat SOApre as non-volatile to more complex VBS schemes that utilize multiple basis sets to represent different types of precursors. Variability in how SOA aging is treated further adds to the overall diversity across schemes. In our view, such diversity is valuable from a research perspective, given that the underlying processes driving SOA formation remain uncertain and, in many cases, poorly characterized. The variation in SOA yields across different schemes reflects the extent of these uncertainties. The differences in scheme formulation, coupled with the large numbers of parameters employed in some schemes, pose practical challenges for applying multiple schemes to standardized scenarios. Addressing these challenges may require innovative approaches. Nonetheless, comparisons under standardized conditions are essential for achieving meaningful quantitative inter-comparisons. Evaluating SOA yields under standard conditions and plotting SOA yield curves (i.e., yield vs. COA) are effective strategies for identifying similarities and differences among schemes. However, it is important to note that the results presented here may not fully capture the ranges of conditions encountered in three-dimensional atmospheric simulations.
4.2 Non-aged SOA yields vary substantially across schemes and while many schemes consider SOA aging, the aging effects vary
Evaluating seven precursor types under both high and low NOx conditions yields 14 distinct comparisons. Across these comparisons, the ratio of maximum to minimum non-aged yields (max min) ranges from 1.8 to >1000 with a median max min of 4.2 (Table 2). Among the eight schemes examined, three (CAMx SOAP2, GEOS-Chem schemes) do not include explicit SOA aging processes. Four schemes account for aging in a subset of precursor types and/or NOx-conditions, while only one (CMAQ CRACMM) includes aging for all precursors. Aging mechanisms considered by these schemes include gas-phase OH-oxidation of evaporated SOA, particle-phase oligomerization, hydrolysis, and photolysis. The impacts of aging on SOA yields vary by scheme and precursor (Table S20): in 67 of the 98 evaluated cases (defined as one scheme/precursor/NOx-condition combination, CRACMM excluded), aging has no effect; in 31 cases, it increases SOA yields. Considering the aging effects, the ratio of max min aged yields ranges from 5.0 to >70, with a median value of 8.3 (Table 3). The relative rankings of precursors by their initial/aged SOA yields differ across schemes (Tables S22 and S23), indicating that different aging schemes can lead to divergent conclusions regarding the relative importance of specific SOA precursors – a consideration with potential implications for policy guidance. For instance, discrepancies in yields lead to different precursor rankings (e.g., the relative importance of aromatics vs. IVOCs). A model that underpredicts the SOA potential of IVOC emissions might disproportionately focus policy strategies on traditional VOCs (e.g., from petroleum-based solvents) and potentially lead to ineffective widespread controls that miss the critical contribution of IVOCs.
SOA aging remains an area in need of improved representation, with careful attention required to ensure consistent underlying assumptions. Notably, only the two CAMx schemes incorporate condensed-phase SOA photolysis, despite growing evidence that both anthropogenic and biogenic SOA can undergo substantial photolytic depletion (Hodzic et al., 2016; Baboomian et al., 2020), although a portion of SOA appears recalcitrant to such degradation (O'Brien and Kroll, 2019).
4.3 Large uncertainty exists for IVOC SOA yields
The SOA yields from IVOCs show wider variation (from negligible to 1.0 g g−1) than for other anthropogenic precursors (Tables 2 and 3), partly due to different assumptions across schemes. For example, schemes such as WRF-Chem MOSAIC and CHIMERE VBS predict very low non-aged yields from IVOC, based on the assumption that several generations of oxidation are required before forming condensable products. Even after 1 d of aging, IVOC SOA yields remain highly variable, ranging from 0.02 to 1.20 g g−1. Although IVOC are generally classified based on volatility, factors such as high molecular weight or the presence of polar functional groups can shift compounds into the IVOC volatility range (Pankow and Asher, 2008). As a result, volatility and SOA yield are not necessarily well correlated (Donahue et al., 2011). Improving model representations of IVOC-derived SOA yields will require more detailed differentiation of IVOC emissions into multiple subtypes, as illustrated by the CRACMM scheme (Pye et al., 2023). A unified classification or “lumping” scheme for IVOC would be particularly advantageous, allowing multiple models to utilize a common emissions framework and enabling more direct comparisons of IVOC SOA yields. Improving the representation of oxygenated VOCs with reduced volatility – such as glycols and glycol ethers – within gas-phase chemical mechanisms can also support improved differentiation of IVOC-related SOA formation (Yarwood and Tuite, 2024; Yu et al., 2023). More generally, a yield-based lumping approach for IVOCs (e.g., categorizing them into low, medium, or high yield classes) may be more practical to implement than strictly chemically-based schemes.
4.4 Determining experimental SOA yields also presents significant challenges
Laboratory experiments play a crucial role in guiding SOA model development and constraining key model parameters, particularly yields. However, these experiments are subject to operational and design limitations, including the need to account for chamber wall effects (Zhang et al., 2014) and to achieve atmospherically relevant concentration ranges (Peng et al., 2022; Kenagy et al., 2024). The role of autoxidation reactions in SOA formation further complicates the design of atmospherically relevant experiments, as discussed in detail by Kenagy et al. (2024). For instance, studying a reaction mechanism that includes RO2 radical autoxidation at a rate of 0.1 s−1 requires that the effective rates of competing bimolecular reactions, particularly RO2+ NO, be reduced to 0.1 s−1 or lower. This necessitates NO mixing ratios below approximately 5 ppb, which are now typical of photochemically active urban environments such as Los Angeles (Praske et al., 2018). Many SOA chamber experiments designed to investigate high NOx conditions exceed 5 ppb NO, thereby preventing autoxidation. Some chamber experiments, such as those by Sarrafzadeh et al. (2016), have been specifically designed to achieve atmospherically relevant NO (and other radicals) concentrations, making their results particularly valuable for SOA model development. In contrast, oxidation flow reactors face greater challenges (Peng et al., 2019) than chamber experiments in studying SOA formation due to their amplification of radical concentrations, which significantly shortens RO2 lifetime and effectively suppresses autoxidation reactions. Wennberg (2023) has suggested shifting from the conventional terminology of high/low NOx to high/low NO to emphasize the critical role of NO concentration in determining RO2 radical fate.
In this study, we compared SOA formation by eight schemes implemented in five widely used CTMs. For each SOA scheme, we quantified the non-aged SOA mass yields under standardized conditions (T=298 K and COA=10 µg m−3), showed how the non-aged yield varies with COA, and quantified how 1 d of simulated atmospheric aging changed the non-aged yield. We calculated yields for 7 SOA precursor types (4 anthropogenic and 3 biogenic) under both high and low NOx conditions.
The lack of consistency across eight current SOA schemes reviewed here reveals a lack of consensus within the air quality modelling community, notwithstanding substantial efforts to greatly expand the scientific knowledge base related to SOA formation over recent decades. Evaluating SOA schemes using ambient measurements is unlikely to produce consensus because large uncertainties in the SOA schemes are confounded with large uncertainties in precursor emission estimates. In our view, there is no objective basis for preferring one SOA scheme over another considering the high degree of uncertainty presented here. Complex SOA schemes may be valuable to research for investigating linkages between precursors and SOA, but conversely, complexity may be a hindrance to the work of air quality planning because it adds to computational burdens and makes the science more difficult to comprehend and communicate. Notably, very simple SOA schemes have performed as well or better than complex schemes in their ability to simulate ambient OA measurements when driven by ambient precursor measurements (Hodzic and Jimenez, 2011; Pai et al., 2020). Complex schemes can introduce responses to conditions, such as NOx concentration, that may be unexpected and should be overtly evaluated if they have policy relevance, such as the NOx effect on SOA yield from BVOC. Simple schemes with well-characterized SOA yields and responses can have an important place in air quality modelling to support decision making which includes studies that value the health-burdens of air pollution as well as traditional emissions management planning.
In addition, a majority of the eight schemes reviewed here are based on the VBS approach and we expect that sampling a larger number of model schemes would not change this finding. VBS schemes have practical advantages because experimental studies frequently summarize their data (e.g., SOA yields, POA volatility) in a VBS frame which makes for direct translation of these data into a VBS model scheme. However, VBS data can be translated into a different frame (e.g., a two-product scheme) for SOA formation or for representing the partial evaporation of POA emissions, as illustrated by Huang et al. (2024). Therefore, scheme developers can consider using non VBS-based approaches to gain advantages of simplicity and efficiency. The findings summarized above underscore the importance of understanding the limitations of available SOA schemes when applied to air quality management and policy development. The choice of model/scheme can significantly influence the predicted SOA concentrations and their evolution over time, which in turn affects air quality forecasts, assessments and regulations.
The source data for the figures, including an example of the offline calculation (i.e. CMAQ AERO7), are available at Zenodo (https://doi.org/10.5281/zenodo.16757660, Huang, 2025). Calculation data for other species and schemes are available from the corresponding authors upon request.
The supplement related to this article is available online at https://doi.org/10.5194/acp-26-7895-2026-supplement.
G.Y. and L.H. designed the research. L.H. performed the data collection, yields calculation, and data analysis. K.T. performed the box model calculation. L.H. K. T., and G.Y. wrote the manuscript. B. C., Z. W., K.T., P.V., and L.L. contributed to data analysis and revision of the manuscript. All authors contributed to the manuscript preparation and discussions.
The contact author has declared that none of the authors has any competing interests.
Publisher's note: Copernicus Publications remains neutral with regard to jurisdictional claims made in the text, published maps, institutional affiliations, or any other geographical representation in this paper. The authors bear the ultimate responsibility for providing appropriate place names. Views expressed in the text are those of the authors and do not necessarily reflect the views of the publisher.
This work is supported by the Shanghai Technical Service Center of Science and Engineering Computing, Shanghai University.
This research has been supported by the National Natural Science Foundation of China (grant nos. 42375102 and 42375103) and the Electric Power Research Institute (grant no. 10016473).
This paper was edited by Kostas Tsigaridis and reviewed by two anonymous referees.
Appel, K. W., Bash, J. O., Fahey, K. M., Foley, K. M., Gilliam, R. C., Hogrefe, C., Hutzell, W. T., Kang, D., Mathur, R., Murphy, B. N., Napelenok, S. L., Nolte, C. G., Pleim, J. E., Pouliot, G. A., Pye, H. O. T., Ran, L., Roselle, S. J., Sarwar, G., Schwede, D. B., Sidi, F. I., Spero, T. L., and Wong, D. C.: The Community Multiscale Air Quality (CMAQ) model versions 5.3 and 5.3.1: system updates and evaluation, Geosci. Model Dev., 14, 2867–2897, https://doi.org/10.5194/gmd-14-2867-2021, 2021.
Baboomian, V. J., Gu, Y., and Nizkorodov, S. A.: Photodegradation of secondary organic aerosols by long-term exposure to solar actinic radiation, ACS Earth Space Chem., 4, 1078–1089, 2020.
Cappa, C. D. and Wilson, K. R.: Multi-generation gas-phase oxidation, equilibrium partitioning, and the formation and evolution of secondary organic aerosol, Atmos. Chem. Phys., 12, 9505–9528, https://doi.org/10.5194/acp-12-9505-2012, 2012.
Chang, X., Zhao, B., Zheng, H., Wang, S., Cai, S., Guo, F., and Donahue, N. M.: Full-volatility emission framework corrects missing and underestimated secondary organic aerosol sources, One Earth, 5, 403–412, 2022.
Chen, Q., Miao, R., Geng, G., Shrivastava, M., Dao, X., Xu, B., and Zhu, T.: Widespread 2013–2020 decreases and reduction challenges of organic aerosol in China, Nat. Comm., 15, 1–8, https://doi.org/10.1038/s41467-024-48902-0, 2024.
CHIMERE Development Team: CHIMERE Chemistry-transport model v2023r1 Documentation, http://www.lmd.polytechnique.fr/chimere/ (last access: 30 May 2026), 2024.
Couvidat, F., Bessagnet, B., Garcia-Vivanco, M., Real, E., Menut, L., and Colette, A.: Development of an inorganic and organic aerosol model (CHIMERE 2017β v1.0): seasonal and spatial evaluation over Europe, Geosci. Model Dev., 11, 165–194, https://doi.org/10.5194/gmd-11-165-2018, 2018.
Crippa, M., Janssens-Maenhout, G., Dentener, F., Guizzardi, D., Sindelarova, K., Muntean, M., Van Dingenen, R., and Granier, C.: Forty years of improvements in European air quality: regional policy-industry interactions with global impacts, Atmos. Chem. Phys., 16, 3825–3841, https://doi.org/10.5194/acp-16-3825-2016, 2016.
Donahue, N. M., Robinson, A. L., Stanier, C. O., and Pandis, S. N.: Coupled partitioning, dilution, and chemical aging of semivolatile organics, Environ. Sci. Technol., 40, 2635–2643, 2006.
Donahue, N. M., Epstein, S. A., Pandis, S. N., and Robinson, A. L.: A two-dimensional volatility basis set: 1. organic-aerosol mixing thermodynamics, Atmos. Chem. Phys., 11, 3303–3318, https://doi.org/10.5194/acp-11-3303-2011, 2011.
Emery, C. A., Baker, K. R., Wilson, G. M., and Yarwood, G.: Comprehensive Air Quality Model With Extensions, v7.20: Formulation and Evaluation for Ozone and Particulate Matter Over the US, Geosci. Model Dev. Discuss. [preprint], https://doi.org/10.5194/gmd-2024-48, 2024.
EPA: Overview of the Clean Air Act and Air Pollution, https://www.epa.gov/clean-air-act-overview (last access: 30 May 2026), 2017.
Hodzic, A. and Jimenez, J. L.: Modeling anthropogenically controlled secondary organic aerosols in a megacity: a simplified framework for global and climate models, Geosci. Model Dev., 4, 901–917, https://doi.org/10.5194/gmd-4-901-2011, 2011.
Hodzic, A., Kasibhatla, P. S., Jo, D. S., Cappa, C. D., Jimenez, J. L., Madronich, S., and Park, R. J.: Rethinking the global secondary organic aerosol (SOA) budget: stronger production, faster removal, shorter lifetime, Atmos. Chem. Phys., 16, 7917–7941, https://doi.org/10.5194/acp-16-7917-2016, 2016.
Huang, L.: Figure data for “Comparing Secondary Organic Aerosols Schemes Implemented in Current Chemical Transport Models and the Policy Implications of Uncertainties”, Zenodo [data set], https://doi.org/10.5281/zenodo.16757660, 2025.
Huang, L., Liu, H., Yarwood, G., Wilson, G., Tao, J., Han, Z., and Li, L.: Modeling of secondary organic aerosols (SOA) based on two commonly used air quality models in China: Consistent S/IVOCs contribution but large differences in SOA aging, Sci. Total Environ., 903, 166162, https://doi.org/10.1016/j.scitotenv.2023.166162, 2023.
Huang, L., Wu, Z. A., Liu, H., Yarwood, G., Huang, D., Wilson, G., Chen, H., Ji, D., Han, Z., Wang, Y., Wang, H., Huang, C., and Li, L.: An improved framework for efficiently modeling organic aerosol (OA) considering primary OA evaporation and secondary OA formation from VOCs, IVOCs, and SVOCs, Environ. Sci.: Atmos., 4, 1064–1078, 2024.
Huang, R. J., Zhang, Y., Bozzetti, C., Ho, K. F., Cao, J. J., Han, Y., and Prévôt, A. S.: High secondary aerosol contribution to particulate pollution during haze events in China, Nature, 514, 218–222, 2014.
Kenagy, H. S., Heald, C. L., Tahsini, N., Goss, M. B., and Kroll, J. H.: Can we achieve atmospheric chemical environments in the laboratory? An integrated model-measurement approach to chamber SOA studies, Sci. Adv., 10, eado1482, https://doi.org/10.1126/sciadv.ado1482, 2024.
Koo, B., Knipping, E., and Yarwood, G.: 1.5-Dimensional volatility basis set approach for modeling organic aerosol in CAMx and CMAQ, Atmos. Environ., 95, 158–164, 2014.
Lane, T. E., Donahue, N. M., and Pandis, S. N.: Simulating secondary organic aerosol formation using the volatility basis-set approach in a chemical transport model, Atmos. Environ.,, 42, 7439–7451, 2008.
Li, H., Zheng, B., Lei, Y., Hauglustaine, D., Chen, C., Lin, X., and He, K.: Trends and drivers of anthropogenic NOx emissions in China since 2020, Environ. Sci. Ecotechnol., 21, 100425, https://doi.org/doi.org/10.1016/j.ese.2024.100425, 2024.
Li, J., Zhang, H., Li, L., Ye, F., Wang, H., Guo, S., and Hu, J.: Modeling Secondary Organic Aerosols in China: State of the Art and Perspectives, Curr. Pollut. Rep., 9, 22–45, 2023.
Ma, P. K., Zhao, Y., Robinson, A. L., Worton, D. R., Goldstein, A. H., Ortega, A. M., Jimenez, J. L., Zotter, P., Prévôt, A. S. H., Szidat, S., and Hayes, P. L.: Evaluating the impact of new observational constraints on P-S/IVOC emissions, multi-generation oxidation, and chamber wall losses on SOA modeling for Los Angeles, CA, Atmos. Chem. Phys., 17, 9237–9259, https://doi.org/10.5194/acp-17-9237-2017, 2017.
NOAA: WRF-Chem version 4.4 User's Guide, https://www2.mmm.ucar.edu/wrf/users/docs/user_guide_v4/v4.4/contents.html (last access: 30 May 2026), 2022.
O'Brien, R. E. and Kroll, J. H.: Photolytic aging of secondary organic aerosol: Evidence for a substantial photo-recalcitrant fraction, J. Phys. Chem. Lett., 10, 4003–4009, 2019.
Pai, S. J., Heald, C. L., Pierce, J. R., Farina, S. C., Marais, E. A., Jimenez, J. L., Campuzano-Jost, P., Nault, B. A., Middlebrook, A. M., Coe, H., Shilling, J. E., Bahreini, R., Dingle, J. H., and Vu, K.: An evaluation of global organic aerosol schemes using airborne observations, Atmos. Chem. Phys., 20, 2637–2665, https://doi.org/10.5194/acp-20-2637-2020, 2020.
Pankow, J. F.: An absorption model of the gas/aerosol partitioning involved in the formation of secondary organic aerosol, Atmos. Environ., 28, 189–193, 1994.
Pankow, J. F. and Asher, W. E.: SIMPOL.1: a simple group contribution method for predicting vapor pressures and enthalpies of vaporization of multifunctional organic compounds, Atmos. Chem. Phys., 8, 2773–2796, https://doi.org/10.5194/acp-8-2773-2008, 2008.
Peng, W., Le, C., Porter, W. C., and Cocker III, D. R.: Variability in Aromatic Aerosol Yields under Very Low NOx Conditions at Different HO2/RO2 Regimes, Environ. Sci. Technol., 56, 750–760, 2022.
Peng, Z., Lee-Taylor, J., Orlando, J. J., Tyndall, G. S., and Jimenez, J. L.: Organic peroxy radical chemistry in oxidation flow reactors and environmental chambers and their atmospheric relevance, Atmos. Chem. Phys., 19, 813–834, https://doi.org/10.5194/acp-19-813-2019, 2019.
Pennington, E. A., Seltzer, K. M., Murphy, B. N., Qin, M., Seinfeld, J. H., and Pye, H. O. T.: Modeling secondary organic aerosol formation from volatile chemical products, Atmos. Chem. Phys., 21, 18247–18261, https://doi.org/10.5194/acp-21-18247-2021, 2021.
Pennington, E. A., Wang, Y., Schulze, B. C., Seltzer, K. M., Yang, J., Zhao, B., Jiang, Z., Shi, H., Venecek, M., Chau, D., Murphy, B. N., Kenseth, C. M., Ward, R. X., Pye, H. O. T., and Seinfeld, J. H.: An updated modeling framework to simulate Los Angeles air quality – Part 1: Model development, evaluation, and source apportionment, Atmos. Chem. Phys., 24, 2345–2363, https://doi.org/10.5194/acp-24-2345-2024, 2024.
Praske, E., Otkjær, R. V., Crounse, J. D., Hethcox, J. C., Stoltz, B. M., Kjaergaard, H. G., and Wennberg, P. O.: Atmospheric autoxidation is increasingly important in urban and suburban North America, P. Natl. Acad. Sci., 115, 64–69, 2018.
Pye, H. O., Pinder, R. W., Piletic, I. R., Xie, Y., Capps, S. L., Lin, Y. H., and Surratt, J. D.: Epoxide pathways improve model predictions of isoprene markers and reveal key role of acidity in aerosol formation, Environ. Sci. Technol., 47, 11056–11064, 2013.
Pye, H. O. T., Chan, A. W. H., Barkley, M. P., and Seinfeld, J. H.: Global modeling of organic aerosol: the importance of reactive nitrogen (NOx and NO3), Atmos. Chem. Phys., 10, 11261–11276, https://doi.org/10.5194/acp-10-11261-2010, 2010.
Pye, H. O. T., Ward-Caviness, C., Murphy, B. N., Appel, K. W., and Seltzer, K. M.: Secondary organic aerosol association with cardiorespiratory disease mortality in the United States, Nat. Comm., 12, 1–8, https://doi.org/10.1038/s41467-021-27484-1, 2021.
Pye, H. O. T., Place, B. K., Murphy, B. N., Seltzer, K. M., D'Ambro, E. L., Allen, C., Piletic, I. R., Farrell, S., Schwantes, R. H., Coggon, M. M., Saunders, E., Xu, L., Sarwar, G., Hutzell, W. T., Foley, K. M., Pouliot, G., Bash, J., and Stockwell, W. R.: Linking gas, particulate, and toxic endpoints to air emissions in the Community Regional Atmospheric Chemistry Multiphase Mechanism (CRACMM), Atmos. Chem. Phys., 23, 5043–5099, https://doi.org/10.5194/acp-23-5043-2023, 2023.
Ramboll Environment and Health: User's Guide – Comprehensive Air Quality Model with Extensions Version 7.20, https://www.camx.com/Files/CAMxUsersGuide_v7.20.pdf (last access: 30 May 2026), 2022.
Robinson, A. L., Donahue, N. M., Shrivastava, M. K., Weitkamp, E. A., Sage, A. M., Grieshop, A. P., and Pandis, S. N.: Rethinking organic aerosols: Semivolatile emissions and photochemical aging, Science, 315, 1259–1262, 2007.
Sarrafzadeh, M., Wildt, J., Pullinen, I., Springer, M., Kleist, E., Tillmann, R., Schmitt, S. H., Wu, C., Mentel, T. F., Zhao, D., Hastie, D. R., and Kiendler-Scharr, A.: Impact of NOx and OH on secondary organic aerosol formation from β-pinene photooxidation, Atmos. Chem. Phys., 16, 11237–11248, https://doi.org/10.5194/acp-16-11237-2016, 2016.
Sasidharan, S., He, Y., Akherati, A., Li, Q., Li, W., Cocker, D., and Jathar, S. H.: Secondary organic aerosol formation from volatile chemical product emissions: Model parameters and contributions to anthropogenic aerosol, Environ. Sci. Technol., 57, 11891–11892, 2023.
Schell, B., Ackermann, I. J., Hass, H., Binkowski, F. S., and Ebel, A.: Modeling the formation of secondary organic aerosol within a comprehensive air quality model system, J. Geophys. Res.-Atmos., 106, 28275–28293, 2001.
Shrivastava, M., Fast, J., Easter, R., Gustafson Jr., W. I., Zaveri, R. A., Jimenez, J. L., Saide, P., and Hodzic, A.: Modeling organic aerosols in a megacity: comparison of simple and complex representations of the volatility basis set approach, Atmos. Chem. Phys., 11, 6639–6662, https://doi.org/10.5194/acp-11-6639-2011, 2011.
Shrivastava, M., Easter, R. C., Liu, X., Zelenyuk, A., Singh, B., Zhang, K., and Tiitta, P.: Global transformation and fate of SOA: Implications of low-volatility SOA and gas-phase fragmentation reactions, J. Geophys. Res.-Atmos., 120, 4169–4195, 2015.
Seltzer, K. M., Pennington, E., Rao, V., Murphy, B. N., Strum, M., Isaacs, K. K., and Pye, H. O. T.: Reactive organic carbon emissions from volatile chemical products, Atmos. Chem. Phys., 21, 5079–5100, https://doi.org/10.5194/acp-21-5079-2021, 2021.
Strader, R., Lurmann, F., and Pandis, S. N.: Evaluation of secondary organic aerosol formation in winter, Atmos. Environ., 33, 4849–4863, 1999.
Tsimpidi, A. P., Karydis, V. A., Pandis, S. N., and Lelieveld, J.: Global combustion sources of organic aerosols: model comparison with 84 AMS factor-analysis data sets, Atmos. Chem. Phys., 16, 8939–8962, https://doi.org/10.5194/acp-16-8939-2016, 2016.
Vitali, B., Bettineschi, M., Cholakian, A., Zardi, D., Bianchi, F., Sinclair, V. A., and Mikkola, J.: Analysis of chemical and transport processes of biogenic aerosols over the northern Apennines: insights from the WRF-CHIMERE model, Environ. Sci.: Atmos., 4, 967–987, 2024.
Wennberg, P. O.: Let's Abandon the “High NOx” and “Low NOx” Terminology, ACS ES&T Air, 1, 3–4, 2023.
Wildt, J., Mentel, T. F., Kiendler-Scharr, A., Hoffmann, T., Andres, S., Ehn, M., Kleist, E., Müsgen, P., Rohrer, F., Rudich, Y., Springer, M., Tillmann, R., and Wahner, A.: Suppression of new particle formation from monoterpene oxidation by NOx, Atmos. Chem. Phys., 14, 2789–2804, https://doi.org/10.5194/acp-14-2789-2014, 2014.
Yarwood, G. and Tuite, K.: Representing Ozone Formation from Volatile Chemical Products (VCP) in Carbon Bond (CB) Chemical Mechanisms, Atmosphere, 15, 1–19, https://doi.org/10.3390/atmos15020178, 2024.
Yu, H., Møller, K. H., Buenconsejo, R. S., Crounse, J. D., Kjaergaard, H. G., and Wennberg, P. O.: Atmospheric Photo-Oxidation of 2-Ethoxyethanol: Autoxidation Chemistry of Glycol Ethers, J. Phys. Chem. A, 127, 9564–9579, 2023.
Zawadowicz, M. A., Lee, B. H., Shrivastava, M., Zelenyuk, A., Zaveri, R. A., Flynn, C., and Shilling, J. E.: Photolysis controls atmospheric budgets of biogenic secondary organic aerosol, Environ. Sci. Technol., 54, 3861–3870, 2020.
Zhang, Q. J., Beekmann, M., Drewnick, F., Freutel, F., Schneider, J., Crippa, M., Prevot, A. S. H., Baltensperger, U., Poulain, L., Wiedensohler, A., Sciare, J., Gros, V., Borbon, A., Colomb, A., Michoud, V., Doussin, J.-F., Denier van der Gon, H. A. C., Haeffelin, M., Dupont, J.-C., Siour, G., Petetin, H., Bessagnet, B., Pandis, S. N., Hodzic, A., Sanchez, O., Honoré, C., and Perrussel, O.: Formation of organic aerosol in the Paris region during the MEGAPOLI summer campaign: evaluation of the volatility-basis-set approach within the CHIMERE model, Atmos. Chem. Phys., 13, 5767–5790, https://doi.org/10.5194/acp-13-5767-2013, 2013.
Zhang, X., Cappa, C. D., Jathar, S. H., McVay, R. C., Ensberg, J. J., Kleeman, M. J., and Seinfeld, J. H.: Influence of vapor wall loss in laboratory chambers on yields of secondary organic aerosol, P. Natl. Acad. Sci., 111, 5802–5807, 2014.
Zhao, B., Wang, S., Donahue, N. M., Jathar, S. H., Huang, X., Wu, W., and Robinson, A. L.: Quantifying the effect of organic aerosol aging and intermediate-volatility emissions on regional-scale aerosol pollution in China, Sci. Rep., 6, 28815, https://doi.org/10.1038/srep28815, 2016.
Zhao, D., Schmitt, S. H., Wang, M., Acir, I.-H., Tillmann, R., Tan, Z., Novelli, A., Fuchs, H., Pullinen, I., Wegener, R., Rohrer, F., Wildt, J., Kiendler-Scharr, A., Wahner, A., and Mentel, T. F.: Effects of NOx and SO2 on the secondary organic aerosol formation from photooxidation of α-pinene and limonene, Atmos. Chem. Phys., 18, 1611–1628, https://doi.org/10.5194/acp-18-1611-2018, 2018.
Zhao, Y., Hennigan, C. J., May, A. A., Tkacik, D. S., de Gouw, J. A., Gilman, J. B., and Robinson, A. L.: Intermediate-volatility organic compounds: a large source of secondary organic aerosol, Environ. Sci. Technol., 48, 13743–13750, 2014.