the Creative Commons Attribution 4.0 License.
the Creative Commons Attribution 4.0 License.
 | 04 Jun 2026
Synchronization of source and sink by boundary layer evolution: a key to new particle formation under varying ozone pollution
Yulin Wang
Deyu Liu
Honglei Wang
Shuangshuang Shi
Qun Hu
Zihan Wang
Zirui Liu
Tianliang Zhao
Lijuan Shen
Atmospheric new particle formation (NPF) is a vital source of aerosol and cloud condensation nuclei, regulated by complex meteorological and chemical factors. Utilizing ground aerosol particle size distributions and vertical observations, this study employs a generalized additive model (GAM) and SHapley Additive exPlanations (SHAP) to quantitatively assess the marginal contributions of factors driving NPF under the NPF scenario and three non-NPF scenarios. We found that NPF depends on the synchronization of enhanced source strength and weakened sink intensity, a process controlled by planetary boundary layer evolution. Under the NPF scenario, the breakup of the inversion layer and entrainment of cleaner air aloft promote vertical mixing. This rapidly reduces the condensation sink (CS) while transporting ozone (O3) to the surface, allowing precursor formation to coincide with a clean background, thus creating a favorable nucleation window. In contrast, nucleation is inhibited in non-NPF scenarios through distinct mechanisms: insufficient oxidation capacity (Non-O3 scenario), source–sink desynchronization caused by stable stratification suppressing vertical exchange (Low-O3 scenario), or rapid scavenging by high background particles (High-O3 scenario). Correlation analysis and SHAP method corroborate the source–sink competition mechanism. Under the NPF scenario, nucleation (Nuc) mode significantly correlates with SO2, with high temperature and sufficient precursors contributing positively to its predicted value. However, predicted Nuc values are dominated by background particles under the Low-O3 scenario and negatively influenced by T and SO2 under the Non-O3 scenario, while under the High-O3 scenario, pre-existing aerosols effectively offset precursor contributions.
- Article
(6864 KB) - Full-text XML
-
Supplement
(24879 KB) - BibTeX
- EndNote


Atmospheric new particle formation (NPF) is one of the major sources of atmospheric aerosols (Gordon et al., 2017; Jiang et al., 2021) and serves as a critical pathway for the formation of cloud condensation nuclei (CCN) (Matsui et al., 2011; Zhu et al., 2022). As a result, it not only significantly impacts air quality (Kulmala et al., 2021; Tang et al., 2021), but also further modulates cloud microphysical processes, radiative balance, and climate effect (Makkonen et al., 2012; Sebastian et al., 2021; Sullivan et al., 2018).
Previous studies generally suggest that the occurrence and development of NPF are jointly regulated by multiple factors. Among them, meteorological elements influence the accumulation or dilution of precursors through their influence on planetary boundary layer (PBL) structure, turbulence, and radiative conditions (Dai et al., 2017; Lai et al., 2022a; Watson et al., 2023). Meanwhile, the concentration and production rate of precursors determine the source strength, representing indispensable prerequisites for NPF (Jin et al., 2025; Wang et al., 2013a). Concurrently, the condensation sink (CS), dominated by background aerosol particles, scavenges precursor vapors and newly formed clusters, thereby suppressing nucleation (Du et al., 2022; Liu et al., 2024; Shang et al., 2023).
Ozone (O3), as a key oxidant for driving the formation of nucleation precursors (Lelieveld et al., 2008; Liao et al., 2009), exhibits increasingly complex influences on the NPF process (Tiszenkel and Lee, 2023; Zhang et al., 2024) under the prominent composite air pollution conditions in China (Lyu et al., 2024; Wang et al., 2025; Zong et al., 2021). Although some studies argue that O3 enhances atmospheric oxidation capacity and accelerates the formation of nucleation precursors (Liu et al., 2022; Tan et al., 2022), thereby promoting NPF, a growing number of observational evidence indicates that NPF does not necessarily occur even under high O3 pollution conditions (Carnerero et al., 2019; Kanawade et al., 2011; Nie et al., 2014). Therefore, a purely chemical perspective is insufficient to fully explain the behavior of NPF under different O3 backgrounds.
In fact, as a core driver of atmospheric physical processes, PBL plays an important role in both the variation of ground pollutant concentrations and the NPF process. Lai et al. (2022b) noted that NPF often initiates at the top of the boundary layer or within the residual layer, rather than just at the surface. With the development and lifting of the unstable daytime PBL, particles formed aloft can be entrained into the mixed layer and subsequently transported to the surface (Lampilahti et al., 2021; Nilsson et al., 2001; Wehner et al., 2010), but the intense vertical exchange can also effectively dilute near-surface pollutants (Su et al., 2018; Xia et al., 2022), collectively facilitating NPF. On the contrary, a stable boundary layer structure tends to suppress pollutant diffusion, leading to the accumulation of O3 and PM2.5 near the surface (Ding et al., 2016; Huang et al., 2018; Su et al., 2022; Wang et al., 2018) and a significant enhancement of the background CS (Petäjä et al., 2016), which inhibits nucleation and particle growth. Therefore, the evolution of the boundary layer structure needs to be considered to have a more comprehensive understanding of NPF.
Although previous studies have revealed the influence of physical or chemical processes in the atmosphere on NPF, they are mostly limited to discussions of single processes and qualitative analyses. However, in the real atmosphere, precursors, meteorological elements, background aerosols, and PBL structure are always highly coupled and exhibit significant nonlinear characteristics (Fiore et al., 2015; Jacob and Winner, 2009; Li et al., 2017; Wang et al., 2015). Therefore, traditional correlation analysis is difficult to quantitatively describe the relative importance of different factors (Liu and Shi, 2021; Qi et al., 2024; Zheng et al., 2023), and even more difficult to explain their synergistic control mechanisms, which limits our in-depth understanding of NPF in complex atmospheric environments.
In recent years, interpretable machine learning methods have offered new methods for addressing the above challenges. Among them, the SHapley Additive exPlanations (SHAP) method has been gradually applied in the study of atmospheric and air pollution (Hou et al., 2025; Houdou et al., 2024; Ma et al., 2023; Yenkikar et al., 2025), due to its ability to quantitatively analyze the marginal contribution of various input variables to model predictions (Lundberg et al., 2018; Lundberg and Lee, 2017). However, this method is still rarely applied to NPF research, especially regarding the question of whether NPF can occur under different O3 pollution backgrounds.
To address this gap, this study integrates ground-based aerosol particle size distributions (PSD), vertical observation data, and background particles kinetic parameters to systematically compare the differences between NPF scenario and non-NPF scenarios under three different O3 pollution backgrounds. By combining the GAM model with the SHAP method, we quantitatively resolve the contributions of different factors to the particle number concentration of the nucleation (Nuc) mode. The results demonstrate that NPF depends on whether the increase in sources and the reduction in sinks occur synchronously. This finding provides a new perspective for explaining the absence of NPF under high O3 conditions, and is of great significance for understanding aerosol evolution mechanisms under composite pollution.
2.1 Data Collection and Processing
The observation period for this study was from 30 May to 15 June 2018. Hourly surface air quality data (PM2.5, PM10, SO2, NO2, CO, and O3) and meteorological elements (wind speed, wind direction, temperature (T), and relative humidity (RH)) were obtained from the Ministry of Ecology and Environment of China (MEE) (https://www.mee.gov.cn/, last access: 3 June 2026) and the Nanjing University of Information Science and Technology (NUIST) meteorological station, respectively. In addition, vertical observation data (O3, PM2.5, and black carbon (BC)) and ground-based aerosol particle size distribution (5 min resolution, 0.01–10 µm) were respectively collected by an unmanned aerial vehicle (UAV) observation platform and a WPS-1000 instrument at the Intelligent Manufacturing Industrial Park in the northern suburbs of Nanjing (Zhongshan Park; 32.35° N, 118.72° E). Detailed descriptions of the site environment and instrumental configurations can be found in Shi et al. (2022).
To ensure the reliability of the analysis, all observational data were first subjected to quality control. Subsequently, the ground-level meteorological elements and pollutant concentrations used for SHAP analysis were averaged hourly, while the time resolution of the vertical observation data was set to 3 h to accurately reflect the atmospheric vertical structure during the study period.
2.2 NPF Event Identification and Pollution Scenario Classification
Based on previous studies (Dal Maso et al., 2005; Herrmann et al., 2014; Kerminen et al., 2018; Kulmala et al., 2004; Yue et al., 2011), NPF events in this study were identified according to the following three criteria: (1) A clear new particle mode appears in the particle number concentration size distribution, with an initial particle size within the nucleation (Nuc) mode range (10–20 nm); (2) This mode persists for at least 1 h during the observation period; (3) The particle size of this mode continuously evolves towards larger sizes over time, accompanied by a continuous increase in the particle number concentration within the mode. Only when all the above conditions are met is it considered an NPF event, and that day is defined as an NPF day, whereas the remaining days were classified as non-NPF days.
Meanwhile, according to the Ambient Air Quality Standards (GB 3095–2012; MEE, 2012a) and the Technical Regulation on Ambient Air Quality Index (AQI) (HJ 633–2012; MEE, 2012b), the ozone pollution level during the observation period was classified using the maximum daily 8 h average ozone concentration (MDA8-O3). Specifically, days were defined as Non-O3 (MDA8-O3<160 µg m−3), Low-O3 ( µg m−3), and High-O3 (MDA8-O3>215 µg m−3).
Finally, by combining the NPF event identification with the ozone pollution classification, the observation period was divided into four scenarios:
- 1.
NPF (Low-O3): 30 May, 3 June, and 11–13 June (hereafter NPF);
- 2.
Non-NPF (Non-O3): 31 May, 5 June, and 9–10 June (hereafter Non-O3);
- 3.
Non-NPF (Low-O3): 1–2 June, 6–7 June, and 14–15 June (hereafter Low-O3);
- 4.
Non-NPF (High-O3): 4 June and 8 June (hereafter High-O3).
2.3 Key Kinetic Parameters of NPF
The growth rate (GR, nm h−1) is used to characterize the temporal evolution of the particle diameter of newly formed mode (Dal Maso et al., 2005; Kulmala et al., 2012):
where Dp is the geometric mean diameter of the aerosol particles.
The formation rate (FR, ) represents the rate of change of the number concentration of Nuc mode particles, calculated following the method proposed by Kulmala et al. (2004), while neglecting the flux of particles growing beyond the 20 nm upper limit (Wang et al., 2013b):
where Nnuc is the total number concentration within the Nuc mode, and CoagsNuc denotes the coagulation sink within the Nuc mode. And the coagulation sink (Coags, s−1) describes the loss rate of target particles due to coagulation with background particles and is defined as (Kulmala et al., 2001a):
where is the coagulation coefficient proposed by Fuchs et al. (1965), is the number concentration distribution of background particles.
The condensation sink (CS, s−1) is used to characterize the ability of background aerosols to absorb vapor molecules, and was calculated as (Dal Maso et al., 2005; Kulmala et al., 2001b):
where D is the diffusion coefficient of the vapor molecules, βi is the transition regime correction factor, and dp,i and Ni are the diameter and number concentration of each size bin, respectively.
In addition, based on the empirical linear relationship between GR and sulfuric acid vapor concentration (Kulmala et al., 2001b; Nieminen et al., 2010), the condensable vapor concentration (C, cm−3) was estimated using the following parameterization:
Under the steady-state assumption, the condensable vapor production rate (Q, ) can be further expressed as:
2.4 SHAP Method
The SHAP (Shapley Additive exPlanations) method is a game-theory-based method for machine learning model interpretability, used to quantitatively assess the marginal contribution of each input feature to the model prediction (Lundberg and Lee, 2017; Shapley, 2020). Under the SHAP framework, the prediction for an individual sample can be expressed as the sum of a baseline value and the contributions of all features:
where f(x) denotes the model prediction for sample x, ∅0 is the model baseline value, M is the total number of features, and ∅i represents the SHAP value of the ith feature. The sign of ∅i indicates whether the feature promotes or suppresses the prediction, while its absolute magnitude reflects the strength of its contribution.
Considering the complex nonlinear characteristics among multiple variables in the atmospheric system, this study utilizes generalized additive models (GAM) and the KernelSHAP algorithm (Aas et al., 2019; Bordt and Luxburg, 2022; Lundberg and Lee, 2017; Murase et al., 2009) to quantitatively assess the relative contributions of meteorological elements, pollutant concentrations, and background particle parameters to the changes in particle number concentrations of Nuc mode. Feature importance plots and SHAP summary plots are used to quantify the relative importance of each factor (Lundberg et al., 2020; Zhao et al., 2025), thereby intuitively identifying the dominant factors under different pollution scenarios. Furthermore, SHAP dependence plots are used to describe the average marginal impact of a single variable on model predictions (Lundberg and Lee, 2017; Wei et al., 2025; Yuan et al., 2025), and nonlinear fitting of the scatter distributions was further performed to elucidate the specific response relationships between the variable and the number concentrations of mode.
3.1 Source–Sink Control Mechanism of New Particle Formation
As shown in Fig. S1 in the Supplement, the aerosol number concentration and its size distribution exhibited significant phased evolution characteristics during the observation period. For example, from 6 to 8 June, overall pollution levels were relatively high, with the 20–70 nm size range dominating the particle size distribution and persisting for an extended duration. The total particle number concentration in the 10–100 nm range (N10−100) consistently remained at a high level and displayed a clear increasing trend, with peak values exceeding 105 cm−3. Figure 1c–f show that the number concentrations of the four modes of particles also remained high, but there was no obvious enhancement. During this period, the CS level remained persistently high, with an average value of approximately 0.089 s−1 (Fig. 1g), and the concentrations of the six environmental factors were generally high but showed no pronounced fluctuations (Fig. S2). These features collectively indicate that aerosol evolution during this stage was predominantly controlled by background particles.
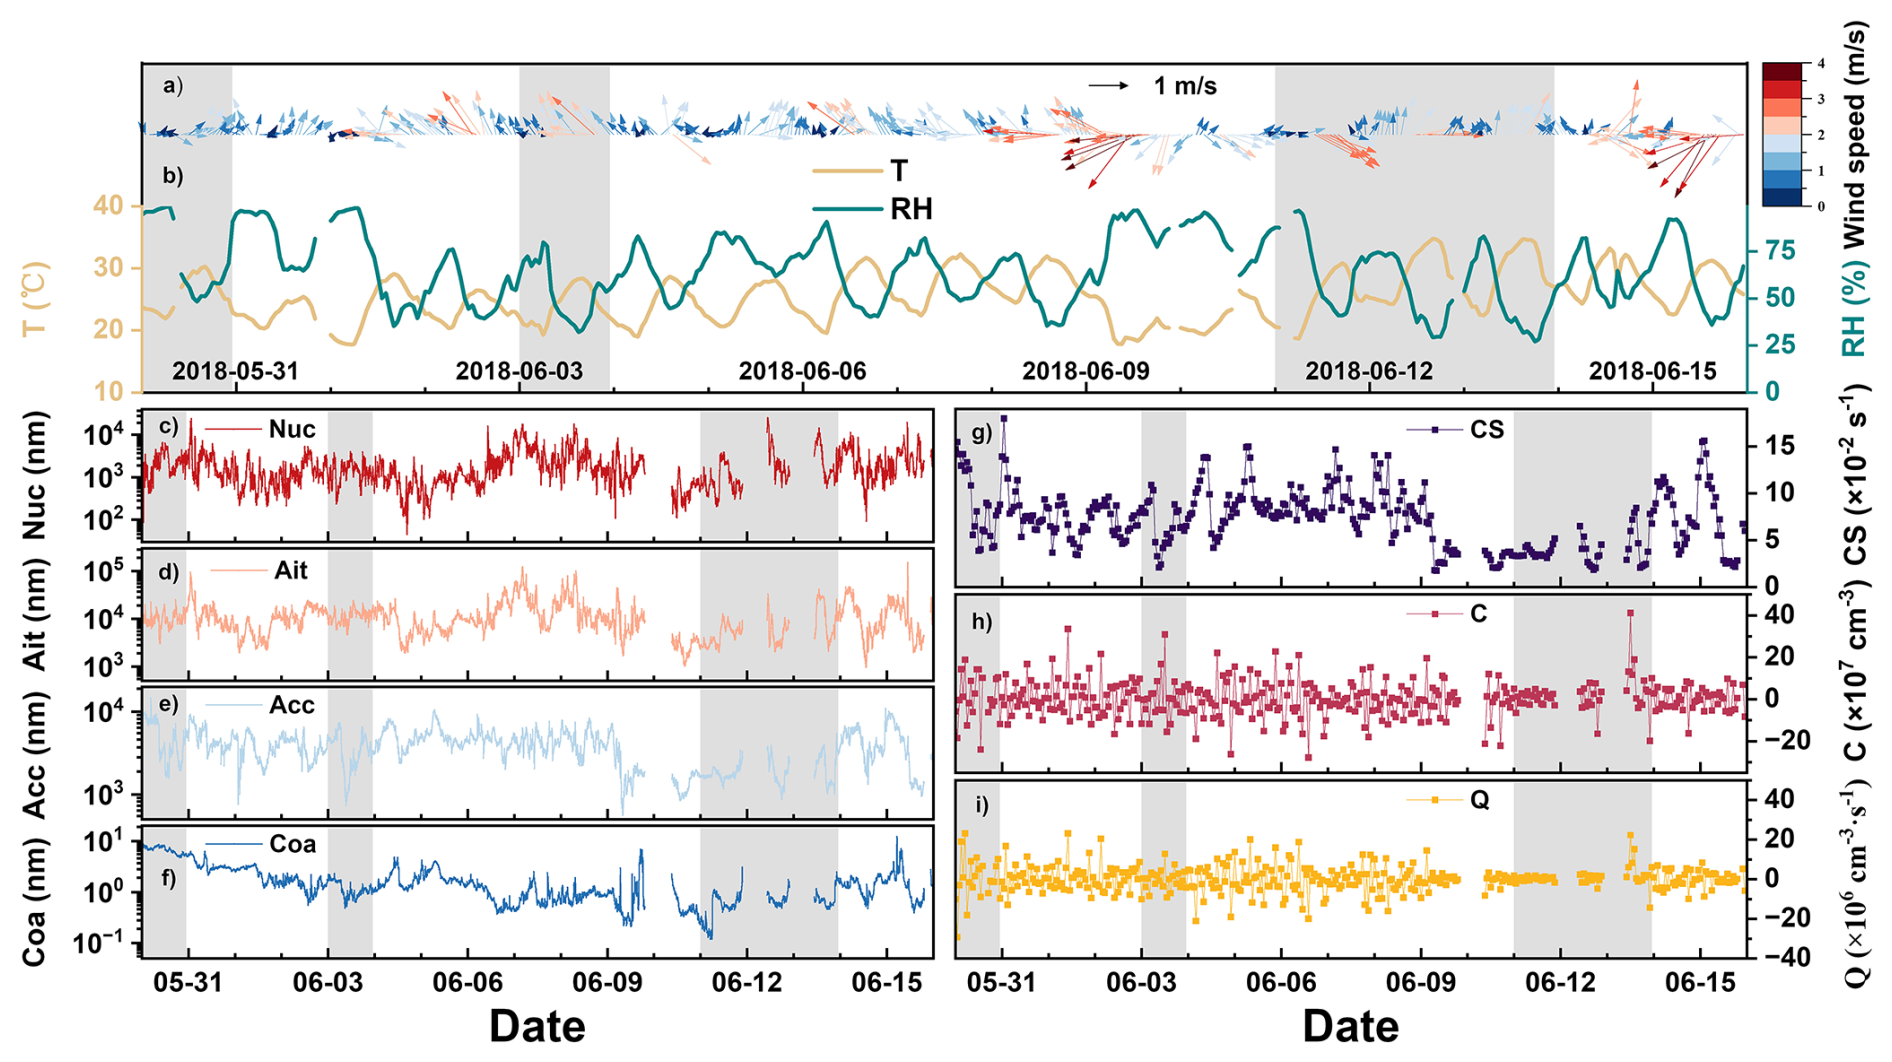
Figure 1Time series of meteorological parameters, particle number concentrations in different modes, and NPF dynamic parameters from 30 May to 15 June 2018: (a) Wind vector, (b) T and RH, (c) NNuc, (d) NAit, (e) NAcc, (f) NCoa, (g) CS, (h) C, and (i) Q. The shaded areas indicate NPF days.
In contrast, during certain periods, the particle size distribution revealed clear growth processes from smaller to larger particle diameters (Fig. S1), lasting approximately 1–2 h. During these episodes, particle number concentrations in the nucleation (Nuc) and Aitken (Ait) modes decreased sharply (Fig. 1c and d), whereas those in the accumulation (Acc) and coarse (Coa) modes exhibited a decrease followed by a subsequent increase (Fig. 1e and f), reflecting the rapid growth of newly formed particles into larger size modes. Simultaneously, lower CS level (Fig. 1g) and weak wind speeds (Fig. 1a) also provided favorable conditions for the survival and growth of newly formed particles.
Based on the classification criteria in Sect. 2.2, a total of five NPF days were identified. Following the method of Birmili et al. (2003), this study determined the time range of each NPF process by using the moments when the particle number concentration in the Nuc mode (10–20 nm) rose and fell to of the daily peak value as the onset and termination of the event. Relevant parameters were then calculated based on the formulations described in Sect. 2.3 (Table 1). As shown in Table 1, the intensity and duration of the NPF process are not controlled by a single factor, instead, they are governed by the dynamic balance between precursor strength (source) and background particle removal capacity (sink).
Table 1Summary of key kinetic parameters for the identified NPF events.
Taking 13 June as an example, although both CS ( s−1) and Coags ( s−1) reached the highest levels among the five events, meaning that newly formed particles and precursors would be strongly removed, which is theoretically unfavorable for nucleation. However, C and Q reached high levels of 7.95×107 cm−3 and 3.81×10⁶ , respectively, favoring precursor formation. As a result, the FR reached its maximum value of 0.71 , indicating that an extremely strong source can effectively offset the removal effect of a high sink. In contrast, on 3 June, the FR was only 0.03 , suggesting slower nucleation initiation. However, both CS ( s−1) and CoagS ( s−1) were the lowest among the five events, the background removal effect was weak, and the final particle growth rate far exceeded that of other events (GR=5.99 nm h−1). This comparison clearly demonstrates that the sources and sinks are closely related in the NPF process: a strong source can compensate for the removal effect of a high sink, while a weak sink facilitates sustained particle growth even under conditions of limited precursor supply.
However, the analysis above only reveals some of the parametric characteristics of NPF, and the key mechanisms determining whether NPF occurs under different O3 pollution backgrounds still need to be explored. To further elucidate these differences, we compared the evolution of particle size distributions across different scenarios. And we found that the NPF scenario exhibited a typical new particle formation signal, with Nuc mode particles significantly increasing around 10:00 (all clock times reported in this paper are given in local Beijing Time (UTC+8)) and continuously growing to larger sizes (Fig. S3a). In contrast, neither the Non-O3 nor the High-O3 scenarios showed clear nucleation characteristics (Fig. S3b and c), but the reasons differed substantially between the two cases.
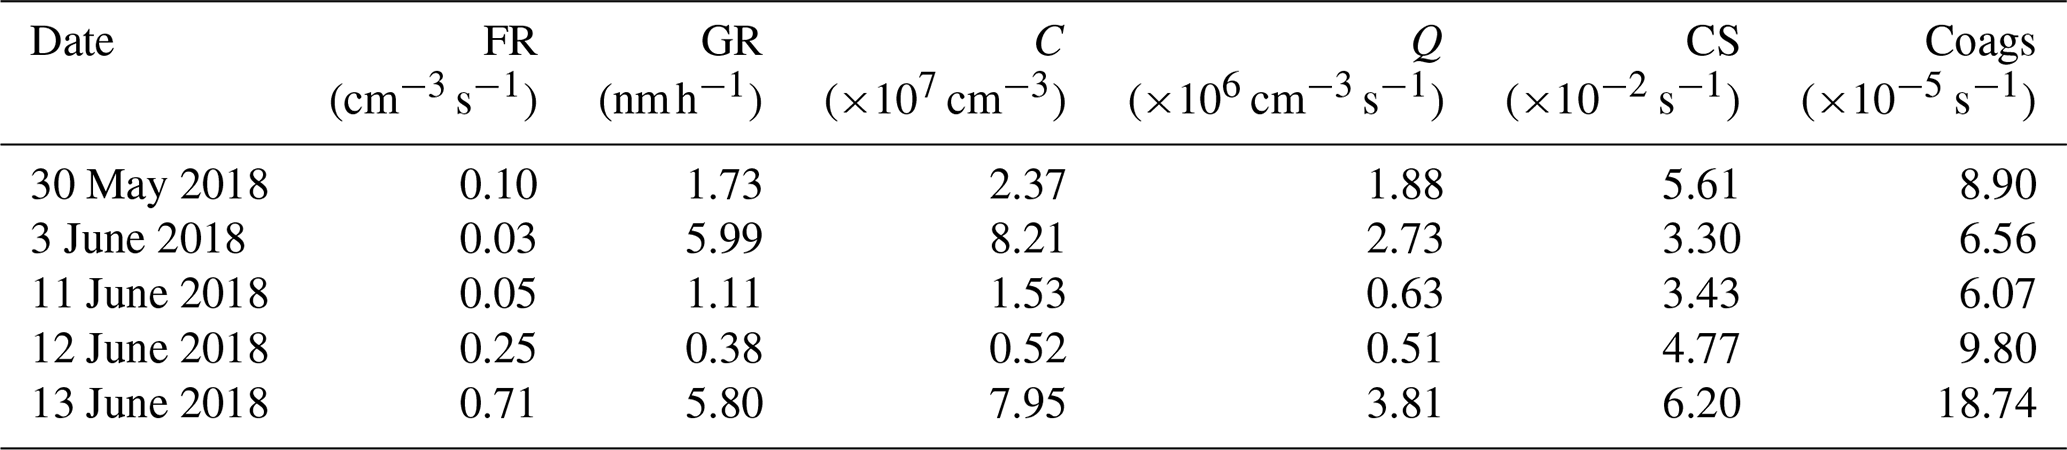
Under the Non-O3 scenario, the particle size distribution was relatively disordered, and there was no significant growth process of Nuc mode particles (Fig. S3b). Although the relatively low background particle concentrations (Fig. 2) and CS levels (Fig. S5c) would, in principle, favor new particle formation, the high humidity environment created by the daily average RH of 80.1 % (Fig. S4b) may also trigger hygroscopic growth effects, thereby exacerbating the scavenging of newly formed clusters by background particles (Molnár et al., 2020; Zang et al., 2019). However, this is unlikely to be the dominant factor for the absence of NPF in this scenario. Instead, the consistently low O3 concentration (Fig. S4d) and T (Fig. S4a) throughout the day lead to weak photochemical reaction activity. Meanwhile, SO2 supply was extremely limited: both its mean concentration and temporal increase were the lowest among the four scenarios (Fig. S4h). Under the combined constraints of weak atmospheric oxidation capacity and insufficient precursor accumulation, the source strength was severely limited, as reflected by persistently low values of C (Fig. S5a) and Q (Fig. S5b). Therefore, we infer that the weak source is the fundamental reason for the absence of NPF under the Non-O3 scenario.
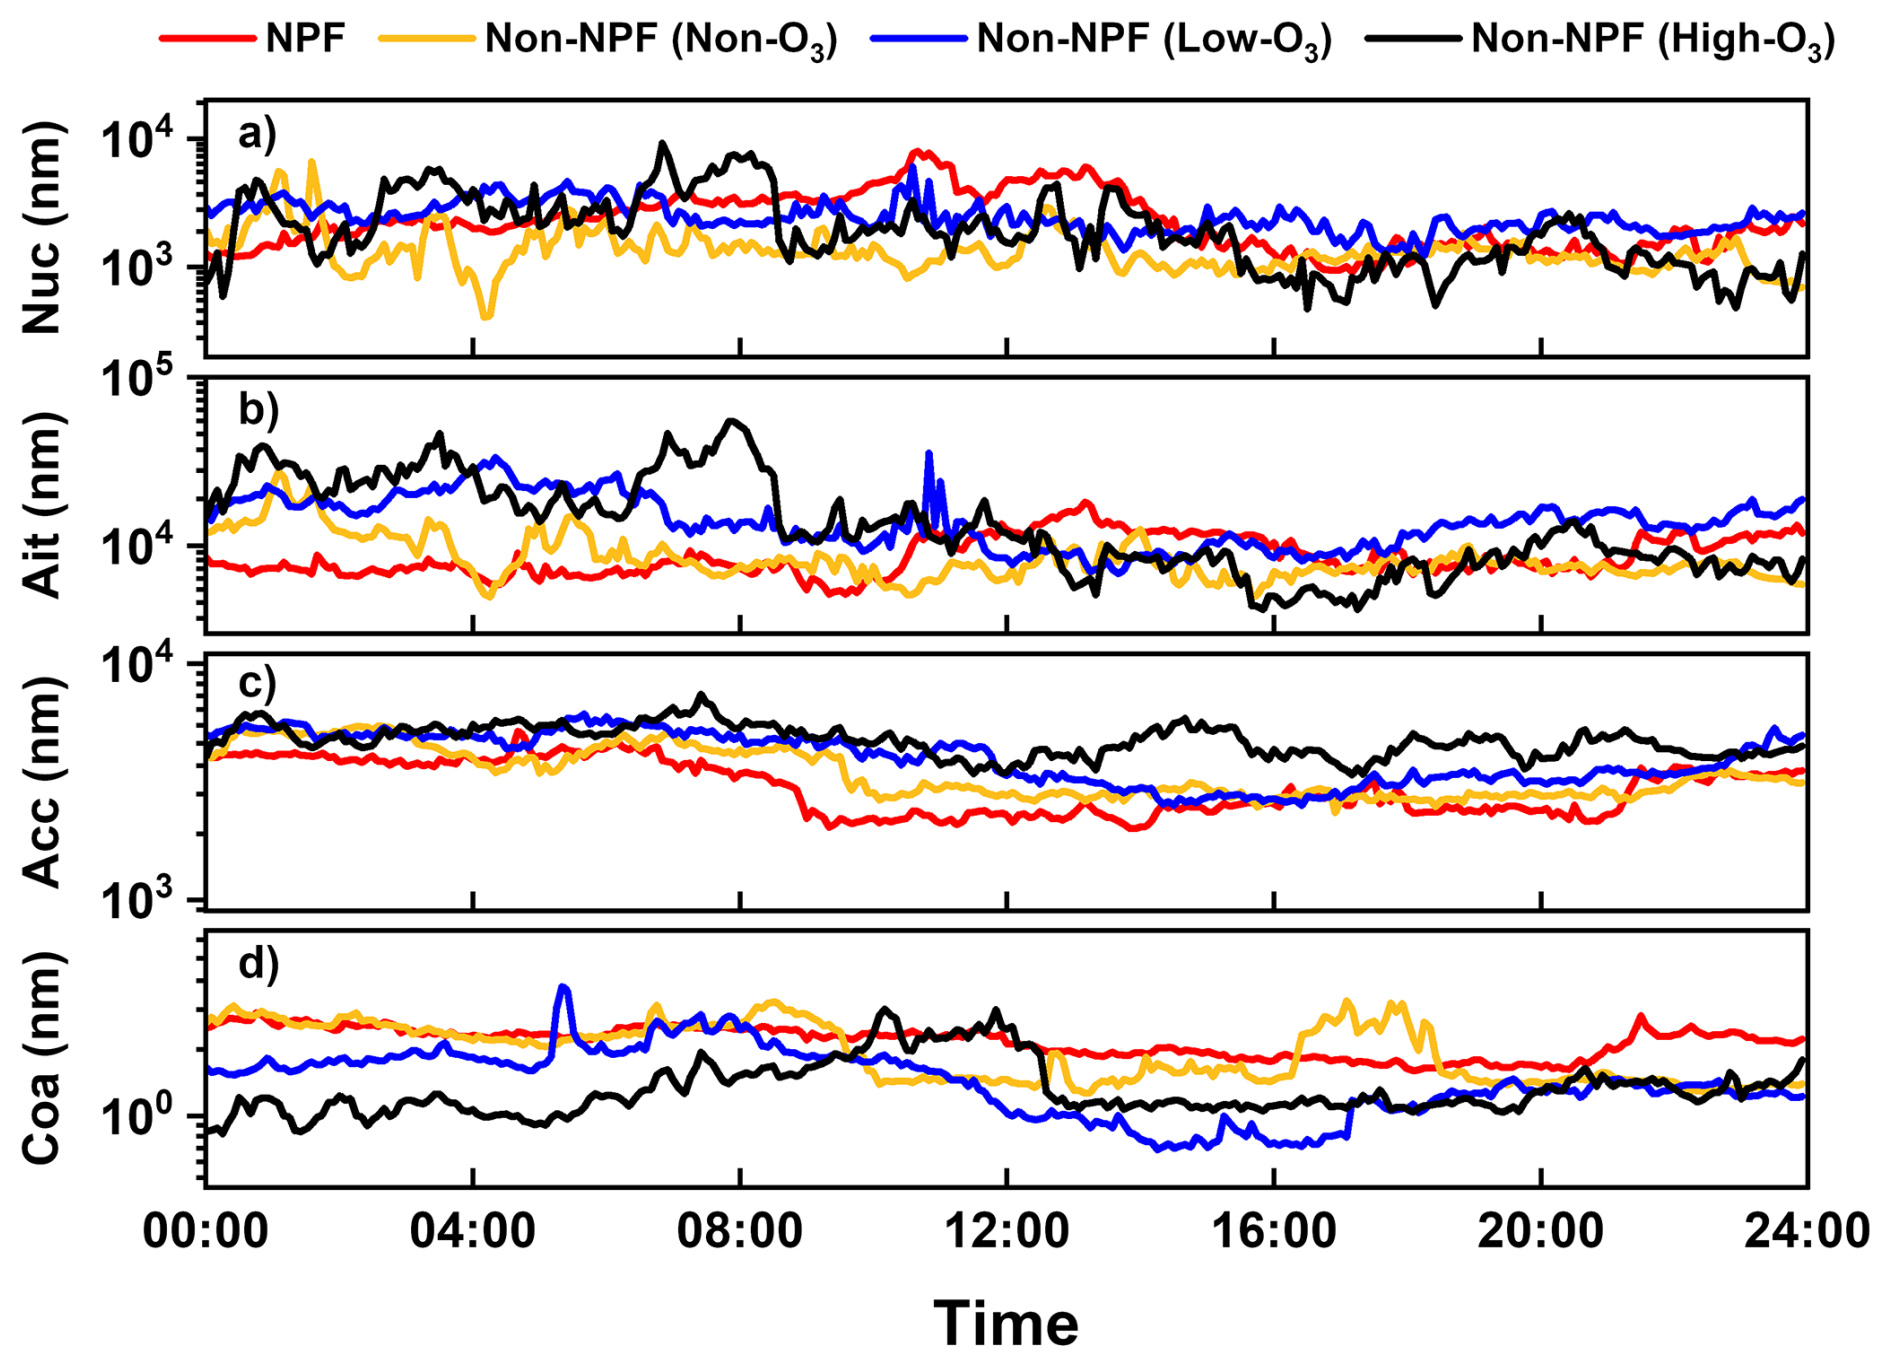
Figure 2Diurnal variations of particle number concentrations in different modes under four classified scenarios: (a) NNuc, (b) NAit, (c) NAcc, (d) NCoa. The red, yellow, blue, and black lines represent the NPF, Non-NPF (Non-O3), Non-NPF (Low-O3) and Non-NPF (High-O3) scenarios, respectively.
Unlike the Non-O3 scenario, the High-O3 scenario exhibited extremely high background particle concentrations, especially from 00:00 to 09:00. However, during the afternoon period with elevated O3 levels, NPF still did not occur; instead, background particle concentrations even showed a slight decline (Fig. S3d). During the critical nucleation period (08:00–12:00), NAcc remained persistently high (Fig. 2c), resulting in drastic fluctuations in CS with an average value as high as s−1, approximately twice that of the NPF scenario ( s−1) (Fig. S5c). Although elevated O3 levels in the afternoon could enhance precursor formation (Fig. S4d), as evidenced by strong fluctuations in Q (Fig. S5b), the extremely strong background CS led to rapid uptake of newly generated precursor by pre-existing coarse particles. As a result, C also exhibits unstable fluctuations (Fig. S5a) because it failed to accumulate. Thus, under the High-O3 scenario, a strong sink can suppress NPF by efficiently removing precursors, despite favorable photochemical conditions.
3.2 Regulation of Source–Sink Terms by Boundary Layer Structure under Similar O3 Backgrounds
According to the classification criteria in Sect. 2.2, both the NPF and Low-O3 scenarios had similarly low O3 pollution levels (160–215 µg m−3). However, NPF occurred only in the former, whereas the latter exhibited a slight increasing trend in Ait mode particle concentrations (Fig. S3c). To further explain the reasons for this contrast, we compared the spatiotemporal evolution of boundary layer structure under the two scenarios.
Under the NPF scenario, the near-surface air temperature decreased with height at 05:00, while an inversion layer existed at approximately 900 m (Fig. S6), implying that convective processes could respond rapidly and be initiated after sunrise (Lapworth, 2006). With increasing solar radiation, rapid surface warming (Fig. S4b) promoted the development of turbulence (Kaimal et al., 1976; Li et al., 2026), especially beginning around 08:00, the rapid lifting of the planetary boundary layer established efficient pathways for vertical exchange (Neu et al., 1994; Stull, 1988). On the one hand, cleaner air aloft was entrained into the mixed layer, rapidly diluting aerosols in the lower layers (Nilsson et al., 2001). This was particularly evident below 300 m, where both PM2.5 (Fig. 3) and BC (Fig. 4) concentrations decreased sharply with height. Near the surface, this process manifested as a pronounced decline in NAcc starting around 07:00 (Fig. 2c), leading to a simultaneous decrease in CS (Fig. S5c) (Korhonen et al., 2004; Lehtinen et al., 2003). In addition, the low RH conditions (Fig. S4b) likely suppressed particle hygroscopic growth, further weakening the CS level (Birmili and Wiedensohler, 2000; Hamed et al., 2007). On the other hand, the inversion layer near 900 m was broken (Fig. S6), accompanied by a weakening of the vertical gradient in the O3 profile within the lower layers (Fig. S9), indicating downward transport of O3 aloft (Song et al., 2024), which led to increased near-surface O3 concentrations (Fig. S4d) and more favorable conditions for nucleation (Jonsson et al., 2007). Crucially, the process of weakened sinks and enhanced atmospheric oxidation capacity driven by the boundary layer coincided temporally with the increase in SO2 concentrations between 07:00 and 09:00 (Fig. S4h). Therefore, the precursors were able to survive and accumulate, ultimately triggering nucleation and sustaining growth.
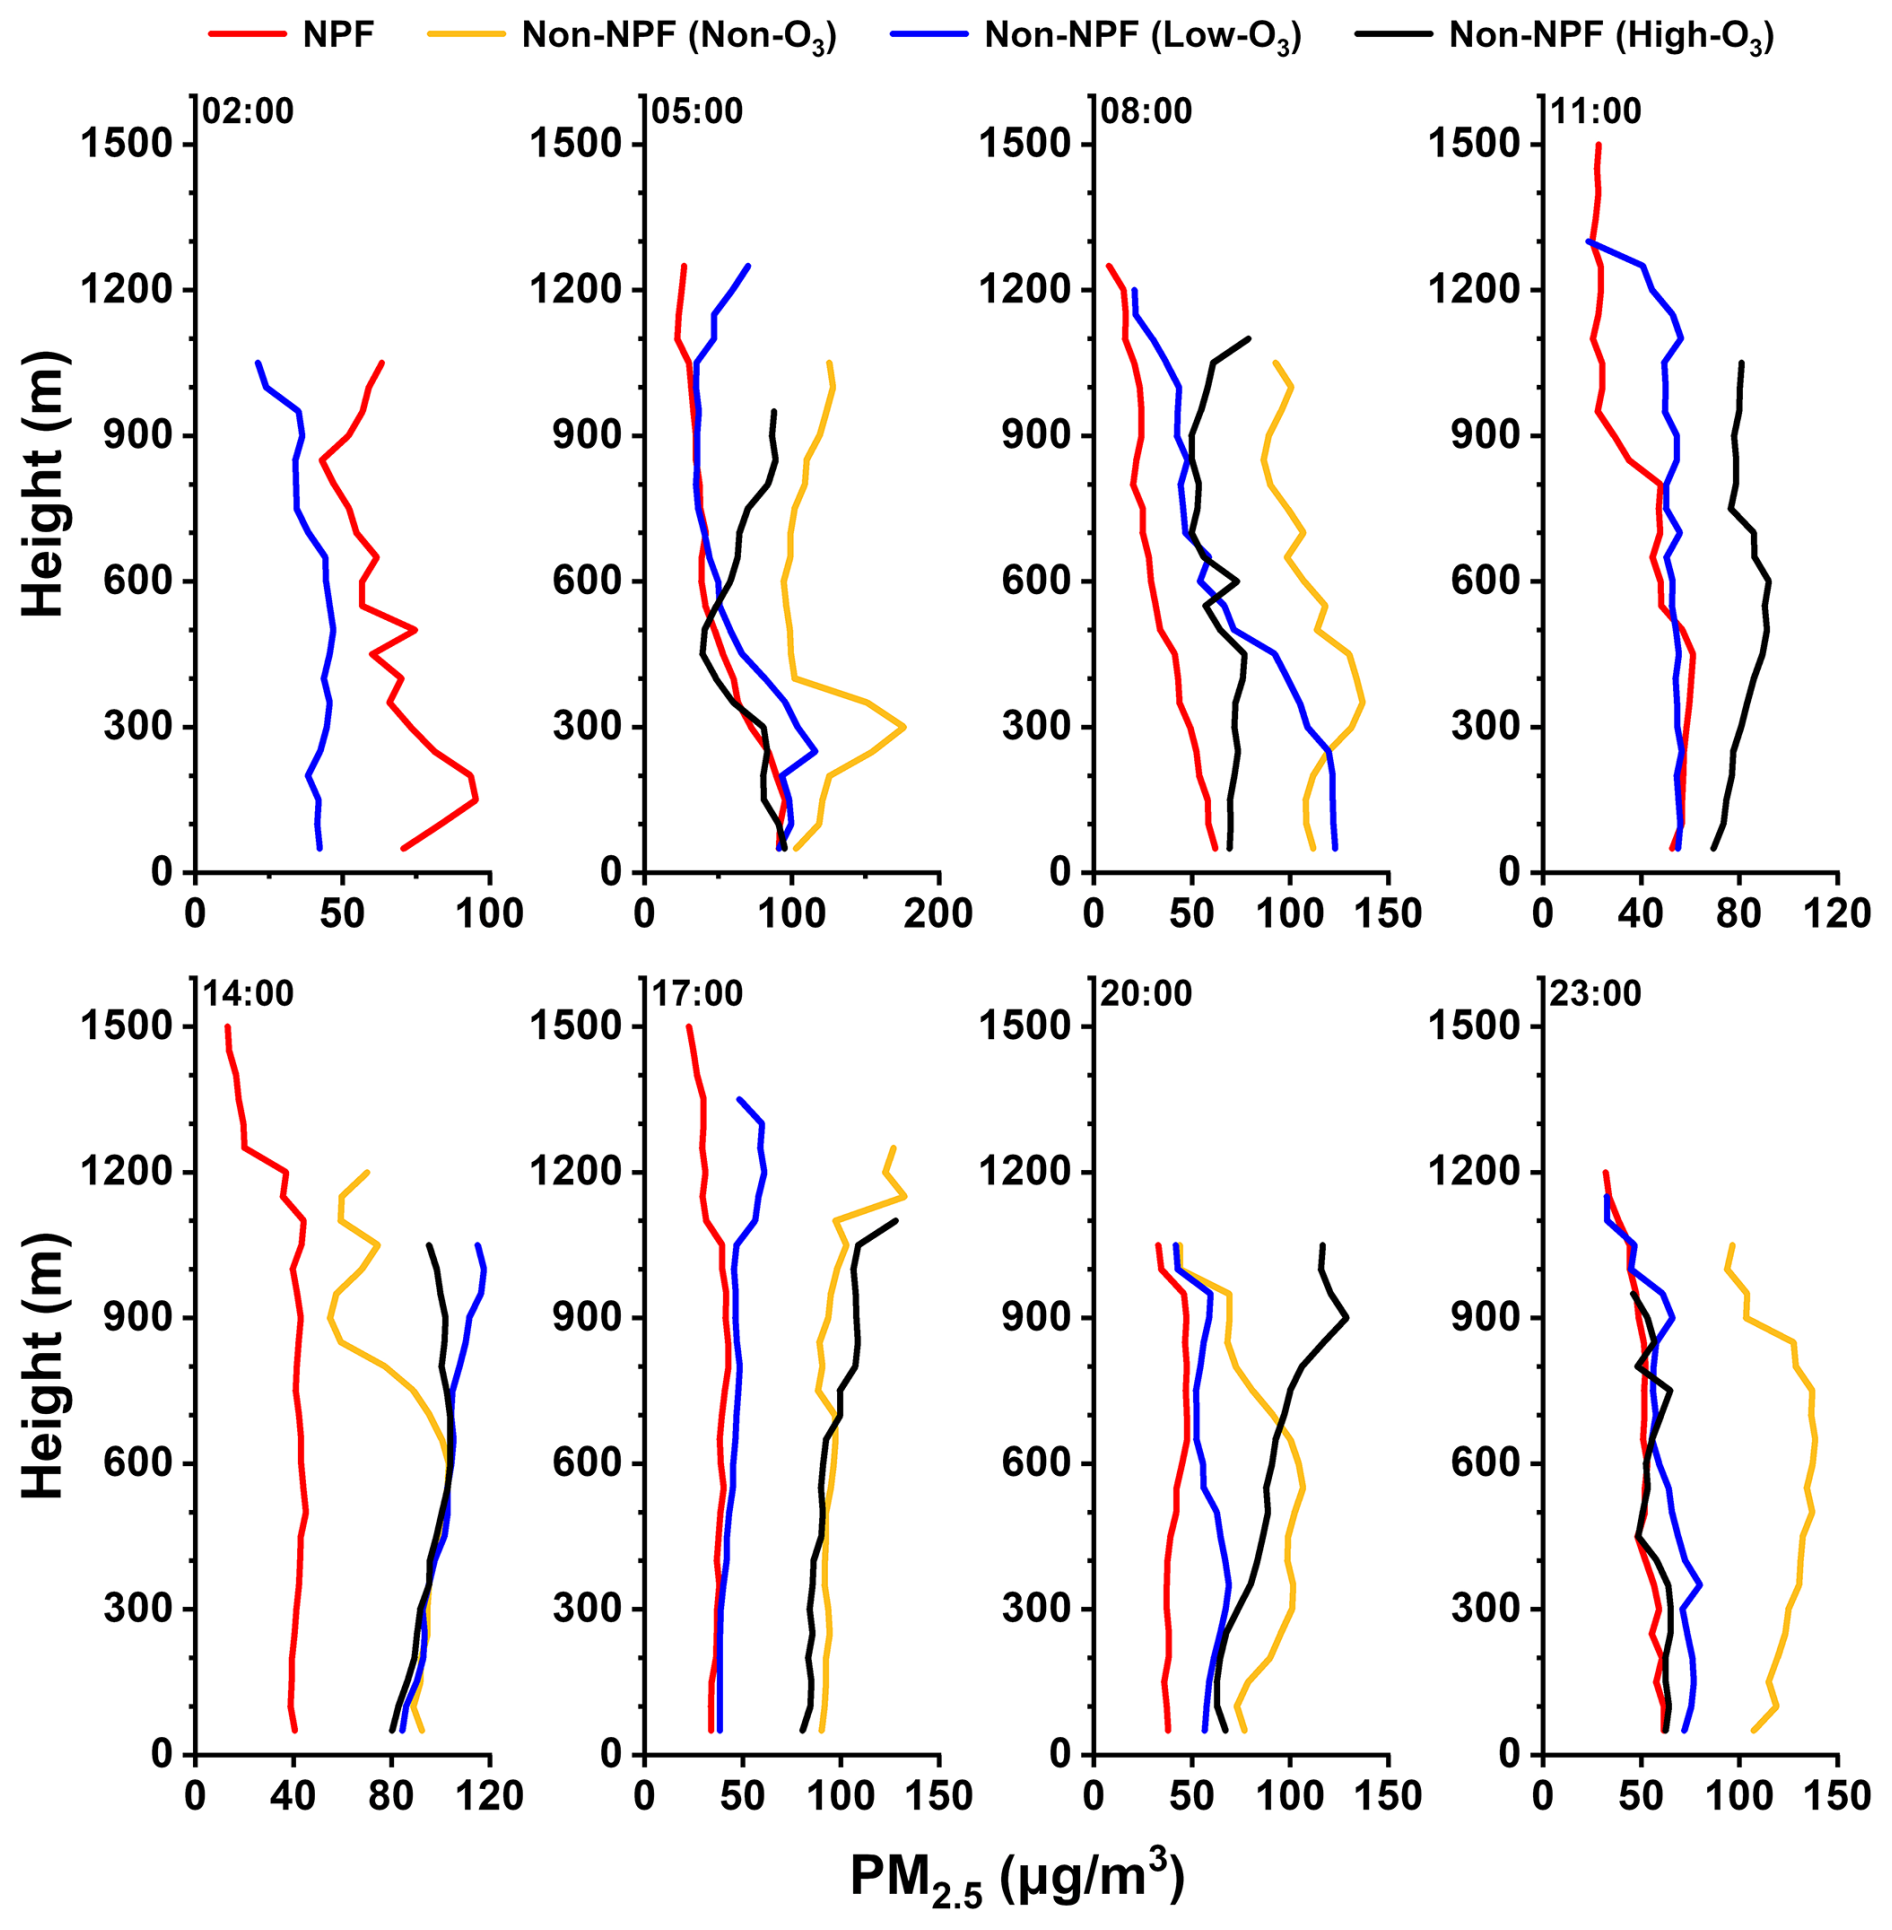
Figure 3Vertical profiles of PM2.5 concentrations at different times under four classified scenarios. The red, yellow, blue, and black lines represent the NPF, Non-NPF (Non-O3), Non-NPF (Low-O3) and Non-NPF (High-O3) scenarios, respectively.
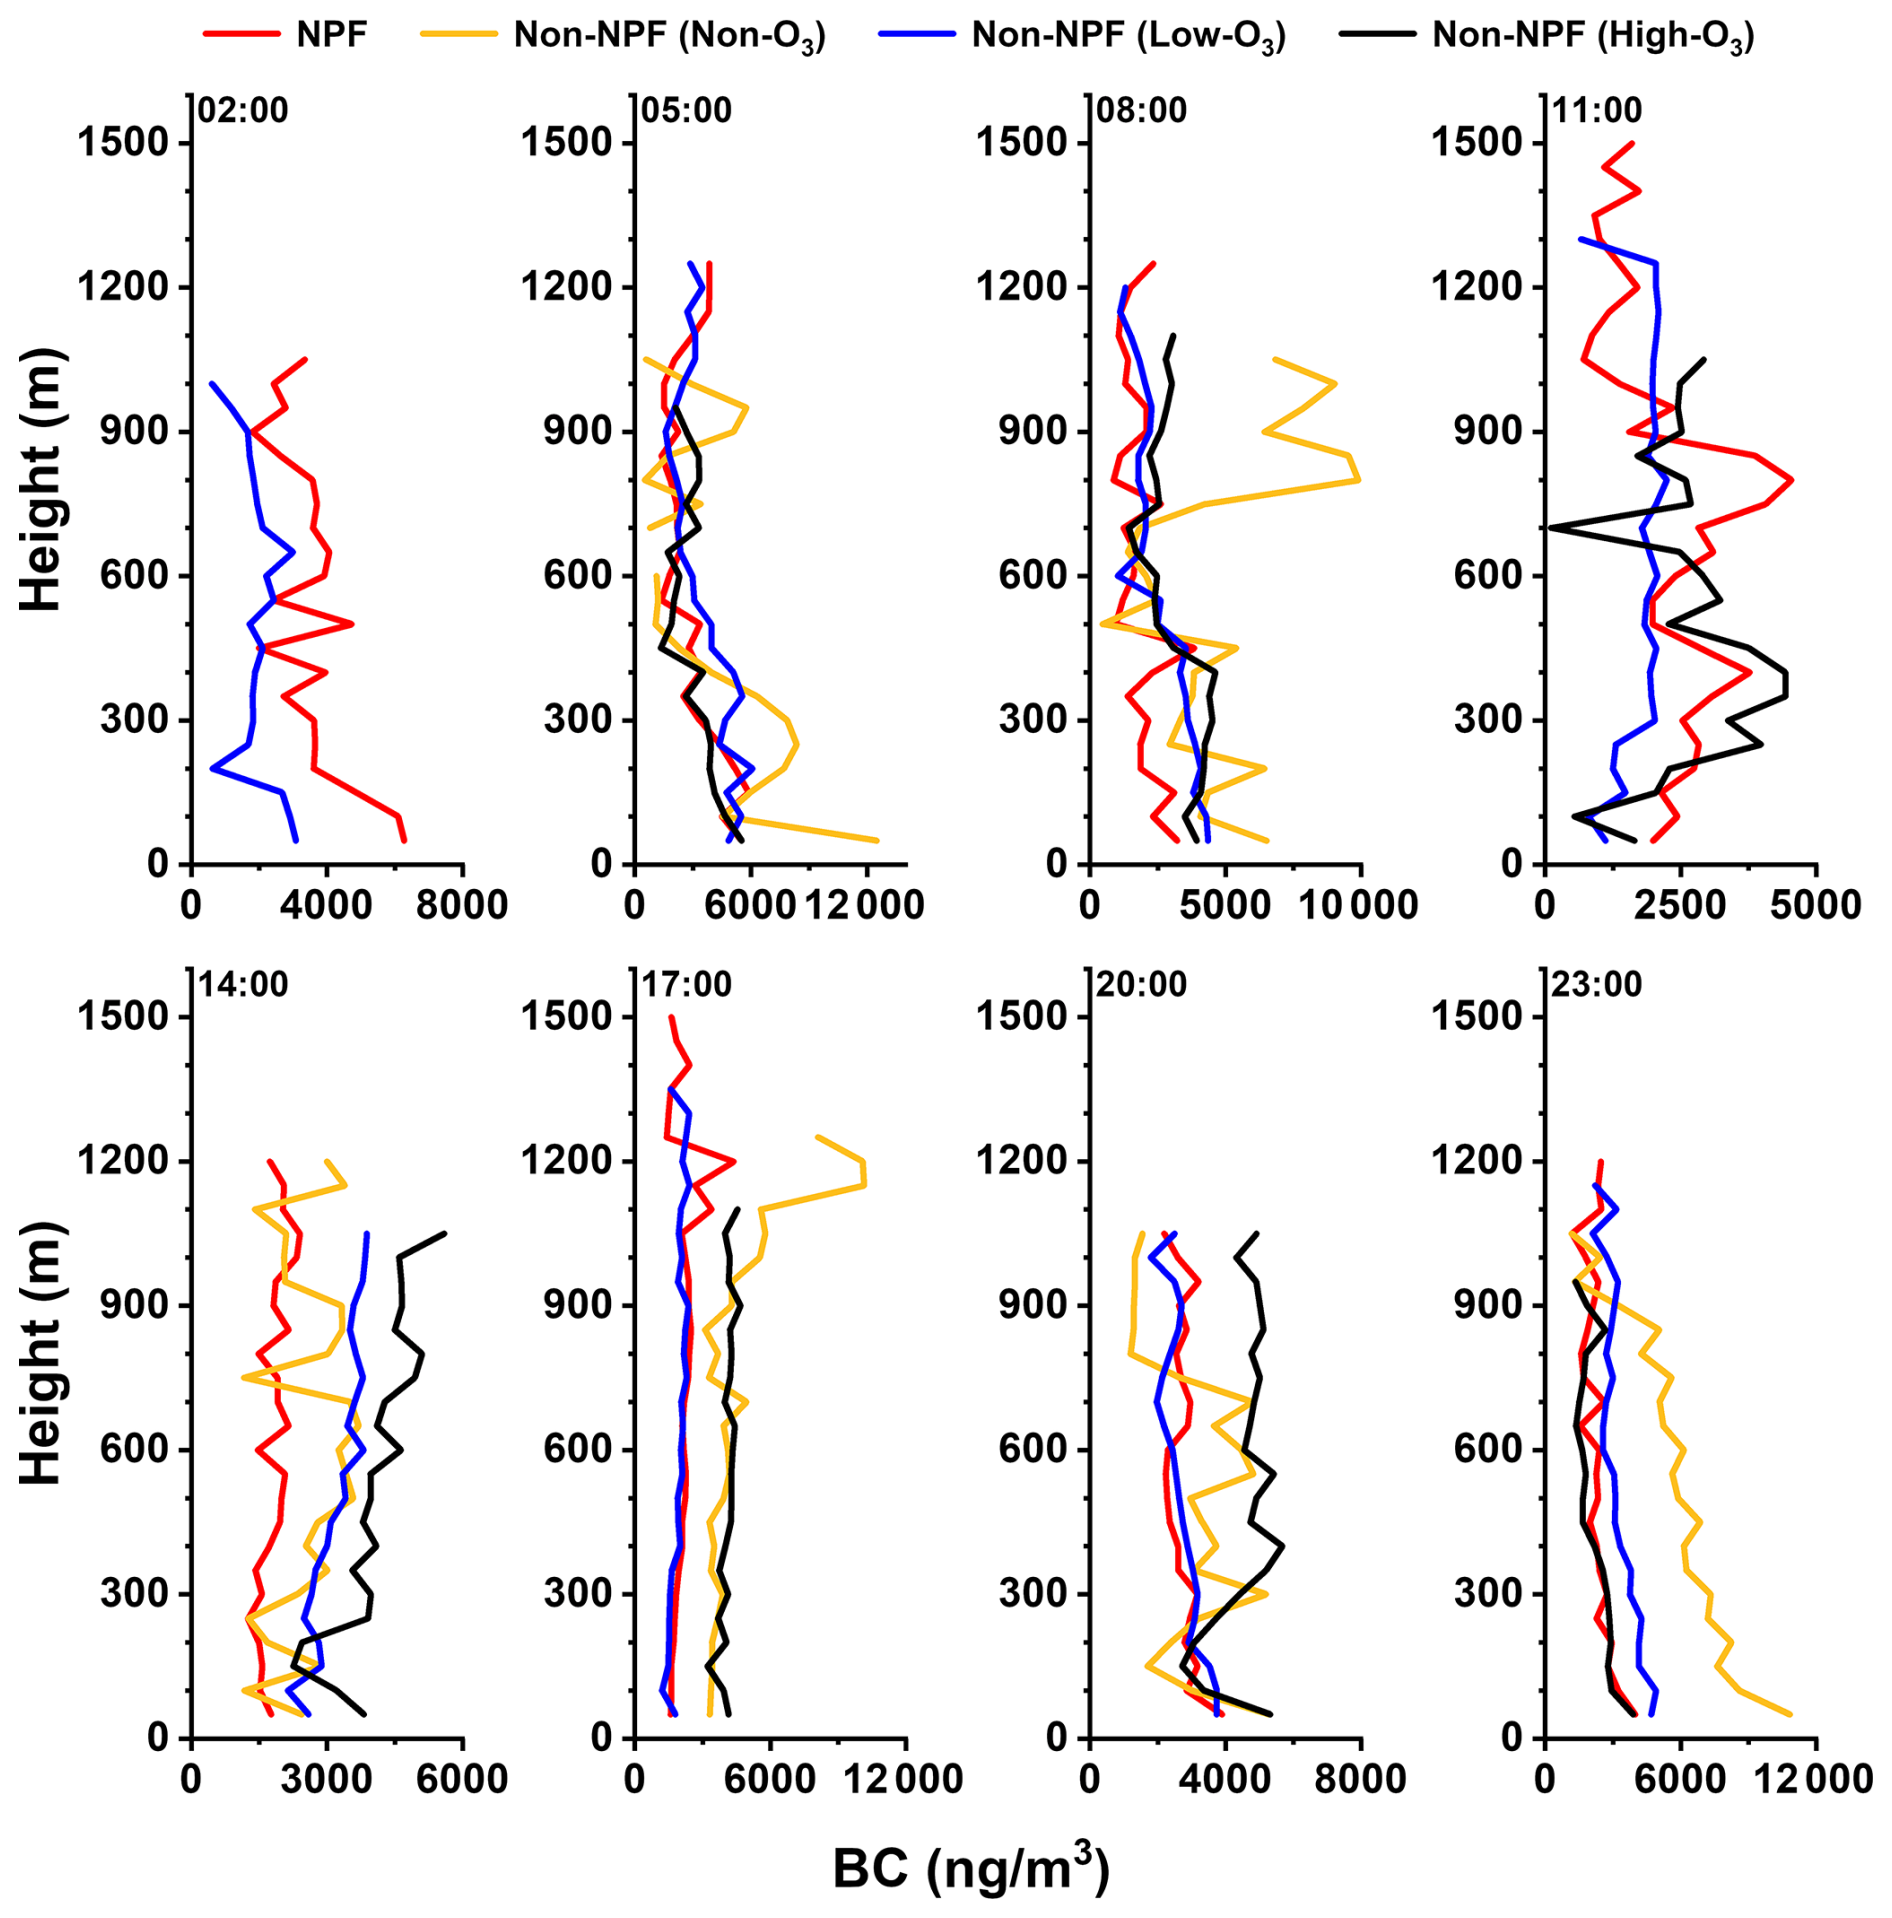
Figure 4Vertical profiles of BC concentrations at different times under four classified scenarios. The red, yellow, blue, and black lines represent the NPF, Non-NPF (Non-O3), Non-NPF (Low-O3) and Non-NPF (High-O3) scenarios, respectively.
In contrast, the Low-O3 scenario was controlled by a stable boundary layer before sunrise. At 05:00, a pronounced inversion layer was present within the 100–150 m layer (Fig. S6), accompanied by high relative humidity (Fig. S7) and weak wind conditions (Fig. S8), collectively establishing a highly stable boundary layer structure. This strongly suppressed the development of turbulent mixing after sunrise, and vertical exchange between the lower and upper layers was persistently limited. As a result, near-surface pollutants were not effectively diluted by cleaner air aloft, and PM2.5 and BC concentrations remained elevated near the surface (Figs. 3 and 4), while NAcc showed no significant change (Fig. 2c). Correspondingly, the CS level did not weaken; instead, it increased rapidly around 10:00 (Fig. S5c), further intensifying the sink strength. This enhancement was likely associated with persistently high near-surface RH (Fig. S4b), which promoted hygroscopic growth of background particles and thereby increased CS (Ali et al., 2025). Meanwhile, although SO2 concentrations showed an increasing trend under this scenario (Fig. S4h), both the magnitude of the increase and the peak values were substantially lower than those observed under the NPF scenario, indicating limited precursor accumulation. More importantly, when SO2 increased, CS did not show a corresponding decrease but instead remained at a high level throughout the critical period. Therefore, we conclude that the asynchrony between source enhancement and sink weakening effectively suppressed the occurrence of NPF under the Low-O3 scenario.
3.3 Comparison of Nucleation Drivers Based on Correlation Analysis and SHAP Method
As shown in Fig. 5, the NPF scenario exhibits the most complex and densely connected correlation network (Fig. 5a). Notably, a significant and strong correlation between the Nuc mode particle concentration and SO2 is observed, which is the only case among the four scenarios where the Nuc mode is directly coupled with a precursor source, indicating that sufficient precursors are required for new particle formation. Meanwhile, both the Acc and Coa modes show significant correlations with multiple atmospheric pollutants, indicating that particle evolution is jointly influenced by background particles. For the Non-O3 scenario (Fig. 5b), the correlations are mainly concentrated in the Acc mode, which shows a significant strong correlation with primary pollutants; while under the Low-O3 scenario (Fig. 5c), the Coa mode is correlated not only with pollutants but also with meteorological elements. However, unlike the NPF scenario, in these two non-NPF scenarios, the Nuc mode is mainly significantly constrained by CS, and its correlations with source-related factors are markedly weakened. Under the High-O3 scenario (Fig. 5d), the overall correlation network is further simplified. Only a strong significant correlation between the Acc mode and CS remains evident, whereas correlations among other particle modes and atmospheric elements are generally weaker.
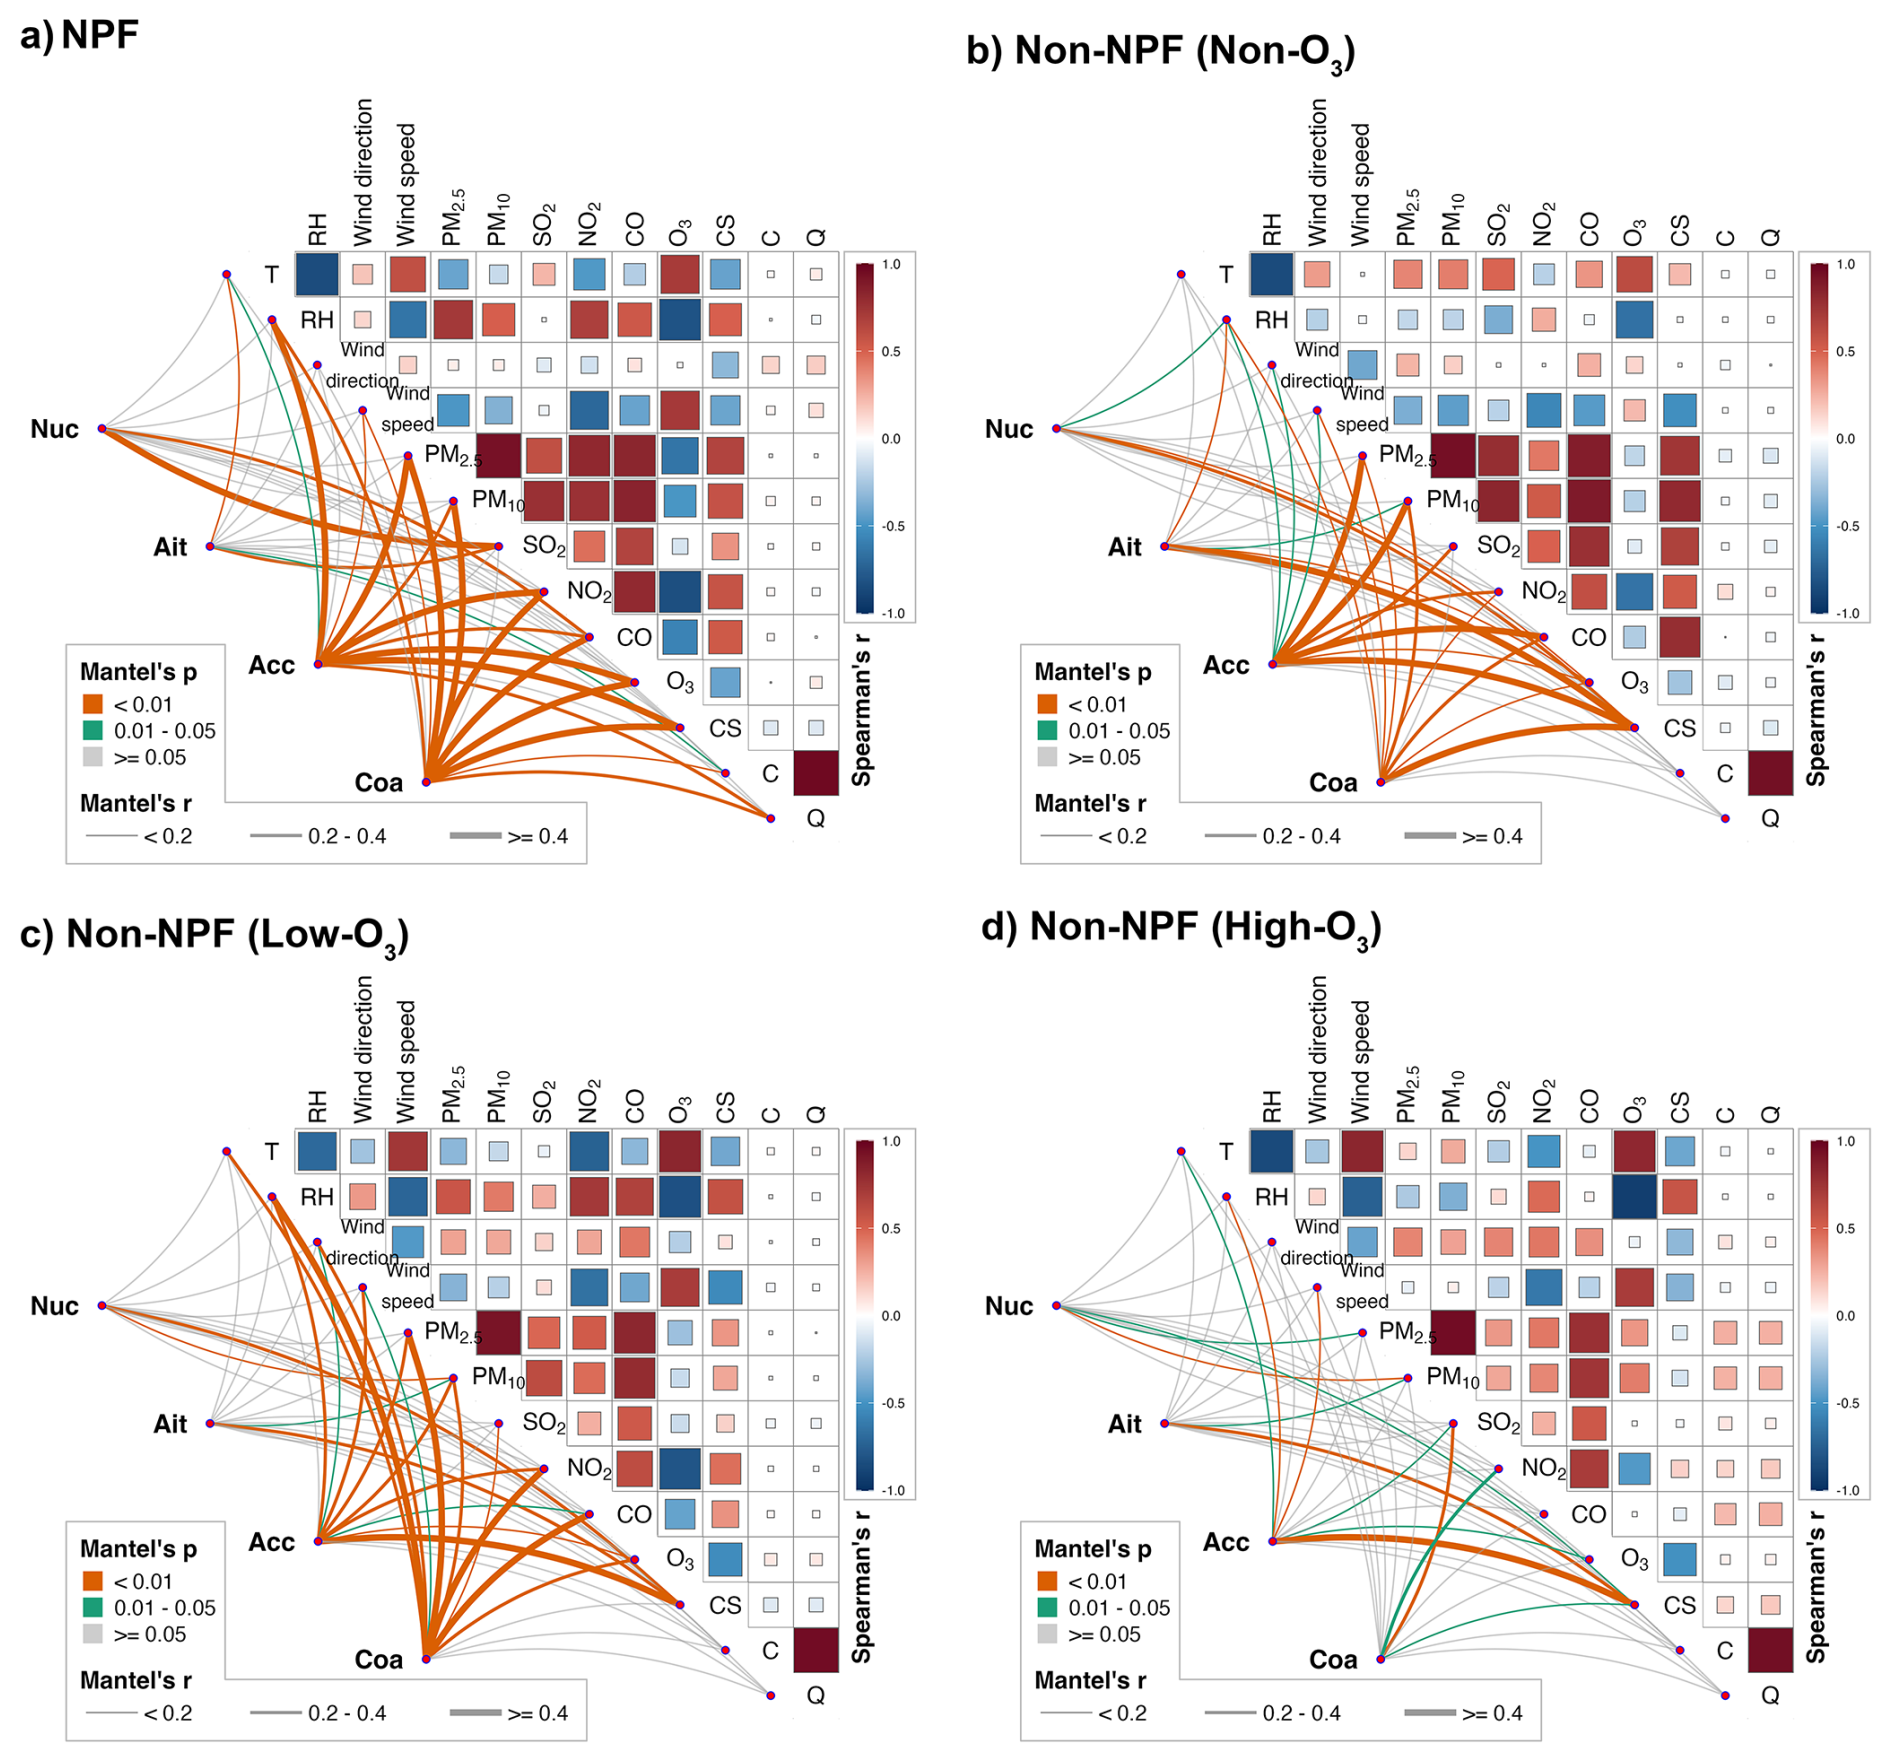
Figure 5Pairwise correlations of potential drivers and their linkage to particle number concentrations under four classified scenarios: (a) NPF, (b) Non-NPF (Non-O3), (c) Non-NPF (Low-O3) and (d) Non-NPF (High-O3). The upper-right triangle shows Spearman correlations between variables, while the lower-left network illustrates the Mantel test linkages between drivers and particle modes.
As the initial stage of the NPF process (Kulmala et al., 2004), the Nuc mode is crucial for understanding the underlying mechanisms governing NPF occurrence. However, due to the complex nonlinear interactions among multiple atmospheric variables, conventional correlation analysis alone is insufficient to disentangle these mechanisms. Therefore, this study introduces the generalized additive model (GAM) in combination with the SHAP method (described in Sect. 2.4) to identify the dominant drivers under different scenarios through feature importance and SHAP summary plots (Fig. 6), and to further reveal the nonlinear response characteristics of these factors to Nuc mode number concentration through SHAP dependence.
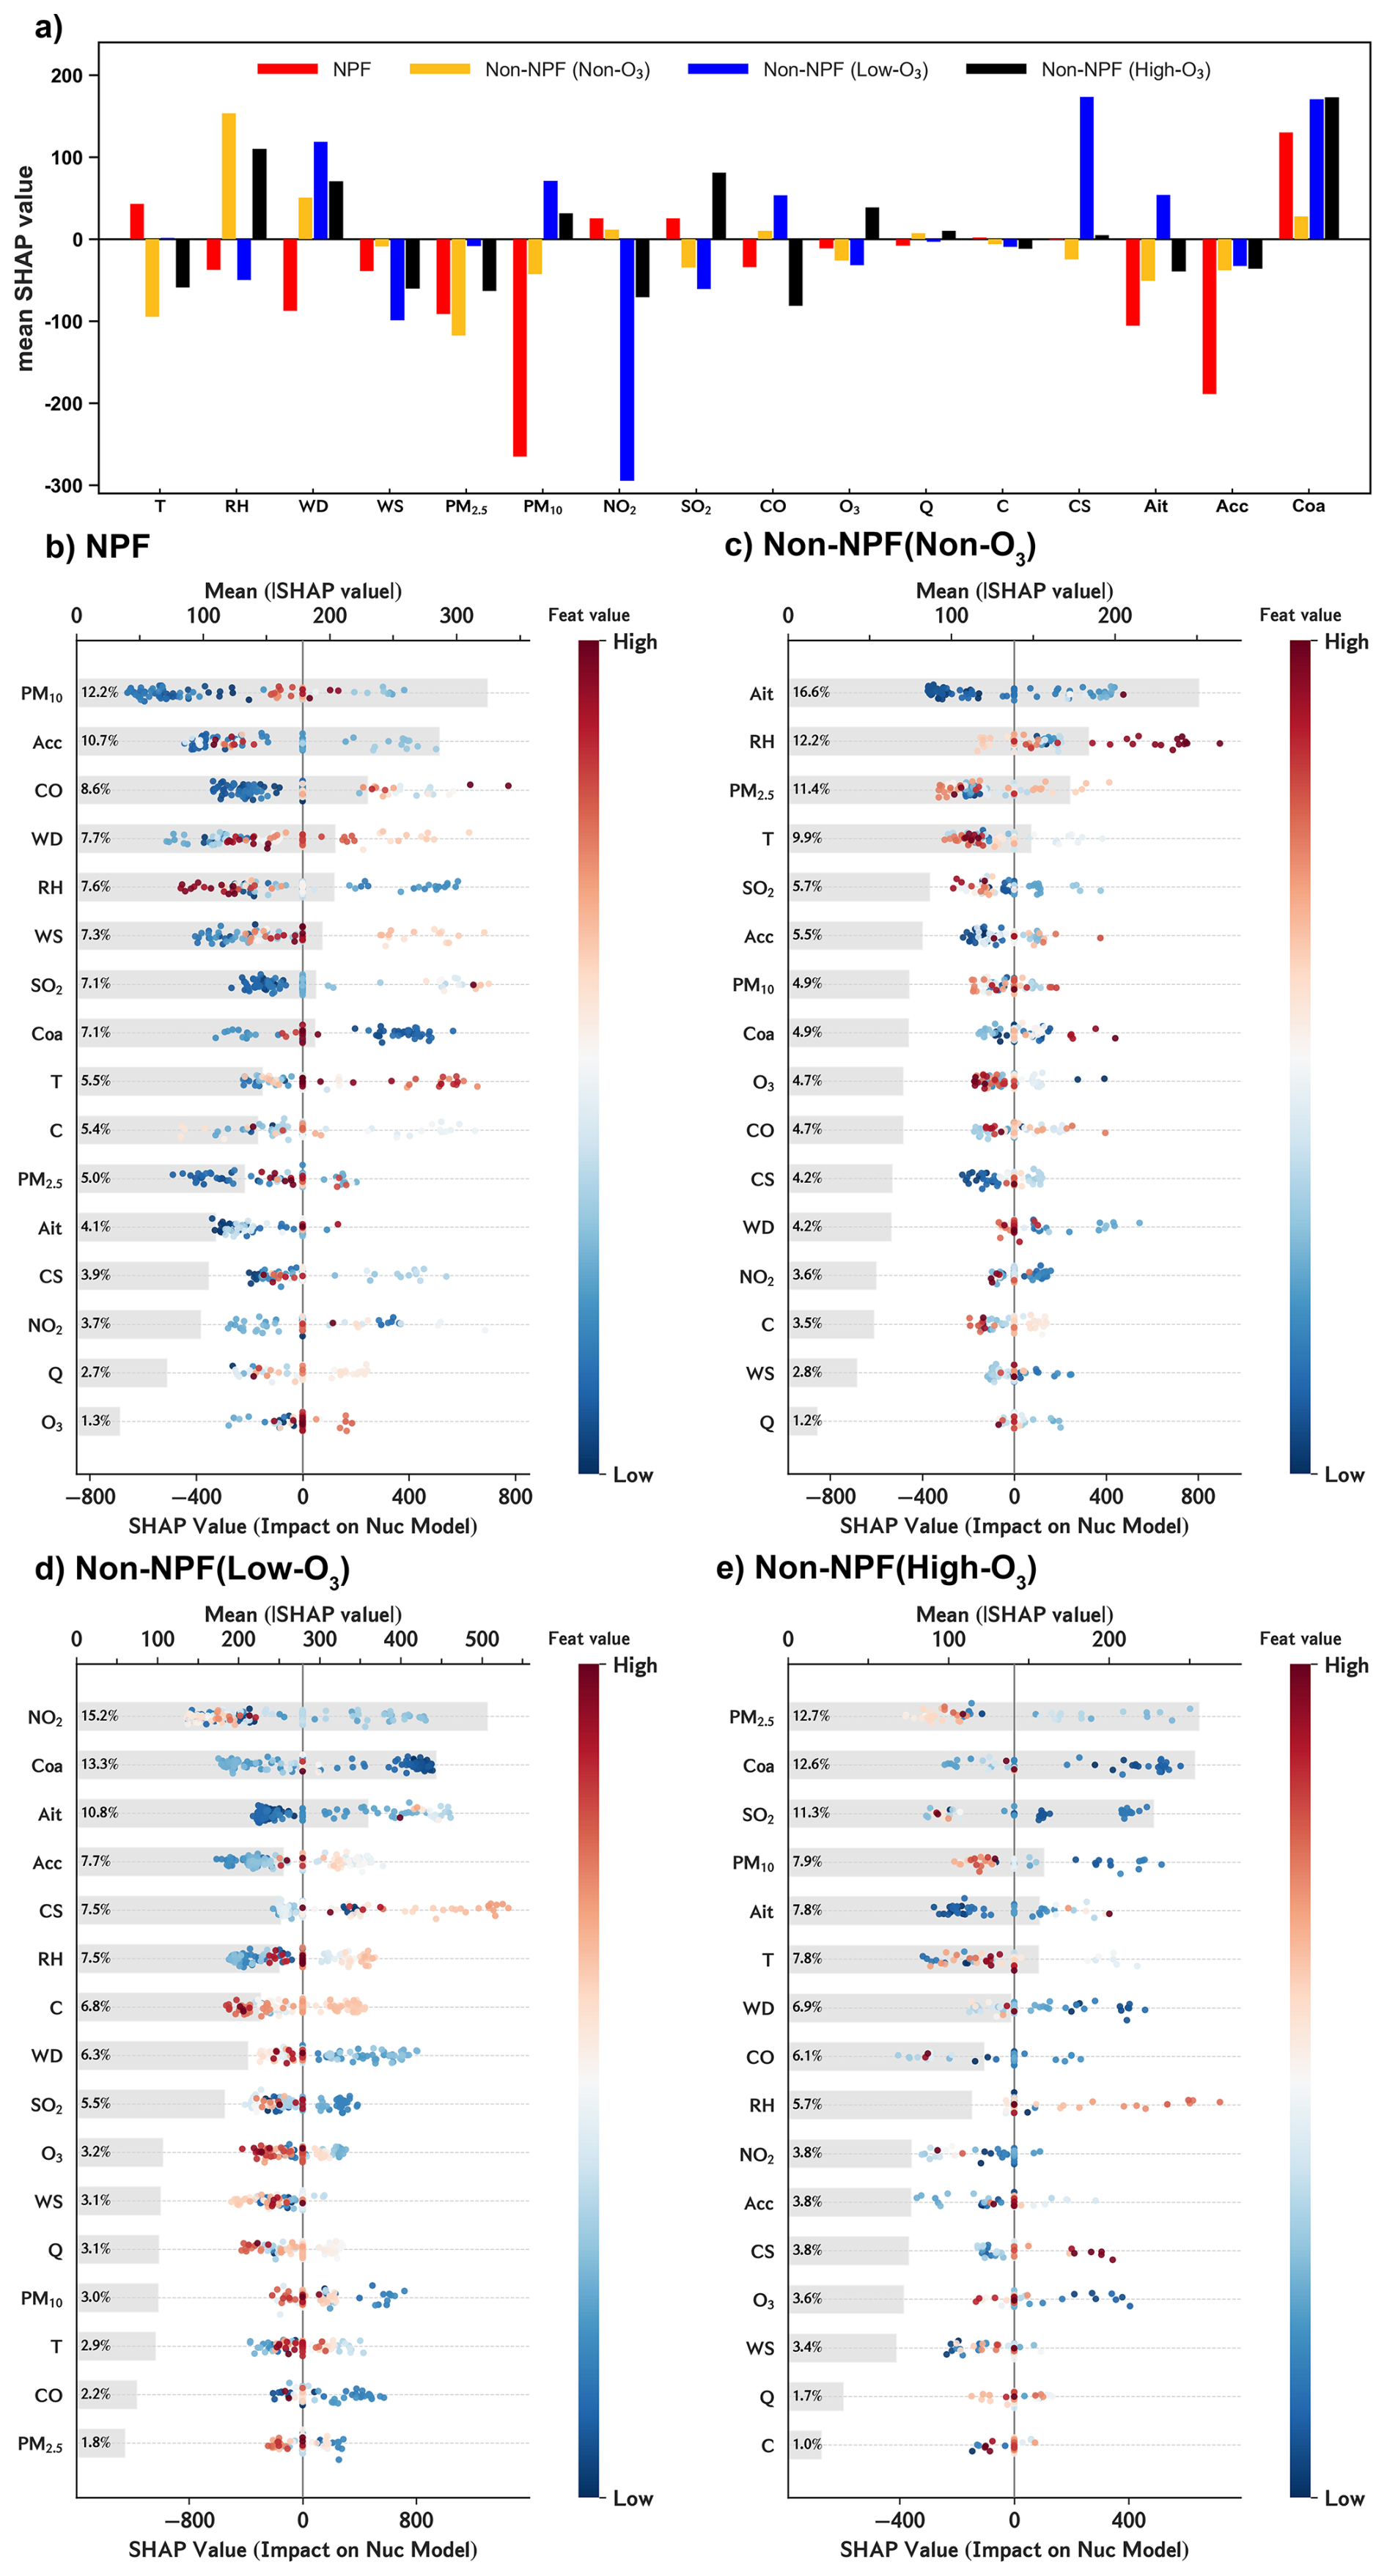
Figure 6SHAP-based analysis of drivers for particle number concentrations in the Nuc mode. (a) Mean SHAP values across the four scenarios, with red, yellow, blue, and black bars represent the NPF, Non-NPF (Non-O3), Non-NPF (Low-O3) and Non-NPF (High-O3) scenarios, respectively. (b–e) Feature importance and summary plots for (b) NPF, (c) Non-NPF (Non-O3), (d) Non-NPF (Low-O3), (e) Non-NPF (High-O3) scenario. The bar charts indicate the mean absolute SHAP values, while the scatter plots show the distribution of SHAP values, with colors transitioning from blue (low feature values) to red (high feature values).
Under the NPF scenario, the mean SHAP values of T and SO2 are 42.9 and 25.2, respectively (Fig. 6a), indicating that both variables generally have a positive impact on the predicted Nuc values. Their importance ranks among the highest across all variables, accounting for 5.5 % and 7.3 %, respectively (Fig. 6b). Scatter points corresponding to high values (red) are predominantly distributed on the positive SHAP side, whereas low-value samples (blue) mainly correspond to negative SHAP values (Fig. 6b), suggesting a positive association between these two variables and predicted Nuc values. This relationship is further confirmed by the dependence plots, which show a pronounced increase in SHAP values when T>28 °C (Fig. 7a) and SO2>10 µg m−3 (Fig. 7f), with the largest amplitudes among all four scenarios. These results indicate that high predicted Nuc values under the NPF scenario are always associated with high temperature and sufficient precursor conditions. In contrast, the CS exerts a clear negative effect on predicted Nuc values, especially when CS is high. Its dependence plot shows that the fitted curve initially increases and then decreases with increasing CS values, turning negative beyond approximately 0.085 s−1 (Fig. 7m), consistent with a mean SHAP value of −0.9 (Fig. 6a). Under the Low-O3 scenario, the dominant contributors to predicted Nuc values differ significantly, with the top five variables in terms of importance being NO2 (15.2 %), Coa (13.3 %), Ait (10.8 %), Acc (7.7 %), and CS (7.5 %) (Fig. 6d), all closely related to background particles. This indicates that, under Low-O3 conditions, background particles tend to increase the predicted values.
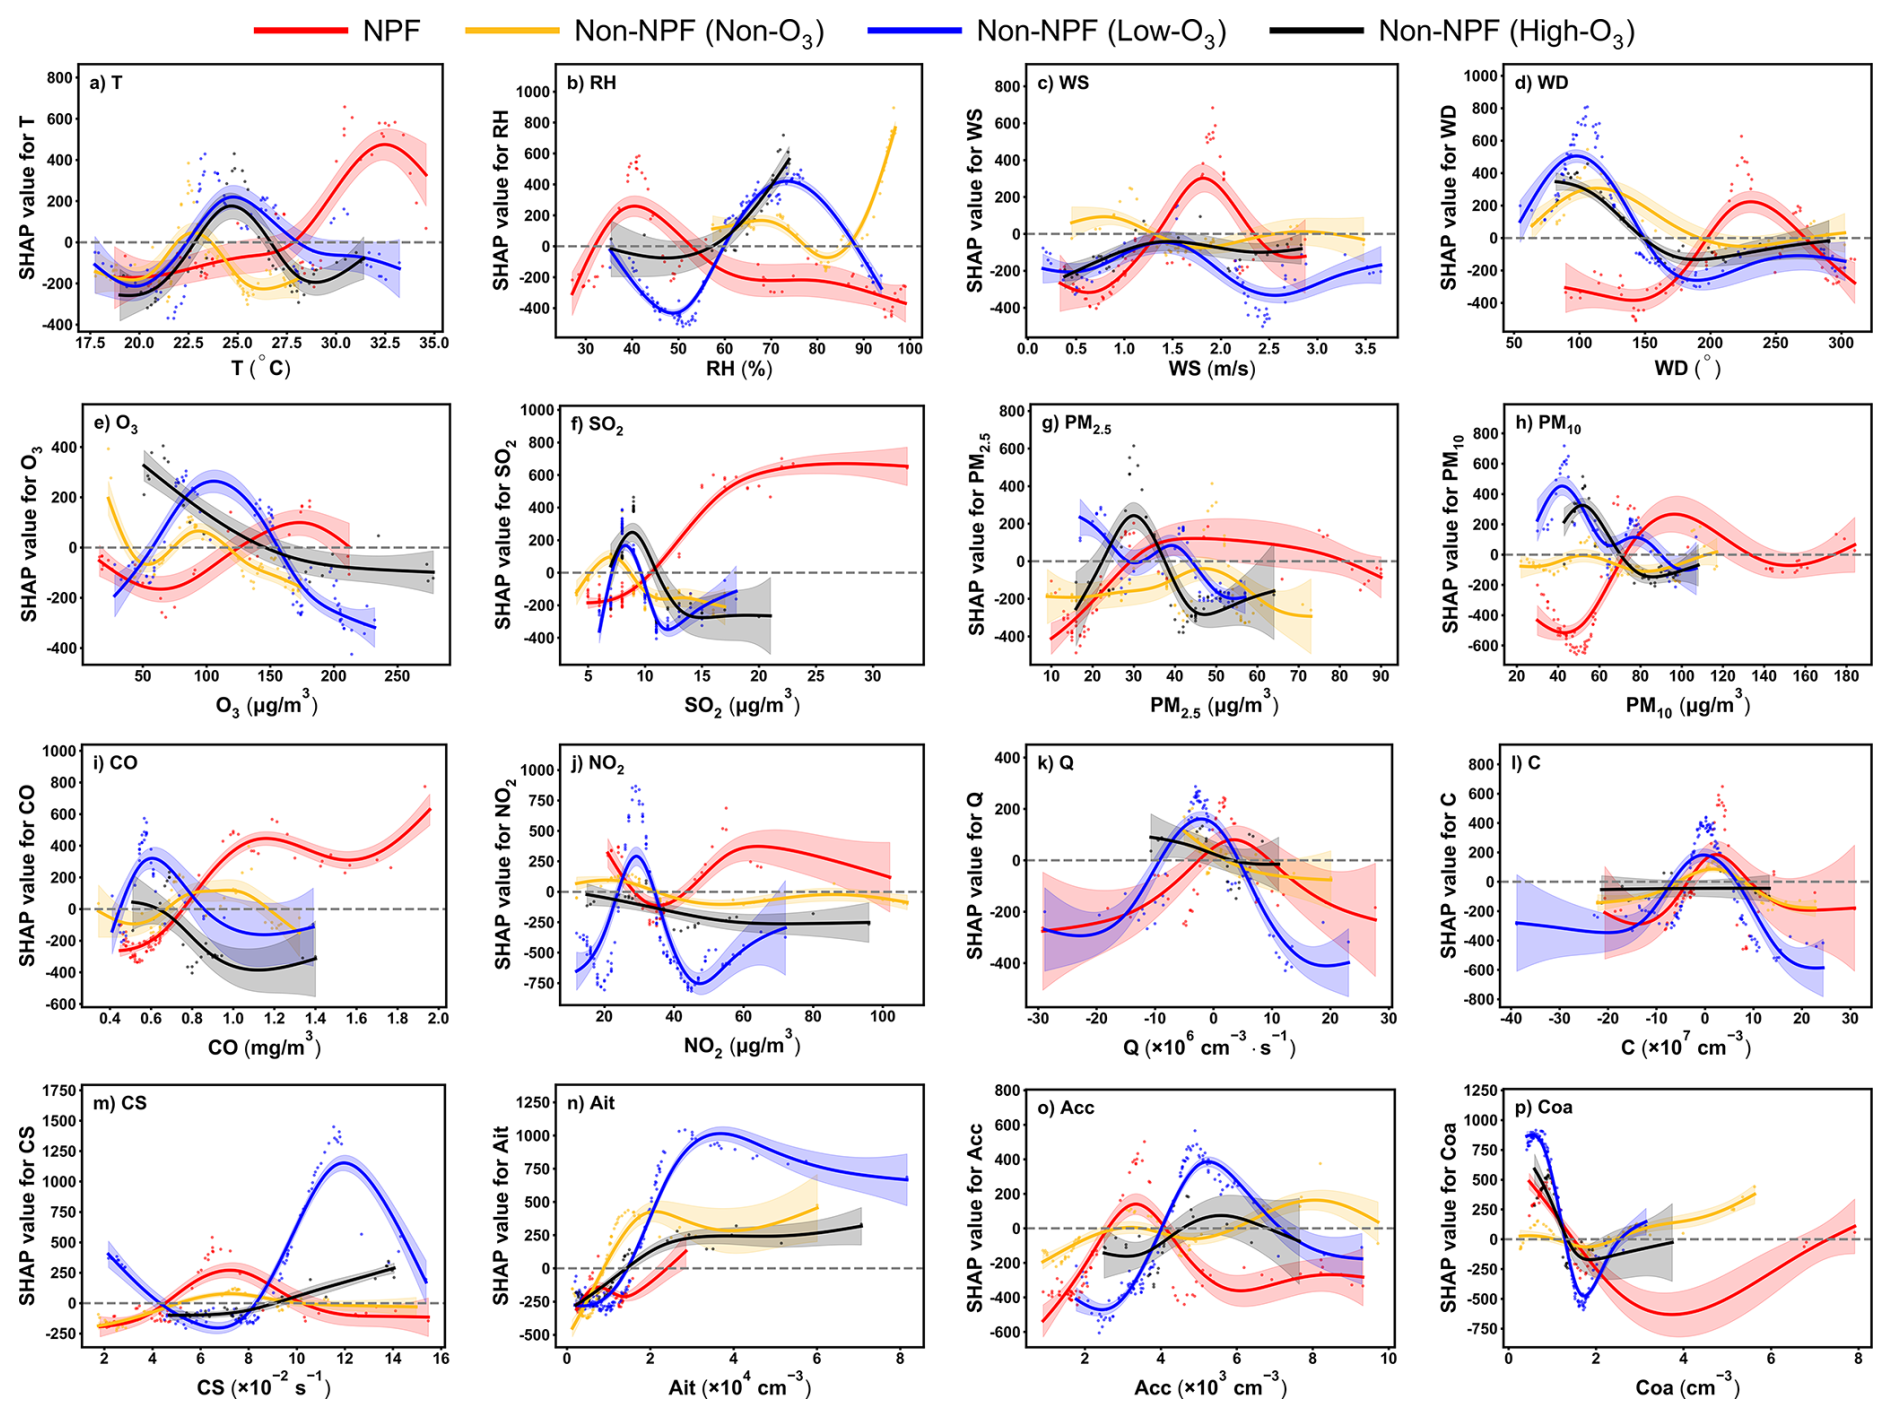
Figure 7SHAP dependency plots of NNuc associated with different variables under four classified scenarios: (a) T, (b) RH, (c) Wind Speed, (d) Wind Direction, (e) O3, (f) SO2, (g) PM2.5, (h) PM10, (i) CO, (j) NO2, (k) Q, (l) C, (m) CS, (n) NAit, (o) NAcc, (p) NCoa. Scatter points depict the SHAP values for individual samples, reflecting the contribution of each feature. The solid curves represent the fitted trends, with shaded areas indicating the 95 % confidence intervals. The red, yellow, blue, and black lines represent the NPF, Non-NPF (Non-O3), Non-NPF (Low-O3) and Non-NPF (High-O3) scenarios, respectively.
Under the Non-O3 scenario, the mean SHAP values of T, SO2 and O3 are −94.4, −34.5, and −26.1, respectively, and high-value samples are predominantly distributed in the negative SHAP value region (Fig. 6c). This may be attributed to the fact that higher values of these photochemically related variables typically occur in the afternoon, when intensified boundary layer mixing dilutes near-surface particles. Such co-variation explains their generally negative SHAP contributions to the predicted Nuc values. Notably, RH exhibits a high mean SHAP value of 153.5 (Fig. 6a), and its dependence curve increases monotonically from 80 % and remained positive thereafter (Fig. 7b), indicating that high humidity conditions are more likely to correspond to higher predicted Nuc values. This is likely because high RH promotes hygroscopic growth of background particles and modulates the small-size end of the particle size distribution, which the model statistically associates with elevated NNuc. For the High-O3 scenario, despite elevated O3 concentrations, the importance of O3 is only 3.6 %, suggesting that O3 is not the key factor controlling Nuc predictions. Although SO2 shows a positive mean SHAP value of 81.4 (Fig. 6a), indicating a promoting effect on Nuc predictions, the high-concentration data points of PM2.5 and Coa are almost all fell into the negative SHAP value region (Fig. 6e). Given that these two variables are the most important contributors in this scenario (Fig. 6e), the results demonstrate that background particles significantly inhibit the increase in Nuc mode. This finding is consistent with the previous inference that particles are generated but rapidly scavenged under High-O3 scenarios.
This study systematically analyzed the occurrence conditions and source-sink control mechanisms of NPF under different O3 pollution backgrounds, based on surface aerosol particle size distribution, pollutant concentration, and vertical observation data. The results demonstrate that NPF is not simply governed by high or low O3 concentrations; instead, it critically depends on the dynamic balance between precursor formation (source) and background aerosol removal (sink). Under non-O3 pollution conditions (Non-O3 scenario), although background aerosol and the CS level are relatively low, insufficient atmospheric oxidation capacity strongly limits precursor formation, making it difficult for the source to be established. Conversely, under high O3 pollution conditions (High-O3 scenario), a strongly oxidative environment favors precursor formation; however, the stronger background particle rapidly removes newly formed molecular clusters, thereby suppressing NPF as well. When O3 concentrations are appropriate, the occurrence of NPF is determined by whether boundary layer can create a favorable window in which source enhancement and sink reduction occur synchronously. Under the NPF scenario, the breakup of the inversion layer after sunrise and the rapid development of the boundary layer plays a decisive role. On the one hand, the entrainment of cleaner air aloft markedly reduces the background CS; on the other hand, enhanced vertical exchange increases near-surface O3 concentrations. This process is aligned with the rapid conversion of SO2 into nucleation precursors, allowing the newly formed molecular clusters to survive and grow continuously, ultimately triggering the NPF process. Under the Low-O3 scenario, the stable boundary layer structure limits vertical mixing, preventing the dilution of near-surface pollutants, and causing the background CS increasing instead of decreasing. Although weak precursor accumulation occurs, its lack of synchronization with sink reduction inhibits the NPF.
In addition, correlation analysis combined with SHAP method provides support for the proposed source–sink competition mechanism. Correlation results show that the NPF scenario is the only case in which the Nuc mode exhibits a strong association with SO2, which is consistent with the dominant factors identified in the SHAP analysis: high temperature (T>28 °C) and sufficient precursors (SO2>10 µg m−3) are primary positive contributors for increasing Nuc predicted values under the NPF scenario, whereas CS exerts a consistently negative influence at higher values. In contrast, in the Low-O3 scenario, background particles such as Coa, Ait, and Acc dominate, indicating that the predicted Nuc values are more constrained by background aerosol levels. For the Non-O3 scenario, RH is a significant factor in increasing the predicted Nuc values, while T, SO2, and O3 show negative contributions. As for the High-O3 scenario, although the SHAP value of SO2 is positive, key factors such as PM2.5 and Coa exhibit extremely strong negative SHAP contributions in the high-value range, playing a more dominant role in the model predictions. Overall, the physical observations and model results are highly consistent, jointly revealing that the dynamic balance between precursor supply and background removal is the fundamental determinant of NPF occurrence across different O3 pollution levels.
It should be noted that the data utilized in this study were derived from a 25 d intensive observations conducted at a suburban site within the Yangtze River Delta region. Consequently, the source-sink synchronization framework proposed herein is best regarded as a mechanistic insight at the process level, rather than as a strictly quantitative law. Nevertheless, we believe that this framework can still provide a useful reference for understanding NPF processes in other atmospheric environments, because the temporal synchronization of source enhancement and sink weakening driven by boundary layer development does not depend on the specific emission characteristics or meteorological conditions of this study site. Naturally, the specific forms of the source and sink terms will vary with changing environmental conditions. For instance, in coastal or forested regions, source terms may be dominated by biogenic volatile organic compounds (BVOCs) and their oxidation products, while condensation sinks may be more heavily influenced by sea salt or natural organic aerosols. Conversely, during winter, when photochemical activity is attenuated and stable boundary layers are more prone to persistence, the process of source-sink synchronization becomes more difficult to establish. Furthermore, we hypothesize that this framework holds the greatest explanatory power under conditions of compound O3-PM2.5 pollution; in cleaner atmospheric environments, however, NPF may be more constrained by weak source conditions. Thus, these contextual variations do not negate the applicability of the framework; rather, they indicate that when applying it across different regions or seasons, the specific source and sink terms must be re-identified in accordance with the prevailing atmospheric environment. Therefore, further research is needed to assess the universality of this mechanism based on data from multiple sites and long-term observations, and to quantitatively test its applicability under different atmospheric conditions.
The observational data used in this study are derived from previously published datasets and are publicly available from Shi et al. (2022) at https://doi.org/10.1029/2022GL099274. The SHAP analysis was conducted using publicly available open-source implementations. The SHAP methodology and its reference implementation are available from the official SHAP project website at https://shap.readthedocs.io/ (last access: 25 January 2026).
The supplement related to this article is available online at https://doi.org/10.5194/acp-26-7827-2026-supplement.
YW carried out the data analysis, conducted the statistical and SHAP analyses, and wrote the original draft of the manuscript. DL contributed to data processing and assisted with the analysis and interpretation of the results. HW and QH designed the study, supervised the research, and revised the manuscript. SS provided the observational data used in this study. ZW and ZL assisted with data analysis and visualization. TZ provided scientific guidance and contributed to the interpretation of the results. LS contributed to data quality control and methodological support. All authors discussed the results, reviewed the manuscript, and approved the final version.
The contact author has declared that none of the authors has any competing interests.
Publisher's note: Copernicus Publications remains neutral with regard to jurisdictional claims made in the text, published maps, institutional affiliations, or any other geographical representation in this paper. The authors bear the ultimate responsibility for providing appropriate place names. Views expressed in the text are those of the authors and do not necessarily reflect the views of the publisher.
This study was supported by the National Key Research and Development Program of China (grant no. 2022YFC3701204), the Natural Science Foundation of Jiangsu Province (grant no. BK20231300), the National Natural Science Foundation of China (grant no. 42505181) and Open Research Fund Project of State Key Laboratory of Atmospheric Environment and Extreme Meteorology. The authors gratefully acknowledge Shuangshuang Shi for providing the vertical observation data used in this study.
This study was supported by the National Key Research and Development Program of China (Grant No. 2022YFC3701204), the Natural Science Foundation of Jiangsu Province (BK20231300), the National Natural Science Foundation of China (42505181) and Open Research Fund Project of State Key Laboratory of Atmospheric Environment and Extreme Meteorology.
This paper was edited by Birgit Wehner and reviewed by two anonymous referees.
Aas, K., Jullum, M., and Løland, A.: Explaining individual predictions when features are dependent: more accurate approximations to Shapley values, arXiv [preprint], https://doi.org/10.48550/arXiv.1903.10464, 2019.
Ali, U., Singh, V., Faisal, M., Kumar, M., and Gani, S.: Exploring the influence of physical and chemical factors on new particle formation in a polluted megacity, Environ. Sci.: Atmos., 5, 25–47, https://doi.org/10.1039/D4EA00114A, 2025.
Birmili, W. and Wiedensohler, A.: New particle formation in the continental boundary layer: meteorological and gas phase parameter influence, Geophys. Res. Lett., 27, 3325–3328, https://doi.org/10.1029/1999GL011221, 2000.
Birmili, W., Berresheim, H., Plass-Dülmer, C., Elste, T., Gilge, S., Wiedensohler, A., and Uhrner, U.: The Hohenpeissenberg aerosol formation experiment (HAFEX): a long-term study including size-resolved aerosol, H2SO4, OH, and monoterpenes measurements, Atmos. Chem. Phys., 3, 361–376, https://doi.org/10.5194/acp-3-361-2003, 2003.
Bordt, S. and Luxburg, U. V.: From Shapley values to generalized additive models and back, Proc. Int. Conf. Artif. Intell. Stat. (AISTATS), 121–134, https://doi.org/10.48550/arXiv.2209.04012, 2022.
Carnerero, C., Pérez, N., Petäjä, T., Laurila, T. M., Ahonen, L. R., Kontkanen, J., Ahn, K.-H., Alastuey, A., Querol, X., and Guo, Y.: Relating high ozone, ultrafine particles, and new particle formation episodes using cluster analysis, Atmos. Environ.: X, 4, 100051, https://doi.org/10.1016/j.aeaoa.2019.100051, 2019.
Dai, L., Wang, H., Zhou, L., An, J., Tang, L., Lu, C., Yan, W., Liu, R., Kong, S., Chen, M., Lee, S., and Yu, H.: Regional and local new particle formation events observed in the Yangtze River Delta region, China, J. Geophys. Res.-Atmos., 122, 2389–2402, https://doi.org/10.1002/2016JD026030, 2017.
Dal Maso, M., Kulmala, M., Riipinen, I., Wagner, R., Hussein, T., Aalto, P. P., and Lehtinen, K. E. J.: Formation and growth of fresh atmospheric aerosols: eight years of aerosol size distribution data from SMEAR II, Hyytiälä, Finland, Boreal Environ. Res., 10, 323–336, 2005.
Ding, A. J., Huang, X., Nie, W., Sun, J. N., Kerminen, V.-M., Petäjä, T., Su, H., Cheng, Y. F., Yang, X.-Q., Wang, M. H., Chi, X. G., Wang, J. P., Virkkula, A., Guo, W. D., Yuan, J., and Wang, S. Y.: Enhanced haze pollution by black carbon in megacities in China, Geophys. Res. Lett., 43, 2873–2879, https://doi.org/10.1002/2016GL067745, 2016.
Du, W., Cai, J., Zheng, F., Yan, C., Zhou, Y., Guo, Y., Chu, B., Yao, L., Heikkinen, L. M., Fan, X., Wang, Y., Cai, R., Hakala, S., Chan, T., Kontkanen, J., Tuovinen, S., Petäjä, T., Kangasluoma, J., Bianchi, F., Paasonen, P., Sun, Y., Kerminen, V.-M., Liu, Y., Daellenbach, K. R., Dada, L., and Kulmala, M.: Influence of aerosol chemical composition on condensation sink efficiency and new particle formation in Beijing, Environ. Sci. Tech. Let., 9, 375–382, https://doi.org/10.1021/acs.estlett.2c00159, 2022.
Fiore, A. M., Naik, V., and Leibensperger, E. M.: Air quality and climate connections, J. Air Waste Manage., 65, 645–685, https://doi.org/10.1080/10962247.2015.1040526, 2015.
Fuchs, N. A., Daisley, R. E., Fuchs, M., Davies, C. N., and Straumanis, M. E.: The mechanics of aerosols, Phys. Today, 18, 73, https://doi.org/10.1063/1.3047354, 1965.
Gordon, H., Kirkby, J., Baltensperger, U., Bianchi, F., Breitenlechner, M., Curtius, J., Dias, A., Dommen, J., Donahue, N. M., Dunne, E. M., Duplissy, J., Ehrhart, S., Flagan, R. C., Frege, C., Fuchs, C., Hansel, A., Hoyle, C. R., Kulmala, M., Kürten, A., Lehtipalo, K., Makhmutov, V., Molteni, U., Rissanen, M. P., Stozhkov, Y., Tröstl, J., Tsagkogeorgas, G., Wagner, R., Williamson, C., Wimmers, D., Winkler, P. M., Yan, C., and Carslaw, K. S.: Causes and importance of new particle formation in the present-day and preindustrial atmospheres, J. Geophys. Res.-Atmos., 122, 8739–8760, https://doi.org/10.1002/2017JD026844, 2017.
Hamed, A., Joutsensaari, J., Mikkonen, S., Sogacheva, L., Dal Maso, M., Kulmala, M., Cavalli, F., Fuzzi, S., Facchini, M. C., Decesari, S., Mircea, M., Lehtinen, K. E. J., and Laaksonen, A.: Nucleation and growth of new particles in Po Valley, Italy, Atmos. Chem. Phys., 7, 355–376, https://doi.org/10.5194/acp-7-355-2007, 2007.
Herrmann, E., Ding, A. J., Kerminen, V.-M., Petäjä, T., Yang, X. Q., Sun, J. N., Qi, X. M., Manninen, H., Hakala, J., Nieminen, T., Aalto, P. P., Kulmala, M., and Fu, C. B.: Aerosols and nucleation in eastern China: first insights from the new SORPES-NJU station, Atmos. Chem. Phys., 14, 2169–2183, https://doi.org/10.5194/acp-14-2169-2014, 2014.
Hou, Y., Wang, Q., and Tan, T.: Evaluating drivers of PM2.5 air pollution at urban scales using interpretable machine learning, Waste Manage., 192, 114–124, https://doi.org/10.1016/j.wasman.2024.11.025, 2025.
Houdou, A., El Badisy, I., Khomsi, K., Abdala, S. A., Abdulla, F., Najmi, H., Obtel, M., Belyamani, L., Ibrahimi, A., and Khalis, M.: Interpretable machine learning approaches for forecasting and predicting air pollution: a systematic review, Aerosol Air Qual. Res., 24, 230151, https://doi.org/10.4209/aaqr.230151, 2024.
Huang, X., Wang, Z., and Ding, A.: Impact of aerosol–PBL interaction on haze pollution: multiyear observational evidences in North China, Geophys. Res. Lett., 45, 8596–8603, https://doi.org/10.1029/2018GL079239, 2018.
Jacob, D. J. and Winner, D. A.: Effect of climate change on air quality, Atmos. Environ., 43, 51–63, https://doi.org/10.1016/j.atmosenv.2008.09.051, 2009.
Jiang, S., Zhang, F., Ren, J., Chen, L., Yan, X., Liu, J., Sun, Y., and Li, Z.: Evaluation of the contribution of new particle formation to cloud droplet number concentration in the urban atmosphere, Atmos. Chem. Phys., 21, 14293–14308, https://doi.org/10.5194/acp-21-14293-2021, 2021.
Jin, J., Cai, R., Liu, Y., Yang, G., Li, Y., Li, C., Yao, L., Jiang, J., Zhang, X., and Wang, L.: Atmospheric new particle formation in the eastern region of China: an investigation on mechanism and influencing factors at multiple sites, Atmos. Chem. Phys., 25, 17125–17138, https://doi.org/10.5194/acp-25-17125-2025, 2025.
Jonsson, Å. M., Hallquist, M., and Saathoff, H.: Volatility of secondary organic aerosols from the ozone initiated oxidation of α-pinene and limonene, J. Aerosol Sci., 38, 843–852, https://doi.org/10.1016/j.jaerosci.2007.06.008, 2007.
Kaimal, J. C., Wyngaard, J. C., Haugen, D. A., Coté, O. R., Izumi, Y., Caughey, S. J., and Readings, C. J.: Turbulence structure in the convective boundary layer, J. Atmos. Sci., 33, 2152–2169, https://doi.org/10.1175/1520-0469(1976)033<2152:TSITCB>2.0.CO;2, 1976.
Kanawade, V. P., Jobson, B. T., Guenther, A. B., Erupe, M. E., Pressley, S. N., Tripathi, S. N., and Lee, S.-H.: Isoprene suppression of new particle formation in a mixed deciduous forest, Atmos. Chem. Phys., 11, 6013–6027, https://doi.org/10.5194/acp-11-6013-2011, 2011.
Kerminen, V.-M., Chen, X., Vakkari, V., Petäjä, T., Kulmala, M., and Bianchi, F.: Atmospheric new particle formation and growth: review of field observations, Environ. Res. Lett., 13, 103003, https://doi.org/10.1088/1748-9326/aadf3c, 2018.
Korhonen, H., Lehtinen, K. E. J., and Kulmala, M.: Multicomponent aerosol dynamics model UHMA: model development and validation, Atmos. Chem. Phys., 4, 757–771, https://doi.org/10.5194/acp-4-757-2004, 2004.
Kulmala, M., Dal Maso, M., Mäkelä, J. M., Pirjola, L., Väkevä, M., Aalto, P., Miikkulainen, P., Hämeri, K., and O'Dowd, C. D.: On the formation, growth and composition of nucleation mode particles, Tellus B, 53, 479–490, https://doi.org/10.1034/j.1600-0889.2001.530411.x, 2001a.
Kulmala, M., Hämeri, K., Aalto, P. P., Mäkelä, J. M., Pirjola, L., Nilsson, E. D., Buzorius, G., Rannik, Ü., Dal Maso, M., Seidl, W., Hoffmann, T., Janson, R., Hansson, H.-C., Viisanen, Y., Laaksonen, A., and O'Dowd, C. D.: Overview of the international project on biogenic aerosol formation in the boreal forest (BIOFOR), Tellus B, 53, 324–343, https://doi.org/10.1034/j.1600-0889.2001.530402.x, 2001b.
Kulmala, M., Vehkamäki, H., Petäjä, T., Dal Maso, M., Lauri, A., Kerminen, V.-M., Birmili, W., and McMurry, P. H.: Formation and growth rates of ultrafine atmospheric particles: a review of observations, J. Aerosol Sci., 35, 143–176, https://doi.org/10.1016/j.jaerosci.2003.10.003, 2004.
Kulmala, M., Petäjä, T., Nieminen, T., Sipilä, M., Manninen, H. E., Lehtipalo, K., Dal Maso, M., Aalto, P. P., Junninen, H., Paasonen, P., Riipinen, I., Lehtinen, K. E. J., Laaksonen, A., and Kerminen, V. M.: Measurement of the nucleation of atmospheric aerosol particles, Nat. Protoc., 7, 1651–1667, https://doi.org/10.1038/nprot.2012.091, 2012.
Kulmala, M., Dada, L., Daellenbach, K. R., Yan, C., Stolzenburg, D., Kontkanen, J., Ezhova, E., Hakala, S., Tuovinen, S., Kokkonen, T. V., Kurppa, M., Cai, R., Zhou, Y., Yin, R., Baalbaki, R., Chan, T., Chu, B., Deng, C., Fu, Y., Ge, M., He, H., Heikkinen, L., Junninen, H., Liu, Y., Lu, Y., Nie, W., Rusanen, A., Vakkari, V., Wang, Y., Yang, G., Yao, L., Zheng, J., Kujansuu, J., Kangasluoma, J., Petäjä, T., Paasonen, P., Järvi, L., Worsnop, D., Ding, A., Liu, Y., Wang, L., Jiang, J., Bianchi, F., and Kerminen, V.-M.: Is reducing new particle formation a plausible solution to mitigate particulate air pollution in Beijing and other Chinese megacities?, Faraday Discuss., 226, 334–347, https://doi.org/10.1039/D0FD00078g, 2021.
Lai, S., Hai, S., Gao, Y., Wang, Y., Sheng, L., Lupascu, A., Ding, A., Nie, W., Qi, X., Huang, X., Chi, X., Zhao, C., Zhao, B., Shrivastava, M., Fast, J., Yao, X., and Gao, H.: The striking effect of vertical mixing in the planetary boundary layer on new particle formation in the Yangtze River Delta, Sci. Total Environ., 829, 154607, https://doi.org/10.1016/j.scitotenv.2022.154607, 2022a.
Lai, S., Huang, X., Qi, X., Chen, L., Ren, C., Wang, Z., Wang, J., Lou, S., Chi, X., Gao, Y., Hai, S., Petäjä, T., Kerminen, V.-M., Kulmala, M., and Ding, A.: Vigorous new particle formation above polluted boundary layer in the North China Plain, Geophys. Res. Lett., 49, e2022GL100301, https://doi.org/10.1029/2022GL100301, 2022b.
Lampilahti, J., Leino, K., Manninen, A., Poutanen, P., Franck, A., Peltola, M., Hietala, P., Beck, L., Dada, L., Quéléver, L., Öhrnberg, R., Zhou, Y., Ekblom, M., Vakkari, V., Zilitinkevich, S., Kerminen, V.-M., Petäjä, T., and Kulmala, M.: Aerosol particle formation in the upper residual layer, Atmos. Chem. Phys., 21, 7901–7915, https://doi.org/10.5194/acp-21-7901-2021, 2021.
Lapworth, A. J.: The morning transition of the nocturnal boundary layer, Bound.-Lay. Meteorol., 119, 501–526, https://doi.org/10.1007/s10546-005-9046-0, 2006.
Lehtinen, K. E. J., Korhonen, H., Dal Maso, M., and Kulmala, M.: On the concept of condensation sink diameter, Boreal Environ. Res., 8, 405–411, 2003.
Lelieveld, J., Butler, T. M., Crowley, J. N., Dillon, T. J., Fischer, H., Ganzeveld, L., Harder, H., Lawrence, M. G., Martinez, M., and Taraborrelli, D.: Atmospheric oxidation capacity sustained by a tropical forest, Nature, 452, 737–740, https://doi.org/10.1038/nature06870, 2008.
Li, X., Hu, X.-M., Wei, W., Zhang, L., Ren, Y., Zhang, H., and Zhang, L.: Impact of surface and entrainment heat fluxes on the thermodynamic structure of the convective boundary layer over the Tibetan Plateau: observations and modeling analysis, Atmos. Res., 329, 108459, https://doi.org/10.1016/j.atmosres.2025.108459, 2026.
Li, Z., Guo, J., Ding, A., Liao, H., Liu, J., Sun, Y., Wang, T., Xue, H., Zhang, H., and Zhu, B.: Aerosol and boundary-layer interactions and impact on air quality, Natl. Sci. Rev., 4, 810–833, https://doi.org/10.1093/nsr/nwx117, 2017.
Liao, H., Zhang, Y., Chen, W. T., Raes, F., and Seinfeld, J. H.: Effect of chemistry–aerosol–climate coupling on predictions of future climate and future levels of tropospheric ozone and aerosols, J. Geophys. Res.-Atmos., 114, D10, https://doi.org/10.1029/2008JD010984, 2009.
Liu, C. and Shi, K.: A review on methodology in O3–NOx–VOC sensitivity study, Environ. Pollut., 291, 118249, https://doi.org/10.1016/j.envpol.2021.118249, 2021.
Liu, S., Wang, P., Ma, Q., Shen, X., Kang, H., Sun, J., Liu, Q., Zhang, Y., Shi, M., Yu, D., Zhong, J., Hu, X., Lu, J., Yu, A., Che, H., and Zhang, X.: Key characteristics of new particle formation events occurring simultaneously in the Yangtze River Delta and northeast rural sites in China, Atmos. Environ., 324, 120406, https://doi.org/10.1016/j.atmosenv.2024.120406, 2024.
Liu, T., Hong, Y., Li, M., Xu, L., Chen, J., Bian, Y., Yang, C., Dan, Y., Zhang, Y., Xue, L., Zhao, M., Huang, Z., and Wang, H.: Atmospheric oxidation capacity and ozone pollution mechanism in a coastal city of southeastern China: analysis of a typical photochemical episode by an observation-based model, Atmos. Chem. Phys., 22, 2173–2190, https://doi.org/10.5194/acp-22-2173-2022, 2022.
Lundberg, S. M. and Lee, S.-I.: A unified approach to interpreting model predictions, Adv. Neur. In., 30, 4765–4774, 2017.
Lundberg, S. M., Erion, G. G., and Lee, S.-I.: Consistent individualized feature attribution for tree ensembles, arXiv [preprint], https://doi.org/10.48550/arXiv.1802.03888, 2018.
Lundberg, S. M., Erion, G., Chen, H., DeGrave, A., Prutkin, J. M., Nair, B., Katz, R., Himmelfarb, J., Bansal, N., and Lee, S.-I.: From local explanations to global understanding with explainable AI for trees, Nat. Mach. Intell., 2, 56–67, https://doi.org/10.1038/s42256-019-0138-9, 2020.
Lyu, Y., Wu, H., Liu, X., Han, F., Lv, F., Pang, X., and Chen, J.: Co-occurring extremes of fine particulate matter (PM2.5) and ground-level ozone in the summer of southern China, Geophys. Res. Lett., 51, e2023GL106527, https://doi.org/10.1029/2023GL106527, 2024.
Ma, L., Graham, D. J., and Stettler, M. E. J.: Using explainable machine learning to interpret the effects of policies on air pollution: COVID-19 lockdown in London, Environ. Sci. Technol., 57, 19189–19198, https://doi.org/10.1021/acs.est.2c09596, 2023.
Makkonen, R., Asmi, A., Kerminen, V.-M., Boy, M., Arneth, A., Hari, P., and Kulmala, M.: Air pollution control and decreasing new particle formation lead to strong climate warming, Atmos. Chem. Phys., 12, 1515–1524, https://doi.org/10.5194/acp-12-1515-2012, 2012.
Matsui, H., Koike, M., Kondo, Y., Takegawa, N., Wiedensohler, A., Fast, J. D., and Zaveri, R. A.: Impact of new particle formation on the concentrations of aerosols and cloud condensation nuclei around Beijing, J. Geophys. Res.-Atmos., 116, D19208, https://doi.org/10.1029/2011JD016025, 2011.
MEE (Ministry of Ecology and Environment of the People's Republic of China): Ambient air quality standards (GB 3095–2012), Ministry of Ecology and Environment of the People's Republic of China 2012a.
MEE (Ministry of Ecology and Environment of the People's Republic of China): Technical regulation on Ambient Air Quality Index (HJ 633–2012), Ministry of Ecology and Environment of the People's Republic of China, 2012b.
Molnár, A., Imre, K., Ferenczi, Z., Kiss, G., and Gelencsér, A.: Aerosol hygroscopicity: hygroscopic growth proxy based on visibility for low-cost PM monitoring, Atmos. Res., 236, 104815, https://doi.org/10.1016/j.atmosres.2019.104815, 2020.
Murase, H., Nagashima, H., Yonezaki, S., Matsukura, R., and Kitakado, T.: Application of a generalized additive model (GAM) to reveal relationships between environmental factors and distributions of pelagic fish and krill: a case study in Sendai Bay, Japan, ICES J. Mar. Sci., 66, 1417–1424, https://doi.org/10.1093/icesjms/fsp105, 2009.
Neu, U., Künzle, T., and Wanner, H.: On the relation between ozone storage in the residual layer and daily variation in near-surface ozone concentration – a case study, Bound.-Lay. Meteorol., 69, 221–247, https://doi.org/10.1007/BF00708857, 1994.
Nie, W., Ding, A., Wang, T., Kerminen, V.-M., George, C., Xue, L., Wang, W., Zhang, Q., Petäjä, T., Qi, X., Gao, X., Wang, X., Yang, X., Fu, C., and Kulmala, M.: Polluted dust promotes new particle formation and growth, Sci. Rep.-UK, 4, 6634, https://doi.org/10.1038/srep06634, 2014.
Nieminen, T., Lehtinen, K. E. J., and Kulmala, M.: Sub-10 nm particle growth by vapor condensation – effects of vapor molecule size and particle thermal speed, Atmos. Chem. Phys., 10, 9773–9779, https://doi.org/10.5194/acp-10-9773-2010, 2010.
Nilsson, E. D., Rannik, Ü., Kulmala, M., Buzorius, G., and O'Dowd, C. D.: Effects of continental boundary layer evolution, convection, turbulence and entrainment on aerosol formation, Tellus B, 53, 441–461, https://doi.org/10.3402/tellusb.v53i4.16617, 2001.
Petäjä, T., Järvi, L., Kerminen, V.-M., Ding, A. J., Sun, J. N., Nie, W., Kujansuu, J., Virkkula, A., Yang, X.-Q., Fu, C. B., Zilitinkevich, S., and Kulmala, M.: Enhanced air pollution via aerosol–boundary layer feedback in China, Sci. Rep.-UK, 6, 18998, https://doi.org/10.1038/srep18998, 2016.
Qi, L., Zheng, H., Ding, D., and Wang, S.: A comparison of meteorological normalization of PM2.5 by multiple linear regression, general additive model, and random forest methods, Atmos. Environ., 338, 120854, https://doi.org/10.1016/j.atmosenv.2024.120854, 2024.
Sebastian, M., Kanawade, V. P., Soni, V. K., Asmi, E., Westervelt, D. M., Vakkari, V., Hyvärinen, A.-P., Pierce, J. R., and Hooda, R. K.: New particle formation and growth to climate-relevant aerosols at a background remote site in the western Himalaya, J. Geophys. Res.-Atmos., 126, e2020JD033267, https://doi.org/10.1029/2020JD033267, 2021.
Shang, D., Hu, M., Tang, L., Fang, X., Chen, S., Zeng, L., Guo, S., Zhang, Y., and Wu, Z.: New particle formation occurrence in the urban atmosphere of Beijing during 2013–2020, J. Geophys. Res.-Atmos., 128, e2022JD038334, https://doi.org/10.1029/2022JD038334, 2023.
Shapley, L.: 7. A Value for n-Person Games. Contributions to the Theory of Games II (1953) 307–317, in: Classics in Game Theory (69–79), edited by: Kuhn, H., Princeton University Press, Princeton, https://doi.org/10.1515/9781400829156-012, 2020.
Shi, S., Zhu, B., Tang, G., Liu, C., An, J., Liu, D., Xu, J., Xu, H., Liao, H., and Zhang, Y.: Observational evidence of aerosol radiation modifying photochemical ozone profiles in the lower troposphere, Geophys. Res. Lett., 49, e2022GL099274, https://doi.org/10.1029/2022GL099274, 2022.
Song, X., Li, X.-B., Yuan, B., He, X., Chen, Y., Wang, S., Huangfu, Y., Peng, Y., Zhang, C., Liu, A., Yang, H., Liu, C., Li, J., and Shao, M.: Elucidating key factors in regulating budgets of ozone and its precursors in atmospheric boundary layer, npj Clim. Atmos. Sci., 7, 262, https://doi.org/10.1038/s41612-024-00818-8, 2024.
Stull, R. B.: An Introduction to Boundary Layer Meteorology, 100 Springer, Dordrecht, the Netherlands, https://doi.org/10.1515/9781400829156-012, 1988.
Su, T., Li, Z., and Kahn, R.: Relationships between the planetary boundary layer height and surface pollutants derived from lidar observations over China: regional pattern and influencing factors, Atmos. Chem. Phys., 18, 15921–15935, https://doi.org/10.5194/acp-18-15921-2018, 2018.
Su, T., Li, Z., Zheng, Y., Wu, T., Wu, H., and Guo, J.: Aerosol-boundary layer interaction modulated entrainment process, npj Clim. Atmos. Sci., 5, 64, https://doi.org/10.1038/s41612-022-00283-1, 2022.
Sullivan, R. C., Crippa, P., Matsui, H., Leung, L. R., Zhao, C., and Thota, A.: New particle formation leads to cloud dimming, npj Clim. Atmos. Sci., 1, 19, https://doi.org/10.1038/s41612-018-0019-7, 2018.
Tan, S., Chen, X., and Yin, S.: Comparison results of eight oxygenated organic molecules: unexpected contribution to new particle formation in the atmosphere, Atmos. Environ., 268, 118817, https://doi.org/10.1016/j.atmosenv.2021.118817, 2022.
Tang, L., Shang, D., Fang, X., Wu, Z., Qiu, Y., Chen, S., Li, X., Zeng, L., Guo, S., and Hu, M.: More significant impacts from new particle formation on haze formation during COVID-19 lockdown, Geophys. Res. Lett., 48, e2020GL091591, https://doi.org/10.1029/2020GL091591, 2021.
Tiszenkel, L. and Lee, S.-H.: Synergetic effects of isoprene and HOx on biogenic new particle formation, Geophys. Res. Lett., 50, e2023GL103545, https://doi.org/10.1029/2023GL103545, 2023.
Wang, H., Shi, G. Y., Zhang, X. Y., Gong, S. L., Tan, S. C., Chen, B., Che, H. Z., and Li, T.: Mesoscale modelling study of the interactions between aerosols and PBL meteorology during a haze episode in China Jing–Jin–Ji and its near surrounding region – Part 2: Aerosols' radiative feedback effects, Atmos. Chem. Phys., 15, 3277–3287, https://doi.org/10.5194/acp-15-3277-2015, 2015.
Wang, Y., Wang, H., Shi, S., Shen, L., Zhu, B., and Zhao, T.: Observational study of the regional PM2.5–O3 pollution in the Yangtze River Delta region: vertical distribution, temporal evolution and comparison of different pollution types, Atmos. Environ., 345, 121072, https://doi.org/10.1016/j.atmosenv.2025.121072, 2025.
Wang, Z., Huang, X., and Ding, A.: Dome effect of black carbon and its key influencing factors: a one-dimensional modelling study, Atmos. Chem. Phys., 18, 2821–2834, https://doi.org/10.5194/acp-18-2821-2018, 2018.
Wang, Z. B., Hu, M., Mogensen, D., Yue, D. L., Zheng, J., Zhang, R. Y., Liu, Y., Yuan, B., Li, X., Shao, M., Zhou, L., Wu, Z. J., Wiedensohler, A., and Boy, M.: The simulations of sulfuric acid concentration and new particle formation in an urban atmosphere in China, Atmos. Chem. Phys., 13, 11157–11167, https://doi.org/10.5194/acp-13-11157-2013, 2013a.
Wang, Z. B., Hu, M., Sun, J. Y., Wu, Z. J., Yue, D. L., Shen, X. J., Zhang, Y. M., Pei, X. Y., Cheng, Y. F., and Wiedensohler, A.: Characteristics of regional new particle formation in urban and regional background environments in the North China Plain, Atmos. Chem. Phys., 13, 12495–12506, https://doi.org/10.5194/acp-13-12495-2013, 2013b.
Watson, Z., Tiszenkel, L., Pour Biazar, A., Knupp, K., and Lee, S.: Effects of boundary layer dynamics and meteorology on ultrafine particle formation and growth, Atmos. Environ., 309, 119952, https://doi.org/10.1016/j.atmosenv.2023.119952, 2023.
Wehner, B., Siebert, H., Ansmann, A., Ditas, F., Seifert, P., Stratmann, F., Wiedensohler, A., Apituley, A., Shaw, R. A., Manninen, H. E., and Kulmala, M.: Observations of turbulence-induced new particle formation in the residual layer, Atmos. Chem. Phys., 10, 4319–4330, https://doi.org/10.5194/acp-10-4319-2010, 2010.
Wei, Q., Chen, Y., Zhang, H., Jia, Z., Yang, J., Niu, B., and Chen, Y.: Simulation and prediction of PM2.5 concentrations and analysis of driving factors using interpretable tree-based models in Shanghai, China, Environ. Res., 270, 121003, https://doi.org/10.1016/j.envres.2025.121003, 2025.
Xia, X., Zhang, K., Yang, R., Zhang, Y., Xu, D., Bai, K., and Guo, J.: Impact of near-surface turbulence on PM2.5 concentration in Chengdu during the COVID-19 pandemic, Atmos. Environ., 268, 118848, https://doi.org/10.1016/j.atmosenv.2021.118848, 2022.
Yenkikar, A., Mishra, V. P., Bali, M., and Ara, T.: Explainable forecasting of air quality index using a hybrid random forest and ARIMA model, MethodsX, 15, 103517, https://doi.org/10.1016/j.mex.2025.103517, 2025.
Yuan, X., Hong, X., Huang, Z., Sheng, L., Zhang, J., Chen, D., Zhong, Z., Wang, B., and Zheng, J.: Uncovering key sources of regional ozone simulation biases using machine learning and SHAP analysis, Environ. Pollut., 372, 126012, https://doi.org/10.1016/j.envpol.2025.126012, 2025.
Yue, D., Hu, M., Zhang, R., Wu, Z., Su, H., Wang, Z., Peng, J., He, L., Huang, X., Gong, Y., and Wiedensohler, A.: Potential contribution of new particle formation to cloud condensation nuclei in Beijing, Atmos. Environ., 45, 6070–6077, https://doi.org/10.1016/j.atmosenv.2011.07.037, 2011.
Zang, L., Wang, Z., Zhu, B., Zhang, Y., and Xu, D.: Roles of relative humidity in aerosol pollution aggravation over Central China during wintertime, Int. J. Env. Res. Pub. He., 16, 4422, https://doi.org/10.3390/ijerph16224422, 2019.
Zhang, J., Gong, X., Crosbie, E., Diskin, G., Froyd, K., Hall, S., Kupc, A., Moore, R., Peischl, J., Rollins, A., Schwarz, J., Shook, M., Thompson, C., Ullmann, K., Williamson, C., Wisthaler, A., Xu, L., Ziemba, L., Brock, C. A., and Wang, J.: Stratospheric air intrusions promote global-scale new particle formation, Science, 385, 210–216, https://doi.org/10.1126/science.adn2961, 2024.
Zhao, C., Lin, Z., Yang, L., Jiang, M., Qiu, Z., Wang, S., Gu, Y., Ye, W., Pan, Y., Zhang, Y., Wang, T., Jia, Y., and Chen, Z.: A study on the impact of meteorological and emission factors on PM2.5 concentrations based on machine learning, J. Environ. Manage., 360, 124347, https://doi.org/10.1016/j.jenvman.2025.124347, 2025.
Zheng, H., Kong, S., Zhai, S., Sun, X., Cheng, Y., Yao, L., Song, C., Zheng, Z., Shi, Z., and Harrison, R. M.: An intercomparison of weather normalization of PM2.5 concentration using traditional statistical methods, machine learning, and chemistry transport models, npj Clim. Atmos. Sci., 6, 214, https://doi.org/10.1038/s41612-023-00536-7, 2023.
Zhu, Y., Shen, Y., Li, K., Meng, H., Sun, Y., Yao, X., Gao, H., Xue, L., and Wang, W.: Investigation of particle number concentrations and new particle formation with largely reduced air pollutant emissions at a coastal semi-urban site in Northern China, J. Geophys. Res.-Atmos., 127, e2021JD035419, https://doi.org/10.1029/2021JD035419, 2022.
Zong, L., Yang, Y., Gao, M., Wang, H., Wang, P., Zhang, H., Wang, L., Ning, G., Liu, C., Li, Y., and Gao, Z.: Large-scale synoptic drivers of co-occurring summertime ozone and PM2.5 pollution in eastern China, Atmos. Chem. Phys., 21, 9105–9124, https://doi.org/10.5194/acp-21-9105-2021, 2021.