the Creative Commons Attribution 4.0 License.
the Creative Commons Attribution 4.0 License.
 | 03 Jun 2026
Geostationary observations of atmospheric ammonia over East Asia: spatio-temporal variations revealed by three years of FY-4B/GIIRS measurements
Mengya Sheng
Runyi Zhou
Jiancong Hua
Shan Han
Shangyi Liu
Lin Zhang
Wei Wang
Ruijun Dang
Hansen Cao
Zichong Chen
Yixuan Gu
Mingxu Liu
Chengli Qi
Feng Lu
Changpei Han
Mark W. Shephard
Nadir Guendouz
Camille Viatte
Lieven Clarisse
Martin Van Damme
Cathy Clerbaux
Satellite observations play a crucial role in quantifying ammonia sources by capturing large-scale variations of atmospheric NH3 concentrations. As the world's first geostationary hyperspectral infrared sounder, the Geostationary Interferometric Infrared Sounder (GIIRS) on board China's FengYun-4 satellite series provides a unique opportunity to monitor the diurnal cycle of NH3. Using NH3 retrievals from July 2022 to June 2025, this study investigates the spatio-temporal variability of NH3 columns over East Asia, with a focus on daytime variations (07:00–19:00 LT – local time) in major agricultural regions. Inter-comparison with polar-orbiting IASI and CrIS data shows that GIIRS NH3 retrievals are consistent in capturing spatial patterns and temporal dynamics. The NH3 peaks occur between March and July, with peak timing earlier in the south and later in the north, reflecting regional differences primarily driven by agricultural activities. Validation with ground-based FTIR measurements at Hefei in eastern China demonstrates the accuracy of GIIRS NH3, with a correlation coefficient of 0.77 and an RMSE of 9.67×10¹⁵ molec cm−2, while reproducing daytime variations observed by FTIR. For major agricultural areas, the NH3 columns generally increase from early morning to late afternoon, reaching 1.10–1.56 times morning levels in summer and spring. Compared with GEOS-CF model simulations, the results reveal pronounced discrepancies in spatial distributions over the Sichuan Basin in southwestern China and daytime variations over northern India. These findings highlight the valuable capability of FY-4B/GIIRS in identifying and tracking daytime dynamics of NH3 sources over East Asia, offering new insights beyond current low-Earth orbit (LEO) instruments.
- Article
(16040 KB) - Full-text XML
-
Supplement
(11182 KB) - BibTeX
- EndNote


Gaseous ammonia (NH3), the most abundant alkaline gas and a major reactive nitrogen compound in the atmosphere, plays a critical role in the global nitrogen cycle. NH3 is an important precursor of secondary inorganic aerosols. It rapidly reacts with atmospheric acids such as sulfuric acid (H2SO4) and nitric acid (HNO3) to form ammonium sulfate ((NH4)2SO4) and ammonium nitrate (NH4NO3) (Seinfeld and Pandis, 2016). These ammonium-containing aerosols are the primary components of fine particulate matter (PM2.5) and have been identified as key contributors to elevated PM2.5 concentrations and haze pollution in both rural areas (Jang et al., 2025; Saraswati et al., 2019; Meng et al., 2018) and megacities (Lin et al., 2020) in Asia, posing significant threats to air quality, visibility, and public health. NH3 also exerts indirect influences on global climate change, for example, by driving nitrous oxide (N2O) formation via atmospheric oxidation (Pai et al., 2021) and by altering radiative forcing through aerosol-mediated processes (Gong et al., 2024). Moreover, excessive emissions and deposition of NH3 have adverse effects on ecosystems, causing biodiversity loss, soil acidification, and water eutrophication (Bobbink et al., 2010). Anthropogenic NH3 emissions primarily originate from agricultural activities, particularly from synthetic fertilizer application and livestock farming, with additional contributions from industrial processes and transportation (Behera et al., 2013). Numerous studies have indicated that a relatively strong reduction in PM2.5 and N2O levels can be achieved by decreasing agricultural emissions (e.g., Luo et al., 2025). Therefore, comprehensive quantification and understanding of NH3 emission sources are essential for developing effective air quality and climate mitigation strategies.
Asia is the world's most significant NH3 emission region, accounting for over 30 % of global NH3 emissions annually as reported by the Emissions Database for Global Atmospheric Research (EDGAR) inventory. Due to widespread use of urea-based nitrogen fertilizers and high livestock densities, cropland areas such as the Indo-Gangetic Plain in India and the North China Plain in China are recognized as major global NH3 emission hot spots (Van Damme et al., 2018). NH3 volatilization is strongly controlled by surface conditions, including temperature and moisture, and irrigation-driven accumulation in soils (Behera et al., 2013). The resulting atmospheric NH3 concentrations over a region are further influenced by meteorology- and topography-induced constraints on atmospheric mixing and transport, chemical reactions dependent on the concentrations of reactive acidic gases, and dry and wet deposition (Dammers et al., 2017a). In most regions, NH3 concentrations in summer are significantly higher than those in winter, driven by emissions from urea hydrolysis and livestock manure decomposition (Warner et al., 2016; Van Damme et al., 2015). Given its short atmospheric lifetime of a few hours to several days, NH3 exhibits large intra-day variability in concentration from both agricultural and non-agricultural sources. Several studies have employed surface measurements to investigate the diurnal variability of NH3 and its controlling mechanisms, revealing that diurnal patterns in urban and rural areas differ markedly across seasons (Gu et al., 2022; He et al., 2020; Chang et al., 2019; Huy et al., 2017; Meng et al., 2011). These analyses are limited by the sparse spatial coverage and short temporal duration of ground-based monitoring networks. To complement observations, atmospheric chemistry models have been applied to simulate NH3 at regional and global scales, and refinements in surface exchange schemes have improved NH3 modeling (Jongenelen et al., 2025; Cao et al., 2022). However, the mechanisms underlying the diurnal variability of atmospheric NH3 in different emission regions still remain poorly understood.
Satellite observations facilitate top-down inversion methods for monitoring NH3 variations across multiple spatial scales. The hyperspectral infrared sounders onboard polar-orbiting satellites in low-Earth orbit (LEO), such as the Infrared Atmospheric Sounding Interferometer (IASI; Clarisse et al., 2009), the Tropospheric Emission Spectrometer (TES; Beer et al., 2008), the Atmospheric Infrared Sounder (AIRS; Warner et al., 2016), the Cross-track Infrared Sounder (CrIS; Shephard et al., 2020), and the Hyperspectral Infrared Atmospheric Sounder (HIRAS; Hua et al., 2026), have provided global monitoring of atmospheric NH3 column densities. Satellite-based NH3 retrievals have been widely used to investigate the spatial distribution of NH3 emission sources (e.g., Van Damme et al., 2018), to characterize spatiotemporal variations in atmospheric NH3 concentrations (e.g., Van Damme et al., 2021; Shephard et al., 2020), and to constrain emission estimates (e.g., Cao et al., 2020; Dammers et al., 2019; Chen et al., 2025) and dry deposition estimates (e.g., Kharol et al., 2018). Van Damme et al. (2021) reported that NH3 concentrations increased from 2008 to 2018 in major agricultural regions globally, including South Asia, China, the United States and some parts of Europe. Based on multi-year NH3 maps, Van Damme et al. (2018) and Clarisse et al. (2019) identified and quantified major industrial and agricultural NH3 point sources, revealing that NH3 emissions from approximately two-thirds of these sources were underestimated by at least one order of magnitude in the EDGAR emission inventory. In addition, NH3 emission estimates based on satellite observations and inverse modeling indicated that bottom-up emission inventories underestimate NH3 emissions, especially during summer (e.g., Xu et al., 2023; Marais et al., 2021; Zhang et al., 2018; Chen et al., 2021).
Accurately monitoring the daily dynamics of NH3 emissions imposes high sampling requirements in time and space on atmospheric NH3 measurements. Polar-orbiting satellites typically measure a given location at most twice per day. For example, IASI and CrIS cross the equator at 09:30/21:30 and 01:30/13:30 local solar time (LST), respectively (Whitburn et al., 2016; Shephard and Cady-Pereira, 2015). The above satellite-based studies mostly used morning observations from IASI and afternoon observations from CrIS, because of the lower uncertainties associated with a more favorable thermal state of the atmosphere for the remote sensing of its lowest layers. Investigations of the spatial and temporal variability of NH3 are constrained by the limited coverage of satellite overpasses, leading to potential temporal representativeness biases and substantial uncertainties in daily NH3 emission estimates (Clarisse et al., 2019; Van Damme et al., 2018). The Geostationary Interferometric Infrared Sounder (GIIRS) onboard the FY-4 series is the world's first hyperspectral infrared sounder in geostationary (GEO) orbit. It was first launched as an experimental instrument on FY-4A in December 2016 and subsequently deployed as operational instruments with enhanced sensitivity on FY-4B in June 2021 (Yang et al., 2017) and on FY-4C in December 2025. Compared with current LEO instruments, GIIRS provides continuous day-and-night monitoring of atmospheric NH3 over East Asia at hourly-scale temporal resolution, representing a breakthrough in monitoring the diurnal cycle of atmospheric NH3 variations (Clarisse et al., 2021; Zeng et al., 2023a). Similarly, the Meteosat Third Generation sounding satellite (MTG-S1), launched in July 2025, carries the Infrared Sounder (IRS), another geostationary hyperspectral infrared instrument designed to provide higher spatio-temporal resolution observations (every 30 min) over Europe (Holmlund et al., 2021). A recent study by Guendouz et al. (2026) investigated the correlation between GIIRS NH3 and surface skin temperature and showed the potential of discriminating sources between temperature-driven livestock/fertilizer volatilization and urea fertilizer application.
With over three years of FY-4B/GIIRS geostationary observations available from July 2022 to June 2025, unprecedented opportunities have emerged to monitor the spatial and temporal variations of NH3 concentrations and their evolution throughout the day over East Asia. In this study, we highlighted the enhanced capability of GIIRS observations to identify emission sources and capture daytime variations associated with agricultural activities, surpassing those reported by polar-orbiting satellites. The data and methodology are described in Sect. 2. The spatial patterns and seasonal cycles of NH3 observed by GIIRS are compared with observations from IASI and CrIS, as well as estimates from the mosaic Asian anthropogenic emission inventory (MIX) in Sect. 3.1. The data accuracy and temporal variations of satellite-derived NH3 are validated against ground-based Fourier Transform Infrared (FTIR) measurements at the Hefei station in Sect. 3.2. The daytime variations of NH3 from GIIRS observations and model simulations in major agricultural regions are discussed in Sect. 3.3. Conclusions are summarized in Sect. 4.
2.1 Satellite NH3 retrievals
2.1.1 GIIRS observations
FY-4B/GIIRS was successfully launched on 3 June 2021 and began operating at 133° E on 11 April 2022, providing observational data from 1 June 2022. As the FY-4A satellite approached fuel depletion, FY-4B was maneuvered from 133 to 105° E between 1 February and 5 March 2024 to take over FY-4A's observation duties, with measurements temporarily suspended during this period. Since then, FY-4B/GIIRS has been operating nominally at 105° E. FY-4B/GIIRS observations primarily cover the regions from 3 to 55° N and 60 to 137° E, encompassing East Asia and parts of South and Southeast Asia (Fig. 1). The instrument performs measurements over the target region every 2 h using a “step-stare” scanning mode. Observations are conducted along 12 scanning lines from north to south, with 27 fields of regard (FORs) arranged from west to east along each line. The FOR is a two-dimensional infrared detector array composed of 16×8 sparsely arranged pixels. Each pixel has a nadir-projected size of approximately 12 km×12 km, with a spacing of 12 km in both along-track and cross-track directions between adjacent pixels. Initially, 12 measurement cycles in a day started at 00:00, 02:00, 04:00, …, 22:00 UTC. After 6 September 2022, the start times were changed to 01:00, 03:00, 05:00, …, 23:00 UTC, respectively.
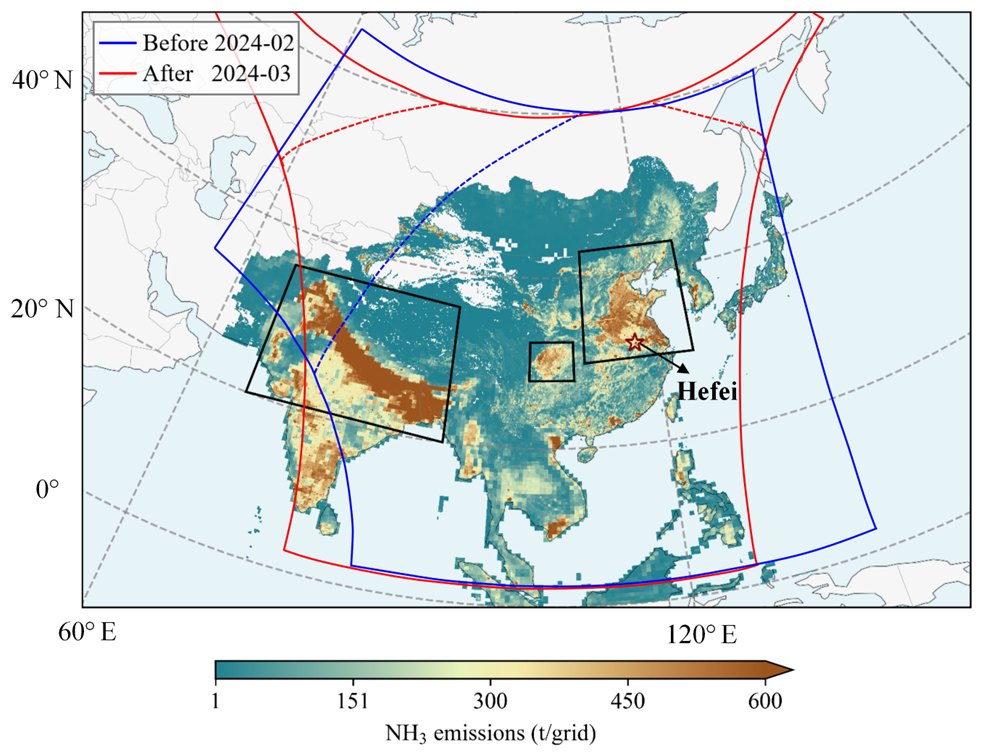
Figure 1Spatial domain of FY-4B/GIIRS observations and NH3 retrievals over East Asia. Blue and red solid lines outline GIIRS observational coverage before and after the FY-4B orbital relocation, respectively. Blue and red dashed lines denote the corresponding NH3 retrieval domains, with viewing zenith angles greater than 70° excluded. The background map shows total anthropogenic NH3 emissions in 2017 from the MIXv2 emission inventory at a 0.1° grid resolution (Li et al., 2024). The red pentagram marks the location of the Hefei station, which is further described in Sect. 3.2. Black boxes outline major agricultural areas, including the North-Northeast China Plain, the Sichuan Basin, and the Indo-Gangetic Plain.
Three years of NH3 columns from July 2022 to June 2025 are retrieved from FY-4B/GIIRS spectra using the FengYun Geostationary satellite Atmospheric Infrared Retrieval (FY-GeoAIR) algorithm, which exploits the strong NH3 absorption features in the 955–975 cm−1 spectral region. FY-GeoAIR is a full-physics retrieval algorithm that integrates a forward radiative transfer model for simulating upwelling thermal radiation and an optimal estimation-based inverse model for retrieving trace gases and auxiliary parameters from the observed spectra (Zeng et al., 2023b). In this study, the retrieval configuration and parameters are identical to those described in Zeng et al. (2023a), except that a profile-scaling retrieval approach was adopted instead of the full-profile retrieval method. The full-profile retrieval method fully resolves the ammonia profile as 11 separate layers. In contrast, the profile-scaling retrieval approach only retrieves the total column of NH3. It applies a single representative a priori profile (identical for all scenes) and scales this profile in the retrieval algorithm to optimize the spectra fitting. In this case, there is only one state vector element for NH3, instead of 11. The reasons for this change of the retrieval configuration are: (1) the degrees of freedom for signal (DOFS) for most NH3 retrievals as shown in Zeng et al. (2023a) is less than one, indicating less than one piece of information is available from the spectra for NH3 and not sufficient to constrain its vertical distribution; (2) using the profile-scaling retrieval approach speeds up the retrieval calculation. Similarly, only total column is retrieved for the interference gas H2O. The retrieval yields the NH3 column and the posteriori error estimate. In addition, the column averaging kernel (AVK) is derived simultaneously in the optimal estimation framework. The column AVK value at a given atmospheric layer represents the change in the retrieved total NH3 column with respect to a perturbation of the partial NH3 column at that layer. It therefore reflects the height-dependent sensitivity determined by the temperature difference between the surface and the given atmospheric layer (Figs. A1 and S1 in the Supplement). This definition of AVK is similar to that from the Total Carbon Column Observing Network (Wunch et al., 2011) and IASI (Clarisse et al., 2023), but differs from conventional matrix AVK from optimal estimation (Shephard et al., 2011, 2015). Further details on interpretation and calculation of the column AVK are provided in the Appendix.
In the NH3 retrievals, regions with viewing zenith angles greater than 70° are excluded from the retrieval algorithm, as large zenith angles increase the atmospheric path length and scattering effects while reducing the signal-to-noise ratio and retrieval reliability. Observations that are cloud-contaminated or fail to converge within 10 iterations are also removed. To obtain high-quality GIIRS NH3 observations, we also applied the following filtering criteria: (1) a root mean square error (RMSE) of the fitting residual less than 0.2 K; (2) a reduced χ2 less than 5; (3) retrieval error below 300 %; (4) the absolute difference between the a priori and retrieved surface skin temperature less than 10 K; (5) the bottom layer of column AVK greater than 0.1; (6) the thermal contrast (TC) greater than 0 K; (7) the retrieved NH3 columns are positive. The retrieval error was calculated as the square root of the diagonal elements of the retrieval error covariance matrix for NH3, normalized by the ratio of the retrieved NH3 column to the a priori NH3 column. The TC is defined as the temperature difference between the surface and the lowest atmospheric layer. The strict quality filtering results in large data gaps over the Tibetan Plateau throughout the day, and over southern regions of China and India during 17:00–19:00 LST, where retrievals are frequently discarded due to low sensitivity or cloud screening.
In this study, NH3 retrievals from individual observations over land during daytime (07:00–19:00 LST) were utilized to investigate spatial and temporal variations over East Asia (Fig. 2), whereas nighttime data were excluded due to insufficient thermal contrast. To facilitate regional analysis, individual retrievals were averaged onto a 0.5°×0.5° grid. For the analysis of daytime NH3 variations in Sect. 3.3, we further filtered the daytime observations by requiring TC>5 K to ensure sufficient sensitivity to near-surface NH3. Figure S2 shows the number of data points before and after applying the TC>5 K filtering criterion. The fractions of valid observations remaining in the North-Northeast China Plain, the Sichuan Basin, and the Indo-Gangetic Plain (as shown in Fig. 1) are about 83 %, 88 %, and 73 %, respectively.
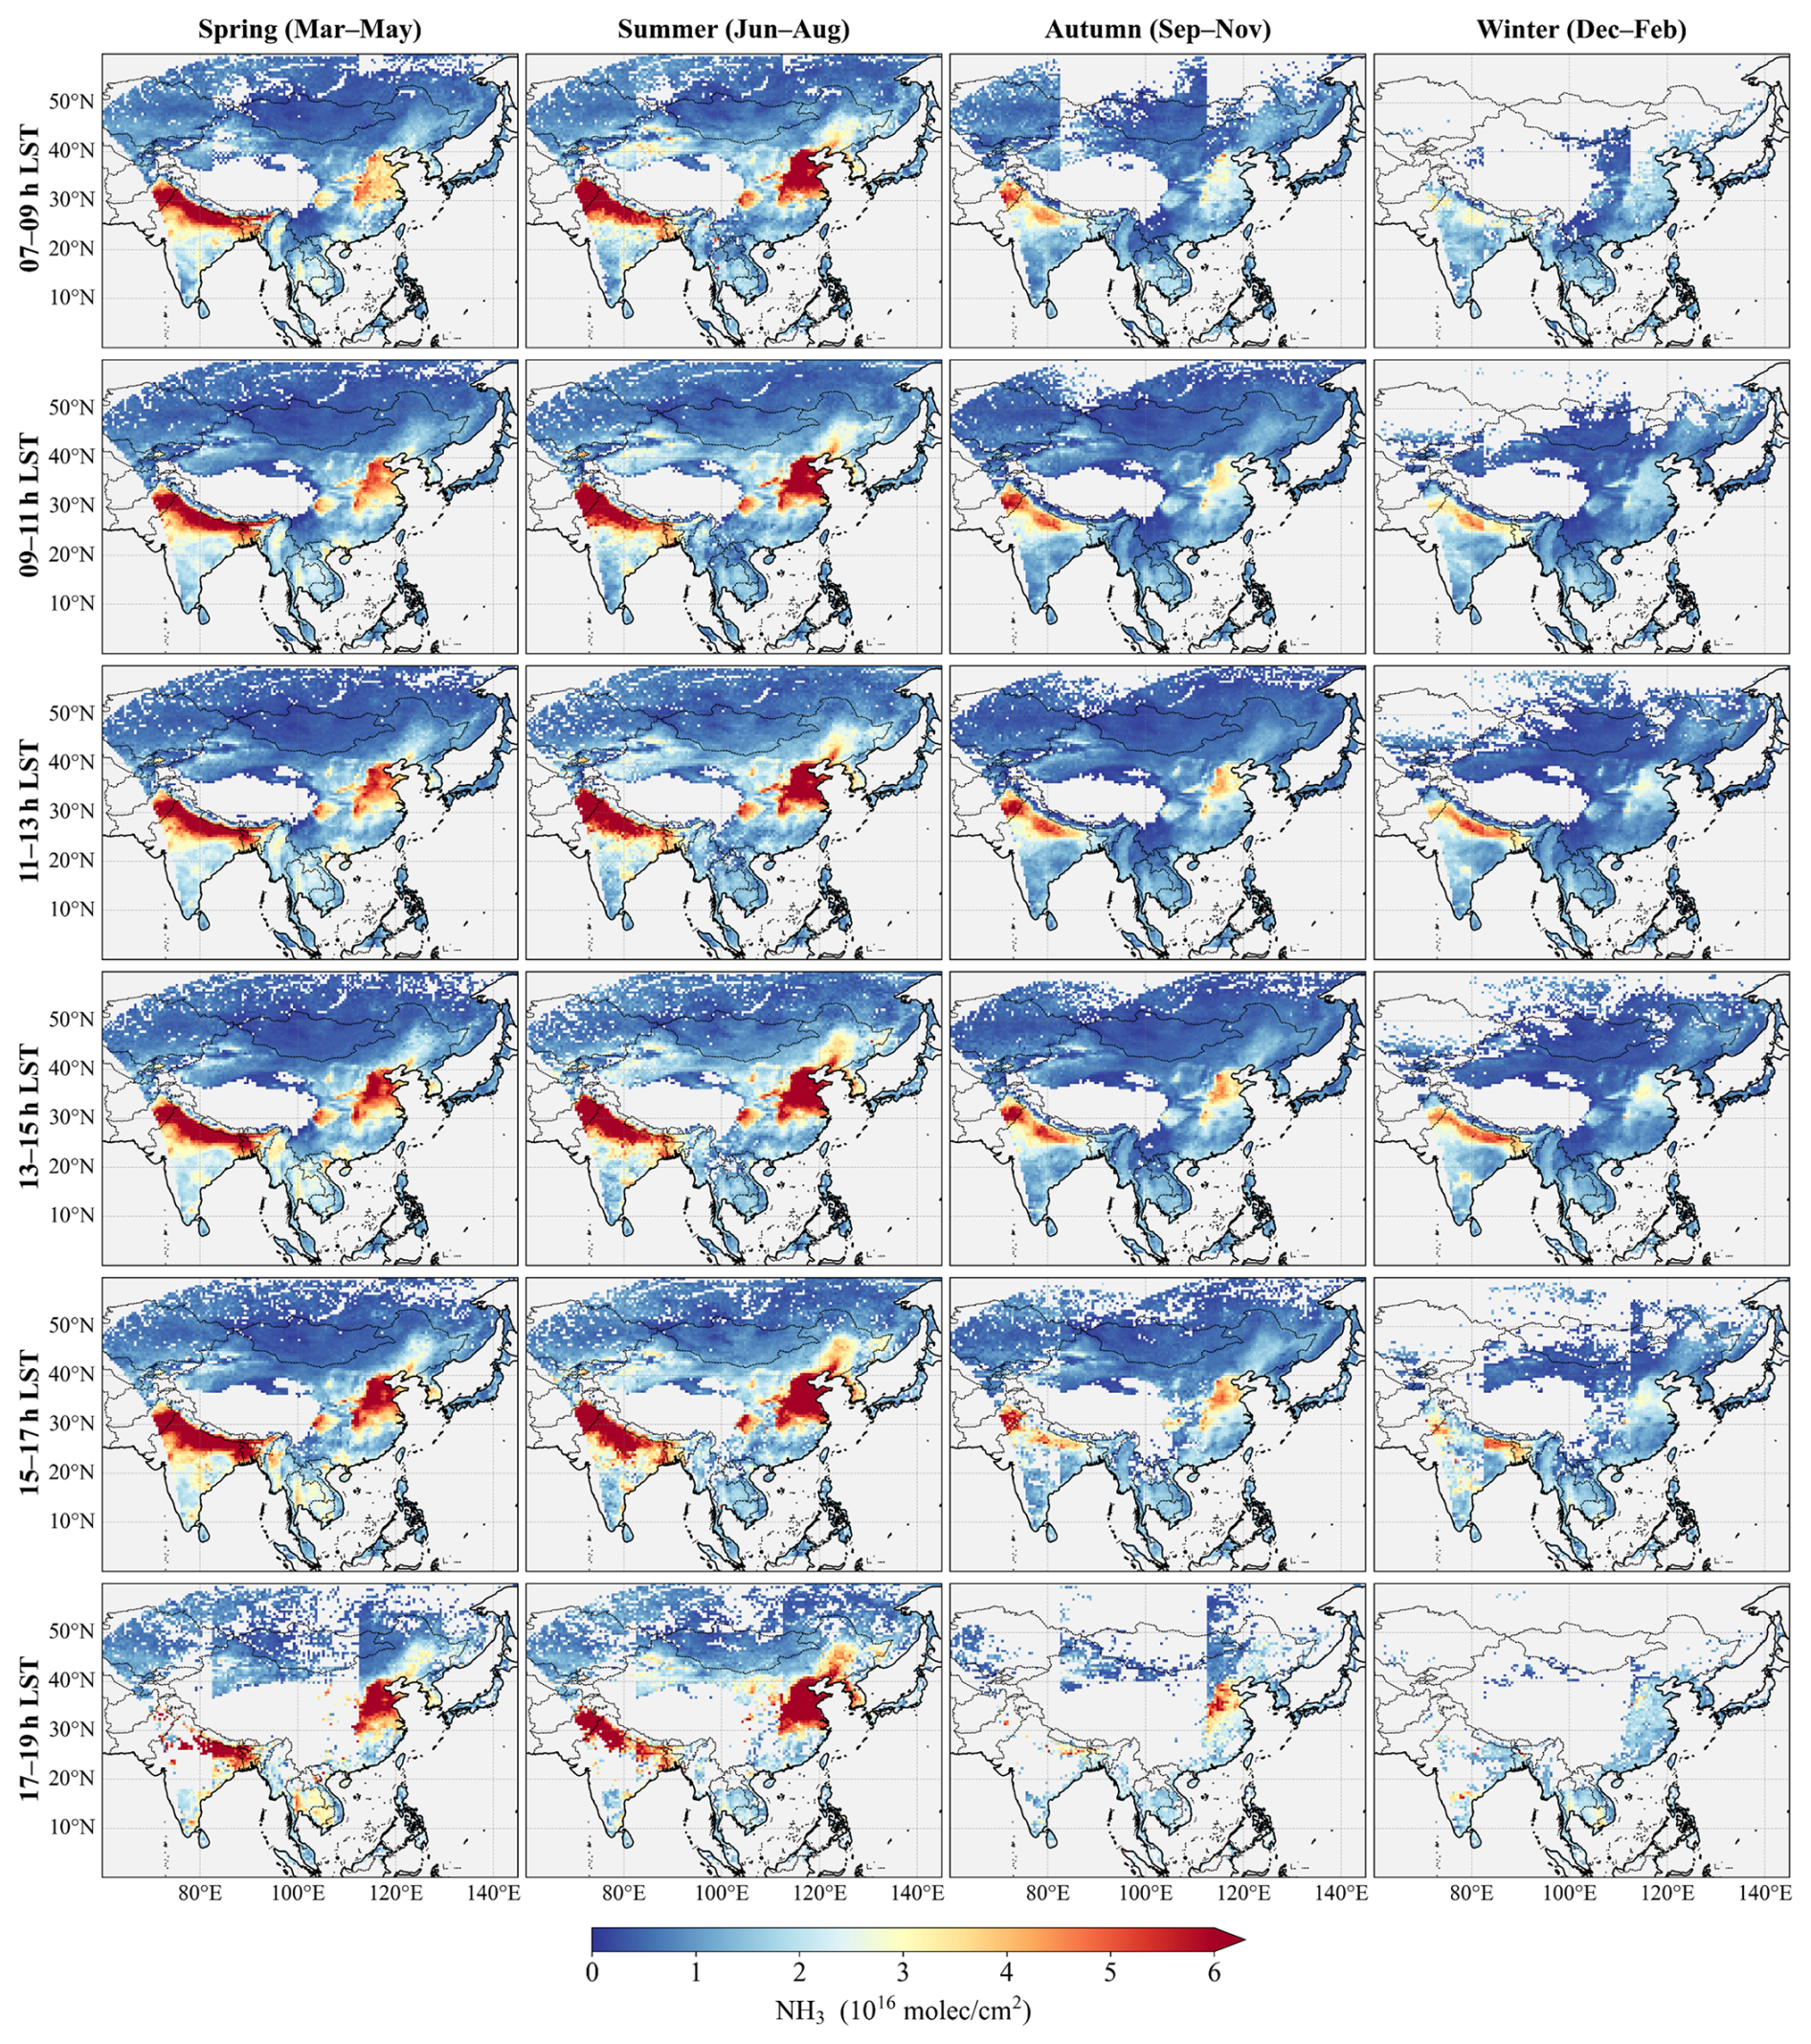
Figure 2Seasonal maps of NH3 columns from FY-4B/GIIRS observations from July 2022 to June 2025 averaged for every 2 h according to local solar time (LST) on a 0.5°×0.5° grid and for different seasons (spring: March–April–May; summer: June–July–August; autumn: September–October–November; winter: December–January–February).
2.1.2 IASI observations
The IASI instrument, jointly developed by the Centre National d'Études Spatiales (CNES) and the European Organisation for the Exploitation of Meteorological Satellites (EUMETSAT), was specifically designed for deployment aboard the Metop series satellites. Three identical instruments were successively onboard Metop-A, Metop-B and Metop-C platforms, launched in 2006, 2012, and 2018, respectively. IASI operates in a sun-synchronous LEO at an altitude of approximately 800 km, with a ground swath of ∼2100 km and a spatial resolution of 12 km at nadir. It measures the Earth's emitted infrared radiation across a spectral range of 645–2760 cm−1 with an apodized resolution of 0.5 cm−1 (Clerbaux et al., 2009). The near-real-time NH3 dataset is retrieved using the Artificial Neural Network for IASI (ANNI) framework. This method converts the hyperspectral signature of NH3, quantified by the so-called hyperspectral range index (HRI), into total column amounts (Whitburn et al., 2016). Two independent validation studies demonstrated that IASI-retrieved NH3 columns show good consistency with both in situ and FTIR observations, exhibiting near-unity regression slopes and moderate biases (Guo et al., 2021; Wang et al., 2022). In this study, we utilized NH3 data from IASI observations on the Metop-B and Metop-C platforms from January 2017 to June 2025 for comparison with GIIRS observations. The data products provide total NH3 columns derived from the ANNI version 4 algorithm, which is about 15 %–20 % larger than the previous version 3 due to the improved setup of HRI, but show very similar NH3 distribution (Clarisse et al., 2023). Here, NH3 columns marked as recommended by both pre-filter and post-retrieval quality flags in the data products were selected and then regridded onto a 0.5° spatial grid using arithmetic averaging. The quality flags allow some negative columns to be retained, as discussed by Clarisse et al. (2019) and Whitburn et al. (2016).
2.1.3 CrIS observations
The Cross-track Infrared Sounder (CrIS) is a Fourier transform spectrometer (FTS) jointly developed by the National Oceanic and Atmospheric Administration (NOAA) and the National Aeronautics and Space Administration (NASA), which provides hyperspectral infrared measurements at a spectral resolution of 0.625 cm−1 with a nadir spatial resolution of ∼14 km. CrIS was first launched on the Suomi National Polar-orbiting Partnership (S-NPP) satellite on 28 October 2011 and subsequently deployed on NOAA-20 (JPSS-1) on 29 November 2017 and on JPSS-2 on 10 November 2022. The NH3 retrievals from CrIS observations on S-NPP and NOAA-20 have been generated using the CrIS Fast Physical Retrieval (CFPR) algorithm developed by Environment and Climate Change Canada (ECCC), which exploits spectral features near 967 cm−1. A detailed description of the CFPR algorithm can be found in Shephard et al. (2015, 2020). Independent validation studies against FTIR-derived total column measurements have demonstrated that CFPR (version 1.3) shows good overall consistency, with a correlation of approximately 0.8 and a slope of 1.02. For retrievals with total column values above 1×10¹⁶ molec cm−2 (ranging from moderate to high levels), the relative bias is less than 5 %. For smaller total column values ( molec cm−2), there are larger differences, with CrIS retrievals about 30 % higher than FTIR values (Dammers et al., 2017b). However, these validations did not account for non-detects below the detection limit of the sensor ( molec cm−2 under typical remote sensing conditions) (Shephard et al., 2025; White et al., 2023), which could reduce potential high-biases over non-source conditions. In this study, we used CrIS NH3 data product from NOAA-20 (version 1.6.4), spanning the period from March 2019 to April 2025. The product provides geolocation information, vertically integrated ammonia total columns, retrieval uncertainties, quality flags, and additional metadata. The dataset utilizes the information content of the satellite measurements to explicitly identify and account for cloud-free observations below the sensor detection level (White et al., 2023). Our analysis focuses on NH3 retrievals over land, characterized by land fraction >0, quality flag ≥4, cloud flag ≠1, and DOFS ≥0.1.
2.2 Ground-based FTIR measurements at Hefei
The Hefei station (31.91° N, 117.17° E) is located in the northwestern rural area of Hefei city, China. The surrounding region is part of a typical Jianghuai agricultural region, where wetlands and croplands are interspersed in a distinctive landscape pattern. Since July 2015, a high-resolution ground-based Fourier transform infrared spectrometry (FTIR) has been operating at the station to record mid-infrared (MIR) solar absorption spectra (700–4000 cm−1) for the remote sensing of greenhouse gases and trace species (Wang et al., 2017). A previous study has demonstrated that FTIR measurements at Hefei effectively capture the spatiotemporal variability of NH3 columns, and the retrievals are broadly consistent with IASI satellite data (Wang et al., 2022). In this study, FTIR-derived NH3 column data from 2017 to 2024 were averaged into hourly means and used for the validation and cross-comparison of satellite-based NH3 retrievals. It should be noted that the data primarily covers the period from 08:00 to 17:00 LST, with limited available observations between 17:00 and 18:00 LST.
2.3 NH3 emission inventory
The MIXv2 Asian emission inventory was developed under the framework of the Model Inter-Comparison Study for Asia Phase IV (MICS-Asia IV) project by assembling a mosaic of up-to-date regional and national emission inventories (Li et al., 2024). It provides monthly estimates of NH3 emissions for 2010–2017 at a spatial resolution of 0.1°×0.1° grid across seven sectors. The inventory incorporated nine regional and two global emission inventories, covering 23 countries and regions in East, Southeast and South Asia. Anthropogenic NH3 emissions were based on the best available emission inventories, including a process-based NH3 emission inventory developed by Peking University (PKU-NH3) for China, the official Japan emission inventory (JPN), and the Clean Air Policy Support System (CAPSS) emissions for the Republic of Korea, and were gap-filled with REAS version 3 for Asia (REASv3). Studies have suggested that the spatial distribution of NH3 emissions in the inventory is generally reliable, with differences compared to other emission inventories and satellite-constrained NH3 emissions typically within 20 %–50 % (Luo et al., 2022; Zhang et al., 2019; Kang et al., 2016).
2.4 Hourly NH3 data from GEOS-CF model
The Goddard Earth Observing System composition forecast (GEOS-CF) is a high-resolution global constituent prediction model developed by NASA's GMAO. It expands on the GEOS weather and aerosol modeling system by introducing the GEOS-Chem chemistry module, providing near-real-time, three-dimensional gridded information on atmospheric composition (Keller et al., 2021). The emission inputs of anthropogenic NH3 emissions used by GEOS-CF are mainly from the Hemispheric Transport of Air Pollution emissions inventory (HTAP v2.2), which provides monthly data at a 0.1° spatial resolution. The model runs at hourly intervals with 0.25°×0.25° horizontal resolution and 72 hybrid-eta levels from the surface to 0.01 hPa. In this study, NH3 vertical profiles were obtained from 1 d replay simulations (referred to as “hindcast”) constrained by pre-computed meteorological analysis fields, and NH3 total columns were calculated by combining the model's vertical pressure levels and surface pressures from the fifth-generation ECMWF reanalysis (ERA5) (Hersbach et al., 2023).
2.5 The derivation of NH3 variations
2.5.1 Curve-fitting Method for trend analysis
To quantify the temporal changes in NH3 columns, we applied a curve-fitting method to obtain daily time series of satellite-based NH3 observations. This method is widely used to extract temporal variation characteristics of atmospheric composition, such as NH3 (Wang et al., 2022; Van Damme et al., 2015). As shown in Eq. (1), it integrates a polynomial function and a sum of harmonic function, representing long-term linear trend and seasonal cycles, respectively.
where f is the daily fitting result, t is the time in decimal years, the coefficients (a0, a1, βn, γn) are determined by the least squares regression. In Sect. 3.1, the fitting analysis was performed separately for each 0.5°×0.5° grid cell, with more than 500 data points and observation dates spanning over 100 d. Extreme values and minima of the fitted curves were then calculated to identify temporal inflection points and determine the months with peak NH3 concentrations.
2.5.2 Gridded NH3 enhancements
Based on the spatial distribution of NH3 emissions and concentrations, the study domain was divided into 14 subregions (Fig. 6). Monthly variations of NH3 columns for each subregion were obtained by aggregating the daily fitted values calculated in Sect. 2.5.1, which represent the regional background levels. NH3 anomalies from individual measurements were then calculated by subtracting NH3 backgrounds, as defined in Eq. (2).
where Ai is the NH3 anomaly for the individual ith retrieval, Xi is the observed NH3 column, and BKr,m represents the NH3 background for region r and month m corresponding to the spatial location and observation time of retrieval i. For each grid cell, positive anomalies with occurrences of elevated concentrations ( molec cm−2) exceeding 30 d were classified as NH3 enhancements. The frequency of such occurrences, expressed as number of days, serves as a useful indicator of enhanced emissions, such as recurring agricultural activities (Shephard et al., 2020; Warner et al., 2016).
3.1 Spatial and temporal NH3 distribution over East Asia
Figure 2 illustrates the three-year averaged seasonal NH3 column concentrations retrieved from FY-4B/GIIRS observations over East Asia from July 2022 to June 2025, presented on a 0.5°×0.5° grid at two-hour intervals. The observations are aggregated according to local solar time (LST) to facilitate the analysis of NH3 diurnal variations and consistent comparisons. The study region spans multiple time zones and data availability during the 07:00–09:00 and 17:00–19:00 LST periods is substantially reduced due to retrieval filtering, resulting in noticeable boundaries across longitudes. Elevated NH3 columns, significantly above background levels, are observed over the Indo-Gangetic Plain, the North China Plain, the Sichuan Basin, and the Northeast China Plain (as shown by the black boxes in Fig. 1). The daytime NH3 columns reach values exceeding 4×10¹⁶ molec cm−2, primarily driven by intensive agricultural activities and supplemented by non-negligible contributions from urban and industrial emissions. Localized weaker enhancements of NH3 column concentrations are evident over agricultural core areas in China (including the Ningxia Irrigation Plain, the Wei River Plain, the Jianghan Plain, and oasis agriculture in the arid regions of Xinjiang), as well as the central Deccan Plateau in India, the Mekong Delta in Vietnam, the Chao Phraya River Plain in Thailand, and the Fergana Valley in Uzbekistan (as shown by the dashed boxes in Fig. S4). Most of these regions exhibit higher NH3 columns in summer and considerable daytime variability, with large differences between morning and afternoon observations. A detailed analysis of diurnal patterns over major source regions is provided in Sect. 3.3.
Comparisons with the spatial distribution of NH3 columns observed by polar-orbiting infrared sounders of IASI and CrIS show reasonable agreement, especially in regions with high NH3 columns above 3×10¹⁶ molec cm−2 (Figs. 3 and 4). The seasonal increases in atmospheric NH3 are most pronounced in spring and summer. Despite generally similar seasonal and spatial patterns, inter-satellite NH3 observations exhibit noticeable differences. Relative to the IASI observations, GIIRS typically shows very small systematic differences with fitted slopes close to unity. In contrast, GIIRS observations tend to show higher NH3 columns than CrIS in most high-concentration regions, with mean differences of approximately 25 %–50 % relative to the corresponding GIIRS values in summer. The data point scattering in the comparison plots primarily results from spectral noise. Overall, there is good agreement between GIIRS-derived NH3 columns and those from IASI and CrIS across different seasons.
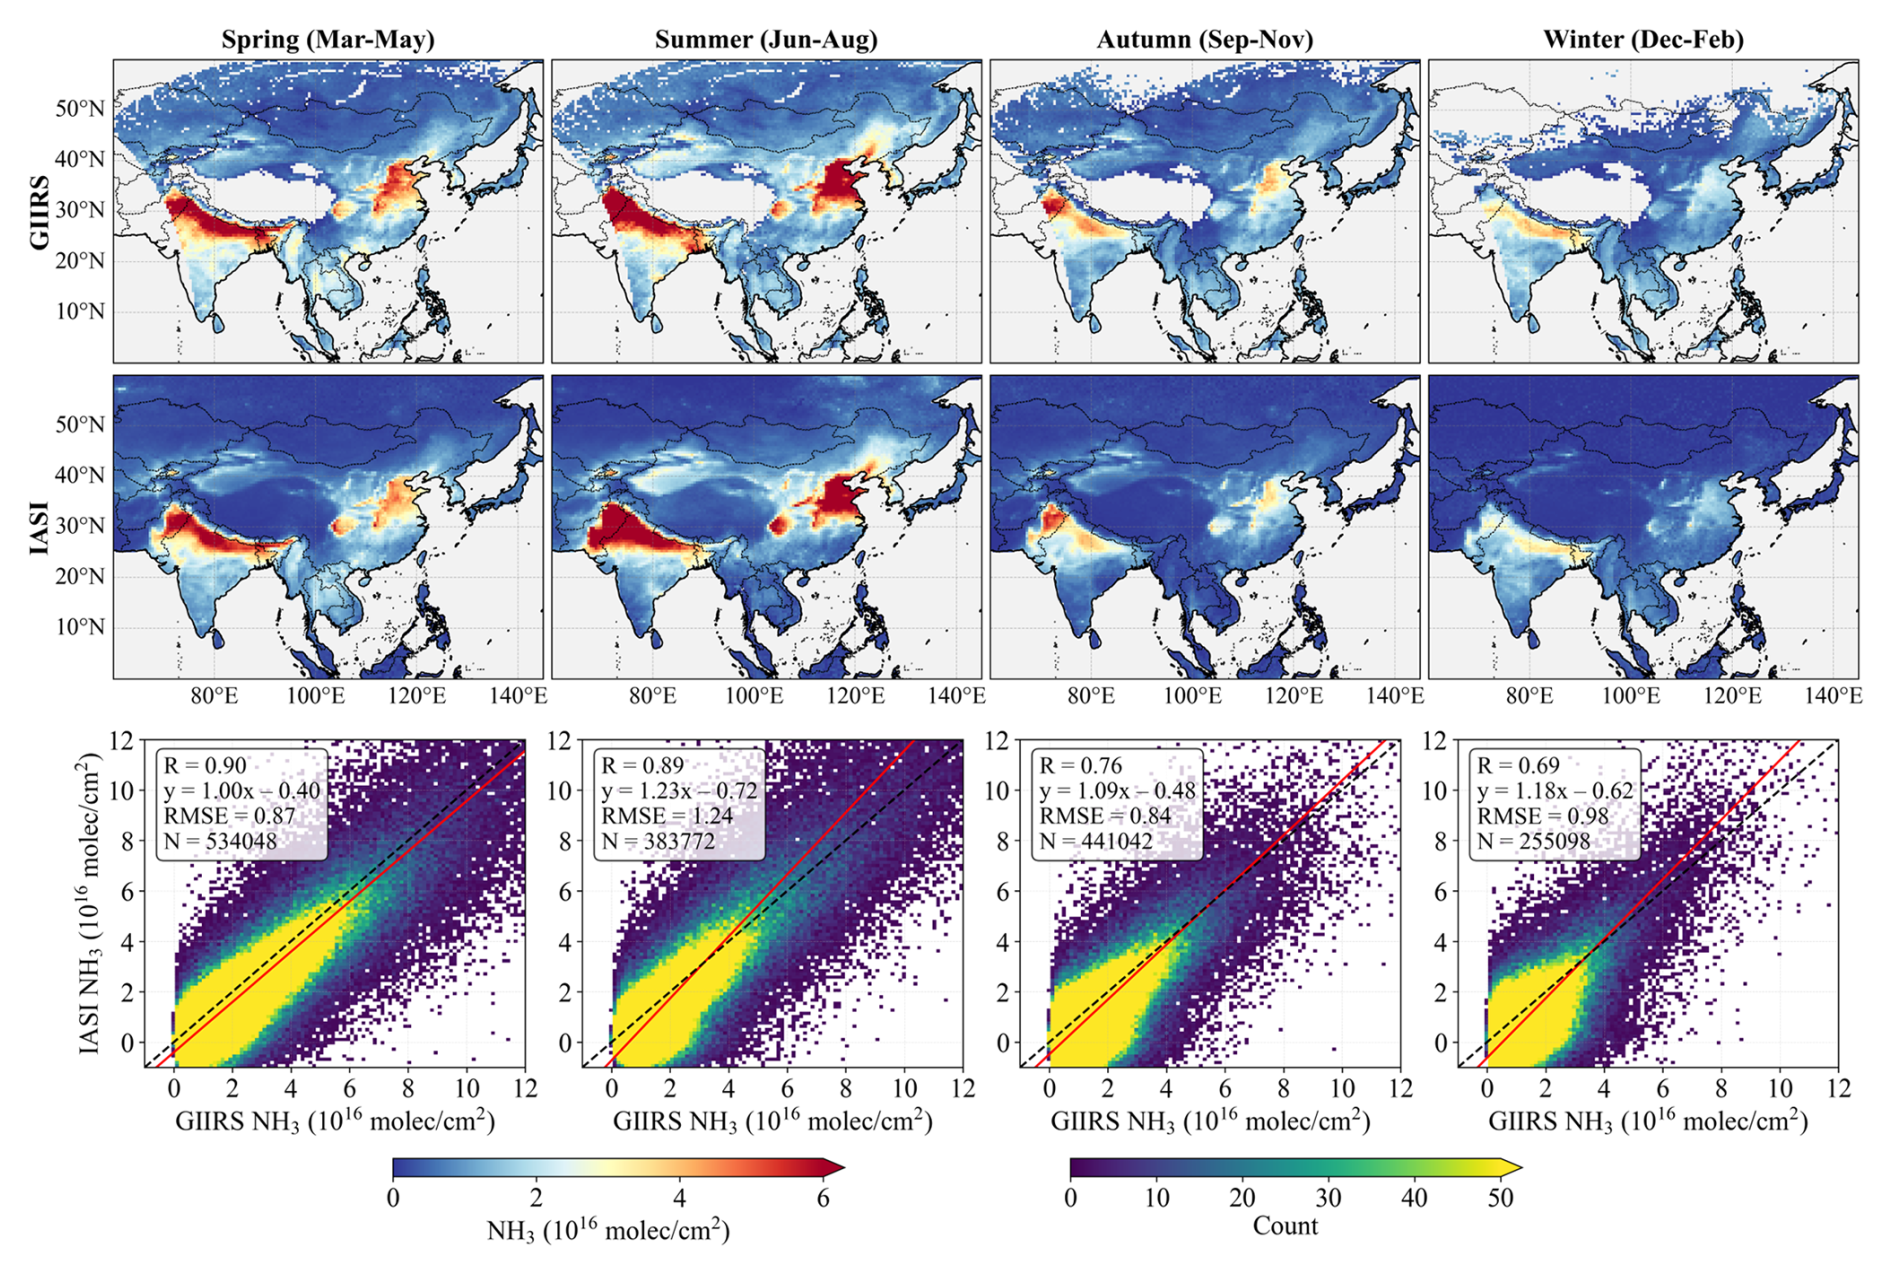
Figure 3Comparison of NH3 columns observed by GIIRS and IASI during morning overpasses (∼ 09:30 LST) from July 2022 to June 2025. Seasonal maps are presented on a 0.5°×0.5° grid. Scatter plots compare GIIRS and IASI data matched by overpass times within 1 h and spatial locations within the same 0.5°×0.5° grid cells.
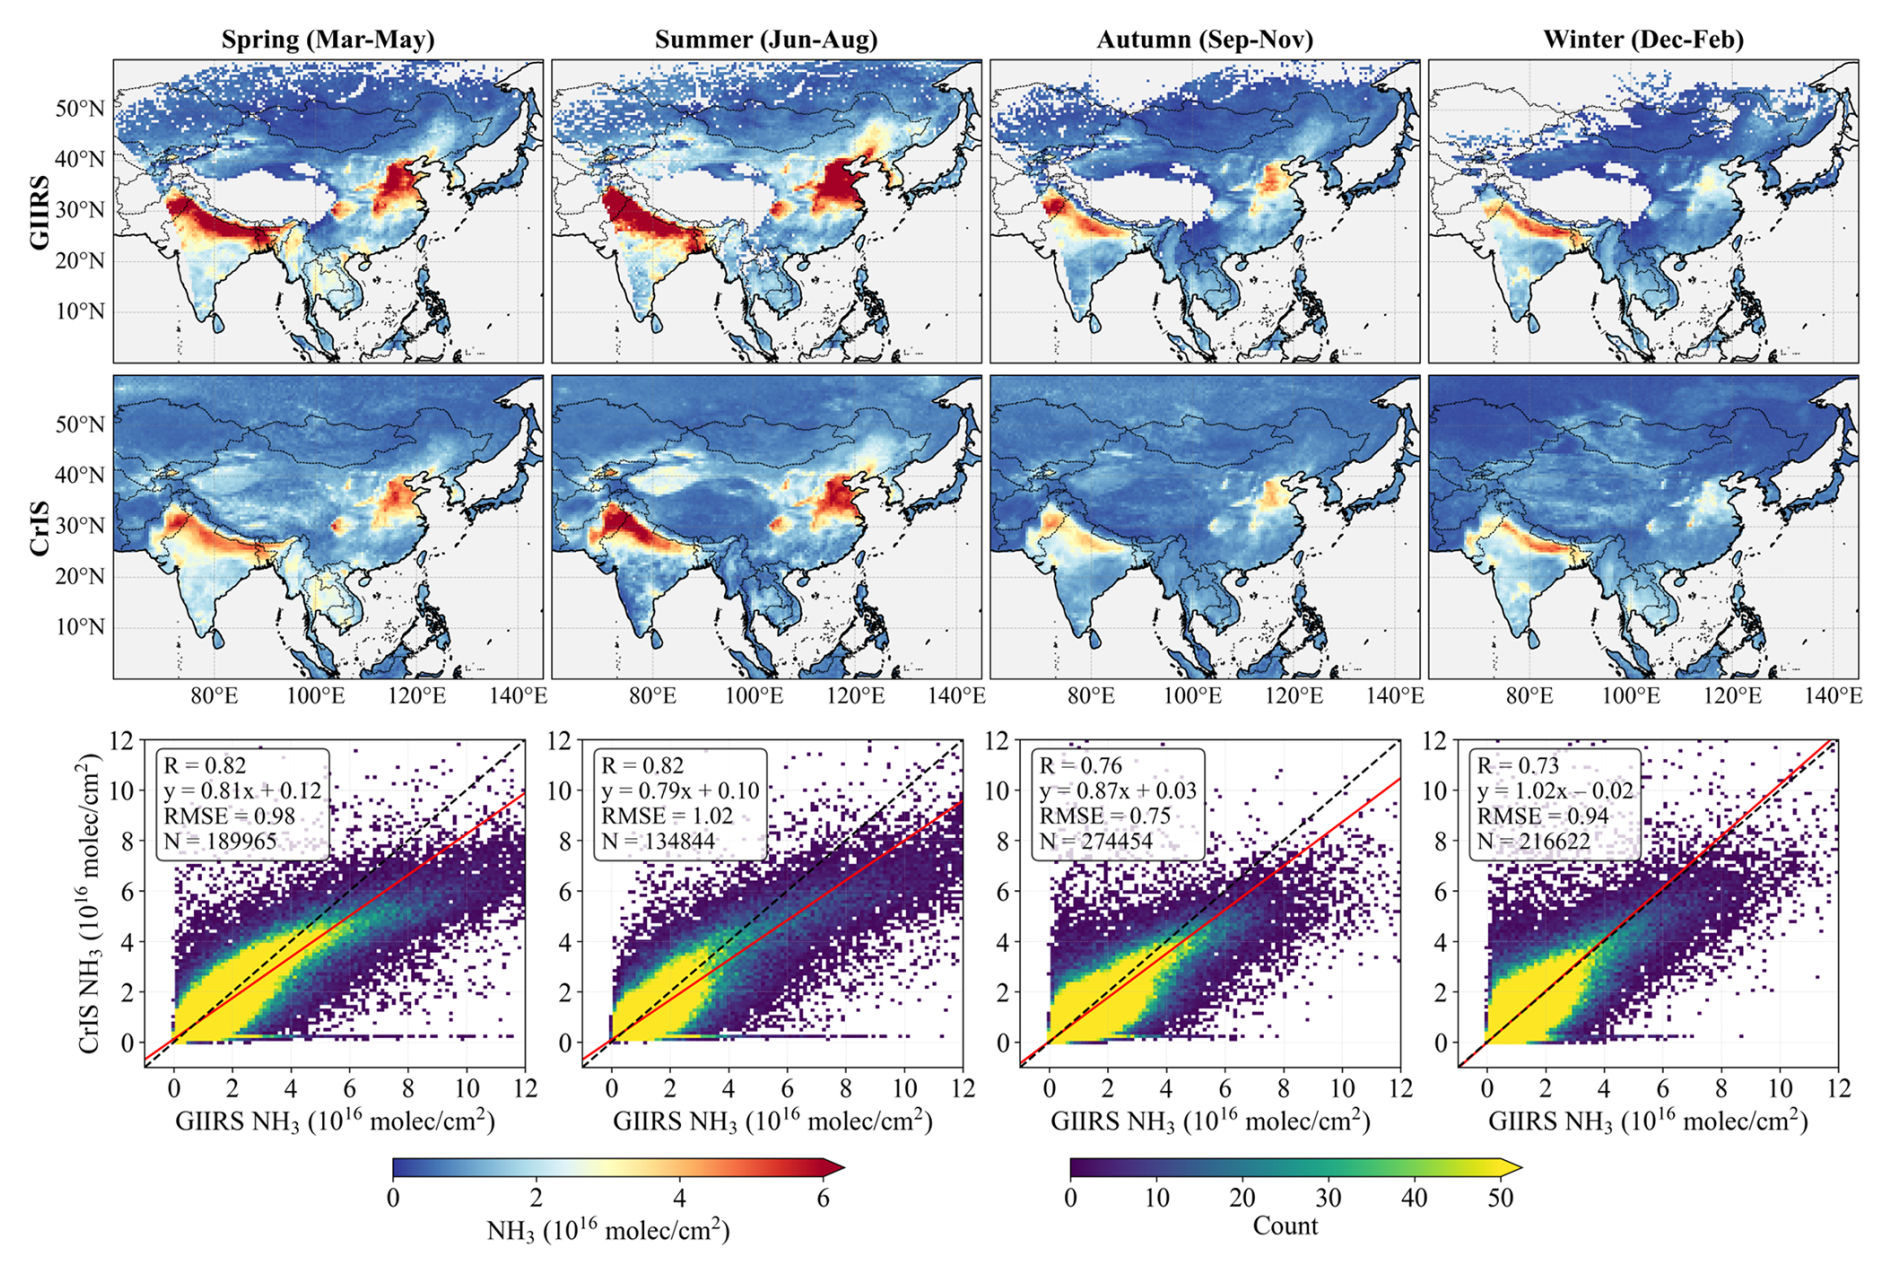
Figure 4Comparison of NH3 columns observed by GIIRS and CrIS during afternoon overpasses (∼ 13:30 LST) from July 2022 to April 2025. Seasonal maps are presented on a 0.5°×0.5° grid. Scatter plots compare GIIRS and CrIS data matched by overpass times within 1 h and spatial locations within the same 0.5°×0.5° grid cells.
To account for the effects of differing vertical sensitivities, as reflected by the AVKs, and a priori profiles among these satellites (see Fig. S1 for example), we conducted experiments using model profile data and satellite AVKs over the North-Northeast China Plain (30–43° N, 110–125° E) in June 2024 (Sect. S1 in the Supplement). Model simulations of NH3 profiles were convolved with different satellite AVKs to generate AVK-smoothed NH3 columns, representing the NH3 columns that a certain satellite would retrieve if the model simulations were the “truth”. We then compared AVK-smoothed NH3 column datasets generated using different satellite AVKs to evaluate the effects of different satellite vertical sensitivities. The comparison results (Fig. S5 in the Supplement) show high correlations (R>0.9) and slopes close to unity. This indicates consistency in the detection of NH3 across different sensors, and that the effects of different AVKs and a priori profiles are small in terms of total column retrieval when comparing different satellite retrievals.
Figure 5 illustrates the months corresponding to the maximum NH3 concentrations derived from GIIRS and IASI on a 0.5° grid, while the result from CrIS, which is highly scattered at this scale, is shown on a 1° grid in Fig. S6. The spatial pattern shows a clear north-south gradient in the timing of NH3 peaks. In the northern regions of East Asia, NH3 columns generally peak in June and July, which could be attributed to enhanced volatilization from agricultural soils, livestock operations, and other sources (e.g., composting facilities and wastewater treatment plants) under high-temperature conditions (Li et al., 2024). Irrigated croplands in the North and Northeast China Plains also exhibit a secondary spring maximum (Fig. S7) associated with extensive fertilizer use and animal feeding operations. In contrast, the regions of southern China, India, and Southeast Asia, characterized by a tropical monsoon climate, exhibit earlier NH3 peaks, generally occurring from March to May. The peak period coincides with their first cropping season, which involves intensive nitrogen fertilizer application. The warm and humid conditions in these regions further promote NH3 volatilization from soils and livestock waste. Following the onset of the rainy season in June–July, atmospheric NH3 concentrations decline sharply (such as R7, R8, R13, R14 in Fig. 6), primarily due to enhanced wet scavenging processes. This seasonal pattern aligns with findings from multiple studies reporting a distinct “late dry season-early wet season” NH3 maximum in tropical regions (e.g., Chen et al., 2020; Liu et al., 2019). Spring is a period of intense fire activity in the Indochina Peninsula, which is largely driven by residue burning, land-clearing, and naturally flammable vegetation during the dry season (Chang et al., 2021; Vadrevu et al., 2019). The NH3 maxima mainly occur in March–April, and the consistent spatial distribution of these NH3 peaks observed by GIIRS and IASI over Southeast Asia suggests the influence of biomass burning associated with fires on its seasonal variations. In addition, bimodal local maxima, with peaks of comparable magnitude, are also observed in regions such as central India (from May to September), Guangdong in southern China (typically in April and August), and the transboundary region between the Mekong Delta in Vietnam and Yunnan in China (March–April and June–July).
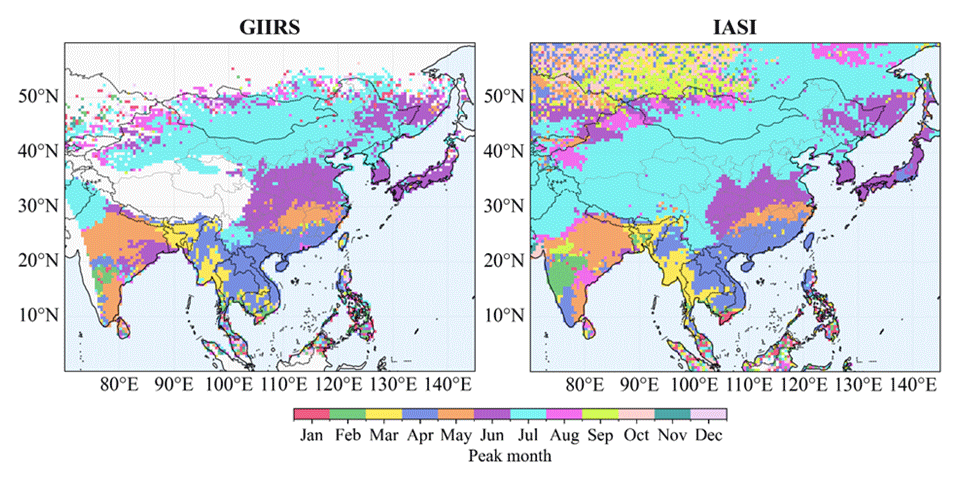
Figure 5The months with NH3 column peaks observed by FY-4B/GIIRS from July 2022 to June 2025 and IASI from January 2022 to June 2025 on a 0.5°×0.5° grid. GIIRS results for the full daytime period (07:00–19:00 LST) are presented here for clarity, as morning and afternoon observations show consistent seasonal patterns (not shown).
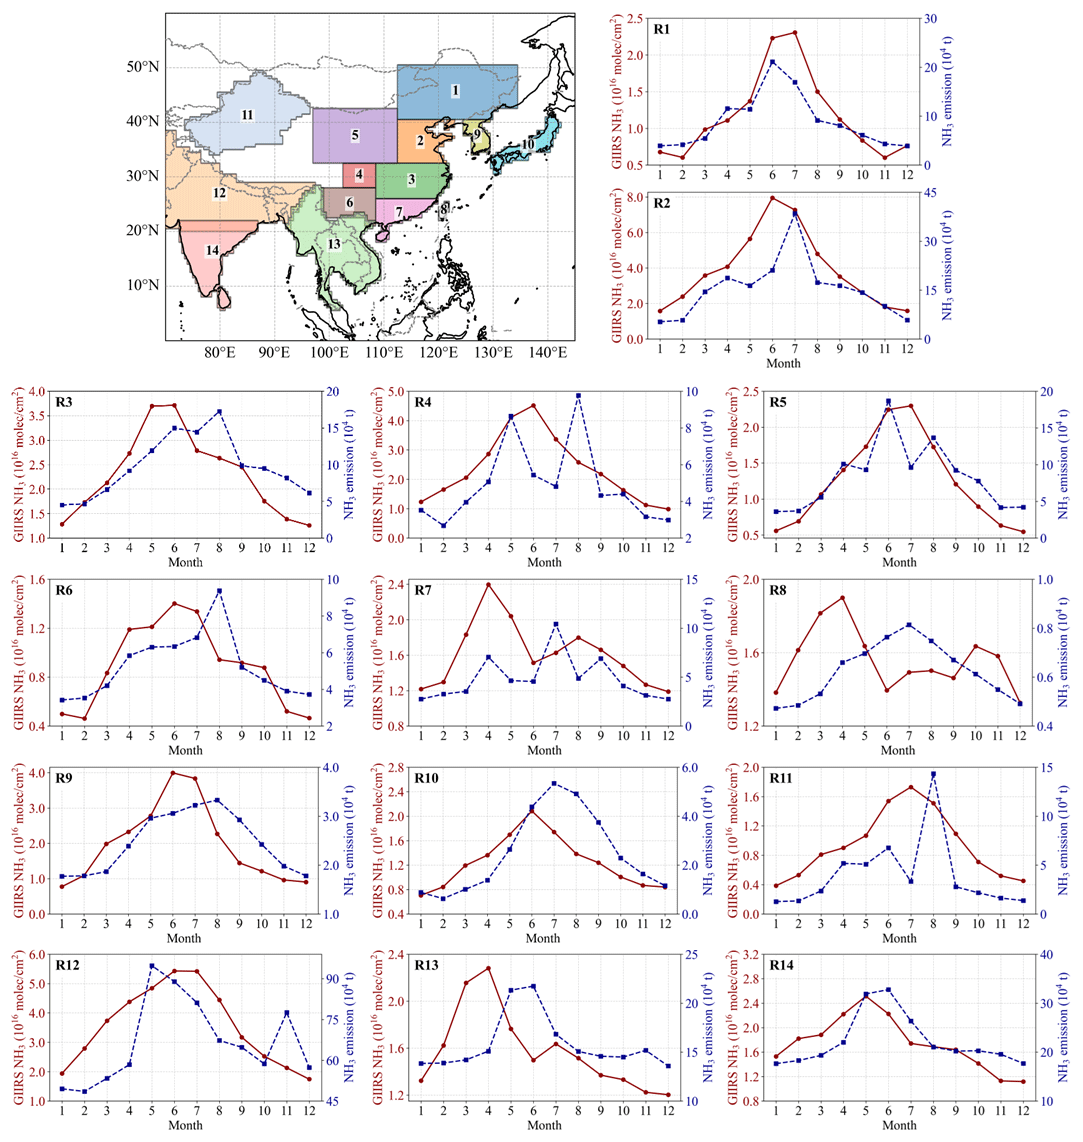
Figure 6Monthly variations of GIIRS-derived NH3 columns from July 2022 to June 2025 and NH3 total emissions from the MIX inventory in 2017. Colored boxes specify spatial domains of 14 subregions (Sect. 2.5.2).
In general, the spatial and temporal distributions of NH3 peaks largely agree with the previous studies of Van Damme et al. (2015) and Shephard et al. (2020). Minor discrepancies between GIIRS and IASI result from differences in observational accuracy and retrieval algorithms, as discussed above. Satellite-observed NH3 seasonal cycles are driven by the interplay of agricultural activities and climatic conditions, leading to deviations from seasonal patterns of anthropogenic emissions (Fig. S8). Several studies have reported that NH3 emissions inferred from satellite observations exhibit distinct seasonal variations that can differ from those of the NH3 columns (Li et al., 2026; Kumar et al., 2025). Therefore, we focus on the spatial distribution of NH3 enhancements, relative to regional background levels, as captured by different satellites.
After removing monthly backgrounds derived from predefined regions (Fig. S9), NH3 enhancements (Fig. 7) reveal a spatial pattern of anthropogenic emissions that is highly consistent with the MIX emission inventory (Fig. 1). Apart from the major agricultural emission regions mentioned above, some regions (e.g. Hyderabad and Vijayawada in India) also show elevated NH3 levels compared to the background during autumn and winter, likely influenced by dense urban and industrial activities. Due to data discrepancies in local overpass times and sensor sensitivities among the polar-orbiting and geostationary satellites (Shephard et al., 2025), the enhancement values detected by CrIS are 0.50 ± 0.64 and 0.74 ± 0.90×10¹⁶ molec cm−2 lower than those detected by GIIRS and IASI, respectively. These inter-satellite differences can lead to inconsistencies in the observed NH3 enhancements across various source regions, particularly over the Sichuan Basin, the Ningxia Irrigation Plain, and the urban and biomass-burning regions of Southeast Asia. Compared with IASI and CrIS observations at different local times, GIIRS provides consistent and reliable measurements throughout the daytime, enabling accurate characterization of spatial and temporal variations in NH3 concentrations across distinct emission source regions.
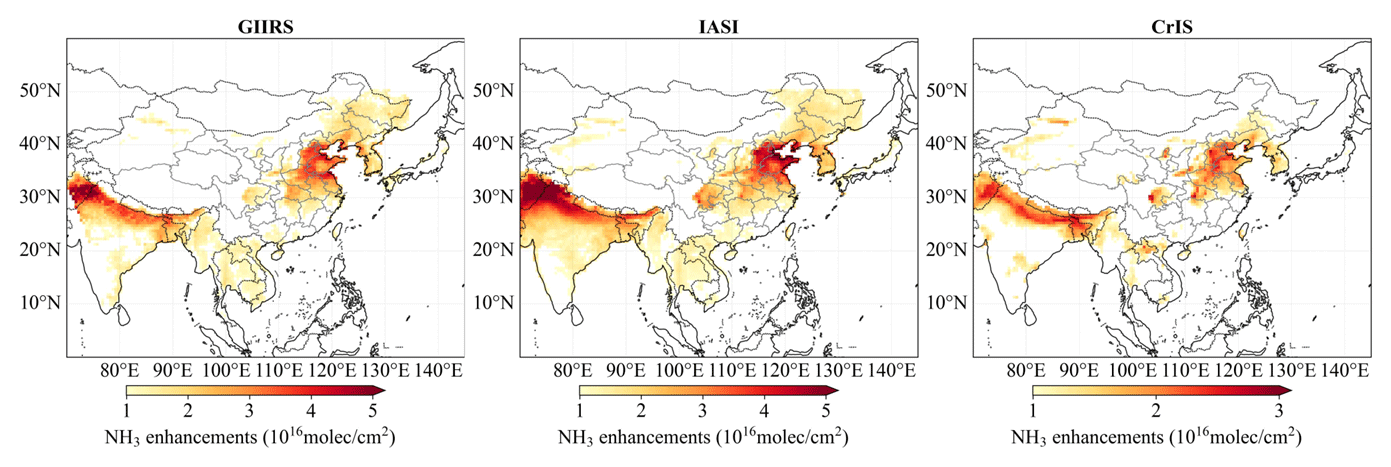
Figure 7Spatial distribution of NH3 enhancements derived from satellite observations (GIIRS, IASI, and CrIS). Note that the color bar for CrIS differs from those for GIIRS and IASI, and abnormal NH3 enhancements over the Tibetan Plateau have been excluded.
3.2 Inter-comparison of NH3 variations at the Hefei station
To evaluate the data accuracy of GIIRS-derived NH3 columns and assess the consistency of temporal variations with polar-orbiting satellite measurements, we compared the satellite-based observations with ground-based FTIR measurements at the Hefei station. Satellite data within a 0.25° latitude/longitude radius around the Hefei station (Fig. S10) were selected and averaged on an hourly scale. A linear regression through the origin was applied to evaluate the proportional agreement between the datasets.
Figure 8 shows scatter plots comparing NH3 columns retrieved from satellite observations and FTIR measurements during their overlapping periods. Overall, the satellite-derived NH3 columns show good agreement with the FTIR data, with Pearson correlation coefficients (R) exceeding 0.70, although satellite values are generally slightly higher. Among the satellites, GIIRS agrees best with FTIR in terms of the highest correlation and the low root mean square error (RMSE). However, GIIRS exhibits a relative systematic bias toward overestimating NH3 columns, as indicated by its regression slope (1.12) being notably larger than those of IASI and CrIS. When measurement uncertainties were taken into account, regression analysis using the orthogonal distance regression (ODR) method yielded an increased slope of 1.24 (Fig. S11), indicating that GIIRS tends to produce systematically higher NH3 columns than IASI and CrIS.
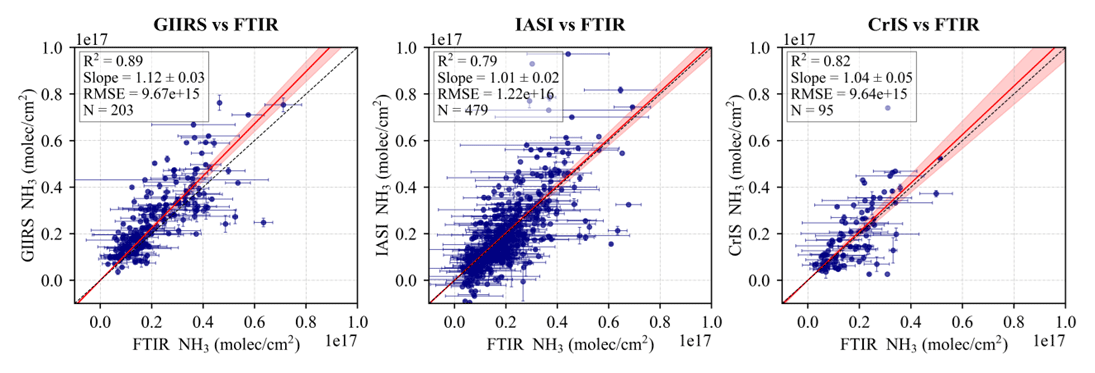
Figure 8Cross-validation of hourly NH3 columns from GIIRS, IASI, and CrIS with FTIR measurements at the Hefei station. The overlapping periods span January 2017 (IASI), March 2019 (CrIS), and July 2022 (GIIRS) to December 2024. GIIRS data encompass all daytime hours, while IASI and CrIS data correspond specifically to their respective overpass times.
Although the overestimation of GIIRS becomes more pronounced in afternoon observations (Fig. S12), the corresponding data conversely show improved consistency, which is characterized by higher R2 and lower RMSE values. This is related to the fact that the inversion accuracy of GIIRS observations is affected by TC and boundary layer conditions. High NH3 columns and significant TC represent favorable conditions for retrieving NH3 from satellite observations (Zeng et al., 2023a; Clarisse et al., 2010). As illustrated in Fig. S13, large positive TC between 11:00 and 15:00 LST enhances measurement sensitivity, leading to lower retrieval errors. GIIRS NH3 column retrievals are most reliable when TC exceeds 5 K, a condition predominantly observed during summer daytime hours (07:00–19:00 LST).
The Hefei station and its surrounding regions predominantly practice a rice-wheat rotation, with rice and winter wheat typically sown in spring (around May) and autumn (around October), respectively. According to the MIX emission inventory, agricultural ammonia emissions in this region exhibit two primary peaks in June and August, which are associated with local agricultural practices including livestock waste management, nitrogen fertilizer application, and irrigation activities during the rice growing season (Hou and Yu, 2020). Smaller peaks occur in October–November and April, corresponding to the rice harvest/wheat sowing period and the wheat regreening fertilization stage, respectively. Driven jointly by agricultural emission intensity and meteorological conditions such as high temperatures, the atmospheric NH3 concentrations observed by satellites and ground-based FTIR show consistent seasonal cycles, peaking in summer (June–August) and reaching a minimum in winter (November–January). Figure 9 shows the monthly NH3 time series observed by satellites and FTIR at different local overpass times. GIIRS and IASI show closely matched NH3 peaks in June. The systematic overestimation of peak values by GIIRS relative to CrIS and FTIR is consistent with an inherent data bias as shown in Fig. 8.
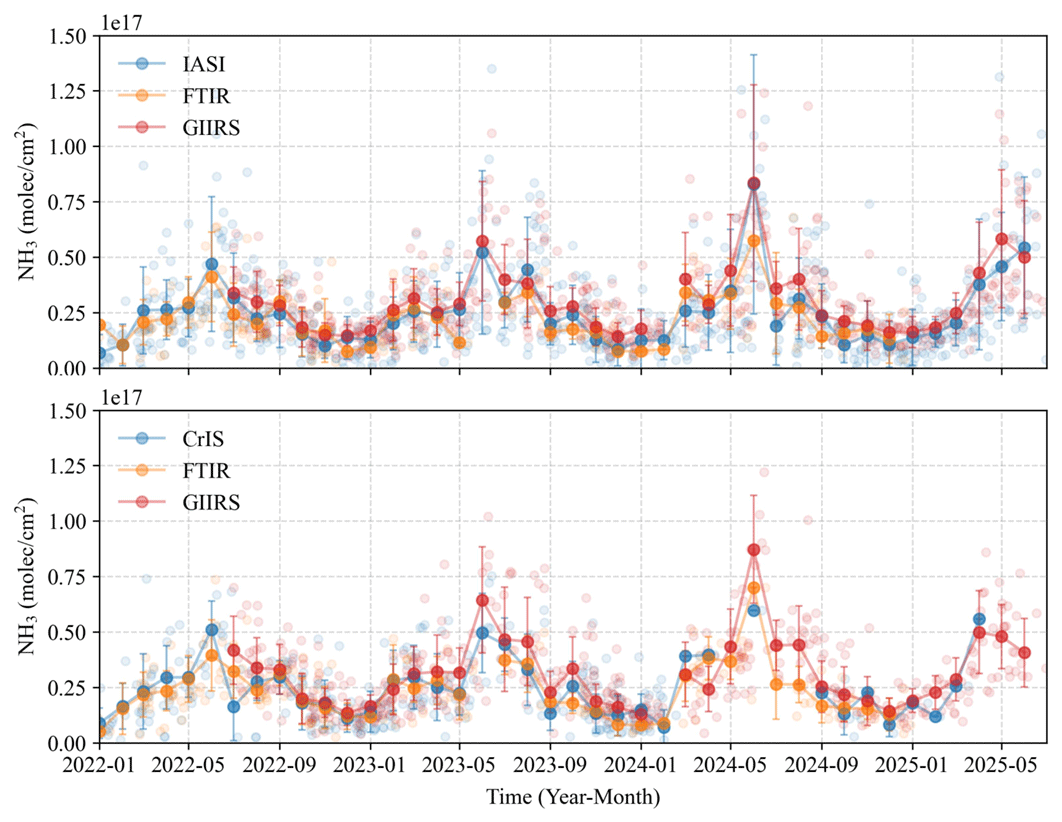
Figure 9Time series of monthly NH3 columns at the Hefei station from satellite-based and ground-based observations, corresponding to different local overpass times of polar-orbiting satellites for morning (∼ 09:30 LST) and afternoon (∼ 13:30 LST). The light-colored, semi-transparent points represent daily mean values at different local times.
Notably, GIIRS-derived NH3 columns in June 2024 were significantly higher than those in the same month of 2023 and 2025, with increases of 1.46 and 1.67 times during morning overpass time (∼ 09:30 LST), and 1.35 and 2.15 times during afternoon overpass time (∼ 13:30 LST), respectively. Such pronounced variability is likely linked to extreme weather events reported in the region, such as persistent heatwaves and abrupt drought-flood transitions (Zhou et al., 2025; Ding et al., 2024). Morning observations from IASI align with GIIRS data, showing that NH3 concentrations in June 2024 reached 1.43 to 2.62 times the levels recorded in the years 2017–2025 (specifically, 1.59 and 1.53 times those of 2023 and 2025, respectively). Similar interannual changes were observed by CrIS and FTIR in June 2024, with NH3 levels increasing by factors of 1.17–1.53 and 1.40–2.28 compared with previous years, respectively, despite a data gap in June 2023 for FTIR.
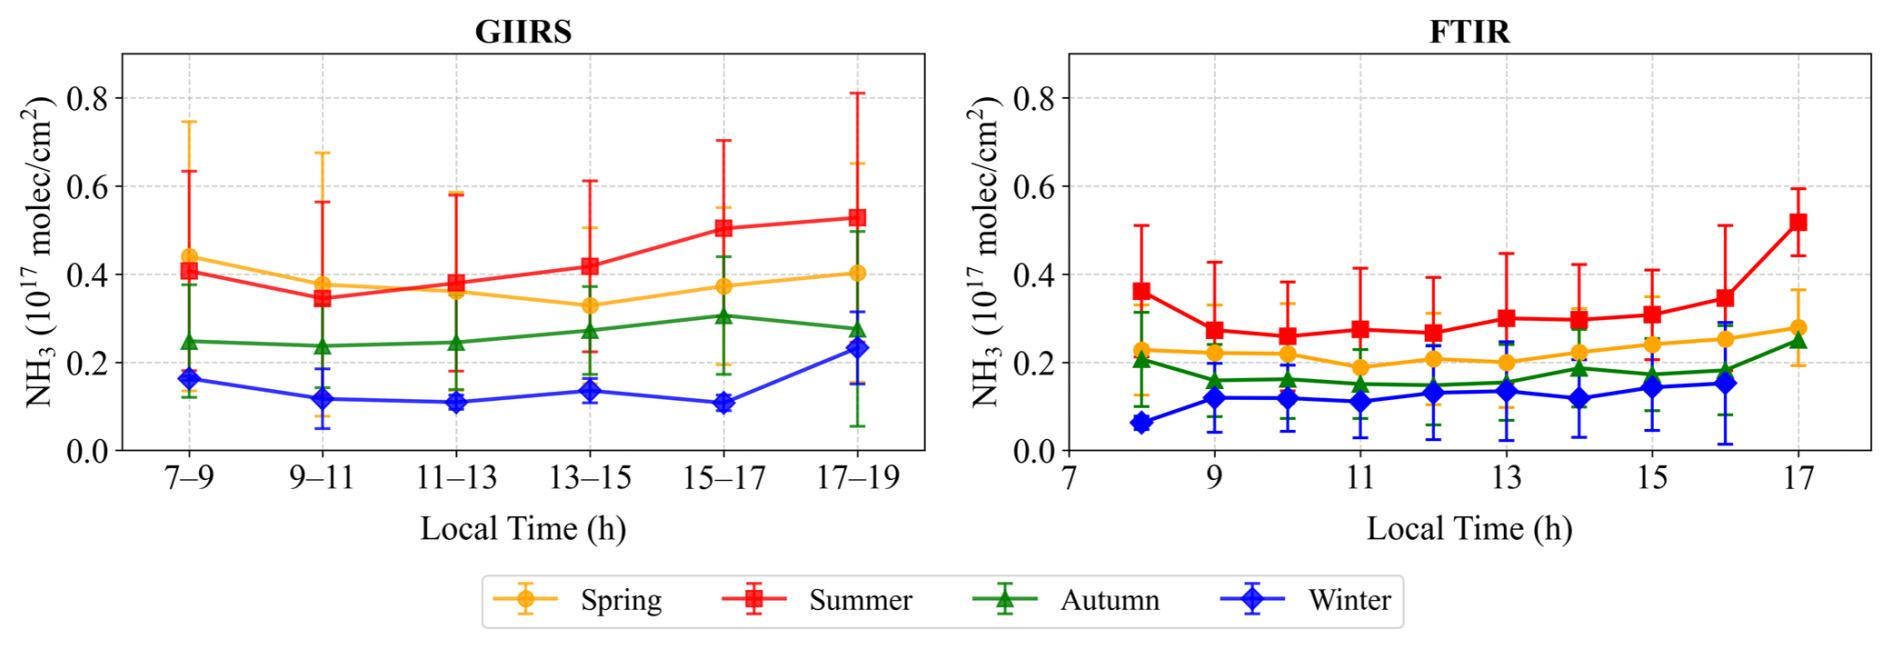
Figure 10Daytime NH3 variations observed by GIIRS and FTIR in different seasons. The seasonal mean NH3 from GIIRS are calculated based on 37 high-quality days in Fig. S14.
When comparing GIIRS-based NH3 columns at different local times, afternoon concentrations are generally higher than those in the morning, with the largest differences observed in summer (July–August) and the smallest in autumn and winter. To more accurately characterize daytime NH3 variations, we further applied strict data filtering criteria by retaining only retrievals with TC>5 K to ensure high sensitivity to near-surface NH3. Over the three-year period, 37 high-quality observation days were identified, each providing six consecutive two-hour interval observations from 07:00 to 19:00 LST (Fig. S14). The maximum diurnal amplitude occurs in summer, reaching over 1.5×10¹⁶ molec cm−2. Except for autumn, all three other seasons exhibit relatively high NH3 concentrations around 07:00 and 17:00 LST, a pattern that aligns well with the diurnal variations reported by Wang et al. (2022) based on FTIR measurements (Fig. 10). However, NH3 retrievals from FTIR lack sufficient valid observations within a single day, making it difficult to consistently capture the intra-day variability in NH3 across different dates.
Moreover, the FTIR station is situated in a transitional zone between urban and suburban areas. A spatial domain with a radius of 0.25° used in this study encompasses GIIRS sampling points from both urban and agricultural regions (Fig. S10). To assess spatial variability of NH3, GIIRS retrievals with TC>5 K within this spatial domain were classified into urban and non-urban categories, and their daytime variations were statistically analyzed across seasons over three years. As shown in Fig. S15, NH3 concentrations in non-urban areas are consistently and significantly higher than those in urban areas during spring and summer, indicating the strong contribution of agricultural activities to ambient NH3 levels. Particularly in spring, statistically significant differences are most pronounced during 07:00–09:00 and 17:00–19:00 LST, corresponding to time windows of fertilizer application and livestock activity. During winter, higher NH3 levels in the morning and late afternoon are mainly observed in urban areas, likely reflecting the impact of traffic emissions. These findings highlight the importance of high-frequency satellite observations for dynamic monitoring of NH3 variations, and the contribution of agricultural activity in shaping the diurnal NH3 variability.
3.3 Daytime NH3 variations in major agricultural regions
We focused on eight major agricultural source areas located in the North China Plain and the Northeast China Plain, the Sichuan Basin, and the Indo-Gangetic Plain, to further investigate daytime variations in NH3 columns. These areas are characterized by high NH3 column concentrations and emissions, generally flat terrain, and a large proportion of irrigated cropland (as shown in Figs. S16 and S17). To ensure sufficient measurement sensitivity to near-surface NH3, only GIIRS observations with TC greater than 5 K were retained, thereby excluding cases with low information content. During autumn and winter, available observations are sparse in the early morning and late afternoon. Here, GIIRS-observed daytime variations of NH3 columns across different seasons (Fig. 11) and the corresponding spatial distributions for each study region (Figs. 12–14 and S18–S20) are presented, with comparisons to anthropogenic NH3 emissions (Fig. S17) and GEOS-CF model simulations (Figs. S21–S24). Despite significant differences between model-simulated and satellite-based NH3 columns, we focused on analyzing the daytime variations and their spatial distributions in representative months of May–June (NH3 peak months) in 2025.
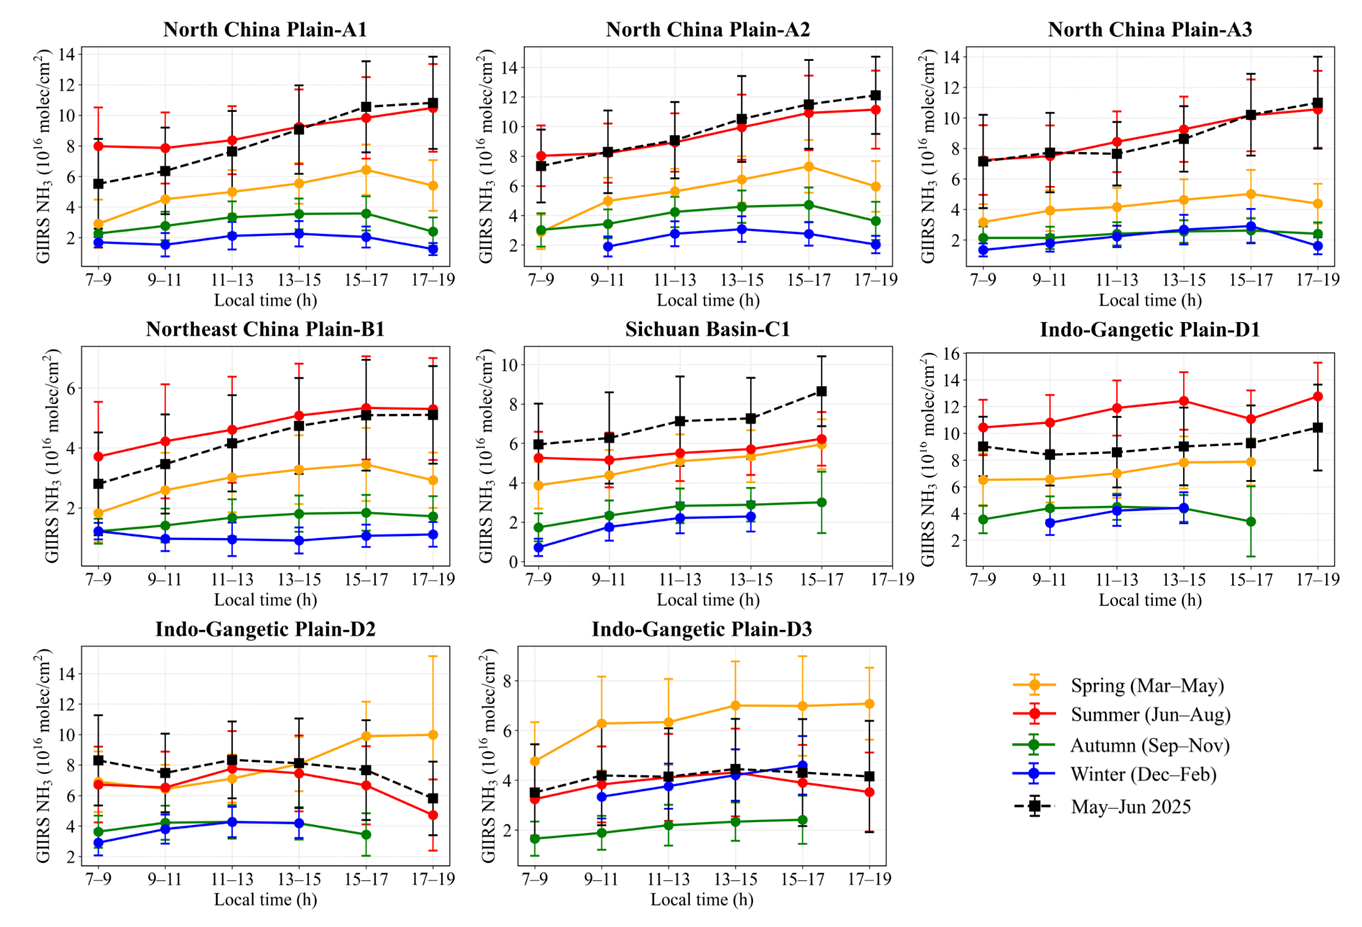
Figure 11Daytime NH3 variations for major agricultural emission areas observed by GIIRS in different seasons.
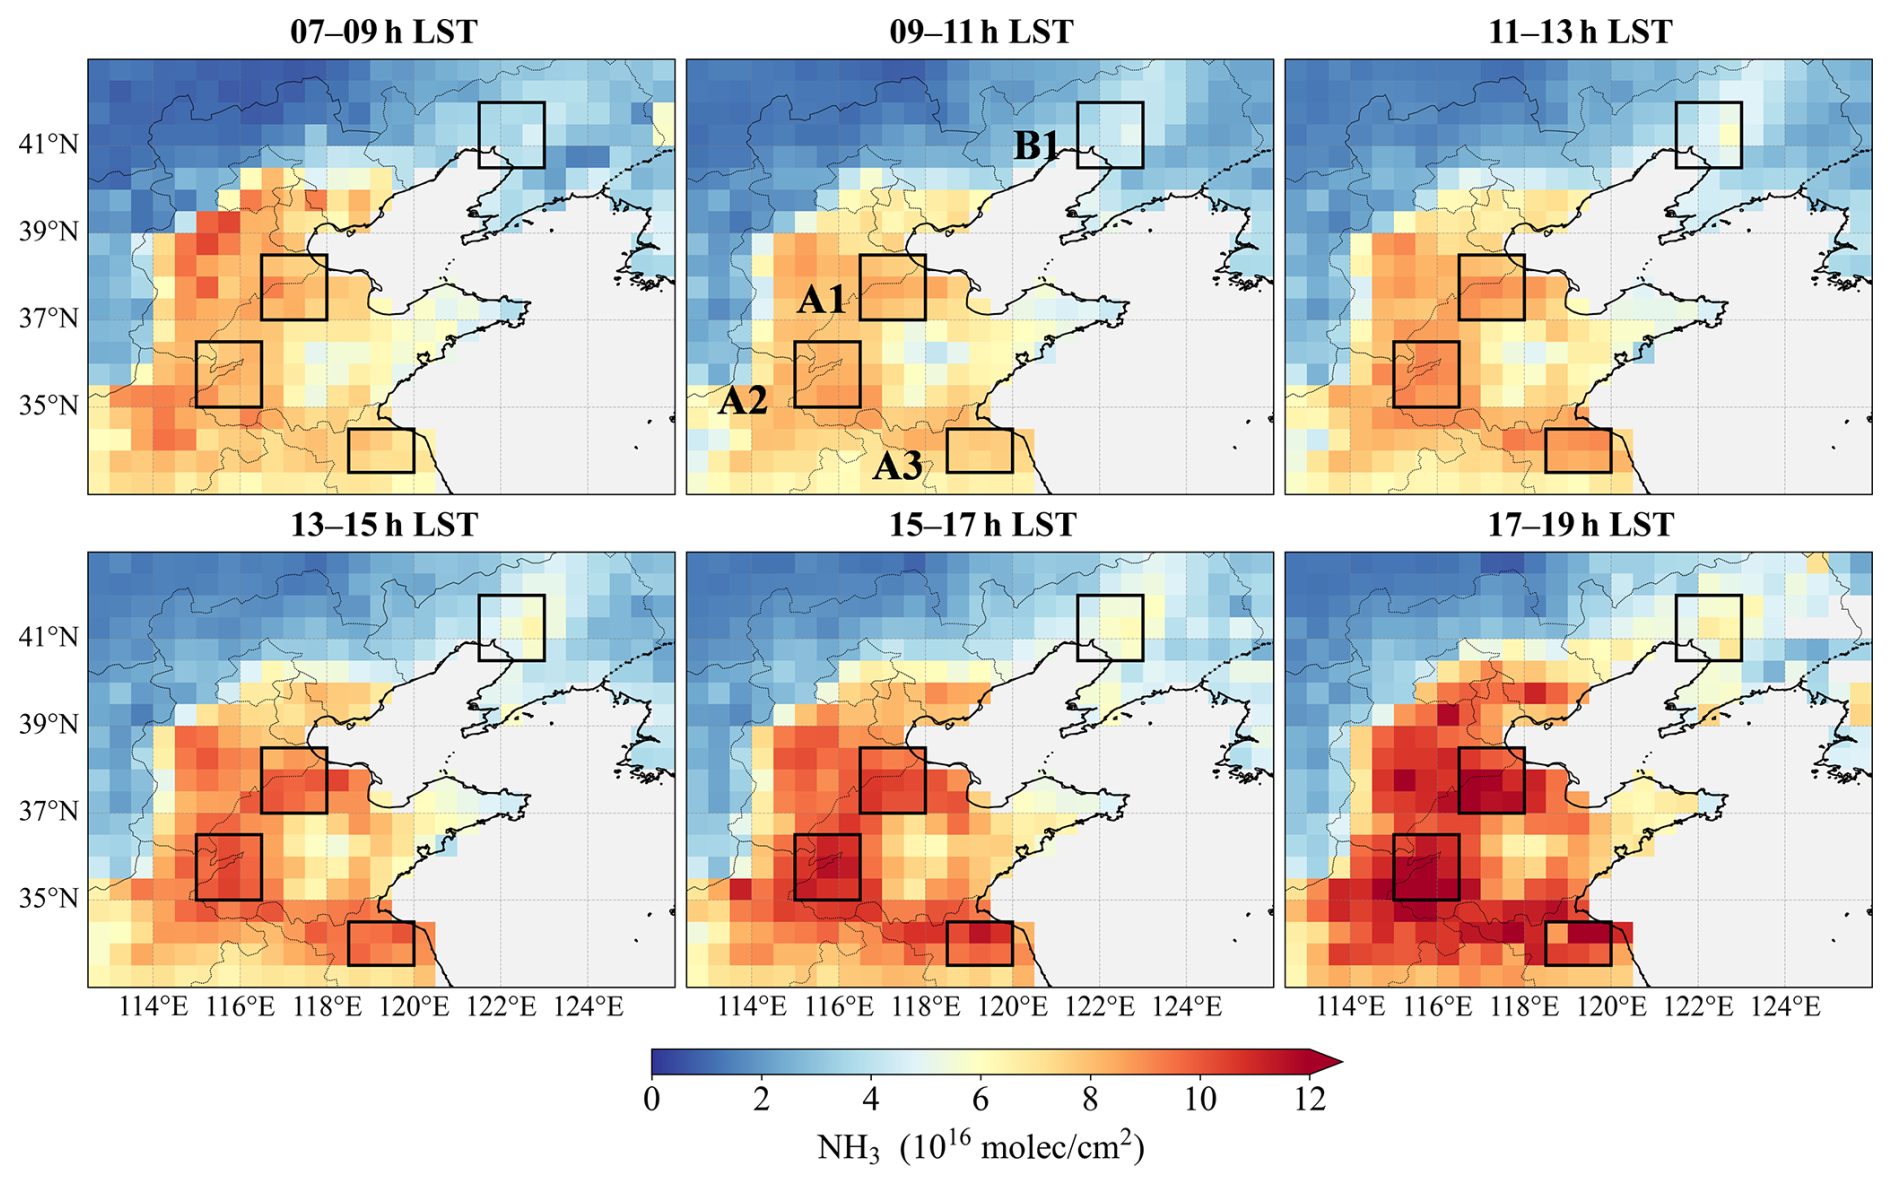
Figure 12Daytime NH3 variations observed by GIIRS in summer from July 2022 to June 2025 in the North-Northeast China Plain.
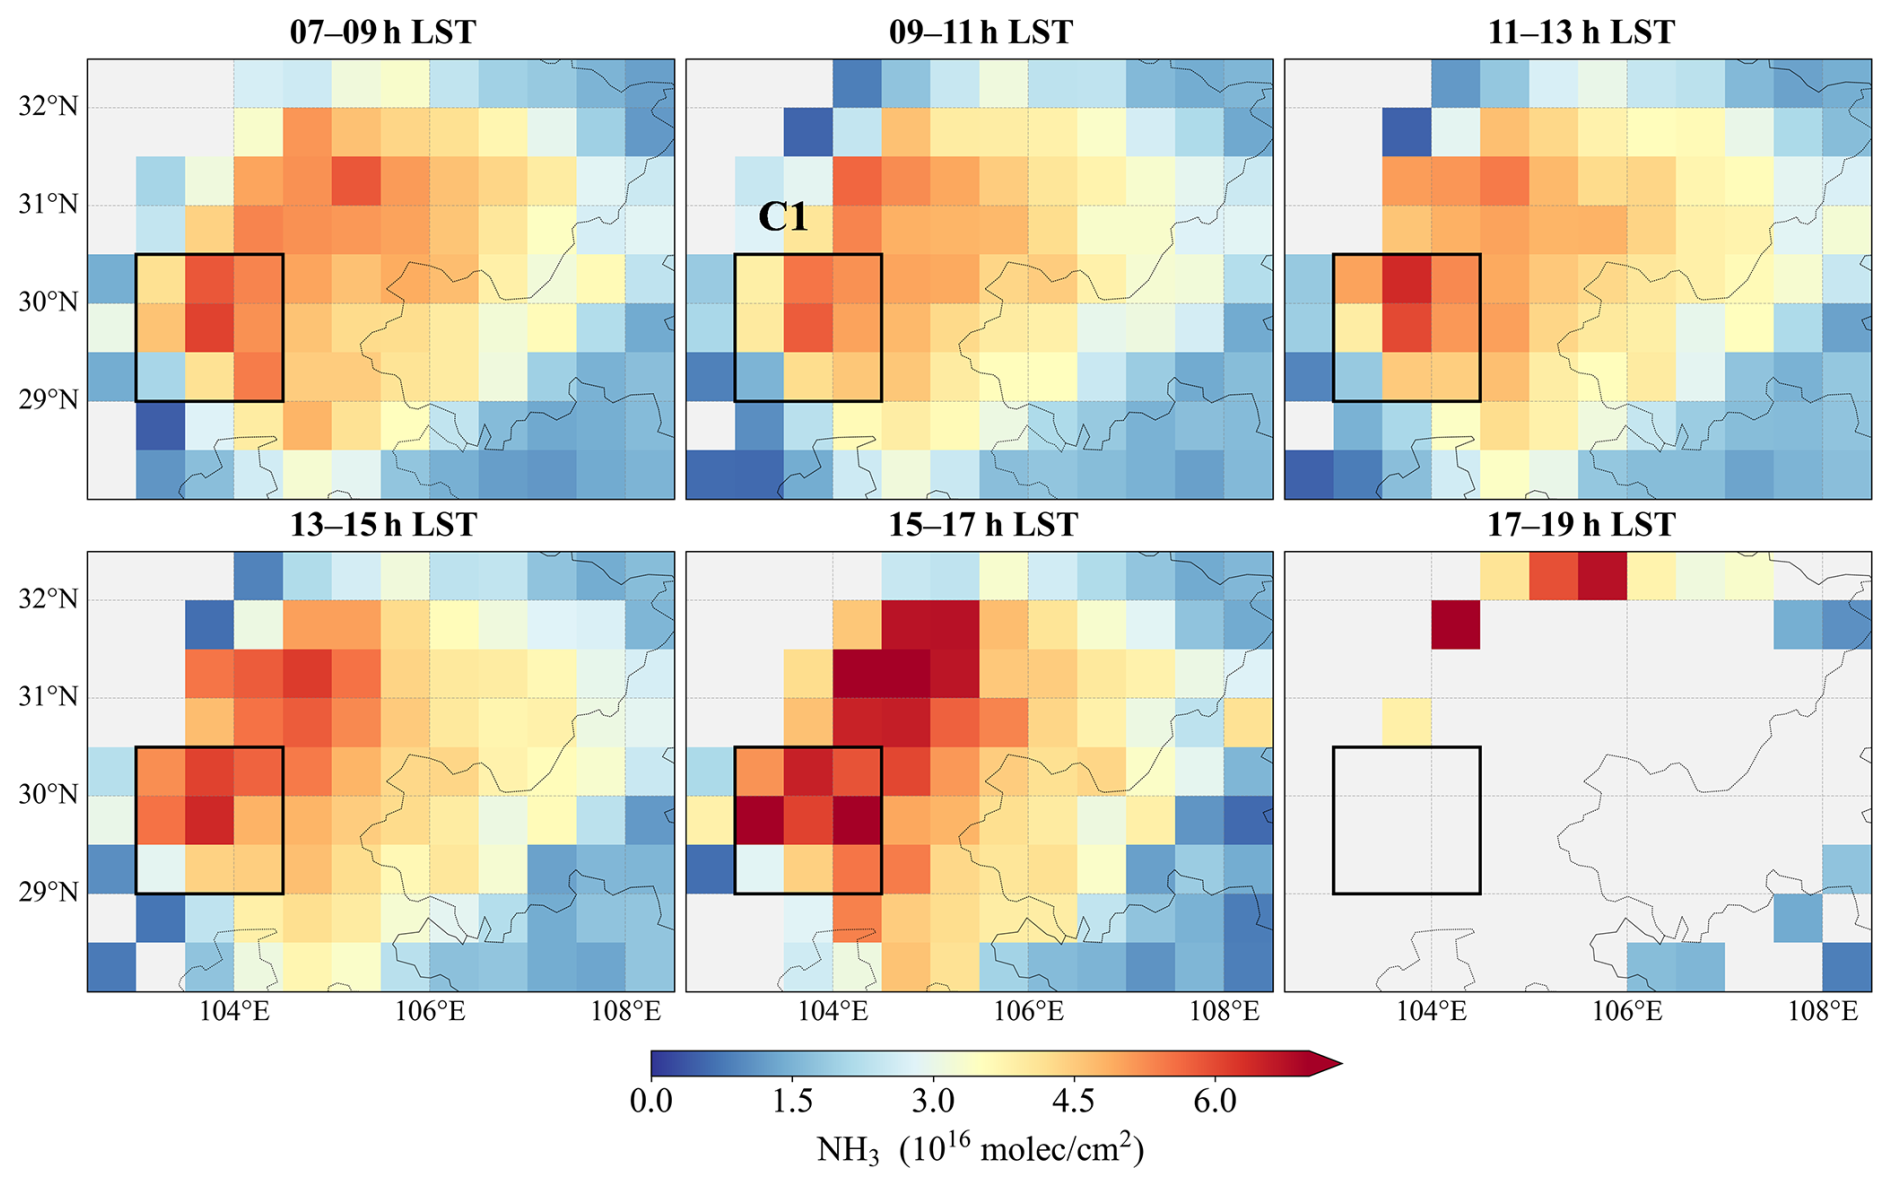
Figure 13Daytime NH3 variations observed by GIIRS in summer from July 2022 to June 2025 in the Sichuan Basin.
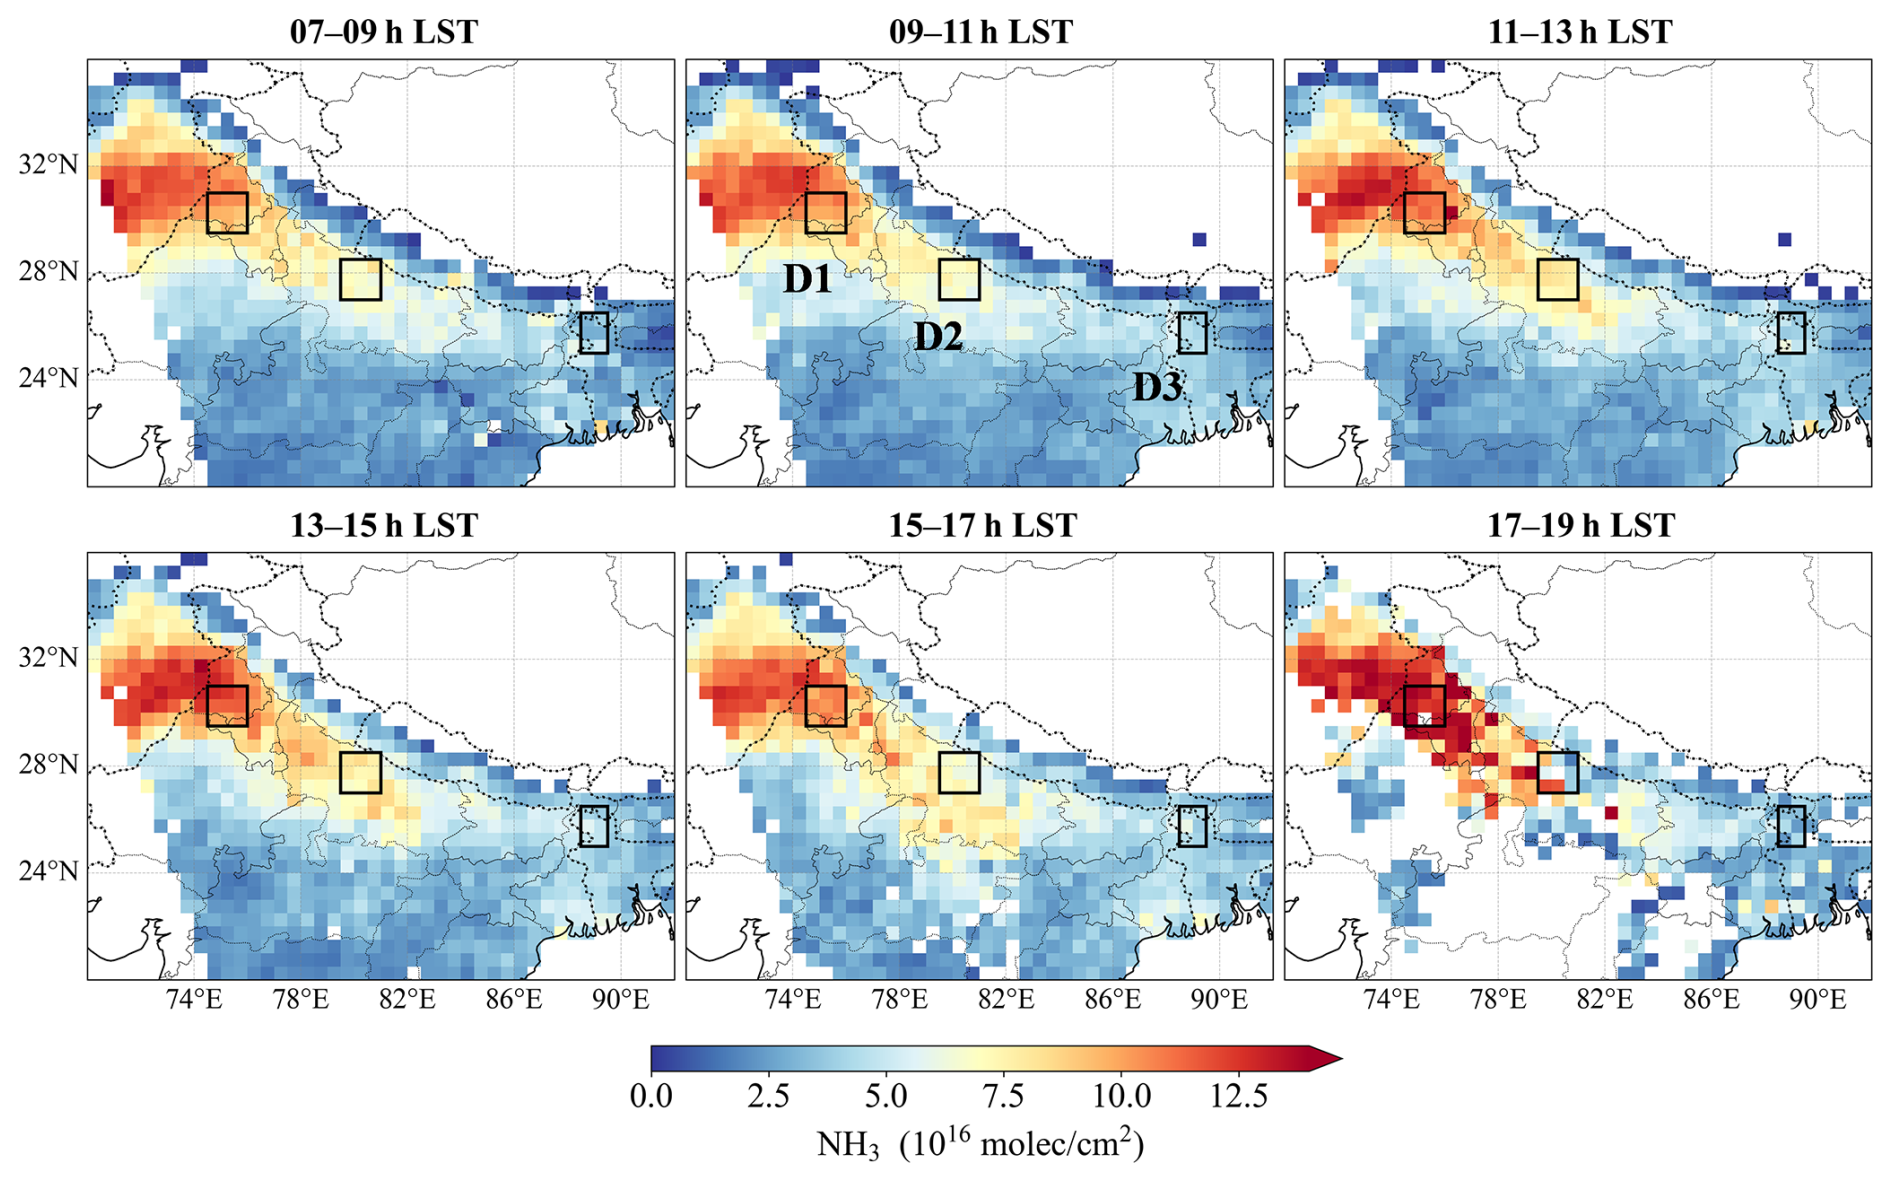
Figure 14Daytime NH3 variations observed by GIIRS in summer from July 2022 to June 2025 in the Indo-Gangetic Gangetic Plain.
The North China Plain is characterized by extensive irrigated croplands with winter wheat-maize rotation and widespread small-scale livestock farming concentrated in east-central provinces, including Henan, Shandong, and Hebei. Due to intensive agricultural and livestock activities, dense industrial emissions and heavy urban traffic, the region ranks among the most polluted regions in China. The spatial distribution of local NH3 high values across different seasons shows considerable variations, especially during the late afternoon in the spring and summer, which may indicate a change in emission hotspots (Figs. 12 and S18). Across the three selected areas (A1–A3), GIIRS observations reveal a consistent temporal pattern of NH3 columns, with values increasing from early morning to late afternoon in summer but generally declining after 15:00 LST in other seasons. In summer, the mean variations in GIIRS NH3 column amplitudes for the afternoon and morning are 22 %, 27 %, and 29 %, respectively, while in May and June 2025, these variations increased to 56 %, 38 %, and 32 %, respectively.
The Northeast China Plain is a key grain production region, particularly for maize, soybeans, and rice. Agriculture is highly mechanized, and livestock farming is carried out on a large scale. Because agricultural emission sources are spatially concentrated and geographically stable, the spatial pattern of NH3 enhancements shows little variation at different local times (Fig. 12). The B1 area is located in the estuarine delta, with large cities such as Shenyang and Anshan to the east. Due to low population density and limited industrial activity, NH3 emissions in this area are primarily associated with fertilizer application and animal husbandry, resulting in relatively lower levels than those in other areas. GIIRS observations show that NH3 columns are at markedly reduced levels, approximately 52 % of those in the North China Plain, but follow a similar diurnal cycle, with the variation amplitude in summer being comparable (25 % for 3 years, 43 % for May–June 2025). The difference is that in winter, the diurnal variation also shows higher NH3 columns in the morning (07:00–09:00 LST), which may be related to traffic emissions and the effects of meteorological conditions (such as temperature and humidity changes) in the early morning. Ground-based studies have reported that the peak atmospheric NH3 concentration typically occurs in the morning, as observed in the urban area of Beijing (Gu et al., 2022) and in the rural areas of Xianghe (He et al., 2020), Xinxiang (Teng et al., 2017), Shanghai (Wang et al., 2015), and Hefei (Wang et al., 2022).
The Sichuan Basin, located in southwestern China, is an important agricultural region encompassing the Chengdu-Chongqing urban agglomeration. Ammonia emissions exhibit a clear east-west gradient, reflecting regional differences in agricultural practices and livestock management (Li et al., 2021; Zhang et al., 2018; Kang et al., 2016). Studies based on IASI observations indicate that NH3 hotspots in the Sichuan Basin are primarily concentrated in the Chengdu Plain, the southern urban clusters, and northwestern Sichuan, where agricultural sources dominate ammonia emissions (Yang et al., 2024; Dammers et al., 2019; Van Damme et al., 2018). GIIRS observations show that NH3 columns are significantly enhanced in the western regions, particularly along the Mianyang-Deyang-Chengdu-Meishan-Leshan corridor (Figs. 7 and 13), which is associated with intensive agricultural activity and urban-industrial emissions. The basin's unique topography and meteorological conditions such as frequent temperature inversions result in very few valid NH3 observations after 17:00 LST. Across different seasons, NH3 columns generally exhibit an increasing trend from morning to afternoon. In spring and summer, seasonal mean NH3 concentrations show relatively small differences because agricultural sources dominate and vertical mixing is enhanced by changes in boundary layer height, with daytime NH3 variations of 27 % and 23 %, respectively. The largest daytime variation occurs in winter, when afternoon values are 1.46 times higher than those in the morning.
The Indo-Gangetic Plain, South Asia's most extensive alluvial plain, spans Pakistan, northern India, and Bangladesh. The region is densely populated and intensively farmed, producing rice, wheat, sugarcane, and vegetables, often under irrigated and mechanized conditions. Fertilizer application, livestock excretion, industrial activities, and high population density lead to significant NH3 and reactive nitrogen emissions, reaching their maximum over the Punjab region in Pakistan. We selected three areas that are located in Punjab, Uttar Pradesh, and Bangladesh, respectively (Fig. 14). Differences in NH3 emission sources and climatic conditions across these regions lead to pronounced seasonal variations in NH3 concentrations. The daytime variation amplitudes of NH3 columns are highest in spring, which are 17 %, 32 %, and 21 % for D1, D2, and D3, respectively. However, under the coupled conditions of abundant precipitation and strong solar radiation in summer, NH3 columns in the D2 and D3 areas reach their peak around 13:00 LST.
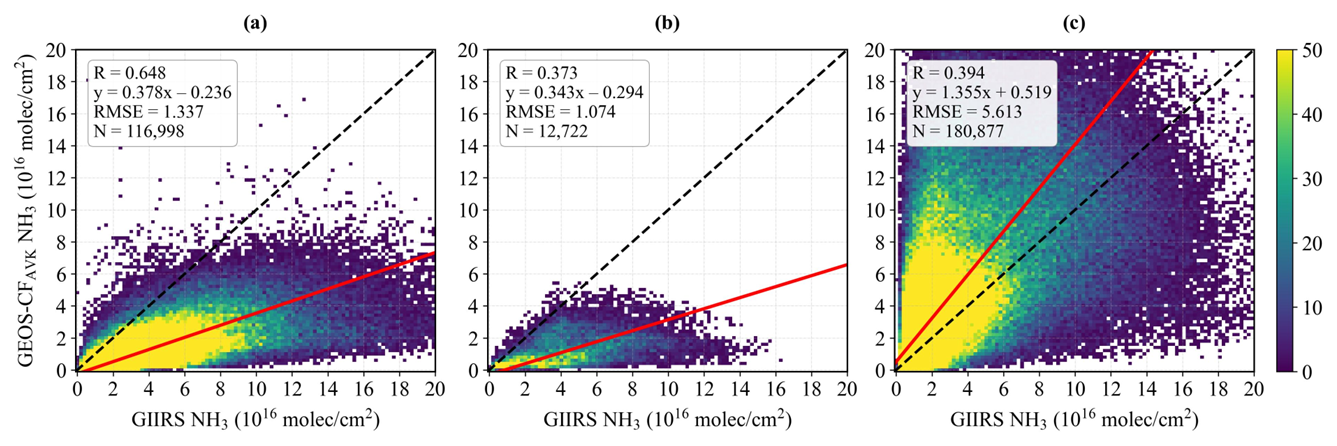
Figure 15Comparison of NH3 columns in May and June 2025 from GIIRS observations and GEOS-CF AVK-smoothed model simulations for (a) the North China Plain and the Northeast China Plain, (b) the Sichuan Basin, and (c) the Indo-Gangetic Plain. The model data is calculated by applying the AVKs from satellite retrievals to NH3 profile (see Sect. S1).
The diurnal variation of atmospheric NH3 column concentrations is primarily influenced by surface emissions, boundary layer dynamics, and gas-particle partitioning associated with meteorological conditions (Lan et al., 2024; Behera et al., 2013). In these main agricultural source areas, NH3 concentrations generally rise from morning to afternoon, driven by diurnal variations in temperature and humidity that shift the gas-particle equilibrium toward the gaseous phase. The daytime NH3 variations simulated by the GEOS-CF model for May–June 2025 range from 7 % to 36 %, slightly lower than the variations observed by GIIRS (10 % to 56 %). However, the GEOS-CF model was unable to accurately reproduce the spatial pattern of NH3 enhancements in the Sichuan Basin, which can be largely attributed to the bottom-up emission inventory and the influence of complex topography and local climatic conditions. After considering the vertical sensitivities of satellite retrievals, the AVK-smoothed model data resulted in an overall reduction of 12 % ± 38 % in the model NH3 columns over the Sichuan Basin. However, considerable discrepancies in the spatial distribution remain relative to the satellite observations. Figure 15 presents a cross-comparison between the satellite-derived NH3 columns and the AVK-smoothed model data in May–June 2025. Over the North-Northeast China Plain, the model underestimates NH3 columns by 62 % on average, with a standard deviation of 45 %, whereas over the Sichuan Basin, the underestimation reaches 65 %, with a standard deviation of 30 %. In contrast, the model generally overestimates NH3 columns over the Indo-Gangetic Plain. Regarding the spatial and temporal patterns of diurnal variations (Figs. S25–S28), the largest discrepancies are observed in the areas of C1 in the Sichuan Basin and D1 in the Indo-Gangetic Plain, suggesting that the model has limited capability to simulate NH3 in these areas and may require improvements through satellite-observed constraints to improve simulation accuracy.
The geostationary satellite observations from FY-4B/GIIRS provide a unique opportunity to monitor the diurnal variations of atmospheric NH3 over East Asia, yet current research on this topic remains limited. In this study, we present a comprehensive analysis of three years of FY-4B/GIIRS observations from July 2022 to June 2025, revealing the spatiotemporal variations of NH3 across East Asia and the distinctive daytime variations in agricultural emission regions.
NH3 column concentrations from GIIRS observations exhibit pronounced local enhancements over major emission regions, particularly in flat agricultural plains (e.g. the North China Plain, the Northeast China Plain, the Indo-Gangetic Plain, the Ningxia Irrigation Plain, the Wei River Plain, the Jianghan Plain, the Mekong Delta in Vietnam, the Chao Phraya River Plain in Thailand) with intensive crop cultivation and animal husbandry, as well as smaller-scale accumulation in topographically confined areas such as valleys and basins (e.g. the Sichuan Basin, oasis agriculture in the arid regions of Xinjiang in China, the Fergana Valley in Uzbekistan). After removing background levels derived from predefined reference regions, NH3 enhancements show a consistent spatial pattern with anthropogenic emissions from the bottom-up MIX Asia emission inventory, and highlight these major emission source regions. The spatial distribution of NH3 derived from GIIRS agrees well with polar-orbiting satellite observations from IASI and CrIS.
The timing of peak NH3 in the seasonal cycle primarily reflects agricultural activities related to fertilizer application and is modulated by climatic factors such as temperature. For example, NH3 columns generally exhibit a summer maximum (June–July) and a secondary spring maximum (April) in the North China Plain and Northeast China Plain. In southern regions of China, India, and Southeast Asia, NH3 peaks during the late dry season (March–May) and declines sharply in the early wet season (June–July). Overall, regional differences in the timing of peak months follow a north-south gradient. Comparison with ground-based FTIR measurements and satellite-based IASI and CrIS observations show generally good agreement, yielding a correlation coefficient of 0.77 and an RMSE of 9.67×10¹⁵ molec cm−2 relative to FTIR, while also consistently capturing the temporal variability of NH3 columns.
This study reports the detailed daytime variations of NH3 columns observed by FY-4B/GIIRS over the North China Plain, the Northeast China Plain, the Sichuan Basin, Hefei, and the Indo-Gangetic Plain. The NH3 columns during the day generally increase from early morning to late afternoon, showing similar temporal variations to those observed by ground-based FTIR measurements at Hefei and simulated by GEOS-CF model in the main agricultural source areas. Crucially, GIIRS provides substantial advantages by accurately characterizing spatial distributions and enabling continuous daily observations. GIIRS in the infrared is complementary to the Geostationary Environment Monitoring Spectrometer (GEMS; Kim et al., 2020), which operates in the ultraviolet/visible (UV/VIS) spectral range and provides hourly observations of trace gases such as NO2 and SO2 over East Asia. The synergy between GIIRS and GEMS enables joint investigations of NH3 and NO2, offering new opportunities to better quantify reactive nitrogen budgets and assess their impacts on air quality and climate. The upgraded FY-4C/GIIRS was launched in December 2025, further enhancing the FY-4 geostationary observational capabilities. Compared to its predecessor FY-4B/GIIRS, which provides a spatial resolution of 12 km and a temporal resolution of 2 h, FY-4C/GIIRS achieves a significant improvement to 8 km and 1 h, respectively. This emerging satellite constellation will offer unprecedented opportunities for seamless hourly coverage to monitor diurnal cycles and emission processes across East and South Asia, thereby improving our understanding of atmospheric chemistry and supporting the development of more effective air pollution mitigation strategies.
In the profile-scaling optimal estimation framework, the column AVK (unitless) represents the change in the retrieved total NH3 column (molec cm−2) with respect to a perturbation of the partial NH3 column (molec cm−2) at a given atmospheric layer. For example, if the true NH3 partial column in the first layer near the surface increases by 1.0×10¹⁶ molec cm−2, whereas the retrieval algorithm only detects an increase of 0.4×10¹⁶ molec cm−2 in the final retrieved total column, the resulting column AVK for the first layer is 0.4. A value of 1.0 would imply perfect sensitivity to that layer. As a hyperspectral sounder has varying sensitivities to different altitudes and the spectral signatures of NH3 molecules vary at different altitudes, the retrieved total column is not uniformly sensitive to NH3 molecules at all heights. The one-dimensional column AVK thus provides a crucial diagnostic metric to understand where the retrieved column information is originating. This definition of column AVK is conceptually similar to that from TCCON (Wunch et al., 2011) and IASI (Clarisse et al., 2023). By contrast, the conventional matrix AVK from optimal estimation quantifies how much information is retrieved from the measurement (Shephard et al., 2011, 2015), and the sum of each row of AVK provides an estimate of the fraction of retrieval information contributed by the measurement rather than the a priori at the corresponding altitude. When the information content of the measurement is high or the retrieval loosely constrained, the AVK values approach the unit matrix. Conversely, when the information content is low or the retrieval is heavily constrained, the AVK values tend toward zero and the solution remain close to the a priori. A detailed discussion on the difference between column AVK and matrix AVK can be referred to Clarisse et al. (2023).
The column AVK is calculated following the formalism of the full matrix AVK from optimal estimation, which is expressed as:
where KGasProf is the layer-resolved NH3 Jacobian quantifying the sensitivity of radiance to layer-specific NH3 partial column perturbations. KGasProf is calculated using the radiative transfer model for each retrieval. The gain matrix G is given by:
where Kcol is the total-column NH3 Jacobian quantifying the sensitivity of radiance to total NH3 column, Sε and Sa are the noise covariance matrix for the measured radiances and the a priori covariance matrix for the retrieval.
To verify the analytical column AVK calculated from Eq. (A1), observation simulation experiments were conducted to calculate the corresponding numerical column AVK for comparison. An observation over the North China Plain (41.97° N, 122.50° E) on 15 July 2025 was selected, with a surface pressure of 1002.65 hPa, surface temperature of 302.49 K, and lowest-layer air temperature of 297.46 K. The “true” NH3 profile was generated by scaling the a priori profile from Zeng et al. (2023a) by a factor of 10 (approximate total column: 9.49×10¹⁶ molec cm−2), which was also used as the a priori profile for all retrievals. We first simulated the “true” radiance spectrum from the “true” profile, added Gaussian random noise, and ran the retrieval algorithm 100 times to obtain the mean retrieved total column, which is close to the true total column. The analytical column AVK solution from this observation was then derived using Eqs. (A1) and (A2). Subsequently, we performed a layer-wise perturbation test to derive the numerical column AVK. A fixed NH3 perturbation of 1×10¹⁶ molec cm−2 was individually added to each of the 12 retrieval layers of the “true” profile, while keeping all other layers unchanged. For each perturbed layer, the noise-added retrieval was repeated 100 times to obtain the mean retrieved total column. The numerical column AVK was then calculated as the ratio of the retrieved total column change to the imposed “true” column increment (1×10¹⁶ molec cm−2). Figure A1 compares the analytical and numerical AVKs, showing good agreement between the two sets, thereby justifying the calculation of column AVK using Eqs. (A1) and (A2).
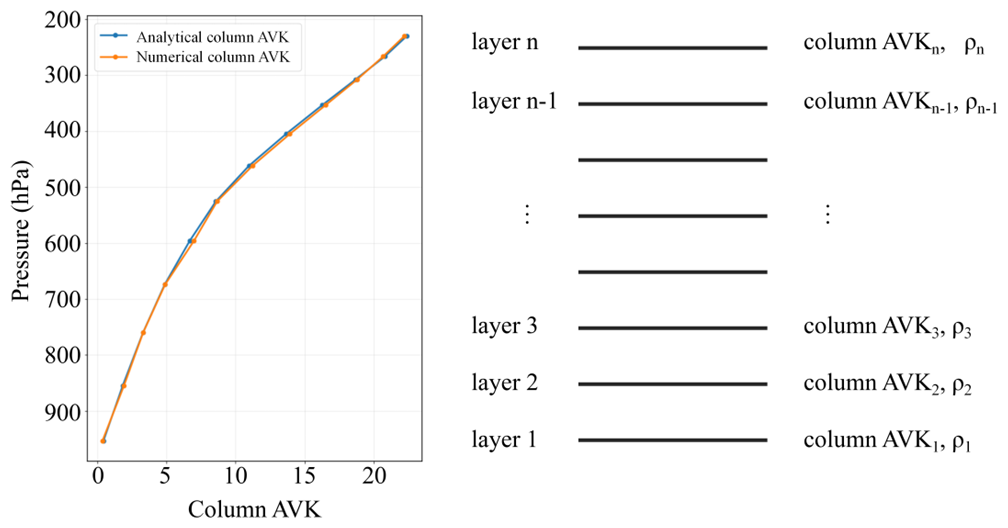
Figure A1Comparison of the analytical and numerical column AVKs for a case over the North China Plain on 15 July 2024 (left panel). Schematic of the retrieval vertical layers from the surface to 200 hPa (right panel), consisting of n pressure levels (typically n=11 or 12), with the layer-dependent column AVK values (column AVKi) and the air density (ρi) of NH3 at each layer.
The GIIRS NH3 data (July 2022 to June 2025) used in this study is publicly available on Zenodo (https://doi.org/10.5281/zenodo.17193848, Zeng, 2025). Further updates on the data will be provided on the project website (https://fengyunair.github.io/, last access: 16 November 2025). The IASI L2 ammonia satellite observations are available from the AERIS data infrastructure (https://iasi.aeris-data.fr/, last access: 16 September 2025). The CrIS Fast Physical Retrieval (CFPR) ammonia dataset is created by the Environment and Climate Change Canada is publicly available (https://hpfx.collab.science.gc.ca/~mas001/satellite_ext/cris/, last access: 9 November 2025). The Hefei FTIR data are retrieved by Key Laboratory of Environmental Optics and Technology, Anhui Institute of Optics and Fine Mechanics, Chinese Academy of Sciences (Wang et al., 2022). The MIX emission inventory can be requested from the MEIC team (http://meicmodel.org.cn/?page_id=2721, last access: 9 November 2025). The GEOS-CF model data are available from High Performance Computing for Science, NASA Center for Climate Simulation (https://portal.nccs.nasa.gov/datashare/gmao/geos-cf/v1/das/Y2025/, last access: 10 August 2025).
The supplement related to this article is available online at https://doi.org/10.5194/acp-26-7803-2026-supplement.
MS and ZCZ designed the study. MS carried out the result analysis and prepared the manuscript. ZCZ and JH developed the GIIRS NH3 retrieval algorithm. MS, RZ, SH, and SL collected and analyzed the emission sets. WW provided the FTIR data. RD, LZ, HC, ZC, and YG provided guidance on interpreting the satellite data and model simulations. ML provided guidance on analyzing emission inventory. NG, LC, MVD, and CC provided the IASI data and guided the interpretation. MWS provided the CrIS data and guidance. LL, CQ, FL, and CH provided guidance on analyzing GIIRS spectra. All authors reviewed and proofread the paper. LC is a senior research associate supported by the Belgian F.R.S.-FNRS.
The contact author has declared that none of the authors has any competing interests.
Publisher's note: Copernicus Publications remains neutral with regard to jurisdictional claims made in the text, published maps, institutional affiliations, or any other geographical representation in this paper. The authors bear the ultimate responsibility for providing appropriate place names. Views expressed in the text are those of the authors and do not necessarily reflect the views of the publisher.
We acknowledge FY-4B/GIIRS L1 spectral data provided by the National Satellite Meteorological Center (NSMC) of the China Meteorological Administration (CMA). We are grateful to the AERIS data infrastructure for providing access to the IASI NH3 data. We thank the ECCC for making the CrIS NH3 data publicly available. We also acknowledge the MEIC team for sharing the NH3 emission dataset from MIX inventory and the NASA Center for Climate Simulation (NCCS) for sharing NH3 data from GEOS-CF model simulations, and the ECMWF for sharing ERA-5 reanalysis data. This study was supported by the High-Performance Computing Platform of Peking University.
This study was supported by the National Natural Science Foundation of China (grant no. 42275142), the China Postdoctoral Foundation (grant no. 2025M770242) and the National Key R&D Program of China (grant nos. 2026YFE0102400 and 2022YFA1003800).
This paper was edited by Carl Percival and reviewed by two anonymous referees.
Beer, R., Shephard, M. W., Kulawik, S. S., Clough, S. A., Eldering, A., Bowman, K. W., Sander, S. P., Fisher, B. M., Payne, V. H., Luo, M., Osterman, G. B., and Worden, J. R.: First satellite observations of lower tropospheric ammonia and methanol, Geophys. Res. Lett., 35, L09801, https://doi.org/10.1029/2008GL033642, 2008.
Behera, S. N., Sharma, M., Aneja, V. P., and Balasubramanian, R.: Ammonia in the atmosphere: a review on emission sources, atmospheric chemistry and deposition on terrestrial bodies, Environ. Sci. Pollut. R., 20, 8092–8131, https://doi.org/10.1007/s11356-013-2051-9, 2013.
Bobbink, R., Hicks, K., Galloway, J., Spranger, T., Alkemade, R., Ashmore, M., Bustamante, M., Cinderby, S., Davidson, E., Dentener, F., Emmett, B., Erisman, J.-W., Fenn, M., Gilliam, F., Nordin, A., Pardo, L., and De Vries, W.: Global assessment of nitrogen deposition effects on terrestrial plant diversity: A synthesis, Ecol. Appl., 20, 30–59, https://doi.org/10.1890/08-1140.1, 2010.
Cao, H., Henze, D. K., Shephard, M. W., Dammers, E., Cady-Pereira, K. E., Alvarado, M., Lonsdale, C., Luo, G., Yu, F., Zhu, L., Danielson, C. G., and Edgerton, E. S.: Inverse modeling of NH3 sources using CrIS remote sensing measurements, Environ. Res. Lett., 15, 104082, https://doi.org/10.1088/1748-9326/abb5cc, 2020.
Cao, H., Henze, D. K., Zhu, L., Shephard, M. W., Cady-Pereira, K., Dammers, E., and Capps, S. L.: 4D-Var inversion of European NH3 emissions using CrIS NH3 measurements and GEOS-Chem adjoint with bi-directional and uni-directional flux schemes, J. Geophys. Res.-Atmos., 127, e2021JD035687, https://doi.org/10.1029/2021JD035687, 2022.
Chang, Y., Zou, Z., Zhang, Y., Deng, C., Hu, J., Shi, Z., Dore, A. J., and Collett Jr., J. L.: Assessing contributions of agricultural and nonagricultural emissions to atmospheric ammonia in a Chinese megacity, Environ. Sci. Technol., 53, 1822–1833, https://doi.org/10.1021/acs.est.8b05984, 2019.
Chang, Y., Zhang, Y.-L., Kawichai, S., Wang, Q., Van Damme, M., Clarisse, L., Prapamontol, T., and Lehmann, M. F.: Convergent evidence for the pervasive but limited contribution of biomass burning to atmospheric ammonia in peninsular Southeast Asia, Atmos. Chem. Phys., 21, 7187–7198, https://doi.org/10.5194/acp-21-7187-2021, 2021.
Chen, F., Lao, Q., Li, Z., Chen, C., Zhou, X., and Zhang, S.: Monthly variations in the nitrogen isotope of ammonium in wet deposition in a tropical city of South China, Aerosol Air Qual. Res., 20, 1062–1069, https://doi.org/10.4209/aaqr.2019.06.0303, 2020.
Chen, J., Du, X., Liu, X., Xu, W., and Krol, M.: Estimation of ammonia emissions over China using IASI satellite-derived surface observations, Environ. Sci. Technol., 59, 9991–10000, https://doi.org/10.1021/acs.est.4c10878, 2025.
Chen, Y., Shen, H., Kaiser, J., Hu, Y., Capps, S. L., Zhao, S., Hakami, A., Shih, J.-S., Pavur, G. K., Turner, M. D., Henze, D. K., Resler, J., Nenes, A., Napelenok, S. L., Bash, J. O., Fahey, K. M., Carmichael, G. R., Chai, T., Clarisse, L., Coheur, P.-F., Van Damme, M., and Russell, A. G.: High-resolution hybrid inversion of IASI ammonia columns to constrain US ammonia emissions using the CMAQ adjoint model, Atmos. Chem. Phys., 21, 2067–2082, https://doi.org/10.5194/acp-21-2067-2021, 2021.
Clarisse, L., Clerbaux, C., Dentener, F., Hurtmans, D., and Coheur, P.-F.: Global ammonia distribution derived from infrared satellite observations, Nat. Geosci., 2, 479–483, https://doi.org/10.1038/ngeo551, 2009.
Clarisse, L., Shephard, M., Dentener, F., Hurtmans, D., Cady-Pereira, K., Karagulian, F., Van Damme, M., Clerbaux, C., and Coheur, P.-F.: Satellite monitoring of ammonia: A case study of the San Joaquin Valley, J. Geophys. Res., 115, D13302, https://doi.org/10.1029/2009JD013291, 2010.
Clarisse, L., Van Damme, M., Clerbaux, C., and Coheur, P.-F.: Tracking down global NH3 point sources with wind-adjusted superresolution, Atmos. Meas. Tech., 12, 5457–5473, https://doi.org/10.5194/amt-12-5457-2019, 2019.
Clarisse, L., Van Damme, M., Hurtmans, D., Franco, B., Clerbaux, C., and Coheur, P.-F.: The diel cycle of NH3 observed from the FY-4A Geostationary Interferometric Infrared Sounder (GIIRS), Geophys. Res. Lett., 48, e2021GL093010, https://doi.org/10.1029/2021GL093010, 2021.
Clarisse, L., Franco, B., Van Damme, M., Di Gioacchino, T., Hadji-Lazaro, J., Whitburn, S., Noppen, L., Hurtmans, D., Clerbaux, C., and Coheur, P.: The IASI NH3 version 4 product: averaging kernels and improved consistency, Atmos. Meas. Tech., 16, 5009–5028, https://doi.org/10.5194/amt-16-5009-2023, 2023.
Clerbaux, C., Boynard, A., Clarisse, L., George, M., Hadji-Lazaro, J., Herbin, H., Hurtmans, D., Pommier, M., Razavi, A., Turquety, S., Wespes, C., and Coheur, P.-F.: Monitoring of atmospheric composition using the thermal infrared IASI/MetOp sounder, Atmos. Chem. Phys., 9, 6041–6054, https://doi.org/10.5194/acp-9-6041-2009, 2009.
Dammers, E., Schaap, M., Haaima, M., Palm, M., Wichink Kruit, R. J., van Zanten, M. C., and Erisman, J. W.: Measuring atmospheric ammonia with remote sensing campaign: Part 1 – characterisation of vertical ammonia concentration profile in the centre of the Netherlands, Atmos. Environ., 169, 97–112, https://doi.org/10.1016/j.atmosenv.2017.08.067, 2017a.
Dammers, E., Shephard, M. W., Palm, M., Cady-Pereira, K., Capps, S., Lutsch, E., Strong, K., Hannigan, J. W., Ortega, I., Toon, G. C., Stremme, W., Grutter, M., Jones, N., Smale, D., Siemons, J., Hrpcek, K., Tremblay, D., Schaap, M., Notholt, J., and Erisman, J. W.: Validation of the CrIS fast physical NH3 retrieval with ground-based FTIR, Atmos. Meas. Tech., 10, 2645–2667, https://doi.org/10.5194/amt-10-2645-2017, 2017b.
Dammers, E., McLinden, C. A., Griffin, D., Shephard, M. W., Van Der Graaf, S., Lutsch, E., Schaap, M., Gainairu-Matz, Y., Fioletov, V., Van Damme, M., Whitburn, S., Clarisse, L., Cady-Pereira, K., Clerbaux, C., Coheur, P. F., and Erisman, J. W.: NH3 emissions from large point sources derived from CrIS and IASI satellite observations, Atmos. Chem. Phys., 19, 12261–12293, https://doi.org/10.5194/acp-19-12261-2019, 2019.
Ding, Y., Ren, G., Li, Q., Sun, X., and Zhou, B.: High-impact extreme weather and climate events in China: summer 2024 overview, Adv. Atmos. Sci., 41, 1123–1135, https://doi.org/10.1007/s00376-024-4462-6, 2024.
Gong, C., Tian, H., Liao, H., Pan, N., Pan, S., Ito, A., Jain, A. K., Kou-Giesbrecht, S., Joos, F., Sun, Q., Shi, H., Vuichard, N., Zhu, Q., Peng, C., Maggi, F., Tang, F. H. M., and Zaehle, S.: Global net climate effects of anthropogenic reactive nitrogen, Nature, 632, 557–563, https://doi.org/10.1038/s41586-024-07714-4, 2024.
Gu, M., Pan, Y., Walters, W. W., Sun, Q., Song, L., Fang, Y., and Xue, Y.: Vehicular emissions enhanced ammonia concentrations in winter mornings: insights from diurnal nitrogen isotopic signatures, Environ. Sci. Technol., 56, 1578–1585, https://doi.org/10.1021/acs.est.1c05884, 2022.
Guendouz, N., Viatte, C., Zeng, Z.-C., Boynard, A., Safieddine, S., Standfuss, C., Turquety, S., Van Damme, M., Clarisse, L., Coheur, P., Sheng, M., Armante, R., Prunet, P., and Clerbaux, C.: Monitoring atmospheric ammonia from geostationary orbit: Contributions of GIIRS-B and IRS remote sensors, J. Geophys. Res.-Atmos., 131, e2025JD046139, https://doi.org/10.1029/2025JD046139, 2026.
Guo, X., Clarisse, L., Wang, R., Van Damme, M., Whitburn, S., Coheur, P.-F., Clerbaux, C., Franco, B., Pan, D., Golston, L. M., Wendt, L., Sun, K., Tao, L., Miller, D., Mikoviny, T., Müller, M., Wisthaler, A., Tevlin, A. G., Murphy, J. G., Nowak, J. B., Roscioli, J. R., Volkamer, R., Kille, N., Neuman, J. A., Eilerman, S. J., Crawford, J. H., Yacovitch, T. I., Barrick, J. D., Scarino, A. J., and Zondlo, M. A.: Validation of IASI satellite ammonia observations at the pixel scale using in-situ vertical profiles, J. Geophys. Res.-Atmos., 126, e2020JD033475, https://doi.org/10.1029/2020JD033475, 2021.
He, Y., Pan, Y., Zhang, G., Ji, D., Tian, S., Xu, X., Zhang, R., and Wang, Y.: Tracking ammonia morning peak, sources and transport with 1 Hz measurements at a rural site in North China Plain, Atmos. Environ., 235, 117630, https://doi.org/10.1016/j.atmosenv.2020.117630, 2020.
Hersbach, H., Bell, B., Berrisford, P., Biavati, G., Horányi, A., Muñoz Sabater, J., Nicolas, J., Peubey, C., Radu, R., Rozum, I., Schepers, D., Simmons, A., Soci, C., Dee, D., and Thépaut, J.-N.: ERA5 hourly data on single levels from 1940 to present, Copernicus Climate Change Service (C3S) Climate Data Store (CDS), https://doi.org/10.24381/cds.adbb2d47, 2023.
Holmlund, K., Grandell, J., Schmetz, J., Stuhlmann, R., Bojkov, B., Munro, R., Lekouara, M., Coppens, D., Viticchie, B., August, T., Theodore, B., Watts, P., Dobber, M., Fowler, G., Bojinski, S., Schmid, A., Salonen, K., Tjemkes, S., Aminou, D., and Blythe, P.: Meteosat Third Generation (MTG): Continuation and innovation of observations from geostationary orbit, B. Am. Meteorol. Soc., 102, E990–E1015, https://doi.org/10.1175/BAMS-D-19-0304.1, 2021.
Hou, X. and Yu, X.: An ammonia emissions inventory for agricultural sources in Hefei, China, Atmos. Ocean. Sci. Lett., 13, 260–267, https://doi.org/10.1080/16742834.2020.1747355, 2020.
Hua, J., Zhou, R., Sheng, M., and Zeng, Z.-C.: Global and diurnal variations in tropospheric ammonia observed from a constellation of hyperspectral infrared sounders in three different LEO orbits, EGUsphere [preprint], https://doi.org/10.5194/egusphere-2026-746, 2026.
Huy, D. H., Thanh, L. T., Hien, T. T., Takenaka, N., and Huy, D. H.: Characteristics of ammonia gas and fine particulate ammonium from two distinct urban areas: Osaka, Japan, and Ho Chi Minh City, Vietnam, Environ. Sci. Pollut. R., 24, 8147–8163, https://doi.org/10.1007/s11356-017-8496-5, 2017.
Jang, J.-H., Hong, J., Kim, J. B., Park, S., Hwang, K., Kim, J., Kim, J. Y., Bae, G.-N., Kim, S., and Kim, K. H.: Influence of atmospheric ammonia on secondary inorganic aerosol formation in PM2.5 during spring 2024 in the Hongseong area, Republic of Korea, Atmos. Environ., 358, 121363, https://doi.org/10.1016/j.atmosenv.2025.121363, 2025.
Jongenelen, T., van Zanten, M., Dammers, E., Wichink Kruit, R., Hensen, A., Geers, L., and Erisman, J. W.: Validation and uncertainty quantification of three state-of-the-art ammonia surface exchange schemes using NH3 flux measurements in a dune ecosystem, Atmos. Chem. Phys., 25, 4943–4963, https://doi.org/10.5194/acp-25-4943-2025, 2025.
Kang, Y., Liu, M., Song, Y., Huang, X., Yao, H., Cai, X., Zhang, H., Kang, L., Liu, X., Yan, X., He, H., Zhang, Q., Shao, M., and Zhu, T.: High-resolution ammonia emissions inventories in China from 1980 to 2012, Atmos. Chem. Phys., 16, 2043–2058, https://doi.org/10.5194/acp-16-2043-2016, 2016.
Keller, C.-A., Knowland, K.-E., Duncan, B.-N., Liu, J., Anderson, D.-C., Das, S., Lucchesi, R.-A., Lundgren, E.-W., Nicely, J.-M., Nielsen, E., Ott, L.-E., Saunders, E., Strode, S.-A., Wales, P.-A., Jacob, D.-J., and Pawson, S.: Description of the NASA GEOS composition forecast modeling system GEOS-CF v1.0, J. Adv. Model. Earth Sy., 13, e2020MS002413, https://doi.org/10.1029/2020MS002413, 2021.
Kharol, S. K., Shephard, M. W., McLinden, C. A., Zhang, L., Sioris, C. E., O'Brien, J. M., Hakami, A., Murphy, J. G., van Donkelaar, A., and Martin, R. V.: Dry deposition of reactive nitrogen from satellite observations of ammonia and nitrogen dioxide over North America, Geophys. Res. Lett., 45, 1157–1166, https://doi.org/10.1002/2017GL075832, 2018.
Kim, J., Jeong, U., Ahn, M. H., Kim, J. H., Park, R. J., Lee, H., Song, C. H., Choi, Y. S., Lee, K. H., Yoo, J. M., Jeong, M. J., Park, S. K., Lee, K. M., Song, C. K., Kim, S. W., Kim, Y. J., Kim, S. W., Kim, M., Go, S., Liu, X., Chance, K., Miller, C. C., Al-Saadi, J., Veihelmann, B., Bhartia, P. K., Torres, O., Abad, G. G., Haffner, D. P., Ko, D. H., Lee, S. H., Woo, J. H., Chong, H., Park, S. S., Nicks, D., Choi, W. J., Moon, K. J., Cho, A., Yoon, J., Kim, S. kyun, Hong, H., Lee, K., Lee, H., Lee, S., Choi, M., Veefkind, P., Levelt, P. F., Edwards, D. P., Kang, M., Eo, M., Bak, J., Baek, K., Kwon, H. A., Yang, J., Park, J., Han, K. M., Kim, B. R., Shin, H. W., Choi, H., Lee, E., Chong, J., Cha, Y., Koo, J. H., Irie, H., Hayashida, S., Kasai, Y., Kanaya, Y., Liu, C., Lin, J., Crawford, J. H., Carmichael, G. R., Newchurch, M. J., Lefer, B. L., Herman, J. R., Swap, R. J., Lau, A. K. H., Kurosu, T. P., Jaross, G., Ahlers, B., Dobber, M., McElroy, C. T., and Choi, Y.: New era of air quality monitoring from space: Geostationary environment monitoring spectrometer (GEMS), B. Am. Meteorol. Soc., 101, E1–E22, https://doi.org/10.1175/BAMS-D-18-0013.1, 2020.
Kumar, P., Broquet, G., Hauglustaine, D., Beaudor, M., Clarisse, L., Van Damme, M., Coheur, P., Cozic, A., Zheng, B., Revilla Romero, B., Delavois, A., and Ciais, P.: Global atmospheric inversion of the anthropogenic NH3 emissions over 2019–2022 using the LMDZ-INCA chemistry transport model and the IASI NH3 observations, Atmos. Chem. Phys., 25, 12379–12407, https://doi.org/10.5194/acp-25-12379-2025, 2025.
Lan, Z., Lin, W., and Zhao, G.: Sources, variations, and effects on air quality of atmospheric ammonia, Curr. Pollut. Rep., 10, 40–53, https://doi.org/10.1007/s40726-023-00291-6, 2024.
Li, B., Chen, L., Shen, W., Jin, J., Wang, T., Wang, P., Yang, Y., and Liao, H.: Improved gridded ammonia emission inventory in China, Atmos. Chem. Phys., 21, 15883–15900, https://doi.org/10.5194/acp-21-15883-2021, 2021.
Li, M., Kurokawa, J., Zhang, Q., Woo, J.-H., Morikawa, T., Chatani, S., Lu, Z., Song, Y., Geng, G., Hu, H., Kim, J., Cooper, O. R., and McDonald, B. C.: MIXv2: a long-term mosaic emission inventory for Asia (2010–2017), Atmos. Chem. Phys., 24, 3925–3952, https://doi.org/10.5194/acp-24-3925-2024, 2024.
Li, Z., Sun, K., Guan, K., Wang, S., Peng, B., Clarisse, L., Van Damme, M., Coheur, P.-F., Cady-Pereira, K., Shephard, M. W., Zondlo, M., and Moore, D.: Ammonia emissions and depositions over the contiguous United States derived from IASI and CrIS using the directional derivative approach, Atmos. Chem. Phys., 26, 703–721, https://doi.org/10.5194/acp-26-703-2026, 2026.
Lin, Y.-C., Zhang, Y.-L., Fan, M.-Y., and Bao, M.: Heterogeneous formation of particulate nitrate under ammonium-rich regimes during the high-PM2.5 events in Nanjing, China, Atmos. Chem. Phys., 20, 3999–4011, https://doi.org/10.5194/acp-20-3999-2020, 2020.
Liu, L., Zhang, X., Wong, A. Y. H., Xu, W., Liu, X., Li, Y., Mi, H., Lu, X., Zhao, L., Wang, Z., Wu, X., and Wei, J.: Estimating global surface ammonia concentrations inferred from satellite retrievals, Atmos. Chem. Phys., 19, 12051–12066, https://doi.org/10.5194/acp-19-12051-2019, 2019.
Luo, X., Zhang, M., Ni, Y., and Shen, G.: Mitigation strategies for NH3 and N2O emissions in greenhouse agriculture: Insights into fertilizer management and nitrogen emission mechanisms, Environ. Technol. Innov., 37, 103995, https://doi.org/10.1016/j.eti.2024.103995, 2025.
Luo, Z., Zhang, Y., Chen, W., Van Damme, M., Coheur, P.-F., and Clarisse, L.: Estimating global ammonia (NH3) emissions based on IASI observations from 2008 to 2018, Atmos. Chem. Phys., 22, 10375–10388, https://doi.org/10.5194/acp-22-10375-2022, 2022.
Marais, E. A., Pandey, A. K., Van Damme, M., Clarisse, L., Coheur, P.-F., Shephard, M. W., Cady-Pereira, K. E., Misselbrook, T., Zhu, L., Luo, G., and Yu, F.: UK ammonia emissions estimated with satellite observations and GEOS-Chem, J. Geophys. Res.-Atmos., 126, e2021JD035237, https://doi.org/10.1029/2021JD035237, 2021.
Meng, Z., Xu, X., Lin, W., Ge, B., Xie, Y., Song, B., Jia, S., Zhang, R., Peng, W., Wang, Y., Cheng, H., Yang, W., and Zhao, H.: Role of ambient ammonia in particulate ammonium formation at a rural site in the North China Plain, Atmos. Chem. Phys., 18, 167–184, https://doi.org/10.5194/acp-18-167-2018, 2018.
Meng, Z. Y., Lin, W. L., Jiang, X. M., Yan, P., Wang, Y., Zhang, Y. M., Jia, X. F., and Yu, X. L.: Characteristics of atmospheric ammonia over Beijing, China, Atmos. Chem. Phys., 11, 6139–6151, https://doi.org/10.5194/acp-11-6139-2011, 2011.
Pai, S. J., Heald, C. L., and Murphy, J. G.: Exploring the global importance of atmospheric ammonia oxidation, ACS Earth Space Chem., 5, 1674–1685, https://doi.org/10.1021/acsearthspacechem.1c00021, 2021.
Saraswati, G. M. P., Sharma, S. K., Mandal, T. K., and Kotnala, R. K.: Simultaneous measurements of ambient NH3 and its relationship with other trace gases, PM2.5 and meteorological parameters over Delhi, India, MAPAN, 34, 55–69, https://doi.org/10.1007/s12647-018-0286-0, 2019.
Seinfeld, J. H. and Pandis, S. N.: Atmospheric chemistry and physics: from air pollution to climate change, 3rd edn., Wiley, Hoboken, NJ, 1152 pp., ISBN 978-1-118-94740-1, 2016.
Shephard, M. W. and Cady-Pereira, K. E.: Cross-track Infrared Sounder (CrIS) satellite observations of tropospheric ammonia, Atmos. Meas. Tech., 8, 1323–1336, https://doi.org/10.5194/amt-8-1323-2015, 2015.
Shephard, M. W., Cady-Pereira, K. E., Luo, M., Henze, D. K., Pinder, R. W., Walker, J. T., Rinsland, C. P., Bash, J. O., Zhu, L., Payne, V. H., and Clarisse, L.: TES ammonia retrieval strategy and global observations of the spatial and seasonal variability of ammonia, Atmos. Chem. Phys., 11, 10743–10763, https://doi.org/10.5194/acp-11-10743-2011, 2011.
Shephard, M. W., Dammers, E., Cady-Pereira, K. E., Kharol, S. K., Thompson, J., Gainariu-Matz, Y., Zhang, J., McLinden, C. A., Kovachik, A., Moran, M., Bittman, S., Sioris, C. E., Griffin, D., Alvarado, M. J., Lonsdale, C., Savic-Jovcic, V., and Zheng, Q.: Ammonia measurements from space with the Cross-track Infrared Sounder: characteristics and applications, Atmos. Chem. Phys., 20, 2277–2302, https://doi.org/10.5194/acp-20-2277-2020, 2020.
Shephard, M. W., Kharol, S. K., Dammers, E., Sioris, C. E., Bell, A., Jansen, R., Caron, J., Snel, R., Palombo, E., Cady-Pereira, K. E., McLinden, C. A., Lutsch, E., and Knuteson, R.: Infrared satellite detection limits for monitoring atmospheric ammonia, IEEE J. Sel. Top. Appl., 18, 10271–10291, https://doi.org/10.1109/JSTARS.2025.3557240, 2025.
Teng, X., Hu, Q., Zhang, L., Qi, J., Shi, J., Xie, H., Gao, H., and Yao, X.: Identification of major sources of atmospheric NH3 in an urban environment in northern China during wintertime, Environ. Sci. Technol., 51, 6839–6848, https://doi.org/10.1021/acs.est.7b00328, 2017.
Vadrevu, K. P., Lasko, K., Giglio, L., Schroeder, W., Biswas, S., and Justice, C.: Trends in Vegetation fires in South and Southeast Asian Countries, Sci. Rep.-UK, 9, 7422, https://doi.org/10.1038/s41598-019-43940-x, 2019.
Van Damme, M., Erisman, J. W., Clarisse, L., Dammers, E., Whitburn, S., Clerbaux, C., Dolman, A. J., and Coheur, P.-F.: Worldwide spatiotemporal atmospheric ammonia (NH3) columns variability revealed by satellite, Geophys. Res. Lett., 42, 8660–8668, https://doi.org/10.1002/2015GL065496, 2015.
Van Damme, M., Clarisse, L., Whitburn, S., Hadji-Lazaro, J., Hurtmans, D., Clerbaux, C., and Coheur, P.-F.: Industrial and agricultural ammonia point sources exposed, Nature, 564, 99–103, https://doi.org/10.1038/s41586-018-0747-1, 2018.
Van Damme, M., Clarisse, L., Franco, B., Sutton, M. A., Erisman, J. W., Wichink Kruit, R., van Zanten, M., Whitburn, S., Hadji-Lazaro, J., and Hurtmans, D.: Global, regional and national trends of atmospheric ammonia derived from a decadal (2008–2018) satellite record, Environ. Res. Lett., 16, 055017, https://doi.org/10.1088/1748-9326/abd5e0, 2021.
Wang, S., Nan, J., Shi, C., Fu, Q., Gao, S., Wang, D., Cui, H., Saiz-Lopez, A., and Zhou, B.: Atmospheric ammonia and its impacts on regional air quality over the megacity of Shanghai, China, Sci. Rep.-UK, 5, 15842, https://doi.org/10.1038/srep15842, 2015.
Wang, W., Tian, Y., Liu, C., Sun, Y., Liu, W., Xie, P., Liu, J., Xu, J., Morino, I., Velazco, V. A., Griffith, D. W. T., Notholt, J., and Warneke, T.: Investigating the performance of a greenhouse gas observatory in Hefei, China, Atmos. Meas. Tech., 10, 2627–2643, https://doi.org/10.5194/amt-10-2627-2017, 2017.
Wang, W., Liu, C., Clarisse, L., Van Damme, M., Coheur, P.-F., Xie, Y., Shan, C., Hu, Q., Sun, Y., and Jones, N.: Ground-based measurements of atmospheric NH3 by Fourier transform infrared spectrometry at Hefei and comparisons with IASI data, Atmos. Environ., 287, 119256, https://doi.org/10.1016/j.atmosenv.2022.119256, 2022.
Warner, J. X., Wei, Z., Strow, L. L., Dickerson, R. R., and Nowak, J. B.: The global tropospheric ammonia distribution as seen in the 13-year AIRS measurement record, Atmos. Chem. Phys., 16, 5467–5479, https://doi.org/10.5194/acp-16-5467-2016, 2016.
Whitburn, S., Van Damme, M., Clarisse, L., Bauduin, S., Heald, C. L., Hadji-Lazaro, J., Hurtmans, D., Zondlo, M. A., Clerbaux, C., and Coheur, P.-F.: A flexible and robust neural network IASI-NH3 retrieval algorithm, J. Geophys. Res.-Atmos., 121, 6581–6599, https://doi.org/10.1002/2016JD024828, 2016.
White, E., Shephard, M. W., Cady-Pereira, K. E., Kharol, S., Ford, S., Dammers, E., Chow, E., Thiessen, N., Tobin, D., Quinn, G., O'Brien, J., and Bash, J.: Accounting for non-detects in satellite retrievals: application using CrIS ammonia observations, Remote Sens.-Basel, 15, 2610, https://doi.org/10.3390/rs15102610, 2023.
Wunch, D., Toon, G. C., Blavier, J.-F. L., Washenfelder, R. A., Notholt, J., Connor, B. J., Griffith, D. W. T., Sherlock, V., and Wennberg, P. O.: The Total Carbon Column Observing Network, Philos. T. Roy. Soc. A, 369, 2087–2112, https://doi.org/10.1098/rsta.2010.0240, 2011.
Xu, J., Lu, M., Guo, Y., Zhang, L., Chen, Y., Liu, Z., Zhou, M., Lin, W., Pu, W., Ma, Z., Song, Y., Pan, Y., Liu, L., and Ji, D.: Summertime urban ammonia emissions may be substantially underestimated in Beijing, China, Environ. Sci. Technol., 57, 13124–13135, https://doi.org/10.1021/acs.est.3c05266, 2023.
Yang, J., Zhang, Z., Wei, C., Lu, F., and Guo, Q.: Introducing the new generation of Chinese geostationary weather satellites, Fengyun-4, B. Am. Meteorol. Soc., 98, 1637–1658, https://doi.org/10.1175/BAMS-D-16-0065.1, 2017.
Yang, X., He, J., and Wang, S.: Interannual variability of atmospheric ammonia over the Sichuan Basin, southwestern China: Trend, sources, and implications on particle matter control, Atmos. Res., 299, 107170, https://doi.org/10.1016/j.atmosres.2023.107170, 2024.
Zeng, Z.-C.: FengYun-4B/GIIRS FYGeoAIR NH3 retrievals from July 2022 to June 2025, Zenodo [data set], https://doi.org/10.5281/zenodo.17193848, 2025.
Zeng, Z.-C., Lee, L., Qi, C., Clarisse, L., and Van Damme, M.: Optimal estimation retrieval of tropospheric ammonia from the Geostationary Interferometric Infrared Sounder on board FengYun-4B, Atmos. Meas. Tech., 16, 3693–3713, https://doi.org/10.5194/amt-16-3693-2023, 2023a.
Zeng, Z.-C., Lee, L., and Qi, C.: Diurnal carbon monoxide observed from a geostationary infrared hyperspectral sounder: first result from GIIRS on board FengYun-4B, Atmos. Meas. Tech., 16, 3059–3083, https://doi.org/10.5194/amt-16-3059-2023, 2023b.
Zhang, L., Chen, Y., Zhao, Y., Henze, D. K., Zhu, L., Song, Y., Paulot, F., Liu, X., Pan, Y., Lin, Y., and Huang, B.: Agricultural ammonia emissions in China: reconciling bottom-up and top-down estimates, Atmos. Chem. Phys., 18, 339–355, https://doi.org/10.5194/acp-18-339-2018, 2018.
Zhang, Q., Pan, Y., He, Y., Zhao, Y., Zhu, L., Zhang, X., Xu, X., Ji, D., Gao, J., Tian, S., Gao, W., and Wang, Y.: Bias in ammonia emission inventory and implications on emission control of nitrogen oxides over North China Plain, Atmos. Environ., 214, 116869, https://doi.org/10.1016/j.atmosenv.2019.116869, 2019.
Zhou, X., Li, Y., Xiao, C., Chen, W., Mei, M., and Wang, G.: High-impact extreme weather and climate events in China: summer 2024 overview, Adv. Atmos. Sci., 42, 1064–1076, https://doi.org/10.1007/s00376-024-4462-6, 2025.