the Creative Commons Attribution 4.0 License.
the Creative Commons Attribution 4.0 License.
 | 01 Jun 2026
European HFC emissions evaluated with multiple atmospheric inverse models and UNFCCC national inventories
Hélène De Longueville
Daniela B. Melo
Alison L. Redington
Alice Ramsden
Alexandre Danjou
Peter Andrews
Joseph Pitt
Brendan Murphy
Lionel Constantin
Kieran M. Stanley
Simon O'Doherty
Angelina Wenger
Dickon Young
Andreas Engel
Tanja Schuck
Katharina Meixner
Thomas Wagenhaeuser
Fides Gad
Martin K. Vollmer
Stefan Reimann
Michela Maoine
Jgor Arduini
Chris Lunder
Norbert Schmidtbauer
László Haszpra
Mihály Molnár
Arnoud Frumau
Cedric Couret
Matthew Rigby
Stephan Henne
Alistair Manning
Anita L. Ganesan
Hydrofluorocarbons (HFCs) are potent greenhouse gases widely used in refrigeration, air-conditioning, and heat pump systems. Accurate monitoring of HFC emissions is essential to evaluate compliance with climate regulations and inform mitigation strategies. This study presents trends of HFC emissions across north-western Europe between 2013 and 2024, derived from atmospheric inverse modelling combining atmospheric measurements at eleven monitoring stations with two transport models (NAME and FLEXPART) and three Bayesian inversion systems (InTEM, ELRIS, RHIME). Although global emissions continue to rise for most HFCs, in north-western Europe our results show an overall steady decline in total HFC emissions from 40 ± 3 Tg CO2-eq yr−1 in 2016 (prior to enhanced regulation) to 29 ± 2 Tg CO2-eq yr−1 in 2023, following EU F-gas Regulations. This reduction is driven primarily by decreasing emissions of HFC-134a, HFC-143a and HFC-125 despite increasing HFC-32 emissions due to its adoption as a lower-global-warming-potential alternative refrigerant. Comparisons with national inventories reported to the United Nations Framework Convention on Climate Change (UNFCCC) show generally good agreement over north-western Europe but reveal discrepancies for specific compounds and countries, particularly for HFC-134a and HFC-125 in France and Germany during the earlier years of the study period. The recent expansion of the European measurement network demonstrates potential to improve spatial coverage and resolution of inverse emission estimates, especially in southern and central Europe. This study highlights the value of multi-model inversions to provide robust emission estimates with realistic, hence actionable, uncertainty characterisation.
- Article
(18229 KB) - Full-text XML
-
Supplement
(24745 KB) - BibTeX
- EndNote


Hydrofluorocarbons (HFCs) are anthropogenic gases primarily used as replacements for ozone-depleting substances (ODSs) being phased out under the Montreal Protocol. Their main applications are in refrigeration, air-conditioning, and heat-pump (RACHP) systems, where they are used as refrigerants. Additional applications include their use as foam blowing agents, aerosol propellants, fire suppressants and solvents (Liang et al., 2022). Although HFCs are not deleterious for the stratospheric ozone layer, they are potent greenhouse gases (GHGs). The overall HFC radiative forcing, as a collective, was 0.028 W m−2 in 2013, accounting for around 0.9 % of the global radiative forcing from all long-lived greenhouse gases. Ten years later, their contribution reached 0.051 W m−2, representing around 1.5 % of the total anthropogenic radiative forcing (data from NOAA GML AGGI viewer, 2025).
Owing to their climate impact, measures have been implemented to limit and reduce emissions of HFCs, including international protocols and national and regional policies. HFCs were added to the basket of GHGs regulated under the 1997 Kyoto Protocol of the United Nations Framework Convention on Climate Change (UNFCCC). In 2016, the Kigali Amendment to the Montreal Protocol, which entered into force in 2019, added HFCs to the list of controlled substances and set out a stepwise phase-down of HFC production and consumption, with different time frames for Article 5 (developing countries with delayed compliance) and non-Article 5 (considered as developed countries) parties (UNEP, 2016).
Within the European Union (EU-27, henceforth EU) and the United Kingdom (UK), HFCs account for approximately 2 % of 2023 total anthropogenic GHG emissions reported to the UNFCCC (UNFCCC, 2025). They also represent the dominant share of reported fluorinated gas (F-gas) emissions (∼ 92 % in 2023) across the combined group of HFCs, perfluorocarbons (PFCs), sulfur hexafluoride (SF6), and nitrogen trifluoride (NF3), largely due to their widespread use in RACHP systems.
1.1 European Regulations
The EU has introduced several regulatory measures to control HFC emissions. Since 2006, two key legislations have been in place: the Mobile Air Conditioning (MAC) Directive (MAC Directive, 2006) and the F-gas Regulation (EU F-gas Regulation, 2006). The MAC Directive banned high-global-warming-potential refrigerants (GWP > 150) in new vehicle air-conditioning systems, fully applying to all new models since 2017 (see Table 2 for GWP values of selected HFCs). The EU F-gas Regulation, first adopted in 2006, was revised in 2014 (EU F-gas Regulation, 2014) and again in 2024 (EU F-gas Regulation, 2024). The initial regulation promoted leak prevention, recovery and recycling, encouraged the adoption of low-GWP alternatives, and restricted certain uses of F-gases. The 2014 revision strengthened the legislation by introducing additional restrictions and an EU-wide quota system to progressively reduce the amount of HFCs placed on the market, targeting a two-thirds reduction by 2030 compared with 2009–2012 levels. The 2024 revision further reinforces this system and sets a complete phase-out of HFCs by 2050.
Following the exit of the UK from the EU, the F-gas Regulation continues to apply directly in Northern Ireland in accordance with the terms of the Ireland/Northern Ireland Protocol, while it is applied in Great Britain as “retained EU law” with requirements that remain aligned with those of the original EU legislation (Great Britain. Department for Environment and Affairs, Food & Rural, 2022). Other non-EU countries in Europe are not discussed here, as they are outside the scope of this study.
In addition, European countries are also bound by the Kigali Amendment to the Montreal Protocol. Since 2019, non-Article 5 parties to the Protocol (including the EU, UK, Switzerland and Norway), have been restricted to 90 % of their 2011–2013 baseline HFC consumption, with reductions tightening, in stages, to 15 % by 2036. The EU F-gas Regulation gives effect to these international obligations while setting more ambitious regional targets, although it focuses on HFCs placed on the market, whereas the Kigali Amendment regulates HFC production and consumption.
1.2 Emission Monitoring
Reliable quantification of HFC emissions is essential to track progress towards climate targets and to assess effectiveness of policy measures. Under the UNFCCC and the Paris Agreement, Annex I countries must annually submit national greenhouse gas inventories covering emissions from 1990 until two years prior to the submission year (e.g., the 2025 report covers emissions up to 2023). These inventories provide standardised, transparent data, but their uncertainty assessments are often incomplete and difficult to compare across countries. In addition, bottom-up HFC inventory estimates are subject to uncertainty due to a range of assumptions, such as equipment lifetimes and leakage rates (Say et al., 2016). Moreover, although reported emissions are disaggregated by gas, a minimum level of aggregation is sometimes applied for HFCs and other F-gases to protect confidential commercial or military information. Consequently, sectoral emissions reported under categories such as “unspecified mix of HFCs” or “unspecified mix of HFCs and PFCs” complicate the monitoring of gas-specific emissions.
Independent top-down approaches based on atmospheric measurements and inverse modelling offer a complementary method to estimate GHG emissions (Bergamaschi et al., 2018; World Meteorological Organization, 2025). They also allow for the evaluation of inventory reports and can, where they arise, highlight inconsistencies worthy of further investigation, for example, point source emissions not included in bottom-up inventories (Meixner et al., 2025).
Several studies have applied atmospheric inverse modelling to HFCs in Europe. For example, Manning et al. (2021) analysed UK HFC emissions from the late 1990s to 2019 and documented a decline linked to EU regulations. Rust et al. (2022) used campaign measurements in Switzerland (2019–2020) to demonstrate the benefits of a dense monitoring network for resolving regional emission patterns, a conclusion supported by Katharopoulos et al. (2023). Other studies include emission estimates for the Eastern Mediterranean from a 2013 campaign (Schoenenberger et al., 2018), long-term Italian emissions of HFC-134a between 2008 and 2023 (Annadate et al., 2025), and European-wide trends for nine HFCs between 2008 and 2014 (Graziosi et al., 2017). The latter study found general agreement with UNFCCC reports at the European scale but identified discrepancies at the specific gas and country level. A clear example of such divergence was shown by Say et al. (2016), who reported a mismatch in the UK HFC-134a emissions and demonstrated how atmospheric data can support the evaluation and refinement of reported emissions. Addressing these differences should involve an understanding and evaluation of the sources of divergence within the inverse modelling frameworks themselves. For example, Brunner et al. (2017) conducted an inter-model comparison of European emissions of HFC-134a, HFC-125, and SF6 for 2011, in which they illustrated how methodological choices can influence inferred emissions. However, such systematic multi-model evaluations remain relatively rare in the literature.
In this work, we combine observations from eleven European monitoring stations with two transport models and three inversion systems to derive long-term emission estimates of eleven HFCs, namely HFC-134a, HFC-143a, HFC-125, HFC-32, HFC-23, HFC-227ea, HFC-365mfc, HFC-245fa, HFC-152a, HFC-236fa and HFC-4310mee, for the period 2013–2024. The analysis focuses on north-western Europe, comprising of the UK, France, Germany, Ireland, Belgium, the Netherlands and Luxembourg. This study expands the European HFC emission record by providing multi-model estimates over more than a decade and incorporates data from new European stations not previously published. Some of these observations are not from long-term programmes but rather project-based as part of an extended network established within the EU-funded project Process Attribution of Regional emIssionS (Horizon Europe – PARIS, 2026). The results are compared with UNFCCC national inventories to evaluate their consistency; these inventories are themselves used as the primary basis for assessing compliance with climate policy.
Section 2 describes the atmospheric measurement network, and Sect. 3 introduces the inversion frameworks. Trends in inferred HFC emissions and comparisons with national inventories are presented in Sect. 4. Section 5 then examines the spatial distribution of major HFC emissions, and Sect. 6 evaluates the impact of recent expansions on atmospheric data-based emission estimates.
In this study, we use measurements from eleven European trace gas measurement stations. An overview of the sites, their type and measurement period is given in Table 1.
High-frequency in situ measurements (typically either one ambient air sample every two hours or two ambient air samples every three hours) are provided by the Advanced Global Atmospheric Gases Experiment (AGAGE) network at six sites: Mace Head (MHD, Ireland), Tacolneston (TAC, UK), Jungfraujoch (JFJ, Switzerland), Monte Cimone (CMN, Italy), Zeppelin (ZEP, Svalbard) and Taunus (TOB, Germany) (Prinn et al., 2018). MHD, TAC, JFJ, CMN, and ZEP data cover the full study period (2013–2024). At TOB, continuous observations started in 2018, but additional weekly flask sampling was performed from 2015 to 2022. Flask data are also collected at Cabauw (CBW, Netherlands) every two days since 2021. A description of both flask measurements is provided in the Supplement.
Since 2023, the European F-gas observation network has expanded through the PARIS project to include data from four additional sites including two high-frequency stations. Capo Granitola (CGR, Italy) was made operational and the measurements from the station at Zugspitze (ZSF, Germany) were transferred to calibration scales consistent with the other stations in the network. Two flask stations, Birkenes (BIR, Norway) and Hegyhátsál (HUN, Hungary) (typically flask samples every two days) were added, again with measurements on consistent calibration scales. All observational data are reviewed during regular common data quality control meetings. A description of these new stations is provided in the Supplement Sect. S1.
Table 1Measurement stations used in the inversions.
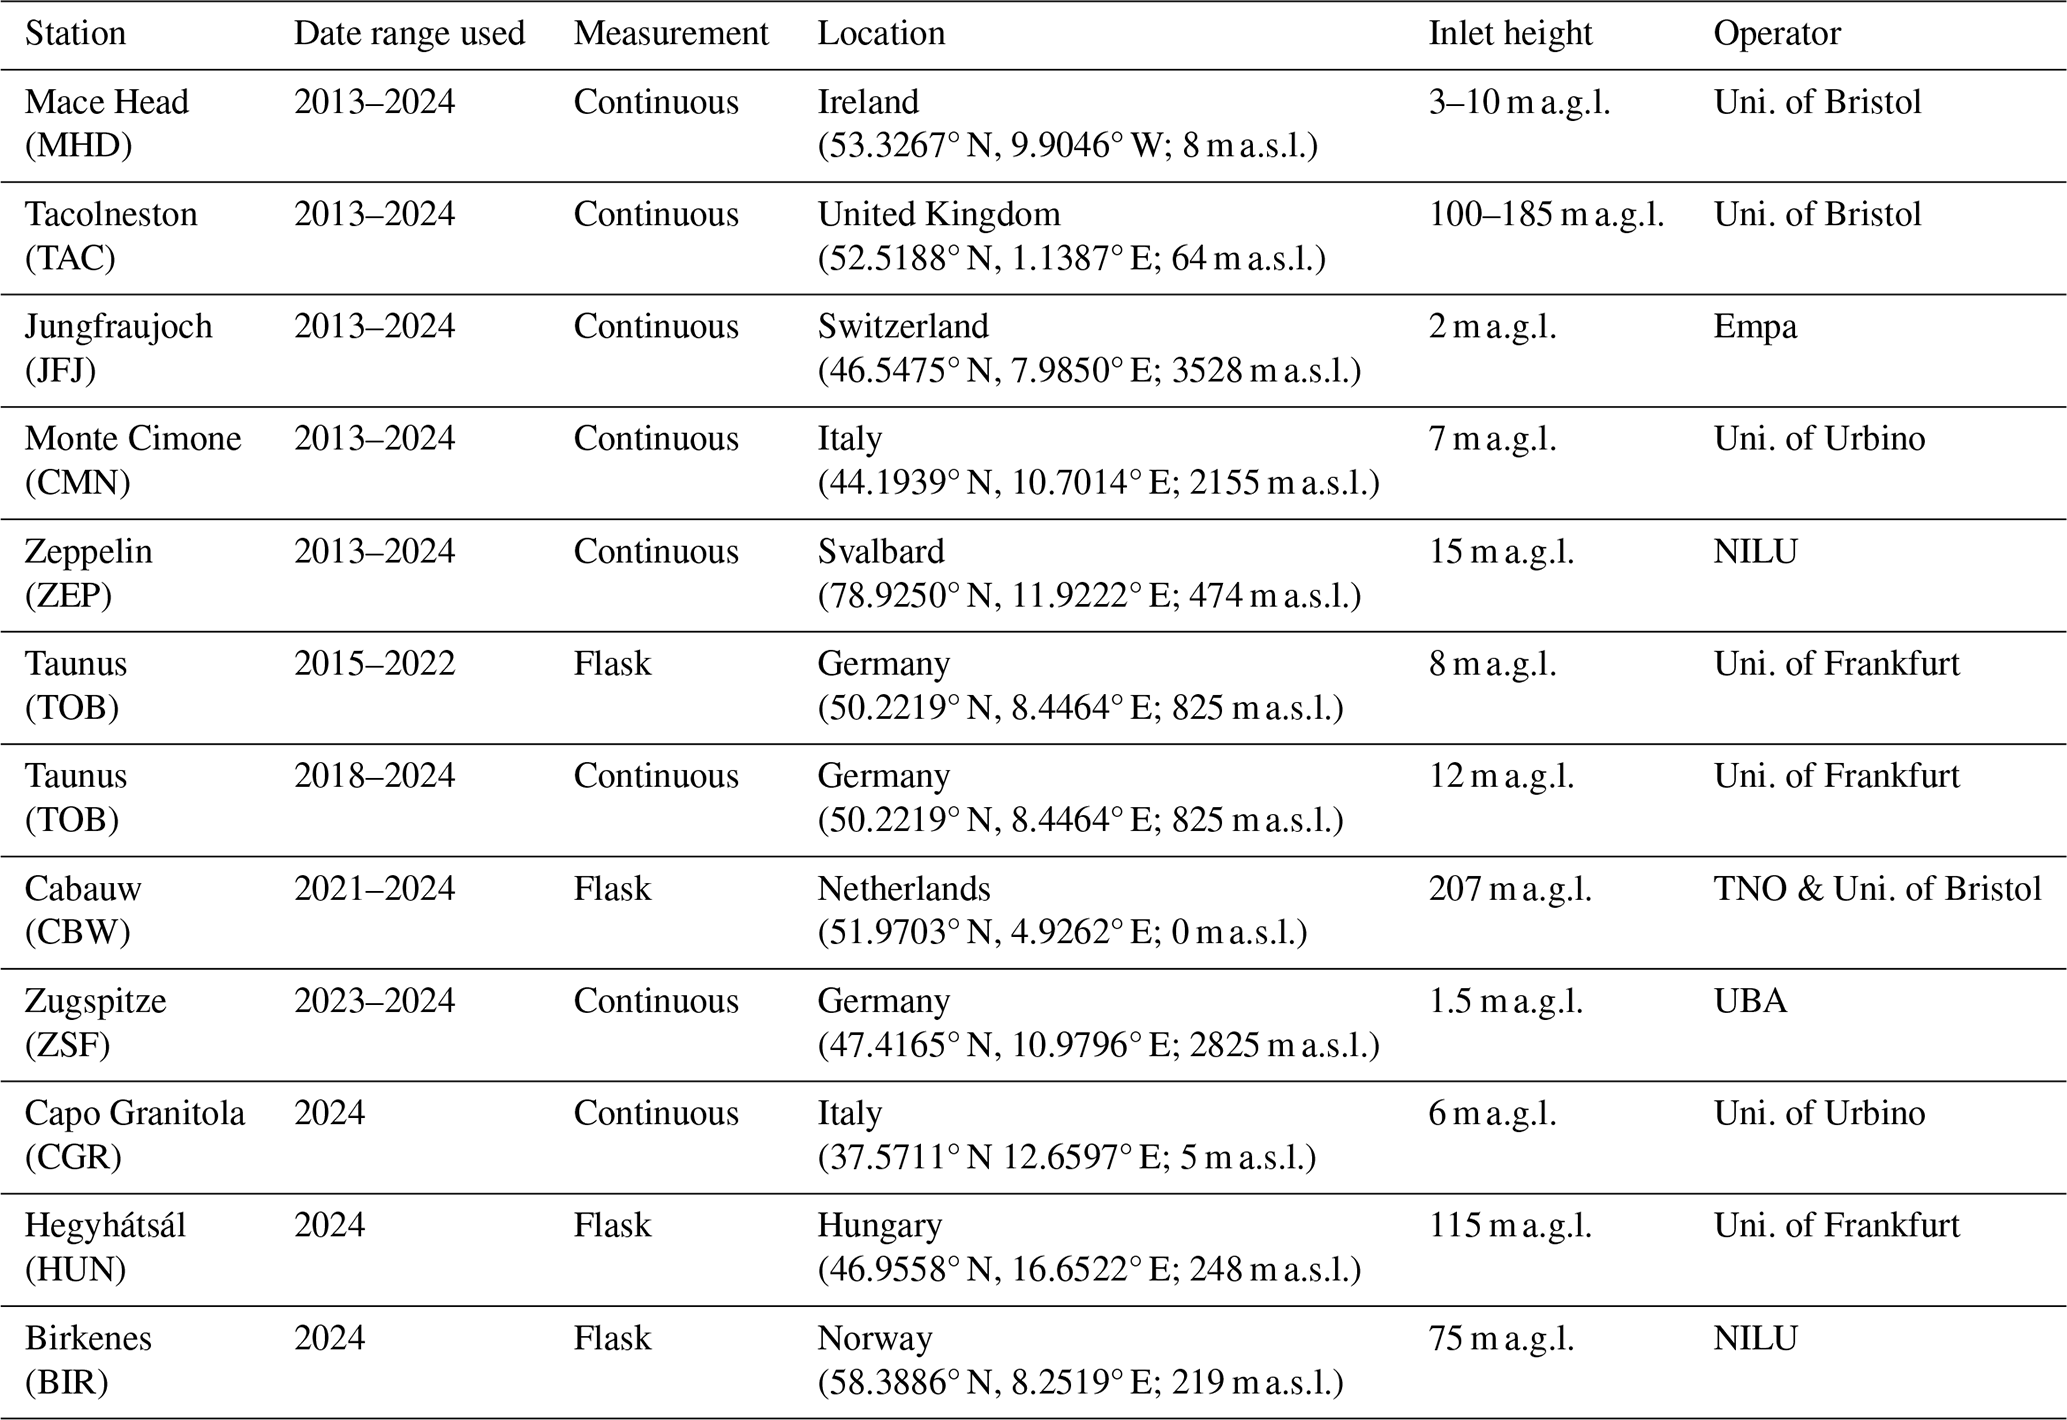
TOB measurements of HFC-134a start in May 2024. m a.s.l.: meters above sea level. m a.g.l.: meters above ground level.
Atmospheric inverse modelling combines information from atmospheric transport models, observational data and prior estimates of surface emission fluxes to infer (posterior) emission fluxes. In this framework, atmospheric transport models are used to establish the relationship between surface emissions and observed mole fractions, while prior emission fluxes provide an initial estimate that is subsequently refined by the observations. The three inverse modelling systems used in this study all adopt a Bayesian approach to solve this inverse problem: the Regional Hierarchical Inverse Modelling Environment (RHIME; Ganesan et al., 2014; Saboya et al., 2024), the Empa Lagrangian Regional Inversion System (ELRIS; Henne et al., 2016; Katharopoulos et al., 2023) and the Inversion Technique for Emission Modelling (InTEM; Manning et al., 2021; Arnold et al., 2018).
Two atmospheric transport models are employed to derive the source sensitivity by simulating the dispersion of emissions from source regions to measurement sites: the Numerical Atmospheric-dispersion Modelling Environment (NAME; Jones et al., 2007) and FLEXible PARTicle dispersion model (FLEXPART; Pisso et al., 2019). Details of the configurations of simulations can be found in the Supplement.
The same prior emissions are considered in the three inversion systems. For HFC-134a, HFC-143a, HFC-125, and HFC-32, prior emissions are taken from the Emissions Database for Global Atmospheric Research inventory (EDGAR v8.0; Crippa et al., 2023) and re-gridded to the transport model output resolution. For all remaining HFC species, uniformly distributed prior emissions over land are assumed, with no emissions over ocean. The estimated total annual emissions within the inversion domain are 1.0 kt for HFC-23, 8.0 kt for HFC-152a, 4.0 kt for HFC-365mfc, 0.4 kt for HFC-4310mee, 2.0 kt for HFC-245fa, 4.0 kt for HFC-227ea, and 1.0 kt for HFC-236fa.
For each inversion framework, emissions are resolved annually, with HFC emissions assumed to be constant within each year. With increased observational data density, higher temporal resolution inversions may become feasible, potentially allowing seasonal variations in emissions to be identified (Hu et al., 2025). A brief description of each inverse model is provided below.
In RHIME, the inversion domain consists of an inner domain covering most of Europe, discretised into 250 spatial basis regions, and an outer domain comprising six broader basis regions surrounding the inner domain. Emissions are inferred as scaling factors applied to prior emission fluxes within each basis region using Bayesian inference with Markov Chain Monte Carlo (MCMC) sampling. Atmospheric observations and transport model source sensitivities are aggregated over fixed 4 h intervals; the standard deviation of the aggregated mole fractions is used to represent variability, and the resampled instrument repeatability serves as the instrument uncertainty. Data are excluded when the transport model predicts a low planetary boundary layer height (below 200 m or within 50 m of inlet height), except at mountain sites (JFJ, CMN and ZSF). Boundary conditions are estimated as monthly scaling factors at the four cardinal domain boundaries and inferred using the same MCMC sampling approach as for the emissions, with prior mole fractions derived from MHD observations during Atlantic inflow (wind directions 180–300°). Prior emission scaling factors are assumed to follow a log-normal distribution with a mean of 1 and a standard deviation of 8 (), while a truncated normal distribution is assumed for the prior boundary condition scaling factors with a lower bound at zero, a normal-equivalent mean of 1 and a standard deviation of 0.1; model uncertainty is treated as a hyperparameter with a uniform prior between 0.1 and 1.0 ppt. The total model–data uncertainty is computed as the quadrature sum of instrument uncertainty, measurement variability and model uncertainty, with a site-specific minimum value based on the annual mean difference between the monthly median and fifth percentile mole fractions.
ELRIS makes use of the analytical solution to Bayes' theorem, which assumes normally distributed prior and model errors. Surface fluxes along the transport model domain and mole fractions at its borders (boundary conditions) are optimised, together with a bias mole fraction per site. An inner domain comprising most of Europe is discretised in 700 grid cells (basis regions) following the approach described in Henne et al. (2016). The region outside this inner domain (outer domain) is discretised in 4 grid cells. Following Arnold et al. (2018), the borders of the transport model domain are discretised in 11 interfaces. Average boundary conditions are optimised at each interface at a monthly resolution. Prior boundary conditions are estimated with the Robust Estimation of Baseline Signal (REBS) method using MHD observations (Ruckstuhl et al., 2012). The prior bias mole fraction is set to zero for all sites. A total uncertainty of 100 % is attributed to the inner domain prior emissions, while an uncertainty of 20 % is specified for the prior emissions in the outer domain. As described in Henne et al. (2016), the prior emissions in the inner domain are assumed to be spatially correlated, following an exponential decay with horizontal distance. A spatial correlation length of 500 km is assumed for all compounds except HFC-23. This compound is expected to have localised sources so a lower correlation length of 250 km is considered instead. The prior uncertainty of the boundary conditions and bias mole fractions are obtained from the REBS method. The uncertainty of the boundary conditions is assumed to be temporally correlated. An exponential decay with time is assumed, characterised by a temporal correlation length of 14 d. Similar to RHIME, atmospheric observations and source sensitivities are aggregated over 4 h intervals. Moreover, observations characterised by low planetary boundary layers are excluded from the inversion problem following the same criteria used by RHIME. This filtering was not applied to CMN, JFJ, TOB, ZEP and ZSF. The 4 h resampled measured repeatability is used as instrument uncertainty, and the observed standard deviation within the 4 h aggregation interval is used as a measure of variability. Following Henne et al. (2016), the model uncertainty is assumed to scale linearly with the prior mole fraction above baseline. The scaling factors are computed iteratively. The diagonal elements of the model-data mismatch covariance matrix is given by the squared sum of the instrument uncertainty, variability, model uncertainty, and a baseline uncertainty estimated by the REBS method. The model-data mismatch error is assumed to be temporally correlated, following an exponential decay in time with a temporal correlation length of 0.2 d.
The InTEM model solves for the 3-D varying background mole fraction and observation station biases within the inverse system, along with the spatial distribution and magnitude of the emissions. Time-varying prior background mole fractions are derived from the MHD, JFJ, CMN and ZEP observations by considering the fraction of air entering the eleven boundaries to the computational domain, and taking account of the influence of air from the tropics or southern hemisphere as described in Manning et al. (2021). The remaining sites use the MHD prior background mole fraction, and all sites have the freedom to solve for a station bias. Selection of observational data is based on boundary layer height and wind speed and is detailed in Manning et al. (2021) along with the gridding system InTEM employs. Similarly to RHIME and ELRIS, observational data are aggregated into 4 h periods with the repeatability from the data provider taken as the instrument uncertainty. The InTEM inversions used a prior uncertainty of 10 % over north-western (NW) Europe for the species with EDGAR priors and 100 % uncertainty over NW Europe for the flat, land only priors. The model uncertainty for each 4 h period is taken as the greater value of either the median pollution event (above baseline) in that year, or 10 % of the magnitude of the pollution event, plus the uncertainty calculated based on the number of observations available within the 4 h window (using adjacent periods if data are insufficient).
Combining the three inversion systems with the two transport models yields six distinct inversion frameworks. To facilitate the analysis, the results of the inversions were generated in a standardised format and visualised using the Python package Flux Intercomparison Environment (FLUXIE) developed for comprehensive cross-model evaluation (The FLUXIE Team, 2026). Examples of FLUXIE plots, including modelled and observed mole fractions and model fit statistics, are provided in the Supplement.
The emissions estimates analysed in this study span the period 2013–2024. Inversion results based on the NAME transport model cover the entire time range, and we report the average of the three associated inversion systems (InTEM-NAME, ELRIS-NAME, RHIME-NAME), referred to as the NAME-based mean. The associated uncertainty range is defined by the minimum and maximum uncertainties across the three NAME-based inversions. Similarly, we compute an average of the inversion systems using the FLEXPART transport model (InTEM-FLEXPART, ELRIS-FLEXPART, RHIME-FLEXPART), referred to as the FLEXPART-based mean, although these estimates are available only for 2017–2024.
This section presents both the NAME- and FLEXPART-based means for north-western Europe, alongside estimates for the UK, France, Germany, the Benelux region (grouping Belgium, the Netherlands, and Luxembourg) and Ireland. To reduce the influence of year-to-year variability that is unlikely to reflect real changes in emissions but are due to statistical noise, both means are smoothed using a three-year moving average. Emission estimates from each individual inversion system are provided in Appendix A and an example of “unsmoothed” NAME- and FLEXPART-based means is also presented in Fig. A1.
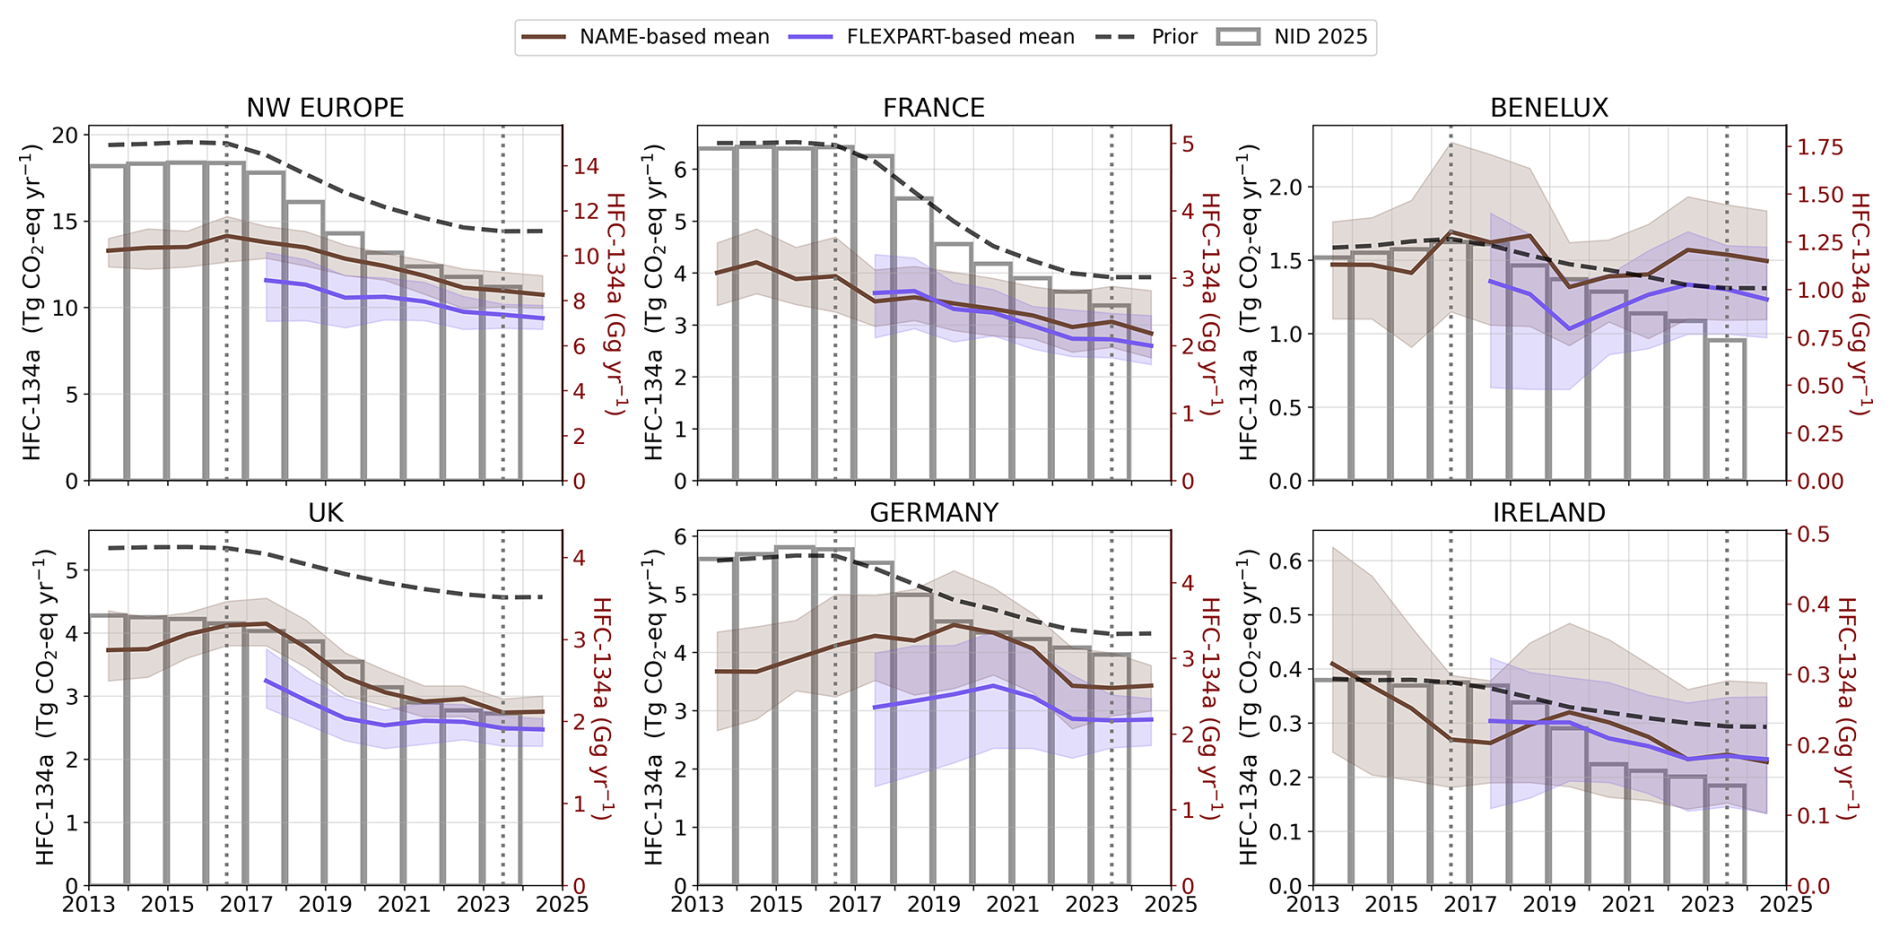
Figure 1Annual HFC-134a emissions for north-western Europe and its subregions (France, Benelux = Belgium–Netherlands–Luxembourg, UK, Germany, Ireland) from 2013 to 2024. Left y-axes show emissions in Tg CO2-eq yr−1, while right y-axes show emissions in Gg yr−1. Atmospheric inversion estimates are shown as the NAME-based mean (brown) and FLEXPART-based mean (purple), each representing the average of the InTEM, ELRIS, and RHIME inversion systems, with uncertainty ranges defined by the minimum and maximum of the 15.9 % and 84.1 % percentile, respectively, across the three models. Both means have been smoothed using a three-year moving average. The black dashed line indicates the prior emissions, and national inventory emissions submitted to the UNFCCC (2025 submission; NID 2025) are shown as grey outlined bars. The vertical dotted lines in 2016 and 2023 serve as visual guides for the discussion.
We compare our results with emissions reported in the National Inventory Documents (NID) submitted to the UNFCCC in 2025, taken from the Common Reporting Tables (CRT; UNFCCC, 2025). The CRT do not provide uncertainty estimates. Instead, uncertainty information is included in Annex 2 of each NID, following the 2006 Intergovernmental Panel on Climate Change (IPCC) Guidelines for National GHG Inventories (IPCC, 2006). However, the methods for reporting uncertainties varies substantially between countries: some provide sector-specific uncertainties for individual gases, while others report only aggregated uncertainties for all F-gases or for total HFCs, sometimes based on multiple methodological approaches. This heterogeneity makes it difficult to interpret or standardise uncertainty information consistently across the countries examined here. Readers are therefore encouraged to consult the country-specific NIDs directly for more detailed information on the uncertainty estimates provided by each country.
Table 2North-western European (France, Germany, UK, Ireland, Netherlands, Belgium, Luxembourg) HFC emissions (in Tg CO2-eq yr−1) for 2016 and 2023 estimated from the NAME-based and FLEXPART-based inversions, alongside the national inventories reported to the UNFCCC (NID 2025), with the percentage change in emission between 2016 and 2023 (Δ), for each HFC and the total of all HFCs. Global emissions (in Tg CO2-eq yr−1) in 2023 estimated by the global 12-box model using AGAGE measurements from Western et al. (2025). North-western European contribution to global emissions in 2023, based on the average of NAME- and FLEXPART-based estimates. GWP-100 values for each HFC reported in the Fifth Assessment Report (AR5; Stocker et al., 2013).
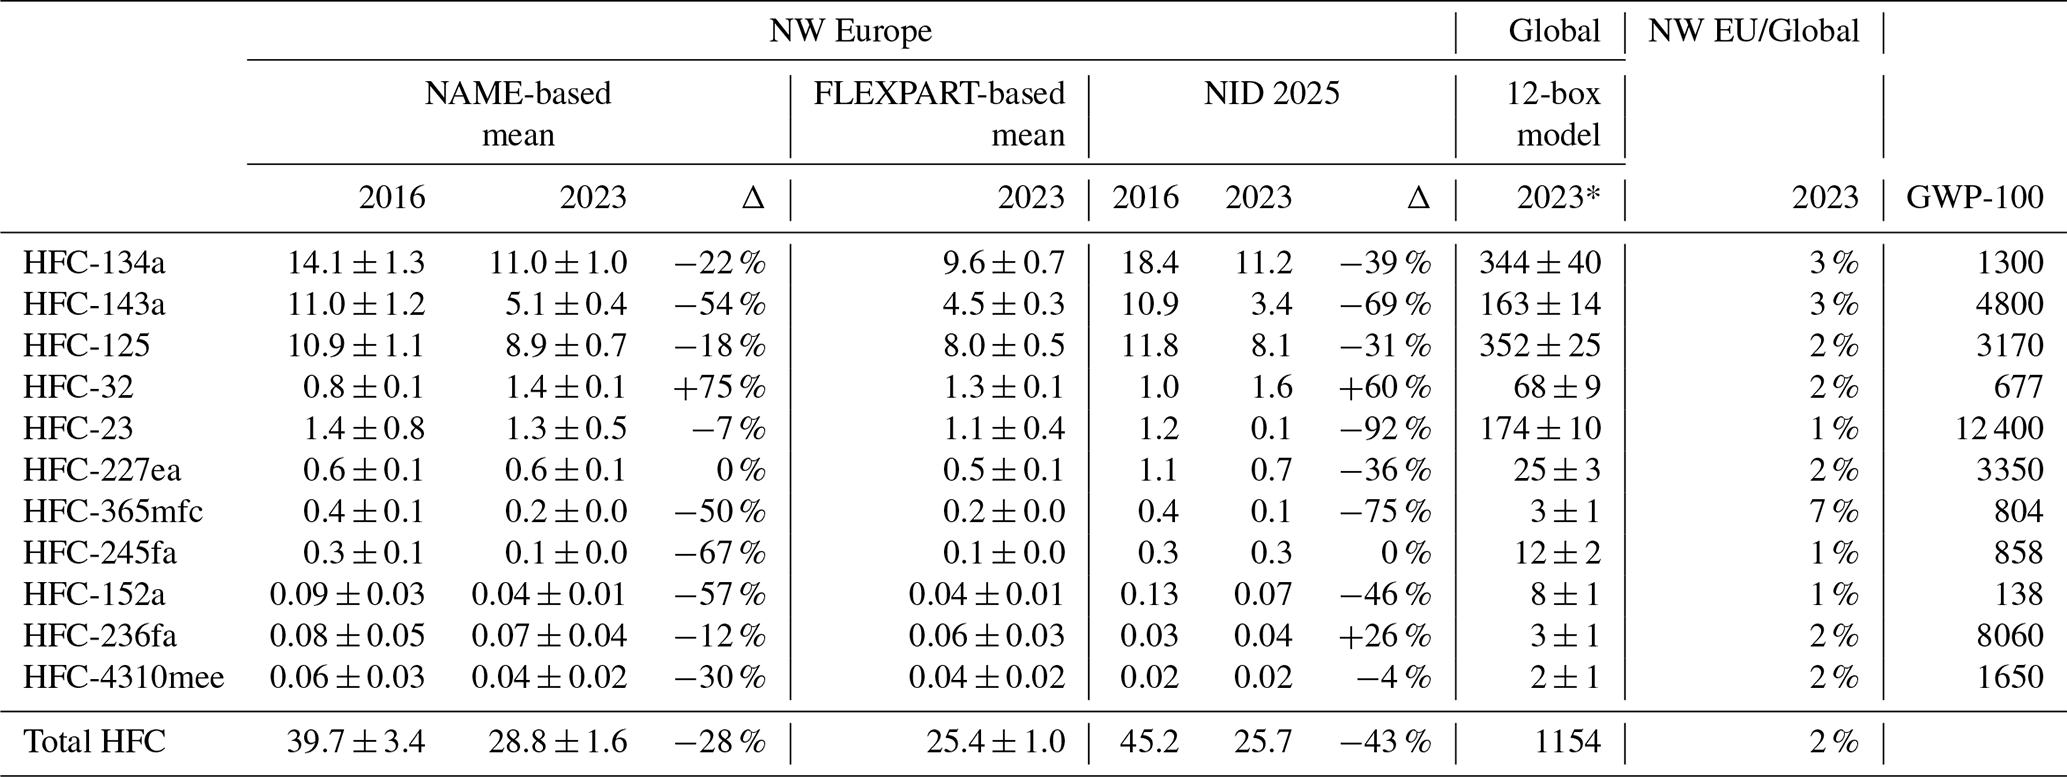
in Tg CO2-eq yr−1. Notes: The NAME- and FLEXPART-based means are the average of the InTEM, ELRIS, and RHIME inversion systems, with uncertainty ranges defined by the minimum and maximum uncertainties across the three models. Both means have been smoothed using a three-year moving average. * 2022 for HFC-4310mee.
Finally, to assess temporal changes and to facilitate comparison with the inventories, we evaluate the change in emissions between 2016 and 2023. Because the NAME- and FLEXPART-based means are smoothed using a three-year moving average, the 2016 and 2023 values correspond to the average of the periods 2015–2017 and 2022–2024, respectively. The transition between 2016 and 2017 marks the onset of major European policy interventions, namely the start of the HFC phase-down under the EU F-gas Regulation and the ban of high-GWP refrigerants in all new vehicle AC systems under the EU MAC Directive. Comparing these two periods therefore allows us to explore the influence of EU policy on emission trends. We place particular emphasis on NW Europe and the UK, where observational coverage provides the strongest constraints on the inversions. The north-western European emission estimates are summarised in Table 2, alongside the reported NID 2025 emissions and the global warming potentials (GWP-100; Stocker et al., 2013) used to convert them to CO2-equivalent. Global emissions, estimated with the global 12-box model using AGAGE measurements (Western et al., 2025), are also included in the table, together with the north-western European contribution to global emissions.
4.1 HFC-134a
HFC-134a is primarily used in mobile air-conditioning and other RACHP systems, with additional applications in technical aerosols (e.g., metered-dose inhalers) and as a foam blowing agent.
Figure 1 presents the atmospheric inversion-based emission estimates, with the NAME-based mean shown in brown and the FLEXPART-based mean in purple. The prior emissions used in the inversions are indicated by the black dashed line, and UNFCCC national inventory estimates (2025 submission) are shown as grey outlined bars. Emissions are expressed in Tg CO2-eq yr−1; values in Gg yr−1 are provided on the right axes, just for reference.
In north-western Europe, the NAME-based mean emissions plateaued between 2013 and 2016, at 14.1 ± 1.3 Tg CO2-eq yr−1 in 2016, followed by a decline of 22 % to 11.0 ± 1.0 Tg CO2-eq yr−1 in 2023. The UNFCCC inventory shows a similar plateau, but at higher levels: 18.4 Tg CO2-eq yr−1 in 2016 (about one-third higher than the inverse estimates). The discrepancy narrows after 2016, with the inventory decreasing by 39 % to 11.2 Tg CO2-eq yr−1 in 2023, closely matching the NAME-based mean. Most of the difference is attributable to France and Germany, the largest emitters in the region.
The FLEXPART-based mean also shows a downward trend from 2017 to 2024, reaching 9.6 ± 0.7 Tg CO2-eq yr−1 in 2023. The FLEXPART-based estimates are lower than the NAME-based but mostly overlapping within uncertainties. The six individual inversion frameworks are given in Fig. A2, showing good agreement between models, especially in recent years when observational coverage increased. This contrasts with earlier studies that relied on fewer monitoring sites (e.g. Brunner et al., 2017), likely reflecting recent advances in both measurement networks and inversion systems.
The post-2016 decline in HFC-134a emissions is consistent with the implementation of EU measures targeting high-GWP HFCs, particularly the MAC Directive, which strongly affects HFC-134a use due to its dominant role in mobile air-conditioning systems. Annadate et al. (2025) examined Italian HFC-134a emissions using observations from four stations (CMN, MHD, JFJ, TAC) and FLEXPART source sensitivities, finding a similar decreasing trend in Italy and other parts of Europe. Their aggregated European total spans more countries than considered in this study; nevertheless, their modelled emissions show a consistent decline of ∼ 27 % between 2016 and 2023.
For the UK, emissions in 2016 are estimated at 4.1 ± 0.4 Tg CO2-eq yr−1 using the NAME-based mean, in close agreement with the UNFCCC inventory value of 4.2 Tg CO2-eq yr−1. Both datasets show a comparable decline of ∼ 35 % over the seven years, reaching 2.7 ± 0.3 Tg CO2-eq yr−1 (NAME-based mean) and 2.7 Tg CO2-eq yr−1 (inventory) in 2023. This strong consistency throughout the timeseries contrasts with discrepancies reported in an earlier study (Manning et al., 2021), where the UK 2020 inventory was reported to be 54 % higher than InTEM for 2009–2018. The improved consistency in these results reflects the substantial downward revisions implemented in recent UK inventory submissions. In particular, the UK inventory model for refrigerated gases was replaced by a more advanced approach that better captures market changes (including refill rates and market penetration). However, between 2017 and 2021, the FLEXPART-based mean is lower than the inventory, although convergence is observed thereafter.
For France, the inventory estimate is greater than the NAME-based mean by 2.5 Tg CO2-eq yr−1 in 2016, which is more than one-third of the reported emissions. A similar discrepancy is seen with the FLEXPART-based mean, which is closely aligned with the NAME-based mean. After 2017, the French inventory shows a sharp decline, resulting in much closer agreement with the inverse estimates by 2023. According to the 2024 national inventory document, the sharp decrease after 2017 is mostly due to the renewal of the automobile fleet, as well as a decrease of HFC-134a usage in technical aerosols and metered-dose inhalers (Citepa, 2024). Part of the discrepancy with our estimates may arise because the French inventory includes overseas territories, while our inversion estimates apply only to the European domain. However, this difference alone is very unlikely to explain the gap observed in the early years.
German emissions show a similar pattern to French emissions, with a substantial gap of 1.8 Tg CO2-eq yr−1 between the inventory and the NAME-based mean in 2013–2016 but improving agreement after 2016. A difference is also observed between the FLEXPART- and NAME-based means, with the latter indicating higher emissions, although the two show improved agreement in recent years. It is important to note that HFC-134a observations from the German monitoring station ZSF and TOB, important for more robustly constraining national emissions, only became available for this gas in 2023 and late-2024, respectively. Consequently, the inversion-based estimates for Germany come with large uncertainties in the earlier years.
For the Benelux region, atmospheric observation-based emissions decrease more slowly than the inventory, exhibit greater variability, and have large uncertainties. This is likely due to the small geographical size with high emissions per unit area, which makes it challenging for the inversion systems to properly assign emissions to the right country. Nevertheless, the estimates remain consistent with inventory values. Irish inversion-based estimates also align well with the national inventory throughout the study period.
Relative to global estimates from Western et al. (2025) (converted to CO2eq, Table 2), which amount to 344 ± 40 Tg CO2-eq yr−1 in 2023, north-western European emissions of HFC-134a represent 3 % of the global total, based on the average of the NAME- and FLEXPART-based means in 2023.
4.2 HFC-143a
HFC-143a is mainly used as a blend component in commercial refrigeration systems. In north-western Europe, atmospheric observation-based emissions of HFC-143a show a pronounced decline over the study period, the NAME-based mean decreasing from 11.0 ± 1.2 Tg CO2-eq yr−1 in 2016 to 5.1 ± 0.4 Tg CO2-eq yr−1 in 2023, a 54 % reduction (Fig. 2). The FLEXPART-based mean follows a similar downward trend during 2017–2024, with slightly lower emissions overall (4.5 ± 0.3 Tg CO2-eq yr−1 in 2023) but mostly agreeing within uncertainty bands. The agreement among the six inversion frameworks (Fig. A3) is generally good, with larger year-to-year and inter-model variability in the earlier years when the measurement network was more sparse. The national inventories also show a steep decline, from 10.9 Tg CO2-eq yr−1 in 2016 to 3.4 Tg CO2-eq yr−1 in 2023, broadly consistent with our estimates. However, a divergence emerges after 2021, with the inventory declining more rapidly than the atmospheric data-based estimates. This emerging gap is driven primarily by discrepancies observed for France in the later years of the study period; specifically, the French inventory value in 2023 is less than half of the NAME- and FLEXPART-based means.
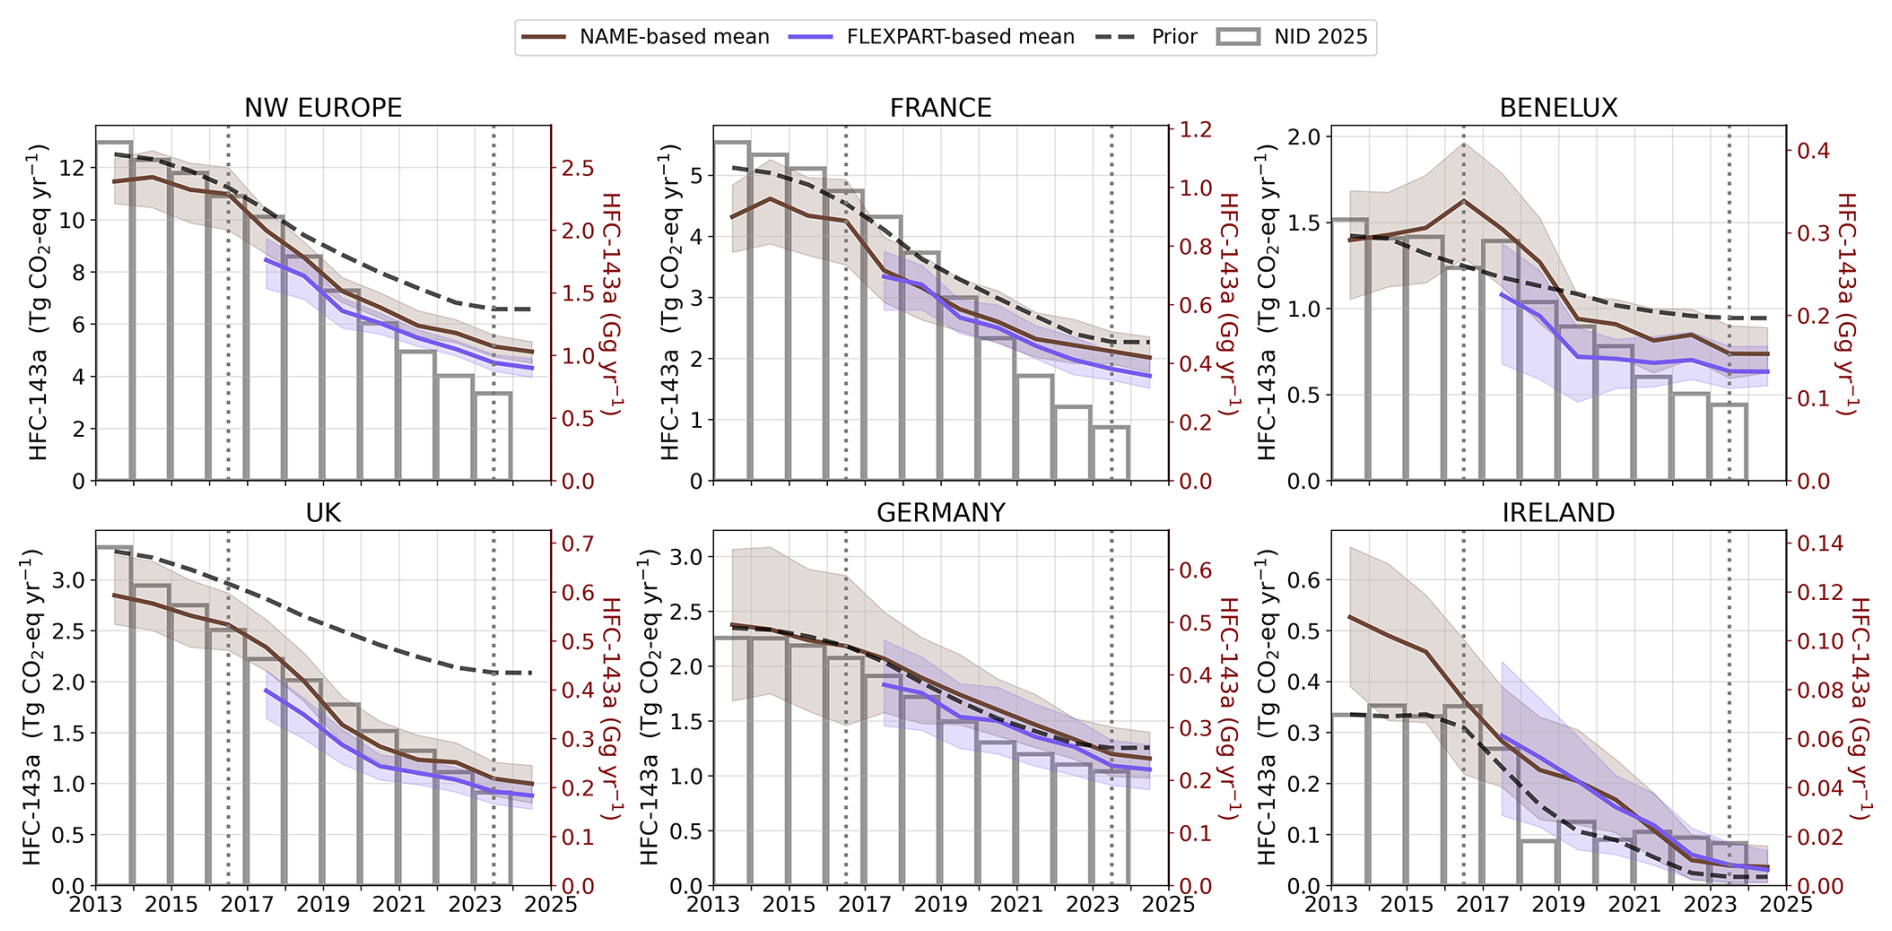
Figure 2Annual HFC-143a emissions for north-western Europe and its subregions (France, Benelux = Belgium–Netherlands–Luxembourg, UK, Germany, Ireland) from 2013 to 2024. Left y-axes show emissions in Tg CO2-eq yr−1, while right y-axes show emissions in Gg yr−1. Atmospheric inversion estimates are shown as the NAME-based mean (brown) and FLEXPART-based mean (purple), each representing the average of the InTEM, ELRIS, and RHIME inversion systems, with uncertainty ranges defined by the minimum and maximum of the 15.9 % and 84.1 % percentile, respectively, across the three models. Both means have been smoothed using a three-year moving average. The black dashed line indicates the prior emissions, and national inventory emissions submitted to the UNFCCC (2025 submission; NID 2025) are shown as grey outlined bars. The vertical dotted lines in 2016 and 2023 serve as visual guides for the discussion.
For the UK, the NAME-based mean is in close agreement with the inventory, with both showing around a 62 %–64 % reduction between 2016 and 2023, from 2.6 ± 0.3 (NAME-based mean) and 2.5 (inventory) Tg CO2-eq yr−1 to 1.0 ± 0.2 and 0.9 Tg CO2-eq yr−1, respectively. German emissions also show good agreement between the inventory and the NAME- and FLEXPART-based means.
Benelux emissions decrease over the study period; however, the inventory shows an increase in 2017 followed by a decline. A similar feature is present in the atmospheric observation-based estimates, appearing as a peak in 2016 (Fig. 2). Examination of the individual inversion systems without smoothing (Fig. A3) indicates that the peak also occurs in 2017, consistent with the inventory. The shift to 2016 in the mean timeseries appears after applying the three-year moving average. The 2017 peak aligns with reported increases in Dutch refrigeration emissions prior to the implementation of subsequent phase-down measures (RIVM, 2024). The inventory and the atmospheric-based estimates diverge after 2021, with the atmospheric-based estimates plateauing while the inventory continues to decline.
Irish emissions are small compared to the north-western Europe total, and both inventory and inversions generally agree within the NAME- and FLEXPART-based uncertainties. A sharp drop is seen in the inventory in 2018 that is not evident in the NAME- nor FLEXPART-based means; however, this decrease is present in some individual models (Fig. A3) but is smoothed out when averaging across models and applying the three-year moving average. As reported in the Irish NID, the substantial reduction in HFC emissions in 2018–2020 relative to 2017 is due to decreases in HFC imports as a consequence of them being replaced by lower-GWP hydrofluoroolefins (HFOs), HFO/HFC blends, and other alternatives (EPA, 2024). Inverse emission estimates from 2021 onwards align well with the inventory.
In 2023, our north-western European emission estimates (NAME and FLEXPART) of HFC-143a account for 3 % of the global total, which is estimated at 163 ± 14 Tg CO2-eq yr−1 (Table 2).
4.3 HFC-125
HFC-125 is used mainly as a component in refrigerant blends for stationary air-conditioning, commercial refrigeration, and heat pumps, and also as a firefighting agent.
In north-western Europe, inventory-based emissions of HFC-125 remained relatively stable during 2013–2016, reaching 11.8 Tg CO2-eq yr−1 in 2016, followed by a decrease of 31 % to 8.1 Tg CO2-eq yr−1 in 2023 (Fig. 3). Atmospheric inversion estimates are consistently lower in the early period, with a NAME-based mean of 10.9 ± 1.1 Tg CO2-eq yr−1 in 2016, and show a more modest reduction of 18 % to 8.9 ± 0.7 Tg CO2-eq yr−1 in 2023. The FLEXPART-based mean follows a similar trend but remains lower than the NAME-based mean, reaching 8.0 ± 0.5 Tg CO2-eq yr−1 in 2023.
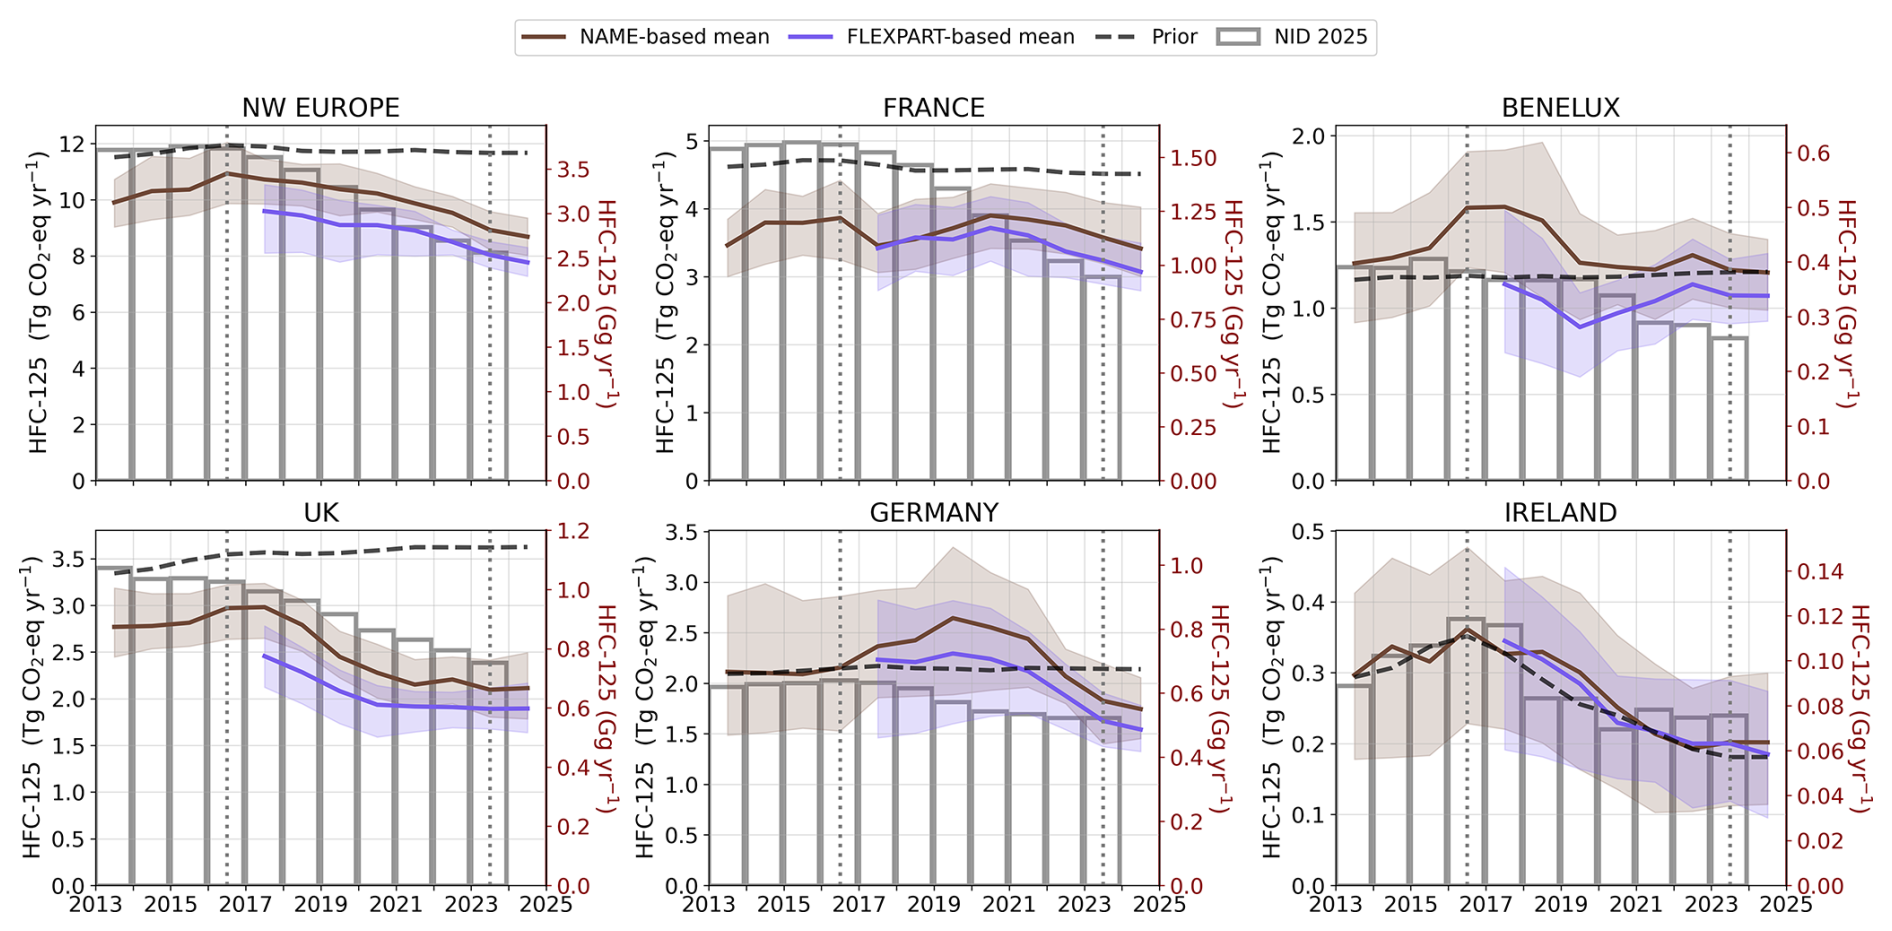
Figure 3Annual HFC-125 emissions for north-western Europe and its subregions (France, Benelux = Belgium–Netherlands–Luxembourg, UK, Germany, Ireland) from 2013 to 2024. Left y-axes show emissions in Tg CO2-eq yr−1, while right y-axes show emissions in Gg yr−1. Atmospheric inversion estimates are shown as the NAME-based mean (brown) and FLEXPART-based mean (purple), each representing the average of the InTEM, ELRIS, and RHIME inversion systems, with uncertainty ranges defined by the minimum and maximum of the 15.9 % and 84.1 % percentile, respectively, across the three models. Both means have been smoothed using a three-year moving average. The black dashed line indicates the prior emissions, and national inventory emissions submitted to the UNFCCC (2025 submission; NID 2025) are shown as grey outlined bars. The vertical dotted lines in 2016 and 2023 serve as visual guides for the discussion.
The gap between the inventory and the NAME-based mean in 2013–2016 arises predominantly from France, where the inversions consistently estimate lower emissions than reported in the inventory. This discrepancy gradually narrows, with convergence occurring after 2019 within inverse model uncertainties.
UK emissions derived from our inversions are 3.0 ± 0.3 Tg CO2-eq yr−1 in 2016 and decline by 30 % to 2.1 ± 0.3 Tg CO2-eq yr−1 in 2023 for the NAME-based mean, closely aligning with the FLEXPART-based mean which reached 1.9 ± 0.22 Tg CO2-eq yr−1 in 2023. The inventory shows a similar downward trend, albeit at slightly higher levels, decreasing from 3.3 to 2.4 Tg CO2-eq yr−1 over the same period. The larger discrepancies reported in Manning et al. (2021), where InTEM estimates were on average 35 % lower than the 2020 inventory for 2012–2017, have substantially reduced, due to a significant downward revision of the UK inventory.
For Germany, Benelux, and Ireland, atmospheric observation-based estimates are associated with relatively large uncertainties, but overall they remain broadly consistent with national inventories over 2013–2023. For Germany, however, the NAME- and FLEXPART-based estimates diverge from the inventory during 2018–2022, showing a temporary increase while the inventory declines. For Benelux, the inversions do not exhibit a clear trend beyond 2016, whereas the inventory suggests a gradual long-term decline. For Ireland, both atmospheric observation-based and inventory estimates decrease after 2017.
Based on the average of the NAME- and FLEXPART-based mean, north-western Europe accounts for slightly more than 2 % of global HFC-125 emissions, which are estimated at 352 ± 25 Tg CO2-eq yr−1 in 2023 (Table 2).
4.4 HFC-32
HFC-32 is used as a refrigerant for air-conditioning, commercial refrigeration, and heat pumps.
Unlike other HFCs, HFC-32 emissions in north-western Europe exhibit a pronounced upward trend both in the inventory and in inverse estimates (Fig. 4). The NAME-based mean increased by approximately 75 % between 2016 and 2023, rising from 0.8 ± 0.1 to 1.4 ± 0.1 Tg CO2-eq yr−1. The FLEXPART-based mean aligns closely with 1.3 ± 0.1 Tg CO2-eq yr−1 in 2023. The inventory shows a similar but more moderate increase of 60 %, from 1.0 to 1.6 Tg CO2-eq yr−1, slightly higher than the atmospheric-based estimates. This increase in HFC-32 emissions reflects the ongoing transition towards lower-GWP alternatives, with HFC-32 increasingly replacing higher-GWP blends.
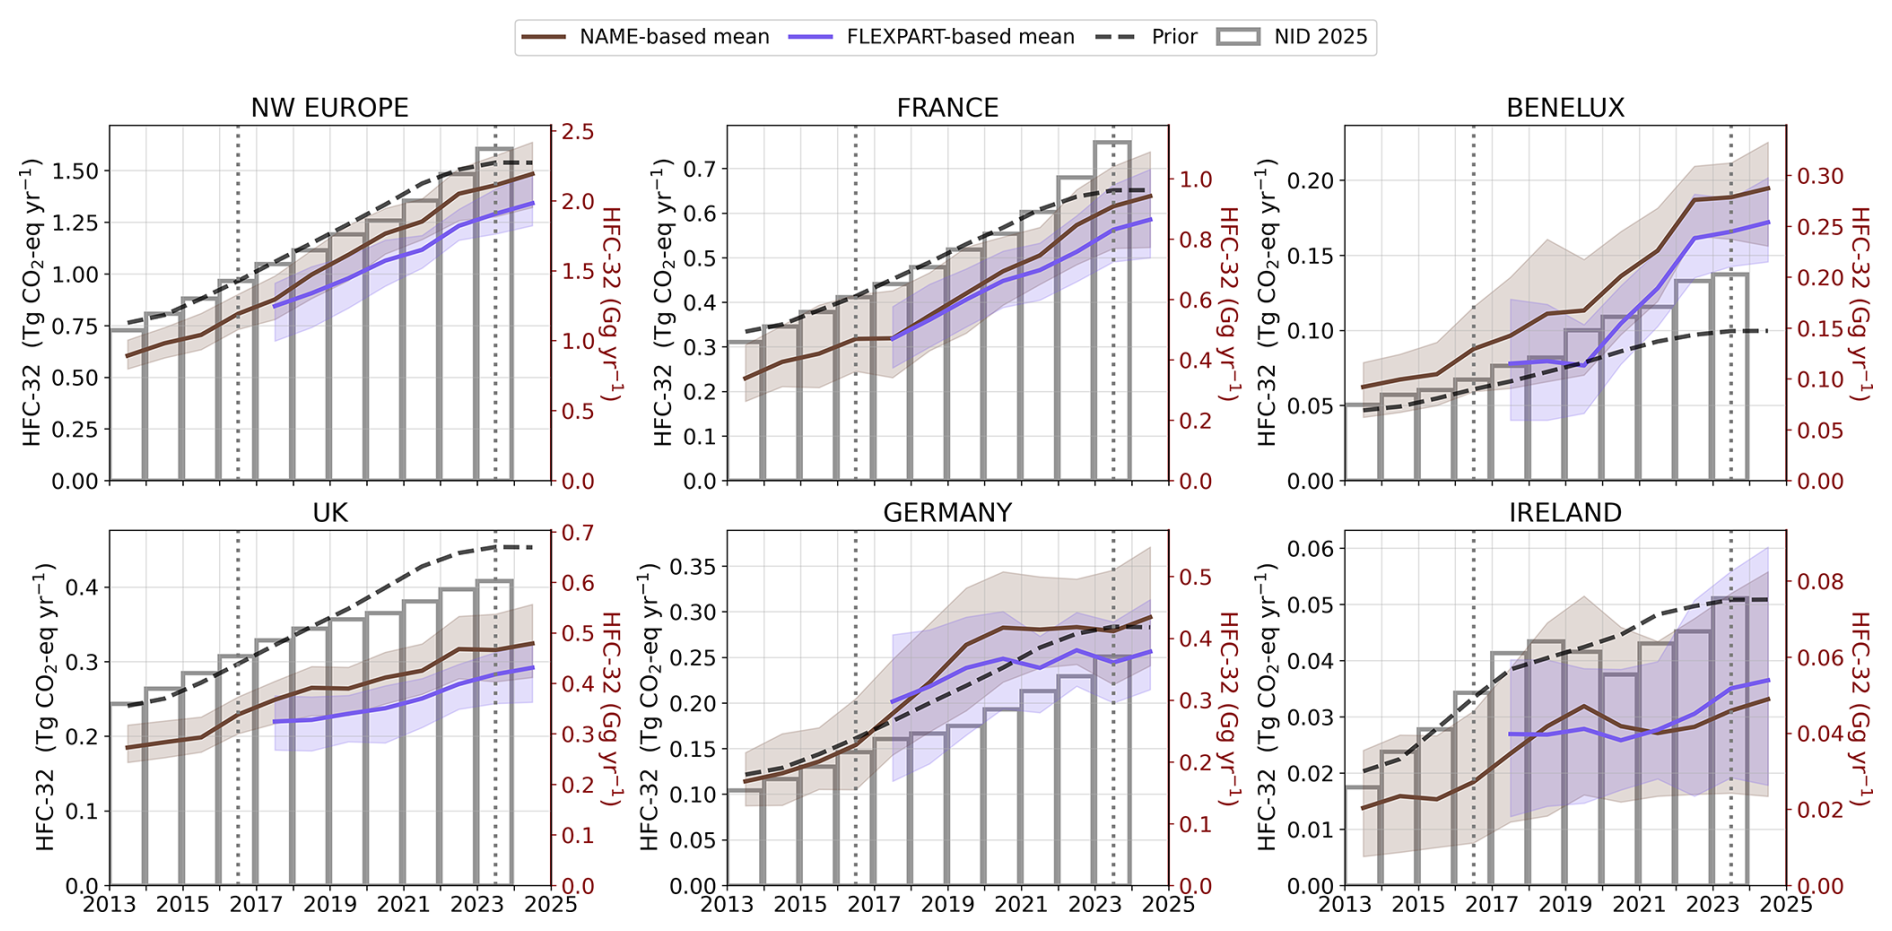
Figure 4Annual HFC-32 emissions for north-western Europe and its subregions (France, Benelux = Belgium–Netherlands–Luxembourg, UK, Germany, Ireland) from 2013 to 2024. Left y-axes show emissions in Tg CO2-eq yr−1, while right y-axes show emissions in Gg yr−1. Atmospheric inversion estimates are shown as the NAME-based mean (brown) and FLEXPART-based mean (purple), each representing the average of the InTEM, ELRIS, and RHIME inversion systems, with uncertainty ranges defined by the minimum and maximum of the 15.9 % and 84.1 % percentile, respectively, across the three models. Both means have been smoothed using a three-year moving average. The black dashed line indicates the prior emissions, and national inventory emissions submitted to the UNFCCC (2025 submission; NID 2025) are shown as grey outlined bars. The vertical dotted lines in 2016 and 2023 serve as visual guides for the discussion.
The UK also exhibits a consistent increasing trend, although inversion-based estimates remain about 25 % lower than the inventory throughout the timeseries. The NAME-based mean increases from 0.23 ± 0.03 Tg CO2-eq yr−1 in 2016 to 0.32 ± 0.05 Tg CO2-eq yr−1 in 2023 (0.28 ± 0.03 Tg CO2-eq yr−1 for the FLEXPART-based mean), compared with an increase from 0.31 to 0.41 Tg CO2-eq yr−1 in the inventory. This discrepancy is smaller than that reported by Manning et al. (2021), where the InTEM estimates in 2018 were about 50 % lower than the 2018 value in the 2020 inventory, reflecting updates and downward revisions in more recent UK inventories.
France accounts for roughly half of north-western Europe's HFC-32 emissions, with generally good agreement between the atmospheric data-based estimates and the inventory, although the inversion estimates are slightly lower. Emissions from Germany, Benelux, and Ireland also show good consistency between the inventories and the inverse estimates, considering the relatively large NAME- and FLEXPART-based uncertainties across the full period.
In 2023, based on the average of the NAME- and FLEXPART-based means, north-western Europe contributes approximately 2 % to global HFC-32 emissions, which are estimated at 68 ± 9 Tg CO2-eq yr−1 (Table 2).
4.5 Minor HFCs
North-western European emissions of the less abundant HFCs (HFC-23, HFC-227ea, HFC-365mfc, HFC-245fa, HFC-152a, HFC-236fa, and HFC-4310mee) are shown in Fig. 5. They exhibit heterogeneous but generally declining trends over the 2013–2024 period. Despite large uncertainties, driven by a poorer model performance for these compounds (see Supplement Sect. S3), the NAME- and FLEXPART-based means broadly agree on both the magnitude and trajectory of emissions, with the FLEXPART-based mean systematically slightly lower than the NAME-based mean. Both also follow the directional changes suggested by the UNFCCC inventories, except for HFC-23 and HFC-245fa, where notable discrepancies between reported and atmospheric data-based estimates arise between 2019 and 2023.
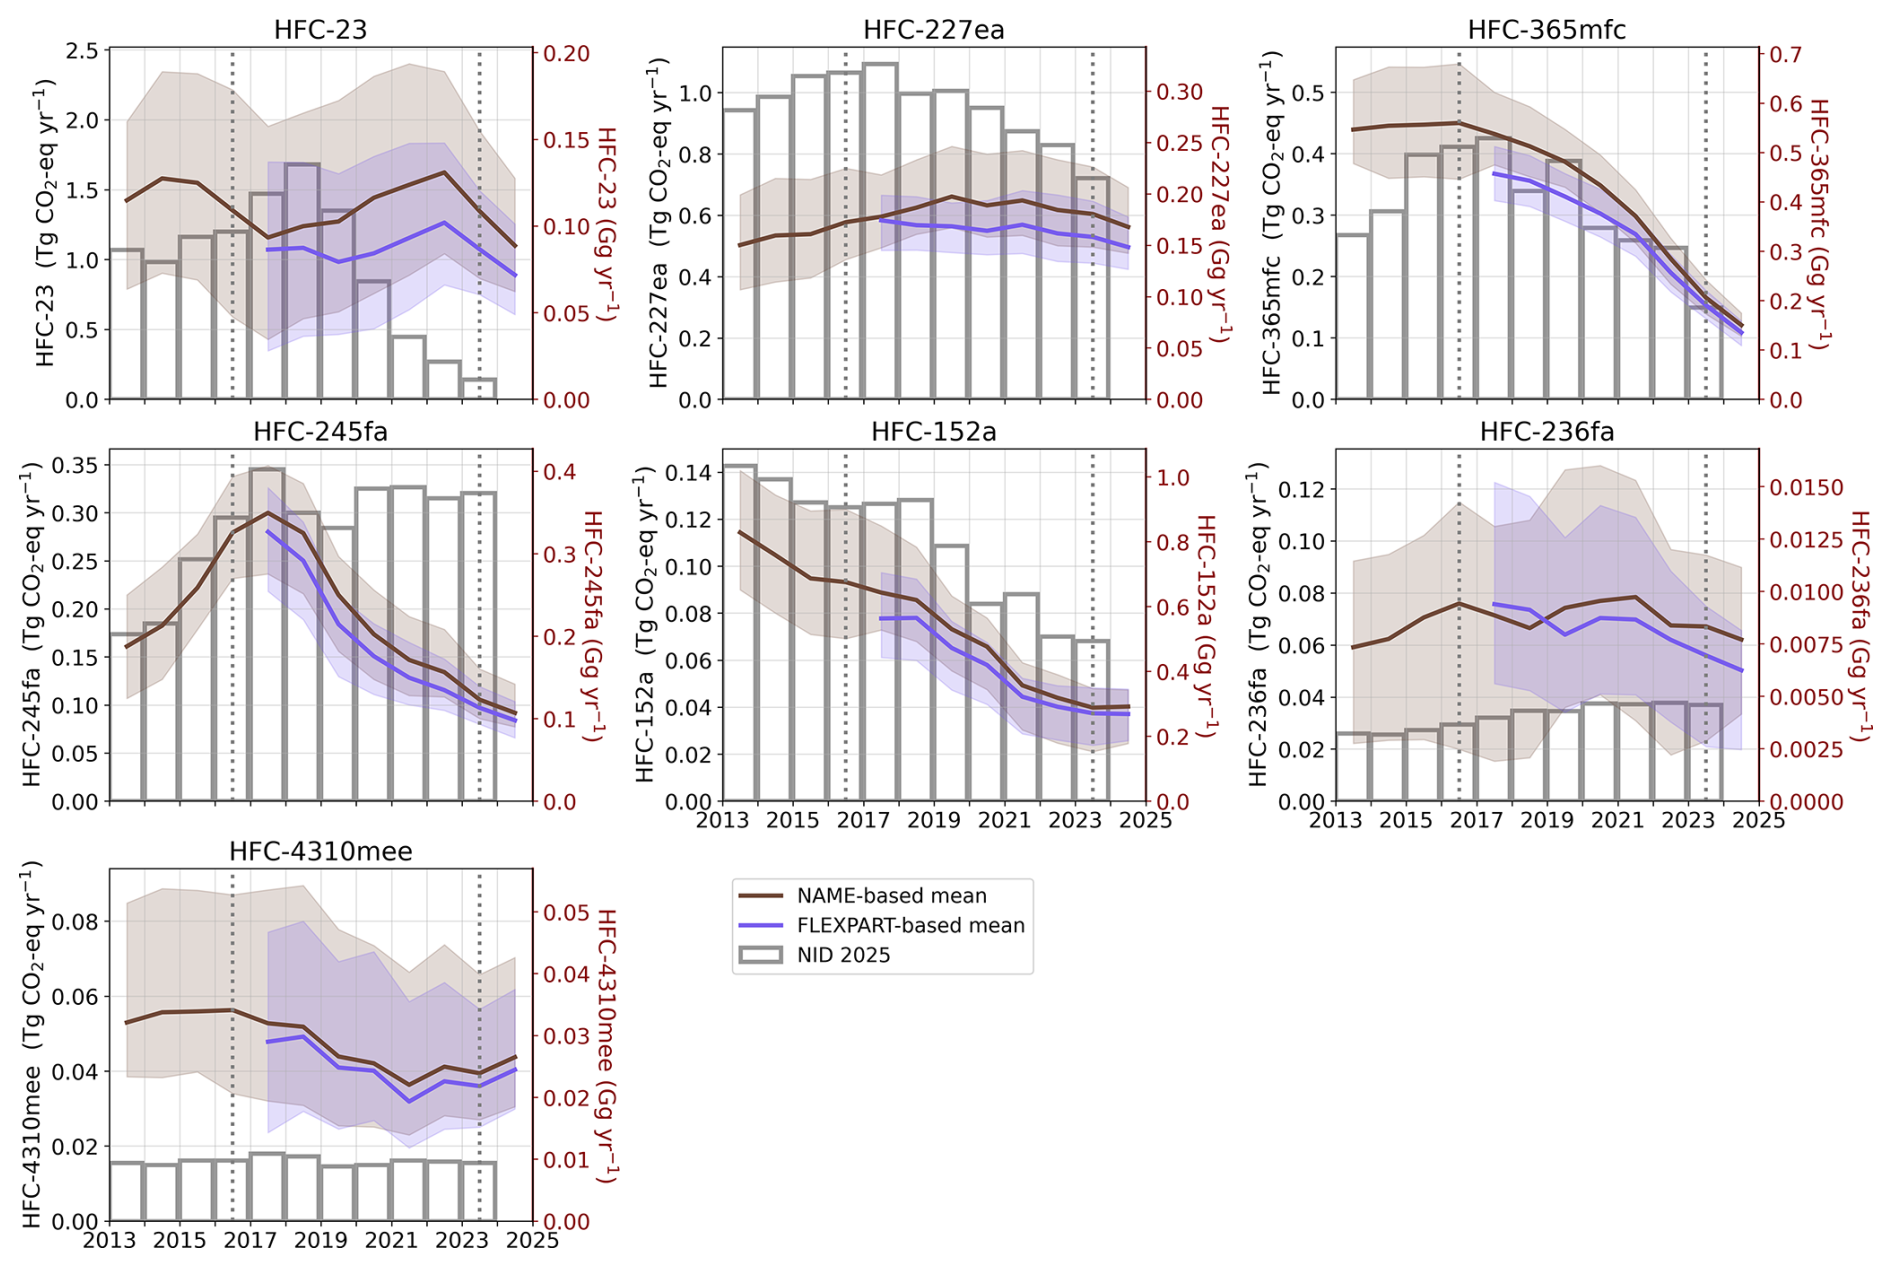
Figure 5Annual emissions from 2013 to 2024 of HFC-23, HFC-227ea, HFC-365mfc, HFC-245fa, HFC-152a, HFC-236fa, and HFC-4310mee for north-western Europe (aggregate of France, Germany, the UK, Belgium, the Netherlands, Luxembourg, and Ireland). Left y-axes show emissions in Tg CO2-eq yr−1, while right y-axes show emissions in Gg yr−1. Atmospheric inversion estimates are shown as the NAME-based mean (brown) and FLEXPART-based mean (purple), each representing the average of the InTEM, ELRIS, and RHIME inversion systems, with uncertainty ranges defined by the minimum and maximum of the 15.9 % and 84.1 % percentile, respectively, across the three models. Both means have been smoothed using a three-year moving average. National inventory emissions submitted to the UNFCCC (2025 submission; NID 2025) are shown as grey outlined bars. The vertical dotted lines in 2016 and 2023 serve as visual guides for the discussion.
HFC-23 shows substantial year-to-year variability and comparatively large uncertainties in the inversion estimates. Although a downward tendency appears after 2022, extending the timeseries will be important to confirm whether this represents a sustained decline in atmospheric observation-based emissions. The inventory, by contrast, shows a sharp reduction after 2018.
HFC-23 presents particular challenges for atmospheric inverse modelling. It is emitted primarily as a by-product of HCFC-22 production (Stanley et al., 2020; Rust et al., 2024), where its emissions may be sporadic, and highly localised; features that are difficult to capture with the temporal and spatial resolution of our inversion systems and the current measurement density. Moreover, comparisons with inventories can be complicated as several countries do not report HFC-23 separately but include it under “unspecified mix of HFCs” or “unspecified mix of HFCs and PFCs”. Further investigation is needed to monitor and reconcile these differences.
For HFC-245fa, the NAME-based mean increases from 2013 to 2017 in good agreement with the inventory, but the datasets diverge thereafter: the NAME- and FLEXPART-based means steadily decrease, whereas the inventory remains nearly constant at approximately its 2017 level. For HFC-227ea, the inventory indicates a gradual decline after 2016, whereas the NAME-based mean increases from 2016 to 2019 before declining slightly thereafter, and the FLEXPART-based mean remains relatively flat from 2017 to 2021 before showing a slight decrease. A gap between both inversion systems and the inventory is evident in the earlier years, but convergence improves toward the end of the record. HFC-365mfc shows a clear decrease after 2017 in both the atmospheric-based emissions and the inventory, with close agreement throughout the timeseries. HFC-152a shows a strong and consistent decline, with all inversion results indicating a persistent decrease from 2013 onward. The inventory starts its intermittent decline in 2019. HFC-236fa and HFC-4310mee show no clear trends in the inversion estimates, which are characterised by large uncertainties owing to their low atmospheric abundances and weaker observational constraints. The inventories also show no clear long-term trends for these gases and generally report lower values than inferred from atmospheric observations.
The origin of the discrepancies between atmospheric observation-based and inventories estimates in north-western Europe for minor HFCs is difficult to attribute to specific countries, since their emissions can be challenging to infer from atmospheric data, and because some emissions are reported under aggregated “unspecified” HFC categories. Further work is needed to clarify these differences.
4.6 Total HFC
Total HFC emissions are obtained by aggregating GWP-weighted emissions derived for 11 individual species: HFC-134a, HFC-143a, HFC-125, HFC-32, HFC-152a, HFC-227ea, HFC-245fa, HFC-23, HFC-365mfc, HFC-236fa, and HFC-4310mee.
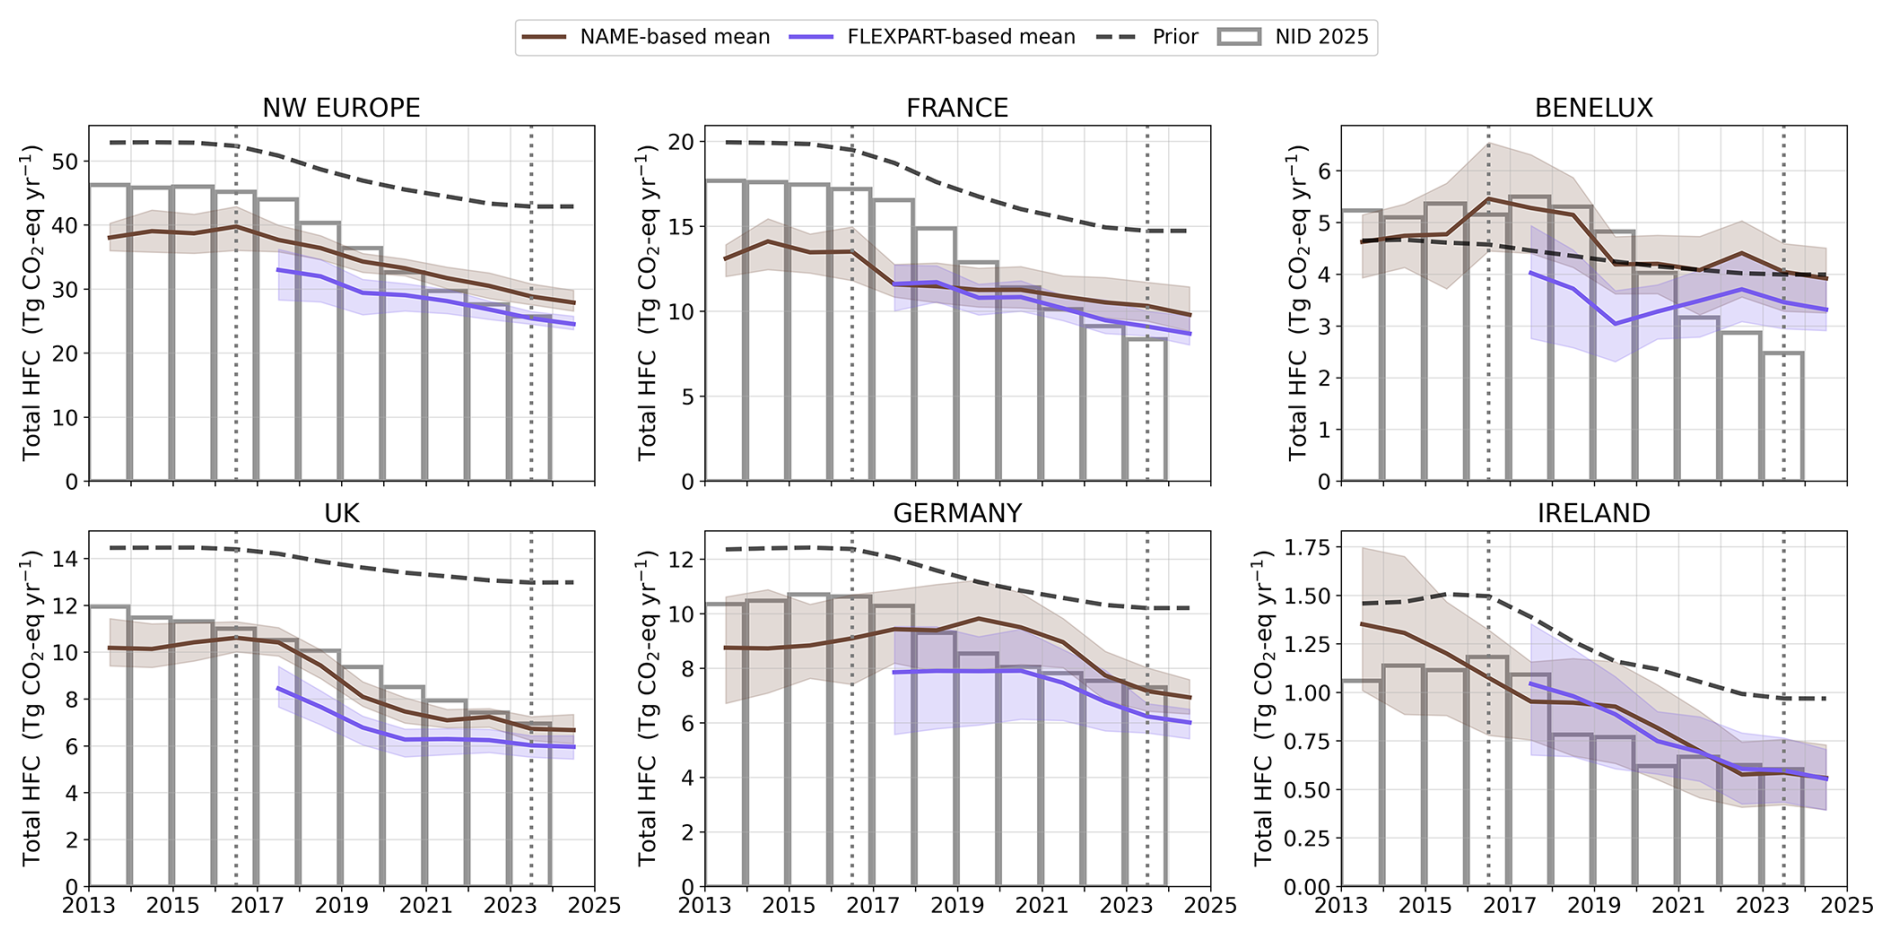
Figure 6Annual emissions of Total HFC for north-western Europe and subregions between 2013 and 2024 (aggregate of France, Germany, the UK, Belgium, the Netherlands, Luxembourg, and Ireland). Total HFC corresponds to the aggregation of HFC-134a, HFC-143a, HFC-125, HFC-32, HFC-152a, HFC-227ea, HFC-245fa, HFC-23, HFC-365mfc, HFC-236fa, and HFC-4310mee. Atmospheric inversion estimates are shown as the NAME-based mean (brown) and FLEXPART-based mean (purple), each representing the average of the InTEM, ELRIS, and RHIME inversion systems, with uncertainty ranges defined by the minimum and maximum of the 15.9 % and 84.1 % percentile, respectively, across the three models. Both means have been smoothed using a three-year moving average. The black dashed line indicates the prior emissions, and national inventory emissions submitted to the UNFCCC (2025 submission; NID 2025) are shown as grey outlined bars. The vertical dotted lines in 2016 and 2023 serve as visual guides for the discussion.
Total HFC emissions (inventory and atmospheric observation-based) in north-western Europe, presented in Fig. 6, are relatively stable through 2013–2016 before declining steadily from 2016 onward. This behaviour closely mirrors that of HFC-134a, the dominant contributor to regional HFC emissions, accounting for approximately 38 % of the total, based on 2023 atmospheric measurement-inferred emissions, followed by HFC-125 (31 %) and HFC-143a (18 %).
The NAME-based mean shows a plateau in 2013–2016, reaching 39.7 ± 3.4 Tg CO2-eq yr−1 in 2016, followed by a decrease of 27 % to 28.8 ± 1.6 Tg CO2-eq yr−1 in 2023. The FLEXPART-based mean declines between 2017 and 2023, similar to the NAME-based mean, but remaining slightly lower, with a 2023 estimate of 28.8 ± 1.6 Tg CO2-eq yr−1. The UNFCCC inventory shows the same general trend but at higher magnitudes in the early period, with emissions decreasing by 43 % from 45.2 to 25.7 Tg CO2-eq yr−1 between 2016 and 2023. Both the atmospheric observation-based and inventory trends clearly reflect the influence of the EU F-gas regulation and are consistent with Ludig et al. (2024), which reports that the EU remains on track with its HFC phase-down mandated under the regulation.
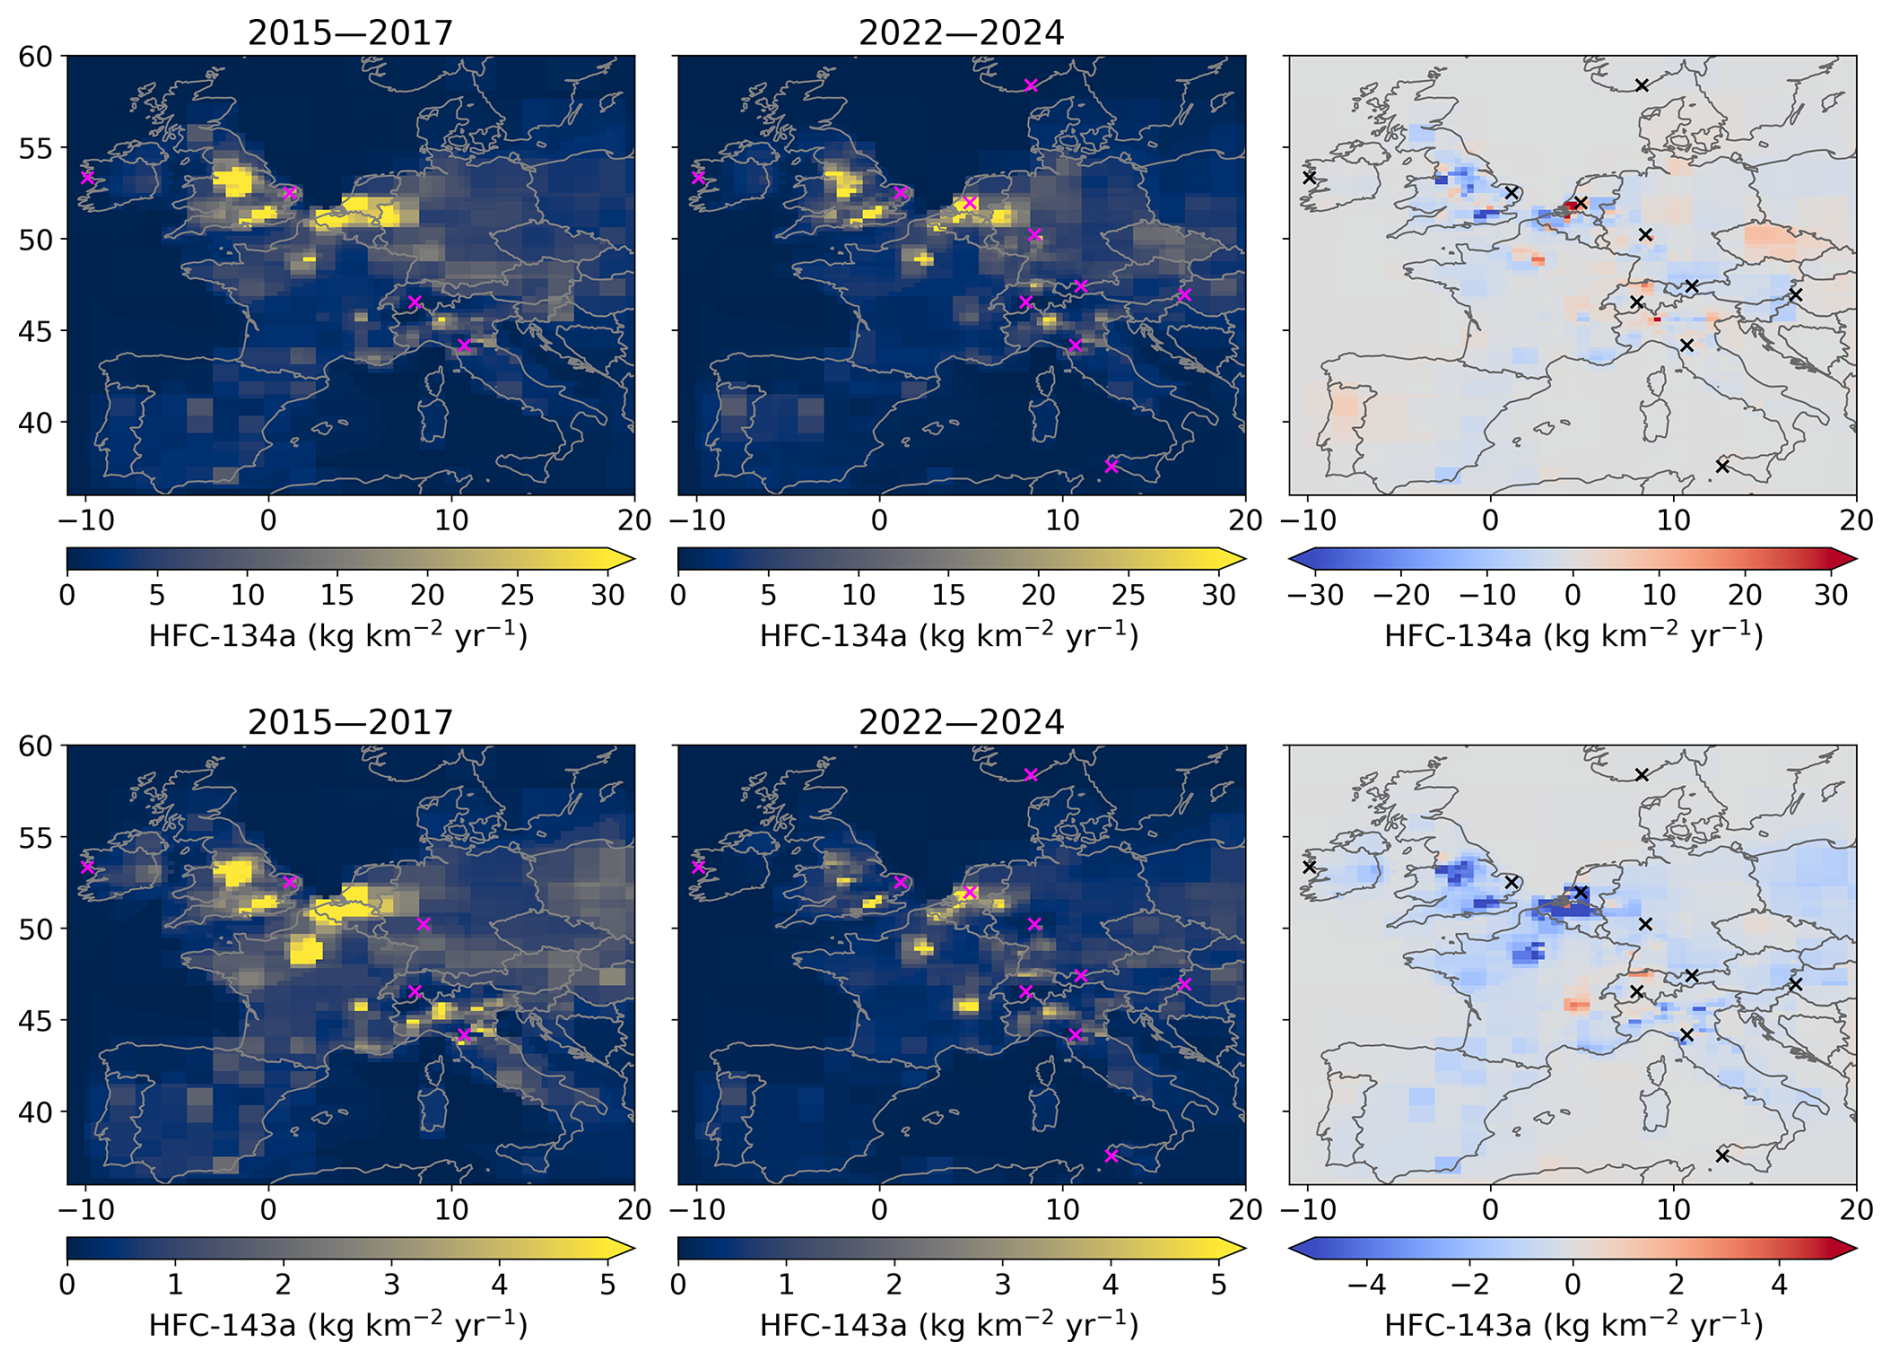
Figure 7Spatial distributions of the average modelled emissions of HFC-134a (top row) and HFC-143a (bottom row), during the periods 2015–2017 and 2022–2024, and the difference between these two periods; mean of all three models (InTEM, ELRIS, and RHIME) using the NAME transport model. Magenta and black crosses mark the locations of atmospheric measurement sites.
Country-level comparisons reveal that France and Germany account for most of the discrepancies between inversion-based and inventory estimates, particularly in the earlier years of the study period. In contrast, UK emissions are in close agreement throughout the timeseries, with the discrepancies noted in Manning et al. (2021) (InTEM estimates were on average 73 % of the 2020 inventory over 2008–2018) largely resolved following downward revisions in recent UK inventory submissions. The NAME-based mean for the UK decreases from 11.0 ± 0.7 Tg CO2-eq yr−1 in 2016 to 6.7 ± 0.5 Tg CO2-eq yr−1 in 2023, a reduction of 39 %. This closely matches the 37 % reduction reported in the inventory, from 11.0 to 6.9 Tg CO2-eq yr−1 over the same periods. Nevertheless, there is some discrepancies between the FLEXPART-based mean and the inventory from 2017 to 2021, with lower FLEXPART-based estimates, but both converge towards good agreement in the most recent years.
For Benelux, the NAME- and FLEXPART-based means show a slow declining trend (by about a tenth), whereas the inventory indicates that total HFC emissions have halved by 2023 compared to 2013. Irish emissions are small, with good consistency between inversion-based and inventory estimates.
Overall, both the atmospheric inversions and the inventories indicate a substantial regional decline in total HFC emissions since 2017, although inventories tend to estimate larger emissions in the earlier years compared to the atmospheric-based estimates. In addition to the influence of the EU F-gas Regulations, other external factors may also have affected the emission trends. One such factor is the COVID-19 pandemic (2020–2022), during which socioeconomic activity was reduced across much of Europe. Annadate et al. (2025) reported a reduction in inversion-derived HFC-134a emissions in the Po Basin in 2020, likely linked to mobility restrictions implemented during the pandemic. However, in our study, we find no clear or consistent evidence of a pandemic-related effect on regional HFC emissions.
Total HFC emissions from north-western Europe in 2023 represented 2 % of global emissions (1154 Tg CO2-eq yr−1; Table 2), with France as the largest contributor, followed by Germany, the UK, the Benelux countries, and Ireland.
Figures 7 and 8 show the spatial distribution of emissions of the four major HFCs (HFC-134a, HFC-143a, HFC-125, and HFC-32), averaged across the InTEM, ELRIS, and RHIME inverse models using the NAME transport model, for the periods 2015–2017 and 2022–2024, along with the corresponding differences between the two periods. This section focuses on regions that are best constrained by the monitoring network over the study period, including the UK, Ireland, Benelux, France, and Germany.
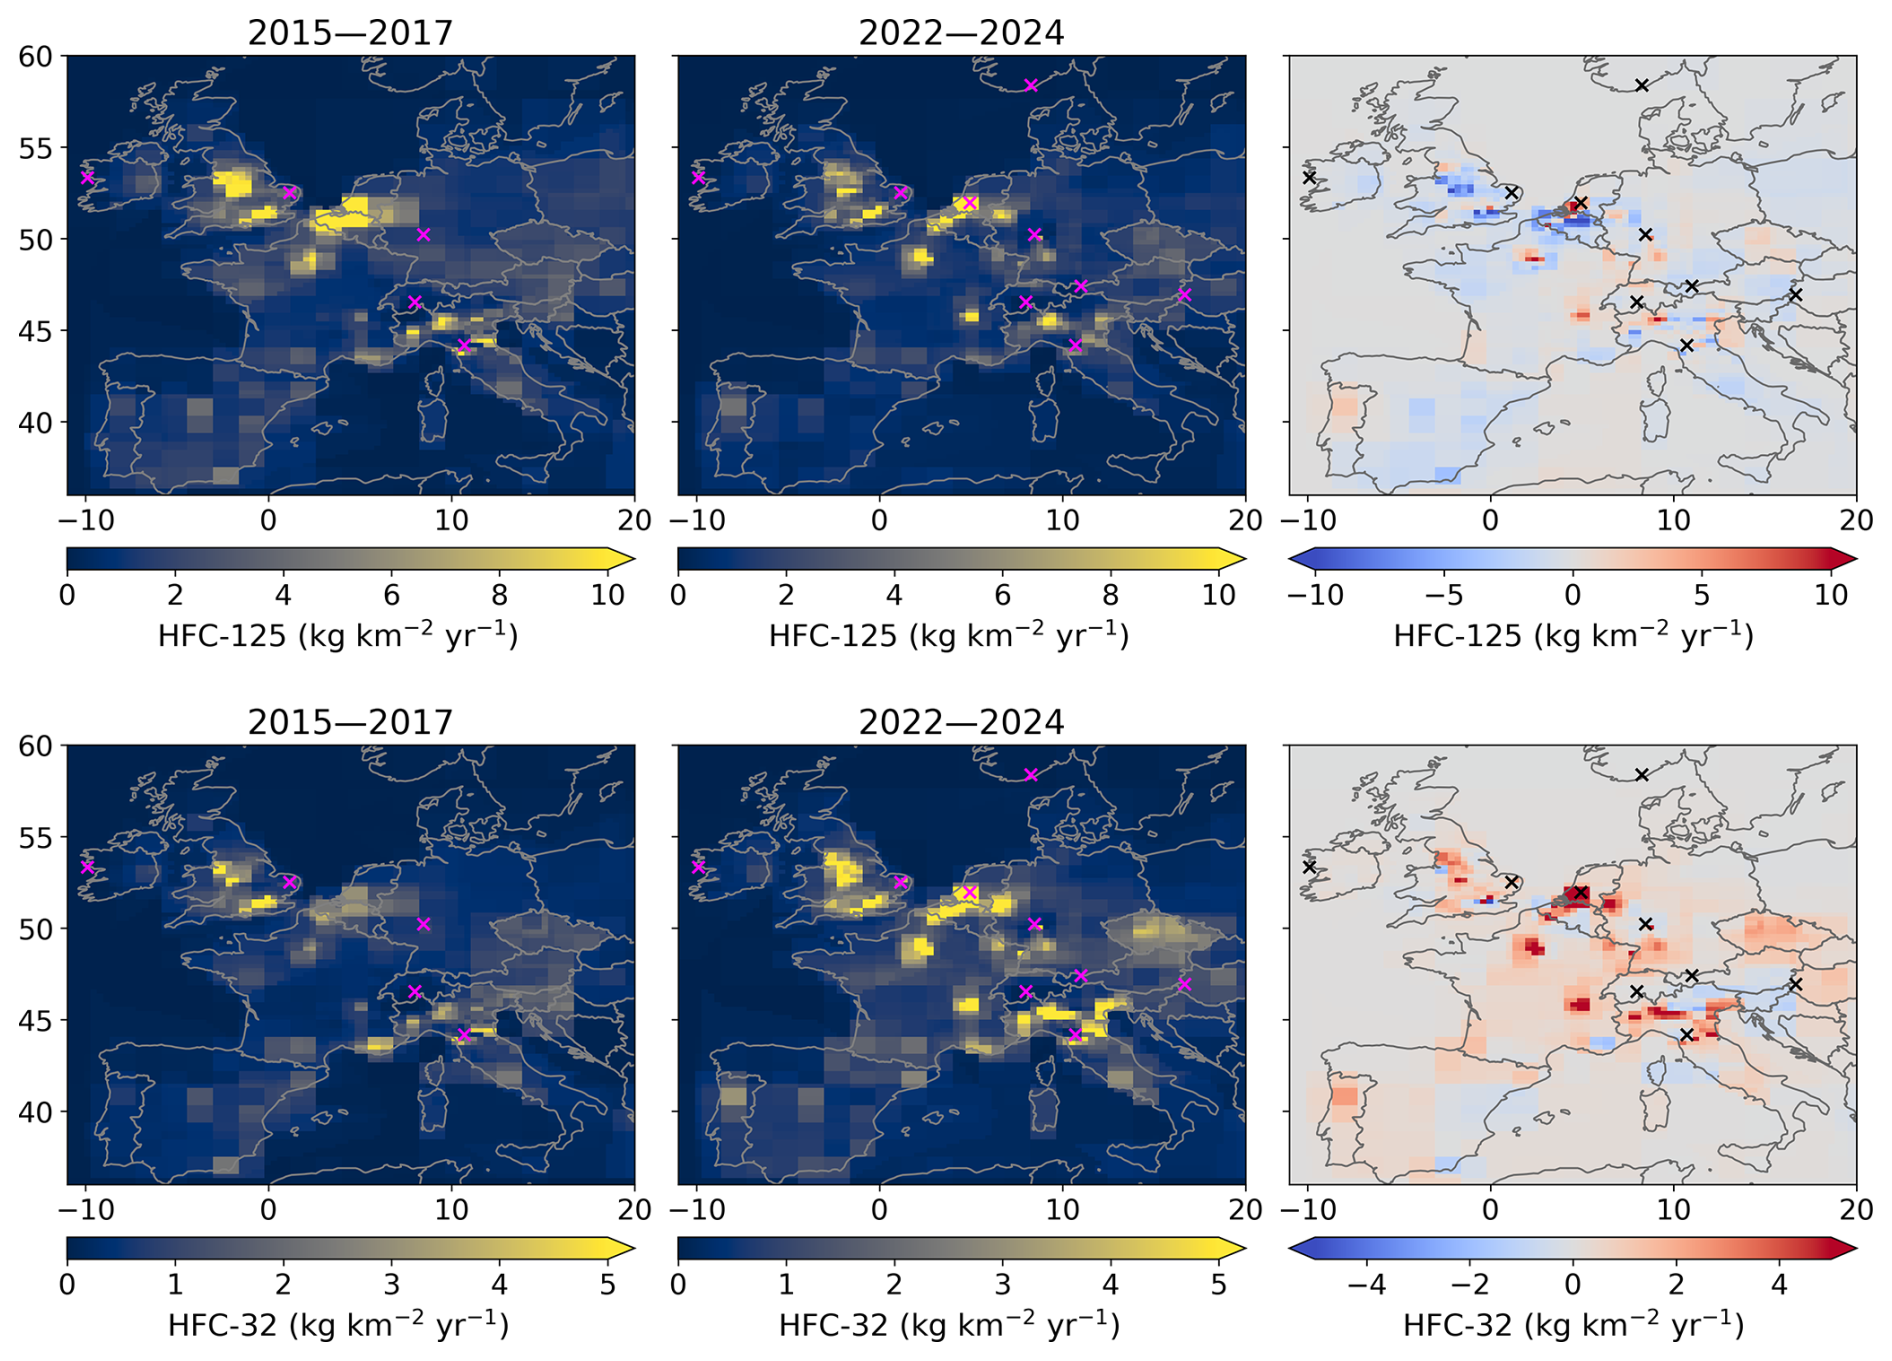
Figure 8Spatial distributions of the average modelled emissions of HFC-125 (top row) and HFC-32 (bottom row), during the periods 2015–2017 and 2022–2024, and the difference between these two periods; mean of all three models (InTEM, ELRIS, and RHIME) using the NAME transport model. Magenta and black crosses mark the locations of atmospheric measurement sites.
During the early period, emissions of all four species were concentrated around densely populated areas, consistent with patterns of refrigeration and air-conditioning demand. Seven years later, these hotspots remain visible but exhibit contrasting trends across species: emissions of the high-GWP HFCs (HFC-134a, HFC-143a, and HFC-125) decrease (blue in the difference map), while HFC-32 emissions increase (red in the difference map), reflecting again the ongoing transition away from high-GWP refrigerants toward lower-GWP alternatives. In the difference maps, however, some hotspots show an increase between the two periods, even for species with an overall decreasing trend. For example, in south-eastern France around Lyon, or along the western border between the Netherlands and Belgium. While these could reflect genuine local increases in emissions, they are also likely influenced by changes in spatial resolution resulting from the expansion of the measurement network.
The spatial distributions obtained using the FLEXPART transport model for the period 2022–2024 are shown in Figs. B1 and B2 in the Appendix, together with the NAME-based map and the difference between the two transport model-based results. Similar patterns are found in the 2022–2024 results using both transport models, with the FLEXPART-based inversions showing slightly lower emissions over densely populated regions (blue in the difference maps) and slightly higher emissions (red in the difference maps) near the monitoring stations.
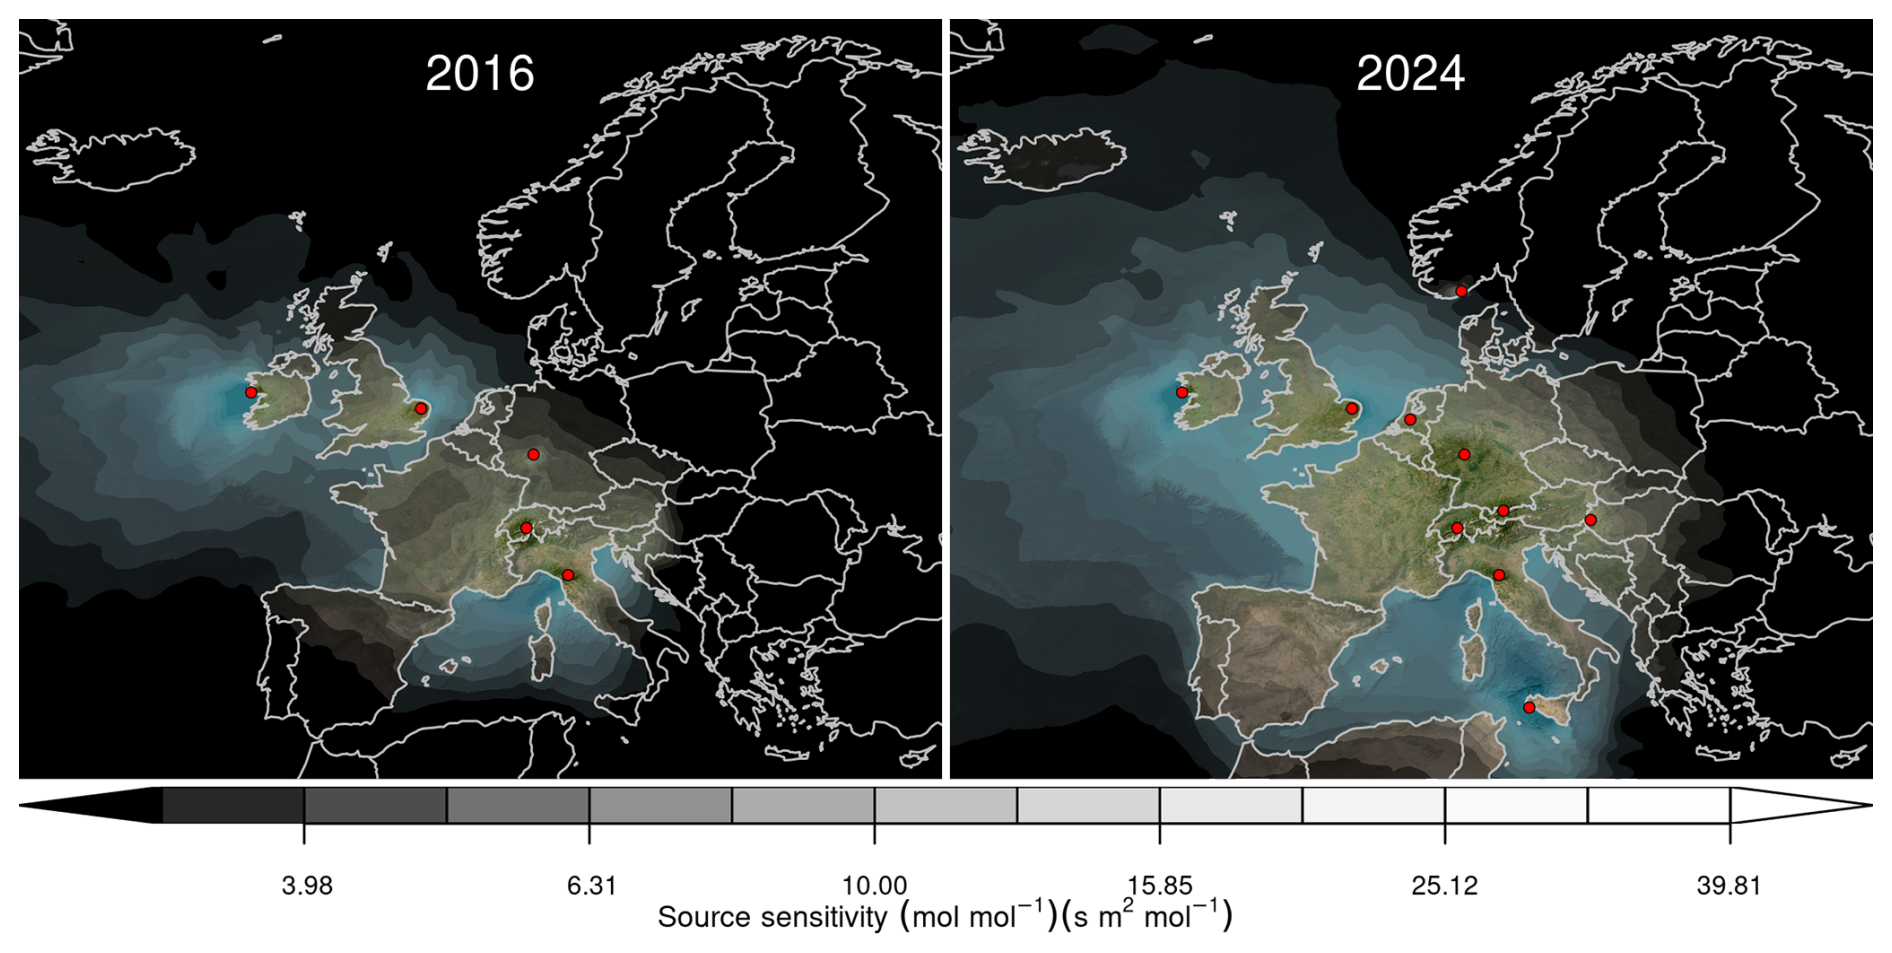
Figure 9Total source sensitivity to HFC-143a emissions as calculated by the NAME transport model for the year 2016 (left) and 2024 (right). Observing stations active in each year are marked as red dots. Areas with visible land surface represent regions for which emissions can be observed well from the network. Shaded or dark areas represent regions for which limited emission information can be obtained from the network.
At the beginning of the period of study in 2013, five operational measurement sites in Europe were monitoring HFCs (MHD, TAC, JFJ, CMN, and ZEP). Two additional sites were added in the following years: TOB (flask from 2015, high-frequency from 2018 and full AGAGE site since 2023, in Germany) and CBW (flask from 2021 in the Netherlands). Starting in 2023, the high-frequency site ZSF in Germany has been incorporated. For 2024, three more sites have contributed to HFC observations: one high-frequency site (CGR in Sicily) and two flask sites (HUN in Hungary and BIR in Norway). Together, these additions improve the spatial coverage and provide the inversions with more observational constraints. Figure 9 illustrates how total source sensitivity for HFC-143a changed between 2016 and 2024, with the expanded monitoring network improving both in regions that were already partially constrained and in areas that were previously poorly constrained, particularly in southern and eastern Europe.
To evaluate the influence of these new stations on 2023–2024 inferred emissions, we conducted sensitivity inversions for HFC-134a and HFC-143a for the year 2024, removing these four newly added sites. The analysis is limited to these two gases because CGR does not provide observations for HFC-32 or HFC-125. Figure 10 compares emissions derived using the reduced “7-site network” with those obtained from the “expanded network”, using the NAME transport model. The comparison focuses on Italy, Hungary, and southern Germany where the stations are implemented; Norway is not discussed because BIR only began operating in November 2024, and thus its current record is too short to assess its impact.
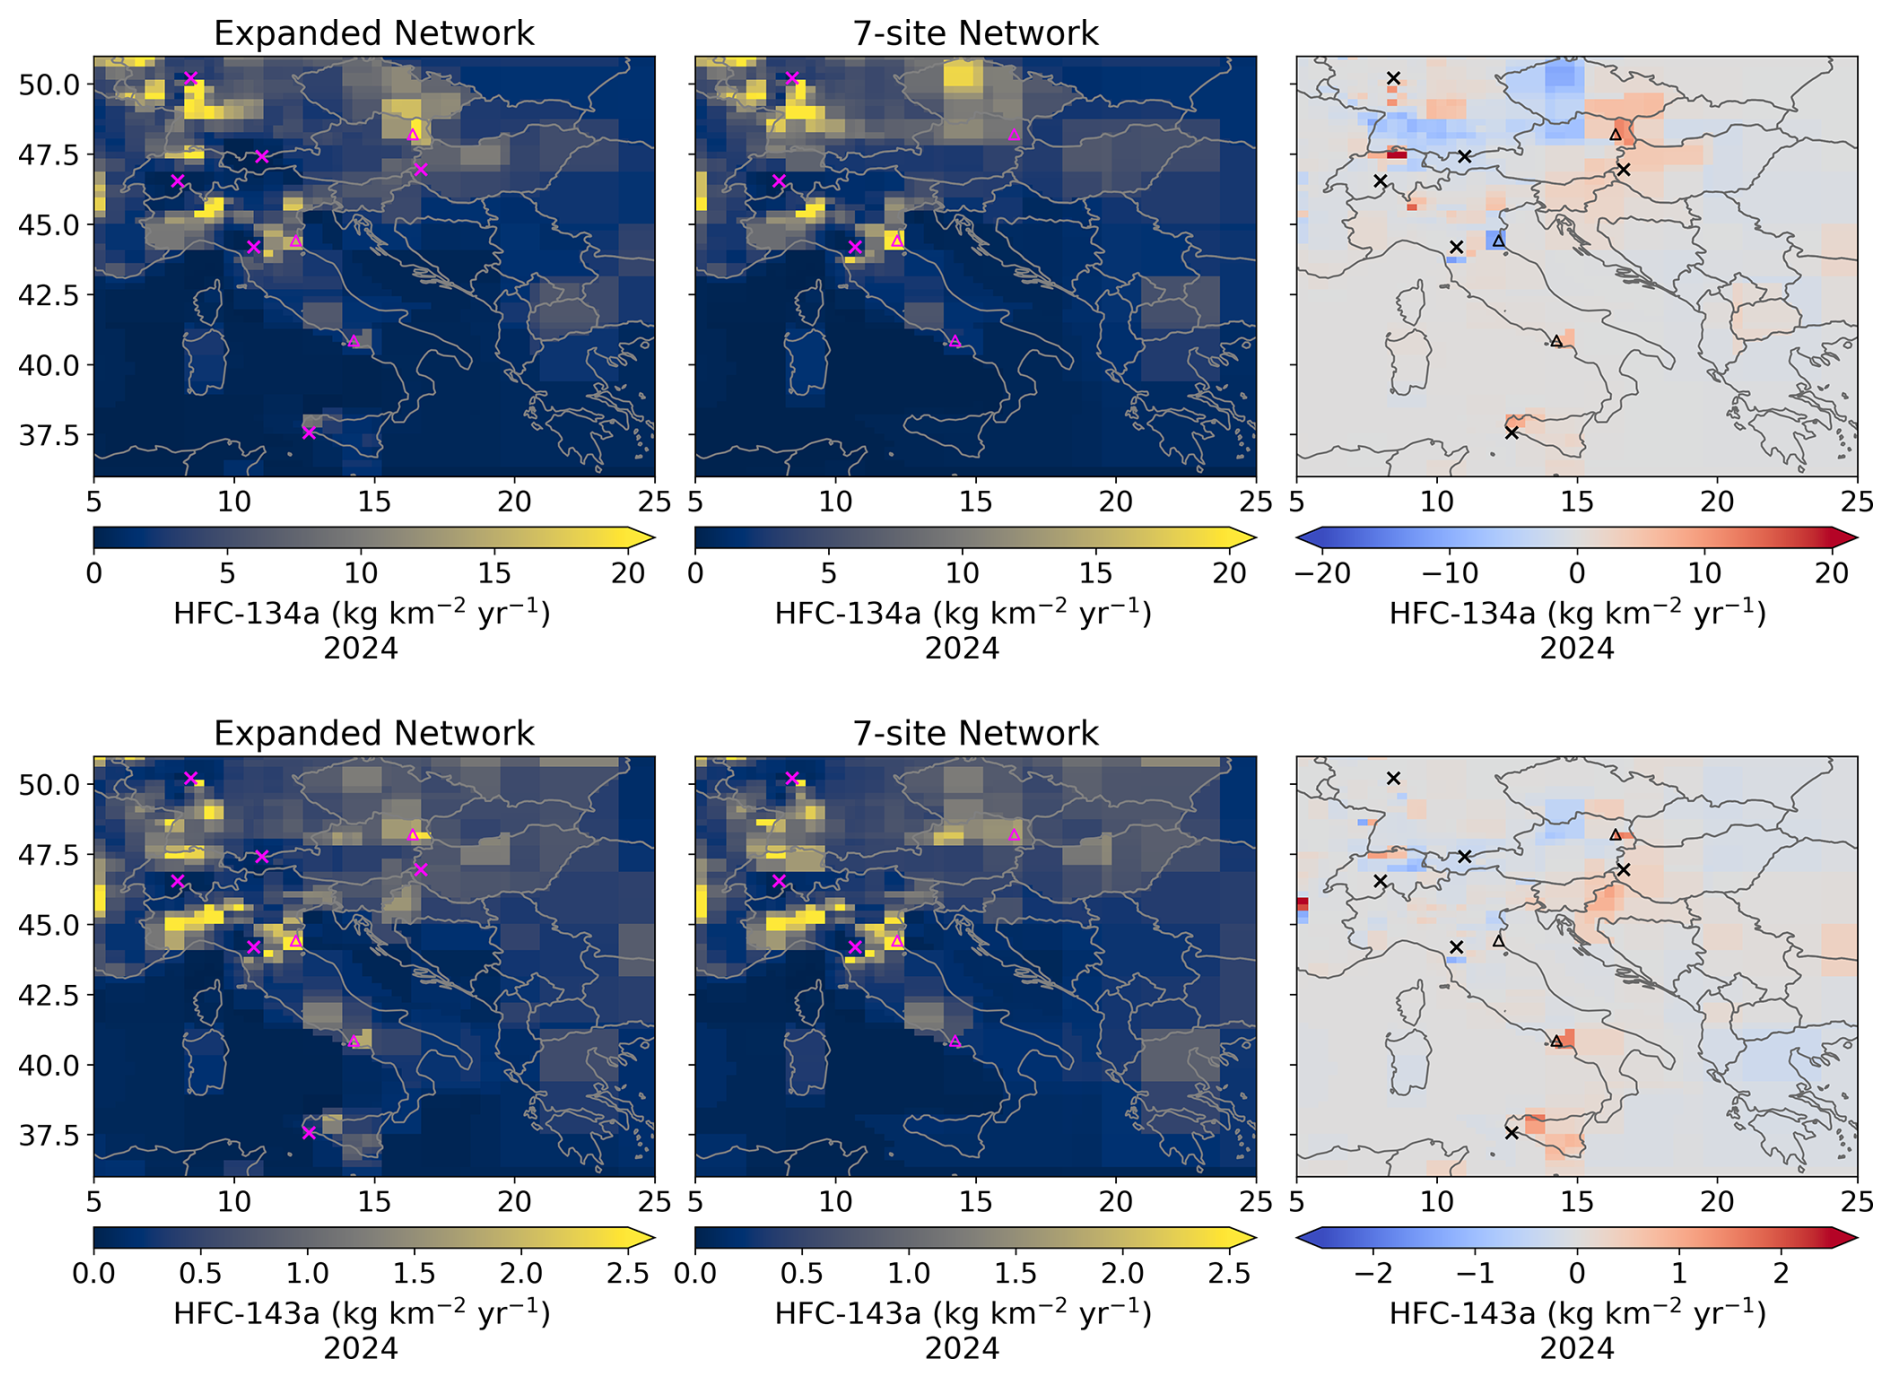
Figure 10Impact of newly added measurement sites (ZSF, CGR, HUN, and BIR) on the spatial distribution of inferred HFC-134a (top panels) and HFC-143a (bottom panels) emissions for 2024. Each map shows the mean emissions from the InTEM, ELRIS, and RHIME inverse models using the NAME transport model. The Expanded Network (left column) includes all available sites (MHD, CMN, JFJ, TAC, CBW, TOB, ZEP, ZSF, CGR, HUN, and BIR), while the 7-site Network (middle column) excludes the four new stations. The right column shows the spatial differences between the two network combinations. Magenta and black crosses mark the locations of atmospheric measurement sites. Triangles mark the locations of Naples (Italy), the Port of Ravenna (Italy) and Vienna (Austria).
The expanded network produces clearer spatial attribution in several regions. In particular, the CGR site substantially enhances sensitivity in southern Europe in 2024, enabling the detection of HFC-134a and HFC-143a emissions over Sicily and strengthening a hotspot over Naples that is less apparent when CGR is excluded. In contrast, emissions from the Po Valley region and the Port of Ravenna are already well resolved in our inversions regardless of whether CGR is included, owing to the long-standing CMN and JFJ measurements that provide strong observational constraints in northern Italy. Annadate et al. (2025) likewise identified substantial HFC-134a emissions in the Po Valley, using an inverse modelling framework based on four stations (MHD, TAC, JFJ, CMN) and FLEXPART source sensitivities, and also reported additional hotspots over several major Italian cities including Naples, in their 2022 emission maps.
Similarly, the HUN flask site and the ZSF site improve localisation of emissions in Vienna and the surrounding central European region. Although emissions in this area were previously diffuse or weakly constrained, the addition of HUN and ZSF allow Vienna to emerge more distinctly as a detectable source region, highlighting the value of an increased observational density for spatially resolving regional-scale emissions. The addition of ZSF also impacts the area around southern Germany, increasing emissions at the Swiss-German border, particularly for HFC-134a.
Comparable results using the FLEXPART transport model are shown in Fig. B3, with similar impacts detected for CGR and ZSF, although the effect of HUN is less pronounced.
At this stage, the short data records available from these new stations limit our ability to assess their impact on country-level emission estimates. Nevertheless, these initial results demonstrate the value of the expanded network showing that additional sites both extend the geographical reach of atmospheric observation-based emission estimates and strengthen the constraints in regions already monitored. Future measurements will be needed before robust impacts on inversion results and country-level trends can be quantified.
Overall, expanding the European measurement network represents a crucial step toward improving the robustness of atmospheric HFC emission estimates and enhancing independent verification of national inventories, ultimately enabling more comprehensive trend assessments beyond north-western Europe.
We have presented a comprehensive assessment of emissions of eleven HFCs across north-western Europe for the period 2013–2024, using an atmospheric measurement network of eleven stations combined with three inversion systems and two atmospheric transport models. Our results show that emissions of total HFC, HFC-134a, HFC-125 and HFC-143a have steadily decreased over this period, reflecting the impact of the implementation of EU F-gas regulations and the gradual phase-down of high-GWP substances, while HFC-32 emissions have increased due to its adoption as a lower-GWP alternative. Inverse emission estimates derived from atmospheric measurements generally agree with the reported national inventories, although discrepancies remain for specific compounds and individual countries. Notably, France and Germany show divergences for HFC-134a and HFC-125 in the earlier period (2013–2016), and France for HFC-143a in recent years (2022–2023). Substantial inconsistencies also arise for several minor HFCs including HFC-23, HFC-227ea, and HFC-245fa, reflecting both modelling and reporting challenges. Further investigation is needed to resolve these discrepancies. Although the individual inversion frameworks produce broadly consistent estimates, a more comprehensive intercomparison remains an important area for further study, particularly for understanding the differences between inversions using the two transport models considered in this study. Spatial distributions highlight that the highest emissions are concentrated in densely populated areas, emphasising the importance of a well-distributed observation network to capture regional variations. The recent expansion of the European measurement network in 2023–2024 with additional high-frequency and flask sites offers further potential to improve emission estimates beyond north-western Europe, although the results are still preliminary due to the short data record available. Overall, this study demonstrates the value of combining atmospheric observations with multiple inversion frameworks to provide independent, timely, and spatially resolved emission estimates, which are crucial for verifying national inventories, assessing compliance with climate regulations, and guiding future mitigation strategies. Continued network growth, longer measurement records, and further refinement of inversion methodologies will be essential to reduce uncertainties and enhance the resolution of inversion emission assessments of HFCs.
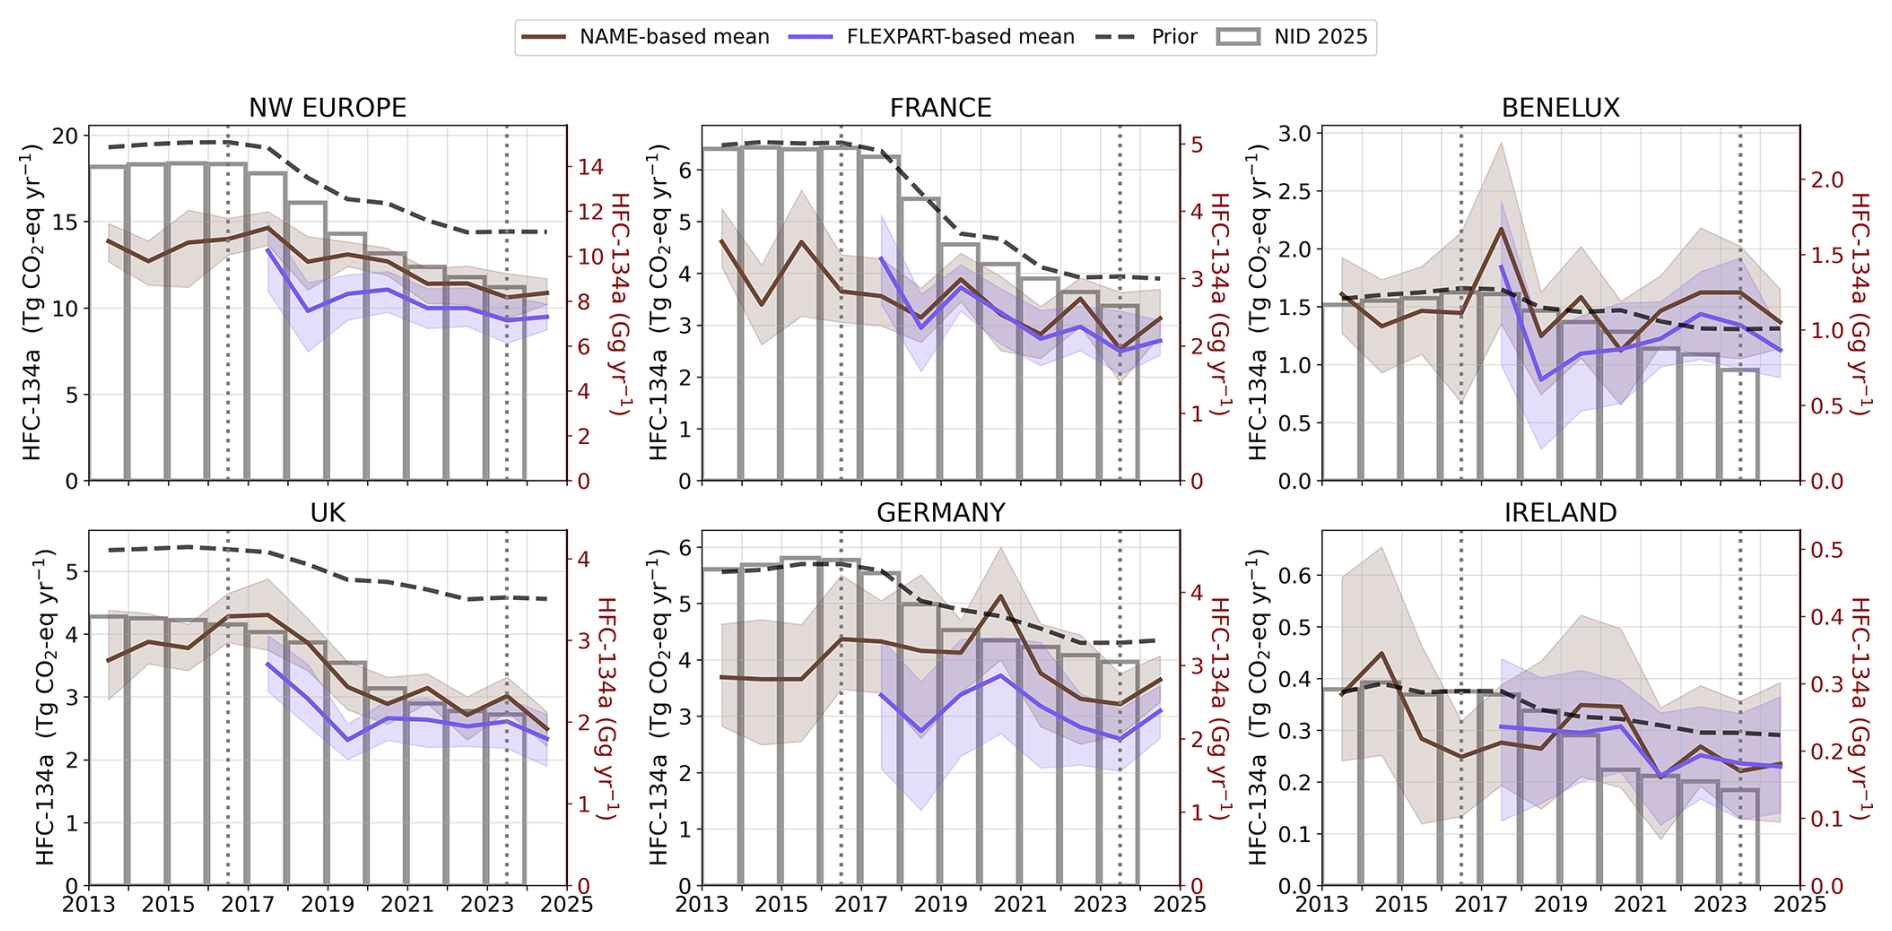
Figure A1Annual HFC-134a emissions for north-western Europe and its subregions (France, Benelux = Belgium–Netherlands–Luxembourg, UK, Germany, Ireland) from 2013 to 2024. Atmospheric inversion estimates are shown as the NAME-based mean (brown) and FLEXPART-based mean (purple), each representing the average of the InTEM, ELRIS, and RHIME inversion systems from Fig. A2, with uncertainty ranges defined by the minimum and maximum of the 15.9 % and 84.1 % percentile, respectively, across the three models. Compared to Fig. 1, no smoothing has been applied to the means. The black dashed line indicates the prior emissions, and national inventory emissions submitted to the UNFCCC (2025 submission; NID 2025) are shown as grey outlined bars. The vertical dotted lines in 2016 and 2023 serve as visual guides for the discussion.
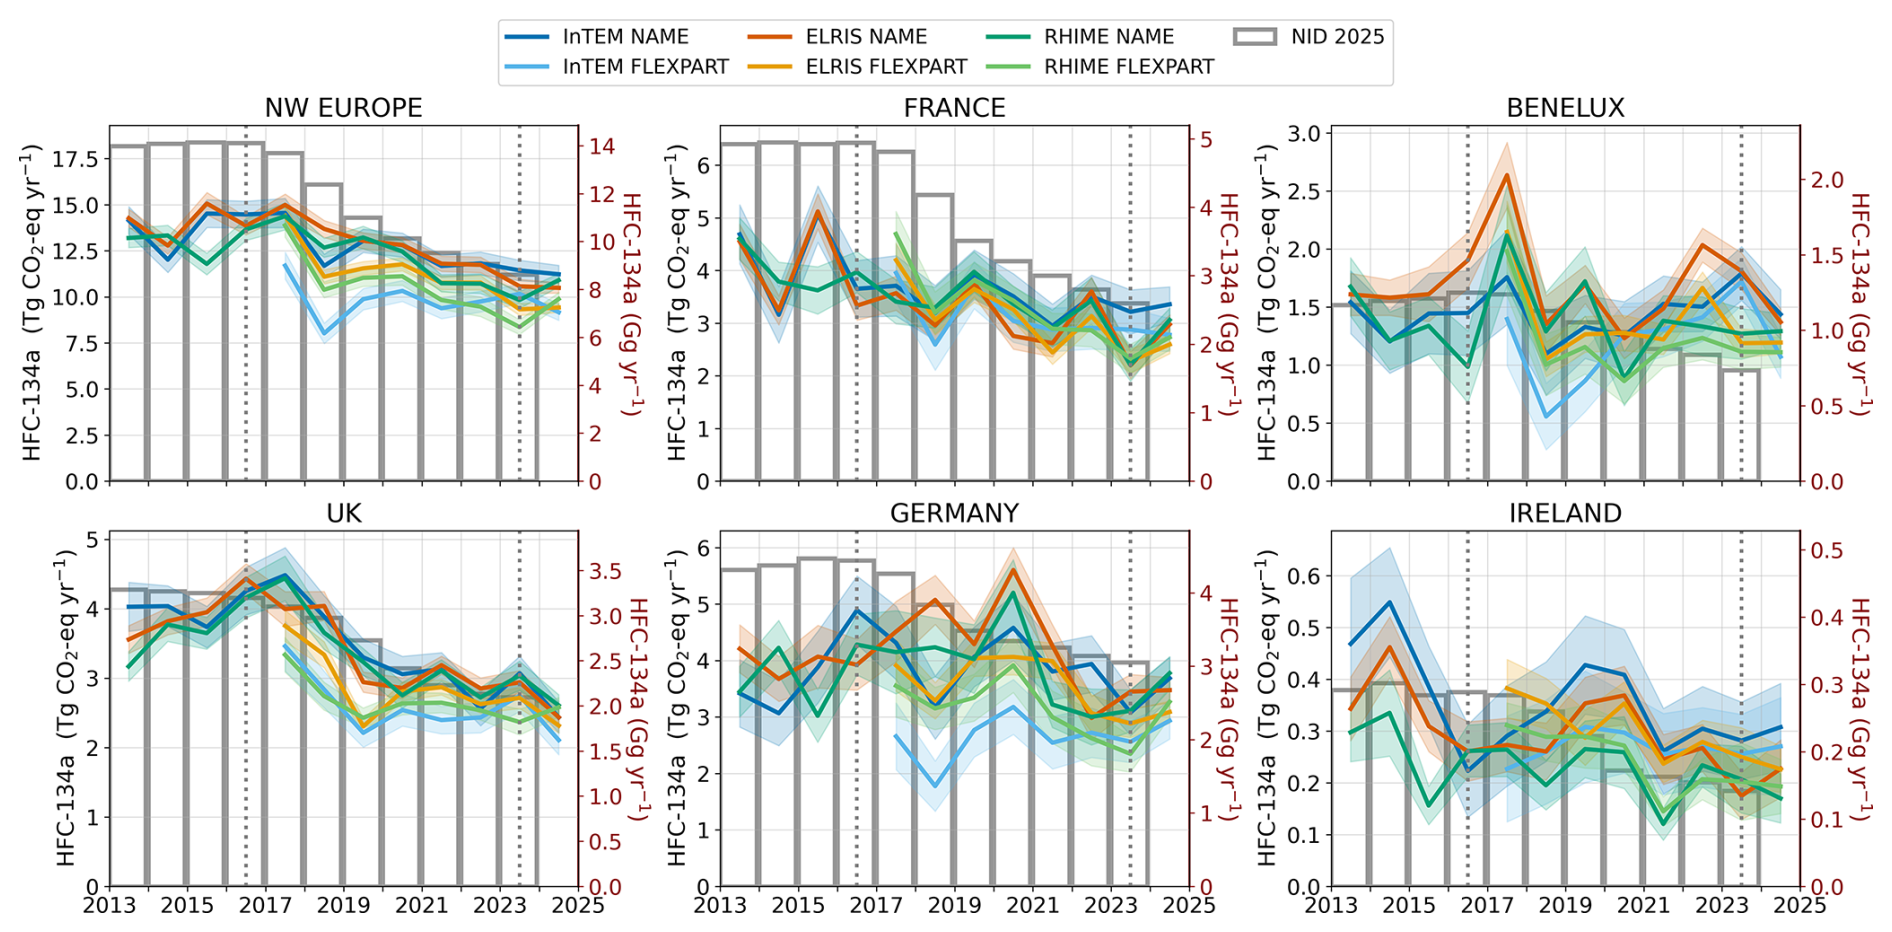
Figure A2Annual HFC-134a emissions for north-western Europe and its subregions (France, Benelux = Belgium–Netherlands–Luxembourg, UK, Germany, Ireland) from 2013 to 2024. Atmospheric inversion estimates are shown from InTEM (blue), ELRIS (orange), and RHIME (green), each with NAME (dark) and FLEXPART (light) transport models. National inventory emissions submitted to the UNFCCC (2025 submission; NID 2025) are shown as grey outlined boxes. The vertical dotted lines in 2016 and 2023 serve as visual guides for the discussion.
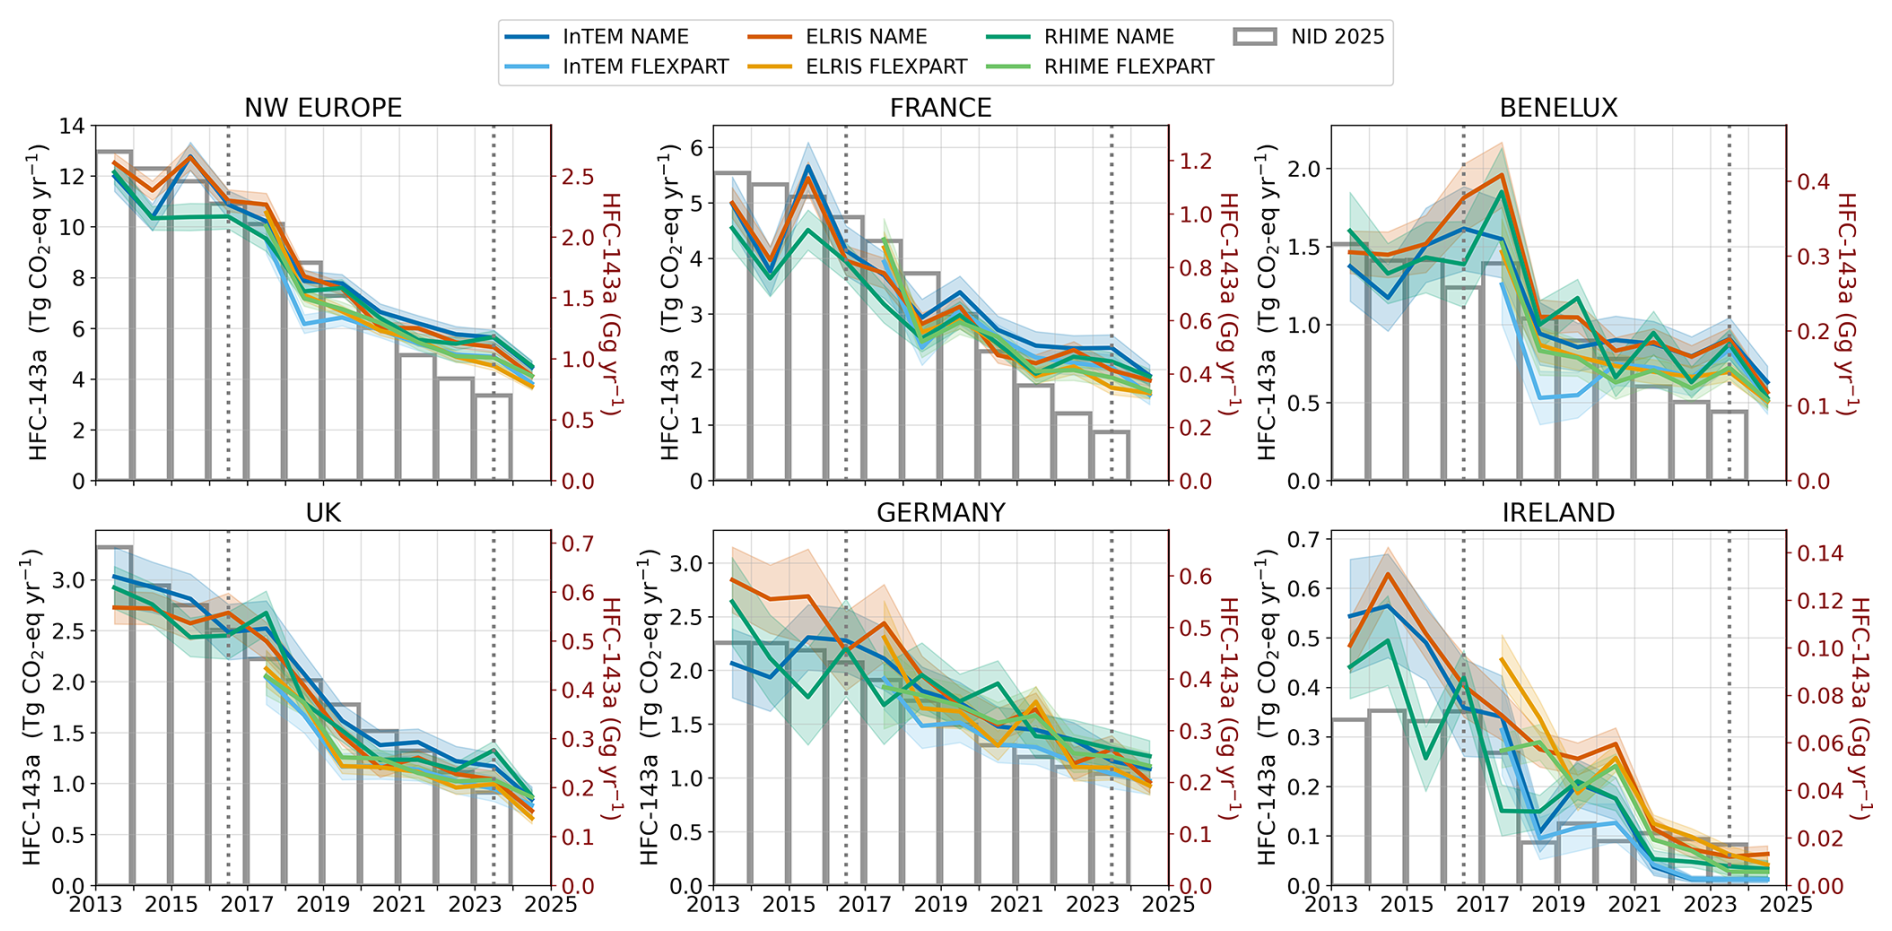
Figure A3Annual HFC-143a emissions for north-western Europe and its subregions (France, Benelux = Belgium–Netherlands–Luxembourg, UK, Germany, Ireland) from 2013 to 2024. Atmospheric inversion estimates are shown from InTEM (blue), ELRIS (orange), and RHIME (green), each with NAME (dark) and FLEXPART (light) transport models. National inventory emissions submitted to the UNFCCC (2025 submission; NID 2025) are shown as grey outlined bars. The vertical dotted lines in 2016 and 2023 serve as visual guides for the discussion.
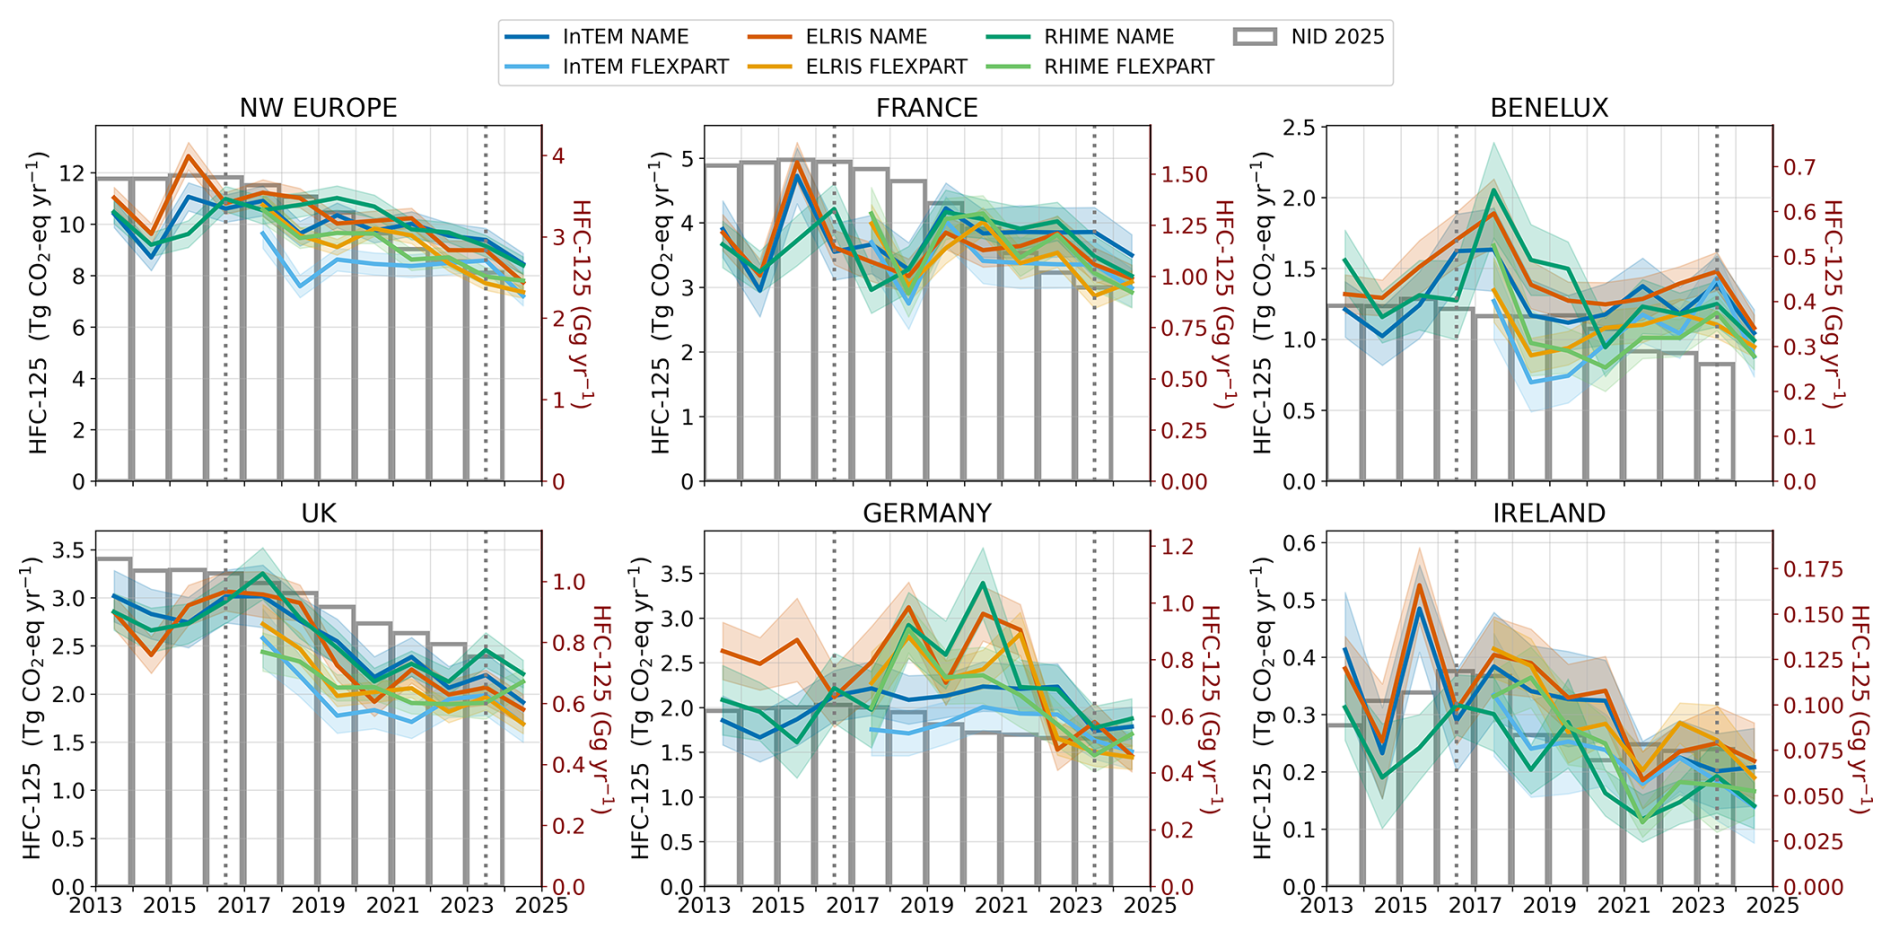
Figure A4Annual HFC-125 emissions for north-western Europe and its subregions (France, Benelux = Belgium–Netherlands–Luxembourg, UK, Germany, Ireland) from 2013 to 2024. Atmospheric inversion estimates are shown from InTEM (blue), ELRIS (orange), and RHIME (green), each with NAME (dark) and FLEXPART (light) transport models. National inventory emissions submitted to the UNFCCC (2025 submission; NID 2025) are shown as grey outlined bars. The vertical dotted lines in 2016 and 2023 serve as visual guides for the discussion.
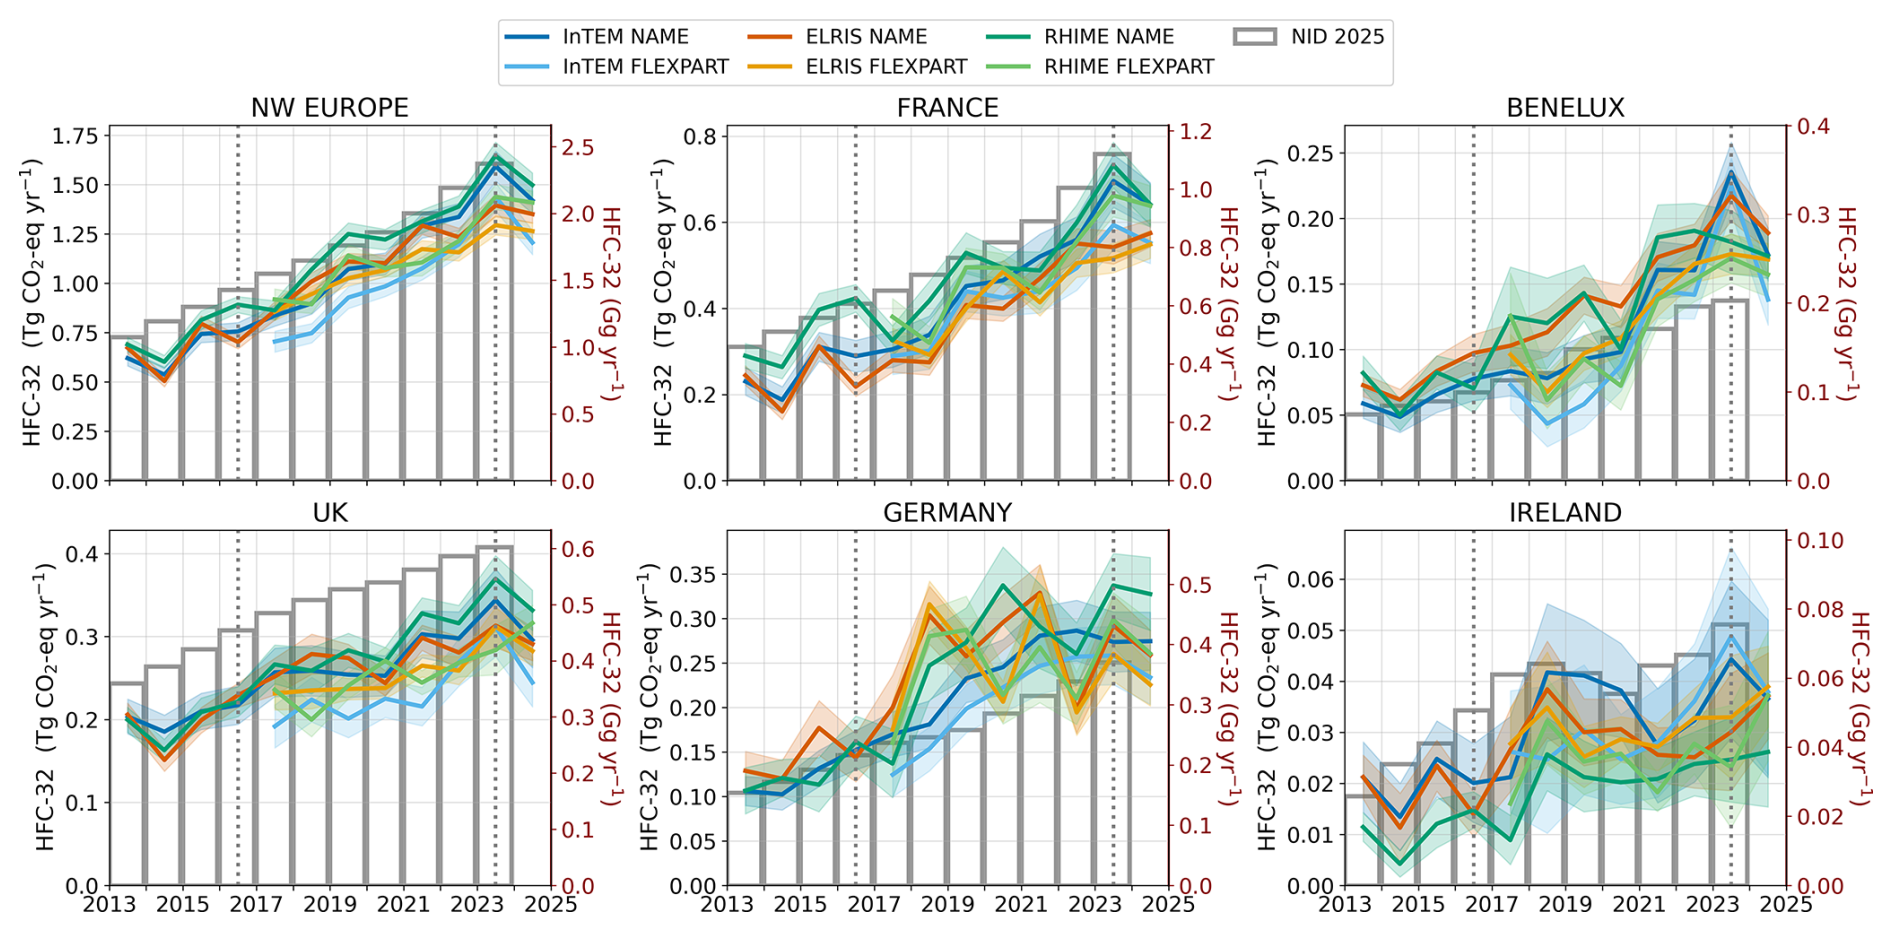
Figure A5Annual HFC-32 emissions for north-western Europe and its subregions (France, Benelux = Belgium–Netherlands–Luxembourg, UK, Germany, Ireland) from 2013 to 2024. Atmospheric inversion estimates are shown from InTEM (blue), ELRIS (orange), and RHIME (green), each with NAME (dark) and FLEXPART (light) transport models. National inventory emissions submitted to the UNFCCC (2025 submission; NID 2025) are shown as grey outlined bars. The vertical dotted lines in 2016 and 2023 serve as visual guides for the discussion.
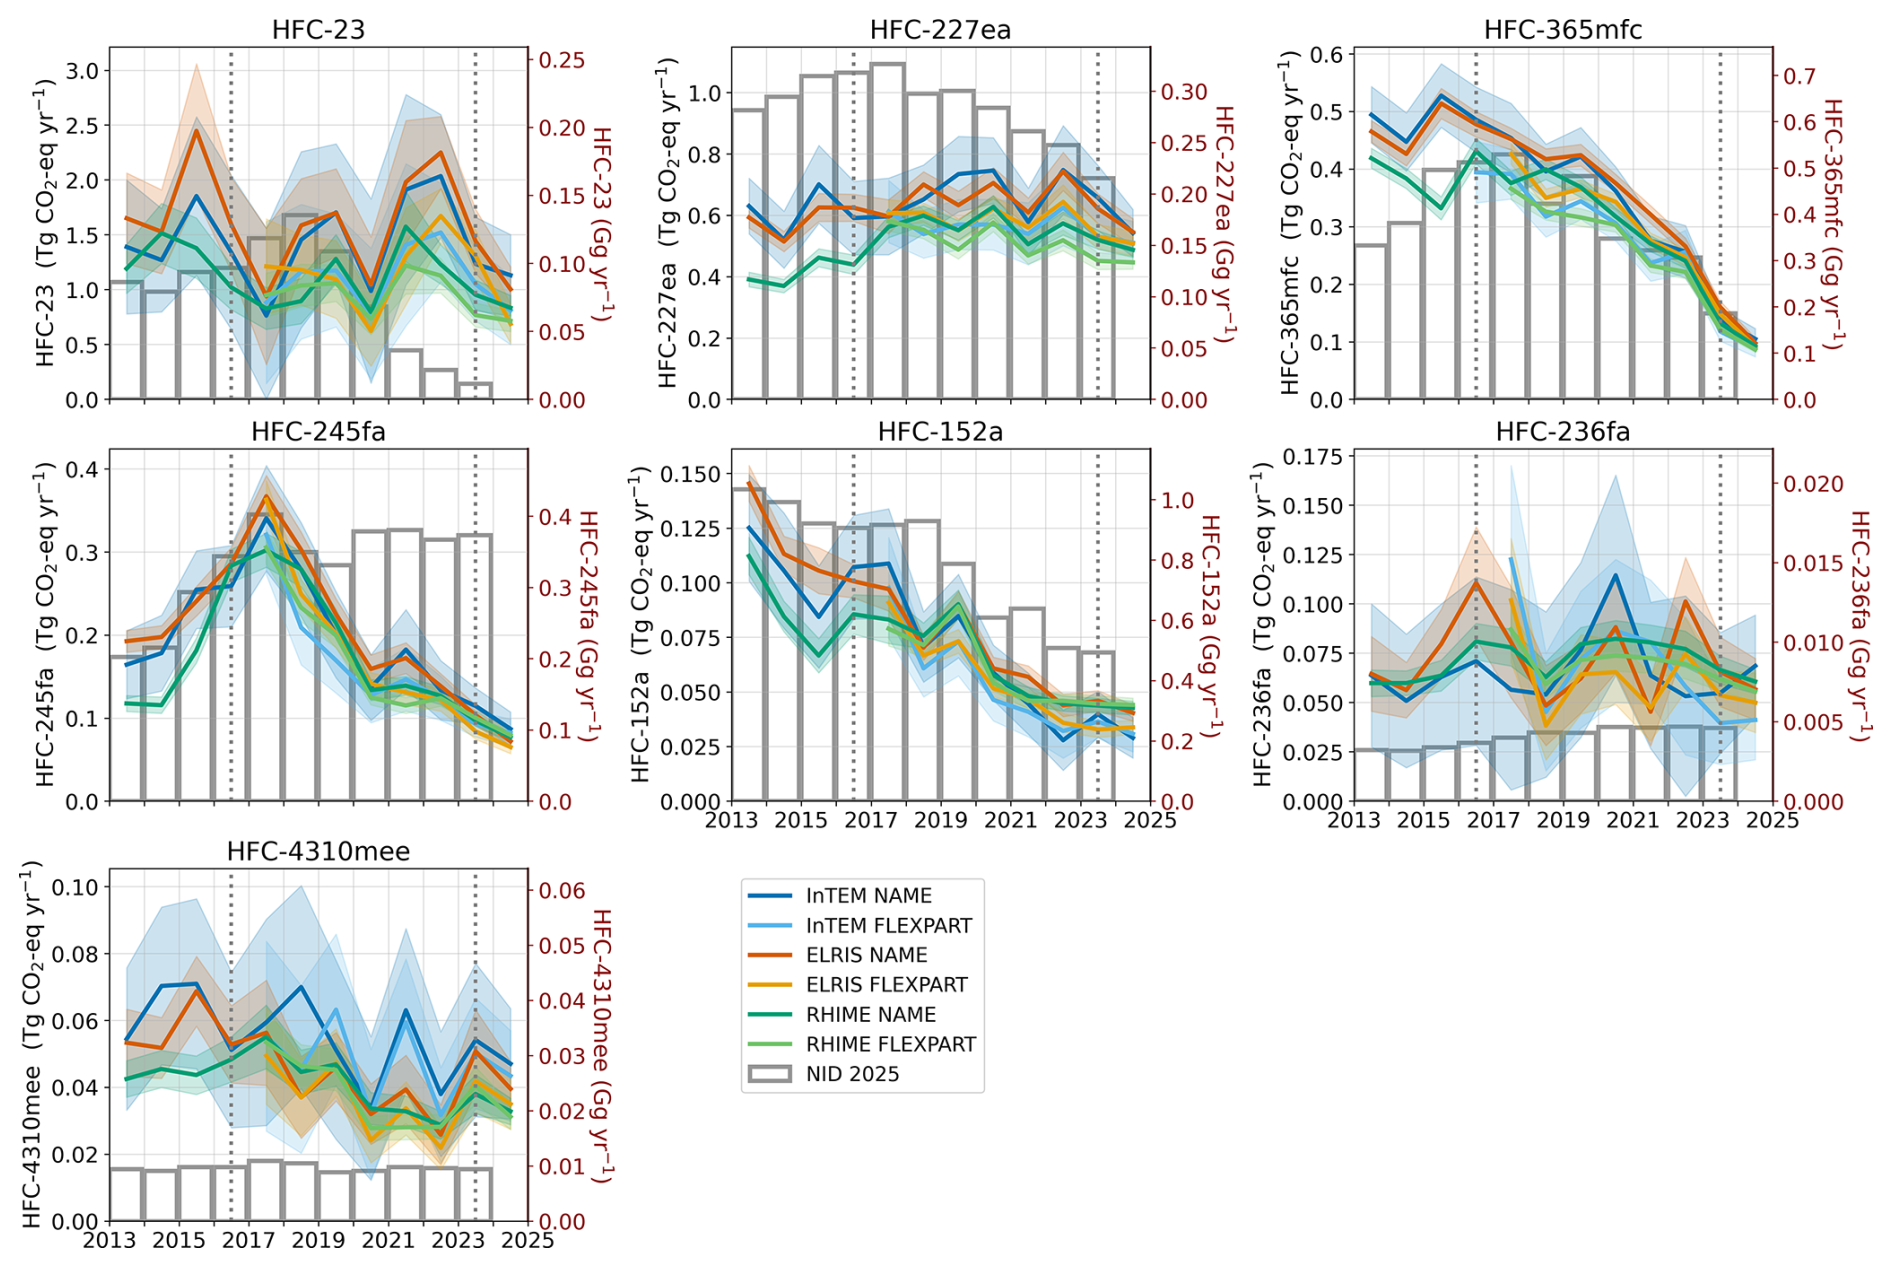
Figure A6Annual emissions from 2013 to 2024 of HFC-23, HFC-227ea, HFC-365mfc, HFC-245fa, HFC-152a, HFC-236fa, and HFC-4310mee for north-western Europe (aggregate of France, Germany, the UK, Belgium, the Netherlands, Luxembourg, and Ireland). Atmospheric inversion estimates are shown from InTEM (blue), ELRIS (orange), and RHIME (green), each with NAME (dark) and FLEXPART (light) transport models. National inventory emissions submitted to the UNFCCC (2025 submission; NID 2025) are shown as grey outlined bars. The vertical dotted lines in 2016 and 2023 serve as visual guides for the discussion.
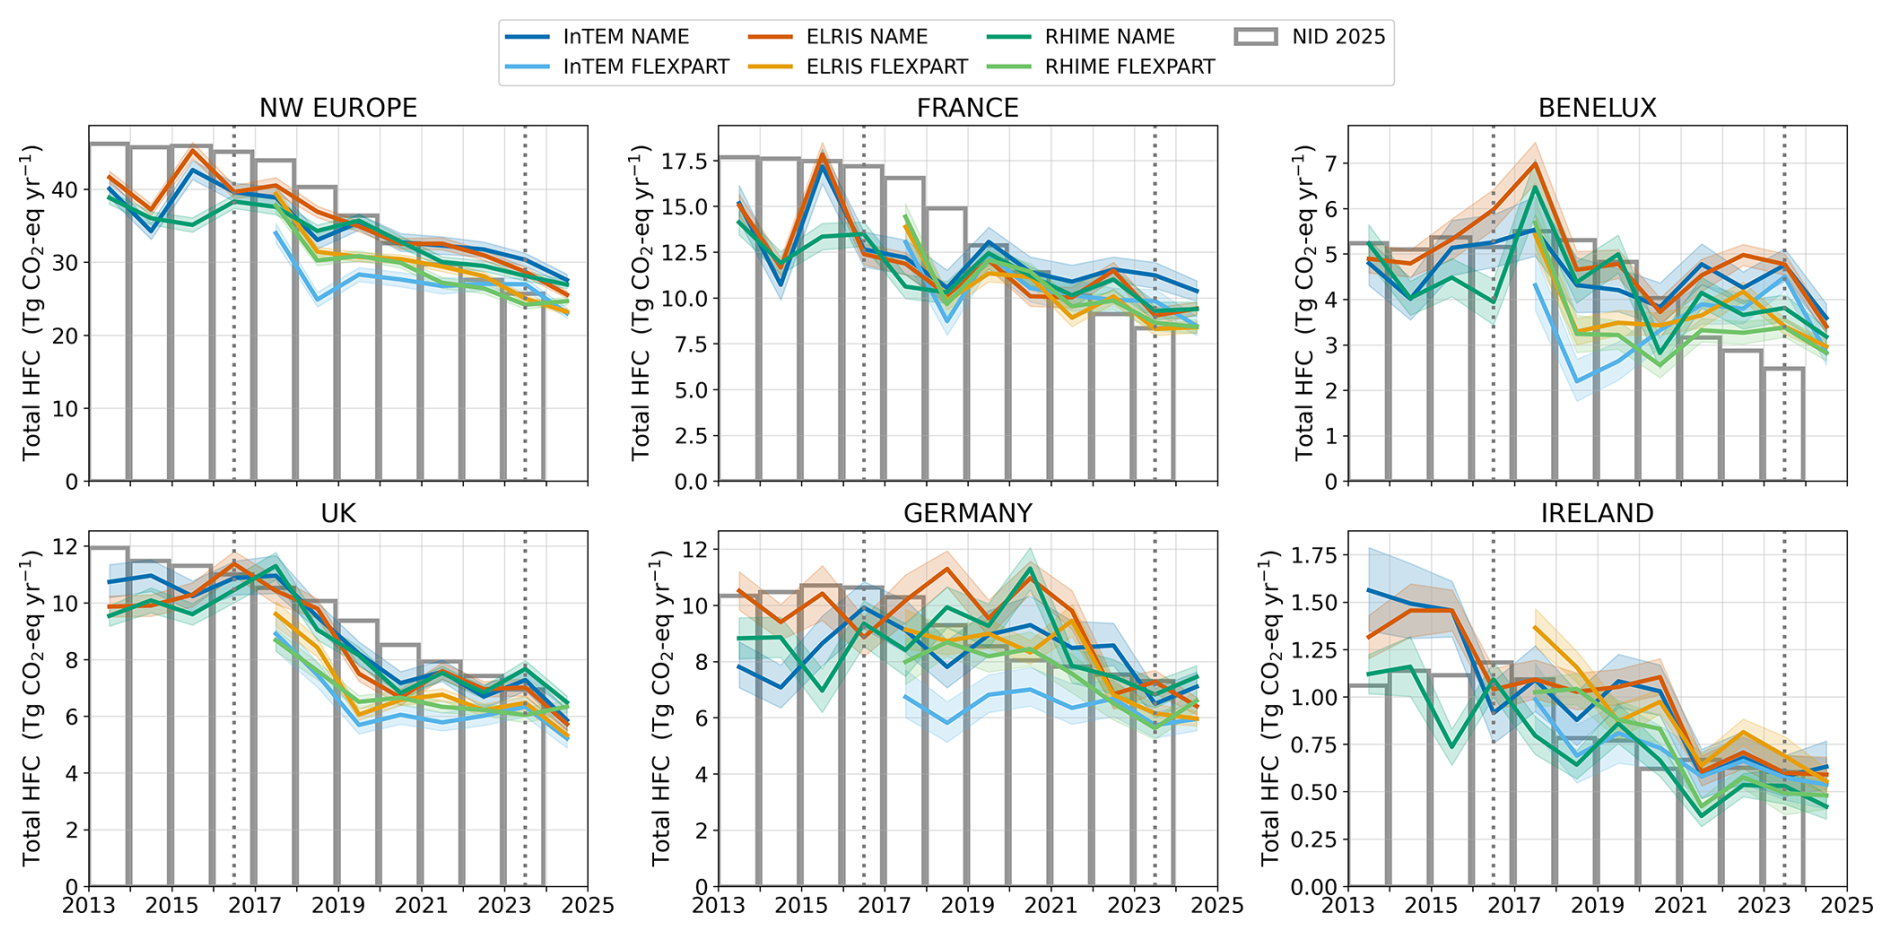
Figure A7Annual emissions of Total HFC for north-western Europe and subregions (France, Benelux = Belgium–Netherlands–Luxembourg, UK, Germany, Ireland) between 2013 and 2024. Total HFC corresponds to the aggregation of HFC-134a, HFC-143a, HFC-125, HFC-32, HFC-152a, HFC-227ea, HFC-245fa, HFC-23, HFC-365mfc, HFC-236fa, and HFC-4310mee. Atmospheric inversion estimates are shown from InTEM (blue), ELRIS (orange), and RHIME (green), each with NAME (dark) and FLEXPART (light) transport models. National inventory emissions submitted to the UNFCCC (2025 submission; NID 2025) are shown as grey outlined bars. The vertical dotted lines at 2016 and 2023 serve as visual guides for the discussion.
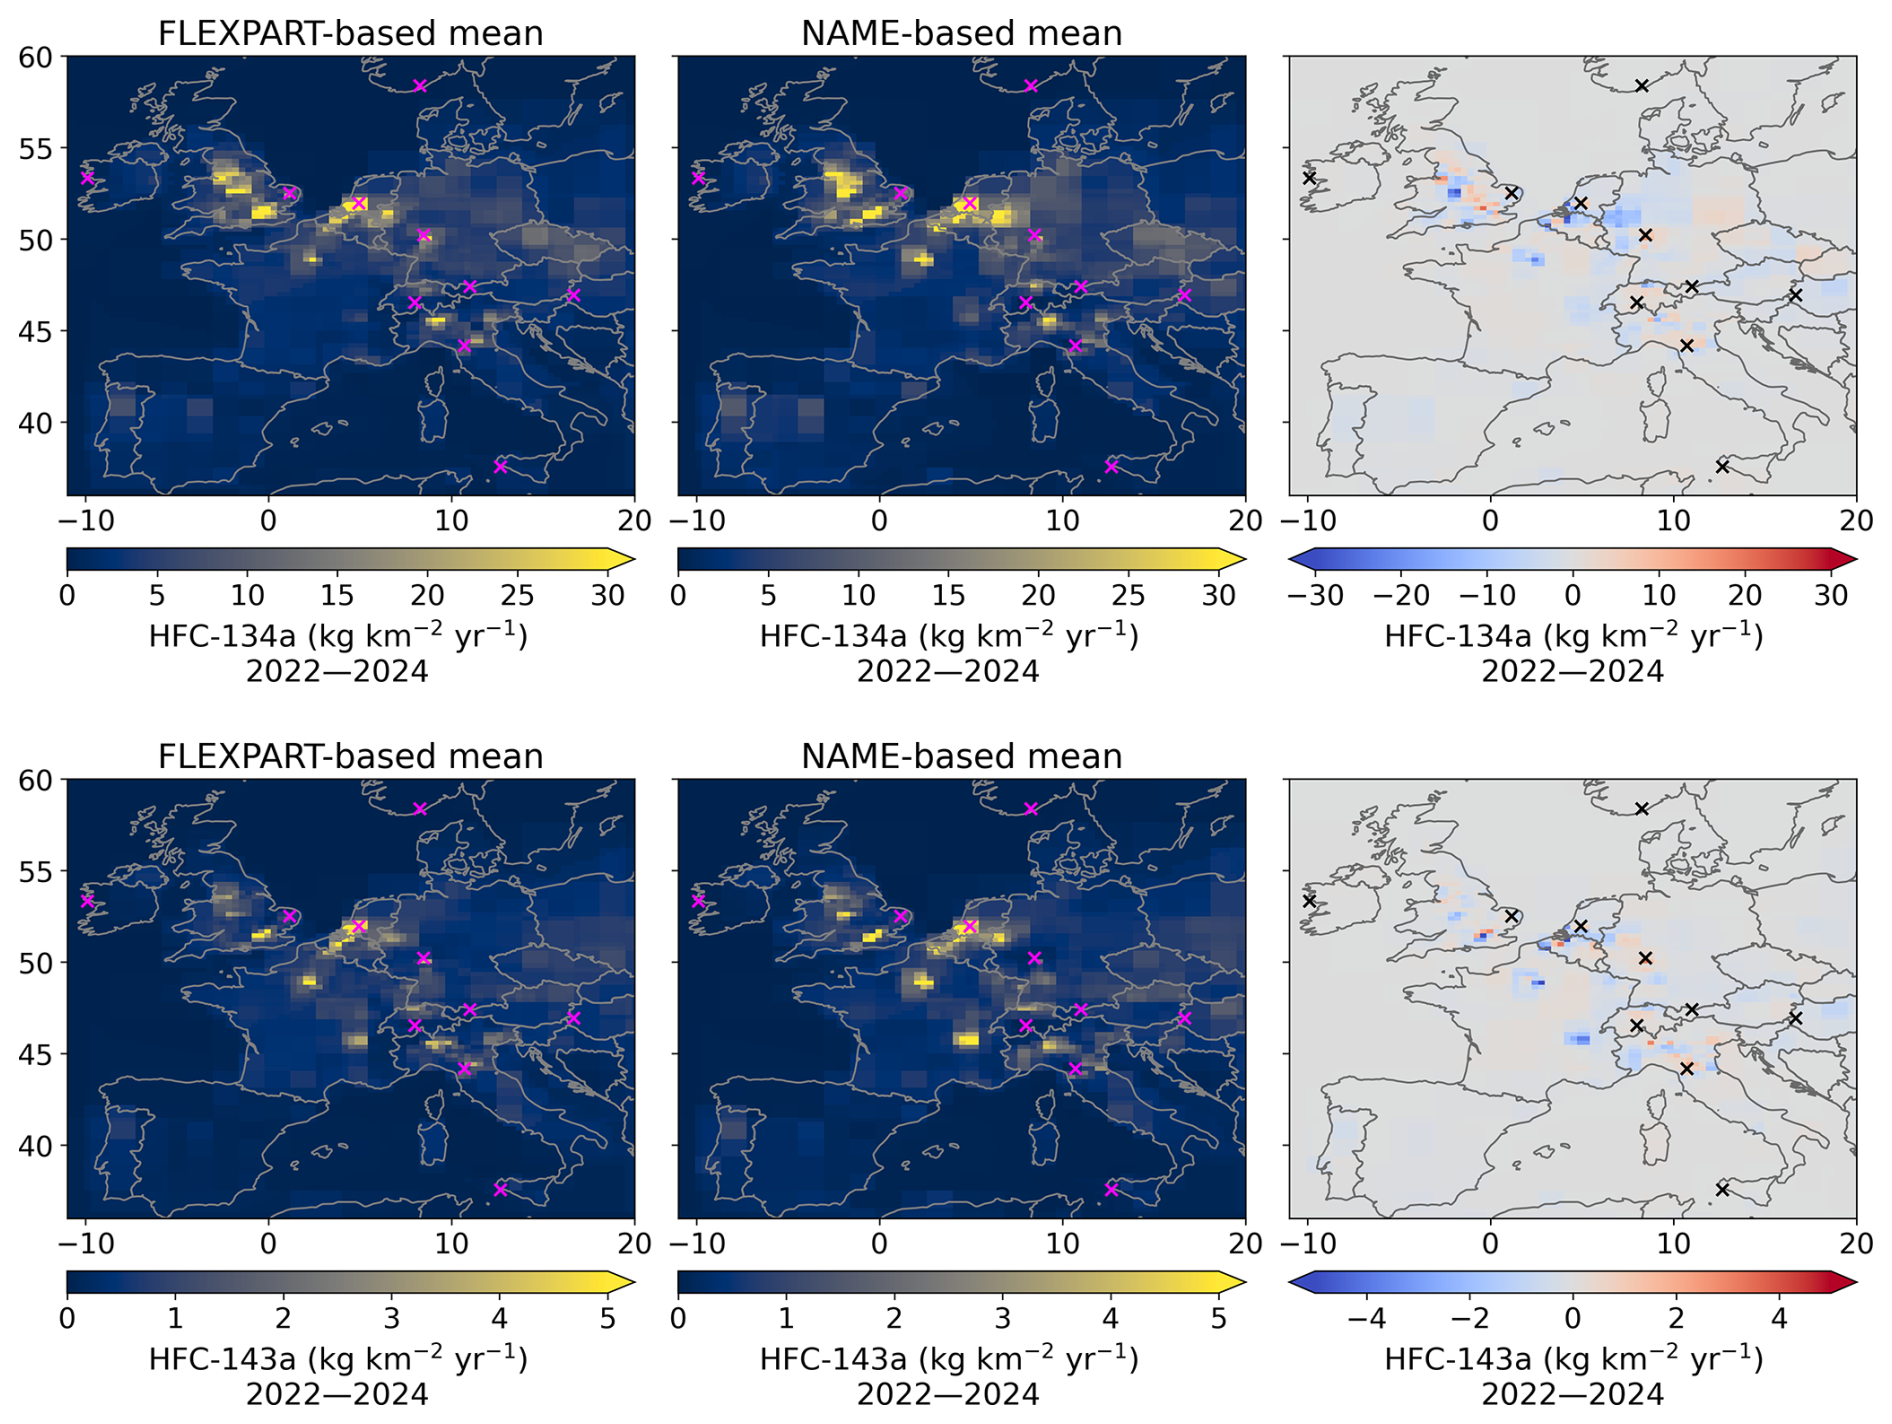
Figure B1Spatial distributions of the average modelled emissions of HFC-134a (first panel) and HFC-143a (second panel) estimated with the FLEXPART and NAME tranport models for the period 2022–2024, and the difference between the two maps; mean of all three models (InTEM, ELRIS, and RHIME) using the relative transport model. Magenta and black crosses mark the locations of atmospheric measurement sites.
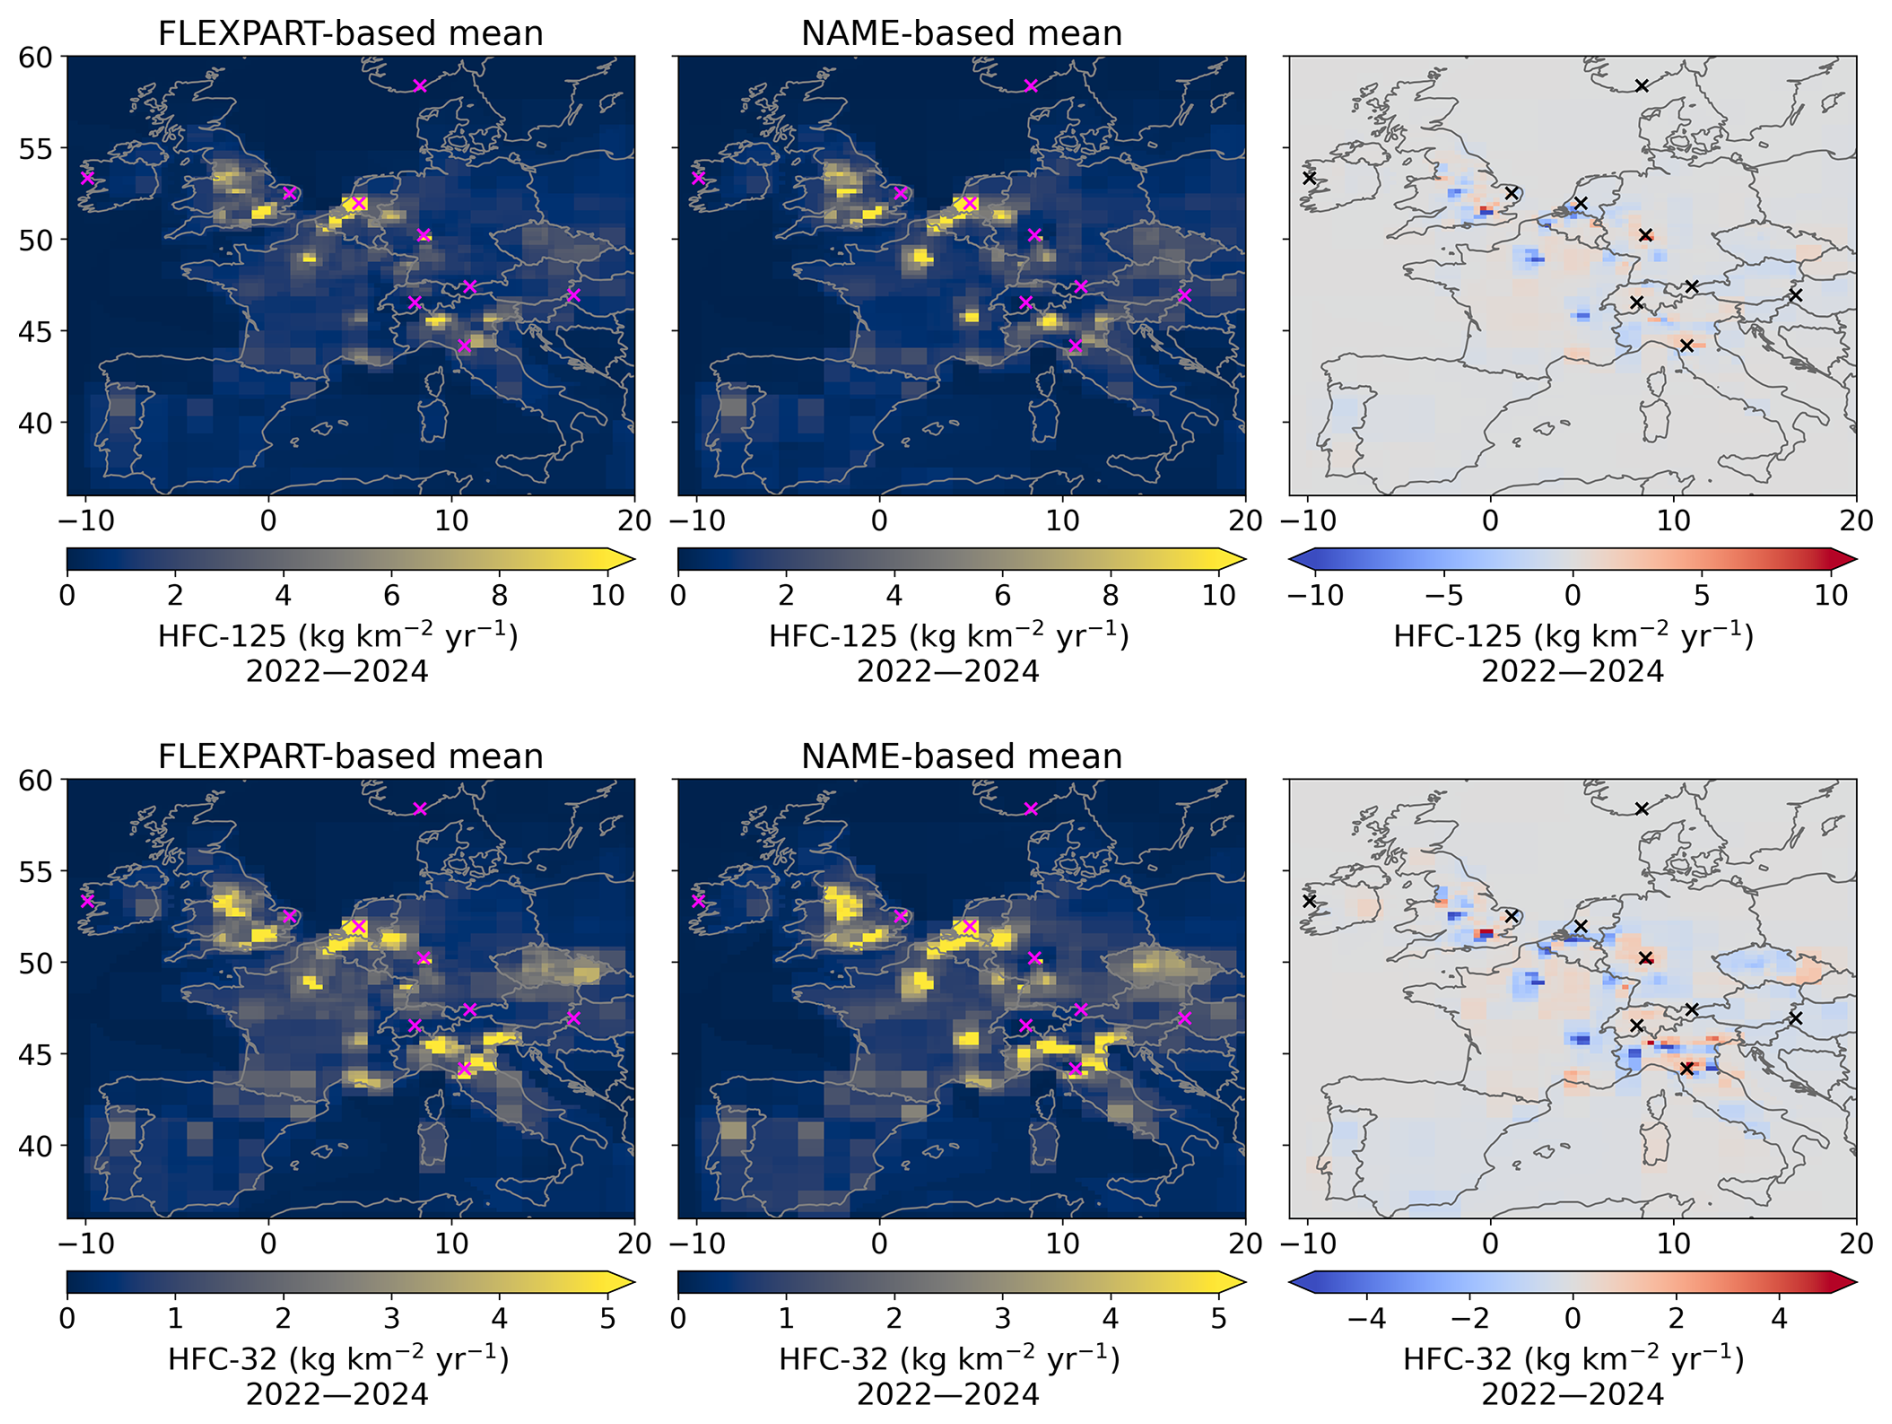
Figure B2Spatial distributions of the average modelled emissions of HFC-125 (first panel) and HFC-32 (second panel) estimated with the FLEXPART and NAME tranport models for the period 2022–2024, and the difference between the two maps; mean of all three models (InTEM, ELRIS, and RHIME) using the relative transport model. Magenta and black crosses mark the locations of atmospheric measurement sites.
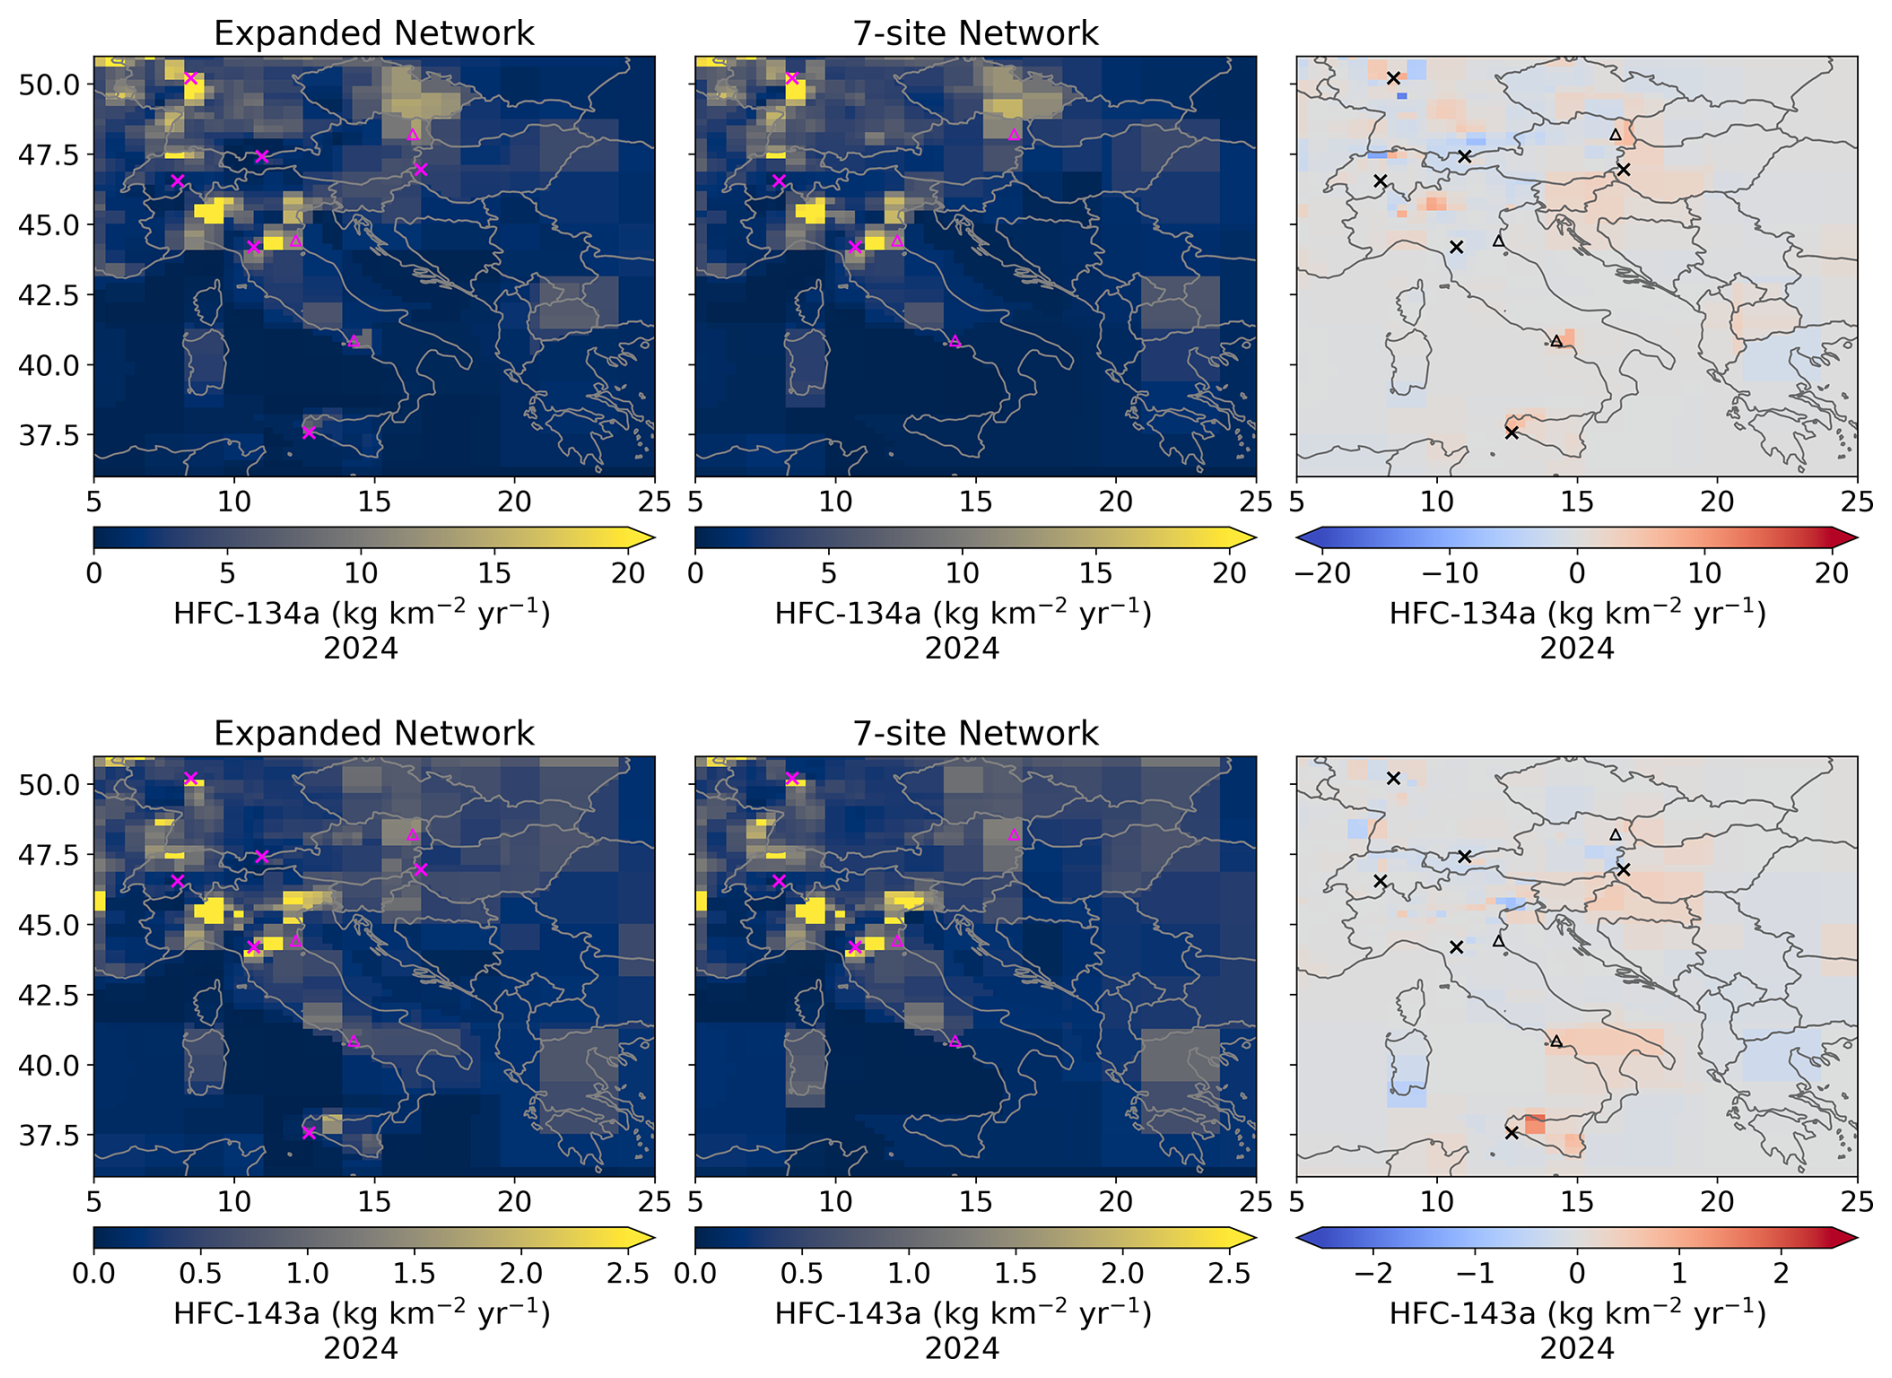
Figure B3Impact of newly added measurement sites (ZSF, CGR, HUN, and BIR) on the spatial distribution of inferred HFC-134a (top panels) and HFC-143a (bottom panels) emissions for 2024. Each map shows the mean emissions from the InTEM, ELRIS, and RHIME inverse models using the FLEXPART transport model. The Expanded Network (left column) includes all available sites (MHD, CMN, JFJ, TAC, CBW, TOB, ZEP, ZSF, CGR, HUN, and BIR), while the 7-site Network (middle column) excludes the four new stations. The right column shows the spatial differences between the two inversions. Magenta and black crosses mark the locations of atmospheric measurement sites. Triangles mark the locations of Naples (Italy), the Port of Ravenna (Italy) and Vienna (Austria).
The measured mole fractions used in this study are available on the ICOS Carbon Portal (https://doi.org/10.18160/JK51-GFYB, Engel et al., 2026). This archive should be used by those who wish to replicate the analysis in this study using an identical measurement dataset. The latest AGAGE station data from the AGAGE archive (https://www-air.larc.nasa.gov/missions/agage/data/, last access: 18 May 2026) should be used for all other purposes. Atmospheric data-based emissions from RHIME, ELRIS, and InTEM are available on the ICOS Carbon Portal (https://doi.org/10.18160/GR1Q-6SK4, Ganesan et al., 2026). An exception is the “7-site network” emissions discussed in Sect. 6, which are provided in the Supplements. The intercomparison tool FLUXIE used for data analysis is available from FLUXIE v2.1.hfc-paper (https://doi.org/10.5281/zenodo.19695451, The FLUXIE Team, 2026). The code for RHIME is available from RHIME v0.5 (https://doi.org/10.5281/zenodo.17454638, Murphy et al., 2025). The code for InTEM and ELRIS are available on request.
The supplement related to this article is available online at https://doi.org/10.5194/acp-26-7647-2026-supplement.
HDL, DBM, ALR, SH, AM, and ALG conceptualized the study. HDL performed the analysis, interpreted the data, drafted the paper and produced the figures. HDL, AD, JP, MR, ALG, and BM performed the RHIME inversions. DBM and SH performed the ELRIS inversions. ALR, AR, PA, and AM performed the InTEM inversions. AM performed the NAME simulations. SH performed the FLEXPART simulations. JP, KMS, SO'D, AW, DY, AE, TS, KM, TW, FG, MKV, SR, MM, JA, CL, NS, LH, MM, AF, and CC performed the atmospheric measurements. HDL, DBM, AR, AD, SH, and LC worked on the development of FLUXIE. All authors contributed to the discussion and writing of the manuscript.
At least one of the (co-)authors is a member of the editorial board of Atmospheric Chemistry and Physics. The peer-review process was guided by an independent editor, and the authors also have no other competing interests to declare.
Publisher's note: Copernicus Publications remains neutral with regard to jurisdictional claims made in the text, published maps, institutional affiliations, or any other geographical representation in this paper. The authors bear the ultimate responsibility for providing appropriate place names. Views expressed in the text are those of the authors and do not necessarily reflect the views of the publisher.
HDL, AD, DBM, ALG, MR, ALR, AR, PA, and AM were supported by the Horizon Europe grant Process Attribution for Regional emIssionS (PARIS; Grant Agreement number 101081430). HDL, ALG and MR were also supported by the Natural Environment Research Council (NERC) project Investigating HALocarbon impacts on the global Environment (InHALE, NE/X00452X/1). ALR, AR, PA, and AM were also supported by the Department for Energy Security & Net Zero (DESNZ). Measurements at Monte Cimone were supported by FP7-Infrastructures-2010-1 grant no. 262254 “ACTRIS (Aerosol, Clouds and Trace Gases Research Infrastructure)” project. Support for the measurements at Jungfraujoch is provided by the Swiss National Programs HALCLIM and CLIMGAS-CH (Swiss Federal Office for the Environment, FOEN), by ACTRIS-CH and by the International Foundation High Altitude Research Stations Jungfraujoch and Gornergrat (HFSJG). The measurements at Taunus Observatory were funded through the PARIS project. The Medusa instrument at Taunus Observatory was funded by the German Federal Ministry of Education and Research through the German component of ACTRIS (Aerosol, Clouds and Trace Gases Research Infrastructure) under grant 01LK2001I. AGAGE operations are supported by the National Aeronautics and Space Administration (NASA) Upper Atmosphere Research Program with grants 80NSSC21K1369 to MIT and grants 80NSSC21K1210 and 80NSSC21K1201 to SIO and multiple preceding grants providing partial support for Mace Head. Mace Head and Tacolneston, as part of the UK DECC Network, are also supported through the UK Government's Department for Energy Security and Net Zero under contract nos. TRN1028/06/2015, TRN1537/06/2018, TRN5488/11/2021 and prj_1604 to the University of Bristol. Measurements at Zeppelin were supported by the Norwegian Environment Agency. The authors would like to thank the ICOS Carbon Portal for providing archival facilities for the measurement data used in this study.
This research has been supported by the HORIZON EUROPE Climate, Energy and Mobility (grant no. 101081430).
This paper was edited by Jens-Uwe Grooß and reviewed by two anonymous referees.
Annadate, S., Mancinelli, E., Gonella, B., Moricci, F., O’Doherty, S., Stanley, K., Young, D., Vollmer, M. K., Cesari, R., Falasca, S., Giostra, U., Maione, M., and Arduini, J.: Monitoring the impact of EU F-gas regulation on HFC-134a emissions through a comparison of top-down and bottom-up estimates, Environmental Sciences Europe, 37, https://doi.org/10.1186/s12302-025-01081-1, 2025. a, b, c, d
Arnold, T., Manning, A. J., Kim, J., Li, S., Webster, H., Thomson, D., Mühle, J., Weiss, R. F., Park, S., and O'Doherty, S.: Inverse modelling of CF4 and NF3 emissions in East Asia, Atmos. Chem. Phys., 18, 13305–13320, https://doi.org/10.5194/acp-18-13305-2018, 2018. a, b
Bergamaschi, P., Danila, A., Weiss, R. F., Ciais, P., Thompson, R. L., Brunner, D., Levin, I., Meijer, Y., Chevallier, F., Janssens-Maenhout, G., Bovensmann, H., Crisp, D., Basu, S., Dlugokencky, E., Engelen, R., Gerbig, C., Günther, D., Hammer, S., Henne, S., Houweling, S., Karstens, U., Kort, E., Maione, M., Manning, A. J., Miller, J., Montzka, S., Pandey, S., Peters, W., Peylin, P., Pinty, B., Ramonet, M., Reimann, S., Röckmann, T., Schmidt, M., Strogies, M., Sussams, J., Tarasova, O., van Aardenne, J., Vermeulen, A. T., and Vogel, F.: Atmospheric monitoring and inverse modelling for verification of greenhouse gas inventories, Publications Office of the European Union, https://doi.org/10.2760/759928, 2018. a
Brunner, D., Arnold, T., Henne, S., Manning, A., Thompson, R. L., Maione, M., O'Doherty, S., and Reimann, S.: Comparison of four inverse modelling systems applied to the estimation of HFC-125, HFC-134a, and SF6 emissions over Europe, Atmos. Chem. Phys., 17, 10651–10674, https://doi.org/10.5194/acp-17-10651-2017, 2017. a, b
Citepa: Rapport Secten – Emissions de gaz à eff et de serre et de polluants atmosphériques 1990–2023, https://ressources.citepa.org/historiques/secten/2024/rapport/SECTEN_2024.pdf (last access: 18 May 2026). a
Crippa, M., Guizzardi, D., Pagani, F., Banja, M., Muntean, M., Schaaf E.and Becker, W., Monforti-Ferrario, F., Quadrelli, R., Risquez Martin, A., Taghavi-Moharamli, P., Köykkä, J., Grassi, G., Rossi, S., Brandao De Melo, J., Oom, D., Branco, A., San-Miguel, J., and Vignati, E.: GHG emissions of all world countries, Publications Office of the European Union, https://doi.org/10.2760/953322, 2023. a
Engel, A., Wagenhäuser, T., Meixner, K., Schuck, T., Stanley, K., O'Doherty, S., Wenger, A., Pitt, J., Young, D., Grant, A., Say, D., Rigby, M., Ganesan, A., Stavert, A., Arnold, T., Rennick, C., Safi, E., Chung, E., Kikaj, D., Spain, G., Wisher, A., Garrard, N., Vollmer, M., Reimann, S., Arduini, J., Maione, M., Lunder, C., Hermansen, O., Schmidbauer, N., Frumau, A., van den Bulk, P., Couret, C., Molnár, M., and Haszpra, L.: Atmospheric station results archive: European AGAGE network, UK DECC network, Cabauw tall tower, additional PARIS project sites, ICOS [data set], https://doi.org/10.18160/JK51-GFYB, 2026. a
EPA: Ireland's National Inventory Document 2024: Greenhouse Gas Emissions 1990–2022, https://www.epa.ie/publications/monitoring--assessment/climate-change/air-emissions/Ireland's-NIR-2024_cov.pdf (last access: 18 May 2026), 2024. a
EU F-gas Regulation: Regulation (EC) No 842/2006 of the European Parliament and of the Council on certain fluorinated greenhouse gases, Official Journal of the European Union, L 161, 14 June 2006, 1–11, http://data.europa.eu/eli/reg/2006/842/oj (last access: 18 May 2026), 2006. a
EU F-gas Regulation: Regulation (EU) No 517/2014 of the European Parliament and of the Council of 16 April 2014 on fluorinated greenhouse gases and repealing Regulation (EC) No 842/2006, Official Journal of the European Union, L 150, 20 May 2014, 195–230, https://data.europa.eu/eli/reg/2014/517/oj (last access: 18 May 2026), 2014. a
EU F-gas Regulation: Regulation (EU) 2024/573 of the European Parliament and of the Council of 7 February 2024 on fluorinated greenhouse gases, amending Directive (EU) 2019/1937 and repealing Regulation (EU) No 517/2014, Official Journal of the European Union, L 54, 7 February 2024, https://data.europa.eu/eli/reg/2024/573/oj (last access: 18 May 2026), 2024. a
Ganesan, A. L., Rigby, M., Zammit-Mangion, A., Manning, A. J., Prinn, R. G., Fraser, P. J., Harth, C. M., Kim, K.-R., Krummel, P. B., Li, S., Mühle, J., O'Doherty, S. J., Park, S., Salameh, P. K., Steele, L. P., and Weiss, R. F.: Characterization of uncertainties in atmospheric trace gas inversions using hierarchical Bayesian methods, Atmos. Chem. Phys., 14, 3855–3864, https://doi.org/10.5194/acp-14-3855-2014, 2014. a
Ganesan, A., Manning, A., Henne, S., De Longueville, H., Ramsden, A., Melo, D. B., Danjou, A., Andrews, P., Murphy, B., Redington, A., and Pitt, J.: Inverse modelling results for European non-CO2 greenhouse gas emissions, ICOS [data set], https://doi.org/10.18160/GR1Q-6SK4, 2026. a
Graziosi, F., Arduini, J., Furlani, F., Giostra, U., Cristofanelli, P., Fang, X., Hermanssen, O., Lunder, C., Maenhout, G., O’Doherty, S., Reimann, S., Schmidbauer, N., Vollmer, M., Young, D., and Maione, M.: European emissions of the powerful greenhouse gases hydrofluorocarbons inferred from atmospheric measurements and their comparison with annual national reports to UNFCCC, Atmos. Environ., 158, 85–97, https://doi.org/10.1016/j.atmosenv.2017.03.029, 2017. a
Great Britain. Department for Environment and Affairs, Food & Rural: Ozone-depleting substances and fluorinated greenhouse gases common framework: Provisional framework outline agreement and concordat, https://www.legislation.gov.uk/uksi/2019/583/contents (last access: 18 May 2026), 2022. a
Henne, S., Brunner, D., Oney, B., Leuenberger, M., Eugster, W., Bamberger, I., Meinhardt, F., Steinbacher, M., and Emmenegger, L.: Validation of the Swiss methane emission inventory by atmospheric observations and inverse modelling, Atmos. Chem. Phys., 16, 3683–3710, https://doi.org/10.5194/acp-16-3683-2016, 2016. a, b, c, d
Horizon Europe – PARIS: Process Attribution of Regional Emissions, funded by the European Union under Grant Agreement No. 101081430, https://horizoneurope-paris.eu/ (last access: 19 May 2026). a
Hu, L., Andrews, A. E., Montzka, S. A., Miller, S. M., Bruhwiler, L., Oh, Y., Sweeney, C., Miller, J. B., McKain, K., Ibarra Espinosa, S., Davis, K., Miles, N., Mountain, M., Lan, X., Crotwell, A., Madronich, M., Mefford, T., Michel, S., and Houwelling, S.: An Unexpected Seasonal Cycle in U.S. Oil and Gas Methane Emissions, Environ. Sci. Technol., 59, https://doi.org/10.1021/acs.est.4c14090, 2025. a
IPCC: 2006 IPCC Guidelines for National Greenhouse Gas Inventories, IGES, Japan, https://www.ipcc-nggip.iges.or.jp/public/2006gl/pdf/1_Volume1/V1_3_Ch3_Uncertainties.pdf (last access: 18 May 2026), 2006. a
Jones, A., Thomson, D., Hort, M., and Devenish, B.: The U.K. Met Office’s Next-Generation Atmospheric Dispersion Model, NAME III, pp. 580–589, Springer US, ISBN 9780387282558, https://doi.org/10.1007/978-0-387-68854-1_62, 2007. a
Katharopoulos, I., Rust, D., Vollmer, M. K., Brunner, D., Reimann, S., O'Doherty, S. J., Young, D., Stanley, K. M., Schuck, T., Arduini, J., Emmenegger, L., and Henne, S.: Impact of transport model resolution and a priori assumptions on inverse modeling of Swiss F-gas emissions, Atmos. Chem. Phys., 23, 14159–14186, https://doi.org/10.5194/acp-23-14159-2023, 2023. a, b
Liang, Q., Rigby, M., Fang, X., Godwin, D., Muhle, J., Saito, T., Stanley, K. M., Velders, G. J., Bernath, P., Derek, N., Reimann, S., Simpson, I. J., and Western, L.: Hydrofluorocarbons (HFCs) in Scientific Assessment of Ozone Depletion 2022, World Meteorological Organization, Geneva, Switzerland, https://ozone.unep.org/system/files/documents/Scientific-Assessment-of-Ozone-Depletion-2022.pdf (last access: 18 May 2026), 2022. a
Ludig, S., Jörß, W., and Liste, V.: ETC CM report 2024/05: Fluorinated greenhouse gases 2024, Tech. rep., European Environment Agency, https://www.eionet.europa.eu/etcs/etc-cm/products/etc-cm-report-2024-05 (last access: 18 May 2026), 2024. a
MAC Directive: Directive 2006/40/EC of the European Parliament and of the Council of 17 May 2006 relating to emissions from air-conditioning systems in motor vehicles and amending Council Directive 70/156/EEC, Official Journal of the European Union, L 161, 14 June 2006, 12–18, https://data.europa.eu/eli/dir/2006/40/oj (last access: 18 May 2026), 2006. a
Manning, A. J., Redington, A. L., Say, D., O'Doherty, S., Young, D., Simmonds, P. G., Vollmer, M. K., Mühle, J., Arduini, J., Spain, G., Wisher, A., Maione, M., Schuck, T. J., Stanley, K., Reimann, S., Engel, A., Krummel, P. B., Fraser, P. J., Harth, C. M., Salameh, P. K., Weiss, R. F., Gluckman, R., Brown, P. N., Watterson, J. D., and Arnold, T.: Evidence of a recent decline in UK emissions of hydrofluorocarbons determined by the InTEM inverse model and atmospheric measurements, Atmos. Chem. Phys., 21, 12739–12755, https://doi.org/10.5194/acp-21-12739-2021, 2021. a, b, c, d, e, f, g, h
Meixner, K., Wagenhäuser, T., Schuck, T. J., Alber, S., Manning, A. J., Redington, A. L., Stanley, K. M., O’Doherty, S., Young, D., Pitt, J., Wenger, A., Frumau, A., Stavert, A. R., Rennick, C., Vollmer, M. K., Maione, M., Arduini, J., Lunder, C. R., Couret, C., Jordan, A., Gutiérrez, X. G., Kubistin, D., Müller-Williams, J., Lindauer, M., Vojta, M., Stohl, A., and Engel, A.: Characterization of German SF6 Emissions, ACS ES&T Air, 2, 2889–2899, https://doi.org/10.1021/acsestair.5c00234, 2025. a
Murphy, B., Saboya, E., alexdanjou, Adam, B., Prasad, De Longueville, H., Pitt, J., Jones, G., Western, L., elenafillo, pearson01, and aliceramsden: openghg/openghg_inversions: Release v0.5, Zenodo [code], https://doi.org/10.5281/zenodo.17454638, 2025. a
NOAA GML AGGI viewer: Annual Greenhouse Gas Index (AGGI), https://gml.noaa.gov/aggi/aggi.html, last access: 28 November 2025. a
Pisso, I., Sollum, E., Grythe, H., Kristiansen, N. I., Cassiani, M., Eckhardt, S., Arnold, D., Morton, D., Thompson, R. L., Groot Zwaaftink, C. D., Evangeliou, N., Sodemann, H., Haimberger, L., Henne, S., Brunner, D., Burkhart, J. F., Fouilloux, A., Brioude, J., Philipp, A., Seibert, P., and Stohl, A.: The Lagrangian particle dispersion model FLEXPART version 10.4, Geosci. Model Dev., 12, 4955–4997, https://doi.org/10.5194/gmd-12-4955-2019, 2019. a
Prinn, R. G., Weiss, R. F., Arduini, J., Arnold, T., DeWitt, H. L., Fraser, P. J., Ganesan, A. L., Gasore, J., Harth, C. M., Hermansen, O., Kim, J., Krummel, P. B., Li, S., Loh, Z. M., Lunder, C. R., Maione, M., Manning, A. J., Miller, B. R., Mitrevski, B., Mühle, J., O'Doherty, S., Park, S., Reimann, S., Rigby, M., Saito, T., Salameh, P. K., Schmidt, R., Simmonds, P. G., Steele, L. P., Vollmer, M. K., Wang, R. H., Yao, B., Yokouchi, Y., Young, D., and Zhou, L.: History of chemically and radiatively important atmospheric gases from the Advanced Global Atmospheric Gases Experiment (AGAGE), Earth Syst. Sci. Data, 10, 985–1018, https://doi.org/10.5194/essd-10-985-2018, 2018. a
RIVM: Greenhouse gas emissions in the Netherlands 1990–2022, National Inventory Report 2024, https://doi.org/10.21945/RIVM-2024-0017, 2024. a
Ruckstuhl, A. F., Henne, S., Reimann, S., Steinbacher, M., Vollmer, M. K., O'Doherty, S., Buchmann, B., and Hueglin, C.: Robust extraction of baseline signal of atmospheric trace species using local regression, Atmos. Meas. Tech., 5, 2613–2624, https://doi.org/10.5194/amt-5-2613-2012, 2012. a
Rust, D., Katharopoulos, I., Vollmer, M. K., Henne, S., O'Doherty, S., Say, D., Emmenegger, L., Zenobi, R., and Reimann, S.: Swiss halocarbon emissions for 2019 to 2020 assessed from regional atmospheric observations, Atmos. Chem. Phys., 22, 2447–2466, https://doi.org/10.5194/acp-22-2447-2022, 2022. a
Rust, D., Vollmer, M. K., Henne, S., Frumau, A., van den Bulk, P., Hensen, A., Stanley, K. M., Zenobi, R., Emmenegger, L., and Reimann, S.: Effective realization of abatement measures can reduce HFC-23 emissions, Nature, 633, 96–100, https://doi.org/10.1038/s41586-024-07833-y, 2024. a
Saboya, E., Manning, A. J., Levy, P., Stanley, K. M., Pitt, J., Young, D., Say, D., Grant, A., Arnold, T., Rennick, C., Tomlinson, S. J., Carnell, E. J., Artioli, Y., Stavert, A., Spain, T. G., O’Doherty, S., Rigby, M., and Ganesan, A. L.: Combining Top-Down and Bottom-Up Approaches to Evaluate Recent Trends and Seasonal Patterns in UK N2O Emissions, J. Geophys. Res.-Atmos., 129, e2024JD040785, https://doi.org/10.1029/2024JD040785, 2024. a
Say, D., Manning, A. J., O’Doherty, S., Rigby, M., Young, D., and Grant, A.: Re-Evaluation of the UK’s HFC-134a Emissions Inventory Based on Atmospheric Observations, Environ. Sci. Technol., 50, 11129–11136, https://doi.org/10.1021/acs.est.6b03630, pMID: 27649060, 2016. a, b
Schoenenberger, F., Henne, S., Hill, M., Vollmer, M. K., Kouvarakis, G., Mihalopoulos, N., O'Doherty, S., Maione, M., Emmenegger, L., Peter, T., and Reimann, S.: Abundance and sources of atmospheric halocarbons in the Eastern Mediterranean, Atmos. Chem. Phys., 18, 4069–4092, https://doi.org/10.5194/acp-18-4069-2018, 2018. a
Stanley, K. M., Say, D., Mühle, J., Harth, C. M., Krummel, P. B., Young, D., O’Doherty, S. J., Salameh, P. K., Simmonds, P. G., Weiss, R. F., Prinn, R. G., Fraser, P. J., and Rigby, M.: Increase in global emissions of HFC-23 despite near-total expected reductions, Nat. Commun., 11, https://doi.org/10.1038/s41467-019-13899-4, 2020. a
Stocker, T. F., Qin, D., Plattner, G.-K., Tignor, M., Allen, S. K., Boschung, J., Nauels, A., Xia, Y., Bex, V., and Midgley, P. M. (Eds.): Climate Change 2013: The Physical Science Basis. Contribution of Working Group I to the Fifth Assessment Report of the Intergovernmental Panel on Climate Change, Cambridge University Press, Cambridge, United Kingdom and New York, NY, USA, https://www.ipcc.ch/site/assets/uploads/2018/02/WG1AR5_all_final.pdf (last access: 18 May 2026), 2013. a, b
The FLUXIE Team: FLUXIE: Flux Intercomparison Environment (v2.1.hfc-paper), Zenodo [code], https://doi.org/10.5281/zenodo.19695451, 2026. a, b
UNEP: Kigali Amendment to the Montreal Protocol on Substances that Deplete the Ozone Layer, Adopted at the Twenty-Eighth Meeting of the Parties to the Montreal Protocol, Kigali, Rwanda, https://ozone.unep.org/treaties/montreal-protocol/amendments/kigali-amendment-2016-amendment-montreal-protocol-agreed (last access: 19 May 2026), 2016. a
UNFCCC: National Inventory Submissions 2025, https://unfccc.int/ghg-inventories-annex-i-parties/2025 (last access: 13 January 2026), 2025. a, b
Western, L. M., Rigby, M., Mühle, J., Krummel, P. B., Lunder, C. R., O'Doherty, S., Reimann, S., Vollmer, M. K., Young, D., Adam, B., Fraser, P. J., Ganesan, A. L., Harth, C. M., Hermansen, O., Kim, J., Langenfelds, R. L., Loh, Z. M., Mitrevski, B., Pitt, J. R., Salameh, P. K., Schmidt, R., Stanley, K., Stavert, A. R., Wang, H.-J., Weiss, R. F., and Prinn, R. G.: Global emissions and abundances of chemically and radiatively important trace gases from the AGAGE network, Earth Syst. Sci. Data, 17, 6557–6582, https://doi.org/10.5194/essd-17-6557-2025, 2025. a, b, c
World Meteorological Organization: Integrated Global Greenhouse Gas Information System Good Practice Guidance for Estimating National-scale Greenhouse Gas Emissions using Atmospheric Observations, Tech. Rep. 319, World Meteorological Organization, Geneva, Switzerland, https://library.wmo.int/idurl/4/69714 (last access: 19 May 2026), 2025. a
- Abstract
- Introduction
- Atmospheric Observations
- Inversion Frameworks
- Trends in NW European and Country-Level HFC Emissions
- Spatial Distribution of Major HFC Emissions
- Expansion of the European Measurement Network
- Conclusions
- Appendix A: Trends in NW European and Country-Level HFC Emissions from Individual Models
- Appendix B: Spatial Distributions of Major HFC Emissions and Expansion of the European Measurement Network from FLEXPART-based Inversions
- Code and data availability
- Author contributions
- Competing interests
- Disclaimer
- Acknowledgements
- Financial support
- Review statement
- References
- Supplement