the Creative Commons Attribution 4.0 License.
the Creative Commons Attribution 4.0 License.
Global VOC emissions quantified from inversion of TROPOMI spaceborne formaldehyde and glyoxal data
Yasmine Sfendla
Trissevgeni Stavrakou
Jean-François Müller
Glenn-Michael Oomen
Beata Opacka
Thomas Danckaert
Isabelle De Smedt
Christophe Lerot
Volatile organic compounds (VOCs) are key precursors of tropospheric ozone and secondary organic aerosols, a major component of PM2.5, and several aromatic VOCs are toxic. Glyoxal is a short-lived oxidation product of many VOCs, yet global models consistently underestimate its abundance, indicating a substantial missing source. Here, we derive improved estimates of global biogenic, pyrogenic, and anthropogenic VOC emissions and new constraints on the atmospheric glyoxal budget, based on the first joint inversion of TROPOMI formaldehyde and glyoxal columns using the adjoint of the MAGRITTEv1.2 chemical transport model. For 2021, the global NMVOC flux is estimated at 1070 Tg yr−1, 19 % above bottom-up estimates, partitioned into 749 Tg from vegetation, 102 Tg from biomass burning, and 219 Tg from anthropogenic activity. Emissions of anthropogenic glyoxal precursors are 43 % higher globally when constrained by satellite data compared with inventory-based simulations, with large underestimations in India, China, and Africa. The total glyoxal source is estimated at 100 Tg yr−1, of which 41 % originates from unidentified VOCs, predominantly biogenic and concentrated in the Tropics. Likely contributors include poorly represented formation pathway in isoprene oxidation under low-NOx conditions and an underestimated contribution of monoterpenes. Validation against Pandonia Global Network, in situ, and MAX-DOAS datasets confirms improved agreement of the satellite-constrained model relative to the model based on inventory data alone.
- Article
(14603 KB) - Full-text XML
-
Supplement
(1603 KB) - BibTeX
- EndNote
Volatile organic compounds (VOCs) are key precursors of tropospheric ozone, a harmful air pollutant and greenhouse gas (Chameides et al., 1988; Monks et al., 2015) and of secondary organic aerosols (SOA), a major component of PM2.5 adversely affecting air quality and human health (Spracklen, 2011; Nault et al., 2021). In addition, some emitted VOCs themselves are toxic, carcinogenic, or cause respiratory irritation, especially aromatic hydrocarbons originating from anthropogenic activity such as benzene, toluene, ethylbenzene and xylenes (Lan et al., 2004; Partha et al., 2022). Thus, accurate quantification of non-methane VOC (NMVOC) emissions is essential for tracking the effectiveness of clean air policies, and adresses a first major limitation in understanding and regulating the formation of smog and secondary air pollution: the uncertainty in the magnitude and distribution of surface NMVOC fluxes.
Emission inventories are generally the starting point when seeking a global picture of the VOC emission fluxes from anthropogenic activity, vegetation, and fires. Yet bottom-up inventories on their own are not sufficient, because they carry significant uncertainties in activity data and emission factors, particularly in regions where field measurements or reporting of anthropogenic and pyrogenic activity are limited (Granier et al., 2011). Ground-based measurements alone do not suffice either because of their sparse and highly-localized nature. Large parts of the Tropics and the African continent, for example, are observational blind spots. Observation of directly-emitted NMVOCs from space remains limited due to the low concentrations and relatively weak spectral features of most VOCs in the spectral ranges accessible to satellite instruments. Nevertheless, several key VOCs have been successfully retrieved, such as methanol (Razavi et al., 2011; Wells et al., 2014; Franco et al., 2024; Wells et al., 2025), acetone (Franco et al., 2019), formic acid (Razavi et al., 2011; Chaliyakunnel et al., 2016; Franco et al., 2018), isoprene (Fu et al., 2019; Wells et al., 2020), and ethene (Franco et al., 2022; Wells et al., 2025). While these retrievals have demonstrated global coverage, they often rely on assumed vertical profile shapes, exhibit limited sensitivity near the surface, require favorable thermal infrared conditions such as a strong surface-atmosphere thermal contrast, and have not yet been integrated into inversion systems to constrain surface NMVOC fluxes: although these efforts provide valuable information for characterizing the large-scale distributions of the retrieved species and bottom-up emissions employed in large-scale models, they cannot readily offer constraints on the full range of different NMVOC species and sources. Secondary VOCs such as formaldehyde (HCHO) and glyoxal (CHOCHO), by contrast, are short-lived oxidation products of a wide range of NMVOCs and exhibit distinct spectral features in the UV and visible ranges, allowing for routine and reliable global retrievals (Thomas et al., 1998; Wittrock et al., 2006). Although methane oxidation is the main source of formaldehyde at the global scale, and particularly over oceans (Stavrakou et al., 2009a), both formaldehyde and glyoxal over continental areas are predominantly produced by more reactive NMVOCs such as isoprene and monoterpenes over vegetated areas. Over heavily industrialized regions, anthropogenic precursors are often dominant; especially aromatic compounds and acetylene contribute substantially to the glyoxal budget in polluted areas (Fu et al., 2008; Stavrakou et al., 2009c). The two compounds are also directly emitted, but in much smaller quantities than their secondary production. Formaldehyde is directly emitted by fuel combustion processes, biomass burning and vegetation. Glyoxal is released by fuel combustion (Qiu et al., 2020; Wang et al., 2023) and some industrial processes (Ho et al., 2013), and biomass burning (Zarzana et al., 2017, 2018).
Formaldehyde retrievals from space have been used to constrain VOC surface emissions (Pu, 2024; Oomen et al., 2024; Opacka et al., 2025) since the work of Palmer et al. (2003), while glyoxal has been used to that effect in combination with formaldehyde (Cao et al., 2018; Chen et al., 2023) since the study by Stavrakou et al. (2009c). The short atmospheric lifetimes of these compounds (on the order of hours) and rapid formation from their parent NMVOCs make them effective tracers of recent VOC emissions: inverse modeling frameworks, such as the adjoint of the global MAGRITTE chemical transport model used in this work, use the satellite observations of these compounds together with detailed representations of atmospheric chemistry and transport to identify the NMVOC emissions that best explain the observed concentrations. In this work, emissions from inventories are used as a priori estimates and subsequently optimized through the inversion of formaldehyde and glyoxal columns measured by the TROPOspheric Ozone Monitoring Instrument (TROPOMI) on board the Sentinel-5P (S5P) satellite. While formaldehyde provides robust constraints on isoprene and the total VOC flux, glyoxal is more selective, for example to aromatic hydrocarbons, but has weaker signal strength.
A major limitation to our understanding of the impact of VOCs on atmospheric composition lies in the incomplete understanding of the atmospheric budget of some NMVOCs whose observed concentrations in the atmosphere are consistently much larger than model predictions. Two important examples of severely underestimated species are formic acid (Stavravkou et al., 2012; Millet et al., 2015) and glyoxal (Fu et al., 2008; Myriokefalitakis et al., 2008; Stavrakou et al., 2009c; Li et al., 2018; Silva et al., 2018; Lerot et al., 2023). A quantification of their atmospheric abundance and a better understanding of the distribution of their missing sources are the first steps towards an identification of the missing sources. The underestimation of continental glyoxal abundances by models has been attributed previously to a combination of factors, including underestimated emissions of known precursors (e.g. aromatics) and uncertainties in the glyoxal formation yields in the oxidation of NMVOC precursors such as isoprene (Li et al., 2016). In addition, glyoxal might be formed from the oxidation of NMVOCs that are currently not considered in models, such as furanoid compounds (Romanias et al., 2024). In this study, following Stavrakou et al. (2009c), the missing source of glyoxal is incorporated as the emission of an Unspecified Volatile Organic Compound (UVOC), representing uncharacterized, but presumably biogenic, organic compounds undergoing oxidation by the OH radical, ultimately yielding glyoxal. The assumption of biogenic origin is based on the dominance of biogenic sources in the global NMVOC budget and on the spatial correlation between observed glyoxal columns and forest coverage (Stavrakou et al., 2009c). However, since forested regions are also frequent sites of biomass burning, a pyrogenic contribution cannot be excluded.
The use of satellite columns of formaldehyde and glyoxal together in a joint inversion directly addresses both knowledge gaps: formaldehyde provides strong constraints on total fluxes of reactive NMVOCs, while glyoxal offers sensitivity to specific emissions, namely those of glyoxal-producing precursors, including those not currently represented in emission inventories and atmospheric models. Some of the the limitations outlined above are addressed in this work by recent advances in chemical transport modeling and satellite observations. On the modelling side, the chemical mechanism has been updated to include a more accurate representation of aromatic hydrocarbon oxidation (Bates et al., 2021), which better reproduces results from chamber experiments. In addition, the parameterization of glyoxal uptake by aerosols has also been refined to account for relative humidity. On the observational side, the TROPOMI instrument offers daily global coverage at much finer spatial resolution and higher signal-to-noise ratio than its predecessors used in previous global model studies.
The manuscript is structured as follows. The observational datasets used in this work, namely the satellite data of formaldehyde and glyoxal acquired from TROPOMI as well as their validation, ground-based formaldehyde column data and in situ glyoxal concentrations, are presented in detail in Sect. 2. The simulation of formaldehyde and glyoxal with the MAGRITTEv1.2 chemistry-transport model and the design of the one-species and two-species inversions are described in Sect. 3. The top-down VOC emissions for different source categories and their evaluation through comparisons with independent observations are thoroughly discussed in Sects. 4 and 5. Conclusions are drawn in Sect. 6.
2.1 TROPOMI formaldehyde and glyoxal column densities
TROPOMI was launched aboard the S5P satellite in October 2017. Functioning as an ultraviolet (UV), visible (VIS), near-infrared (NIR), and short wave infrared (SWIR) spectrometer with a spectral resolution of approximately 0.5 nm in the UV-VIS range, it operates in a low-Earth afternoon polar orbit with an equatorial overpass occurring daily around 13:30 mean local solar time. As of August 2019, it provides nearly daily global coverage at a spatial resolution of 3.5×5.5 km2 in the UV-VIS. It has a 2600 km swath divided into 450 ground pixels in the UV-VIS, and produces operational Level-2 (L2) products including vertical columns of O3, SO2, NO2, HCHO, CHOCHO, CO, and CH4, along with cloud and aerosol information (Veefkind et al., 2012).
The retrieval is based on a three-step differential optical absorption spectroscopy (DOAS) algorithm (De Smedt et al., 2018, 2021; Lerot et al., 2021). Firstly, as part of the calibration process, the absorption cross-sections are convolved with the instrumental slit function. Then the convolved cross-sections are fitted to the measured optical depths within a spectral window in the UV (for formaldehyde) or VIS range (for glyoxal) This step aims to determine the slant column densities (SCDs), representing the trace gas concentration integrated along the slanted effective light path through the atmosphere. The fitting procedure takes into consideration physical and instrumental effects to enhance the quality of the fit. To specifically target CHOCHO absorption bands, a fitting window spanning from 435 to 460 nm is employed, covering its two most intense bands (Barkley et al., 2017; Lerot et al., 2010). For HCHO, a fitting interval of 328.5 to 359 nm is used. The CHOCHO and HCHO absorption cross-sections are obtained from, respectively, Volkamer et al. (2005) and Meller and Moortgat (2000). For the glyoxal fit, Lerot et al. (2021) introduced two additional corrections to this step: one to minimize spectral misfitting caused by strong absorption of NO2, and one to eliminate misfits caused by scene brightness inhomogeneities. In addition, a difficulty for the glyoxal fit lies in its spectral interference with water vapor, which can potentially lead to an overestimation of the glyoxal column density due to overlapping of their spectral features. This effect is particularly pronounced over oceanic regions where water vapor is abundant, and has also been observed in monsoon seasons over land (Chan Miller et al., 2014). Lerot et al. (2021) chose a water vapor cross-section at 293 K and 1013 hPa from the HITRAN2012 database.
Secondly, to convert the slant column densities to vertical column densities (VCDs, i.e., the concentration integrated from the Earth surface pixel beneath the satellite up to the top of the atmosphere), one requires the air mass factors (AMFs) in the middle of the fitting window (448 nm for CHOCHO, 340 nm for HCHO). These are obtained from a look-up table, which contains a range of precomputed altitude-resolved AMFs calculated with the radiative transfer model VLIDORT v2.6 (Spurr, 2008) for different combinations of observational parameters, such as observation angles, surface elevation, and surface albedo. From the table, the appropriate AMF based on the specific conditions of a TROPOMI observation is selected. The surface albedo is obtained from the Ozone Monitoring Instrument (OMI) minimum Lambertian-equivalent reflectivity (LER) climatology (Kleipool et al., 2008) at a spatial resolution of 0.5° ×0.5° for CHOCHO as well as for HCHO at the respective wavelength of the AMF calculation. A priori vertical profiles at a 1° ×1° resolution are provided by the global chemical transport MAGRITTEv1.1 (Müller et al., 2019) for CHOCHO, and TM5-MP (Williams et al., 2017) for HCHO. Over oceans, the a priori CHOCHO profiles are obtained from airborne campaign measurements over the Pacific Ocean (Volkamer et al., 2015). Only observations with a cloud fraction less than 20 % for CHOCHO and less than 40 % for HCHO were retained for processing, following the product recommendations.
Finally, background correction is necessary to mitigate systematic biases, such as instrumental effects or biases caused by spectral interference between the target absorber and other absorbers, and to correct for the presence of stripes in the SCDs derived from TROPOMI observations. To that end, observations in the Pacific Ocean, a remote and clean reference region, served as a baseline against which the observed CHOCHO and HCHO levels in other areas were compared and corrected (De Smedt et al., 2021; Lerot et al., 2021). At the end of the procedure, a background column is added to the tropospheric column. For HCHO, this background value is taken from the model in the reference sector, ranging from 2 to 4×10¹⁵ molec. cm−2. For CHOCHO, a single offset of 0.1×10¹⁵ molec. cm−2 is added. Although some biases are removed in the DOAS-based algorithm (such as those caused by stripes, scene brightness inhomogeneities, or strong NO2 absorption), it introduces systematic errors as well: SCD and spectral fitting uncertainties (e.g., absorption cross-section uncertainties and interference with other species), AMF uncertainties (i.e., uncertainties of the input parameters in the AMF calculation and the profile shape) and background correction uncertainties (i.e., uncertainties of the reference VCD). Lerot et al. (2021) find that for CHOCHO VCDs, those three primary error components generally contribute nearly equally to the total systematic error. In low-emission remote regions with background-level CHOCHO VCDs ( molec. cm−2) however, spectral fit and background correction uncertainties dominate. The total systematic CHOCHO VCD errors were found to lie between 30 % and 70 % for regions with elevated (i.e., higher-than-background-level) CHOCHO emissions (Lerot et al., 2021). The systematic uncertainties for HCHO VCDs are reported in the Algorithm Theoretical Basis Document (ATBD) by De Smedt et al. (2018). For HCHO, the AMF uncertainty is the main contributor to the systematic uncertainty of the final product, both in regions with moderate HCHO VCDs ( molec. cm−2) and in regions with elevated columns ( molec. cm−2). The total systematic HCHO VCD retrieval error in regions with elevated columns (i.e., the Tropics and mid-latitudes in summer) was estimated to be 35 %, with the SCD and spectral fit uncertainties, AMF uncertainties, and background correction uncertainties contributing respectively 15 %, 30 %, and 10 %. In regions with low VCD magnitudes, such as mid-latitudes in wintertime, the error can increase to 50 %–80 %. While the retrieval uncertainty contains both a systematic and a random component, monthly averaging causes the random component to essentially vanish.
2.2 Satellite validation and bias correction
The TROPOMI CHOCHO data was compared with long-term multi-axis differential optical spectroscopy (MAX-DOAS) observations at a limited number of 8 sites in Asia and Europe and a ten-year near-continuous measurement record at Xianghe, China, by Lerot et al. (2021). They found a strong correlation (0.6–0.9) between the TROPOMI and ground-based CHOCHO columns for all stations except Bremen, Germany (0.1). A bias in the TROPOMI columns in wintertime could be responsible for the latter. While a strong correlation was found at the two most polluted sites (MAX-DOAS columns exceeding 5×10¹⁴ molec. cm−2) in Phimai, Thailand and Pantnagar, India, the mean biases between the TROPOMI and ground-based data were rather high, molec. cm−2 in Pantnagar and molec. cm−2 in Phimai. Significant negative biases are not unusual for comparisons between satellite UV-VIS retrievals and MAX-DOAS data at strongly polluted sites (Verhoelst et al., 2021; De Smedt et al., 2021), and could be partly due to spatial heterogeneity and/or vertical sensitivity differences between the instruments. At the other six sites, biases did not exceed molec. cm−2, indicating an overall good agreement between the satellite and ground-based data.
The TROPOMI HCHO data (v.02.04.00) was characterized using the ground-based Fourier-transform infrared (FTIR) measurements from a larger number of 29 stations between May 2018 and November 2023 by Lambert et al. (2023) utilizing the method by Vigouroux et al. (2020). The FTIR vertical sensitivity profile is broadly similar to that of TROPOMI, with lower sensitivity closer to the surface, which makes FTIR especially suited for this validation. The median uncertainties of the FTIR observations were 13 % (systematic) and 0.3×10¹⁵ molec. cm−2 (random) (Vigouroux et al., 2018). TROPOMI pixels were selected within 20 km of each FTIR site and comparisons with FTIR data obtained within a time window of ±3 h of the satellite overpass time were included. Only pixels with a quality assurance value higher than 0.5 were used, which is the standard practice for TROPOMI products (De Smedt et al., 2023). This leads to about 30–40 TROPOMI-FTIR collocation pairs per site to average, but this number can be lower in cloudy conditions (Vigouroux et al., 2020). After minimizing vertical smoothing differences through the application of averaging kernels, a negative TROPOMI bias of −30 % was found for high emission stations, a positive bias smaller than 20 % for moderate-emission stations, and one of 32 % for clean stations, in agreement with the reported systematic uncertainty of the product. With a robust Theil-Sen estimator, the slope and intercept of the TROPOMI HCHO columns as a function of the FTIR columns was determined, resulting in the following bias correction:
with ΩBC the bias-corrected HCHO column and Ω the retrieved TROPOMI HCHO column. This bias correction is applied to the TROPOMI HCHO columns used in this work. A similar linear relationship was reported in the recent validation of OMI HCHO columns using FTIR column data and vertical profiles of in situ HCHO concentrations (Müller et al., 2024).
2.3 In situ glyoxal data
Field campaigns used for independent model evaluation in this study were carried out between 1988 (Grosjean et al., 1990) and 2018 (Liu et al., 2020a; Qian et al., 2019). A total of 70 in situ measurements were compiled from 37 sites across the globe, of which 17 were rural and 20 were urban locations. The distinction is not always clear-cut, such as for a site in Montelibretti, Italy (Possanzini et al., 2007), located in the countryside yet only 30 km away from Rome and therefore likely affected by urban pollution.
A variety of chemical and optical collection and analysis methods were employed in the compiled campaigns. Trapping of glyoxal on a solid sorbent and 2,4-dinitrophenylhydrazine derivatization followed by high-performance liquid chromatography (DNPH-HPLC) was used most commonly for the measurement of glyoxal concentrations. Historically, this chemical method has indeed been used since 1981 (Fung and Grosjean, 1981). It was used in the campaigns in references Lawson et al. (2015); Dai et al. (2012); Yang et al. (2018); Shen et al. (2018); Qian et al. (2019); Rao et al. (2016); Chang et al. (2019); Cerqueira et al. (2003); Possanzini et al. (2007); Borrego et al. (2000); Grosjean et al. (1996); Lee et al. (1995); Munger et al. (1995); Jing et al. (2001); Grosjean et al. (2002) and Grosjean et al. (1990). In the work by Moortgat et al. (2002), Müller et al. (2005) and Ho and Yu (2002), an O-pentafluorobenzyl hydroxylamine (PFBHA) coating was used instead of DNPH to collect the carbonyl compounds. Liu et al. (2006) used dansylhydrazine (DNSH). Spaulding et al. (2003) implemented PFBHA derivatization followed by gas chromatography-mass spectrometry (GCMS). Ieda et al. (2006) and Matsunaga et al. (2004) used an angular denuder for collection, and gas chromatography for analysis. Optical methods used in this database include incoherent broad-band cavity-enhanced absorption spectroscopy (IBB-CEAS) by Liu et al. (2020a); Min et al. (2016) and Washenfelder et al. (2011), laser-induced phosphorescence (LIP) by Huisman et al. (2011); DiGangi et al. (2012) and Thayer et al. (2015), long-path differential optical spectroscopy (LP-DOAS) by MacDonald et al. (2012) and Volkamer et al. (2005), and MAX-DOAS by Hoque et al. (2018) and Sinreich et al. (2007). For MAX-DOAS measurements, column data were converted to volume mixing ratios by the original authors Hoque et al. (2018); Sinreich et al. (2007) and used here as such. The altitude of in situ data collection (i.e., except the MAX-DOAS measurements) varied between ground level and 90 m above ground level, depending on the study.
In this work, the observed in situ CHOCHO concentrations are compared with the a priori and optimized concentrations taking into account the location, altitude, time of the year and hour of the measurement. The campaign at the rural site Phimai in Thailand (Hoque et al., 2018) differs from the others because it featured continuous measurements of both glyoxal and formaldehyde from 2014 to 2016. Therefore, this data is used in an additional evaluation of the annual cycle of both compounds. We acknowledge that the comparison with in situ campaigns has important limitations because the observations were obtained for different years than the one studied here (2021). Additionally, due to the coarse model resolution (2°×2.5°) representativeness issues in the data-model comparisons could be important, especially for urban locations. We therefore focus our comparisons on rural locations, which are expected to be more representative of the modeled grid cell concentrations.
2.4 Pandonia formaldehyde column data
The Pandonia Global Network (PGN) (https://www.pandonia-global-network.org, last access: 14 January 2026) is a network of real-time, standardized, calibrated ground-based instruments measuring columnar trace gas concentrations of NO2, HCHO, and O3, using a passive remote sensing spectrometer system capable of performing direct sun observations (Pandora). The main strengths of PGN are the uniform instrument design and calibration, centralized data processing, data archiving, and distribution. The number of Pandora instruments operating continuously is steadily growing. In this work, direct-sun HCHO column data available from 35 sites for the modeled year 2021 are used for model evaluation before and after the inversion (PGN, 2021). The total number of PGN stations is higher, but HCHO is not yet provided at all stations. All sites with 2021 data are located in the Northern Hemisphere, with the largest density in the eastern United States. More recently, sites in the Southern Hemisphere have been progressively added to the network. We used stations providing data in HDF5 format, selecting only columns flagged as “high quality (assured)” and “high quality (not assured)”. Monthly averages of the observed columns were computed using days with valid data.
3.1 Formaldehyde and glyoxal simulated using the MAGRITTEv1.2 CTM
The Model of Atmospheric composition at Global and Regional scales using Inversion Techniques for Trace gas Emissions (MAGRITTE) is a chemical transport model (CTM) capable of calculating the atmospheric distribution of 182 chemical compounds. 141 of these undergo transport processes including advection, deep convection, and mixing within the boundary layer. The model encompasses detailed up-to-date oxidation mechanisms for isoprene and other biogenic volatile organic compounds (BVOCs) accounting for recent mechanistic advances (Müller et al., 2019). Photolysis rates within the model are obtained from look-up tables calculated using the Tropospheric Ultraviolet and Visible radiative transfer model developed by Madronich and Flocke (1999). MAGRITTEv1.1, and the new version described in this work, MAGRITTEv1.2, adopt most parameterizations from the IMAGES model (Müller and Brasseur, 1995; Stavrakou et al., 2018), including the description of anthropogenic and pyrogenic organic compound reactions (Stavrakou et al., 2009a; Bauwens et al., 2016). Calculations of chemical concentrations are conducted over a σ-pressure coordinate system encompassing 40 vertical layers within the troposphere and the lower stratosphere, extending up to a pressure level of 44 hPa.
All anthropogenic emissions are sourced from the Copernicus Atmosphere Monitoring Service (CAMS) CAMS-GLOB-ANT inventory (Granier et al., 2019) and fire emissions from the QFED (Darmenov and da Silva, 2015) with emission factors from Andreae (2019). Biogenic emissions are obtained from the MEGANv2.1 model embedded in the MOHYCAN canopy environment model (MEGAN-MOHYCAN) (Stavrakou et al., 2018; Müller et al., 2008; Guenther et al., 2012; Bauwens et al., 2018). The emissions are driven by meteorological fields from the ERA5 ECMWF meteorological reanalysis (Hersbach et al., 2020). The spatial and temporal variability of the vegetation density is accounted for through the Leaf Area Index (LAI) dataset obtained from MODIS Collection 6 reprocessed by Yuan et al. (2011). The effect of atmospheric CO2 levels on biogenic isoprene emission is accounted for based on the parameterization of Possell and Hewitt (2011). For CO2 levels of 416.4 ppm in 2021 (Lan et al., 2023), the CO2 activity factor is equal to 0.90. While drought stress can also impact the emissions, its effects are uncertain and therefore neglected in the model. Previous model evaluations against OMI data have shown a deterioration of temporal correlation when accounting for the MEGANv2.1 soil moisture activity factor (Guenther et al., 2006) and soil moisture fields from a meteorological reanalysis (Bauwens et al., 2018; Stavrakou et al., 2018; Opacka et al., 2022).
In 2021, the global annual isoprene flux amounted to 433 Tg and the biogenic methanol emission flux (calculated following Stavrakou et al., 2011) to 137 Tg, available online at http://emissions.aeronomie.be (last access: 8 January 2026). The global annual monoterpene flux equaled 119 Tg. Biogenic emission of other compounds (ethanol, acetaldehyde, and acetone) are as described in Müller et al. (2024).
Considering that aromatic compounds are important anthropogenic precursors of glyoxal, the CTM has been updated in this work to better represent their oxidation through the integration of a new compact mechanism developed by Bates et al. (2021). This oxidation mechanism offers the computational tractability of a relatively minimalist implementation of only 17 species and 44 reactions, while providing a better match with observed yields from chamber experiments than more complex mechanisms for hydrogen oxide radicals, glyoxal, and other oxygenates (Bates et al., 2021). The chemical mechanism of MAGRITTEv1.1 already included the oxidation of six glyoxal precursors: isoprene (C5H8), acetylene (C2H2), and ethene (C2H4), and the common BTX aromatics benzene (C6H6), toluene (C7H8) and xylenes (C8H10). The new mechanism in MAGRITTEv1.2 includes the following additional aromatics: trimethylbenzene (C9H12), styrene (C8H8), ethylbenzene (C8H10), phenol (C6H6O), cresol (C7H8O), catechols (C6H6O2) and methylcatechols (C7H8O2), benzaldehyde (C7H6O), (methyl-) perbenzoic acid (C7H6O3), methylperoxybenzoylnitrate (C7H5O5N), nitrophenols and nitrocatechols (C6H5O3N), generic C4 and C5 intermediates (C4H4O2 and C5H6O2). Among these species, trimethylbenzene, styrene, and ethylbenzene are directly emitted by anthropogenic activities, and phenol, benzaldehyde, styrene, and ethylbenzene are released by fires.
A second update to the model is the revision of glyoxal reactive uptake by aerosols, following Curry et al. (2018). The irreversible uptake of CHOCHO by aqueous aerosols was previously assumed to proceed with a uniform reactive uptake probability, , based on laboratory experiments conducted under atmospheric conditions (Liggio et al., 2005). Evidence for rapid CHOCHO uptake is provided by direct measurements of gas-phase glyoxal (Volkamer et al., 2007; Ervens and Volkamer, 2010). We adopt the parameterization of the reactive uptake coefficients of CHOCHO by different cloud and aerosol types reported in Curry et al. (2018): the glyoxal uptake coefficient by sulfate, nitrate, or ammonium aerosols as a function of the relative humidity (RH) is expressed as
This parameterization leads to much lower uptake at high RH ( for RH >80 %) than in drier conditions (e.g., at RH=50 %). In the context of this work, it results in an overall decrease of the contribution of CHOCHO uptake to aqueous SOA formation compared to the use of the constant uptake probability . We note that more research is needed to better understand the influence of other parameters, like temperature, aerosol acidity and organic content.
Table 1 summarizes the updated global annual of sources and sinks of atmospheric CHOCHO estimated in this study and in previous modeling studies. The overall a priori budget of CHOCHO (47.5 Tg yr−1) remains consistent with previous estimates (Stavrakou et al., 2009c; Silva et al., 2018). The contribution of isoprene oxidation to this total is 23 Tg yr−1, slightly less than in the IMAGESv2 study (28 Tg yr−1), due to mechanistic differences leading to a lower overall glyoxal yield from isoprene, as detailed in Müller et al. (2019). The larger photochemical production of glyoxal in this work (46 Tg yr−1, as compared to 33 Tg yr−1 in Silva et al., 2018) results from several factors, including higher molar yields of glyoxal from aromatics in the mechanism of Bates et al. (2021) adopted in this work (∼ 0.6 for BTX, as compared to 0.25 in Silva et al., 2018), and higher glyoxal yields from monoterpenes (Müller et al., 2019).
(Fu et al., 2008)(Stavrakou et al., 2009c)(Silva et al., 2018)Table 1Global annual sources and sinks of atmospheric CHOCHO estimated in this work (average over 2021) by the a priori MAGRITTEv1.2 model, as compared to the a priori budget from Stavrakou et al. (2009c) for the year 2005, and the results of Silva et al. (2018) for the year 2005 as well. The sources and sinks are expressed in Tg of glyoxal per year. An aerosol uptake coefficient of was adopted in Fu et al. (2008), Stavrakou et al. (2009c) and Silva et al. (2018). Heterogeneous loss includes in-cloud uptake and aerosol uptake.
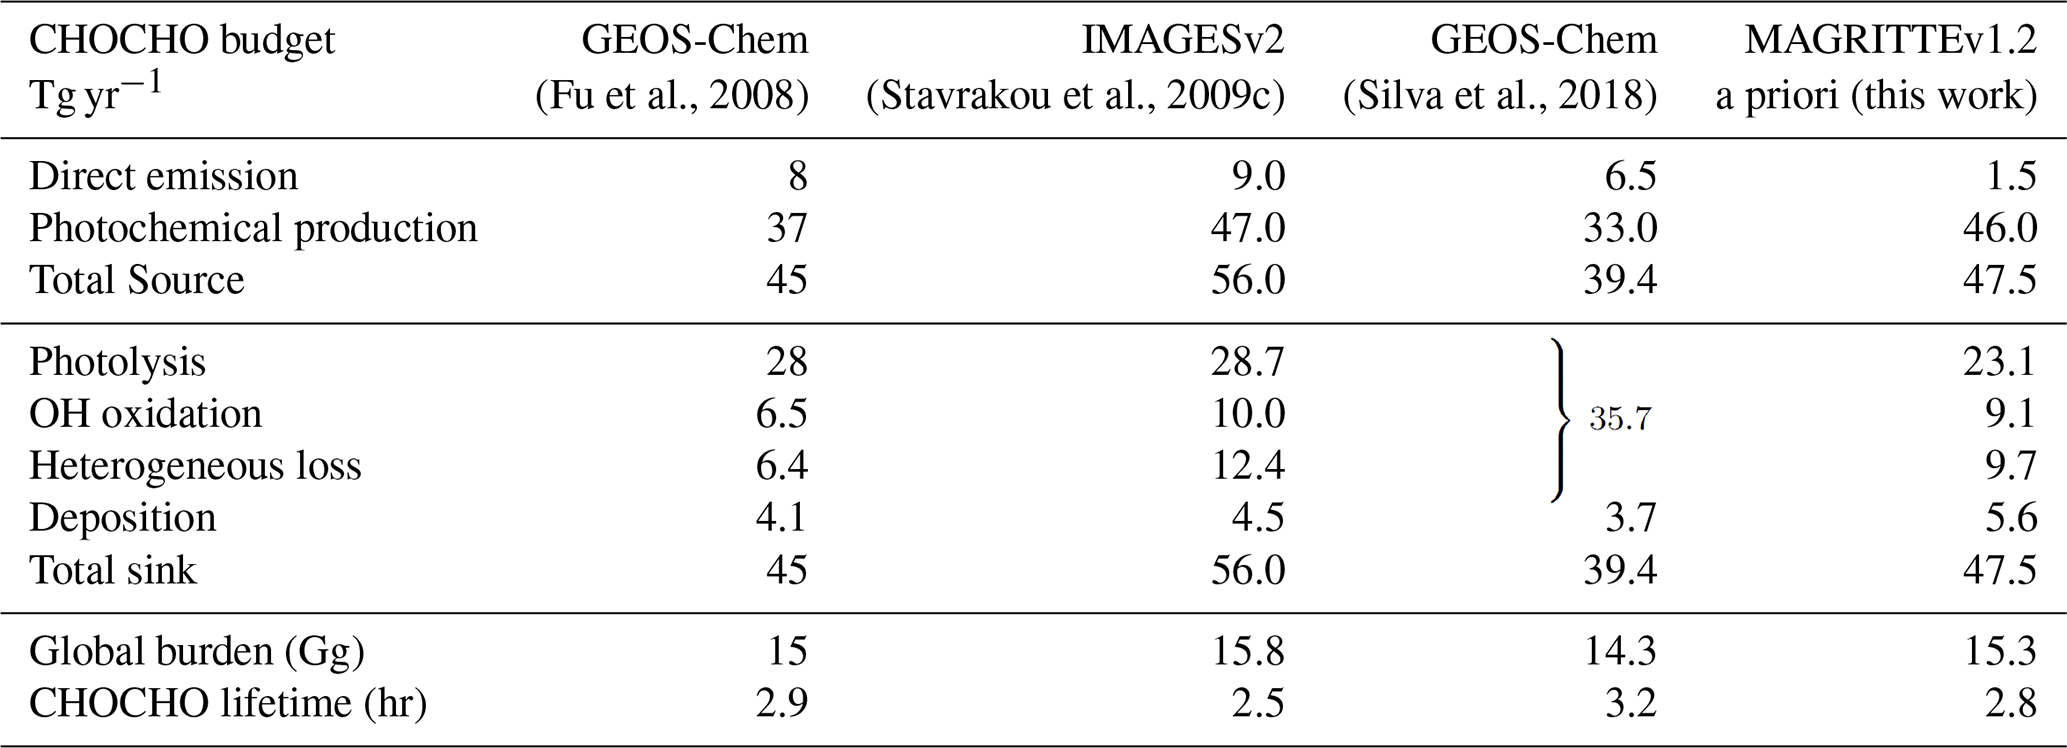
The new parameterization of heterogeneous uptake does not cause an important change in comparison with the IMAGESv2 study, as the organic carbon and black carbon sink parameterization was left unchanged. However, the in-cloud CHOCHO sink has decreased significantly, from 4.7 Tg yr−1 in the work of Stavrakou et al. (2009c) to 0.8 Tg yr−1. The direct emission of glyoxal in this work and in the GEOS-Chem studies includes only pyrogenic emissions while Stavrakou et al. (2009c) included a 3.2 Tg yr−1 anthropogenic direct emission component. The direct pyrogenic source of glyoxal in this work (1.5 Tg yr−1) is lower than in the previous studies, due to the lower emission factors from Andreae (2019).
To facilitate a direct comparison with TROPOMI monthly averaged HCHO columns, the modeled monthly averaged columns are based on daily values at the satellite overpass time (∼ 13:30 local time), while accounting for the number of observations and averaging kernels provided with the TROPOMI retrievals. These kernels are applied to the modeled vertical profiles to account for the instrument's altitude-dependent sensitivity and remove errors due to vertical profile inconsistencies in the comparison of satellite columns with the model (Oomen et al., 2024).
The inverted emissions have uncertainties due to several factors affecting the HCHO columns, besides the magnitude of the emissions, such as the background HCHO levels due to methane oxidation, incomplete or incorrect information regarding VOC speciation in emission inventories, the VOC oxidation mechanisms, the deposition of oxidation intermediates, the transport processes influencing the vertical profile of chemical compounds, and the NOx concentrations, known to influence the OH levels as well as the yields of HCHO and CHOCHO from key VOCs including isoprene.
3.2 One-species and two-species inversion setup
The MAGRITTE chemical transport model is used in a global adjoint-based inversion framework to optimize NMVOC emissions using TROPOMI observations. The emissions are iteratively refined through the minimization of a cost function J, which quantifies the discrepancy between modeled and observed columns, expressed as:
with f denoting the vector of dimensionless emission parameters to be optimized, H(f) the operation of the chemical transport model on the control variables, y the observation vector, T indicating the transpose, B the covariance matrix of emission parameter errors, and E the covariance matrix of observation errors encompassing instrumental, representativeness, and model errors. The cost function is minimized using a quasi-Newton optimization algorithm, which involves calculating its gradient through the model's adjoint (Müller and Stavrakou, 2005). The convergence criterion is a reduction of the norm of the gradient of the cost J by a factor 30. Typically, this criterion is reached after approximately 30 iterations. The observation vector y and its model counterpart H(f) consist of monthly-averaged bias-corrected TROPOMI columns binned onto the model resolution (2° × 2.5°). The optimized monthly-averaged top-down emission flux is expressed as
where ϕj(x,t) indicates the a priori spatiotemporal emission distributions for each source category j out of m categories, and fj(x,t) are the emission parameters determined by the inversion for each category, model grid cell x, and month t, in a given year. Note that the emission parameters are defined per category, i.e. the speciation within each category is unchanged by the inversion.
The target year is 2021, with the simulation commencing on 1 July 2020, exclusively incorporating continental data. Emissions are not optimized in grid cells for which the maximum monthly a priori emission (throughout one year) is very low, namely below 109 molec. cm−2 s−1. Furthermore, only months with at least 10 valid satellite observations per model pixel are included in the analysis.
3.2.1 Formaldehyde-constrained inversion
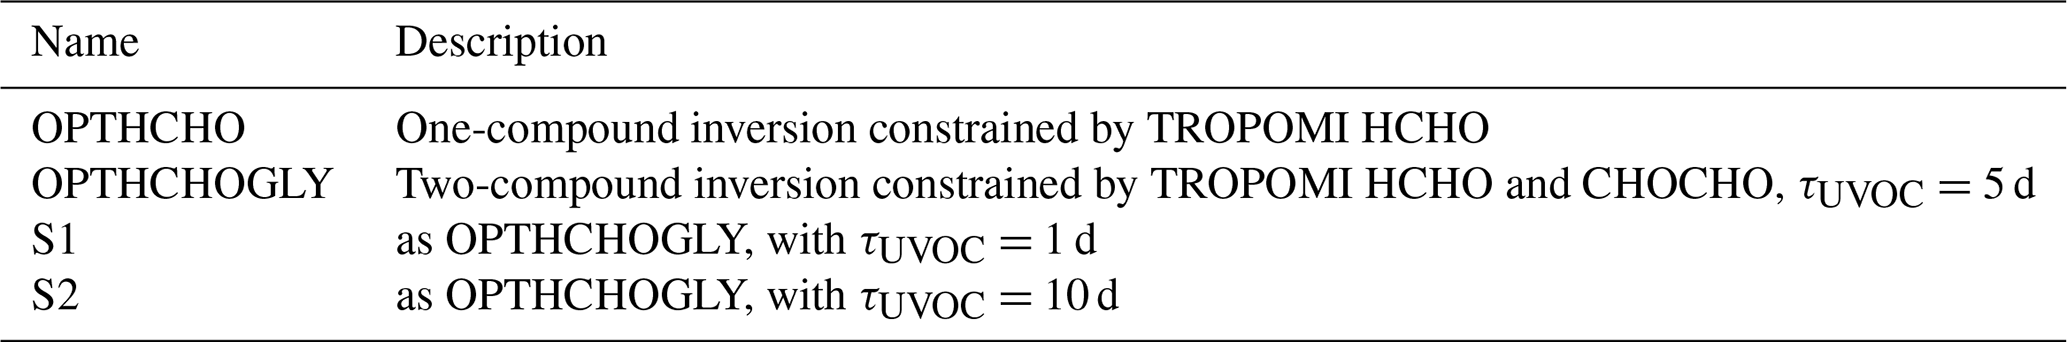
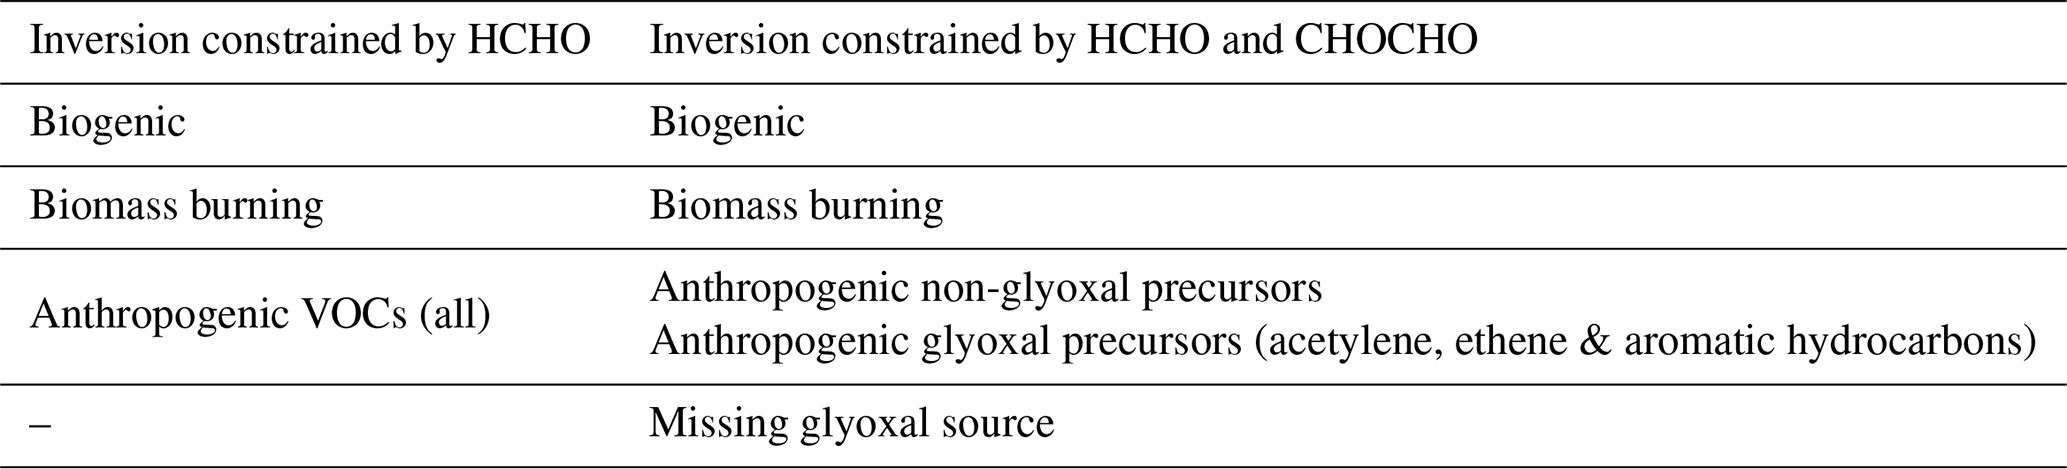
Table 2 summarizes the emission inversions conducted in this work. The formaldehyde-only inversion (hereafter abbreviated as OPTHCHO) optimizes three emission categories, namely biogenic, pyrogenic, and anthropogenic VOC fluxes (see Table 3). Biogenic fluxes are dominated by isoprene, but also include monoterpenes, ethanol, acetaldehyde and acetone. In the HCHO inversion setup, around 111 000 emission parameters fj are inferred by the optimization: 42 000 (3500 grid cells × 12 months) for anthropogenic fluxes, 29 000 for biomass burning fluxes, and 40 000 for biogenic fluxes.
Table 2 Global emission optimizations performed in this study for the target year 2021.
The observation covariance matrix E is assumed to be diagonal, with its diagonal elements the total (TROPOMI) observation uncertainties. Each one is calculated as the squared sum of the retrieval uncertainty, discussed in Sect. 2.1, and an absolute model uncertainty taken equal to 2×10¹⁵ molec. cm−2.
The emission covariance matrix B's diagonal elements are the squares of the relative errors, which are taken equal to 0.9, i.e., the uncertainty factors of all emission parameters are assumed to be e0.9≈2.5. The off-diagonal elements of B depend upon the spatio-temporal correlations of the errors in the fluxes. For biogenic and pyrogenic emissions, the spatial correlations are assumed to decrease exponentially between two grid cells, with the decorrelation length set to 300 km. Anthropogenic emission parameters within the same country are assumed to be weakly spatially correlated (coefficient of 0.1), while parameters for different countries are taken to be uncorrelated. The temporal correlation is assumed to be zero for biomass burning emissions. For biogenic emissions, it is assumed to decrease linearly from 0.6 for consecutive months to 0.1 after 6 months. For anthropogenic emissions, a similar linear decrease from 0.9 to 0.5 after 6 months is implemented.
Table 3Emission categories optimized in the one-compound and two-compound inversions.
3.2.2 Joint inversion constrained by formaldehyde and glyoxal columns
In addition to the source categories addressed by the one-species inversion described above, the simultaneous inversion of HCHO and CHOCHO column data (hereafter abbreviated OPTHCHOGLY) also constrains the emissions of glyoxal precursors. By virtue of the adjoint-based inverse modeling approach, information gained from HCHO constrains the sources of CHOCHO, since both gases have common precursors (e.g., isoprene) and are interrelated through their chemical mechanisms (e.g., via OH). The focus here is limited to continental regions due to the inherent difficulty in retrieving CHOCHO columns over the oceans due to interference with liquid water absorption and because HCHO columns over oceans are mainly due to methane oxidation (Stavrakou et al., 2009a).
In the joint inversion setup, besides the three emission categories of the formaldehyde-based inversion, two additional emission sources are optimized as summarized in Table 3 (i.e., m=5). Firstly, the category of anthropogenic VOCs is subdivided into anthropogenic VOCs that are precursors of glyoxal (aromatic hydrocarbons, as well as acetylene and ethene) and anthropogenic VOCs that are not (ethane, propane, propene, formaldehyde, acetaldehyde, propionaldehyde, 2-butanone, formic acid, acetic acid, butanes and higher alkanes, higher alkenes and alkynes). Secondly, a missing biogenic glyoxal source is introduced, presumed to form via photochemical oxidation (Stavrakou et al., 2009c) of unidentified VOC precursors (UVOC) with a molar yield of unity, assumed to react with OH at a rate constant equal to 2.315×1015 cm3 molec.−1 s−1, resulting in a lifetime of 5 d for [OH] =106 molec. cm−3.
Additional inversions for the year 2021 with shorter (1 d) and longer (10 d) lifetimes are conducted as well, to assess the sensitivity of the model to the chosen UVOC lifetime. The a priori UVOC source is assumed to be distributed according to the MODIS leaf area index from Yuan et al. (2011) and scaled globally to 20 Tg yr−1. The a priori anthropogenic CHOCHO precursors are described in Sect. 3.1. About 190 000 emission parameters fj are computed in the joint inversion for each year: 42 000 anthropogenic (besides glyoxal precursors), 29 000 pyrogenic, and 40 000 biogenic ones for the single-compound inversion, and an additional 42 000 for anthropogenic glyoxal precursors and 37 000 for the UVOC source.
For glyoxal, as for the formaldehyde columns, the elements of the diagonal observation covariance matrix E are the squared sum of the retrieval uncertainty, discussed in Sect. 2.1, and an absolute model uncertainty, which for glyoxal is taken equal to 1×10¹³ molec. cm−2.
The emission uncertainty factor in B is assumed to be e0.9≈2.5 for the UVOC source, while for anthropogenic glyoxal precursors the factor depends on the geographical region. A factor of 2.5 is used for Canada, the United States, Oceania, Japan, and OECD (Organisation for Economic Co-operation and Development) member states in Europe. For all other regions, the uncertainty factor is taken to be e1.1≈3. The decorrelation length of the UVOC source is set to 300 km, like for the biogenic and pyrogenic emissions, while its temporal error correlation is assumed to be constant at 0.3. Spatio-temporal correlations for the anthropogenic categories are identical to those in the single-compound inversion.
4.1 Formaldehyde columns constrained by TROPOMI data
Overall, the HCHO columns from the a priori (bottom-up) model already agree very well with the bias-corrected satellite columns, both in terms of magnitude and spatial representation (Fig. 1). At regional scale, however, the a priori model often exhibits significant deviations from the observations. In the Northern Hemisphere, model underestimations occur during the local winter (Fig. 1a, c) in Southeast Asia, India and Mexico, and during the local summer (Fig. 1b, d) in Southern Europe, the Middle East, and the entire west of North America. In Central and Western Europe, the model overestimates HCHO columns. Over Siberia during summer, a good agreement is found, except at high latitudes (>70°), and the model successfully reproduces the location and magnitude of a major hot spot there that can be attributed to biomass burning (Fig. 2). In West and Central Africa, the a priori model agrees very well with the observations. In the Southern Hemisphere, in summer (Fig. 1a, c) overestimations are found in the semi-arid lowland Chaco Plain of South America and in the north of Australia, while underestimations are seen in Southern Africa. During the local winter, the model performs relatively well throughout the entire Southern Hemisphere (Fig. 1b, d).
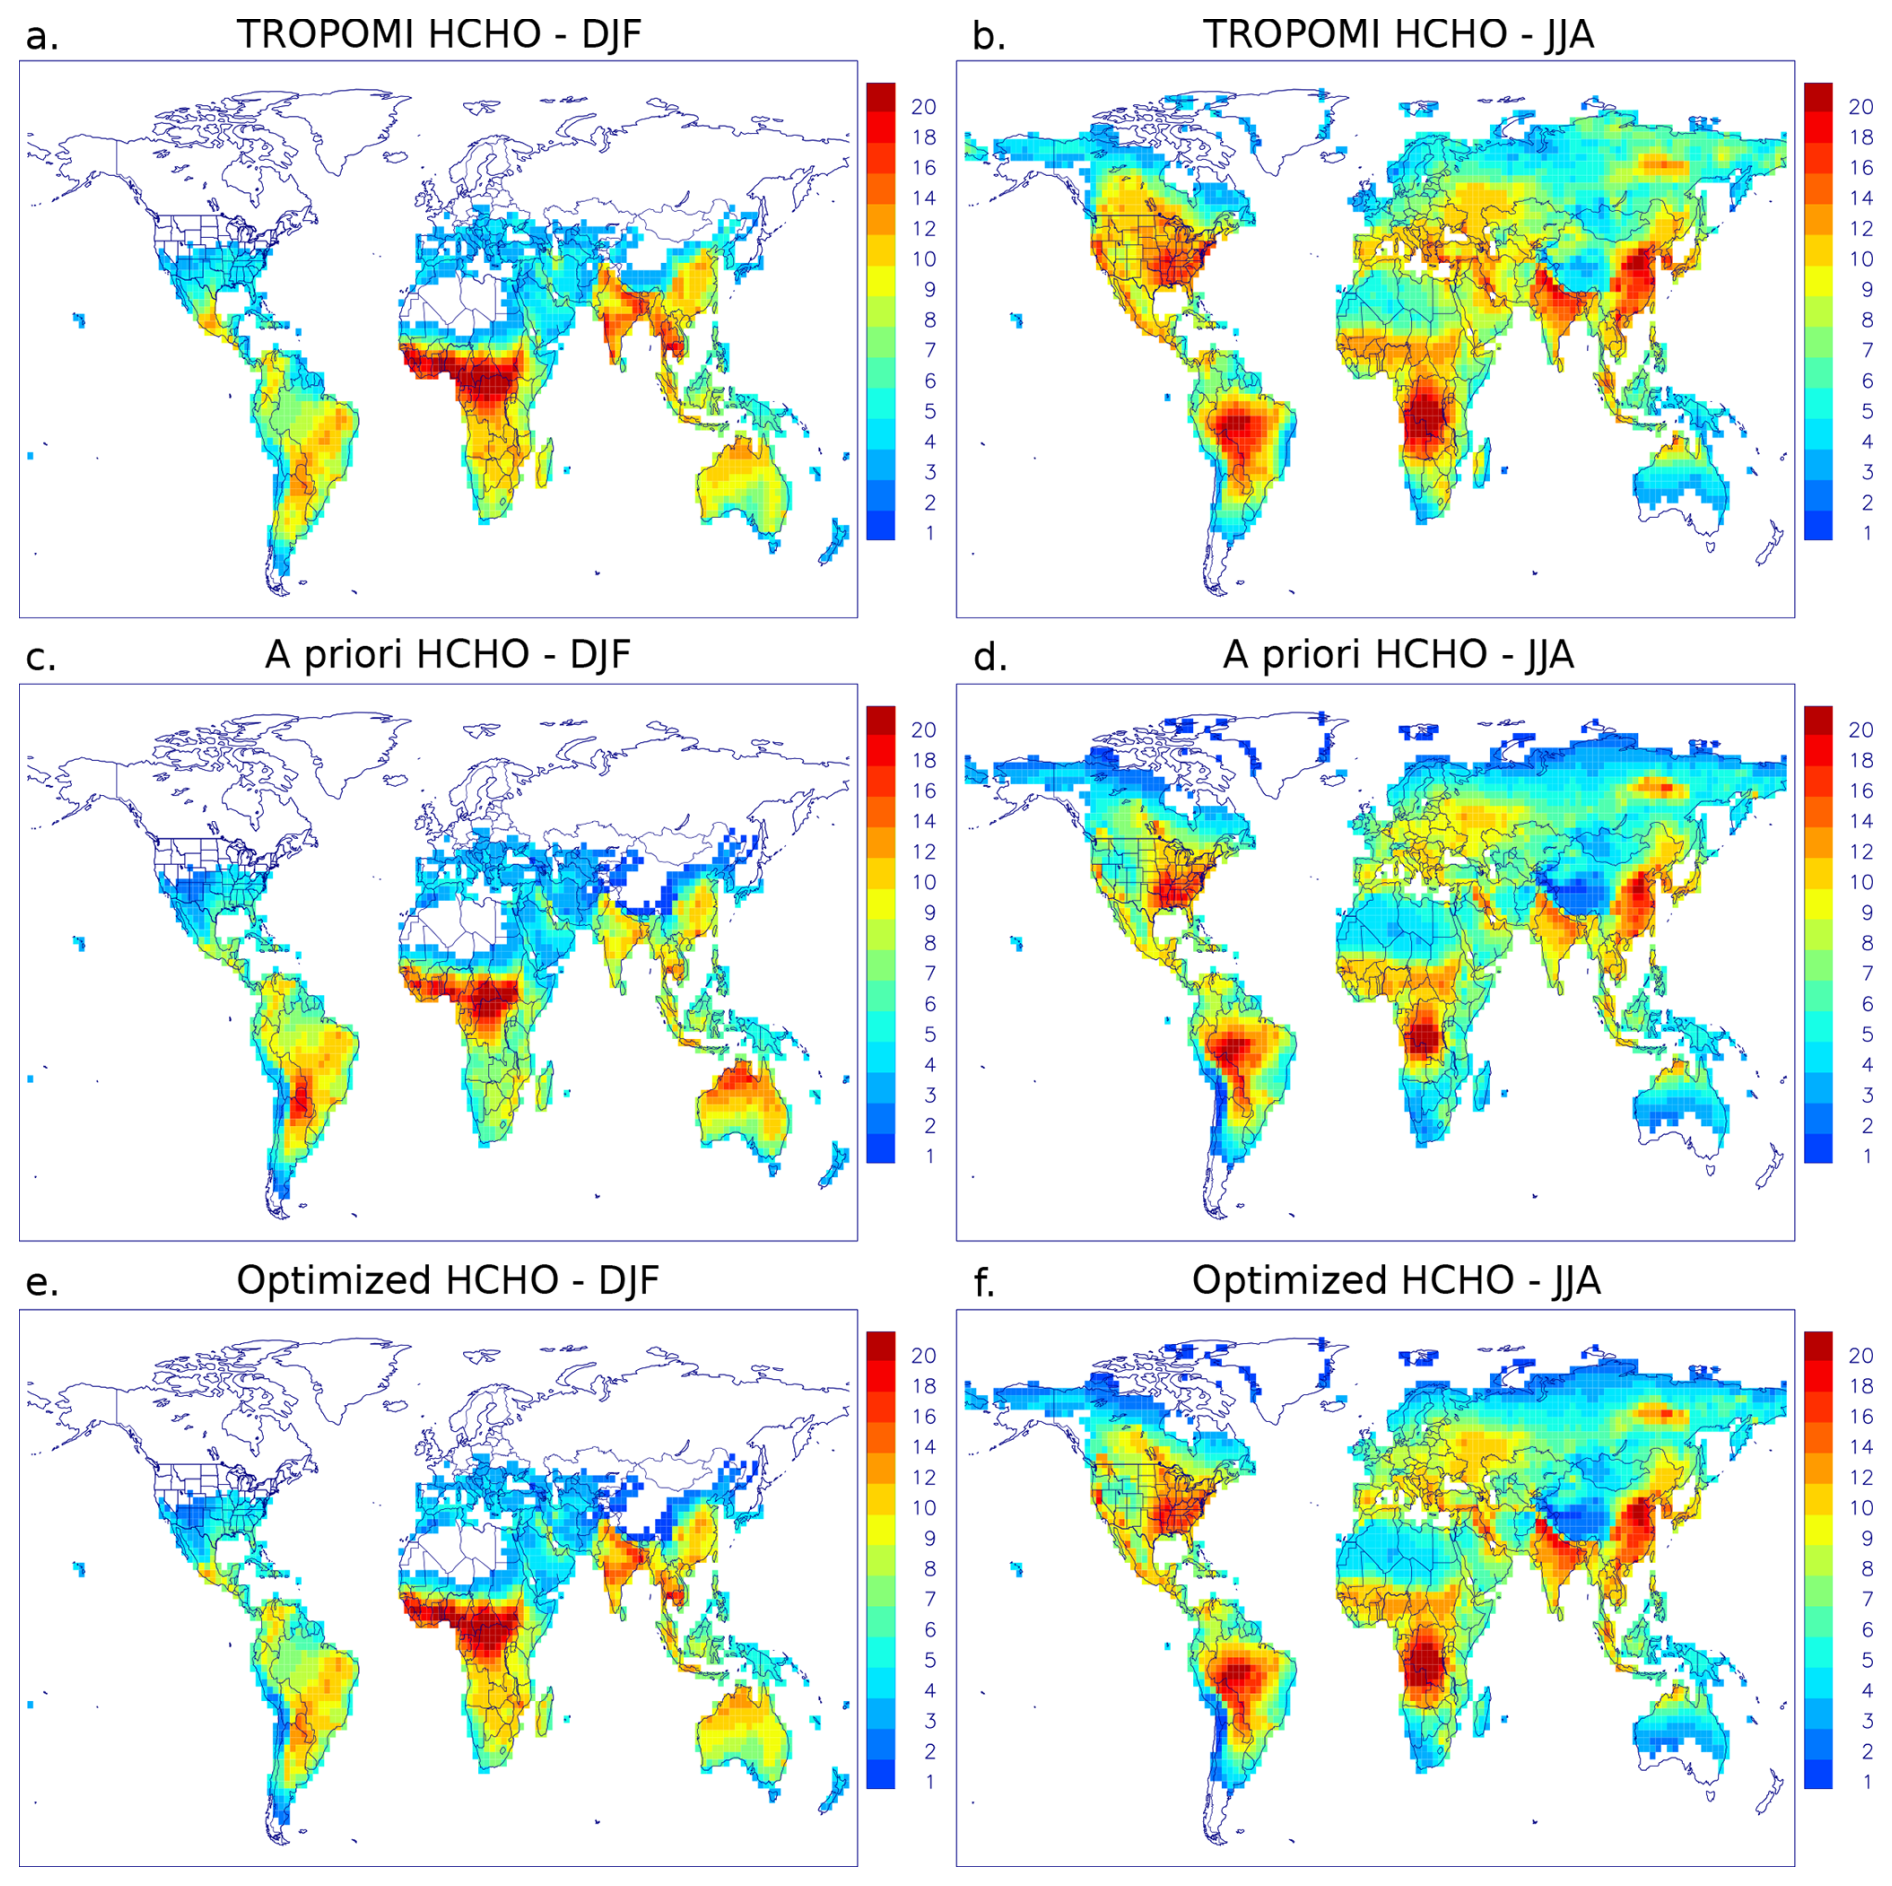
Figure 1HCHO columns averaged over December, January, February (DJF) and June, July, August (JJA) in 2021 (1015 molec.cm−2). (a, b) TROPOMI bias-corrected columns. (c, d) Columns from a priori model. (e, f) Columns optimized through the inversion constrained by TROPOMI HCHO columns (OPTHCHO).
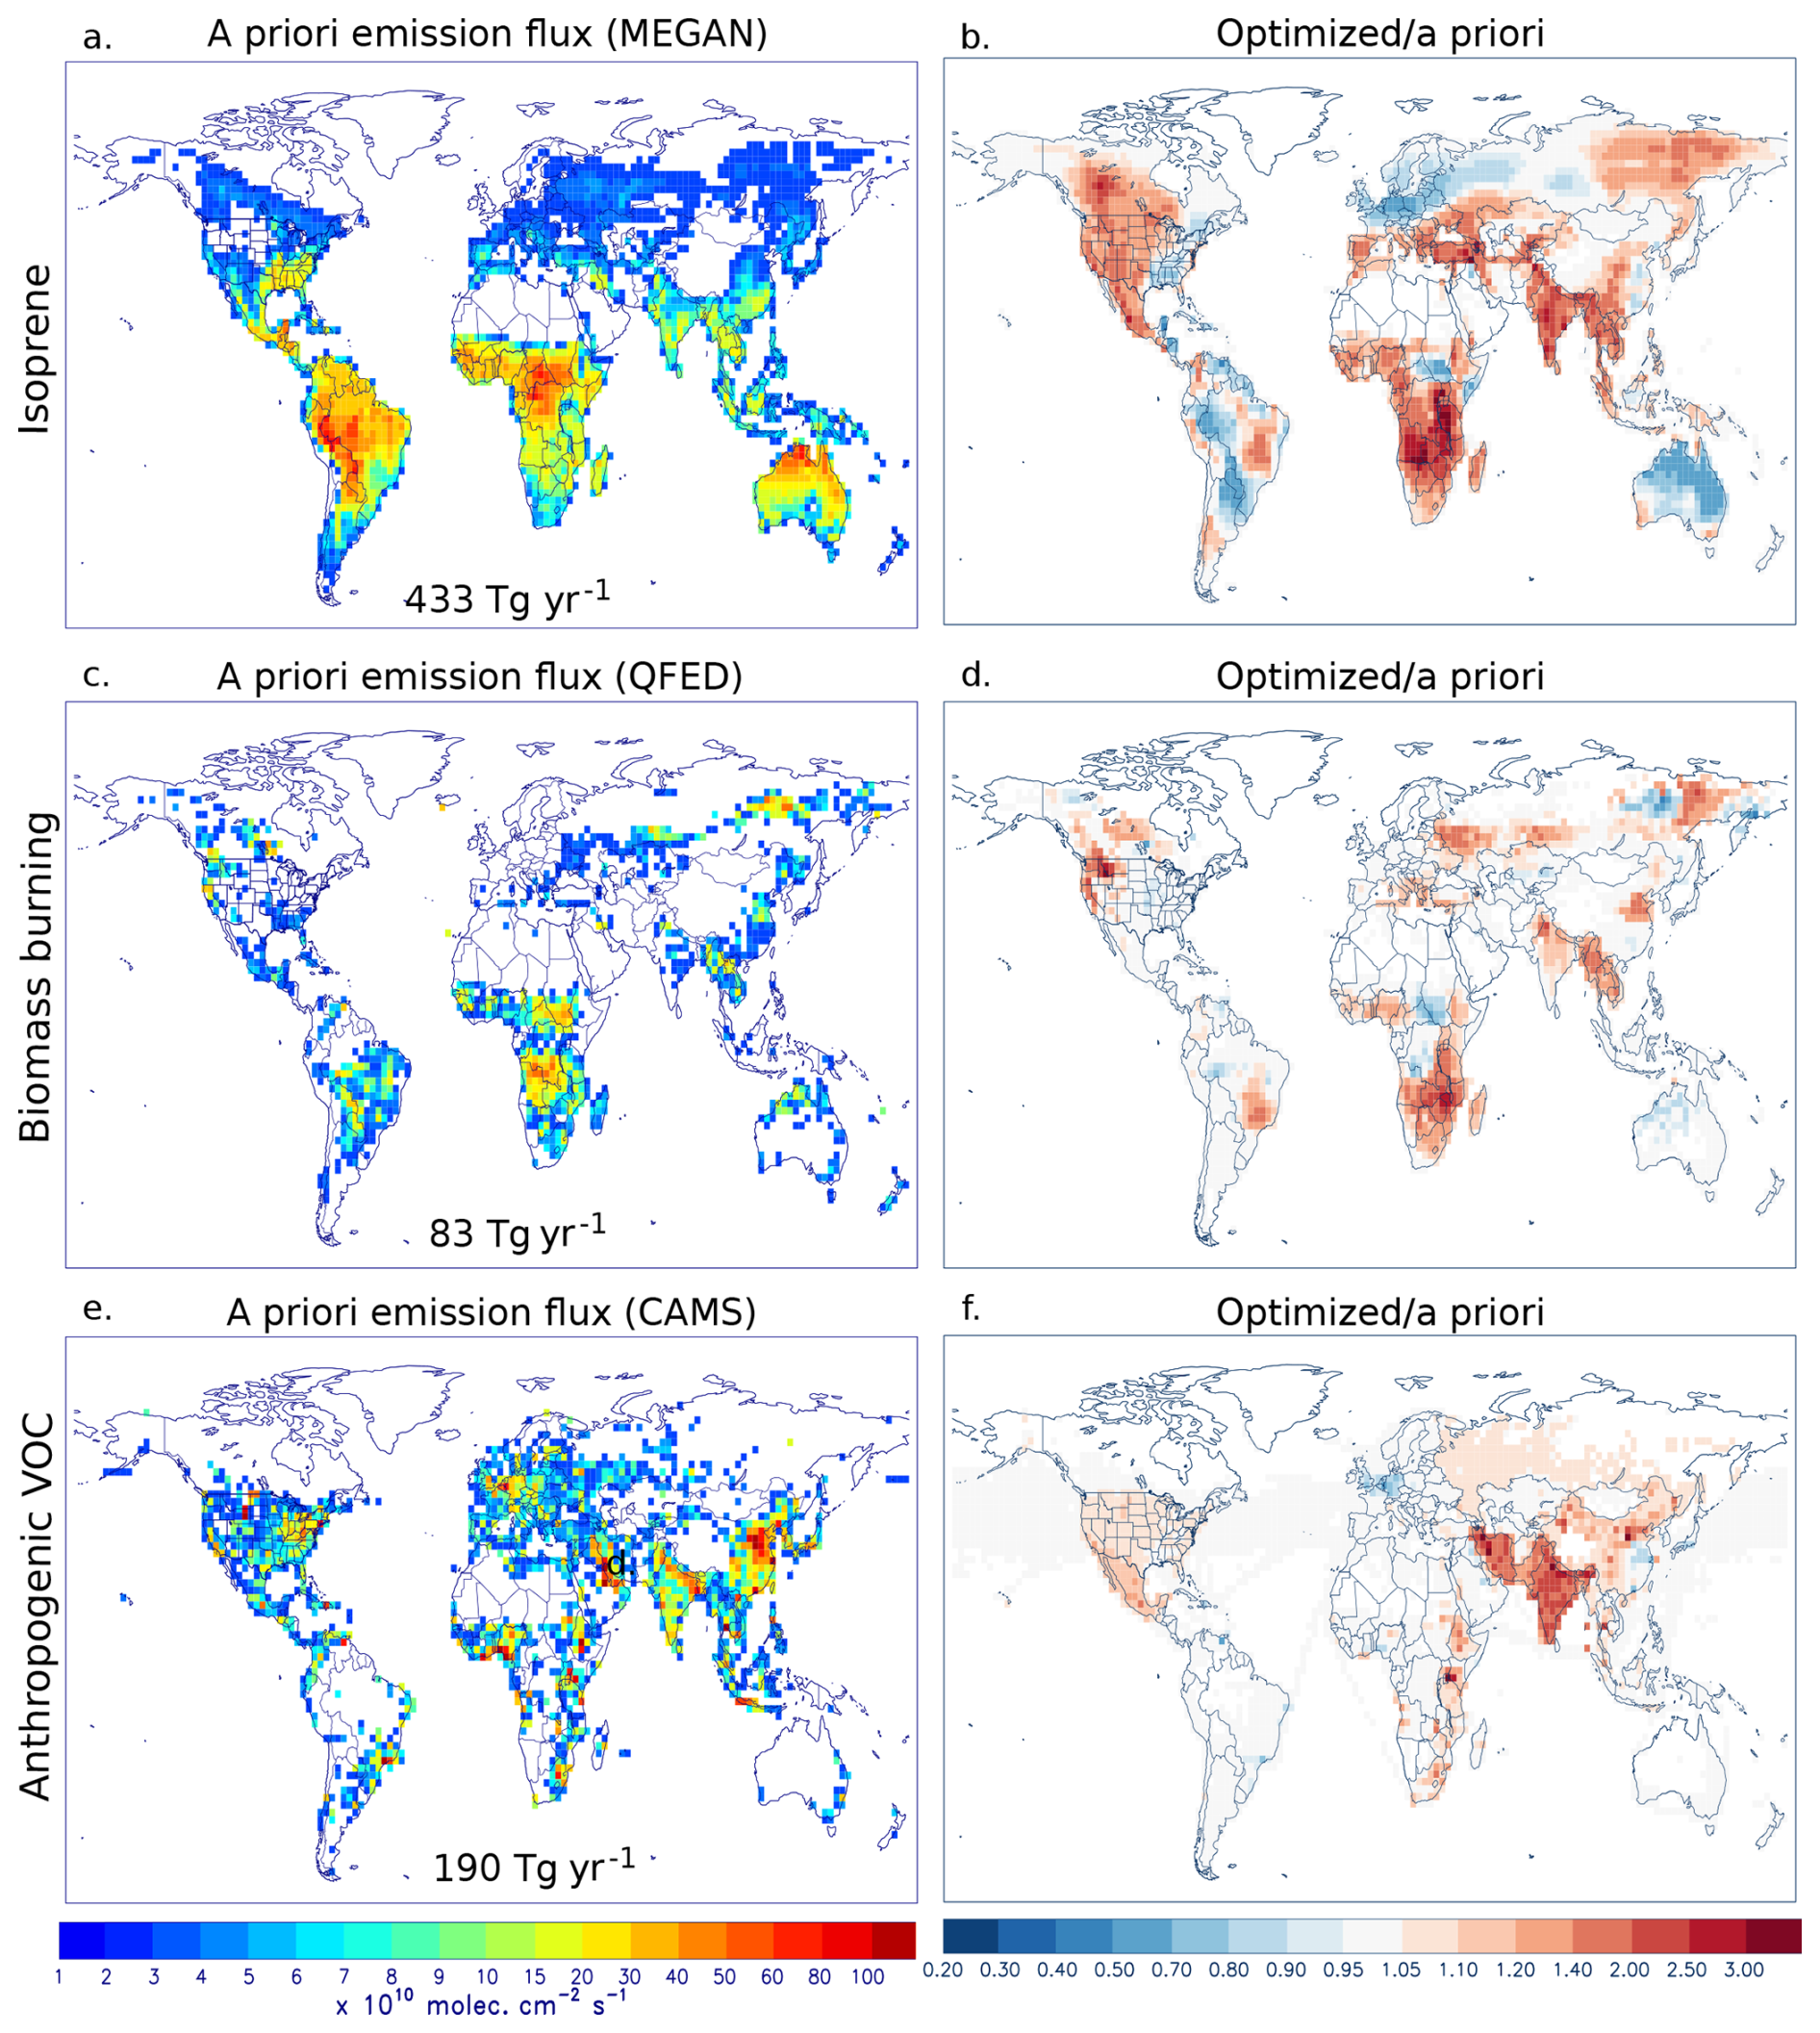
Figure 2 Emission fluxes (2021 average) from OPTHCHO study. Left panels show inventory-based global distributions of (a) isoprene, (c) biomass burning, and (e) anthropogenic VOC emissions used in the model. Blank pixels denote fluxes below 1010 molec. cm−2 s−1. The global a priori total flux per emission category is provided in each panel. Right panels show the ratio between the top-down (OPTHCHO-inversion) and bottom-up emissions of (b) isoprene, (d) biomass burning, and (f) anthropogenic compounds.
After inversion (Fig. 1e, f), the aforementioned discrepancies with the a priori model are mostly eliminated, except for a few regions with low a priori emissions, such as the west of North America and the Middle East. For instance, year-round model underestimations of HCHO in India and in the moist savanna of Southern Africa (DRC, Angola and Zambia) are largely reduced, as well as the dry season mismatch in Southeast Asia.
4.2 VOC emissions inferred from bias-corrected TROPOMI formaldehyde columns
The annual top-down global emission fluxes over 2021 inferred from the OPTHCHO inversion are displayed in Fig. 2 and summarized in Table 4. The global fluxes of isoprene, biomass burning, and anthropogenic VOC emissions are moderately increased by the inversion, by 13 %, 12 % and 20 %, respectively, compared to the bottom-up fluxes, but the inferred changes are significantly more pronounced at regional scale. The excellent top-down HCHO column agreement in Southern Hemisphere Africa seen in Fig. 1 is attained thanks to the strong increase of emissions with respect to the bottom-up inventories used in the model across all categories: 85 % more isoprene, 30 % more biomass burning VOCs and 40 % more anthropogenic VOCs (Table 4). In India, we find strong concomitant biogenic and anthropogenic flux increases with respect to the inventory (Fig. 2b, f) which are in good consistency with OMI-derived fluxes by Müller et al. (2024).
Table 4Bottom-up (a priori) and top-down continental emission estimates per source category for different world regions and globally, for the year 2021 (for the OPTHCHO and OPTHCHOGLY optimizations) or 2005–2017 (for the OMI 2005–2017 optimization by Müller et al., 2024). Regions are defined in Fig. S1 in the Supplement. N.H.: Northern Hemisphere; S.H.: Southern Hemisphere.
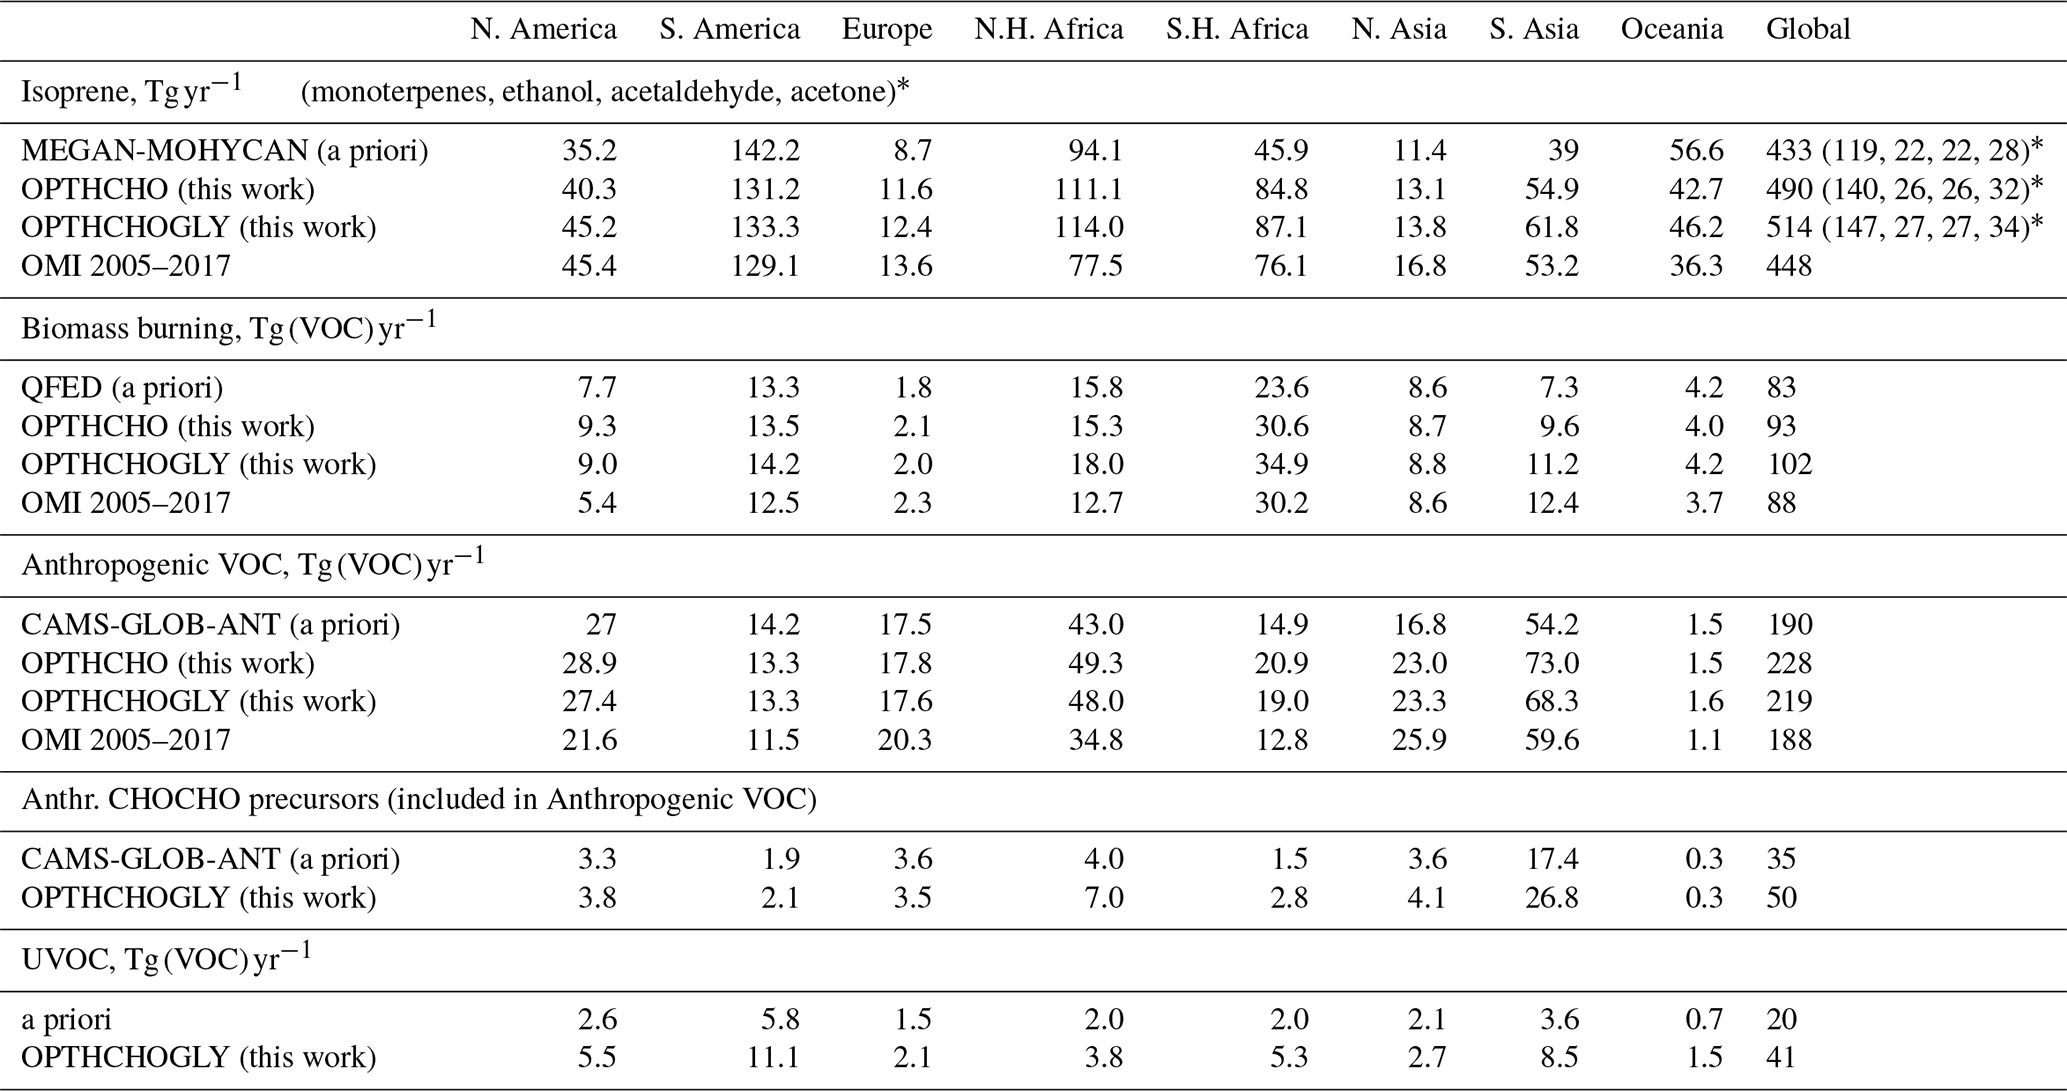
* In parentheses, global emissions are given for biogenic VOCs other than isoprene.
Significant increases of isoprene emissions as compared to the MEGAN-MOHYCAN-based model (Fig. 2a, b) are derived in Europe and South Asia, by respectively 33 % and 41 %. In Oceania, the optimization induces a moderate decrease (by 25 %). Smaller isoprene emission changes are derived throughout South America. The strongest local discrepancies, amounting to a factor of 2 to 3 locally between the bottom-up and optimized model, are observed in Turkey, India, Myanmar, Thailand, in the western part of North America (Canada, the U.S., and Mexico), in the Russian Far East, and in the moist savanna of Southern Africa (Angola, Zambia, Zimbabwe, Malawi, Tanzania). The pronounced increase in isoprene fluxes in Turkey are broadly consistent with the study of Oomen et al. (2024), which relied on weekly bias-corrected TROPOMI HCHO over Europe, and inferred an emission increment of approximately a factor of 4. In comparison, less marked but positive emission increments (+50 %) were derived based on OMI HCHO column data by Bauwens et al. (2016).
The TROPOMI-based OPTHCHO isoprene fluxes are compared with previous estimates based on bias-corrected OMI HCHO data (2005–2017, Müller et al., 2024) in more detail in Fig. 3. Globally, the top-down isoprene estimates from these two inversions are consistent in magnitude: 490 vs. 448 Tg yr−1 for the TROPOMI and OMI inversions, respectively. The spatial distributions of the isoprene emission ratios (Fig. 3b, d) are similar for the TROPOMI and OMI-constrained inversions in most regions that featured significant emission increases with respect to their bottom-up fluxes, such as in the western part of North America, Southern Hemisphere Africa, South Asia, and Turkey. Both inversions show little change, or even a decrease, in Northern Africa, the southern part of South America and Australia. Significant exceptions are Europe, North Asia and the Eastern United States, where the OMI-constrained inversion resulted in strongly enhanced isoprene emissions with respect to the a priori model, while no such enhancement is observed in the TROPOMI-constrained model. The reasons for these differences are likely related to differences in the HCHO columns between OMI and TROPOMI, especially at mid-latitudes. Indeed, the (bias-corrected) HCHO columns from TROPOMI (Fig. 1) are generally lower than the corresponding OMI columns used by Müller et al. (2024) (their Fig. 6a, d) at mid-latitudes, and more specifically over Eastern US, Eastern China and northern Europe.
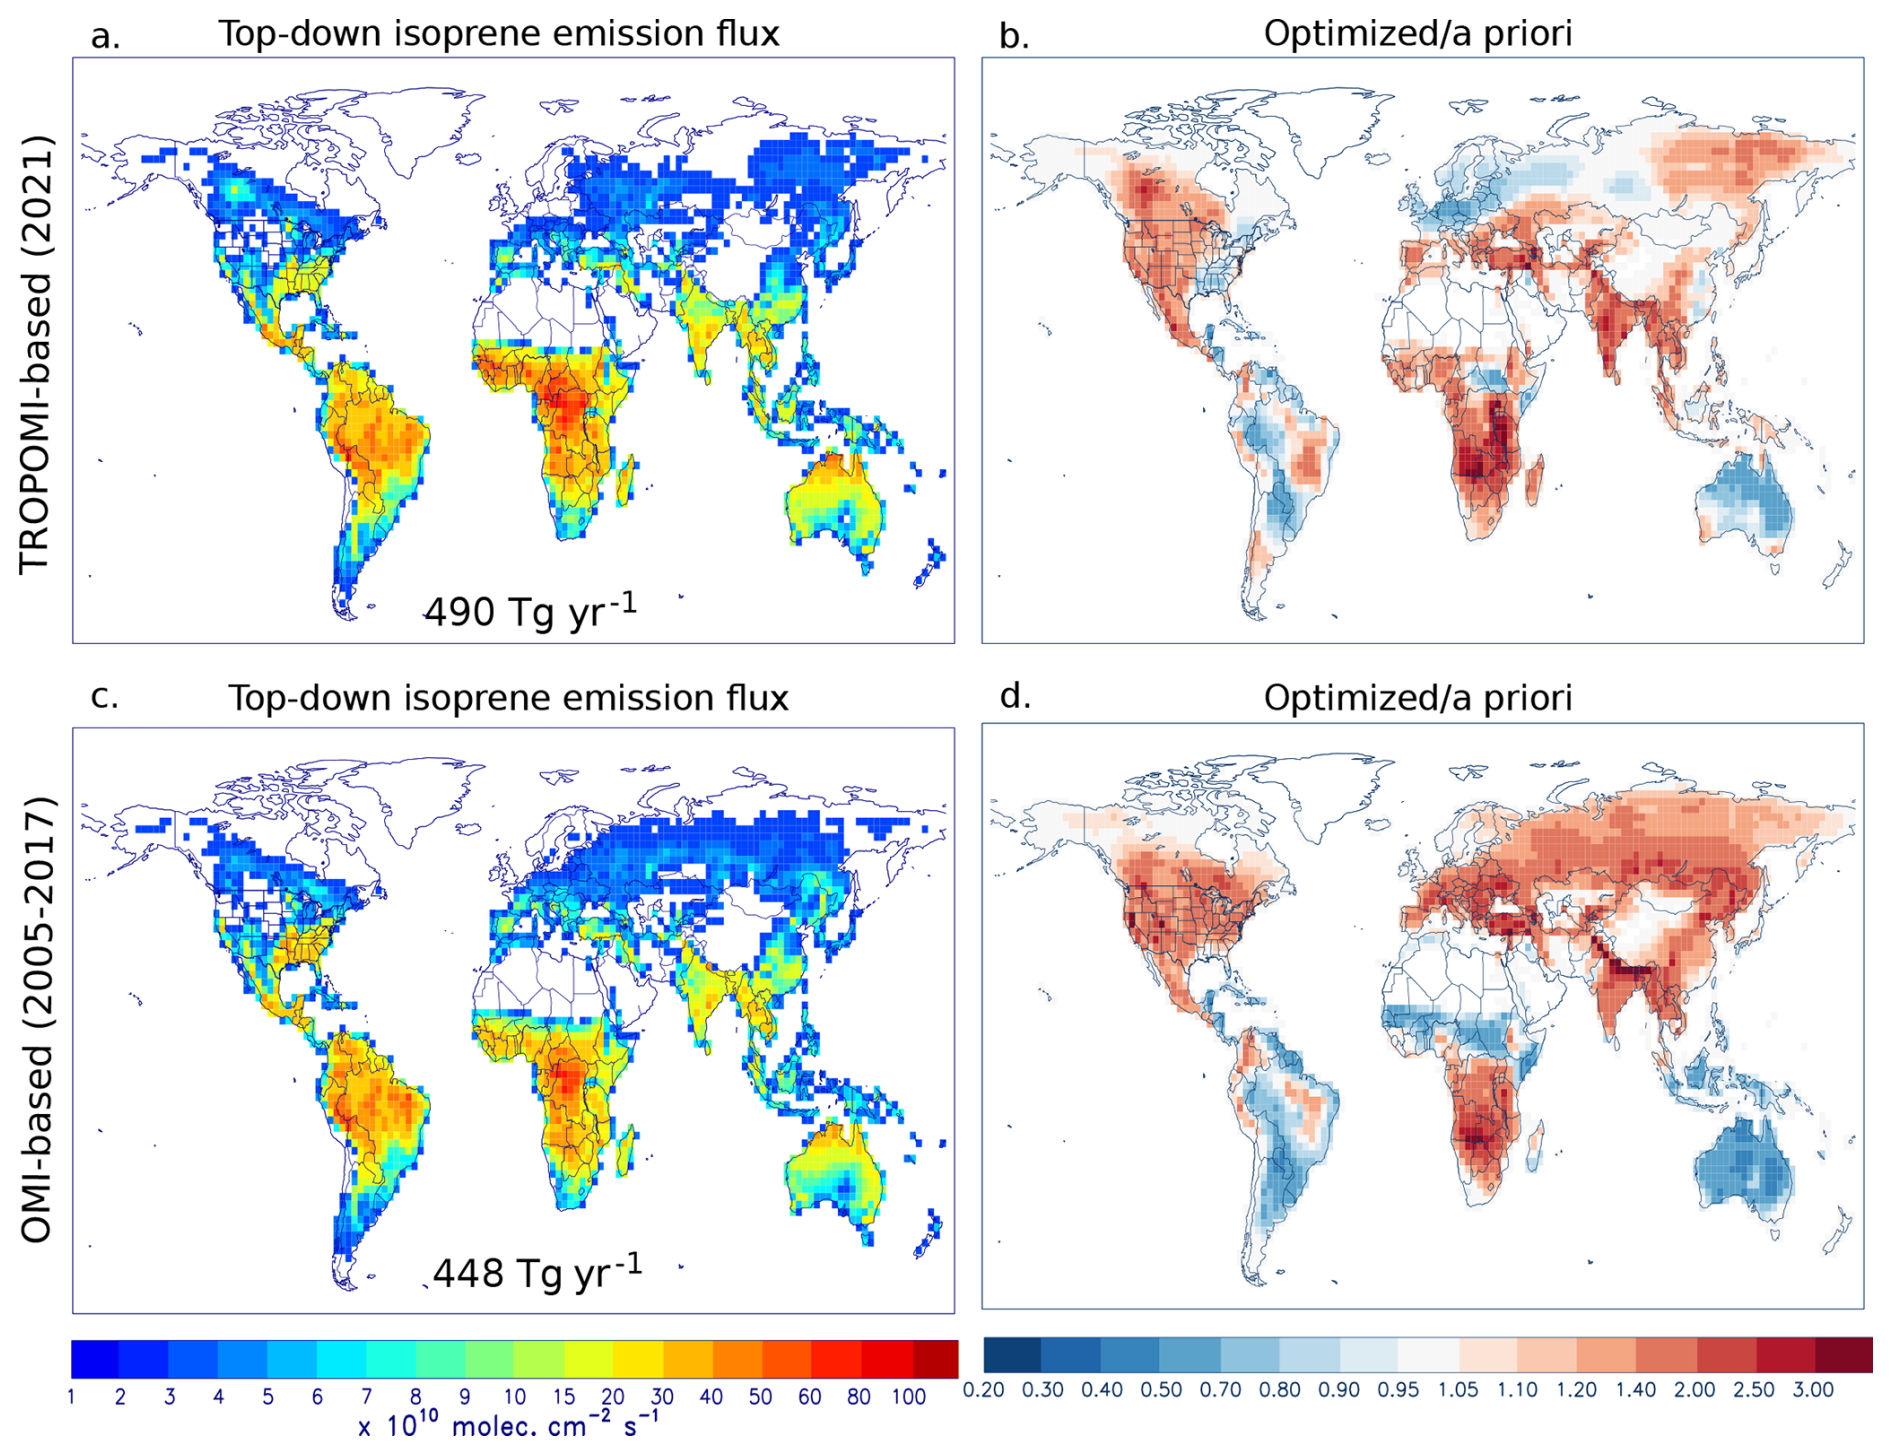
Figure 3 Modeled isoprene emission fluxes based on different satellite observations. (a) Average isoprene emission for 2021 constrained by TROPOMI formaldehyde columns, from this work (OPTHCHO inversion). (b) Average isoprene emission for 2005–2017 constrained by OMI formaldehyde columns, from Müller et al. (2024). Right panels show the ratio between the top-down and the bottom-up derived emissions of the (b) TROPOMI and (d) OMI inversion.
Significant differences between top-down and bottom-up (QFED) biomass burning emissions (Fig. 2c, d) are found in Southern Africa, especially over Zambia, Zimbabwe and Mozambique. This feature has been reported in previous inverse modeling studies relying on SCIAMACHY and OMI HCHO data (Stavrakou et al., 2009b; Bauwens et al., 2016; Müller et al., 2024). Multiple other hotspots in Fig. 2d correlate with locations where agricultural fires are a common practice to prepare land for the upcoming planting season. For example, over north India, the large emission increase corresponds with annual post-monsoon crop residue burning in November (Lan et al., 2022). This results corroborates previous reporting of severe inventory underestimations in the region (Liu et al., 2020b). Strong emission enhancements are also inferred in the North China Plain, where post-harvest burning is a common practice every year in May-June. These are in good agreement with previous estimates (Liu et al., 2015; Stavrakou et al., 2016; Lv et al., 2024). Likewise, the satellite data indicate a marked increase of fire emissions from European Russia and Belarus associated with human-induced fires in grasslands, arable, or abandoned lands occurring in spring and summer (McCarty et al., 2017) which are known to be underrepresented in bottom-up inventories (Glushkov et al., 2021). Myanmar is a known biomass burning hotspot, where shrubland fires and agricultural fires constitute roughly half of the burnt area (Biswas et al., 2015). In March, pyrogenic emissions from the optimized model are twice as large as the bottom-up estimate there. Alongside those systematically occurring fires, episodic and sometimes extreme wildfires may occur in other regions, such as the boreal forests across Siberia (Ponomarev et al., 2023). A very large fire event took place in eastern Siberia in July–August 2021, which released over 3 Tg(VOC) according to QFED. It caused very large TROPOMI HCHO columns (Fig. 1) which are well represented in the bottom-up model. The emission optimization indicates a moderate pyrogenic emission reduction, by 22 % in these months, but its impact on modeled HCHO columns is more than compensated by a concomitant increase in isoprene fluxes in the same area (+29 %). Intense forest fires also occurred across the northwestern United States in July 2021. In the states of Washington, Oregon, Idaho and Montana, the strong bottom-up model underestimation of the HCHO columns leads to almost a threefold increase of pyrogenic emissions: from 0.43 Tg of VOC (July) in the bottom-up model to 1.2 Tg after optimization. In western Canada, in particular British Columbia and Manitoba, large emissions are reported by QFED (2.4 Tg VOC annually within 42–50° N and 90–125° W), but these are not significantly modified by the inversion (2.6 Tg) despite the large model underestimation of a priori HCHO columns in this region (Fig. 2). The improved (though still insufficient) representation of the formaldehyde columns there, after optimization, is primarily a result of enhanced biogenic emissions (+53 % annually). Since the increase in biogenic emissions began a month earlier, in June, well before the peak of the 2021 fire season (only ∼ 0.05 Tg of pyrogenic VOCs were reported in June), it is unlikely that source confounding occurred. One can therefore reliably conclude that biogenic summertime emissions, rather than pyrogenic ones, are underestimated by the emission inventories in Canada and the northwestern U.S.
Average anthropogenic VOC emissions (Fig. 2e, f) have nearly doubled in Iran and India. These changes are discussed in more detail in Sect. 4.4.
4.3 Atmospheric sources and sinks of glyoxal
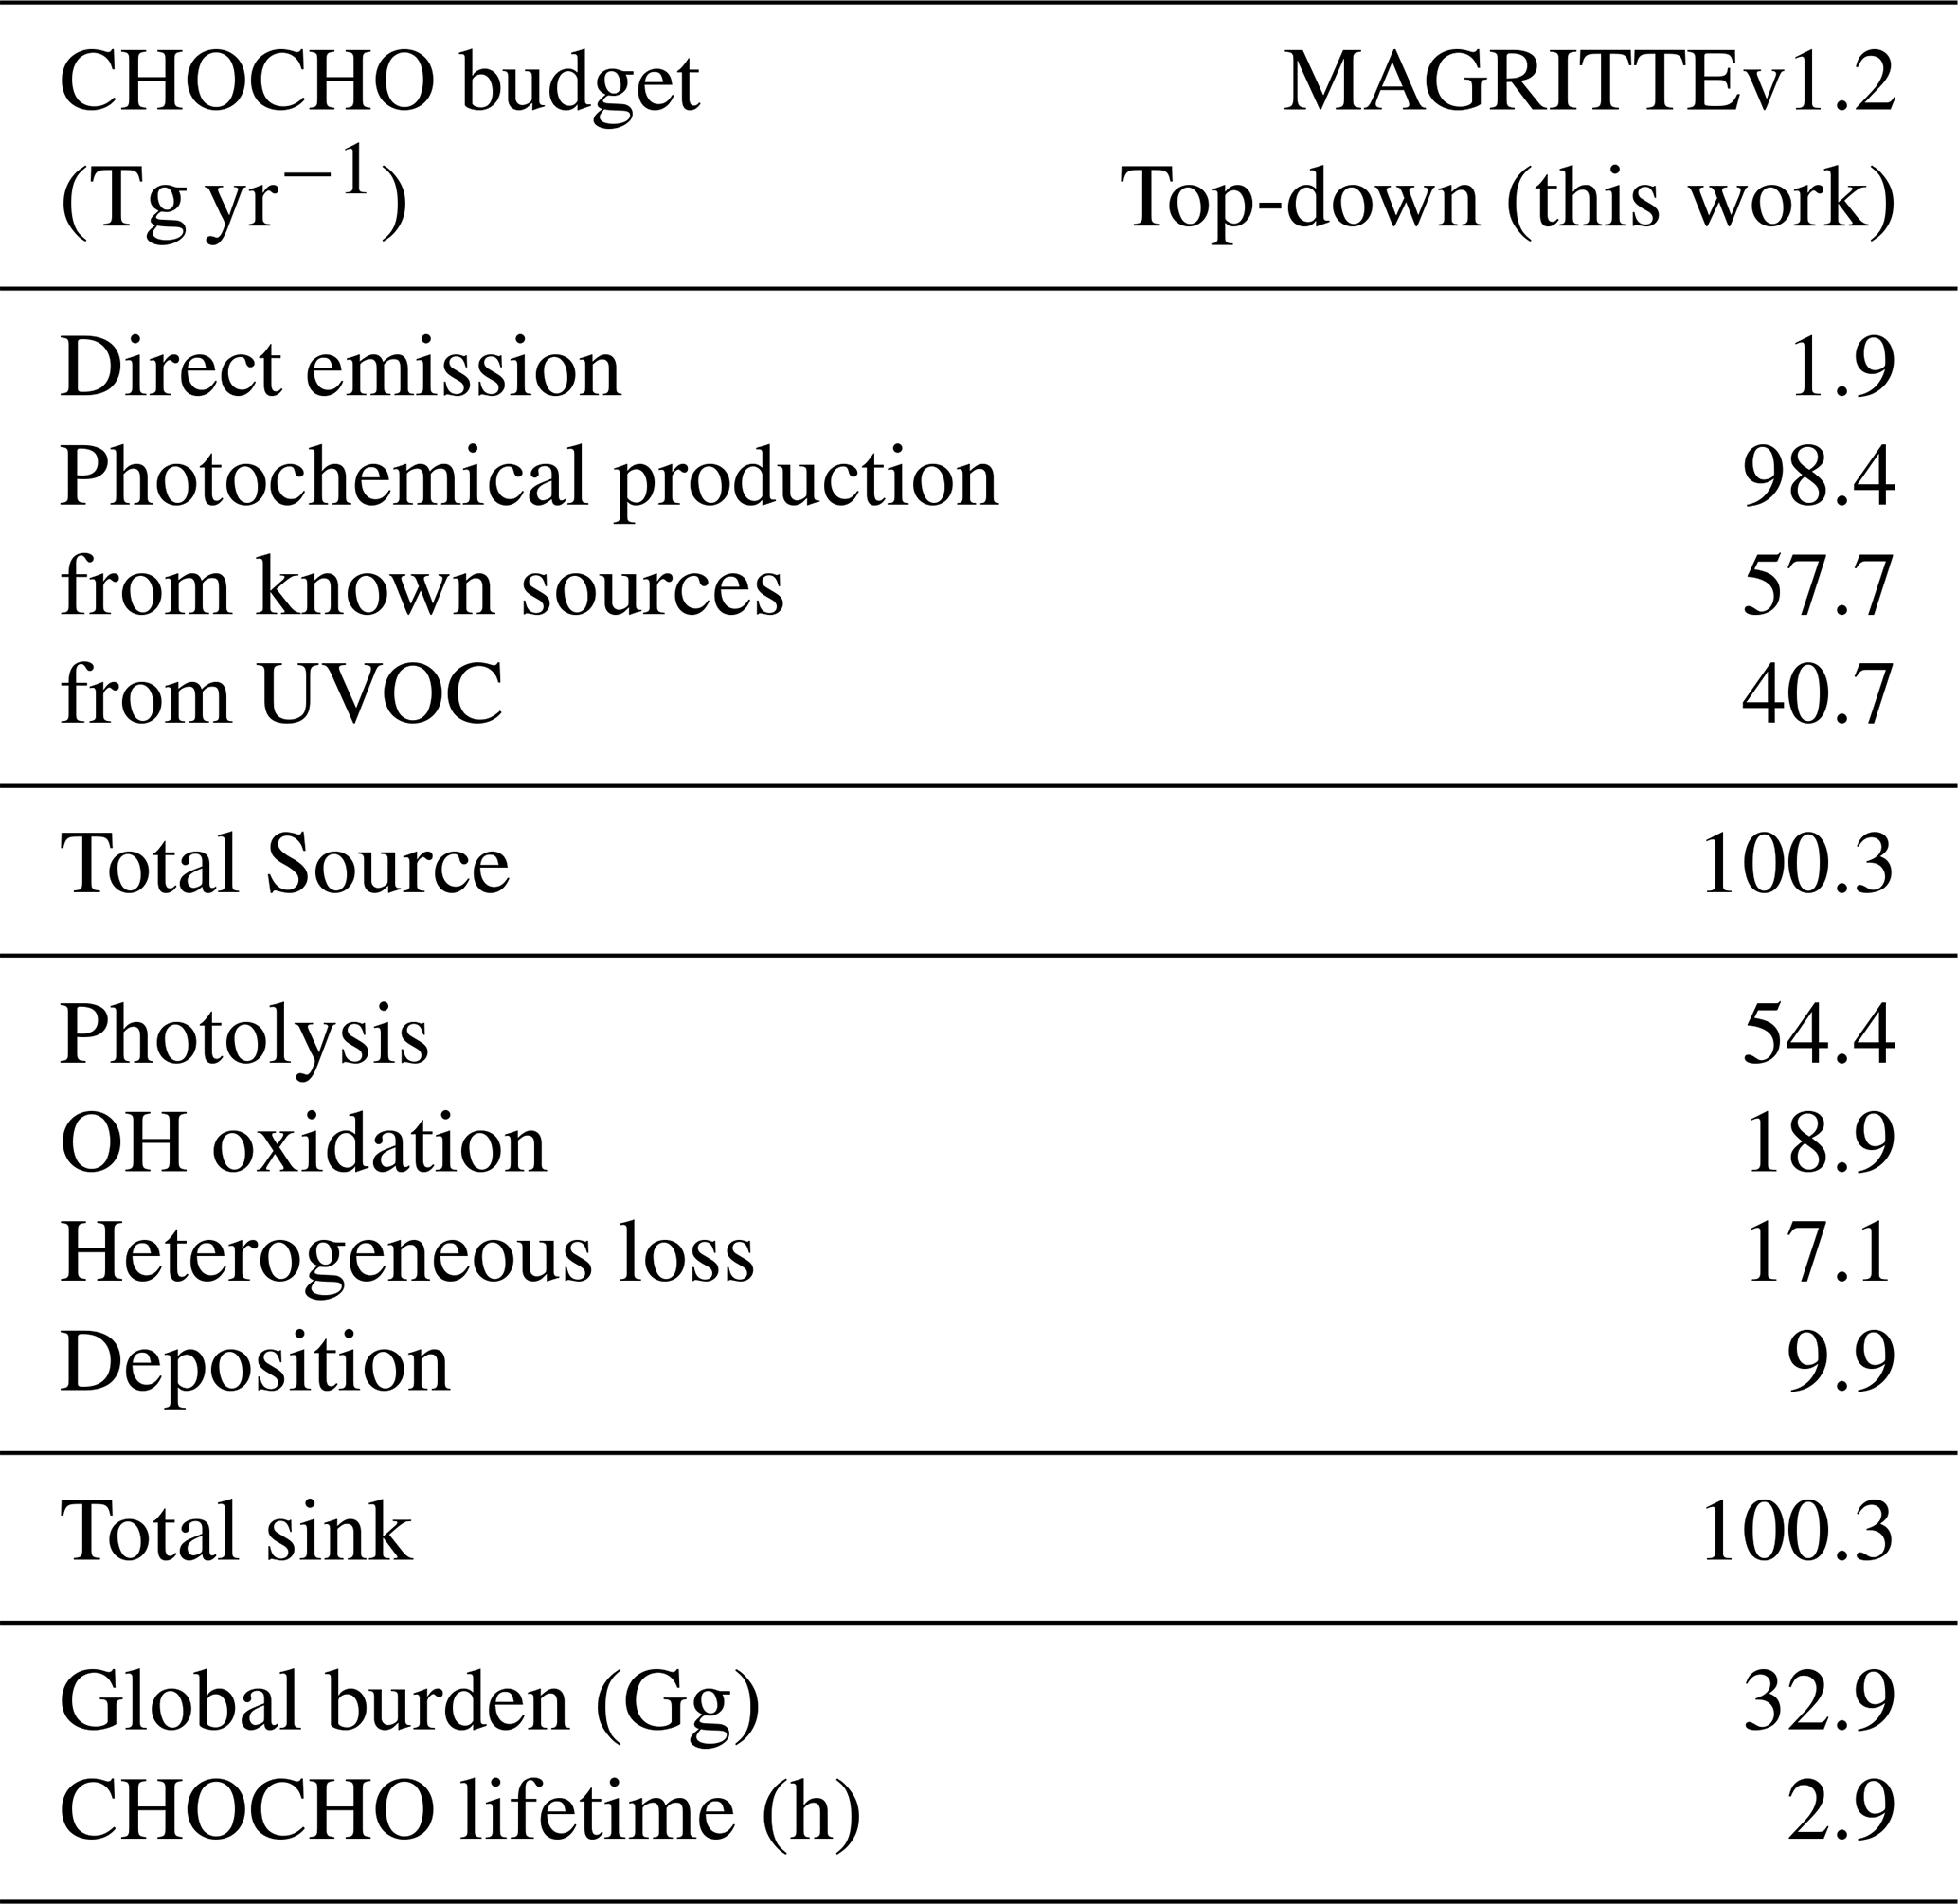
The global top-down glyoxal budget is presented in Table 5. The global annual glyoxal source doubles from 48 Tg in the inventory-based model run (without UVOC) to 100 Tg after inversion. This result is in line with the SCIAMACHY-based inversion result for the year 2005 (Stavrakou et al., 2009c). For a small part (12 Tg), the source enhancement is due to increased emissions of known glyoxal precursors including isoprene (+19 %), monoterpenes (+24 %), pyrogenic VOCs (+23 %) and anthropogenic glyoxal precursors (+43 %). The rest (41 Tg) is due to unidentified VOC precursors (UVOC). The top-down emissions are discussed in more detail in Section 4.4. The glyoxal lifetime incurs little change through the optimization (Table 5), similar to findings in Stavrakou et al. (2009c).
Table 5Top-down (OPTHCHOGLY) global budget of atmospheric glyoxal (Tg yr−1). UVOC: unidentified VOC precursors.
The glyoxal columns from the two-compound OPTHCHOGLY inversion are displayed in Figs. 4 and 5. TROPOMI measures high year-round glyoxal column abundances in the Tropics. In the northern and southern temperate zones, the columns peak during local summer. Although the a priori model reproduces relatively well the patterns of the observed glyoxal distribution (Fig. 5a–d), the magnitudes are strongly underestimated. The gap is largely closed after inversion (Fig. 5e, f).
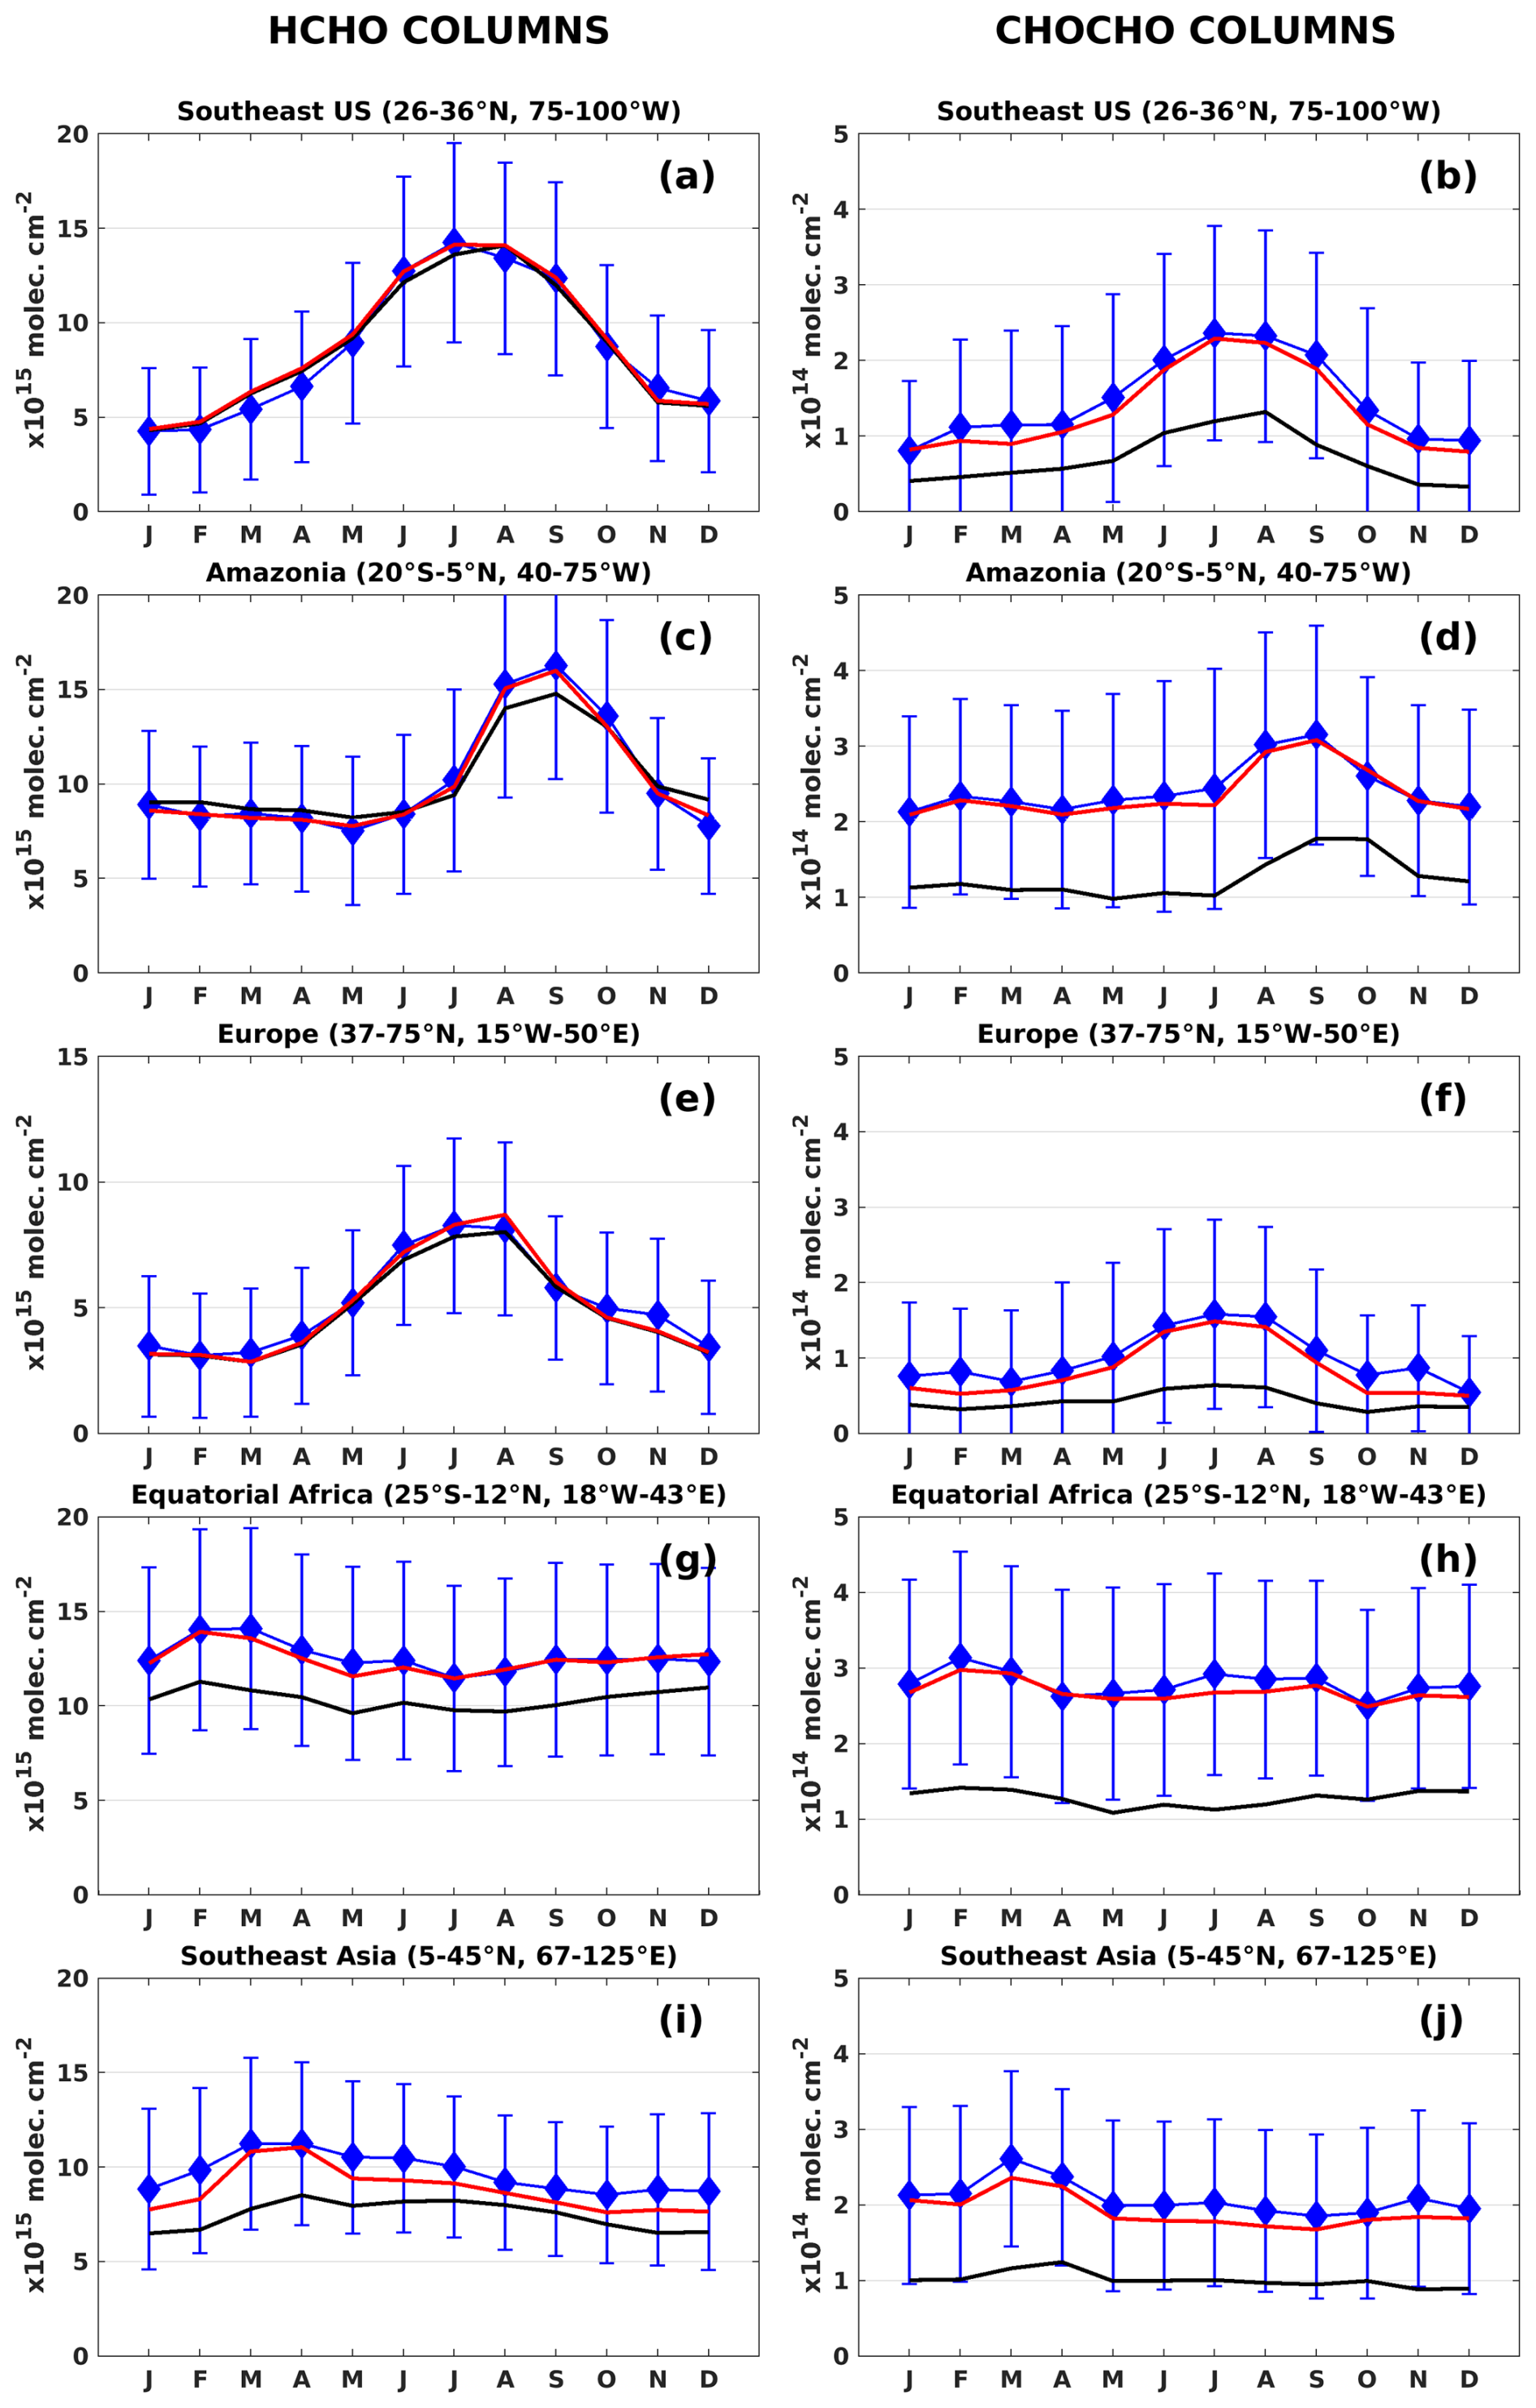
Figure 4 Monthly mean formaldehyde (left) and glyoxal (right) columns simulated with MAGRITTEv1.2 and observed by TROPOMI (blue diamonds) for 2021. The regions are defined as bounding boxes with coordinates given in each subfigure and shown on Fig. S1. Error bars correspond to the errors used in the inversion (cf. Sect. 3.2). Black solid lines correspond to the a priori simulation, red to the optimized columns of the OPTHCHOGLY inversion. The optimized HCHO columns from the OPTHCHO inversion (not shown) are very similar to the OPTHCHOGLY results. Units are 1015 molec. cm−2 for HCHO, 1014 molec. cm−2 for CHOCHO.
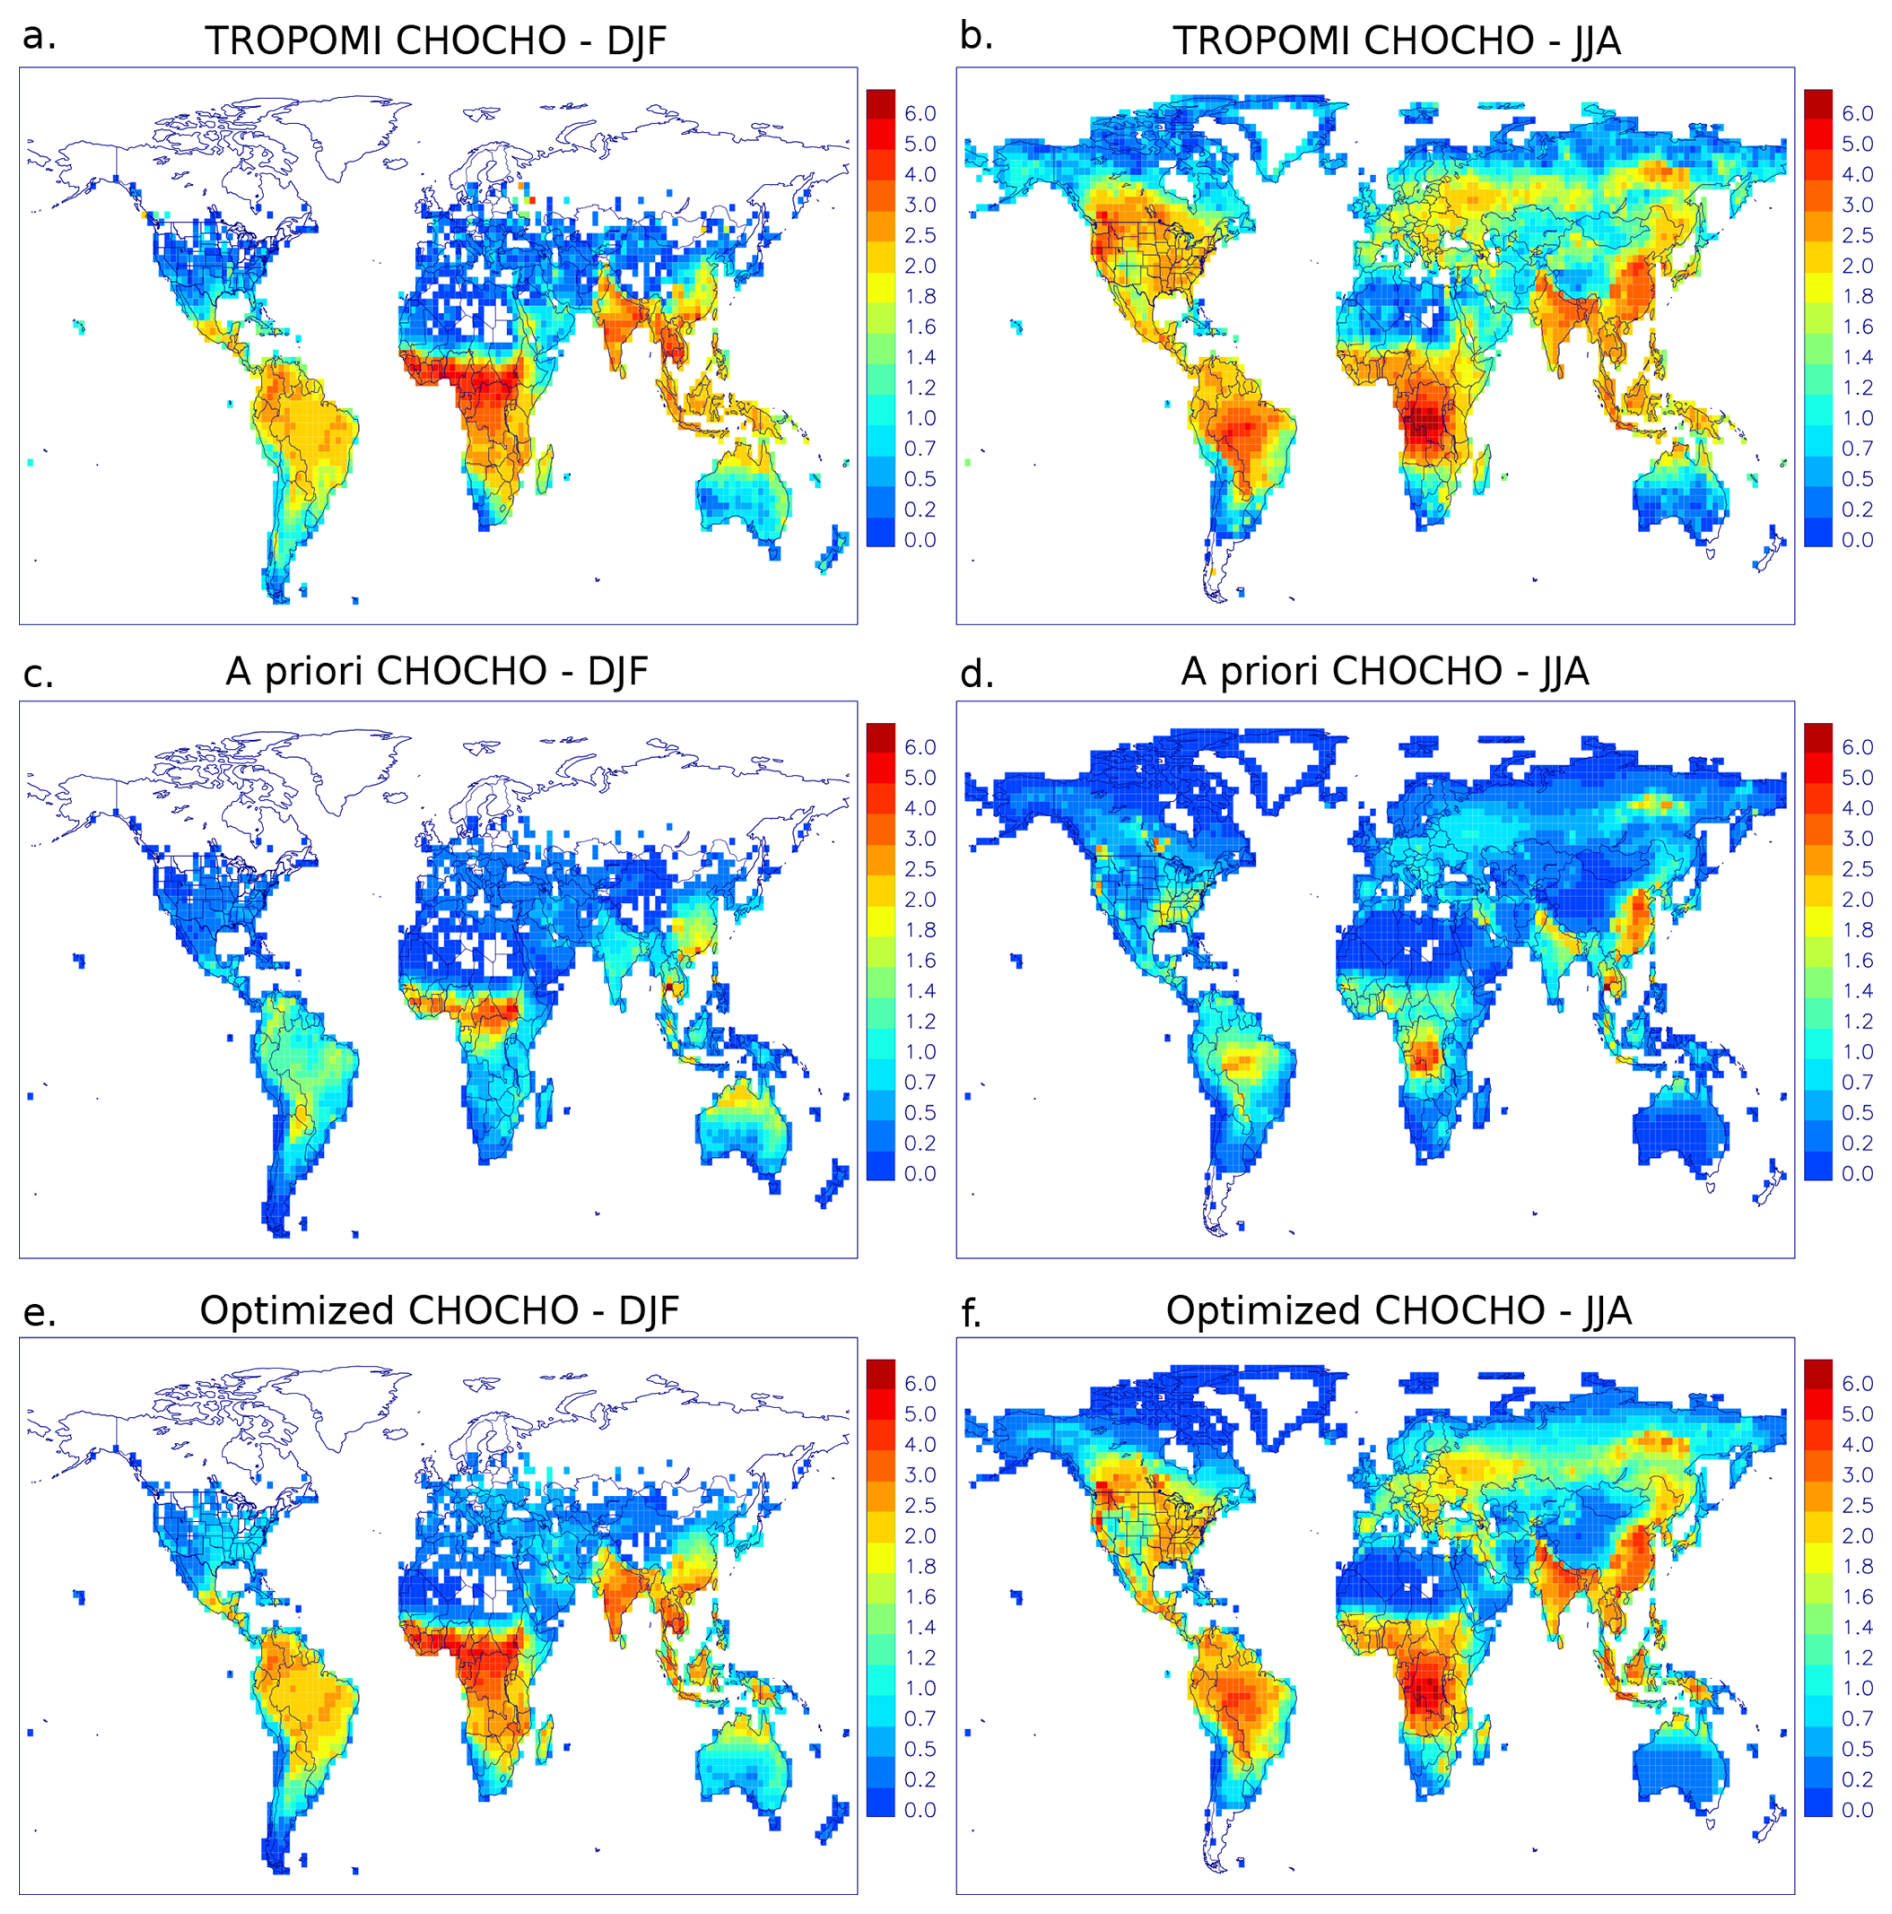
Figure 5CHOCHO columns averaged over December, January, February (DJF) and June, July, August (JJA) in 2021 (1014 molec. cm−2). (a, b) TROPOMI columns. (c, d) Model columns with a priori (bottom-up) emissions, without the UVOC a priori emissions. (e, f) Model columns optimized through the top-down inversion constrained by TROPOMI HCHO and CHOCHO columns (OPTHCHOGLY).
After inversion, the glyoxal columns remain underestimated in many arid and semi-arid areas, including the Arabian Peninsula (by about a factor of 3) and, during summer, northwestern China and Inner Mongolia (locally by more than a factor of 5), and the Western United States (by a factor of 1.5), i. e. low-emission areas according to emission inventories. In the Western U.S., formaldehyde columns remained underestimated after inversion as well (see Sect. 4.1). In Northwestern China and Inner Mongolia, the mining, combustion and processing of coal have intensified drastically since 2010, and the accuracy of the related emissions in bottom-up inventories is relatively low (Zhu et al., 2022). Similarly, it has been found in numerous studies that anthropogenic emission inventories do not accurately represent observations around the Red Sea and the broader Middle East region (Osipov et al., 2022). These factors likely contribute to the lower model performance in those regions.
Figure 5b and d show a severe underestimation of a priori glyoxal columns in summer in the extra-tropical Northern Hemisphere, especially over the global boreal zone and over broadleaf and mixed zones across the U.S. and Europe. This discrepancy is corrected after inversion (Figs. 5f, 4b, f). The effect can be seen in more detail for the broadleaf zones in the time series in Fig. 4b and f: in the Southeast U.S. during summer, the a priori columns are half the observed values, and the difference vanishes after optimization (Fig. 4b). Over Europe, the a priori model discrepancy is smaller in winter, while in summer, the measured column exceeds the a priori values by about 150 %, with the gap closing after inversion (Fig. 4f).
In tropical regions, the observed seasonality is relatively weak and is well captured by the model. The peak of glyoxal concentration around September results from a combination of direct emissions from fires and photochemical production from pyrogenic hydrocarbons (Kluge et al., 2023), as well as biogenic emissions, which are more pronounced in the dry season. The bottom-up underestimation of the glyoxal columns by a factor of 2 year-round gives way to an excellent match in the top-down model (Fig. 4).
4.4 Top-down VOC emissions inferred using TROPOMI formaldehyde and glyoxal columns
As compared to the formaldehyde-constrained inversion (OPTHCHO), the additional constraints provided by glyoxal observations (OPTHCHOGLY) increase the pyrogenic emissions by 10 % globally, whereas isoprene and anthropogenic emissions show small changes (within 5 %) (Table 4). Most significantly affected are the pyrogenic emissions in Africa and South Asia, where the total annual emissions are increased by circa 15 % in OPTHCHOGLY relative to OPTHCHO inversion. The only significant change in isoprene emissions occurs in North America and South Asia, which both increase by circa 12 % compared to the OPTHCHO model. For most other regions, the optimized OPTHCHOGLY emissions remain close to the OPTHCHO results (Table 4 and Fig. 6). Although, for each of the three categories, the global total annual emissions derived in this work (either OPTHCHO or OPTHCHOGLY) are higher than both the bottom-up estimates and the estimates by Müller et al. (2024), regionally, the top-down isoprene emissions derived from OMI columns by Müller et al. (2024) are higher than those obtained here at northern extratropical latitudes (North America, Europe and North Asia), as well as the anthropogenic VOC emissions in Europe and North Asia (Table 4). Those discrepancies are likely due to differences between (bias-corrected) OMI and TROPOMI columns.
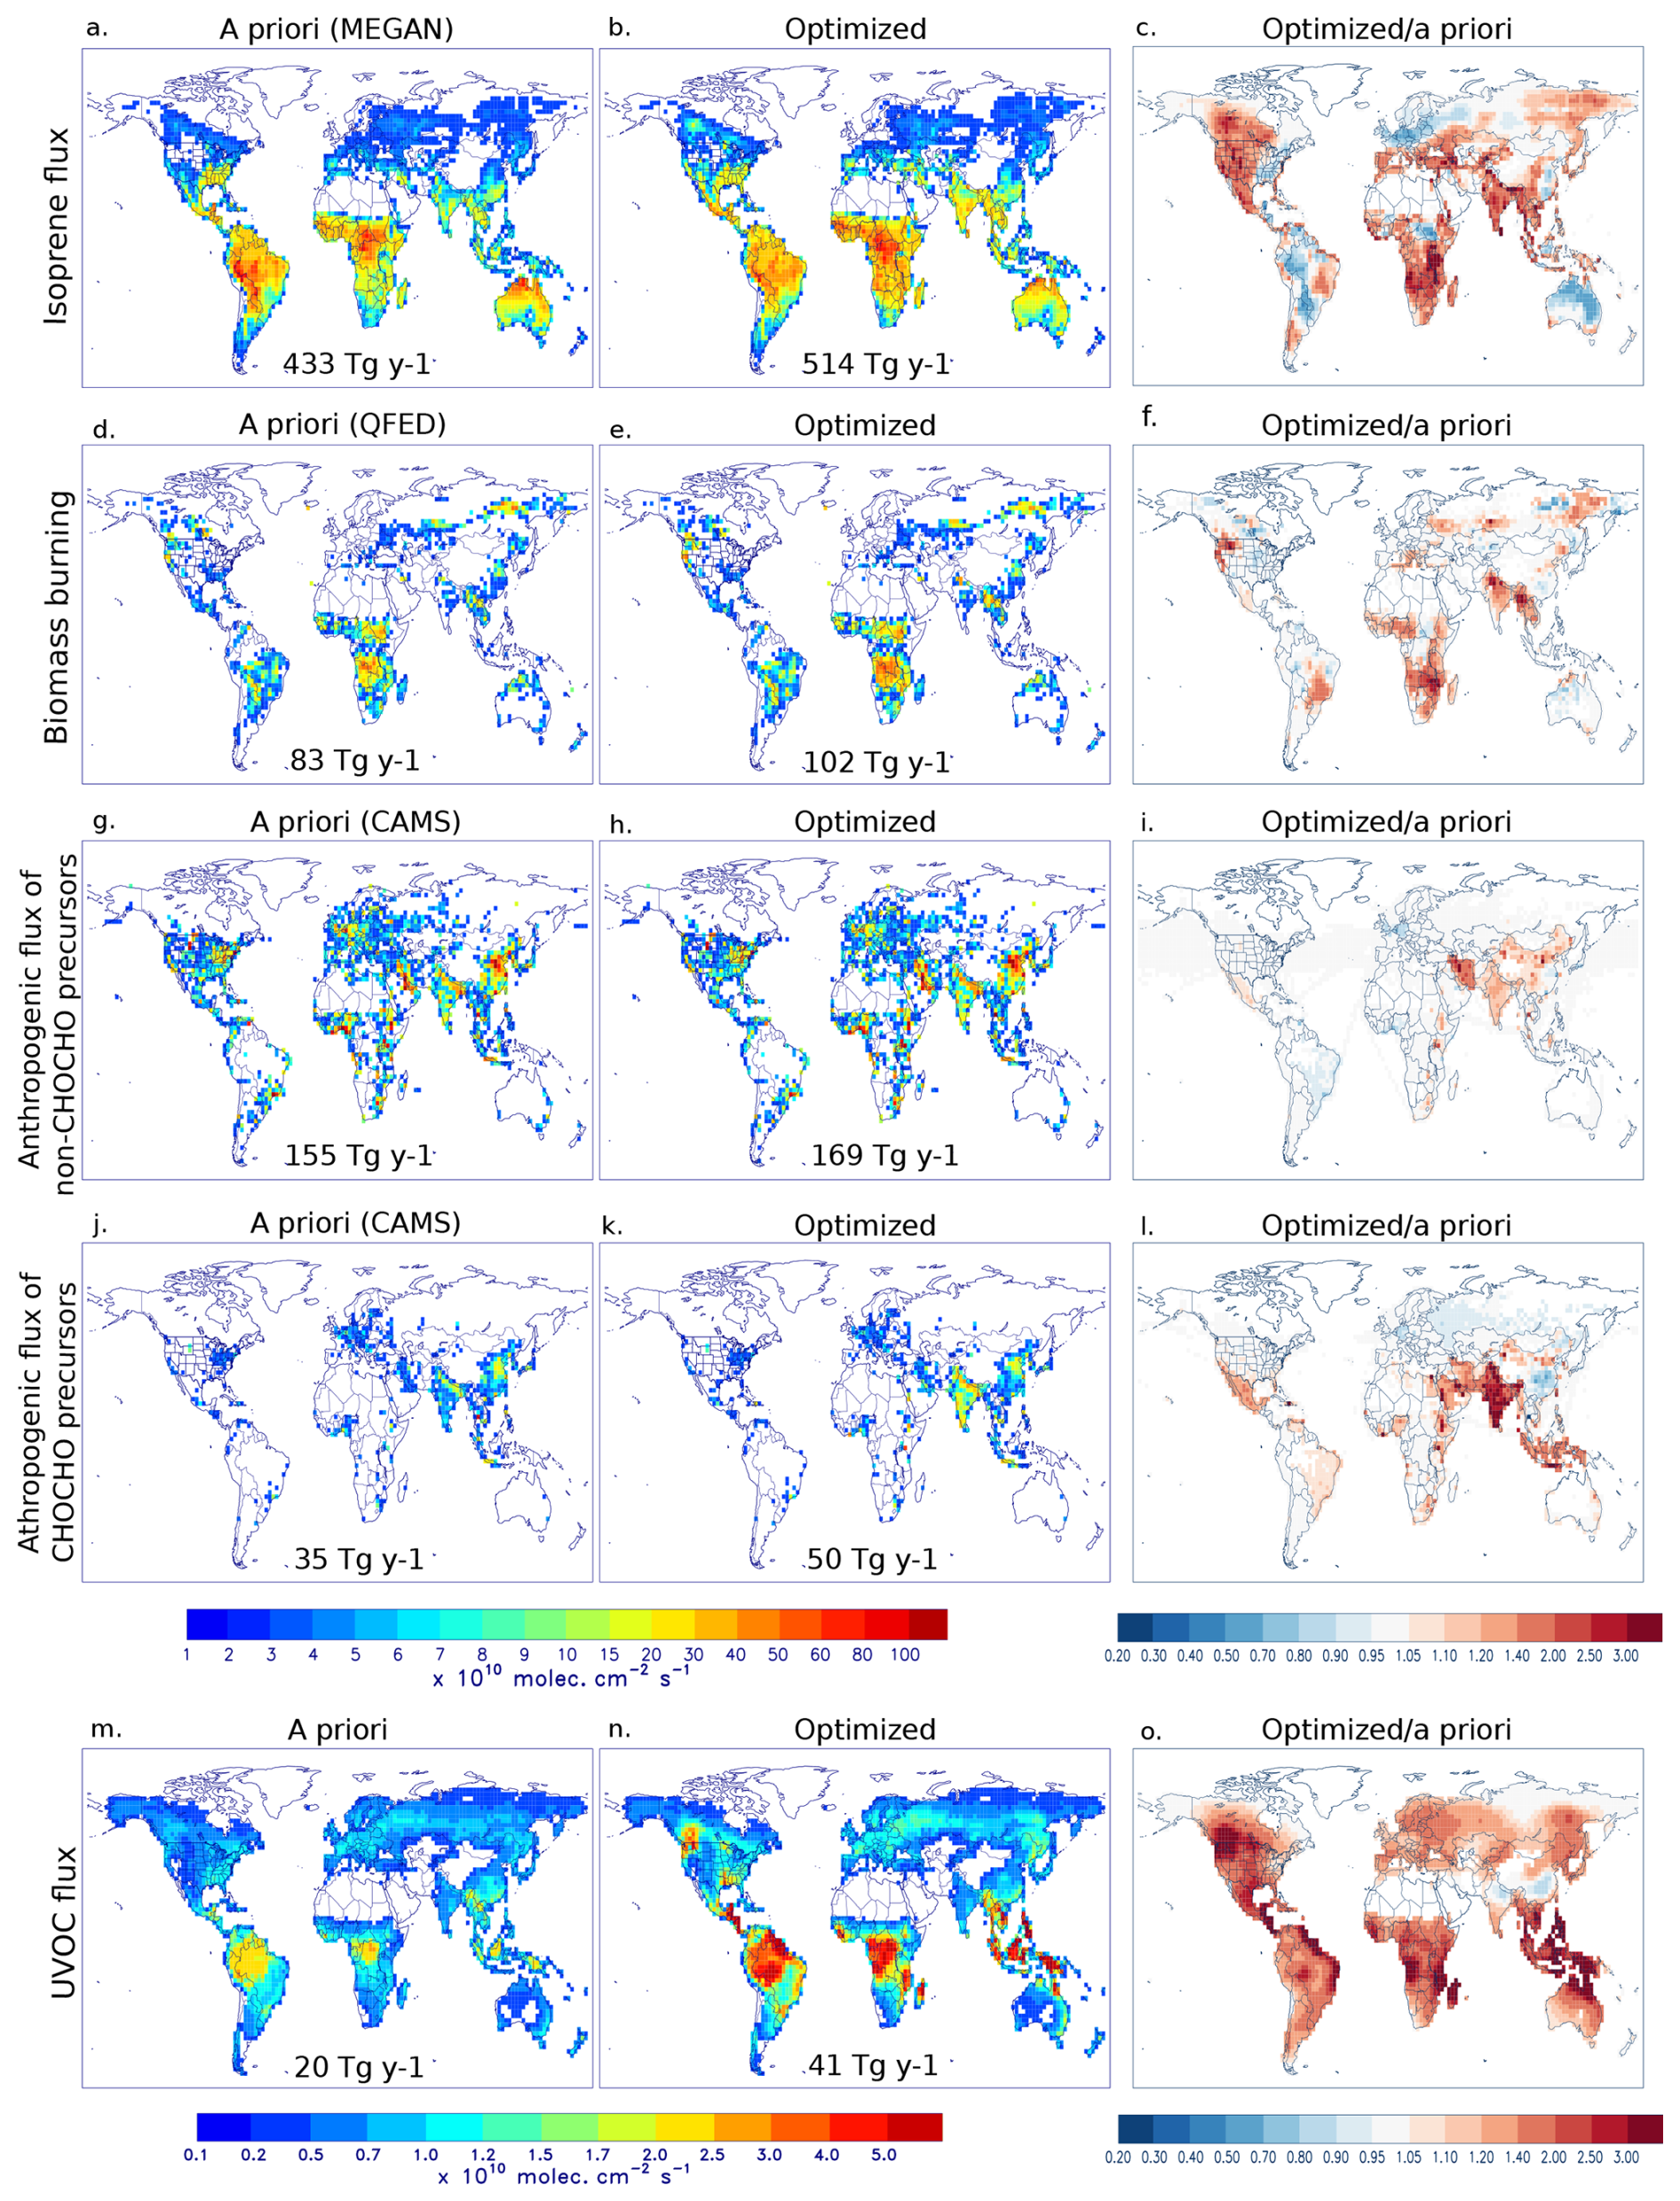
Figure 6 Global distributions of bottom-up emissions (left) and top-down emissions (middle) from the OPTHCHOGLY inversion over 2021, for isoprene (a, b), biomass burning VOCs (d, e), anthropogenic VOCs non-glyoxal precursors (g, h), anthropogenic glyoxal precursors (j, k), and the UVOC glyoxal precursor (m, n). The global total flux per emission category for 2021 is given inset. Right panels show the ratio of the top-down by the a priori emissions.
In every category, Indian emissions are drastically larger than in the inventories: yearly isoprene emissions are more than doubled (from 8 to 17 Tg), pyrogenic emissions are tripled (to 3 Tg), and anthropogenic VOCs are 1.6 times larger (from 12 to 19 Tg). The latter is more in line with other recent assessments in the literature, e.g. 16 Tg for the year 2015 according to the bottom-up inventory of Venkataraman et al. (2020) and 20 Tg in 2009 for the entire indian subcontinent in the OMI-based top-down estimation by Chaliyakunnel et al. (2019). Due to rapid economic growth and limited regulations targeting anthropogenic VOC sources in India (Ganguly et al., 2020), these emissions show a significant positive trend based on long-term OMI HCHO data (Bauwens et al., 2022; Müller et al., 2024) and are expected to have increased steadily up to 2021.
Two additional categories are optimized in the OPTHCHOGLY setup: the anthropogenic glyoxal precursors (Sect. 4.4.1) and the unspecified glyoxal precursor UVOC (Sect. 4.4.2). The former includes all main aromatic compounds (benzene, toluene, ethylbenzene, xylenes, trimethylbenzene, and styrene), as well as acetylene and ethene. All categories included, the annual global VOC source is estimated in the OPTHCHOGLY study at 1070 Tg, up by 19 % from the bottom-up estimation of 897 Tg.
4.4.1 Top-down emissions of anthropogenic glyoxal precursors
According to the CAMS-GLOB-ANT inventory, the main source regions of anthropogenic glyoxal precursors are the eastern United States, Central Europe, Southeast Asia, and most significantly India and eastern China (Figs. 6j, S2). The top-down inversion (Fig. 6k and l) results in a threefold emission increase in India, as well as moderate increases in Mexico, the Middle East, Indonesia, and northern China. In a few areas in the Middle East and in northwestern China, much higher local increases (factors of 1.5–3) are derived, even though the optimized glyoxal columns remain low compared to the observations (Fig. 5). Cumulatively across Africa, anthropogenic glyoxal precursors are emitted at nearly twice the amount (9.8 Tg yr−1) reported in the inventory (5.5 Tg yr−1) (see Table 4 and Fig. 6l). Slight decreases with respect to the inventory are found in North America, North Asia, and Central and South China. Globally, the emissions of anthropogenic glyoxal precursors are estimated at 50 Tg yr−1 after inversion, an increase of 43 % relative to the bottom-up estimate (see Table 4).
According to the OPTHCHOGLY inversion, China emitted 6.5 Tg of anthropogenic aromatics in 2021, very close to the bottom-up estimate (Table 6). The distribution, however, differs significantly between the bottom-up and top-down model. The OPTHCHOGLY emission estimates exceed the a priori fluxes in the Beijing–Tianjin–Hebei (BTH) and Yangtze River Delta urban areas but are lower in the southern urban clusters including Wuhan, Chongqing and the Pearl River Delta (Fig. 7c). The derived source of aromatics from China is about twice lower than reported in the satellite-constrained work of Liu et al. (2012) for 2007 (13.4 Tg yr−1). This disparity can be attributed to differences in the satellite retrievals of SCIAMACHY and TROPOMI and possibly to a decrease in the emissions of glyoxal precursors between 2007 and 2021: the SCIAMACHY glyoxal columns reported by Liu et al. (2012) were in the range (5–10)×1014 molec. cm−2 in August 2007 over Eastern China, which is about twice higher than the TROPOMI columns in August 2021 in the same region. Spaceborne glyoxal data from multiple missions, including OMI, GOME-2 and TROPOMI indicated slightly lower columns since 2015, compared to previous years, possibly in response to emission regulations (Lerot et al., 2021). This decrease (of the order of 1014 molec. cm−2) does not completely explain the very high values used in Liu et al. (2012), which are therefore likely due to retrieval differences.
Liu et al. (2012)(Zhang et al., 2009)Liu et al. (2012)Li et al. (2019)An et al. (2021)Table 6Anthropogenic VOC and aromatic hydrocarbon emissions in China, BTH (Beijing-Tianjin-Hebei) and YRD (Yangtze River Delta). BU: bottom-up; TD: top-down; ant. VOCs: anthropogenic VOCs; % aromatics: percentage of aromatic hydrocarbon emissions with respect to total anthropogenic VOC emissions.
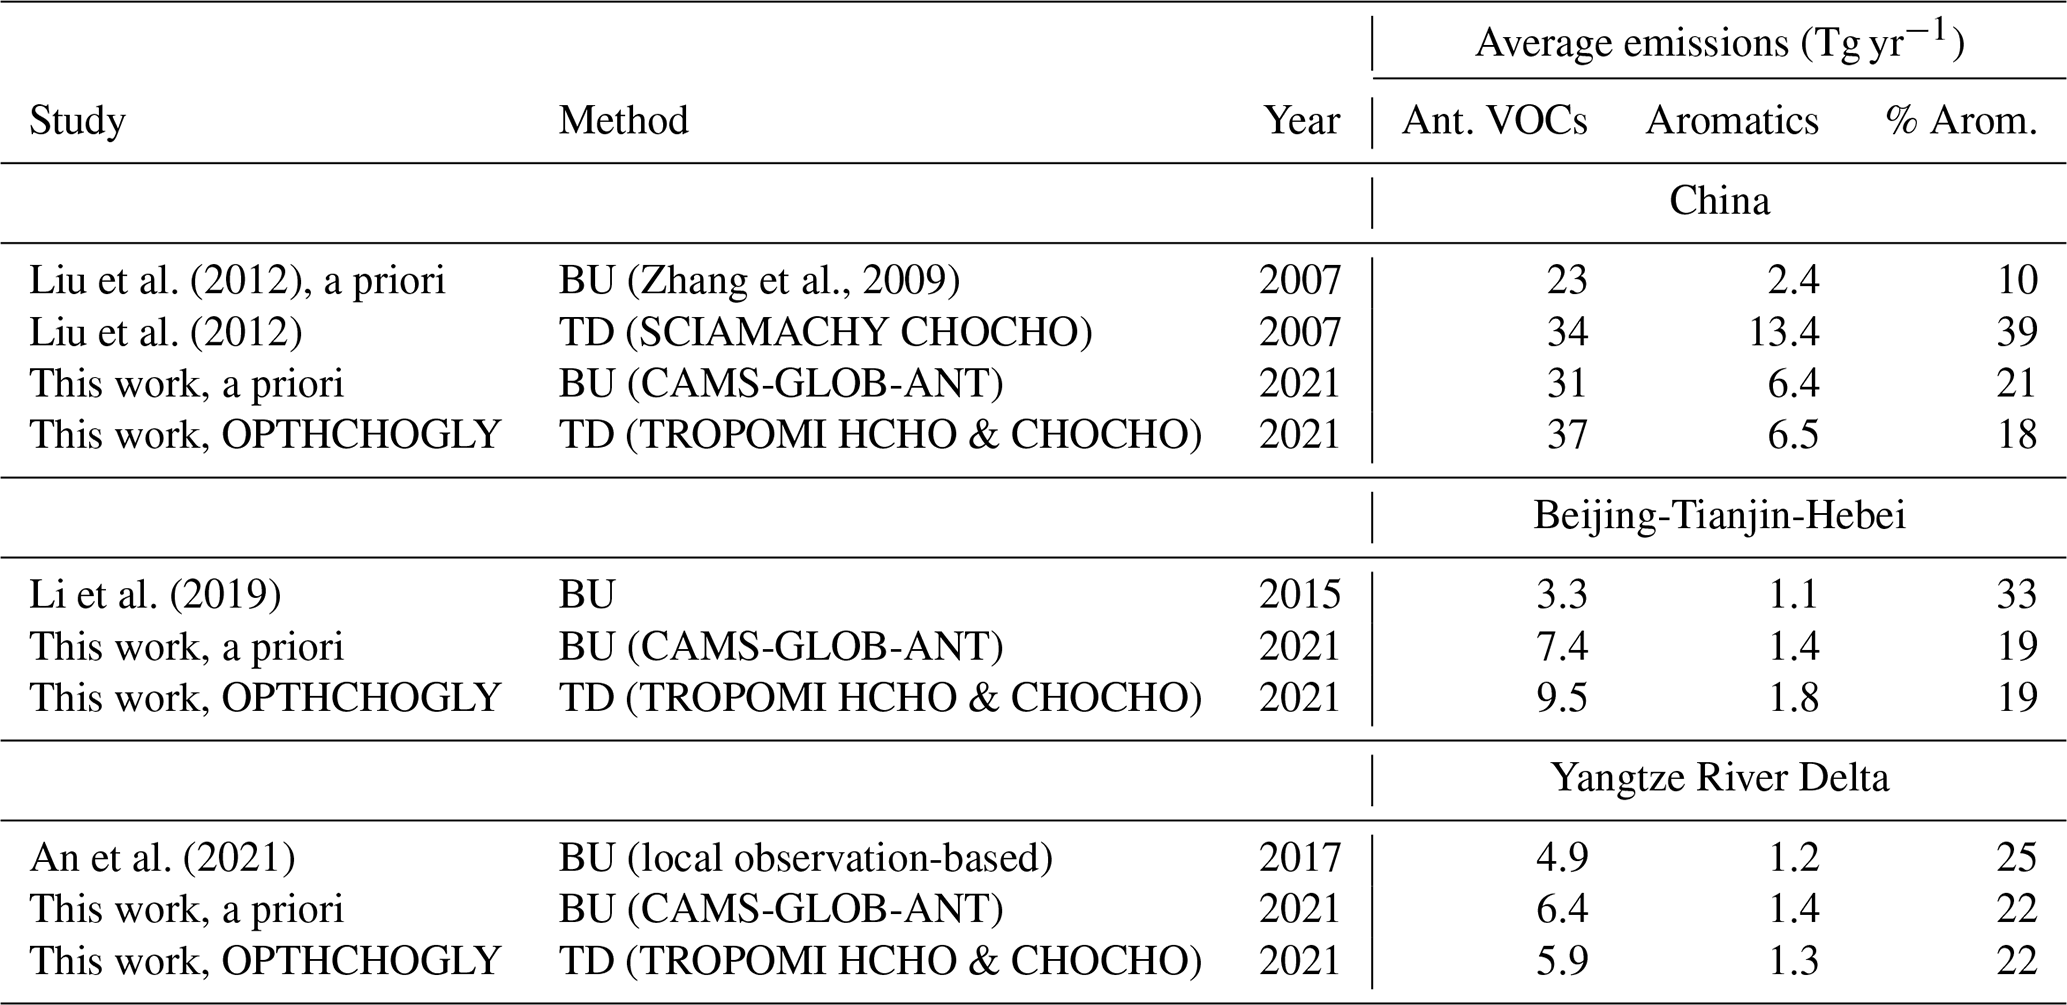
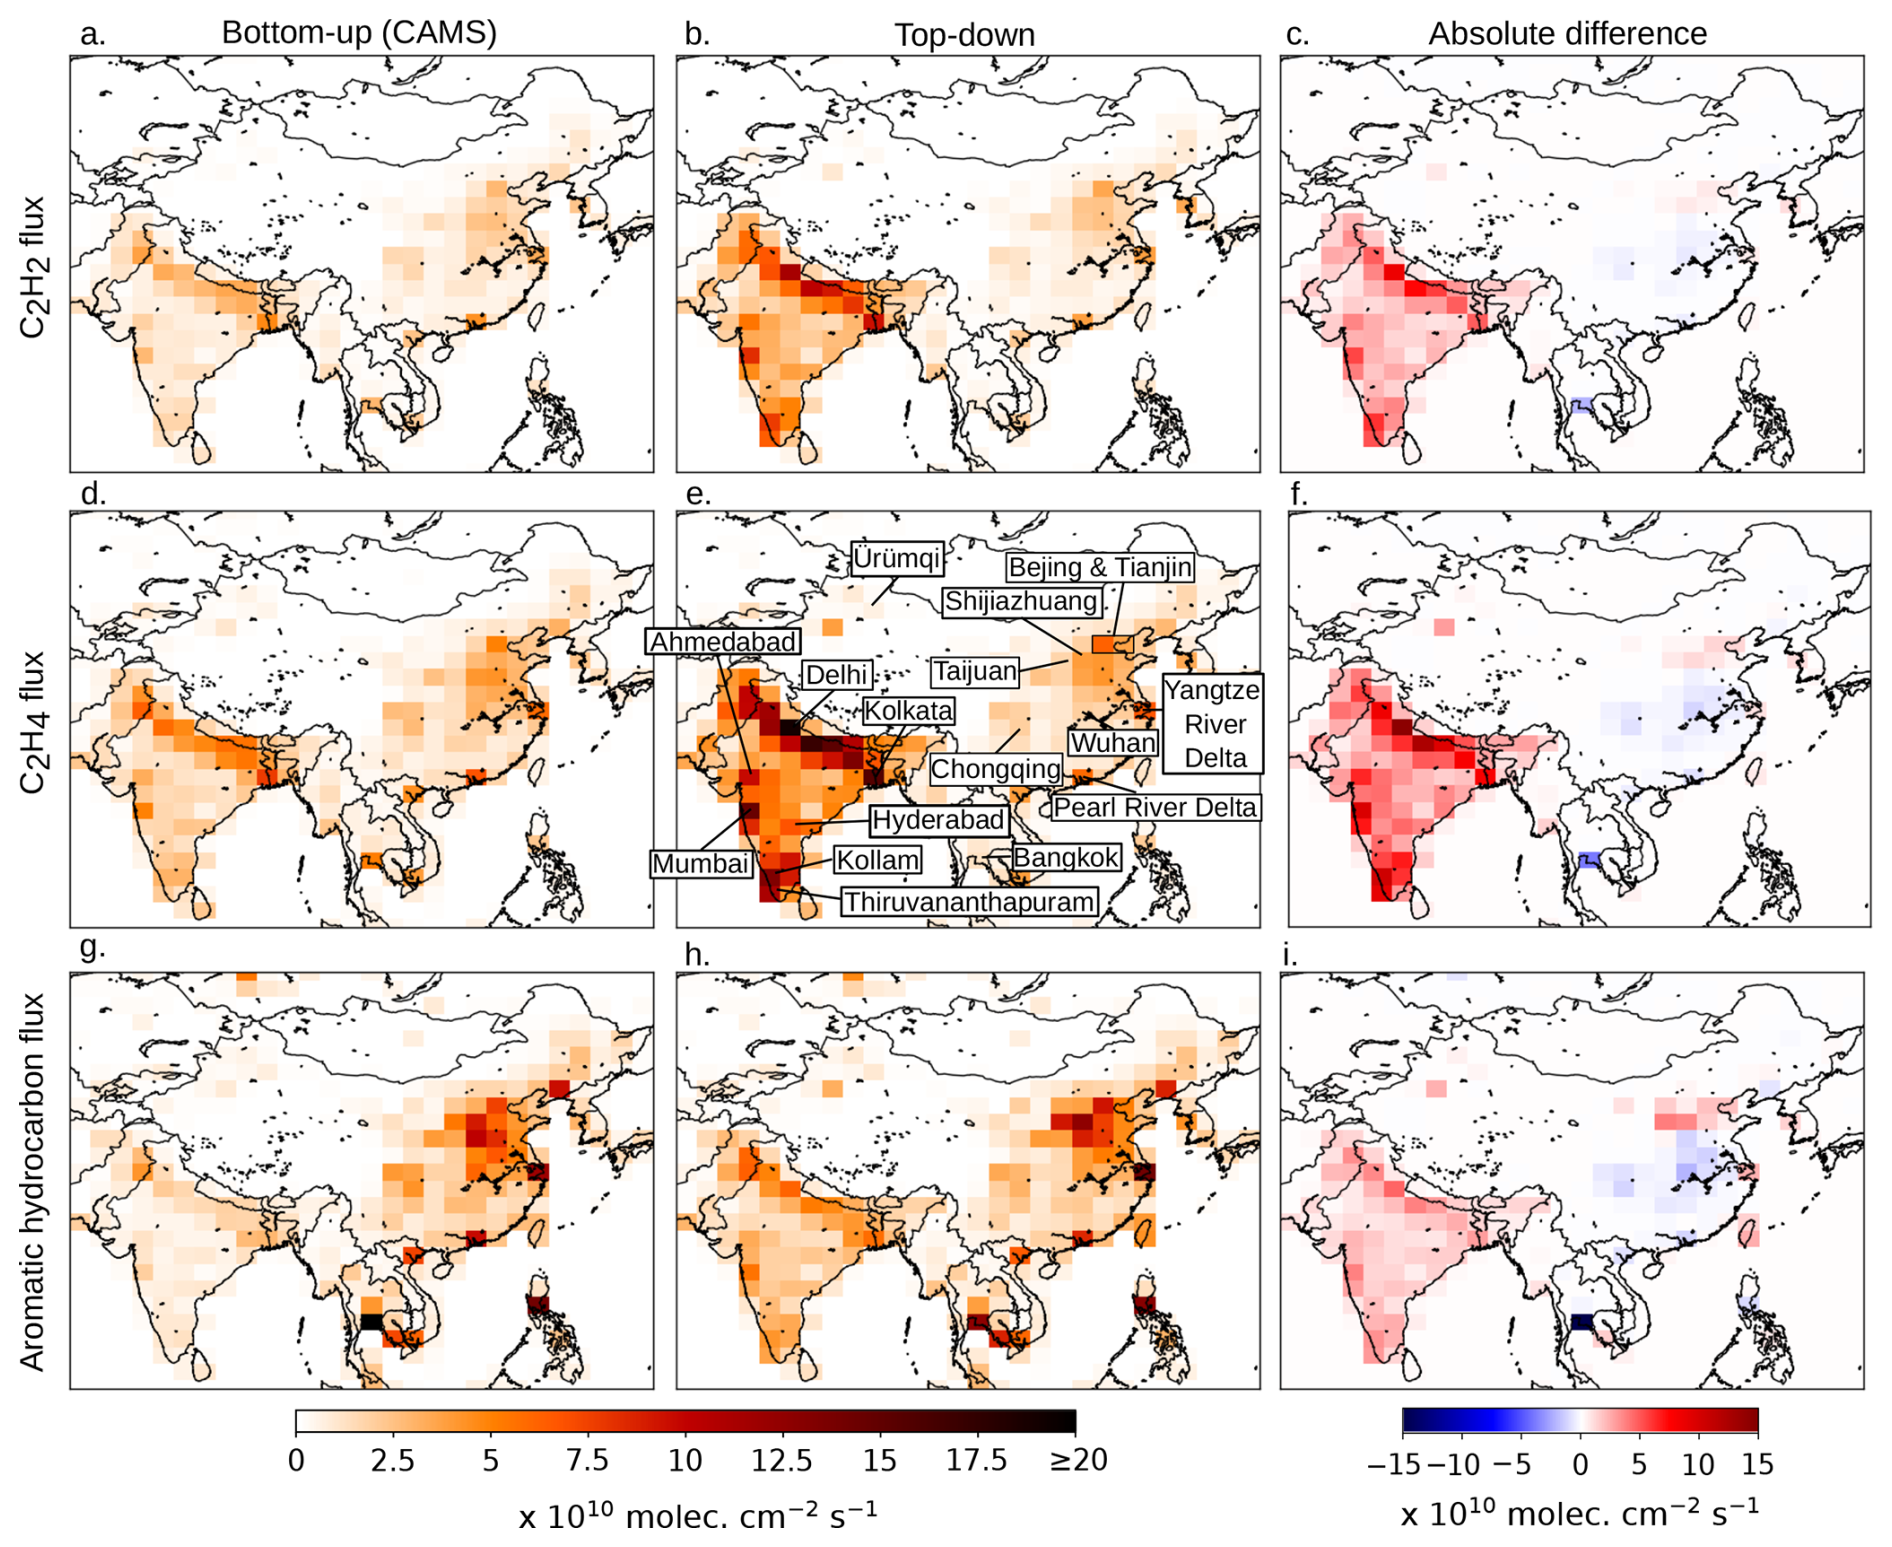
Figure 7 Distributions of anthropogenic bottom-up (a, d, g) and top-down (b, e, h) emissions of acetylene, ethene and aromatic hydrocarbons in India, China and South Asia averaged over 2021. The bottom-up emissions are based on CAMS inventory data. The top-down emissions are derived by the OPTHCHOGLY inversion constrained by HCHO and CHOCHO data. The absolute difference between the top-down and bottom-up model is given in (c), (f), and (i).
The Beijing-Tianjin-Hebei region (BTH) implemented numerous programs to address air pollution since 2012 (Xiao et al., 2020). Our findings suggest that BTH emits about 30 % more aromatics than in the bottom-up inventory (Table 6). The relative contribution of aromatics to the total anthropogenic VOC emissions in BTH is similar in the bottom-up model and after inversion (19 %), but lower than in the bottom-up estimate by Li et al. (2019) for 2015 (33 %). Ambient measurements near Beijing revealed that the aromatic emission flux was significantly lower than reported in Li et al. (2019), suggesting that the contribution of aromatics should be lower (∼ 10 %), i.e. closer to the top-down estimate in this work. A partial explanation could be governmental regulations in the region (Simayi et al., 2022). In view of the disparities among studies (Choi et al., 2024), it is clear that more detailed investigations are needed.
The total of anthropogenic VOC and aromatic emissions over the Yangtze River Delta (YRD) region changed little after inversion (Table 6). Both the bottom-up and top-down estimates agree well with those from the bottom-up inventory of An et al. (2021), based on local measurements for 2017. In terms of seasonal variation, the top-down aromatic fluxes in Shanghai peak in July, a feature absent from the inventory (Fig. S3). This result is consistent with the strong temporal variation of aromatic fluxes in Shanghai, reported by Wang et al. (2020), with maxima in winter (December/January) and summer (June/July). We observed this seasonal feature to a lesser extent in Guangzhou, but not in Beijing. The consistent winter peaks in the CAMS-GLOB-ANT inventory likely reflect heating-related emissions that are relatively well represented, whereas summertime activities may be underrepresented in the inventories. Wang et al. (2020) suggest that seasonal activities (such as outdoor painting) and the influence of meteorology on evaporation processes are key factors contributing to these summer peaks of aromatic emissions missed in bottom-up inventories.
In the northwestern Xinjiang region of China, emission hotspots are found around Ürümqi, as well as a particularly high flux 500 km southwest from that city, in a sparsely populated area. There, the optimization indicates that aromatic emissions are a factor of 4 higher than the bottom-up estimate. These emissions are likely released from the large cotton textile manufacturing industry and from raw textile dyeing wastewater (Ning et al., 2015). During the studied year, about 90 % of China's cotton was grown in Xinjiang, or about a quarter of the world's total (Gale and Davis, 2022). Elsewhere in China, the top-down model suggests anthropogenic emissions of glyoxal precursors similar to or slightly lower than the inventory, e.g. in the Pearl River Delta (PRD). The latter reflects a clear evolution since 2006–2007, when Chan Miller et al. (2016) found a very intense glyoxal hotspot over the PRD observed by OMI, much higher compared to the rest of the industrial coast.
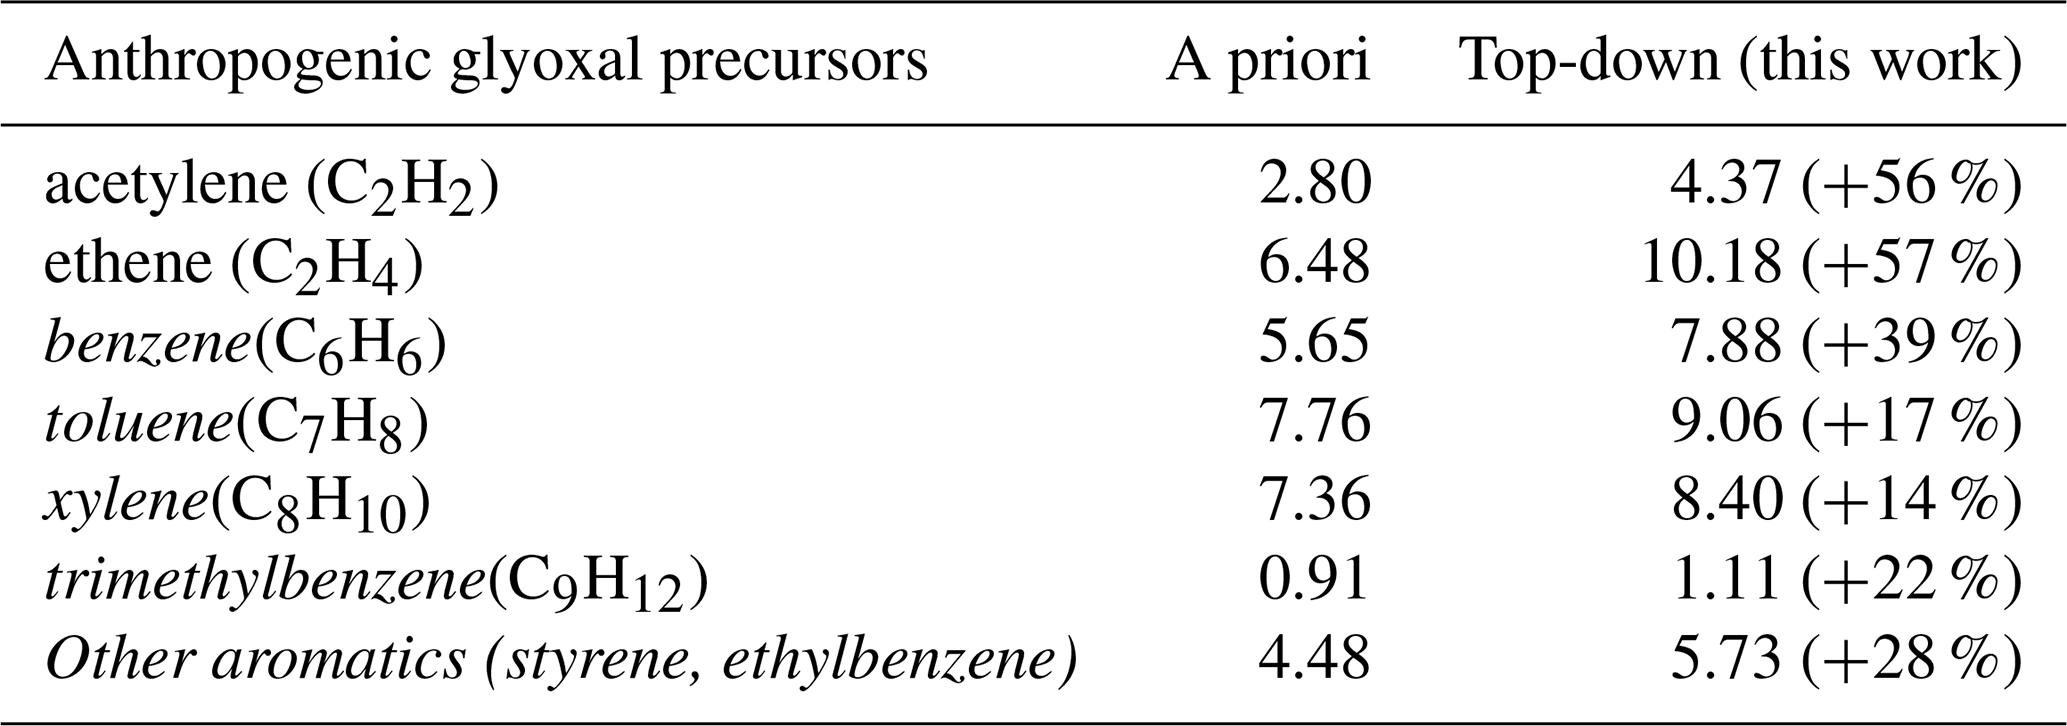
In India, the top-down model suggests annual top-down emissions of anthropogenic glyoxal precursors nearly three times higher than those in the CAMS-GLOB-ANT inventory (8.2 Tg vs. 2.9 Tg). From the top-down perspective, the annual total emissions of anthropogenic glyoxal precursors from India and China (8.1 Tg) are similar, whereas China is globally dominating the emission of anthropogenic aromatics (6.5 Tg vs. 3.7 Tg from India). The dominance of aromatic emissions from China follows from the VOC speciation of the inventory (Figs. S2 and 7). In India, we see that the very large discrepancies between the top-down and inventory emissions of glyoxal precursors are likely mainly caused by an underestimation of acetylene and ethene emissions, and to a lesser extent of aromatics. The threefold flux increase from India explains the substantial enhancement of global anthropogenic emissions of acetylene and ethene at the global scale (+57 %), whereas the global aromatic emission changes are more moderate, of the order of 20 % (Table 7).
Table 7A priori (bottom-up) and optimized (top-down) global anthropogenic emissions of glyoxal precursors derived from the OPTHCHOGLY inversion for 2021. Aromatic hydrocarbons are italicized. Emissions are expressed inTg yr−1. The percentage emission increase for each precursor is in parentheses.
The discrepancies between bottom-up and top-down emissions might have several causes. The analysis of spaceborne infrared observations of ethylene suggests that the large point sources of this compound are strongly underestimated in bottom-up inventories (Franco et al., 2022), in particular over India, northern China, the Middle East and Europe. These flaws likely concern also other VOCs, such as acetylene and aromatics. Over India, the underestimation of bottom-up emissions might be also related to the large share of domestic emissions and informal, small-scale industries in this country (Mukim, 2015). In comparison, Chinese industries tend to be state- or privately owned large-scale enterprises, which are more tightly regulated and better represented in inventory activity data. Additionally, inventories are limited by the lack of activity data and emission factors specific to Indian emission sources (Stewart et al., 2021). Emission sources particular to India include industrial sources such as brick kilns and the processing of textiles, jute and leather; and domestic ones such as residential cooking, home use of poorly-serviced diesel generators, and burning of solid fuel and plastic waste for heating. This is further complicated by the ubiquity of inferior-quality coal, diesel and petrol, which impacts the chemical profile of traffic, residential and industrial emissions (Kumar et al., 2016; Stewart et al., 2021). Hence, emission factors determined for a similar activity in a different country might not translate well to the Indian context.
4.4.2 Unspecified glyoxal precursor emissions
The TROPOMI-constrained analysis indicates a total global annual UVOC source of 41 Tg (Table 4). In comparison, a similar inversion study constrained by SCIAMACHY data by Stavrakou et al. (2009c) for 2005 derived a higher UVOC source after optimization (54 Tg yr−1), even though the total glyoxal source they obtained was similar to the one here, of 100 Tg.
The sensitivity of the model to the UVOC lifetime is shown in Fig. 8. The inferred distribution of the UVOC source is similar across the inversions, and the global totals are respectively 34, 41 and 47 Tg yr−1 when the UVOC lifetime is set to 1, 5 and 10 d. Longer UVOC lifetimes allow emitted UVOCs to move away further from the location where they were emitted (always on land) before being oxidized into glyoxal (over land and ocean). It is therefore expected that increasing the UVOC lifetime decreases the glyoxal production over land, thereby requiring a larger continental UVOC emission flux to close the gap between the modeled and TROPOMI-observed glyoxal columns. The sensitivity analysis is discussed further in Sect. 5.2.
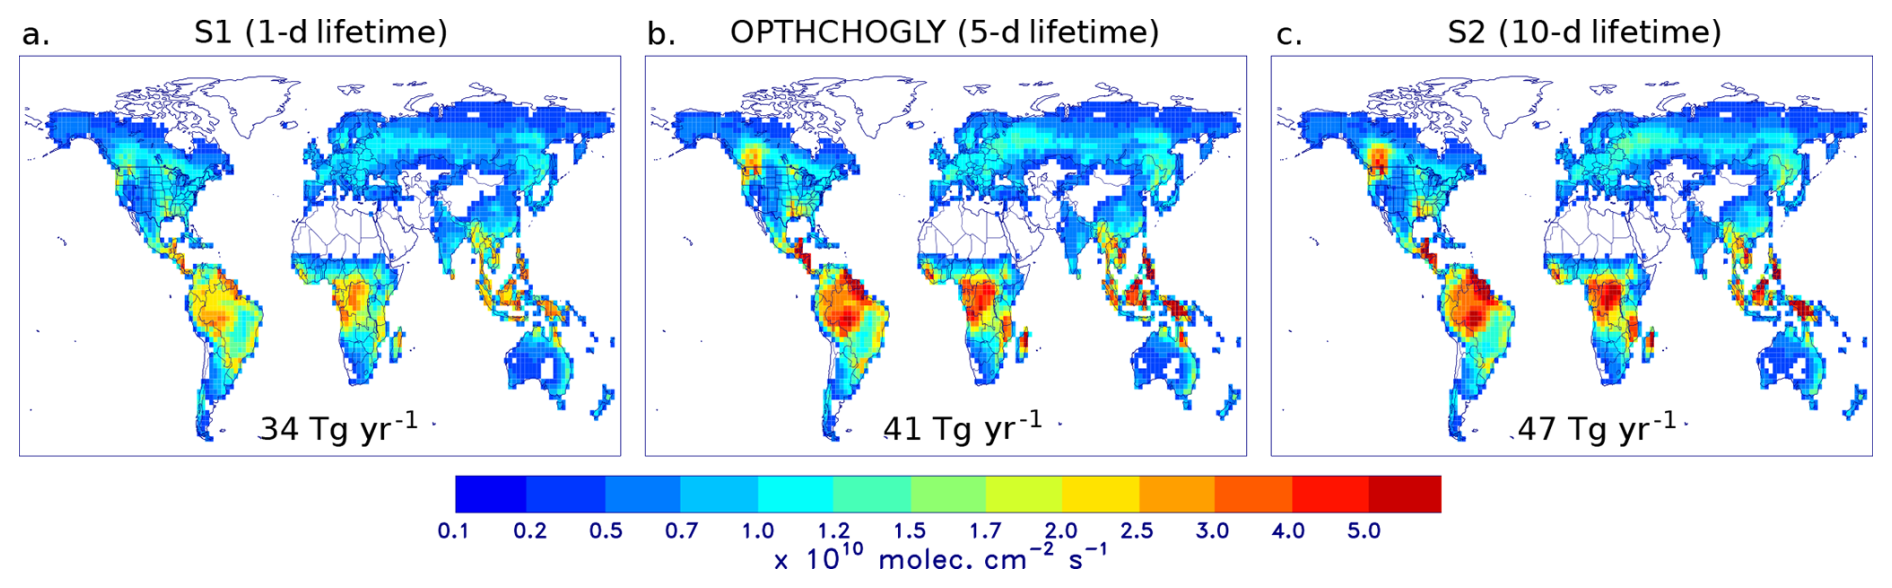
Figure 8 Global annual distribution of the top-down source of the unspecified glyoxal precursor (UVOC) (a) for an assumed UVOC lifetime of 1 d (inversion S1), (b) 5 d (OPTHCHOGLY inversion) and (c) 10 d (S2). The global annual flux is provided in each panel.
We find that circa 70 % of the entire UVOC emission flux stems from the Tropics. The largest increases relative to the assumed a priori source of 20 Tg are also derived over the Tropics, especially in South Asia (+136 %) and Southern Hemisphere Africa (+165 %). Substantial increases are also found in Northern Hemisphere Africa and South America (+90 %), and the UVOC source nearly doubles in North America, primarily due to large increases over Mexico, Central America, the northwestern United States, and western Canada (Fig. 6o). This suggests a substantial underestimation of glyoxal production from biogenic precursors, likely reflecting a combination of underestimated VOC fluxes and incomplete representation of their oxidation chemistry in the model.
In the boreal zone, where monoterpenes dominate BVOC emissions (Guenther et al., 2012), the a priori underestimation of glyoxal (Sect. 4.3) is likely linked to monoterpenes, whose emissions may be too low in the MEGAN-MOHYCAN inventory and/or whose glyoxal yields are underestimated in the model, consistent with previous findings based on OMI glyoxal data and the GEOS-Chem model (Silva et al., 2018). This is supported by the strong UVOC source inferred in this region (Fig. 6o) along with increased BVOC emissions in Canada and the Russian Far East (Fig. 6c). The latter effect was already present in the single-compound inversion and is mainly driven by TROPOMI HCHO columns (Sect. 4.1).
In the broadleaf and mixed forest zone, where monoterpenes are believed to contribute little to biogenic emissions (Kaiser et al., 2015), the glyoxal underestimation appears to result primarily from missing knowledge of glyoxal production pathways from isoprene in the model: a strong UVOC source is inferred across the entire zone, while known biogenic emissions only increase locally, particularly in the western United States. This pattern suggests that the isoprene flux in the inventory is roughly correct in most areas, but the chemical pathways leading to glyoxal formation from isoprene are incompletely represented. This confirms the notion that current knowledge of the isoprene degradation mechanism at low-NOx remains incomplete (e.g., Medeiros et al., 2022; Berndt et al., 2018). Indeed, the relatively low UVOC source over China, India, eastern Brazil, and to a lesser extent the eastern United States may indicate that glyoxal formation under high-NOx conditions is better captured in the model, whereas the low-NOx glyoxal formation yield might be strongly underestimated.
Although the top-down UVOC source is likely predominantly biogenic, a part of it may be misattributed due to the co-occurrence of biogenic emissions with biomass burning during hot and dry periods. In such conditions, elevated glyoxal columns may result from both fire-related VOCs and enhanced BVOC emissions. The top-down UVOC source might then be overestimated due to a poor representation of secondary glyoxal formation from pyrogenic VOCs, as indicated by the reported occurrence of high glyoxal in aged biomass burning plumes (Alvarado et al., 2020; Kluge et al., 2023) (Fig. 6n). The oxidation of furanoid compounds released by fires is believed to form glyoxal at significant yields (Romanias et al., 2024) and is currently ignored in large-scale models. A part of this glyoxal production might occur several days after emission, as it involves long-lived intermediates such as maleic anhydride (Gkatzelis et al., 2024).
As pointed out in Kluge et al. (2023), a study based on aircraft data and the EMAC model, multiple sources might contribute to the model deficits. In particular, recent evidence that phospholipids during the death phase of algal blooms generate glyoxal upon oxidation (Williams et al., 2024) could partly explain the high UVOC source required at the tropical coastal regions (e.g., Atlantic coast of South America, Indonesia, Central America). Therefore, we acknowledge that the use of a single, continental glyoxal precursor is overly simplified and that a multitude of glyoxal precursors and formation pathways are likely at play. In addition, it cannot be ruled out that the strong inferred UVOC source, especially in humid tropical regions, might be partly related to the high sensitivity of glyoxal retrievals to the water vapor cross-section (Lerot et al., 2021).
5.1 Evaluation of modeled formaldehyde columns against PGN data
The PGN measurement sites shown in Fig. 9 are listed with their coordinates in Table 8. The PGN HCHO columns (PGN, 2021) are compared with TROPOMI and model columns in Fig. 10. The 2021 averages of the observed and modeled columns are listed in Table 8. The left panel of Figure 10 displays a comparison of the bias-corrected (Eq. 1) TROPOMI and PGN HCHO columns for every measurement station and every month (where data was available) in 2021. The slope is almost equal to unity (1.03) but a slight offset is derived, with TROPOMI columns being on average circa 1015 molec. cm−2 lower than the PGN data. We note, however, that the TROPOMI columns are averaged over the 2°×2.5° grid cell in which the station is located, whereas the PGN data represent localized measurements, often within an urban area. Furthermore, even though only PGN measurements taken within three hours of the TROPOMI overpass time were selected, the sampled days generally differ between TROPOMI and PGN. Taking these limitations into account, the good overall agreement between the ground-based and satellite data does seem to support the validity of the bias correction applied to TROPOMI columns based on FTIR data. The comparison between PGN and modeled columns (a priori and optimized) is shown in the right panel of Fig. 10. Here, the modeled data are sampled at the PGN observation times. Similar to the comparison with TROPOMI, we find that the model columns are lower than PGN columns on average. The increased VOC emissions and HCHO columns after inversion (OPTHCHOGLY) result in a better match with the PGN data relative to the a priori, with the mean bias decreasing from approximately 30 % to 20 %.
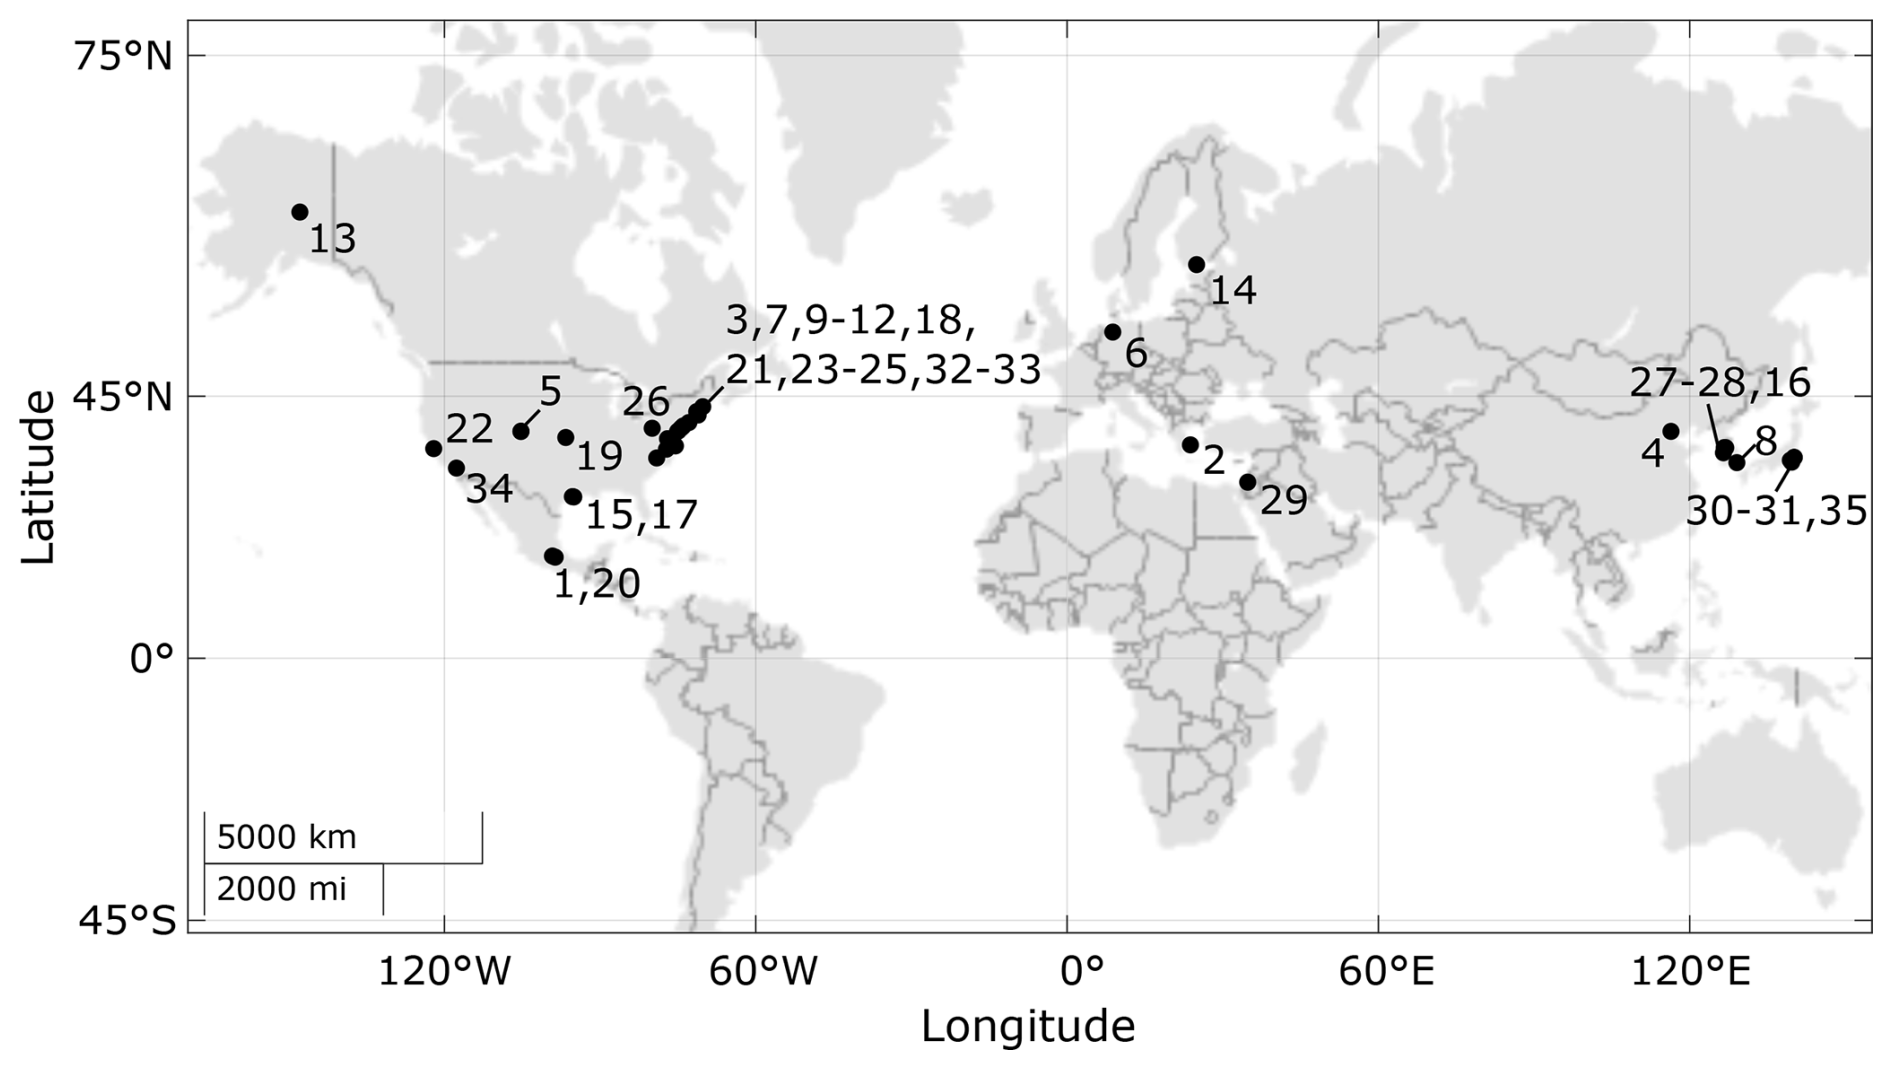
Figure 9 Location of PGN HCHO measurement sites used for independent model evaluation. Each index corresponds to a site in Table 8.
Table 8Observed HCHO columns (1015 molec. cm−2) from PGN stations, and corresponding values from a priori and optimized (OPTHCHOGLY) model. Ind.: index in Fig. 9; Country: ISO country code; Lat.: latitude (°N); Long.: longitude (°E); Obs.: observed column; A priori: a priori model; Optimized: optimized model; Δapr and Δopt: average absolute deviation Δ calculated as the difference (HCHOmodel−HCHOobs) for resp. the a priori and optimized model (1015 molec. cm−2). NCAR: National Center for Atmospheric Research; NIES: National Institute for Environmental Studies.
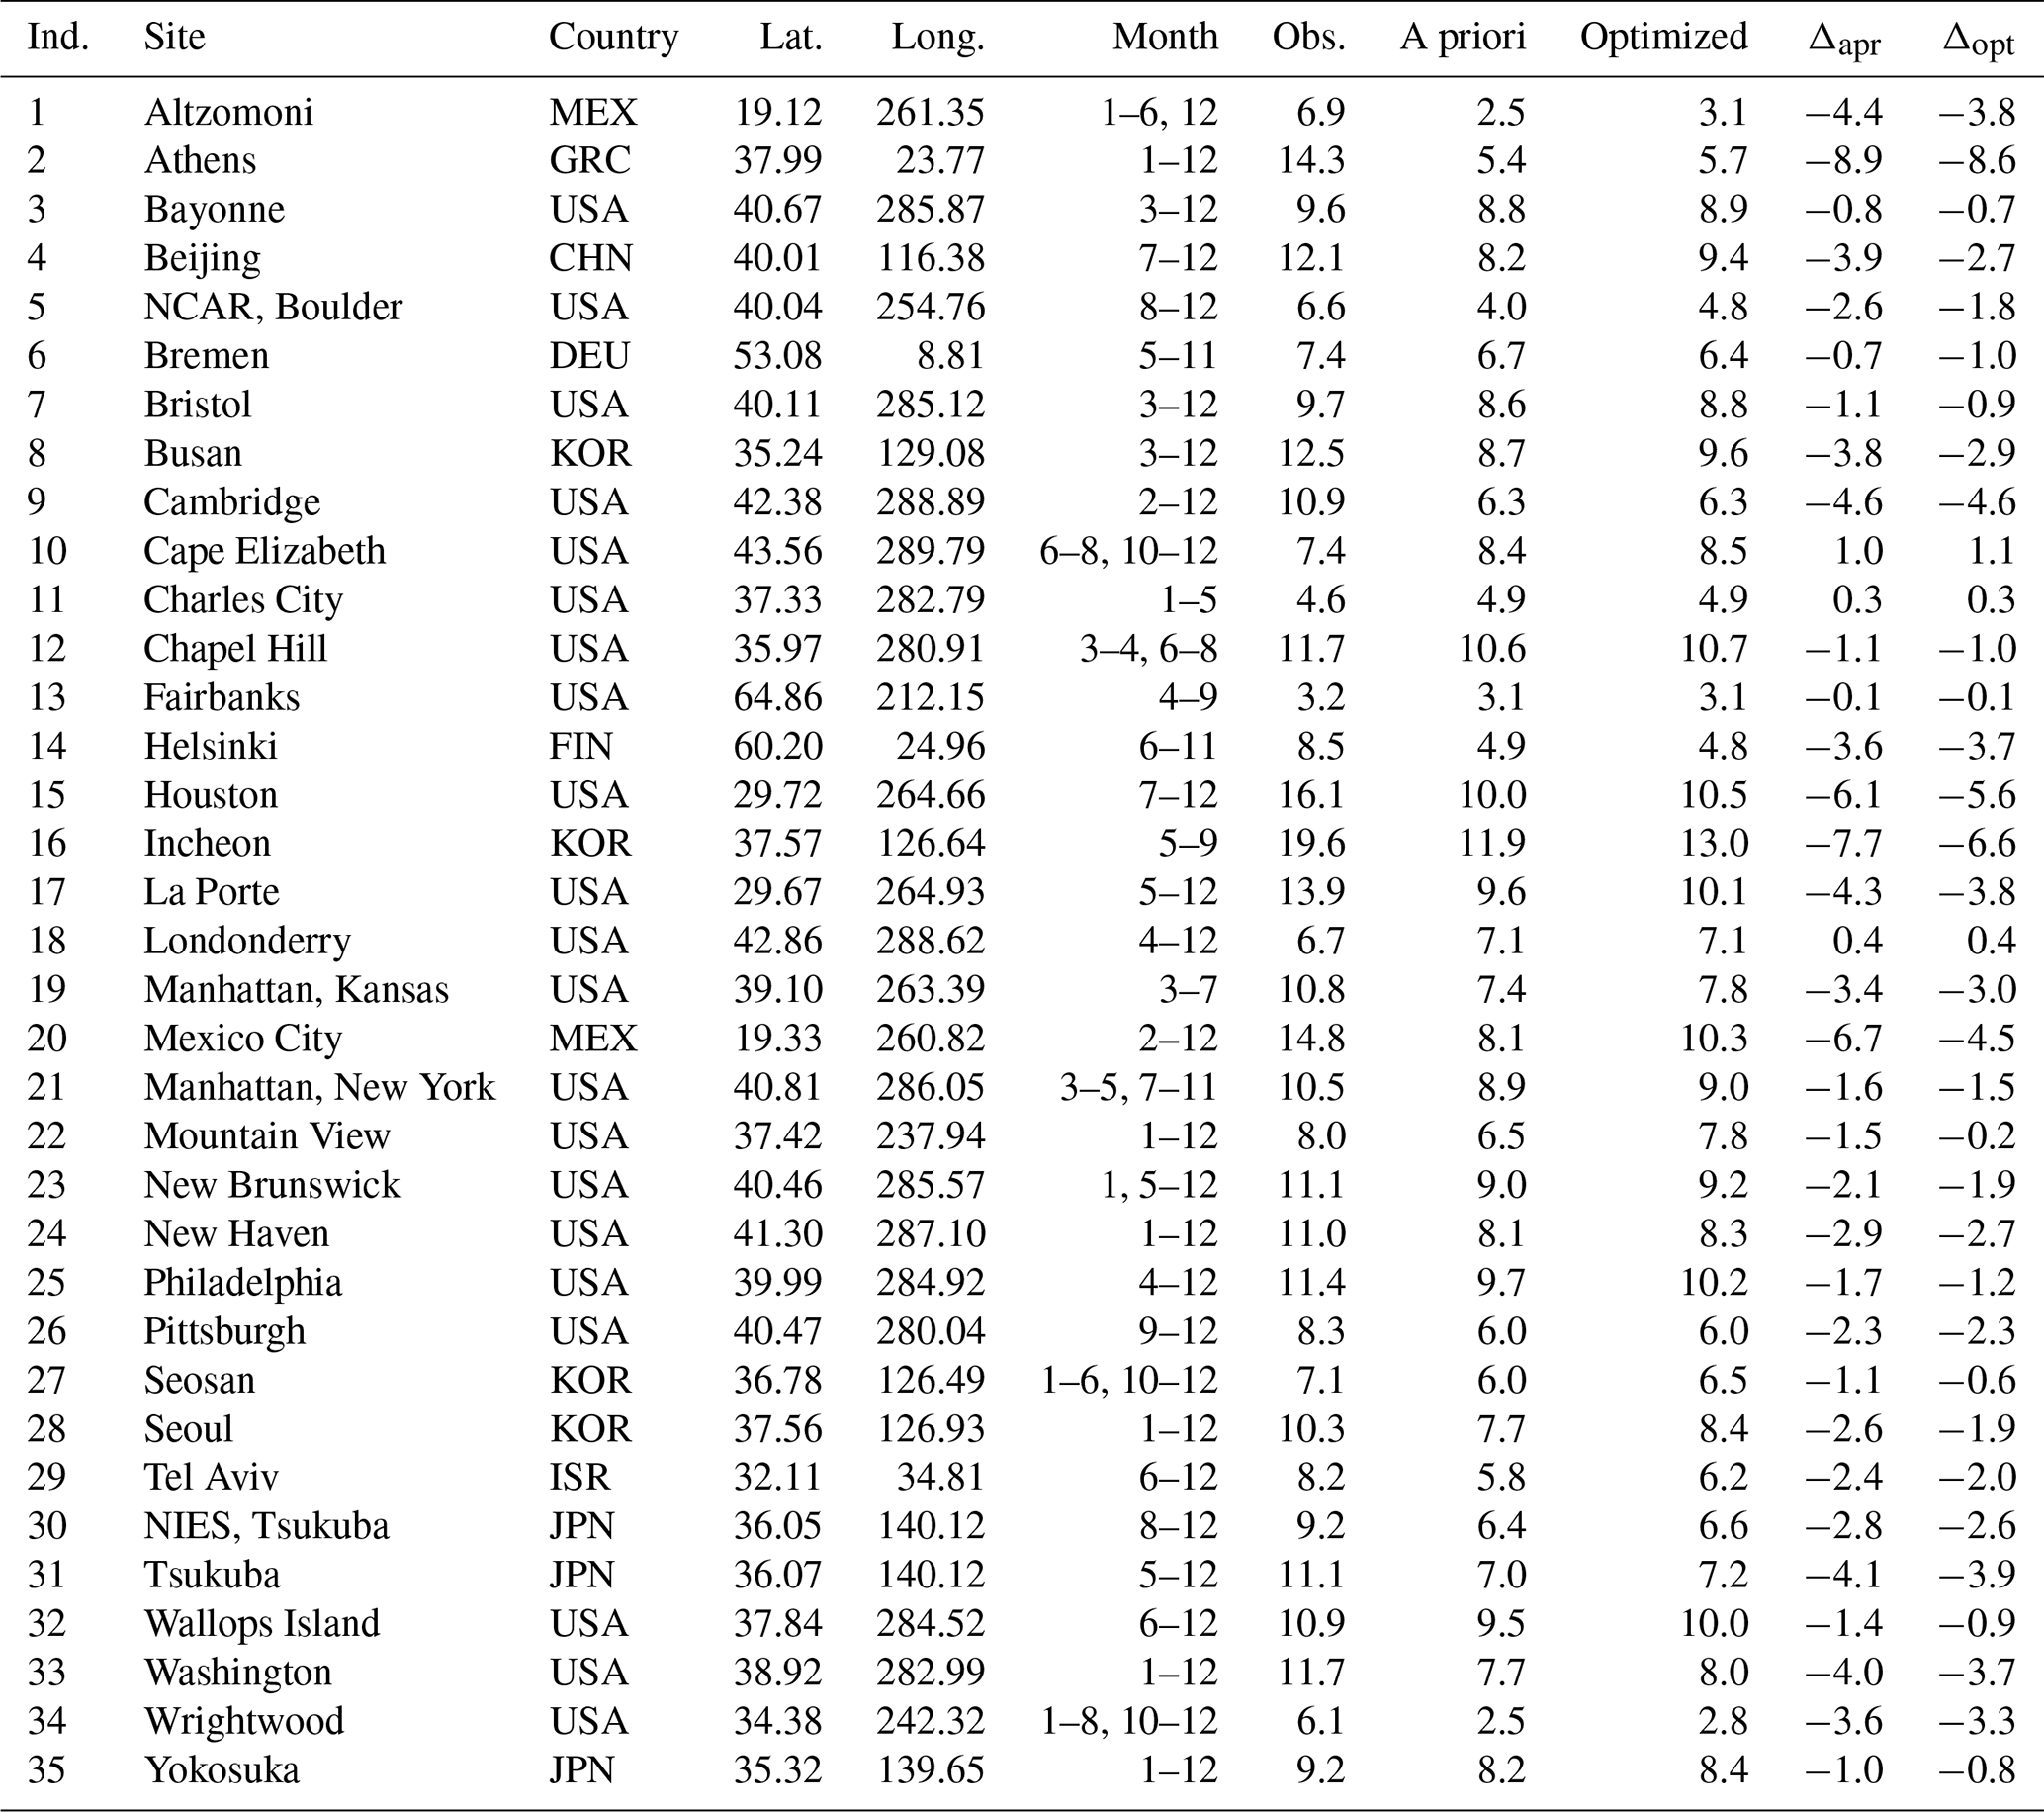
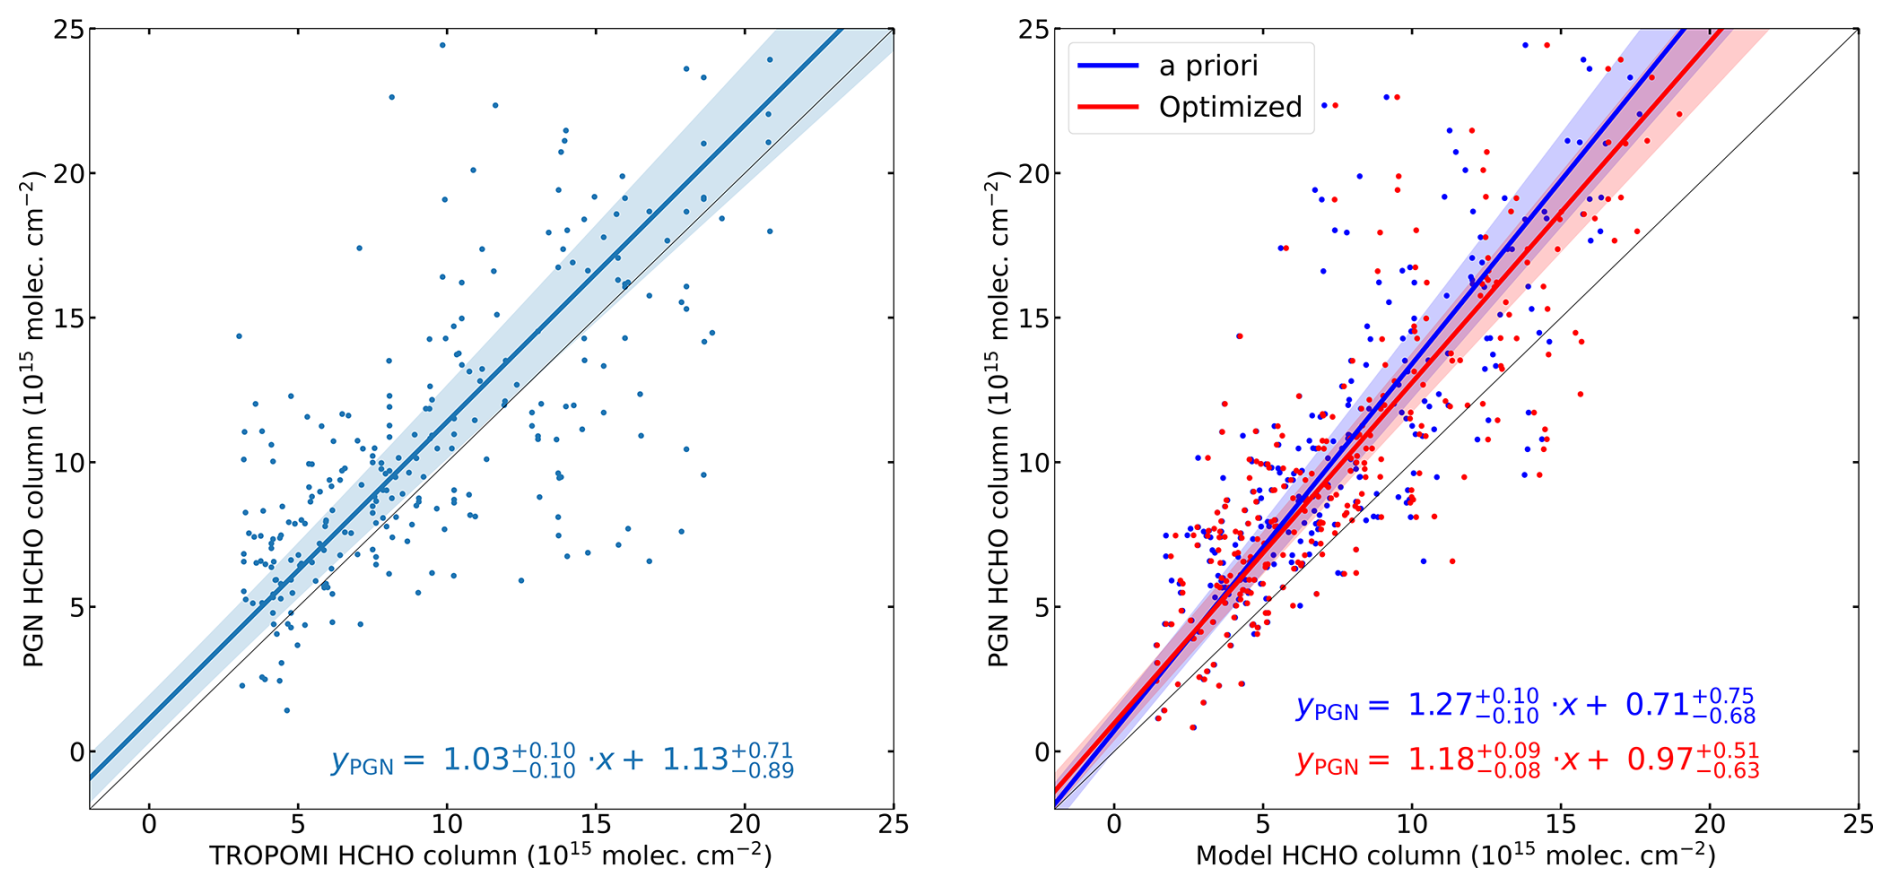
Figure 10Scatter plot of monthly TROPOMI HCHO columns (left) and modeled (a priori and OPTHCHOGLY inversion) HCHO columns (right) versus ground-based PGN HCHO columns for 2021. The data have been spatially collocated and are monthly averaged. The linear TROPOMI fit is shown in light blue, and its 1σ uncertainties are depicted by the light blue-shaded area. Similarly, the a priori and optimized models (and their fit and uncertainties) are shown in blue and red, respectively.
At the large majority of locations (26 out of 35), the optimization improves the agreement between modeled and PGN columns, as expressed by the average absolute deviations listed in Table 8. The average observed HCHO column across all stations listed in Table 8 is 10×1015 molec. cm−2, while the averages from the a priori and optimized model are 7.3×10¹⁵ molec. cm−2 and 7.7×10¹⁵ molec. cm−2. At 5 locations (Bayonne, Bremen, Charles City, Cape Elizabeth, Chapel Hill and La Porte), the a priori model already closely matched the PGN data with an average difference less than 1015 molec. cm−2. At the Asian sites of Beijing, Busan and Seoul, the a priori model underprediction of approximately 30 % is reduced to 20 % after inversion. An exception is the Incheon station, where the observed high column densities (20×1015 molec. cm−2) are poorly represented in both the a priori (12×1015 molec. cm−2) and the optimized model (13×1015 molec. cm−2). Similarly for Tsukuba, located 50 km to the northwest of Tokyo, only a small improvement is found after optimization with the model remaining too low compared to the observation. At the European sites of Helsinki and Athens, the optimized model is unable to bridge the large model underestimation (43 % and 60 %, respectively). This poor performance is most likely due to the coarse resolution in this study (2°×2.5°), since a high-resolution inversion (at 0.5°×0.5°) over Europe constrained by TROPOMI HCHO columns derived a strong increase of isoprene emissions in Southern Europe in order to match the satellite observations (Oomen et al., 2024).
Across the 14 locations in the East Coast states of the U.S., the mean PGN column (9.7×10¹⁵ molec. cm−2) is in good agreement with the a priori average (8.1×10¹⁵ molec. cm−2) and the optimization brings about only small improvements (8.3×10¹⁵ molec. cm−2, Table 8). At 9 of those sites (Bayonne, Bristol, Charles City, Chapel Hill, Londonderry, Manhattan New York, New Brunswick, Philadelphia, and Wallops Island) the a priori model already agreed well with the PGN data and continued to improve after optimization, while at Cambridge, New Haven, Pittsburgh, Washington, and Cape Elizabeth, the optimization results in minimal or no improvement. Elsewhere in the U.S., the a priori model underestimates observed columns by about 40 % at Houston and Boulder, 60 % at Wrightwood, 19 % at Mountain View, and achieves an excellent match at Fairbanks. The model performance after optimization is moderately improved at Houston (35 %), Boulder (27 %) and Wrightwood (54 %), while the top-down model bias is close to zero at Mountain View. The PGN abundances at Altzomoni and Mexico City are much higher than the a priori model estimates and while the optimized abundances increase by about 25 % after optimization, they remain much lower than the observed levels. Both of these locations are difficult to capture with the model, however, due to orographic effects (e.g., Altzomoni is located 4.2 km above sea level) and to intense urban emissions causing strong heterogeneity of HCHO columns around Mexico City.
5.2 Evaluation of modeled glyoxal concentrations against in situ data
The comparisons between the model and in situ data were performed by linear interpolation of the gridded model values, while taking into account the month and hourly range of the measurements. Out of 25 rural sites (Fig. 11, Table S1 in the Supplement), the agreement between model and observations improves after optimization in 16 cases, as can be seen in Fig. 12. For most campaigns carried out in temperate forests (Central Rocky Mountains, Pinnacles, Goldlauter, Pabstthum, Wangdu, Tomakomai, Moshiri and Cape Grim) the a priori glyoxal estimates already matched in situ observations reasonably well (with differences of less than 16 ppt), and the TROPOMI-constrained inversion further improves the agreement (to differences less than 8 ppt). The observations in the Sierra Nevada Mountains across different years are, on average, in relatively good agreement with the model (within 30 %), but show a large variability (almost factor of 2). At the temperate site in the Yangtze River Delta, the high observed glyoxal level stemmed from crop residue burning (Liu et al., 2020a) at the time of measurement, and can therefore not be replicated by the model for a different year (here 2021).
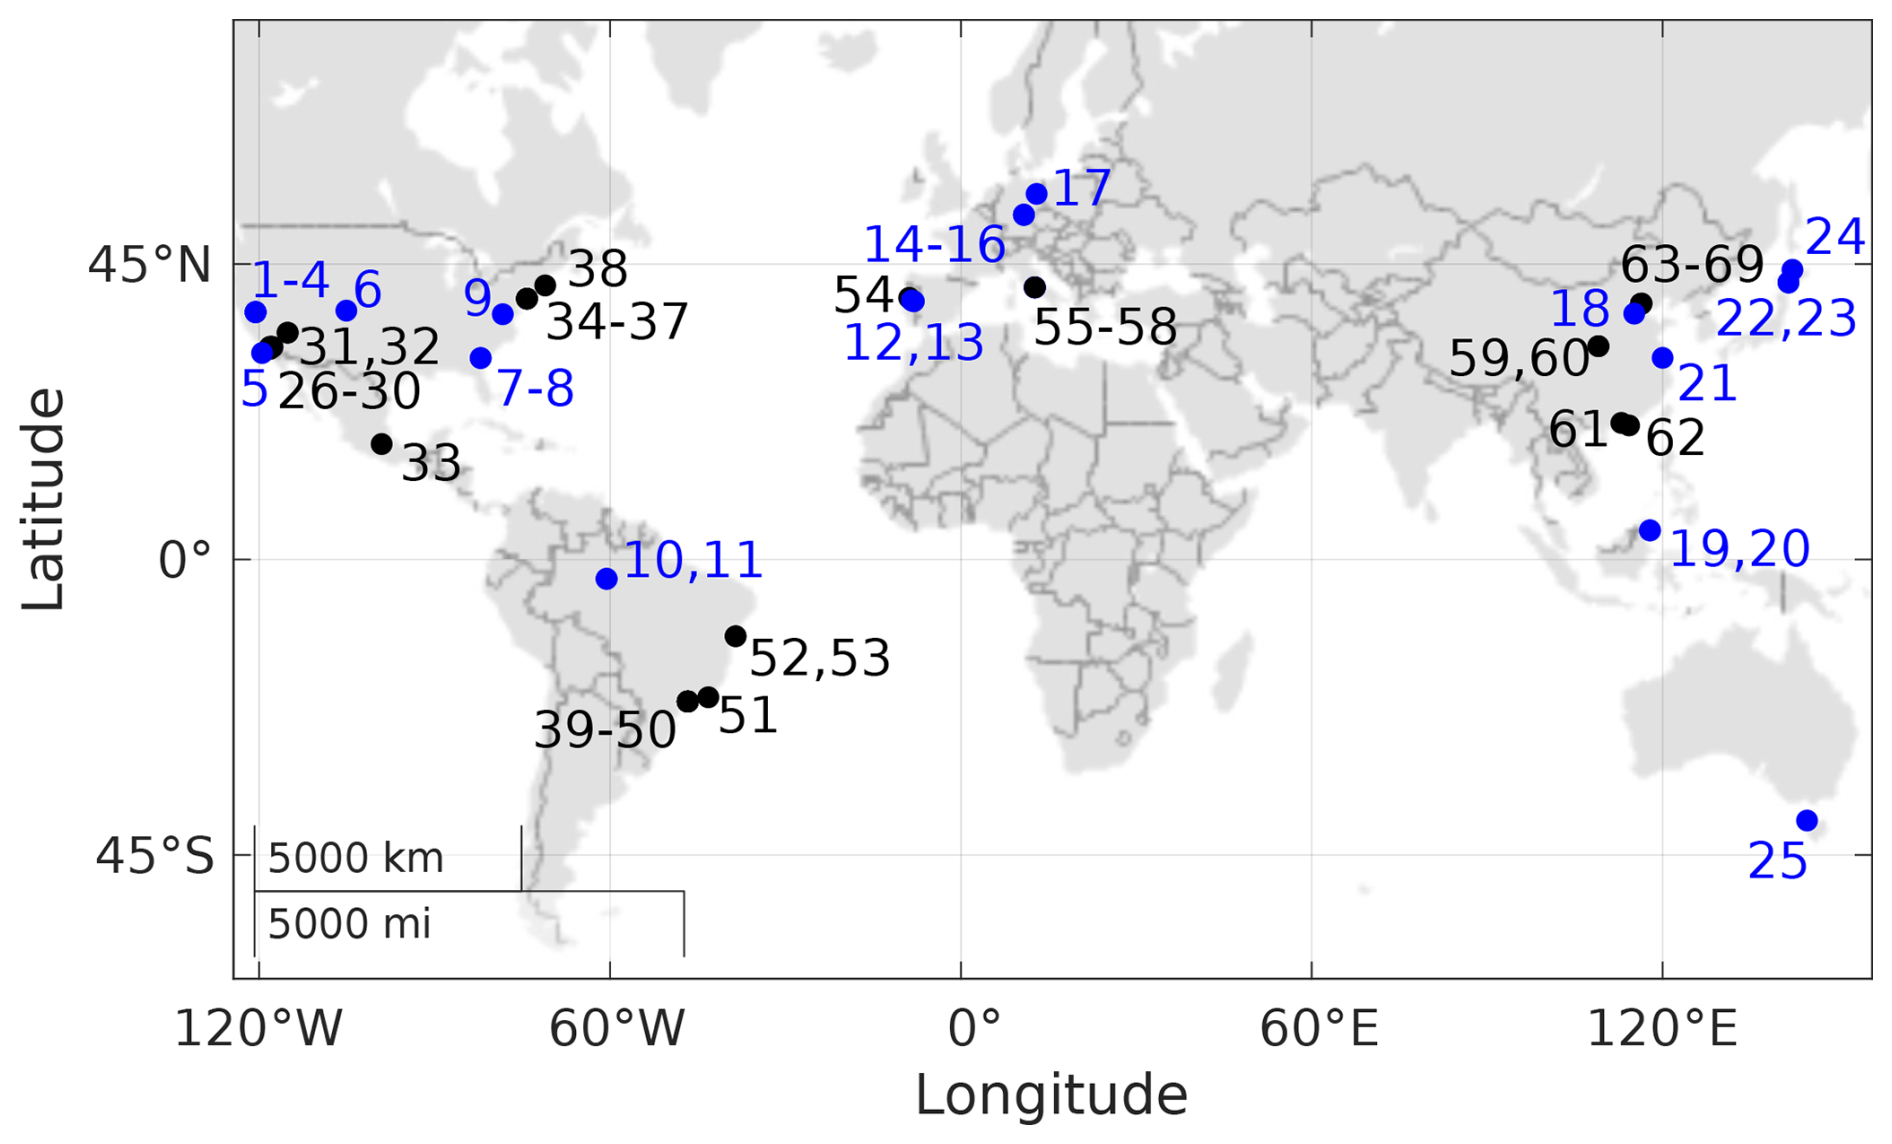
Figure 11 Location of in situ CHOCHO measurement sites (rural in blue, urban in black) used for model evaluation. Each index corresponds to (part of) a campaign in Fig. 12, Fig. S4, and Tables S1 and S2.
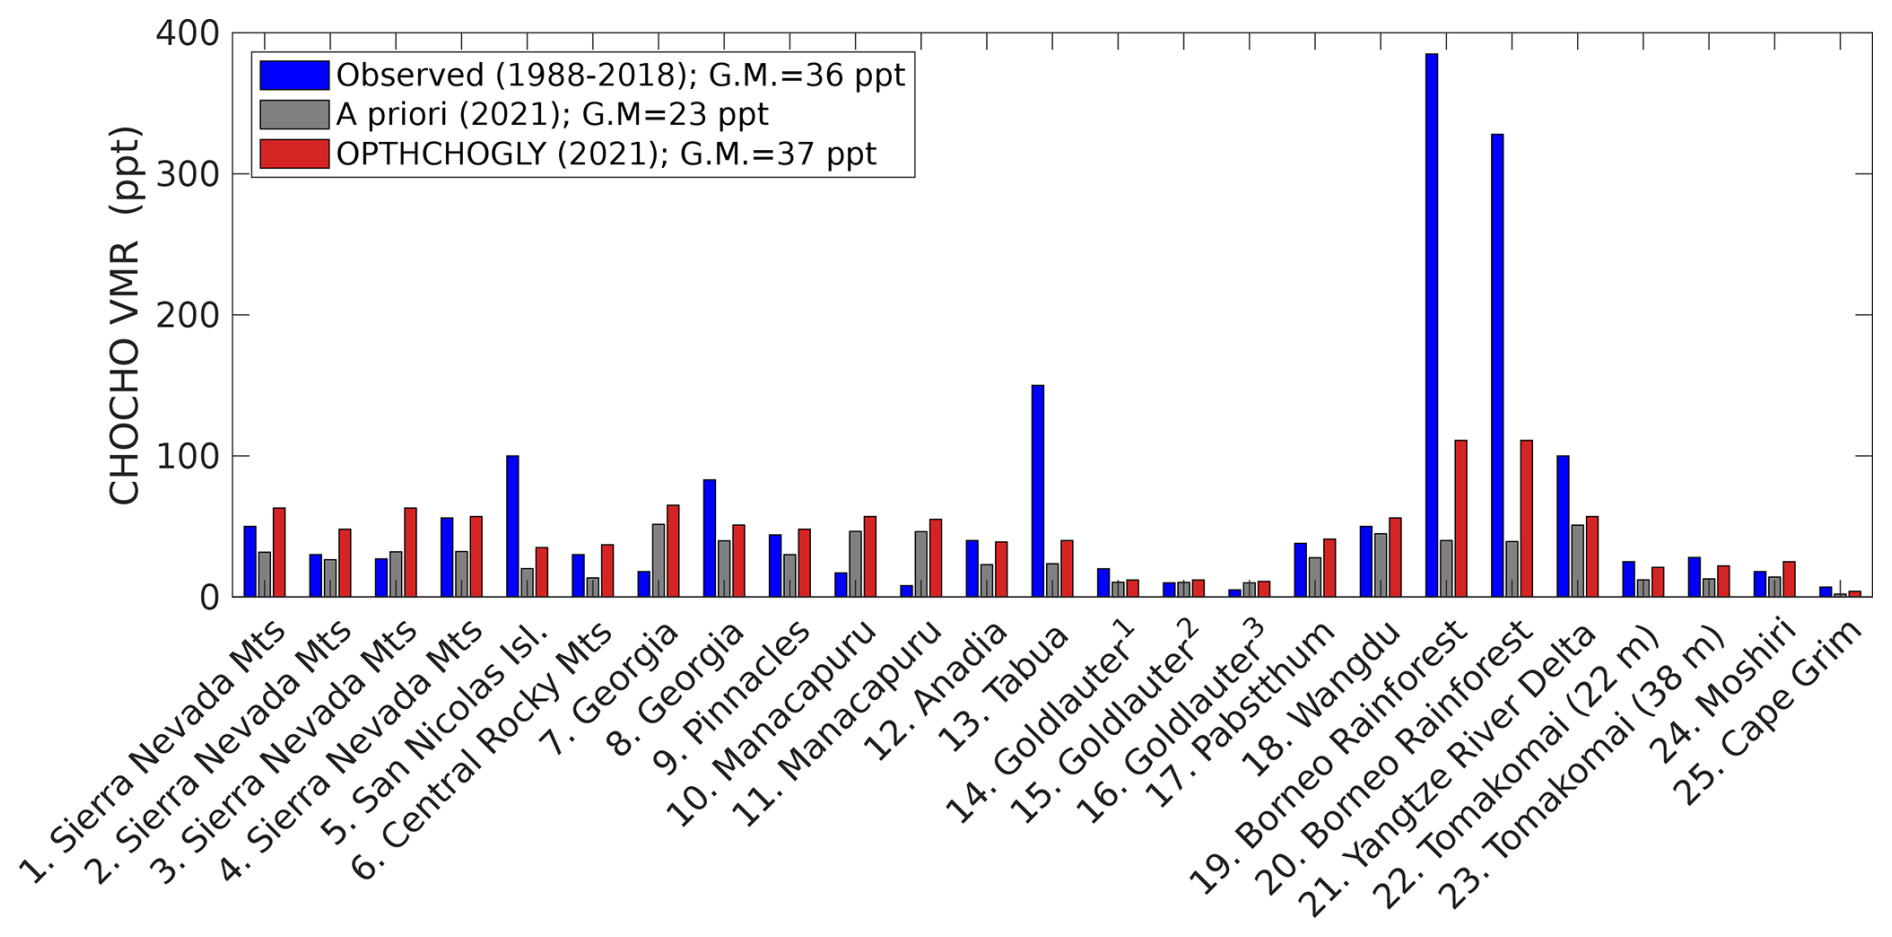
Figure 12 Observed CHOCHO mixing ratios (pptv) from in situ measurement campaigns at 17 rural sites (between 1990 and 2018), and corresponding values from a priori and optimized (OPTHCHOGLY) model. Numbering corresponds to the detailed entries in Table S1 and the locations on the map in Fig. 11. G.M.: geometric mean. Different bars for the Sierra Nevada Mountains campaign correspond to measurements in different years. At Tomakomai, measurements were performed at 22 and 38 m above ground level. Some subsets of the observations are listed for different times of the month: 1 late October, 2 early October, 3 mid-October.
At the tropical rainforest sites, the in situ observations vary widely, resulting in a poor model match: in Manacapuru, a semi-rural city in the Amazon rainforest located 80 km away from the Amazonas capital Manaus, observed glyoxal levels are of the order of 0.01 ppb, significantly lower than the a priori estimate of 0.05 ppb, while in the pristine Borneo rainforest, the observed concentrations average almost 30 times higher, significantly higher than the a priori estimate. The TROPOMI-constrained optimization results in an increased glyoxal concentration at all rainforest sites. In general, levels of glyoxal would be expected to be elevated in these areas due to the strong biogenic emissions of isoprene and monoterpenes.
In Tabua, Portugal, the high (150 ppt) observed glyoxal concentrations–as opposed to the moderate ones in Anadia–can be explained by the Tabua site's location, surrounded by large Eucalyptus globulus plantations. This species is known to strongly emit isoprene and monoterpenes, as confirmed by the measurements at the site (Cerqueira et al., 2003). Neither the a priori nor the OPTHCHOGLY model can resolve these elevated levels. In Georgia, U.S., the very low glyoxal levels in the July-August campaign cannot be replicated by the models. The nearly five times higher levels in the June campaign at the same site are closer to those resulting from the optimized model. Finally, at San Nicholas Island, the very high (100 ppt) glyoxal concentration measured was due to a severe smog event during the measurements (Grosjean et al., 1996) and is evidently not replicated by the 2021 model results.
Overall, across the rural sites, the mean glyoxal concentration inferred by the OPTHCHOGLY inversion (37 ppt) is in excellent agreement with the observations (36 ppt), and is on average 60 % higher than the bottom-up model average (23 ppt). A very similar result is obtained when assuming a shorter UVOC lifetime (1 d, S1 sensitivity inversion), whereas the modeled average glyoxal concentration after inversion is circa 30 % higher than the observation when assuming a long UVOC lifetime (10 d). At urban locations, the mean observed level (381 ppt) is about 10 times higher than typical rural values, and cannot be replicated by the inversions. As shown in Table S2 and Fig. S4, the urban measurements strongly fluctuate with time and location, and therefore, as opposed to the rural measurements, have limited representativeness for the coarse model grid used in this work. For example, glyoxal levels in Salvador, Brazil (index 52 and 53 in Table S2) were measured only one hour apart during the morning rush hour, but differ by more than a factor of 10.
5.3 Evaluation of modeled formaldehyde and glyoxal columns against long-term MAX-DOAS data at Phimai
At the rural site of Phimai, central Thailand (15.18° N, 102.56° E), continuous measurements of formaldehyde and glyoxal were obtained using the MAX-DOAS technique from October 2014 to October 2016 (Hoque et al., 2018) allowing for a comparison with the model throughout an entire year (Fig. 13). The climate in Phimai has two pronounced seasons: the dry season from January to April, and the wet season from June to September. Biomass burning is common during the dry season, and in combination with high biogenic emission fluxes, it leads to the enhanced formaldehyde (7 ppb) and glyoxal (0.2 ppb) levels in March, whereas the monthly mean mixing ratios during the wet season were 2 and 0.1 ppb, respectively. The optimization improves the model performance at this site significantly, with the mean percentage bias between the model and the MAX-DOAS observation having decreased for both compounds, and the Pearson correlation coefficient having increased from 0.52 to 0.84 for formaldehyde and from 0.22 to 0.71 for glyoxal (Fig. 13a, c). The MAX-DOAS observations indicate dry season formaldehyde and glyoxal concentration levels about twice as high as in the wet season. While that ratio was close to unity in the inventory-based model (reflecting the low seasonal variability in Fig. 13a), the seasonality is more marked after optimization, in good agreement with the MAX-DOAS data. The comparison between TROPOMI and modeled data at the same location shows excellent top-down agreement, with a decrease of the mean percentage bias between the model and the TROPOMI observation after optimization from −20 % to −5 % for formaldehyde and from −21 % to 0 % for glyoxal (Fig. 13b, d). The seasonal variation of the MAX-DOAS measurements is very well captured by the TROPOMI observations and reproduced by the optimized (OPTHCHOGLY) model.
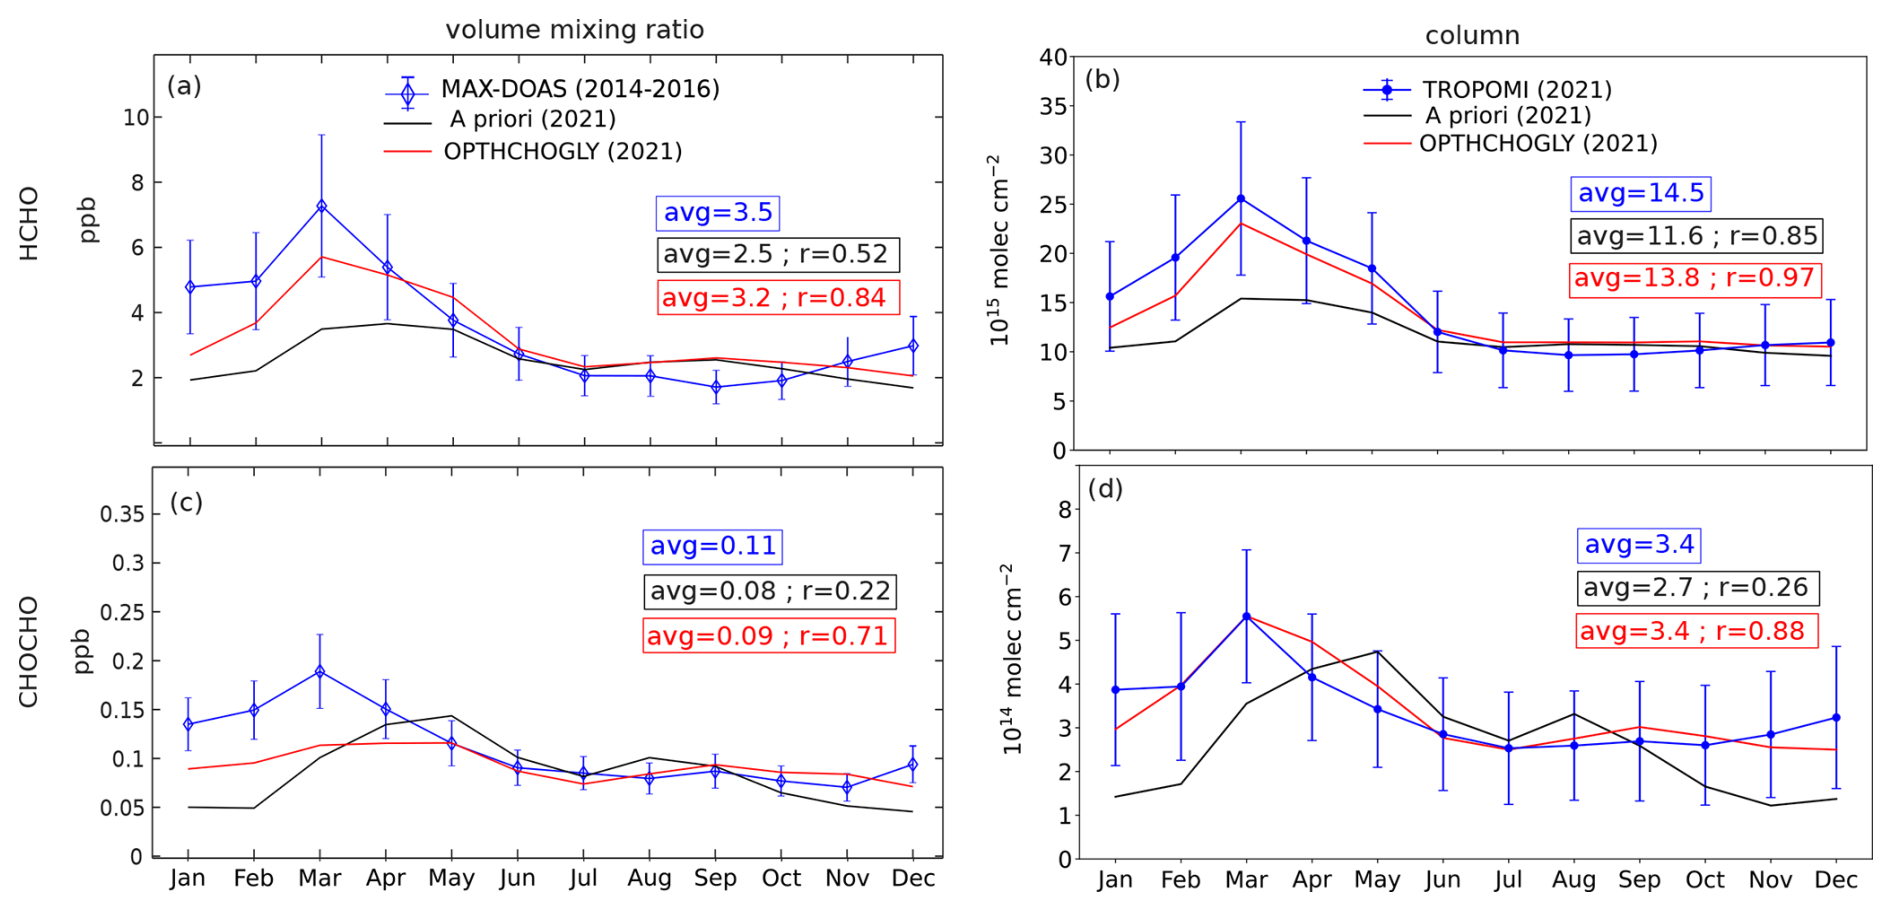
Figure 13 Monthly averaged formaldehyde (a, b) and glyoxal (c, d) levels at Phimai, Thailand. (a, c) MAX-DOAS observations for the 0–1 km layer obtained from October 2014 to October 2016 by Hoque et al. (2018) are shown in blue, the a priori and optimized model for 2021 in black and red, respectively. Error bars represent the total observation error (including random, systematic and bias in elevation angle) of 30 % for formaldehyde and 20 % for glyoxal. (b, d) TROPOMI formaldehyde (b) and glyoxal (d) columns in 2021 are shown in blue; error bars represent the total observation error (Sect. 3.2.1 and 3.2.2). The a priori and optimized (OPTHCHOGLY inversion) formaldehyde and glyoxal columns for the site in 2021 are in black and red, respectively. Insets: avg = yearly average; r = Pearson correlation coefficient between model and observation.
We performed a global top-down inversion of continental NMVOC emissions for 2021 constrained by glyoxal and formaldehyde columns from the spaceborne TROPOMI instrument. The inversion is realized using the adjoint of the MAGRITTEv1.2 model, which was updated to include detailed aromatic chemistry and up-to-date parameterization of glyoxal uptake onto aerosols. This study represents the first joint inversion using both tracers from TROPOMI, allowing better constraints on VOC sources than were possible with earlier, lower resolution satellite data. In addition, the joint inversion enables improved constraints on the longstanding issue of missing glyoxal sources in global atmospheric chemistry models. The total amount of NMVOCs emitted from land into the atmosphere in 2021 is estimated in this study at 1070 Tg and composed of 749 Tg from vegetation, 102 Tg from biomass burning (wildfires, land clearing, and agricultural and controlled burns), and 219 Tg from human activity (domestic, industrial, agricultural, energy production and transport). This estimate is by 19 % higher than the bottom-up inventories used in this work. Two emission inversions were conducted. The first one, constrained by atmospheric formaldehyde alone, provides robust constraints on the total VOC flux (especially isoprene), because the yield of formaldehyde from the oxidation of major NMVOCs is relatively well known. The formaldehyde-and-glyoxal constrained inversion allows the further partitioning of anthropogenic emissions into glyoxal and non-glyoxal precursors; furthermore, it addresses the quantification of the missing source of glyoxal.
The inversions also reveal significant regional and sectoral discrepancies between the bottom-up and top-down emissions. Relative to the MEGAN-based a priori inventory, isoprene emissions from the two-compound inversion are enhanced by as much as 90 %, 58 %, 42 % and 28 %, respectively, over Northern Hemisphere Africa, South Asia, Europe and North America. Large increases (locally up to a factor of 3) are also inferred other regions, notably the western half of North America. Emission decreases are derived over Australia (by 18 %) and large parts of South America. The results are broadly consistent with a recent inversion study based on (bias-corrected) OMI HCHO data, to the notable exception of middle and high latitudes.
Fire emissions in Southern Hemisphere Africa and South Asia are enhanced by about 50 % relative to the QFED inventory, with India reaching 3 Tg yr−1, three times the bottom-up value. Large mismatches over Zambia, Zimbabwe, and Mozambique appear consistent with earlier studies. Other regions with large differences coincide with places where agricultural burning is common practice, showing that these remain poorly captured in inventories. In the northwestern United States, emissions from July 2021 wildfires are increased by nearly a factor of three, while Siberian fire emissions are well represented by the inventory.
Anthropogenic VOC emissions in the United States, Russia, and Europe remain mostly unaffected by the emission optimization. In contrast, large emission increases are derived over Iran (factor of ∼ 2) and over India (∼ 1.6), where optimized emissions reach 19 Tg in 2021. After inversion, global emissions of anthropogenic glyoxal precursors (acetylene, ethene, and aromatic hydrocarbons) are estimated at 50 Tg yr−1, 43 % higher than the bottom-up total from the CAMS-GLOB-ANT inventory. Global acetylene (4.4 Tg yr−1) and ethene (10.2 Tg yr−1) emissions are both about 60 % higher than in the a priori, whereas benzene emissions (7.9 Tg yr−1) are ∼ 40 % higher. India is identified as the top global emitter of acetylene and ethene, while also emitting large amounts of aromatics. Although recently introduced air quality regulations may improve activity reporting in India, reliable emission estimation also requires the development of emission factors tailored to the Indian context.
China emerges as the largest emitter of aromatic hydrocarbons: 6.5 Tg in 2021, out of which 1.8 Tg in Beijing-Tianjin-Hebei alone, ∼30 % more than reported in CAMS-GLOB-ANT. Anthropogenic emissions from Mexico, the Middle East, Indonesia, and parts of Africa are also substantially enhanced; for example, inferred aromatic emissions from Africa are 1.6 times higher than inventory values (4.7 Tg yr−1 vs 2.9 Tg yr−1). Given the health concerns of exposure to aromatics, for example the estimate by Partha et al. (2022) that more than half a million preterm births per year are attributable to aromatic hydrocarbon exposure in China and India, it is important to improve the accuracy of these emission estimates.
Based on the joint inversion of TROPOMI formaldehyde and glyoxal columns, we estimate that 41 % of the global glyoxal source cannot be explained by currently known VOC emissions and chemical mechanisms. The inversion yields a total glyoxal source of ca. 100 Tg yr−1, of which 58 Tg is attributed to the photochemical production from known VOC sources, and 41 Tg from unidentified VOCs (UVOCs). The missing source appears predominantly biogenic, with 70 % originating in the Tropics. Given the dominance of isoprene in the global VOC budget, a large part of the missing glyoxal source over broadleaved and mixed forests likely reflects underrepresented or missing chemical pathways of glyoxal formation from isoprene, especially under low-NOx conditions. The low magnitude of the inferred missing source over China, India and the eastern U.S. suggests that glyoxal formation from isoprene is well represented in the model at higher NOx levels. In the boreal zone, both an underestimation of monoterpene emissions in the MEGAN inventory and an underestimation of glyoxal yields from monoterpenes in the model chemistry might additionally contribute to the discrepancy. Beyond the results of this study, other potential contributors to the glyoxal budget have been suggested. Secondary production from furanoids during fire events may play a role (Romanias et al., 2024), pointing to the need for their future inclusion in chemical transport models. Similarly, marine glyoxal sources could be relevant in coastal regions, although the contribution of algae as precursors remains poorly understood (Williams et al., 2024).
The modeled formaldehyde and glyoxal columns after inversion show good agreement in both magnitude and seasonality with the TROPOMI observations, with very few exceptions. Evaluation against independent datasets confirms the robustness of the inversion. More specifically, comparison with Pandonia Global Network column data further validates the (bias-corrected) HCHO TROPOMI dataset and shows a substantial reduction of the mean model bias (from 30 % to 20 %) and improved statistics at the majority of stations. In addition, model comparison with in situ glyoxal concentrations shows significantly improved agreement at rural stations: the mean glyoxal concentration after the inversion closely matches the observations, whereas the bottom-up model average was ∼ 40 % too low. Finally, comparison with a one-year MAX-DOAS dataset at a tropical rural site in Thailand also shows substantial improvements in both absolute concentrations and seasonality, for formaldehyde as well as for glyoxal, giving credence to the emission updates in this region strongly influenced by biogenic precursors.
The global top-down VOC emission fluxes for five categories, constrained by TROPOMI formaldehyde and glyoxal observations, are available at https://doi.org/10.18758/52E4U9EN (Sfendla et al., 2025). The Copernicus Sentinel-5P TROPOMI Level 2 Formaldehyde Total Column products (v2) can be found at https://doi.org/10.5270/S5P-vg1i7t0 (Copernicus Sentinel-5P, 2020), and the TROPOMI glyoxal tropospheric columns (v4) at https://doi.org/10.18758/71021069 (Lerot and Danckaert, 2021). The MEGAN-MOHYCAN isoprene inventory is available at https://emissions.aeronomie.be (last access: 8 January 2026).
The supplement related to this article is available online at https://doi.org/10.5194/acp-26-733-2026-supplement.
YS carried out the analysis, performed the evaluation of the model against in situ data, and wrote the manuscript. TS and JFM designed the inversions, performed the optimizations, and reviewed the manuscript. GMO performed the evaluation of the model against the PGN column data. BO contributed to the a priori model configuration. IDS provided the TROPOMI formaldehyde retrievals and advice on their use. TD developed the glyoxal retrievals from TROPOMI and gave advice on their use. All the co-authors read and commented on the manuscript and provided feedback.
The contact author has declared that none of the authors has any competing interests.
Publisher's note: Copernicus Publications remains neutral with regard to jurisdictional claims made in the text, published maps, institutional affiliations, or any other geographical representation in this paper. The authors bear the ultimate responsibility for providing appropriate place names. Views expressed in the text are those of the authors and do not necessarily reflect the views of the publisher.
YS was supported by the GLANCE project funded by the European Space Agency (ESA) under the “eo science for society” programme and by the CONCERTO project. GMO was supported by Belspo through the ProDEx project TROVA-E3 (TROPOMI Validation – Phase E3) of the European Space Agency (2024-2025).
This research has been supported by the European Space Agency (GLANCE eo4society grant) and the European Commission, HORIZON EUROPE Framework Programme (CONCERTO (grant agreement no. 101185000)).
This paper was edited by Steven Brown and reviewed by two anonymous referees.
Alvarado, L. M. A., Richter, A., Vrekoussis, M., Hilboll, A., Kalisz Hedegaard, A. B., Schneising, O., and Burrows, J. P.: Unexpected long-range transport of glyoxal and formaldehyde observed from the Copernicus Sentinel-5 Precursor satellite during the 2018 Canadian wildfires, Atmos. Chem. Phys., 20, 2057–2072, https://doi.org/10.5194/acp-20-2057-2020, 2020. a
An, J., Huang, Y., Huang, C., Wang, X., Yan, R., Wang, Q., Wang, H., Jing, S., Zhang, Y., Liu, Y., Chen, Y., Xu, C., Qiao, L., Zhou, M., Zhu, S., Hu, Q., Lu, J., and Chen, C.: Emission inventory of air pollutants and chemical speciation for specific anthropogenic sources based on local measurements in the Yangtze River Delta region, China, Atmos. Chem. Phys., 21, 2003–2025, https://doi.org/10.5194/acp-21-2003-2021, 2021. a, b
Andreae, M. O.: Emission of trace gases and aerosols from biomass burning – an updated assessment, Atmos. Chem. Phys., 19, 8523–8546, https://doi.org/10.5194/acp-19-8523-2019, 2019. a, b
Bates, K. H., Jacob, D. J., Li, K., Ivatt, P. D., Evans, M. J., Yan, Y., and Lin, J.: Development and evaluation of a new compact mechanism for aromatic oxidation in atmospheric models, Atmos. Chem. Phys., 21, 18351–18374, https://doi.org/10.5194/acp-21-18351-2021, 2021. a, b, c, d
Barkley, M. P., González Abad, G., Kurosu, T. P., Spurr, R., Torbatian, S., and Lerot, C.: OMI air-quality monitoring over the Middle East, Atmos. Chem. Phys., 17, 4687–4709, https://doi.org/10.5194/acp-17-4687-2017, 2017. a
Bauwens, M., Stavrakou, T., Müller, J.-F., De Smedt, I., Van Roozendael, M., van der Werf, G. R., Wiedinmyer, C., Kaiser, J. W., Sindelarova, K., and Guenther, A.: Nine years of global hydrocarbon emissions based on source inversion of OMI formaldehyde observations, Atmos. Chem. Phys., 16, 10133–10158, https://doi.org/10.5194/acp-16-10133-2016, 2016. a, b, c
Bauwens, M., Stavrakou, T., Müller, J.-F., Van Schaeybroeck, B., De Cruz, L., De Troch, R., Giot, O., Hamdi, R., Termonia, P., Laffineur, Q., Amelynck, C., Schoon, N., Heinesch, B., Holst, T., Arneth, A., Ceulemans, R., Sanchez-Lorenzo, A., and Guenther, A.: Recent past (1979–2014) and future (2070–2099) isoprene fluxes over Europe simulated with the MEGAN–MOHYCAN model, Biogeosciences, 15, 3673–3690, https://doi.org/10.5194/bg-15-3673-2018, 2018. a, b
Bauwens, M., Verreyken, B., Stavrakou, T., Müller, J.-F., and Smedt, I. D.: Spaceborne evidence for significant anthropogenic VOC trends in Asian cities over 2005–2019, Environ. Res. Lett., 17, 015008, https://doi.org/10.1088/1748-9326/ac46eb, 2022. a
Berndt, T.,Scholz, W., Mentler, B., Fischer, L., Herrmann, H., Kulmala, M., and Hansel, A.: Accretion Product Formation from Self- and Cross-Reactions of RO2 Radicals in the Atmosphere, Angew. Chemie, 57, 3820–3824, https://doi.org/10.1002/anie.201710989, 2018. a
Biswas, S., Lasko, K. D., and Vadrevu, K. P.: Fire Disturbance in Tropical Forests of Myanmar—Analysis Using MODIS Satellite Datasets, IEEE J. Sel. Top. Appl., 8, 2273–2281, https://doi.org/10.1109/JSTARS.2015.2423681, 2015. a
Borrego, C., Gomes, P., Barros, N., and Miranda, A. I.: Importance of handling organic atmospheric pollutants for assessing air quality, J. Chromatogr. A, 889, 271–279, https://doi.org/10.1016/S0021-9673(00)00230-2, 2000. a
Cao, H., Fu, T.-M., Zhang, L., Henze, D. K., Miller, C. C., Lerot, C., Abad, G. G., De Smedt, I., Zhang, Q., van Roozendael, M., Hendrick, F., Chance, K., Li, J., Zheng, J., and Zhao, Y.: Adjoint inversion of Chinese non-methane volatile organic compound emissions using space-based observations of formaldehyde and glyoxal, Atmos. Chem. Phys., 18, 15017–15046, https://doi.org/10.5194/acp-18-15017-2018, 2018. a
Cerqueira, M. A., Pio, C. A., Gomes, P. A., Matos, J. S., and Nunes, T. V.: Volatile organic compounds in rural atmospheres of central Portugal, Sci. Total Environ., 313, 49–60, https://doi.org/10.1016/S0048-9697(03)00250-X, 2003. a, b
Chaliyakunnel, S., Millet, D. B., Wells, K. C., Cady-Pereira, K. E., and Shephard, M. W.: A large underestimate of formic acid from tropical fires: Constraints from space-borne measurements, Environ. Sci. Technol., 50, 5631–5640, https://doi.org/10.1021/acs.est.5b06385, 2016. a
Chaliyakunnel, S., Millet, D. B., and Chen, X.: Constraining Emissions of Volatile Organic Compounds Over the Indian Subcontinent Using Space-Based Formaldehyde Measurements, J. Geophys. Res.-Atmos., 124, 10525–10545, https://doi.org/10.1029/2019JD031262, 2019. a
Chameides, W. L., Lindsay, R. W., Richardson, J., and Kiang, C. S.: The Role of Biogenic Hydrocarbons in Urban Photochemical Smog: Atlanta as a Case Study, Science, 241, 1473–1475, https://doi.org/10.1126/science.3420404, 1988. a
Chang, D., Wang, Z., Guo, J., Li, T., Liang, Y., Kang, L., Xia, M., Wang, Y., Yu, C., Yun, H., Yue, D., and Wang, T.: Characterization of organic aerosols and their precursors in southern China during a severe haze episode in January 2017, Sci. Total Environ., 691, 101–111, https://doi.org/10.1016/j.scitotenv.2019.07.123, 2019. a
Chan Miller, C., Gonzalez Abad, G., Wang, H., Liu, X., Kurosu, T., Jacob, D. J., and Chance, K.: Glyoxal retrieval from the Ozone Monitoring Instrument, Atmos. Meas. Tech., 7, 3891–3907, https://doi.org/10.5194/amt-7-3891-2014, 2014. a
Chan Miller, C., Jacob, D. J., González Abad, G., and Chance, K.: Hotspot of glyoxal over the Pearl River delta seen from the OMI satellite instrument: implications for emissions of aromatic hydrocarbons, Atmos. Chem. Phys., 16, 4631–4639, https://doi.org/10.5194/acp-16-4631-2016, 2016. a
Chen, Y., Liu, C., Su, W., Hu, Q., Zhang, C., Liu, H., and Yin, H.: Identification of volatile organic compound emissions from anthropogenic and biogenic sources based on satellite observation of formaldehyde and glyoxal, Sci. Total Environ., 859, 159997, https://doi.org/10.1016/j.scitotenv.2022.159997, 2023. a
Choi, E., Lee, H.-M., Kim, Y. P., Lee, J. Y., and Wu, Z.: Evaluation of the behavior of BTEX at Beijing and Seoul in winter and summer using observations and 3-D modeling, Atmos. Environ., 319, 120268, https://doi.org/10.1016/j.atmosenv.2023.120268, 2024. a
Copernicus Sentinel-5P: TROPOMI Level 2 Formaldehyde Total Column products, Version 02, European Space Agency [data set], https://doi.org/10.5270/S5P-vg1i7t0, 2020. a
Curry, L. A., Tsui, W. G., and McNeill, V. F.: Technical note: Updated parameterization of the reactive uptake of glyoxal and methylglyoxal by atmospheric aerosols and cloud droplets, Atmos. Chem. Phys., 18, 9823–9830, https://doi.org/10.5194/acp-18-9823-2018, 2018. a, b
Dai, W. T., Ho, S. S. H., Ho, K. F., Liu, W. D., Cao, J. J., and Lee, S. C.: Seasonal and diurnal variations of mono- and di-carbonyls in Xi'an, China, Atmos. Res., 113, 102–112, https://doi.org/10.1016/j.atmosres.2012.05.001, 2012. a
Darmenov, A., and da Silva, A.: The quick fire emissions dataset (QFED) – Documentation of versions 2.1, 2.2 and 2.4. NASA//TM-2015-104606, Vol. 38, NASA Global Modeling and Assimilation Office, https://gmao.gsfc.nasa.gov/pubs/docs/Darmenov796.pdf (last access: 15 August 2024), 2015. a
De Smedt, I., Theys, N., Yu, H., Danckaert, T., Lerot, C., Compernolle, S., Van Roozendael, M., Richter, A., Hilboll, A., Peters, E., Pedergnana, M., Loyola, D., Beirle, S., Wagner, T., Eskes, H., van Geffen, J., Boersma, K. F., and Veefkind, P.: Algorithm theoretical baseline for formaldehyde retrievals from S5P TROPOMI and from the QA4ECV project, Atmos. Meas. Tech., 11, 2395–2426, https://doi.org/10.5194/amt-11-2395-2018, 2018. a, b
De Smedt, I., Pinardi, G., Vigouroux, C., Compernolle, S., Bais, A., Benavent, N., Boersma, F., Chan, K.-L., Donner, S., Eichmann, K.-U., Hedelt, P., Hendrick, F., Irie, H., Kumar, V., Lambert, J.-C., Langerock, B., Lerot, C., Liu, C., Loyola, D., Piters, A., Richter, A., Rivera Cárdenas, C., Romahn, F., Ryan, R. G., Sinha, V., Theys, N., Vlietinck, J., Wagner, T., Wang, T., Yu, H., and Van Roozendael, M.: Comparative assessment of TROPOMI and OMI formaldehyde observations and validation against MAX-DOAS network column measurements, Atmos. Chem. Phys., 21, 12561–12593, https://doi.org/10.5194/acp-21-12561-2021, 2021. a, b, c
De Smedt, I., Romahn, F., and Eichmann, K.-U.: S5P MPC Product Readme Formaldehyde V02.05.00, https://sentinels.copernicus.eu/documents/247904/3541451/Sentinel-5P-Formaldehyde-Readme.pdf (last access: 15 August 2024), 2023. a
DiGangi, J. P., Henry, S. B., Kammrath, A., Boyle, E. S., Kaser, L., Schnitzhofer, R., Graus, M., Turnipseed, A., Park, J.-H., Weber, R. J., Hornbrook, R. S., Cantrell, C. A., Maudlin III, R. L., Kim, S., Nakashima, Y., Wolfe, G. M., Kajii, Y., Apel, E. C., Goldstein, A. H., Guenther, A., Karl, T., Hansel, A., and Keutsch, F. N.: Observations of glyoxal and formaldehyde as metrics for the anthropogenic impact on rural photochemistry, Atmos. Chem. Phys., 12, 9529–9543, https://doi.org/10.5194/acp-12-9529-2012, 2012. a
Ervens, B. and Volkamer, R.: Glyoxal processing by aerosol multiphase chemistry: towards a kinetic modeling framework of secondary organic aerosol formation in aqueous particles, Atmos. Chem. Phys., 10, 8219–8244, https://doi.org/10.5194/acp-10-8219-2010, 2010. a
Franco, B., Clarisse, L., Stavrakou, T., Müller, J.-F, Van Damme, M., Whitburn, S., Hadji-Lazaro, J., Hurtmans, D., Taraborrelli, D., Clerbaux, C., and Coheur, P.-F: A General Framework for Global Retrievals of Trace Gases From IASI: Application to Methanol, Formic Acid, and PAN, J. Geophys. Res.-Atmos., 123, 13963–13984, https://doi.org/10.1029/2018JD029633, 2018. a
Franco, B., Clarisse, L., Stavrakou, T., Müller, J.-F., Pozzer, A., Hadji-Lazaro, J., Hurtmans, D., Clerbaux, C., and Coheur, P.-F.: Acetone Atmospheric Distribution Retrieved From Space, Geophys. Res. Lett., 46, 2884–2893, https://doi.org/10.1029/2019GL082052, 2019. a
Franco, B., Clarisse, L., Van Damme, M., Hadji-Lazaro, J., Clerbaux, C., and Coheur, P.-F.: Ethylene industrial emitters seen from space, Nat. Commun., 13, 6452, https://doi.org/10.1038/s41467-022-34098-8, 2022. a, b
Franco, B., Clarisse, L., Van Damme, M., Hadji-Lazaro, J., Clerbaux, C., and Coheur, P.: Satellite-based identification of large anthropogenic NMVOC emission sources, J. Geophys. Res., 129, e2024JD042047, https://doi.org/10.1029/2024JD042047, 2024. a
Fu, T., Jacob, D. J., Wittrock, F., Burrows, J. P., Vrekoussis, M., and Henze, D. K.: Global budgets of atmospheric glyoxal and methylglyoxal, and implications for formation of secondary organic aerosols, J. Geophys. Res.-Atmos., 113, 2007JD009505, https://doi.org/10.1029/2007JD009505, 2008. a, b, c, d
Fu, D., Millet, D. B., Wells, K. C., Payne, V. H., Yu, S., Guenther, A., and Eldering, A.: Direct retrieval of isoprene from satellite-based infrared measurements, Nat. Commun., 10, 3811, https://doi.org/10.1038/s41467-019-11835-0, 2019. a
Fung, K. and Grosjean, D.: Determination of nanogram amounts of carbonyls as 2,4-dinitrophenylhydrazones by high-performance liquid chromatography, Anal. Chem., 53, 168–171, https://doi.org/10.1021/ac00225a009, 1981. a
Gale, F. and Davis, E. Chinese Cotton: Textiles, Imports, and Xinjiang. USDA Economic Research Service Report, https://doi.org/10.22004/AG.ECON.329762, 2022. a
Ganguly, T., Selvaraj, K. L., and Guttikunda, S. K.: National Clean Air Programme (NCAP) for Indian cities: Review and outlook of clean air action plans, Atmos. Environ., 8, 100096, https://doi.org/10.1016/j.aeaoa.2020.100096, 2020. a
Gkatzelis, G. I., Coggon, M. M., Stockwell, C. E., Hornbrook, R. S., Allen, H., Apel, E. C., Bela, M. M., Blake, D. R., Bourgeois, I., Brown, S. S., Campuzano-Jost, P., St. Clair, J. M., Crawford, J. H., Crounse, J. D., Day, D. A., DiGangi, J. P., Diskin, G. S., Fried, A., Gilman, J. B., Guo, H., Hair, J. W., Halliday, H. S., Hanisco, T. F., Hannun, R., Hills, A., Huey, L. G., Jimenez, J. L., Katich, J. M., Lamplugh, A., Lee, Y. R., Liao, J., Lindaas, J., McKeen, S. A., Mikoviny, T., Nault, B. A., Neuman, J. A., Nowak, J. B., Pagonis, D., Peischl, J., Perring, A. E., Piel, F., Rickly, P. S., Robinson, M. A., Rollins, A. W., Ryerson, T. B., Schueneman, M. K., Schwantes, R. H., Schwarz, J. P., Sekimoto, K., Selimovic, V., Shingler, T., Tanner, D. J., Tomsche, L., Vasquez, K. T., Veres, P. R., Washenfelder, R., Weibring, P., Wennberg, P. O., Wisthaler, A., Wolfe, G. M., Womack, C. C., Xu, L., Ball, K., Yokelson, R. J., and Warneke, C.: Parameterizations of US wildfire and prescribed fire emission ratios and emission factors based on FIREX-AQ aircraft measurements, Atmos. Chem. Phys., 24, 929–956, https://doi.org/10.5194/acp-24-929-2024, 2024. a
Glushkov, I., Zhuravleva, I., McCarty, J. L., Komarova, A., Drozdovsky, A., Drozdovskaya, M., Lupachik, V., Yaroshenko, A., Stehman, S. V., and Prishchepov, A. V.: Spring fires in Russia: results from participatory burned area mapping with Sentinel-2 imagery, Environ. Res. Lett., 16, 125005, https://doi.org/10.1088/1748-9326/ac3287, 2021. a
Granier, C., Bessagnet, B., Bond, T., D'Angiola, A., Denier Van Der Gon, H., Frost, G. J., Heil, A., Kaiser, J. W., Kinne, S., Klimont, Z., Kloster, S., Lamarque, J.-F., Liousse, C., Masui, T., Meleux, F., Mieville, A., Ohara, T., Raut, J.-C., Riahi, K., Schultz, M. G., Smith, S. J., Thompson, A., Van Aardenne, J., Van Der Werf, G. R., and Van Vuuren, D. P.: Evolution of anthropogenic and biomass burning emissions of air pollutants at global and regional scales during the 1980–2010 period, Climatic Change, 109, 163–190, https://doi.org/10.1007/s10584-011-0154-1, 2011. a
Granier, C., Darras, S., van der Gon, H. D., Doubalova, J., Elguindi, N., Galle, B., Gauss, M., Guevara, M., Jalkanen, J.-P. Kuenen, J., Liousse, C., Quack, B., Simpson, D., and Sindelarova, K.: The Copernicus Atmosphere Monitoring Service global and regional emissions (April 2019 version), Copernicus Atmosphere Monitoring Service (CAMS) report, https://doi.org/10.24380/d0bn-kx16, 2019. a
Grosjean, D., Miguel, A. H., and Tavares, T. M.: Urban air pollution in Brazil: Acetaldehyde and other carbonyls, Atmos. Environ., 24, 101–106, https://doi.org/10.1016/0957-1272(90)90015-M, 1990. a, b
Grosjean, E., Grosjean, D., Fraser, M. P., and Cass, G. R.: Air Quality Model Evaluation Data for Organics. 2. C1 −C14 Carbonyls in Los Angeles Air, Environ. Sci. Technol., 30, 2687–2703, https://doi.org/10.1021/es950758w, 1996. a, b
Grosjean, D., Grosjean, E., and Moreira, L. F. R.: Speciated Ambient Carbonyls in Rio de Janeiro, Brazil, Environ. Sci. Technol., 36, 1389–1395, https://doi.org/10.1021/es0111232, 2002. a
Guenther, A., Karl, T., Harley, P., Wiedinmyer, C., Palmer, P. I., and Geron, C.: Estimates of global terrestrial isoprene emissions using MEGAN (Model of Emissions of Gases and Aerosols from Nature), Atmos. Chem. Phys., 6, 3181–3210, https://doi.org/10.5194/acp-6-3181-2006, 2006. a
Guenther, A. B., Jiang, X., Heald, C. L., Sakulyanontvittaya, T., Duhl, T., Emmons, L. K., and Wang, X.: The Model of Emissions of Gases and Aerosols from Nature version 2.1 (MEGAN2.1): an extended and updated framework for modeling biogenic emissions, Geosci. Model Dev., 5, 1471–1492, https://doi.org/10.5194/gmd-5-1471-2012, 2012. a, b
Hersbach, H., Bell, B., Berrisford, P., Hirahara, S., Horányi, A., Muñoz-Sabater, J., Nicolas, J., Peubey, C., Radu, R., Schepers, D., Simmons, A., Soci, C., Abdalla, S., Abellan, X., Balsamo, G., Bechtold, P., Biatavi, G., Bidlot, J., Bonavita, M., De Chiara, G., Dahlgren, P., Dee, D., Diamantakis, M., Dragani, R., Flemming, J., Forbes, R., Fuentes, M., Geer, A., Haimberger, L., Healy, S., Hogan, R. J., Hólm, E., Janisková, M., Keeley, S., Laloyaux, P., Lopez, P., Lupu, C., Radnoti, G., de Rosnay, P., Rozum, I., Vamborg, F., Villaume, S., and Thépaut, J.-N.: The ERA5 global reanalysis, Q. J. R. Meteorol. Soc., 146, 1999–2049, https://doi.org/10.1002/qj.3803, 2020. a
Ho, S. S. H. and Yu, J. Z.: Feasibility of Collection and Analysis of Airborne Carbonyls by On-Sorbent Derivatization and Thermal Desorption, Anal. Chem., 74, 1232–1240, https://doi.org/10.1021/ac015708q, 2002. a
Ho, S. S. H., Ip, H. S. S., Ho, K. F., Ng, L. P. T., Chan, C. S., Dai, W. T., and Cao, J. J.: Hazardous airborne carbonyls emissions in industrial workplaces in China, J. Air Waste Manag. Assoc., 63, 864–877, https://doi.org/10.1080/10962247.2013.797519, 2013. a
Hoque, H. M. S., Irie, H., and Damiani, A.: First MAX-DOAS Observations of Formaldehyde and Glyoxal in Phimai, Thailand, J. Geophys. Res.-Atmos., 123, 9957–9975, https://doi.org/10.1029/2018JD028480, 2018. a, b, c, d, e
Huisman, A. J., Hottle, J. R., Galloway, M. M., DiGangi, J. P., Coens, K. L., Choi, W., Faloona, I. C., Gilman, J. B., Kuster, W. C., de Gouw, J., Bouvier-Brown, N. C., Goldstein, A. H., LaFranchi, B. W., Cohen, R. C., Wolfe, G. M., Thornton, J. A., Docherty, K. S., Farmer, D. K., Cubison, M. J., Jimenez, J. L., Mao, J., Brune, W. H., and Keutsch, F. N.: Photochemical modeling of glyoxal at a rural site: observations and analysis from BEARPEX 2007, Atmos. Chem. Phys., 11, 8883–8897, https://doi.org/10.5194/acp-11-8883-2011, 2011. a
Ieda, T., Kitamor, Y., Mochida, M., Hirata, R., Hirano, T., Inukai, K., Fujinuma, Y., and Kawamura, K.: Diurnal variations and vertical gradients of biogenic volatile and semi-volatile organic compounds at the Tomakomai larch forest station in Japan, Tellus B, 58, 177, https://doi.org/10.1111/j.1600-0889.2006.00179.x, 2006. a
Jing, L., Steinberg, S. M., and Johnson, B. J.: Aldehyde and Monocyclic Aromatic Hydrocarbon Mixing Ratios at an Urban Site in Las Vegas, Nevada, J Air Waste Manag. Assoc., 51, 1359–1366, https://doi.org/10.1080/10473289.2001.10464352, 2001. a
Kaiser, J., Wolfe, G. M., Min, K. E., Brown, S. S., Miller, C. C., Jacob, D. J., deGouw, J. A., Graus, M., Hanisco, T. F., Holloway, J., Peischl, J., Pollack, I. B., Ryerson, T. B., Warneke, C., Washenfelder, R. A., and Keutsch, F. N.: Reassessing the ratio of glyoxal to formaldehyde as an indicator of hydrocarbon precursor speciation, Atmos. Chem. Phys., 15, 7571–7583, https://doi.org/10.5194/acp-15-7571-2015, 2015. a
Kleipool, Q. L., Dobber, M. R., de Haan, J. F., and Levelt, P. F.: Earth surface reflectance climatology from 3 years of OMI data, J. Geophys. Res.-Atmos., 113, D18308, https://doi.org/10.1029/2008JD010290, 2008. a
Kluge, F., Hüneke, T., Lerot, C., Rosanka, S., Rotermund, M. K., Taraborrelli, D., Weyland, B., and Pfeilsticker, K.: Airborne glyoxal measurements in the marine and continental atmosphere: comparison with TROPOMI observations and EMAC simulations, Atmos. Chem. Phys., 23, 1369–1401, https://doi.org/10.5194/acp-23-1369-2023, 2023. a, b, c
Kumar, P., Khare, M., Harrison, R. M., Bloss, W. J., Lewis, A. C., Coe, H., and Morawska, L.: New directions: Air pollution challenges for developing megacities like Delhi, Atmos. Environ., 122, 657–661, https://doi.org/10.1016/j.atmosenv.2015.10.032, 2015. a
Lambert, J.-C., Keppens, A., Compernolle, S., Eichmann, K.-U., de Graaf, M., Hubert, D., Langerock, B., Ludewig, A., Sha, M. K., Verhoelst, T., Wagner, T., Ahn, C., Argyrouli, A., Balis, D., Chan, K. L., Coldewey-Egbers, M., De Smedt, I., Eskes, H., Fjæraa, A. M., Garane, K., Gleason, J. F., Goutail, F., Granville, J., Hedelt, P., Ahn, C., Heue, K.-P., Jaross, G., Kleipool, Q., Koukouli, ML., Lutz, R., Martinez Velarte, M. C., Michailidis, K., Nanda, S., Niemeijer, S., Pazmiño, A., Pinardi, G., Richter, A., Rozemeijer, N., Sneep, M., Stein Zweers, D., Theys, N., Tilstra, G., Torres, O., Valks, P., van Geffen, J., Vigouroux, C., Wang, P., and Weber, M.: Quarterly Validation Report of the Copernicus Sentinel-5 Precursor Operational Data Products #21: April 2018 – November 2023, S5P MPC Routine Operations Consolidated Validation Report series, S5P MPC Routine Operations Consolidated Validation Report series, Issue #21, Version 21.01.00, 194 pp., 18 December 2023, 2023. a
Lan, Q., Zhang, L., Li, G., Vermeulen, R., Weinberg, R. S., Dosemeci, M., Rappaport, S. M., Shen, M., Alter, B. P., Wu, Y., Kopp, W., Waidyanatha, S., Rabkin, C., Guo, W., Chanock, S., Hayes, R. B., Linet, M., Kim, S., Yin, S., Rothman, N., and Smith, M. T.: Hematotoxicity in Workers Exposed to Low Levels of Benzene, Science, 306, 1774–1776, https://doi.org/10.1126/science.1102443, 2004. a
Lan, R., Eastham, S. D., Liu, T., Norford, L. K., and Barrett, S. R. H.: Air quality impacts of crop residue burning in India and mitigation alternatives, Nat. Commun., 13, 6537, https://doi.org/10.1038/s41467-022-34093-z, 2022. a
Lan, X., Tans, P., and Thoning, K. W.: Trends in globally-averaged CO2 determined from NOAA Global Monitoring Laboratory measurements, Version 2023-11, NOAA GML, https://doi.org/10.15138/9N0H-ZH07, 2023. a
Lawson, S. J., Selleck, P. W., Galbally, I. E., Keywood, M. D., Harvey, M. J., Lerot, C., Helmig, D., and Ristovski, Z.: Seasonal in situ observations of glyoxal and methylglyoxal over the temperate oceans of the Southern Hemisphere, Atmos. Chem. Phys., 15, 223–240, https://doi.org/10.5194/acp-15-223-2015, 2015. a
Lee, Y., Zhou, X., and Hallock, K.: Atmospheric carbonyl compounds at a rural southeastern United States site, J. Geophys. Res.-Atmos., 100, 25933–25944, https://doi.org/10.1029/95JD02605, 1995. a
Lerot, C. and Danckaert, T.: TROPOMI glyoxal tropospheric columns (Version V4), Royal Belgian Institute for Space Aeronomy [data set], https://doi.org/10.18758/71021069, 2021. a
Lerot, C., Stavrakou, T., De Smedt, I., Müller, J.-F., and Van Roozendael, M.: Glyoxal vertical columns from GOME-2 backscattered light measurements and comparisons with a global model, Atmos. Chem. Phys., 10, 12059–12072, https://doi.org/10.5194/acp-10-12059-2010, 2010. a
Lerot, C., Hendrick, F., Van Roozendael, M., Alvarado, L. M. A., Richter, A., De Smedt, I., Theys, N., Vlietinck, J., Yu, H., Van Gent, J., Stavrakou, T., Müller, J.-F., Valks, P., Loyola, D., Irie, H., Kumar, V., Wagner, T., Schreier, S. F., Sinha, V., Wang, T., Wang, P., and Retscher, C.: Glyoxal tropospheric column retrievals from TROPOMI – multi-satellite intercomparison and ground-based validation, Atmos. Meas. Tech., 14, 7775–7807, https://doi.org/10.5194/amt-14-7775-2021, 2021. a, b, c, d, e, f, g, h, i
Lerot, C., Müller, J.-F., Theys, N., De Smedt, I., Stavrakou, T., and Van Roozendael, M.: Satellite Evidence for Glyoxal Depletion in Elevated Fire Plumes, Geophys. Res. Lett., 50, e2022GL102195, https://doi.org/10.1029/2022GL102195, 2023. a
Li, J., Mao, J., Min, K.-E., Washenfelder, R. A., Brown, S. S., Kaiser, J., Keutsch, F. N., Volkamer, R., Wolfe, G. M., Hanisco, T. F., Pollack, I. B., Ryerson, T. B., Graus, M., Gilman, J. B., Lerner, B. M., Warneke, C., de Gouw, J. A., Middlebrook, A. M., Liao, J., Welti, A., Henderson, B. H., McNeill, V. F., Hall, S. R., Ullmann, K., Donner, L. J., Paulot, F., and Horowitz, L. W.: Observational constraints on glyoxal production from isoprene oxidation and its contribution to organic aerosol over the Southeast United States, J. Geophys. Res.-Atmos., 121, 9849–9861, https://doi.org/10.1002/2016JD025331, 2016. a
Li, J., Zhang, M., Tang, G., Wu, F., Alvarado, L. M. A., Vrekoussis, M., Richter, A., and Burrows, J. P.: Investigating missing sources of glyoxal over China using a regional air quality model (RAMS-CMAQ), J. Environ. Sci., 71, 108–118, https://doi.org/10.1016/j.jes.2018.04.021, 2018. a
Li, J., Hao, Y., Simayi, M., Shi, Y., Xi, Z., and Xie, S.: Verification of anthropogenic VOC emission inventory through ambient measurements and satellite retrievals, Atmos. Chem. Phys., 19, 5905–5921, https://doi.org/10.5194/acp-19-5905-2019, 2019. a, b, c
Liggio, J., Li, S.-M., and McLaren, R.: Reactive uptake of glyoxal by particulate matter, J. Geophys. Res.-Atmos., 110, 1–13, https://doi.org/10.1029/2004JD005113, 2005. a
Liu, J., Li, X., Li, D., Xu, R., Gao, Y., Chen, S., Liu, Y., Zhao, G., Wang, H., Wang, H., Lou, S., Chen, M., Hu, J., Lu, K., Wu, Z., Hu, M., Zeng, L., and Zhang, Y.: Observations of glyoxal and methylglyoxal in a suburban area of the Yangtze River Delta, China, Atmos. Environ., 238, 117727, https://doi.org/10.1016/j.atmosenv.2020.117727, 2020a. a, b, c
Liu, M., Song, Y., Yao, H., Kang, Y., Li, M., Huang, X., and Hu, M.: Estimating emissions from agricultural fires in the North China Plain based on MODIS fire radiative power, Atmos. Environ., 112, 326–334, https://doi.org/10.1016/j.atmosenv.2015.04.058, 2015. a
Liu, T., Mickley, L. J., Singh, S., Jain, M., DeFries R. S., and Marlier, M. E.: Crop residue burning practices across north India inferred from household survey data: Bridging gaps in satellite observations, Atmos. Environ., 8, 100091, https://doi.org/10.1016/j.aeaoa.2020.100091, 2020b. a
Liu, W., Zhang, J., Kwon, J., Weisel, C., Turpin, B., Zhang, L., Korn, L., Morandi, M., Stock, T., and Colome, S.: Concentrations and Source Characteristics of Airborne Carbonyl Compounds Measured Outside Urban Residences, J. Air Waste Manag. Assoc., 56, 1196–1204, https://doi.org/10.1080/10473289.2006.10464539, 2006. a
Liu, Z., Wang, Y., Vrekoussis, M., Richter, A., Wittrock, F., Burrows, J. P., Shao, M., Chang, C., Liu, S., Wang, H., and Chen, C.: Exploring the missing source of glyoxal (CHOCHO) over China, Geophys. Res. Lett., 39, 2012GL051645, https://doi.org/10.1029/2012GL051645, 2012. a, b, c, d, e
Lv, Q., Yang, Z., Chen, Z., Li, M., Gao, B., Yang, J., Chen, X., and Xu, B.: Crop residue burning in China (2019–2021): Spatiotemporal patterns, environmental impact, and emission dynamics, Environ. Sci. Ecotech., 21, 100394, https://doi.org/10.1016/j.ese.2024.100394, 2024. a
MacDonald, S. M., Oetjen, H., Mahajan, A. S., Whalley, L. K., Edwards, P. M., Heard, D. E., Jones, C. E., and Plane, J. M. C.: DOAS measurements of formaldehyde and glyoxal above a south-east Asian tropical rainforest, Atmos. Chem. Phys., 12, 5949–5962, https://doi.org/10.5194/acp-12-5949-2012, 2012. a
Madronich, S. and Flocke, S.: The Role of Solar Radiation in Atmospheric Chemistry, in: Environmental Photochemistry. The Handbook of Environmental Chemistrym edited by: Boule, P., Vol. 2/2L, Springer, Berlin, Heidelberg, https://doi.org/10.1007/978-3-540-69044-3_1, 1999. a
Matsunaga, S., Mochida, M., and Kawamura, K.: Variation on the atmospheric concentrations of biogenic carbonyl compounds and their removal processes in the northern forest at Moshiri, Hokkaido Island in Japan, J. Geophys. Res.-Atmos., 109, 2003JD004100, https://doi.org/10.1029/2003JD004100, 2004. a
McCarty, J. L., Krylov, A., Prishchepov, A. V., Banach, D. M., Tyukavina, A., Potapov, P., and Turubanova, S.: Agricultural Fires in European Russia, Belarus, and Lithuania and Their Impact on Air Quality, 2002–2012, in: Land-Cover and Land-Use Changes in Eastern Europe after the Collapse of the Soviet Union in 1991, edited by: Gutman, G. and Radeloff, V., Springer, Cham. https://doi.org/10.1007/978-3-319-42638-9_9, 2017. a
Medeiros, D. J., Blitz, M. A., Seakins, P. W., and Whalley, L. K.: Direct measurements of isoprene autoxidation: Pinpointing atmospheric oxidation in tropical forests, JACS Au, 2, 809–818, https://doi.org/10.1021/jacsau.1c00525, 2022. a
Meller, R. and Moortgat, G. K.: Temperature dependence of the absorption cross-sections of formaldehyde between 223 and 323 K in the wavelength range 225–375 nm, J. Geophys. Res.-Atmos., 105, 7089–7101, https://doi.org/10.1029/1999JD901074, 2000. a
Millet, D. B., Baasandorj, M., Farmer, D. K., Thornton, J. A., Baumann, K., Brophy, P., Chaliyakunnel, S., de Gouw, J. A., Graus, M., Hu, L., Koss, A., Lee, B. H., Lopez-Hilfiker, F. D., Neuman, J. A., Paulot, F., Peischl, J., Pollack, I. B., Ryerson, T. B., Warneke, C., Williams, B. J., and Xu, J.: A large and ubiquitous source of atmospheric formic acid, Atmos. Chem. Phys., 15, 6283–6304, https://doi.org/10.5194/acp-15-6283-2015, 2015. a
Min, K.-E., Washenfelder, R. A., Dubé, W. P., Langford, A. O., Edwards, P. M., Zarzana, K. J., Stutz, J., Lu, K., Rohrer, F., Zhang, Y., and Brown, S. S.: A broadband cavity enhanced absorption spectrometer for aircraft measurements of glyoxal, methylglyoxal, nitrous acid, nitrogen dioxide, and water vapor, Atmos. Meas. Tech., 9, 423–440, https://doi.org/10.5194/amt-9-423-2016, 2016. a
Monks, P. S., Archibald, A. T., Colette, A., Cooper, O., Coyle, M., Derwent, R., Fowler, D., Granier, C., Law, K. S., Mills, G. E., Stevenson, D. S., Tarasova, O., Thouret, V., von Schneidemesser, E., Sommariva, R., Wild, O., and Williams, M. L.: Tropospheric ozone and its precursors from the urban to the global scale from air quality to short-lived climate forcer, Atmos. Chem. Phys., 15, 8889–8973, https://doi.org/10.5194/acp-15-8889-2015, 2015. a
Moortgat, G. K., Grossmann, D., Boddenberg, A., Dallmann, G., Ligon, A. P., Turner, W. V., Gäb, S., Slemr, F., Wieprecht, W., Acker, K., Kibler, M., Schlomski, S., and Bächmann, K.: Hydrogen Peroxide, Organic Peroxides and Higher Carbonyl Compounds Determined during the BERLIOZ Campaign, J. Atmos. Chem., 42, 443–463, https://doi.org/10.1023/A:1015743013107, 2002. a
Mukim, M.: Coagglomeration of formal and informal industry: evidence from India, J. Econ. Geogr., 15, 329–351, https://doi.org/10.1093/jeg/lbu020, 2015. a
Müller, J.-F., and Brasseur, G.: IMAGES: A three-dimensional chemical transport model of the global troposphere, J. Geophys. Res.-Atmos., 100, 16,445–16,490, https://doi.org/10.1029/94JD03254, 1995. a
Müller, J.-F. and Stavrakou, T.: Inversion of CO and NOx emissions using the adjoint of the IMAGES model, Atmos. Chem. Phys., 5, 1157–1186, https://doi.org/10.5194/acp-5-1157-2005, 2005. a
Müller, J.-F., Stavrakou, T., Wallens, S., De Smedt, I., Van Roozendael, M., Potosnak, M. J., Rinne, J., Munger, B., Goldstein, A., and Guenther, A. B.: Global isoprene emissions estimated using MEGAN, ECMWF analyses and a detailed canopy environment model, Atmos. Chem. Phys., 8, 1329–1341, https://doi.org/10.5194/acp-8-1329-2008, 2008. a
Müller, J.-F., Stavrakou, T., and Peeters, J.: Chemistry and deposition in the Model of Atmospheric composition at Global and Regional scales using Inversion Techniques for Trace gas Emissions (MAGRITTE v1.1) – Part 1: Chemical mechanism, Geosci. Model Dev., 12, 2307–2356, https://doi.org/10.5194/gmd-12-2307-2019, 2019. a, b, c, d
Müller, J.-F., Stavrakou, T., Oomen, G.-M., Opacka, B., De Smedt, I., Guenther, A., Vigouroux, C., Langerock, B., Aquino, C. A. B., Grutter, M., Hannigan, J., Hase, F., Kivi, R., Lutsch, E., Mahieu, E., Makarova, M., Metzger, J.-M., Morino, I., Murata, I., Nagahama, T., Notholt, J., Ortega, I., Palm, M., Röhling, A., Stremme, W., Strong, K., Sussmann, R., Té, Y., and Fried, A.: Bias correction of OMI HCHO columns based on FTIR and aircraft measurements and impact on top-down emission estimates, Atmos. Chem. Phys., 24, 2207–2237, https://doi.org/10.5194/acp-24-2207-2024, 2024. a, b, c, d, e, f, g, h, i, j, k
Müller, K., van Pinxteren, D., Plewka, A., Svrcina, B., Kramberger, H., Hofmann, D., Bächmann, K., and Herrmann, H.: Aerosol characterisation at the FEBUKO upwind station Goldlauter (II): Detailed organic chemical characterisation, Atmos. Environ., 39, 4219–4231, https://doi.org/10.1016/j.atmosenv.2005.02.008, 2005. a
Munger, J. W., Jacob, D. J., Daube, B. C., Horowitz, L. W., Keene, W. C., and Heikes, B. G.: Formaldehyde, glyoxal, and methylglyoxal in air and cloudwater at a rural mountain site in central Virginia, J. Geophys. Res.-Atmos., 100, 9325–9333, https://doi.org/10.1029/95JD00508, 1995. a
Myriokefalitakis, S., Vrekoussis, M., Tsigaridis, K., Wittrock, F., Richter, A., Brühl, C., Volkamer, R., Burrows, J. P., and Kanakidou, M.: The influence of natural and anthropogenic secondary sources on the glyoxal global distribution, Atmos. Chem. Phys., 8, 4965–4981, https://doi.org/10.5194/acp-8-4965-2008, 2008. a
Nault, B. A., Jo, D. S., McDonald, B. C., Campuzano-Jost, P., Day, D. A., Hu, W., Schroder, J. C., Allan, J., Blake, D. R., Canagaratna, M. R., Coe, H., Coggon, M. M., DeCarlo, P. F., Diskin, G. S., Dunmore, R., Flocke, F., Fried, A., Gilman, J. B., Gkatzelis, G., Hamilton, J. F., Hanisco, T. F., Hayes, P. L., Henze, D. K., Hodzic, A., Hopkins, J., Hu, M., Huey, L. G., Jobson, B. T., Kuster, W. C., Lewis, A., Li, M., Liao, J., Nawaz, M. O., Pollack, I. B., Peischl, J., Rappenglück, B., Reeves, C. E., Richter, D., Roberts, J. M., Ryerson, T. B., Shao, M., Sommers, J. M., Walega, J., Warneke, C., Weibring, P., Wolfe, G. M., Young, D. E., Yuan, B., Zhang, Q., de Gouw, J. A., and Jimenez, J. L.: Secondary organic aerosols from anthropogenic volatile organic compounds contribute substantially to air pollution mortality, Atmos. Chem. Phys., 21, 11201–11224, https://doi.org/10.5194/acp-21-11201-2021, 2021. a
Ning, X.-A., Wang, J.-Y., Li, R.-J., Wen, W.-B., Chen, C.-M., Wang, Y.-J., Yang, Z.-Y., and Liu, J.-Y.: Fate of volatile aromatic hydrocarbons in the wastewater from six textile dyeing wastewater treatment plants, Chemosphere, 136, 50–55, https://doi.org/10.1016/j.chemosphere.2015.03.086, 2015. a
Oomen, G.-M., Müller, J.-F., Stavrakou, T., De Smedt, I., Blumenstock, T., Kivi, R., Makarova, M., Palm, M., Röhling, A., Té, Y., Vigouroux, C., Friedrich, M. M., Frieß, U., Hendrick, F., Merlaud, A., Piters, A., Richter, A., Van Roozendael, M., and Wagner, T.: Weekly derived top-down volatile-organic-compound fluxes over Europe from TROPOMI HCHO data from 2018 to 2021, Atmos. Chem. Phys., 24, 449–474, https://doi.org/10.5194/acp-24-449-2024, 2024. a, b, c, d
Opacka, B., Müller, J.-F., Stavrakou, T., Miralles, D. G., Koppa, A., Pagán, B. R., Potosnak, M. J., Seco, R., De Smedt, I., and Guenther, A. B.: Impact of Drought on Isoprene Fluxes Assessed Using Field Data, Satellite-Based GLEAM Soil Moisture and HCHO Observations from OMI, Remote Sens., 14, 2021, https://doi.org/10.3390/rs14092021, 2022. a
Opacka, B., Stavrakou, T., Müller, J.-F., De Smedt, I., van Geffen, J., Marais, E. A., Horner, R. P., Millet, D. B., Wells, K. C., and Guenther, A. B.: Natural emissions of VOC and NOx over Africa constrained by TROPOMI HCHO and NO2 data using the MAGRITTEv1.1 model, Atmos. Chem. Phys., 25, 2863–2894, https://doi.org/10.5194/acp-25-2863-2025, 2025. a
Osipov, S., Chowdhury, S., Crowley, J. N., Tadic, I., Drewnick, F., Borrmann, S., Eger, P., Fachinger, F., Fischer, H., Predybaylo, E., Fnais, M., Harder, H., Pikridas, M., Vouterakos, P., Pozzer, A., Sciare, J., Ukhov, A., Stenchikov, G. L., Williams, J., and Lelieveld, J.: Severe atmospheric pollution in the Middle East is attributable to anthropogenic sources, Commun. Earth Environ., 3, 203, https://doi.org/10.1038/s43247-022-00514-6, 2022. a
Palmer, P. I., Jacob, D. J., Fiore, A. M., Martin, R. V., Chance, K., and Kurosu, T. P.: Mapping isoprene emissions over North America using formaldehyde column observations from space, J. Geophys. Res.-Atmos., 108, 4180, https://doi.org/10.1029/2002JD002153, 2003. a
Partha, D. B., Cassidy-Bushrow, A. E., and Huang, Y.: Global preterm births attributable to BTEX (benzene, toluene, ethylbenzene, and xylene) exposure, Sci. Total Environ., 838, 156390, https://doi.org/10.1016/j.scitotenv.2022.156390, 2022. a, b
PGN (Pandonia Global Network): 2021 L2_geoms Pandonia data archive, http://data.pandonia-global-network.org/ (last access: 25 August 2023), 2021. a, b
Ponomarev, E. I., Zabrodin, A. N., Shvetsov, E. G., and Ponomareva, T. V.: Wildfire Intensity and Fire Emissions in Siberia, Fire, 6, 246, https://doi.org/10.3390/fire6070246, 2023. a
Possanzini, M., Tagliacozzo, G., and Cecinato, A.: Ambient Levels and Sources of Lower Carbonyls at Montelibretti, Rome (Italy), Water Air Soil Pollut., 183, 447–454, https://doi.org/10.1007/s11270-007-9393-1, 2007. a, b
Possell, M. and Hewitt, C. N.: Isoprene emissions from plants are mediated by atmospheric CO2 concentrations, Glob. Change Biol., 17, 1595–1610, https://doi.org/10.1111/j.1365-2486.2010.02306.x, 2011. a
Pu, D., Zhu, L., Shen, H., De Smedt, I., Ye, J., Li, J., Shu, L., Wang, D., Li, X., Zuo, X., Yang, X., and Fu, T.-M.: Integrated satellite observations unravel the relationship between urbanization and anthropogenic non-methane volatile organic compound emissions globally, npj Clim. Atmos. Sci., 7, https://doi.org/10.1038/s41612-024-00683-5, 2024. a
Qian, X., Shen, H., and Chen, Z.: Characterizing summer and winter carbonyl compounds in Beijing atmosphere, Atmos. Environ., 214, 116845, https://doi.org/10.1016/j.atmosenv.2019.116845, 2019. a, b
Qiu, X., Wang, S., Ying, Q., Duan, L., Xing, J., Cao, J., Wu, D., Li, X., Chengzhi, X., Yan, X., Liu, C., and Hao, J.: Importance of Wintertime Anthropogenic Glyoxal and Methylglyoxal Emissions in Beijing and Implications for Secondary Organic Aerosol Formation in Megacities, Environ. Sci. Technol., 54, 11809–11817, https://doi.org/10.1021/acs.est.0c02822, 2020. a
Rao, Z., Chen, Z., Liang, H., Huang, L., and Huang, D.: Carbonyl compounds over urban Beijing: Concentrations on haze and non-haze days and effects on radical chemistry, Atmos. Environ., 124, 207–216, https://doi.org/10.1016/j.atmosenv.2015.06.050, 2016. a
Razavi, A., Karagulian, F., Clarisse, L., Hurtmans, D., Coheur, P. F., Clerbaux, C., Müller, J. F., and Stavrakou, T.: Global distributions of methanol and formic acid retrieved for the first time from the IASI/MetOp thermal infrared sounder, Atmos. Chem. Phys., 11, 857–872, https://doi.org/10.5194/acp-11-857-2011, 2011. a, b
Romanias, M. N., Coggon, M. M., Fatima, A. A., Burkholder, J. B., Dagaut, P., Decker, Z., Warneke, C., Stockwell, C. E., Roberts, J. M., Tomas, A., Houzel, N., Coeur, C., and Brown, S. S.: Emissions and Atmospheric Chemistry of Furanoids from Biomass Burning: Insights from Laboratory to Atmospheric Observations, ACS Earth Space Chem., 8, 857–899, https://doi.org/10.1021/acsearthspacechem.3c00226, 2024. a, b, c
Sfendla, Y., Stavrakou, T., Müller, J.-F., and Opacka, B.: 2021 Global top-down VOC emissions based on TROPOMI formaldehyde and glyoxal data (Version 1), Royal Belgian Institute for Space Aeronomy [data set], https://doi.org/10.18758/52E4U9EN, 2025. a
Shen, H., Chen, Z., Li, H., Qian, X., Qin, X., and Shi, W.: Gas-Particle Partitioning of Carbonyl Compounds in the Ambient Atmosphere, Environ. Sci. Technol., 52, 10997–11006, https://doi.org/10.1021/acs.est.8b01882, 2018. a
Silva, S. J., Heald, C. L., and Li, M.: Space-based constraints on terrestrial glyoxal production. J. Geophys. Res.-Atmos., 123, 13583–13594, https://doi.org/10.1029/2018JD029311, 2018. a, b, c, d, e, f, g, h
Simayi, M., Shi, Y., Xi, Z., Ren, J., Hini, G., and Xie, S.: Emission trends of industrial VOCs in China since the clean air action and future reduction perspectives, Sci. Total Environ., 826, 153994, https://doi.org/10.1016/j.scitotenv.2022.153994, 2022. a
Sinreich, R., Volkamer, R., Filsinger, F., Frieß, U., Kern, C., Platt, U., Sebastián, O., and Wagner, T.: MAX-DOAS detection of glyoxal during ICARTT 2004, Atmos. Chem. Phys., 7, 1293–1303, https://doi.org/10.5194/acp-7-1293-2007, 2007. a, b
Spaulding, R. S., Schade, G. W., Goldstein, A. H., and Charles, M. J.: Characterization of secondary atmospheric photooxidation products: Evidence for biogenic and anthropogenic sources, J. Geophys. Res.-Atmos., 108, 2002JD002478, https://doi.org/10.1029/2002JD002478, 2003. a
Spracklen, D. V., Jimenez, J. L., Carslaw, K. S., Worsnop, D. R., Evans, M. J., Mann, G. W., Zhang, Q., Canagaratna, M. R., Allan, J., Coe, H., McFiggans, G., Rap, A., and Forster, P.: Aerosol mass spectrometer constraint on the global secondary organic aerosol budget, Atmos. Chem. Phys., 11, 12109–12136, https://doi.org/10.5194/acp-11-12109-2011, 2011. a
Spurr, R. J. D.: LIDORT and VLIDORT: Linearized pseudo-spherical scalar and vector discrete ordinate radiative transfer models for use in remote sensing retrieval problems, in: Light Scattering Reviews, edited by: Kokhanovsky, A., Springer, Berlin, Heidelberg, 229–271, https://doi.org/10.1007/978-3-540-48546-9, 2008. a
Stavrakou, T., Müller, J.-F., De Smedt, I., Van Roozendael, M., van der Werf, G. R., Giglio, L., and Guenther, A.: Evaluating the performance of pyrogenic and biogenic emission inventories against one decade of space-based formaldehyde columns, Atmos. Chem. Phys., 9, 1037–1060, https://doi.org/10.5194/acp-9-1037-2009, 2009a. a, b, c
Stavrakou, T., Müller, J.-F., De Smedt, I., Van Roozendael, M., van der Werf, G. R., Giglio, L., and Guenther, A.: Global emissions of non-methane hydrocarbons deduced from SCIAMACHY formaldehyde columns through 2003–2006, Atmos. Chem. Phys., 9, 3663–3679, https://doi.org/10.5194/acp-9-3663-2009, 2009b. a
Stavrakou, T., Müller, J.-F., De Smedt, I., Van Roozendael, M., Kanakidou, M., Vrekoussis, M., Wittrock, F., Richter, A., and Burrows, J. P.: The continental source of glyoxal estimated by the synergistic use of spaceborne measurements and inverse modelling, Atmos. Chem. Phys., 9, 8431–8446, https://doi.org/10.5194/acp-9-8431-2009, 2009c. a, b, c, d, e, f, g, h, i, j, k, l, m, n, o
Stavrakou, T., Guenther, A., Razavi, A., Clarisse, L., Clerbaux, C., Coheur, P.-F., Hurtmans, D., Karagulian, F., De Mazière, M., Vigouroux, C., Amelynck, C., Schoon, N., Laffineur, Q., Heinesch, B., Aubinet, M., Rinsland, C., and Müller, J.-F.: First space-based derivation of the global atmospheric methanol emission fluxes, Atmos. Chem. Phys., 11, 4873–4898, https://doi.org/10.5194/acp-11-4873-2011, 2011. a
Stavrakou, T., Müller, J-F., Peeters, J., Razavi, A., Clarisse, L., Clerbaux, C., Coheur, P-F., Hurtmans, D., De Mazière, M., Vigouroux, C., Deutscher, N. M., Griffith, D. W. T., Jones, N., and Paton-Walsh, C.: Satellite evidence for a large source of formic acid from boreal and tropical forests, Nat. Geosci., 5, 26–30, https://doi.org/10.1038/ngeo1354, 2012. a
Stavrakou, T., Müller, J.-F., Bauwens, M., De Smedt, I., Lerot, C., Van Roozendael, M., Coheur, P.-F., Clerbaux, C., Boersma, K. F., van der A, R., and Song, Y.: Substantial Underestimation of Post-Harvest Burning Emissions in the North China Plain Revealed by Multi-Species Space Observations, Sci. Rep., 6, 32307, https://doi.org/10.1038/srep32307, 2016. a
Stavrakou, T., Müller, J.-F., Bauwens, M., De Smedt, I., Van Roozendael, M., and Guenther, A.: Impact of climate variability on volatile organic compounds emissions assessed using OMI formaldehyde observations, Geophys. Res. Lett., 45, 8681–8689, https://doi.org/10.1029/2018GL078676, 2018. a, b, c
Stewart, G. J., Nelson, B. S., Drysdale, W. S., Acton, W. J. F., Vaughan, A. R., Hopkins, J. R., Dunmore, R. E., Hewitt, C. N., Nemitz, E., Mullinger, N., Langford, B., Shivani, Reyes-Villegas, E., Gadi, R., Rickard, A. R., Lee, J. D., and Hamilton, J. F.: Sources of non-methane hydrocarbons in surface air in Delhi, India, Faraday Discuss., 226, 409–431, https://doi.org/10.1039/D0FD00087F, 2021. a, b
Thayer, M., Keutsch, F. N., and Dorris, M. R. Field campaign data: Ambient HCHO and CHOCHO, https://www.arm.gov/research/campaigns/amf2014goamazon (last access: August 2025), 2015. a
Thomas, W., Hegels, E., Slijkhuis, S., Spurr, R., and Chance, K.: Detection of biomass burning combustion products in Southeast Asia from backscatter data taken by the GOME Spectrometer, Geophys. Res. Lett., 25, 1317–1320, https://doi.org/10.1029/98GL01087, 1998. a
Veefkind, J. P., Aben, I., McMullan, K., Förster, H., de Vries, J., Otter, G., Claas, J., Eskes, H. J., de Haan, J. F., Kleipool, Q., van Weele, M., Hasekamp, O., Hoogeveen, R., Landgraf, J., Snel, R., Tol, P., Ingmann, P., Voors, R., Kruizinga, B., Vink, R., Visser, H., and Levelt, P. F.: TROPOMI on the ESA Sentinel-5 Precursor: A GMES mission for global observations of the atmospheric composition for climate, air quality and ozone layer applications, Remote Sens. Environ., 120, 70–83, https://doi.org/10.1016/j.rse.2011.09.027, 2012. a
Venkataraman, C., Brauer, M., Tibrewal, K., Sadavarte, P., Ma, Q., Cohen, A., Chaliyakunnel, S., Frostad, J., Klimont, Z., Martin, R. V., Millet, D. B., Philip, S., Walker, K., and Wang, S.: Source influence on emission pathways and ambient PM2.5 pollution over India (2015–2050), Atmos. Chem. Phys., 18, 8017–8039, https://doi.org/10.5194/acp-18-8017-2018, 2018. a
Verhoelst, T., Compernolle, S., Pinardi, G., Lambert, J.-C., Eskes, H. J., Eichmann, K.-U., Fjæraa, A. M., Granville, J., Niemeijer, S., Cede, A., Tiefengraber, M., Hendrick, F., Pazmiño, A., Bais, A., Bazureau, A., Boersma, K. F., Bognar, K., Dehn, A., Donner, S., Elokhov, A., Gebetsberger, M., Goutail, F., Grutter de la Mora, M., Gruzdev, A., Gratsea, M., Hansen, G. H., Irie, H., Jepsen, N., Kanaya, Y., Karagkiozidis, D., Kivi, R., Kreher, K., Levelt, P. F., Liu, C., Müller, M., Navarro Comas, M., Piters, A. J. M., Pommereau, J.-P., Portafaix, T., Prados-Roman, C., Puentedura, O., Querel, R., Remmers, J., Richter, A., Rimmer, J., Rivera Cárdenas, C., Saavedra de Miguel, L., Sinyakov, V. P., Stremme, W., Strong, K., Van Roozendael, M., Veefkind, J. P., Wagner, T., Wittrock, F., Yela González, M., and Zehner, C.: Ground-based validation of the Copernicus Sentinel-5P TROPOMI NO2 measurements with the NDACC ZSL-DOAS, MAX-DOAS and Pandonia global networks, Atmos. Meas. Tech., 14, 481–510, https://doi.org/10.5194/amt-14-481-2021, 2021. a
Vigouroux, C., Bauer Aquino, C. A., Bauwens, M., Becker, C., Blumenstock, T., De Mazière, M., García, O., Grutter, M., Guarin, C., Hannigan, J., Hase, F., Jones, N., Kivi, R., Koshelev, D., Langerock, B., Lutsch, E., Makarova, M., Metzger, J.-M., Müller, J.-F., Notholt, J., Ortega, I., Palm, M., Paton-Walsh, C., Poberovskii, A., Rettinger, M., Robinson, J., Smale, D., Stavrakou, T., Stremme, W., Strong, K., Sussmann, R., Té, Y., and Toon, G.: NDACC harmonized formaldehyde time series from 21 FTIR stations covering a wide range of column abundances, Atmos. Meas. Tech., 11, 5049–5073, https://doi.org/10.5194/amt-11-5049-2018, 2018. a
Vigouroux, C., Langerock, B., Bauer Aquino, C. A., Blumenstock, T., Cheng, Z., De Mazière, M., De Smedt, I., Grutter, M., Hannigan, J. W., Jones, N., Kivi, R., Loyola, D., Lutsch, E., Mahieu, E., Makarova, M., Metzger, J.-M., Morino, I., Murata, I., Nagahama, T., Notholt, J., Ortega, I., Palm, M., Pinardi, G., Röhling, A., Smale, D., Stremme, W., Strong, K., Sussmann, R., Té, Y., van Roozendael, M., Wang, P., and Winkler, H.: TROPOMI–Sentinel-5 Precursor formaldehyde validation using an extensive network of ground-based Fourier-transform infrared stations, Atmos. Meas. Tech., 13, 3751–3767, https://doi.org/10.5194/amt-13-3751-2020, 2020. a, b
Volkamer, R., Molina, L. T., Molina, M. J., Shirley, T., and Brune, W. H.: DOAS measurement of glyoxal as an indicator for fast VOC chemistry in urban air, Geophys. Res. Lett., 32, 2005GL022616, https://doi.org/10.1029/2005GL022616, 2005. a, b
Volkamer, R., San Martini, F., Salcedo, D., Molina, L. T., Jimenez, J. L., and Molina, M. J.: A Missing Sink for Gas-Phase Glyoxal in Mexico City: Formation of Secondary Organic Aerosol, Geophys. Res. Lett., 34, L19807, https://doi.org/10.1029/2007GL030752, 2007. a
Volkamer, R., Baidar, S., Campos, T. L., Coburn, S., DiGangi, J. P., Dix, B., Eloranta, E. W., Koenig, T. K., Morley, B., Ortega, I., Pierce, B. R., Reeves, M., Sinreich, R., Wang, S., Zondlo, M. A., and Romashkin, P. A.: Aircraft measurements of BrO, IO, glyoxal, NO2, H2O, O2–O2 and aerosol extinction profiles in the tropics: comparison with aircraft-/ship-based in situ and lidar measurements, Atmos. Meas. Tech., 8, 2121–2148, https://doi.org/10.5194/amt-8-2121-2015, 2015. a
Wang, H., Yan, R., Xu, T., Wang, Y., Wang, Q., Zhang, T., An, J., Huang, C., Gao, Y., Gao, Y., Li, X., Yu, C., Jing, S., Qiao, L., Lou, S., Tao, S., and Li, Y.: Observation Constrained Aromatic Emissions in Shanghai, China, J. Geophys. Res.-Atmos., 125, e2019JD031815, https://doi.org/10.1029/2019JD031815, 2020. a, b
Wang, T., Huang, R.-J., Yang, L., Dai, W., Ni, H., Gong, Y., Guo, J., Zhong, H., Lin, C., and Xu, W.: Direct emissions of particulate glyoxal and methylglyoxal from biomass burning and coal combustion, Sci. Total Environ., 862, 160757, https://doi.org/10.1016/j.scitotenv.2022.160757, 2023. a
Washenfelder, R. A., Young, C. J., Brown, S. S., Angevine, W. M., Atlas, E. L., Blake, D. R., Bon, D. M., Cubison, M. J., De Gouw, J. A., Dusanter, S., Flynn, J., Gilman, J. B., Graus, M., Griffith, S., Grossberg, N., Hayes, P. L., Jimenez, J. L., Kuster, W. C., Lefer, B. L., Pollack, I. B., Ryerson, T. B., Stark, H., Stevens, P. S., and Trainer, M. K.: The glyoxal budget and its contribution to organic aerosol for Los Angeles, California, during CalNex 2010: GLYOXAL BUDGET FOR LOS ANGELES, J. Geophys. Res.-Atmos., 116, https://doi.org/10.1029/2011JD016314, 2011. a
Wells, K. C., Millet, D. B., Cady-Pereira, K. E., Shephard, M. W., Henze, D. K., Bousserez, N., Apel, E. C., de Gouw, J., Warneke, C., and Singh, H. B.: Quantifying global terrestrial methanol emissions using observations from the TES satellite sensor, Atmos. Chem. Phys., 14, 2555–2570, https://doi.org/10.5194/acp-14-2555-2014, 2014. a
Wells, K. C., Millet, D. B., Payne, V. H., Deventer, M. J., Bates, K. H., De Gouw, J. A., Graus, M., Warneke, C., Wisthaler, A., and Fuentes, J. D.: Satellite isoprene retrievals constrain emissions and atmospheric oxidation, Nature, 585, 225–233, https://doi.org/10.1038/s41586-020-2664-3, 2020. a
Wells, K. C., Millet, D. B., Brewer, J. F., Payne, V. H., Cady-Pereira, K. E., Pernak, R., Kulawik, S., Vigouroux, C., Jones, N., Mahieu, E., Makarova, M., Nagahama, T., Ortega, I., Palm, M., Strong, K., Schneider, M., Smale, D., Sussmann, R., and Zhou, M.: Global decadal measurements of methanol, ethene, ethyne, and HCN from the Cross-track Infrared Sounder, Atmos. Meas. Tech., 18, 695–716, https://doi.org/10.5194/amt-18-695-2025, 2025. a, b
Williams, J. E., Boersma, K. F., Le Sager, P., and Verstraeten, W. W.: The high-resolution version of TM5-MP for optimized satellite retrievals: description and validation, Geosci. Model Dev., 10, 721–750, https://doi.org/10.5194/gmd-10-721-2017, 2017. a
Williams, R. T., Caspers-Brown, A., Sultana, C. M., Lee, C., Axson, J. L., Malfatti, F., Zhou, Y., Moore, K. A., Stevens, N., Santander, M. V., Azam, F., Prather, K. A., and Pomeroy, R. S.: Possible missing sources of atmospheric glyoxal Part I: Phospholipid oxidation from marine algae, Metabolites, 14, 639, https://doi.org/10.3390/metabo14110639 2024. a, b
Wittrock, F., Richter, A., Oetjen, H., Burrows, J. P., Kanakidou, M., Myriokefalitakis, S., Volkamer, R., Beirle, S., Platt, U., and Wagner, T.: Simultaneous global observations of glyoxal and formaldehyde from space, Geophys. Res. Lett., 33, L16804, https://doi.org/10.1029/2006GL026310, 2006. a
Xiao, C., Chang, M., Guo, P., Gu, M., and Li, Y.: Analysis of air quality characteristics of Beijing–Tianjin–Hebei and its surrounding air pollution transport channel cities in China, J. Environ. Sci., 87, 213–227, https://doi.org/10.1016/j.jes.2019.05.024, 2020. a
Yang, X., Xue, L., Wang, T., Wang, X., Gao, J., Lee, S., Blake, D. R., Chai, F., and Wang, W.: Observations and Explicit modeling of mummertime marbonyl mormation in Beijing: Identification of key precursor species and their impact on atmospheric oxidation chemistry, J. Geophys. Res.-Atmos., 123, 1426–1440, https://doi.org/10.1002/2017JD027403, 2018. a
Yuan, H., Dai, Y., Xiao, Z., Ji, D., and Shangguan, W.: Reprocessing the MODIS Leaf Area Index products for land surface and climate modelling, Remote Sens. Environ., 115, 1171–1187, https://doi.org/10.1016/j.rse.2011.01.001, 2011. a, b
Zarzana, K. J., Min, K.-E., Washenfelder, R. A., Kaiser, J., Krawiec-Thayer, M., Peischl, J., Neuman, J. A., Nowak, J. B., Wagner, N. L., Dubè, W. P., St. Clair, J. M., Wolfe, G. M., Hanisco, T. F., Keutsch, F. N., Ryerson, T. B., and Brown, S. S.: Emissions of Glyoxal and Other Carbonyl Compounds from Agricultural Biomass Burning Plumes Sampled by Aircraft, Environ. Sci. Technol., 51, 11761–11770, https://doi.org/10.1021/acs.est.7b03517, 2017. a
Zarzana, K. J., Selimovic, V., Koss, A. R., Sekimoto, K., Coggon, M. M., Yuan, B., Dubé, W. P., Yokelson, R. J., Warneke, C., de Gouw, J. A., Roberts, J. M., and Brown, S. S.: Primary emissions of glyoxal and methylglyoxal from laboratory measurements of open biomass burning, Atmos. Chem. Phys., 18, 15451–15470, https://doi.org/10.5194/acp-18-15451-2018, 2018. a
Zhang, Q., Streets, D. G., Carmichael, G. R., He, K. B., Huo, H., Kannari, A., Klimont, Z., Park, I. S., Reddy, S., Fu, J. S., Chen, D., Duan, L., Lei, Y., Wang, L. T., and Yao, Z. L.: Asian emissions in 2006 for the NASA INTEX-B mission, Atmos. Chem. Phys., 9, 5131–5153, https://doi.org/10.5194/acp-9-5131-2009, 2009. a
Zhu, A., Wang, Q., Liu, D., and Zhao, Y.: Analysis of the Characteristics of CH4 Emissions in China's Coal Mining Industry and Research on Emission Reduction Measures, Int. J. Environ. Res. Public Health, 19, 7408, https://doi.org/10.3390/ijerph19127408, 2022. a