the Creative Commons Attribution 4.0 License.
the Creative Commons Attribution 4.0 License.
 | 19 May 2026
Contrasting organic aerosol molecular composition between the urban and agricultural environment of the Po Valley
Florian Ungeheuer
Jialiang Ma
Luca Ferrero
Cristina Colombi
Eleonora Cuccia
Umberto Dal Santo
Beatrice Biffi
Alexander L. Vogel
The molecular composition of organic aerosol in the Po Valley remains largely unexplored, despite contributing approximately half of the fine aerosol mass. Molecularly-resolved analysis of the organic fraction is essential for understanding the sources and formation processes of organic aerosol in detail. Here, we investigated one year of PM2.5 filter samples from a rural agricultural and an urban environment. We used liquid chromatography and high-resolution mass spectrometry with subsequent non-target analysis of 250 samples. Time-series analysis allowed for the grouping of detected organic compounds using a clustering algorithm, enabling a tentative source attribution. The most populated clusters consist mainly of CHO- and CHOS-containing compounds, attributed to oxidation products of biogenic emissions. They account 31 % and 26 % of the total intensity in the urban and agricultural sites, respectively, and peak during summer. Combustion-related clusters, enriched in nitrogen-containing compounds, contribute approximately 35 % of the total intensity at both sites. A fraction of these molecules are highly conjugated compounds that appear during winter as primary contributors to light-absorbing organic aerosol. Furthermore, we identified site-specific compound clusters, either at the urban or at the agricultural site. At the latter, we found pesticides strongly influence the overall molecular composition, peaking in May when PM2.5 concentration is at its lowest level. This suggests potential toxicological effects despite apparent good air quality conditions. Our results represent the first molecular-level characterization of organic aerosol in the Po Valley, emphasizing the need to assess its composition for a better understanding of its environmental and health impacts.
- Article
(4912 KB) - Full-text XML
-
Supplement
(34404 KB) - BibTeX
- EndNote


The chemical characterization of atmospheric aerosols is essential for developing effective mitigation strategies targeting the most critical sources of air pollution. It is well-established that aerosols affect human health, particularly among the most vulnerable groups of the population (Fann et al., 2018; Kioumourtzoglou et al., 2015; Mikati et al., 2018; Bell and Ebisu, 2012). High exposure of aerosols causes respiratory apparatus cancer (Chang et al., 2022), increases the risk for cardiovascular diseases (Wu et al., 2020; Liang et al., 2022; Chen et al., 2022; Peralta et al., 2022; Xie et al., 2018; He et al., 2022a), and decreases global cognitive performance (Weuve, 2012; Saenz et al., 2018; Ailshire et al., 2017; Harris et al., 2015) resulting in increased hospitalizations burdened on national health systems (Lee et al., 2019). Furthermore, aerosols interact with radiation, leading to a modification of Earth's energy balance. Ammonium nitrate and ammonium sulfate aerosols increase light scattering, which causes atmospheric cooling (Zhu et al., 2015; Adams et al., 2001). Drugé et al. (2019) estimated that ammonium nitrate aerosols cause a mean direct radiative effect at the top of the atmosphere of −1.4 W m−2 over Europe, with a local maxima of −5 W m−2 over the Po Valley, Italy, in all sky conditions. In contrast, black carbon generated by incomplete combustion is a strong light absorber and has a positive radiative effects (+0.0–4.0 W m−2 over Europe, Nordmann et al., 2014), locally increasing air temperature (Ramanathan and Carmichael, 2008). In addition, other light-absorbing aerosols (LAAs) are organic aerosols (OA) formed by compounds rich in chromophores (Zeng et al., 2020), which strongly absorb radiation in the ultraviolet and visible region. These compounds are collectively referred to as “brown carbon” (BrC) due to the color that aerosol samples rich of this fraction assume. Ferrero et al. (2018) estimated BrC heating rate in the Po Valley accounts for 12.50 ± 0.06 % of the total, leading to a heating of 0.20 ± 0.01 K d−1 in cirrostratus cloud conditions and 0.020 ± 10−3 K d−1 under conditions of complete cloud cover (8 oktas) (Ferrero et al., 2021b). Molecular-level characterization of OA is becoming increasingly important to infer aerosol physicochemical properties, toxicological effects, and their sources (e.g. biogenic vs. anthropogenic, primary vs. secondary OA). This is undoubtedly challenging due to the number of compounds involved. Recently, Thoma et al. (2025) have investigated the OA fraction at the Taunus Observatory, a rural background station located at about 800 m a.s.l. in central Germany. By means of a multivariate analysis on an extensive dataset generated by an ultra-high-resolution mass spectrometer, the authors observed that even at a rural site, OA system is composed of several thousands of compounds affected by seasonality and short- and long-range transport, with biogenic secondary OA (BSOA) peaking during summertime and representing about 70 % of the total number of compounds, and 30 % attributed to anthropogenic secondary OA (ASOA), discerned because of the presence of combustion tracers, such as nitrophenols and aromatic species. The source attribution is even more important for air pollution hot-spot regions. Because of this, regions like the North China Plain (e.g., Zhang et al., 2023b; Zhu et al., 2021; Li et al., 2019) and the Indo Gangetic Plain (e.g., Panda et al., 2025; Gupta et al., 2022) have been extensively studied. For example, Kumar et al. (2022) reported that about 60 % of OA mass has a primary origin in New Delhi, due to hydrocarbon-like OA (HOA) and primary biomass burning OA (BBOA). Secondary organic aerosols (SOAs) were instead attributed to aromatics, BSOA, aged BBOA and mixed-urban SOA. Kapoor et al. (2024) pointed out the importance of LAAs, estimating that daily average BrC absorption contributes between 18 % and 42 % to near-ultraviolet absorption over India. Another well-studied pollution hot-spot is the Po Valley, in the Northern part of Italy. A number of papers (e.g., Neuberger et al., 2025; Bigi and Ghermandi, 2016; Ferrero et al., 2014, 2012) reported that this area is dramatically affected by its orography, which often prevents incoming air masses coming from North, West, and East able to disperse and abate the anthropogenic emission of the densely-populated valley in the lower layers of the troposphere. This leads to the accumulation of primary emitted compounds, especially during the cold season, when vertical mixing is limited to a shallow layer (Ferrero et al., 2011). In addition, Colombi et al. (2024) have shown that aerosol homogeneously affects the basin with very similar values in both concentration and chemical composition. The authors analyzed eleven years of particulate matter (PM) samples collected in an urban (Milan, the most populated city in the Po Valley) and rural (Schivenoglia, in a low-intensity agricultural region, about 150 km South-East of Milan) site, finding that both PM and secondary inorganic aerosols constituents show very similar concentrations along the year. Many studies have been published on source apportionment in the Po Valley, consistently highlighting the dominant role of anthropogenic emissions. For example, Perrone et al. (2012) performed a source apportionment on PM2.5 samples collected at urban and rural sites over a three-year period (2006–2009), identifying the local contribution of traffic (Tr), the widespread influence of biomass burning (BB), and the importance of secondary aerosols (both organic and inorganic) particularly during spring and summer. Similarly, Bernardoni et al. (2013) used 14C analysis on PM10 samples collected in Milan during wintertime to distinguish organic carbon (OC) and elemental carbon (EC) from fossil and modern carbon sources, estimating that OCfossil accounts for about 30.8 % of total carbon, while primary wood burning contributes 14.8 %, with an additional 37.5 % attributed to other modern sources. Source apportionment of the OA fraction in this region has been extensively performed over the past decade using aerosol mass spectrometry (AMS). Several authors (Paglione et al., 2020; Saarikoski et al., 2012; Dall’Osto et al., 2015), conducted field campaigns at both urban and rural sites. Their results consistently showed that biomass burning organic aerosol (BBOA) significantly contributes to OA mass, especially in winter, through both primary and secondary components. Regarding the primary fraction, Decesari et al. (2014) highlighted the importance of hydrocarbon-like OA (HOA) and a cooking-related component, whereas Daellenbach et al. (2023) estimated that primary BBOA accounts for 37 % of the OA mass. Concerning the secondary fraction, SOA was found to dominate summertime, especially due to low-oxygenated compounds (Daellenbach et al., 2023). Sandrini et al. (2016) demonstrated that photochemical oxidation of gaseous precursors is a key mechanism for SOA formation, particularly under stagnant conditions. In addition, nighttime increases in relative humidity promote the formation of secondary water-soluble organic carbon, further enhancing the complexity of OA composition (Saarikoski et al., 2012; Decesari et al., 2014). These processes lead to the formation of light-absorbing “brown carbon” (BrC), often associated with the droplet mode (400–700 nm), enriched in aged OA and nitrate (Costabile et al., 2017). In this regards, Kiendler‐Scharr et al. (2016) showed that, in the southern Po Valley, the fraction of organic nitrates is comparable to that of inorganic nitrate and among the highest observed in Europe. Aqueous-phase reactions have been identified as a key pathway for BrC formation (Gilardoni et al., 2016), while a significant fraction of BrC has been found to be water-insoluble and associated with primary emissions from wood combustion (Gilardoni et al., 2020). Overall, the Po Valley atmosphere is strongly impacted by anthropogenic emissions, with more pronounced effects during winter, when meteorological conditions and orography favor air stagnation. Increasing dry periods throughout the year (Baronetti et al., 2020; Monteleone and Borzí, 2024) further enhance the accumulation and spatial homogenization of secondary species (Colombi et al., 2024). Consequently, source apportionment studies have reported relatively low spatial variability across the region, identifying traffic-related fossil emissions as a persistent source throughout the year, secondary aerosols as dominant in summer, and biomass burning as prevalent in winter. Despite these extensive efforts, a detailed molecular-level characterization of OA remains limited. Although AMS-based techniques are powerful tools for apportioning non-refractory OA sources via positive matrix factorization, their hard ionization approach limits the identification of specific molecular species. As a result, a comprehensive understanding of OA composition at the molecular scale is still lacking in this major air pollution hot-spot. Such knowledge is essential to improve the representation of OA in atmospheric models, particularly with respect to photochemical processes and parameterizations (Basla et al., 2022). Promising information to infer source attribution is provided by OA molecular characterization by ultra-high-resolution mass spectrometry (UHRMS) after soft ionization methods. Due to the high mass resolution and accuracy it is possible to derive molecular formulae from the exact mass. In addition, the chromatographic separation at the front of the mass spectrometer helps to resolve isomers. In this regard, many authors have already attempted to describe an aerosol system coupling ultra-high performance liquid chromatography (UHPLC) to soft-ionization UHRMS. For example, Mazzi et al. (2024) recently used a high-performance anion-exchange chromatograph coupled with a triple quadrupole mass spectrometer with an electrospray ion (ESI) source to detect and quantify plant protection agents in Mestre, near Venice, on the eastern side of the Po basin. Among the trace compounds found, the authors estimated glyphosate concentration of 0.05 ng cm−3 in PM10. Many authors have begun to take advantage of the high resolution and accuracy of mass spectrometers, such as Orbitrap, to explore the complexity of OA without targeting specific molecules (e.g., Hildmann and Hoffmann, 2024; Song et al., 2023; Divisekara et al., 2023). Non-targeted analysis enables the characterization of the overall properties of OA and, when applied to time-series of samples and supported by multivariate analysis, has the potential to identify relationships between groups of compounds, molecular markers, and their sources (e.g., Wang et al., 2024). These relationships can be further constrained using source-specific analytical standards, external datasets, or other endpoints, as recently demonstrated by Breuninger et al. (2026) for the oxidative potential of PM. As noted by Tang et al. (2026), and originally proposed by Thoma et al. (2022), the concept of “Aerosolomics” advocates the integration of controlled experiments to elucidate chemical reaction pathways with atmospheric observations, time-series analysis, and correlations with known markers, supported by multivariate analysis, to identify the sources of atmospheric molecular species. In this context, the present work provides a substantial dataset of compounds that contributes to the Aerosolomics database, focusing on the Po Valley, a region for which, to our knowledge, these mentioned analytical techniques and data analysis approaches have not previously been applied. In this respect, Duarte et al. (2023) pointed out that, being the OA one of the most complex environmental matrices known, targeted and untargeted profiling of OA are both required to extract chemical information from the voluminous amount of data generated using newly available analytical approaches such as the one presented in this study. In this work, we applied the aforementioned techniques to two sets of fine atmospheric particulate matter samples (PM2.5) collected in Milan (MI) and Schivenoglia (SKI), both within the Po Valley, during 2021. Although OC concentrations are frequently comparable between the agricultural (SKI) and urban (MI) monitoring sites (90° percentile of absolute difference: 2.0 µg m−3), the molecular characterization of OA reveals marked qualitative differences in molecular aerosol composition, resulting in different light-absorbance spectral behavior too. Furthermore, the implementation of a compound-level clustering analysis allowed for the source attribution of potentially light-absorbing BrC constituents, elucidating distinct source profiles between the two environments.
2.1 Sampling
PM2.5 was collected at two different locations, Milan-Pascal (45°28′42.0348° N, 9°13′54.03° E) and Schivenoglia (45°1′0.336° N, 11°4′34.0032° E), both belonging to the ARPA Lombardia (the regional environmental protection authority) air quality network. The first one (hereinafter “MI”) is an urban background site, located in a small park next to a low-traffic street of the University of Milan campus. Milan is the most populated city in the Northern part of Italy and is located in the center of the Po Valley. The second site (hereinafter “SKI”) is a rural background site about 150 km far from MI, surrounded by agricultural fields and few animal husbandries. A map of Northern Italy showing the sampling sites is provided in Fig. S1 in the Supplement. At both sites, low volume samplers (SKYpost PM, TCR-Tecora, or Lifetek PMS, Megasystem, 16.67 L min−1) were used to collect the PM2.5 samples on not pre-treated quartz fiber filters (Pall TissueQuartz, Ø = 47 mm) for 24 h since 2014. On a weekly basis, the filters were collected and stored in the darkness at low temperature (about 4 °C). For this work, we chose to investigate samples collected in 2021. Therefore, a total of 132 samples for MI site and 117 samples for SKI site were used for the chemical and molecular characterization. The covered period ranges from the end of January 2021 to the end of the same year. Moreover, additional data, such as meteorological parameters (air temperature, global radiation, relative humidity) and gaseous concentration of NOx (NO + NO2), benzene and toluene, were provided by ARPA Lombardia.
2.2 Chemical analysis
Water-soluble inorganic compounds and levoglucosan were quantified by high-performance anion-exchange chromatography with pulsed amperometric detection by extracting 1.5 cm2 quartz filter punches in ultrapure water (10 mL volume) for 20 min in an ultrasonic bath. After filtration (Nylon or PTFE Syringe Filter, pore size 0.45 µm), the resulting solution was injected in the analytical system for the determination of anions (Metrohm 930), cations, and levoglucosan (Metrohm 881). A second punch was used to quantify EC and OC through thermo-optical analysis (Sunset Laboratory Inc., Tigard, OR, USA) based on the EUSAAR2 protocol. Both analytical procedures are also described in Colombi et al. (2024). For the organic phase investigation, a 12 mm diameter round punch was used for OA extraction in 180 µL of a 10 % acetonitrile (ACN) solution (Merck KGaA and Optima LC/MS Grade, Thermo Fisher Scientific Inc. and Milli-Q water Reference A+). The extraction was carried out using an orbital shaker (300 rpm) for 20 min. To the extracted and filtered (non-sterile PTFE Syringe Filter, Thermo Fisher Scientific Inc.) solution of 80 µL, an internal standard (10 % of the final extracted volume) consisting of isotopically labeled benzoic acid (, 99 at. % 13C, SigmaAldrich) and caffeine (13C3C5H10N4O2, 99 at. % 13C SigmaAldrich) was added. The analytes were separated by injecting 10 µL of each sample into a UHPLC with a reverse phase column (CORTECS T3, 120 Å, 2.7 µm, 3 mm × 150 mm, Waters, C-18) system. The mobile phase, ultrapure water and ACN, was maintained at a constant flow rate of 0.4 mL min−1 through the C-18 column heated at a constant temperature (40 °C). The gradient program was set as follows: 0–1 min at 1 % () ACN, 1–16 min with a linear increase to 99 % ACN, 16–16.5 min at a constant 99 % ACN, 16.5–17.5 min with a linear decrease back to 1 % ACN, and 17.5–20 min at 1 % ACN to re-equilibrate the column. A heated electrospray ion source (HESI-II Probe, Thermo Fisher Scientific Inc., operating in both positive and negative modes) was used to ionize the analytes before entering the mass spectrometer (high-resolution hybrid quadrupole-Orbitrap mass spectrometer, Q-Exactive Focus, Thermo Fisher Scientific Inc.). Ions in 75–750 range were detected in both positive and negative ionization mode in full-scan MS with a resolution of 70 000 at 200. Data-dependent tandem mass spectrometry (ddMS2) with a resolution of 17 500 was used at higher-energy collision energies (15, (negative/positive mode), 50 eV). As quality assurance, the sample analysis was periodically supplemented with mixed standards to evaluate the performance of the analytical system. A previous evaluation was also performed in Thoma et al. (2022).
2.3 Light-absorbance measurements
A subset of sample extracts was used to assess the light-absorbance to compare samples, which were collected at the two sites on the same days and exhibit very similar OC concentrations and contribution to PM2.5 (within a tolerance of 2 µg m−3 and 5 %, respectively). For this purpose, 10 µL of sample extracts were directly injected without chromatographic separation into a diode array detector (DAD, Thermo Scientific, Vanquish, VH-D10-A) with a liquid carrier (99 % ACN, 300 µL min−1). The light absorbance was measured with 20 Hz collection rate over the wavelength range of 230–650 nm. Solvent blank with the same amount of the internal standard injected in the sample extracts was used to remove the absorbance background. Finally, to account for the absence of a quantification of the OC mass extracted, we calculated the Absorbance Angstrom Exponent (AAE) for three wavelength ranges, that are 230–250, 250–400, and 400–650 nm. To this end, a linear interpolation was performed between the logarithm of absorbance and that of wavelength. The absolute value of the resulting slope represents the light-spectral behavior of the extracts.
2.4 Data analysis
2.4.1 OA non-target analysis
The chromatograms and acquired spectra were processed using Compound Discoverer software (Thermo Fisher, version 3.3.2). We considered spectra with retention time in the range 0–16.5 min and with a total intensity threshold of 10 (negative/positive mode). Retention time alignment was performed using an adaptive curve with a maximum absolute shift of 0.2 min. Each peak signal was extracted with a mass tolerance of ±2 ppm only if it appeared at least for 5 scans. Base ions for compound detection was set to [M − H]− and [M + H]+ for negative and positive mode, respectively. Molecular formulae were attributed constraining the number of elements (min: C#1, H#1; max: C#90 H#190 Br#3 Cl#4 N#4 O#20 P#1 S#3), the DBE range (0–40), and the hydrogen-to-carbon ratio range (, 0.1–3.5). The acquired MS2 spectra were compared with the Advanced Mass Spectral Database mzCloud (HighChem LLC, Slovakia) and the Aerosolomic database, described in Thoma et al. (2022). A match with these libraries allowed to increase the identification confidence from Level 4 (L4, unequivocal molecular formula) to L2 (probable structure), based on the classification described in Schymanski et al. (2014). Detailed workflows are given in Tables S1 and S2 for negative and positive mode, respectively.
2.4.2 OA molecular characterization and hierarchical cluster analysis
After blank correction, the dataset was reduced considering only the compounds with a signal intensity (SI) higher than 104 and 105 in negative and positive mode, respectively, and with a signal-to-blank and a peak rate higher than 5. Moreover, to analyze the chromatographically resolved features only, we considered the retention time range between 1.55 min (void time: 1.44 min) and 16.50 min. The resulting list of molecular formulae were compared with the PubChem database (Kim et al., 2024, https://pubchem.ncbi.nlm.nih.gov/, last access: June 2024) to remove only potentially non-existent or impossible formulae. Assigned molecular formulae were used to group the features into families based on the elemental composition: CHO, CHNO, CHOS, CHNOS, CHN, and CHOP. Features without an assigned formula or not falling into the aforementioned categories were grouped under the category “Others”. To compare SI among the samples, each individual signal was scaled by the air volume sampled through the filter. Finally, to account for the different instrumental response in terms of signal peak intensity due to the ionization modes, the SI were normalized (nSI) to the maximum value found for each polarity (see Eq. S1). The non-target screening approach requires the identification of descriptors to infer the properties or characteristics of detected molecules, which can aid in their characterization. For each formula, we calculated the average carbon oxidation state (OSc) with the simplified method described in Kroll et al. (2011) (Eq.1), the double bond equivalent value (DBE, Eq. 2), that is the number of rings and double bonds in a molecule, the aromaticity equivalent (Xc), as proposed in Yassine et al. (2014) (Eq. 3). This last descriptor was validated to provide information concerning the presence of aromatic structure in a molecule (Xc ≥ 2.5000), while aliphatic structures show lower values of the mentioned threshold. In this work, to infer temporal averages, we used the peak abundance-weighted average parameter approach, as already shown in Wang et al. (2021).
In Eq. (3), p and q represents the fraction of oxygen and sulfur atoms involved in the π-bond structures. Since their values depend on the category of compounds, we used the same approach proposed in Kourtchev et al. (2016),Wang et al. (2017), and Tong et al. (2021), where for compounds detected in HESI(−), while for formulae detected in HESI(+). In addition, the value of (p× #O + q × #S) is rounded down to the lower integer whether #O or #S are odd for compounds detected in negative mode according to Yassine et al. (2014). It is worth stating here as well that the analytical approach used in this work is not suitable for the quantification of each compound. Although the SI is proportional to the concentration in the analyzed sample, soft ionization techniques have different ionization efficiencies for each analyte. Theoretically, it would be possible to measure the ionization efficiency of each compound; however, the enormous number of molecules contained in an atmospheric aerosol sample makes this process practically impossible. Moreover, many compounds present in the atmosphere are completely unknown and, therefore, no analytical standard is available. This issue led some authors (e.g., Ma et al., 2022; Divisekara et al., 2023) to use surrogate compounds to represent a broader group of molecules and to assume the same concentration-peak area intensity response for these as for the measured compound. Although, to our knowledge, this is the best approach currently available, we believe that the number of surrogates required would be too large for the purposes of this work. For this reason, we have limited our discussion to considering peak area intensities as a proxy for atmospheric concentration, i.e. to compare their relative importance in the samples. A hierarchical clustering algorithm was chosen to reduce the complexity of the system (Qi et al., 2019; Priestley et al., 2021; Thoma et al., 2022). We used the software MATLAB (The MathWorks, vers. 2024a) independently on the two datasets after removing all the features with an occurrence lower than 10 %. We standardized (through centering) each feature along its time-series and used the Euclidean distance as a metric to calculate the similarity among the compounds and the Ward linkage method to create the tree. Finally, the number of clusters for each site was chosen based on the similarity metric, the resulting fingerprint of each cluster, its interpretability using available markers in the literature, and its correlation with external data, such as EC, soluble potassium, levoglucosan, and NO2.
3.1 Seasonality of organic aerosol molecular composition
The calculation of the normalized total signal intensity (nTSI, Eq. S2), i.e. the sum of the nSI of individual compounds in each sample, allowed us to compare the seasonal variability at each site. Both time series sites exhibit peak values during winter and summer (Fig. 1). A similar trend is also visible in the OC concentration quantified in the PM2.5 samples from both sites, although the increase during the summer period, mainly due to aliphatic CHO and CHOS compounds, is not fully reflected in the OC values. This leads to a poor correlation (R2 = 0.280 and 0.466 for MI and SKI, respectively) between nTSI and OC on an individual samples basis. Highly oxygenated compounds dominate during summer, with an average OSc of 0.91 ± 0.06 for MI and 0.89 ± 0.04 for SKI in July. Figure 1 indicates that nTSI has a stronger contribution in aromatic compounds, especially belonging to CHNO and CHO families, during winter. In this regards, both DBE and Xc index show minimum values during summer (2.54 ± 0.14 and 0.37 ± 0.09, respectively in July) and maxima in winter (3.40 ± 0.34 and 0.87 ± 0.15, in February). While no clear temporal trend is observed for P-containing compounds in Milan, two periods of notable contribution from this family to the nTSI are identified at the agricultural site. The annual pattern shows that this compounds contribution increases from March to early May and from late September to the beginning of December, peaking in samples collected in April and November.
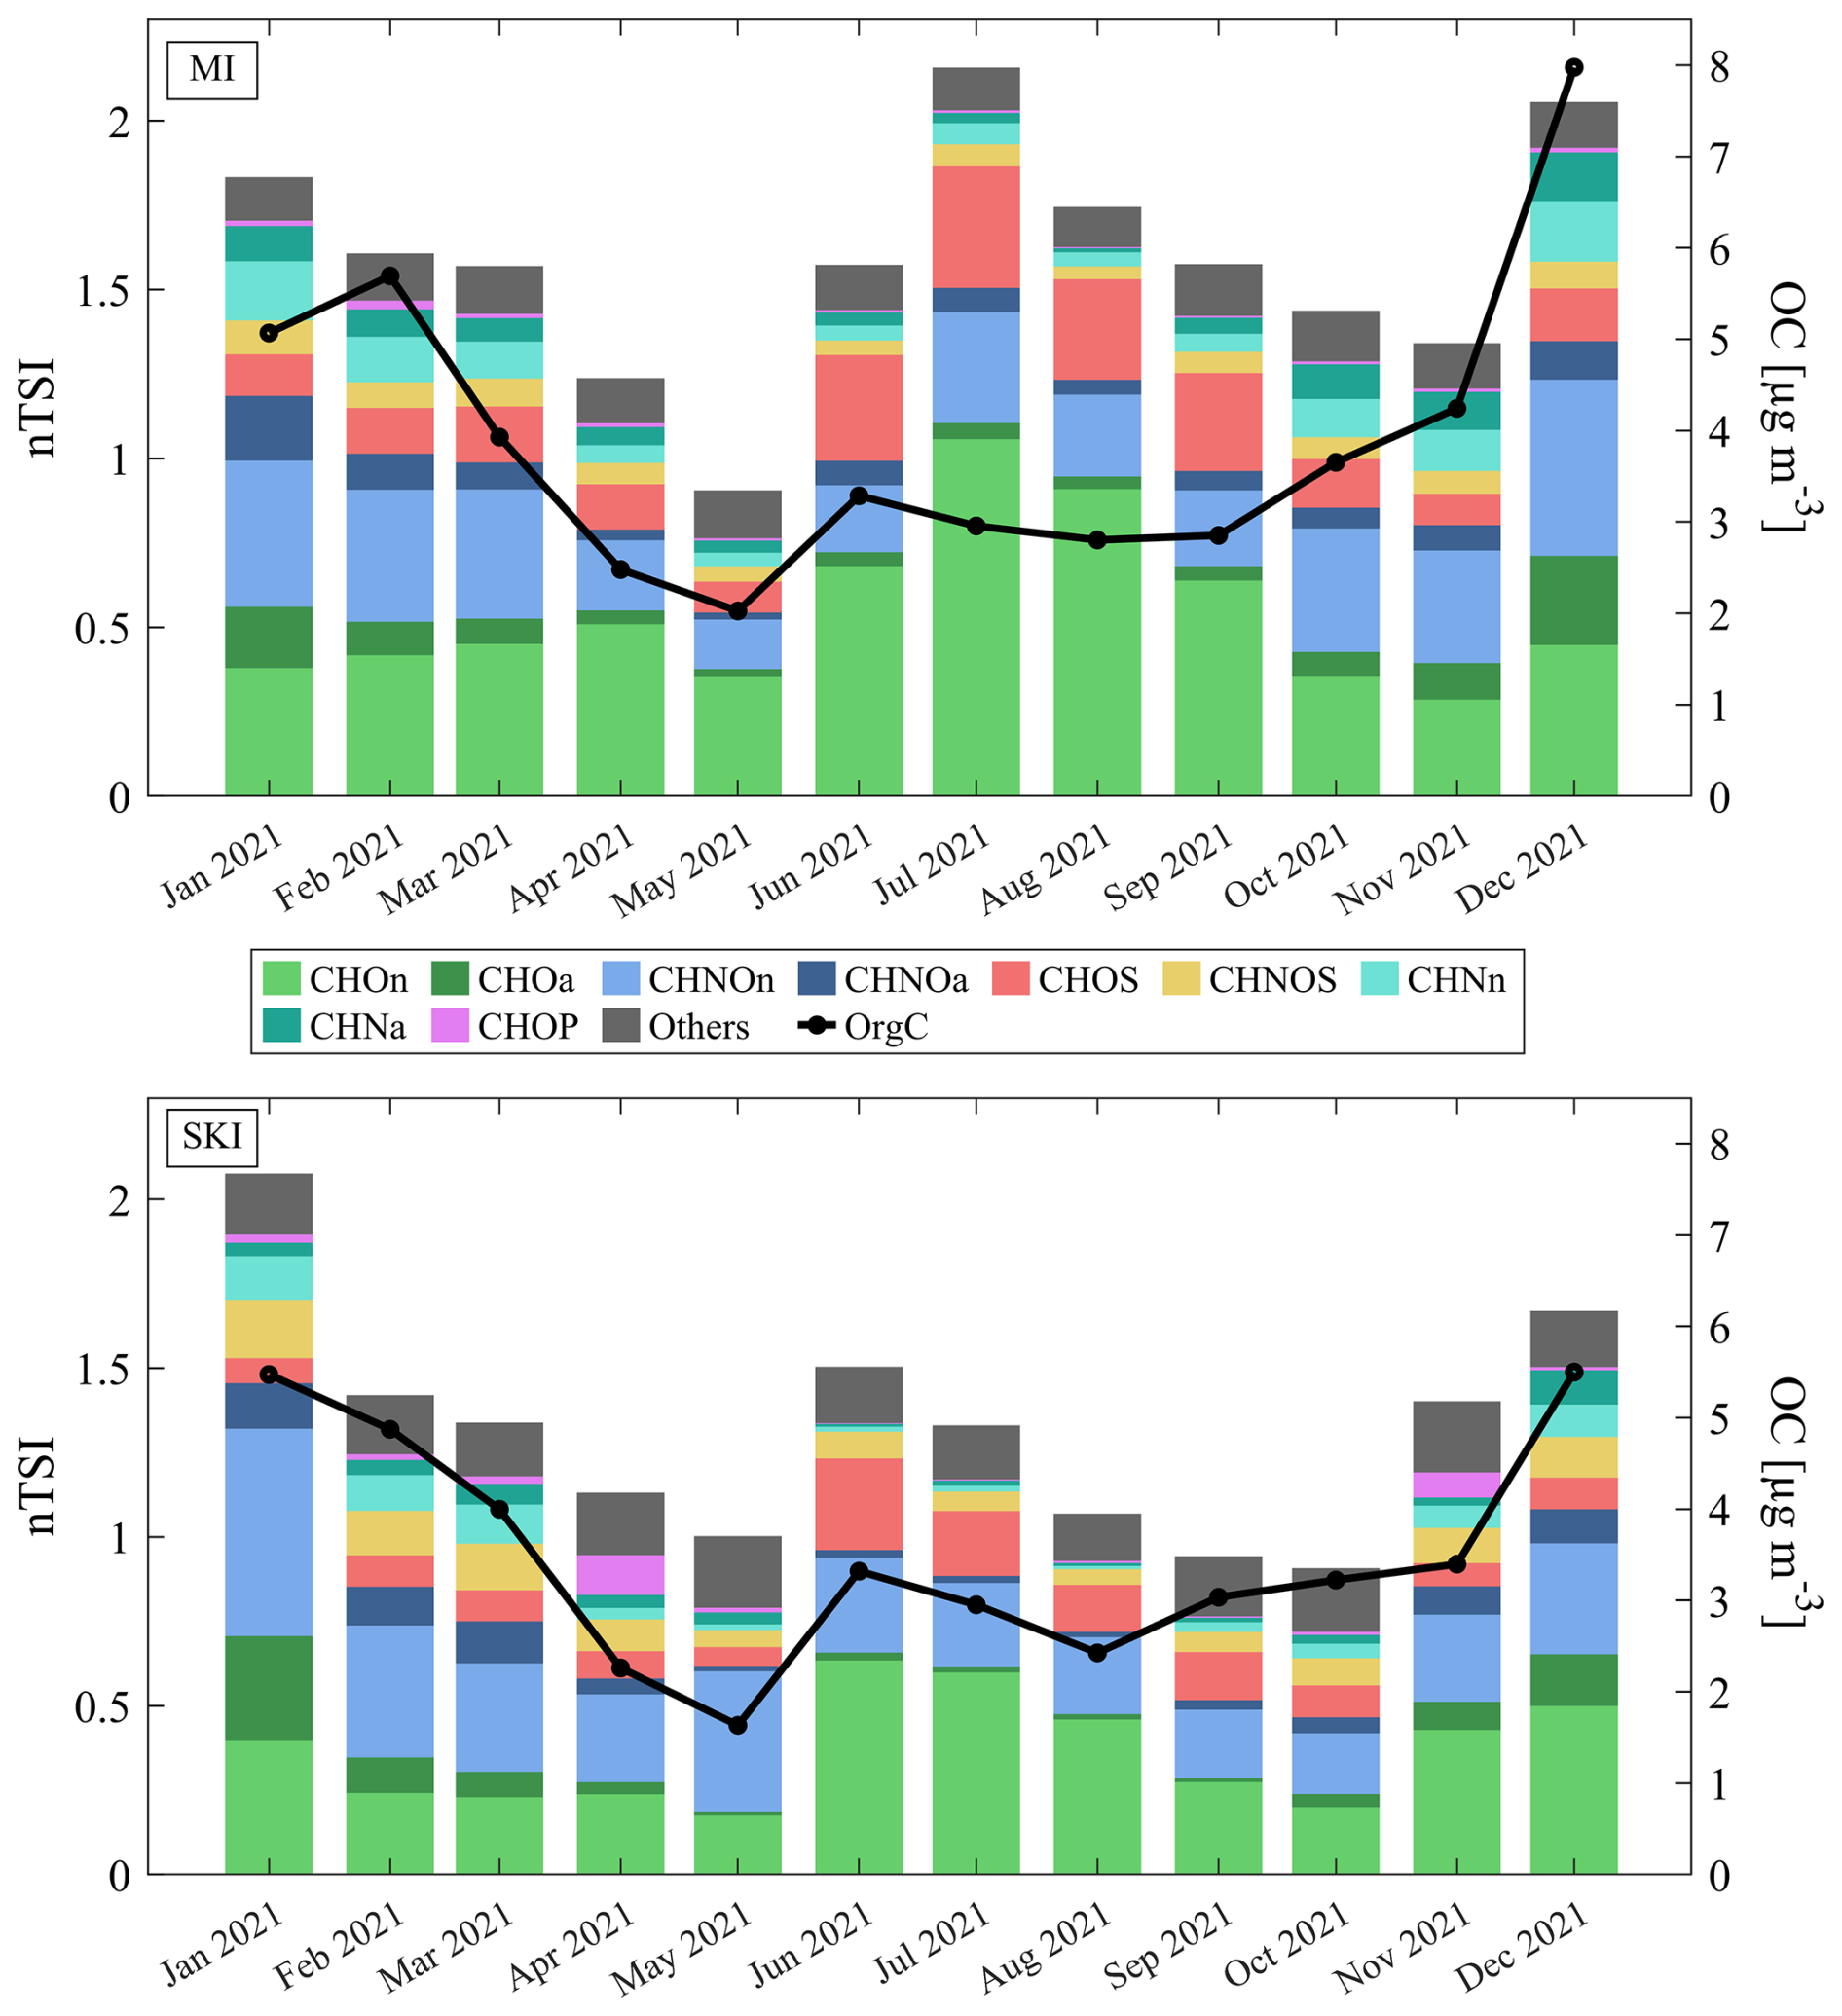
Figure 1Time series of the monthly average nTSI for the groups of compounds detected in the MI (top plot) and SKI (bottom plot) samples. Darker colors represent the nTSI of aromatic compounds (“−a”), distinguishing them from the lighter colors for aliphatic ones (“−n”) based on their Xc values.
Retrieving light-absorption information via a molecular-derived proxy, we use the ratio to identify compounds of light-absorbing aerosols (LAAs), setting limits for this range between 0.5 (for polyenes) and 0.9 (for fullerene-like hydrocarbons) (e.g., Lin et al., 2018; Laskin et al., 2014). Using these criteria, we selected molecules from our dataset that likely contribute to BrC (Fig. 2). Organic LAAs show maxima nTSI values during winter (0.73 ± 0.36 at MI and 0.53 ± 0.24 at SKI). This is in agreement with Bluvshtein et al. (2017) and Budisulistiorini et al. (2017) describing that emission from wildfires, peat fires, agricultural residue burning, and residential combustion substantially contribute to BrC. While some of these sources may remain active during summertime, photobleaching and ventilation of the Po Valley are more efficient during summertime (Chen et al., 2021). Consistently, we observe lower values of the BrC-related molecules in summer (0.27 ± 0.11 at MI and 0.16 ± 0.04 at SKI). The higher values in nTSI observed at the urban site in the warm season indicate either more active emission sources or air-quality conditions that more efficiently promote chromophores formation. Indeed, the plots in Fig. 2 show that the urban site (left) exhibits a larger number of BrC-related compounds (+409) compared to the rural site (right). From a qualitative perspective, the seasonal BrC plots for the two sites (Fig. S2) confirm a different composition of LAAs. Seasonally averaged BrC compound intensities were aggregated by molecular-family and normalized to the total BrC intensity (Fig. S3), revealing that the relative contributions of these families differ between the two sites across seasons. During them (summer and winter) the urban site exhibits higher contributions due to the CHN family compared to the agricultural site (8.8 % vs. 3.7 % at MI and SKI, respectively, in summer; 17.1 % vs. 7.9 % in winter), whereas CHO family contributes to the higher nTSI values (Fig. 2) in respect to SKI during summer only. In contrast, CHNO species contribute more at the agricultural site in both seasons (23.9 % vs. 33.9 % in summer and 46.2 % vs. 51.5 % in winter, respectively). Contributions from the other families are marginal, accounting for less than 2 % at both sites.. Similarly to the temporal pattern shown in Fig. 1, at both sites the contribution of wintertime BrC is mainly due to N-containing compounds. At the same time, the nSI-weighted average shows that in the coldest months BrC has the lowest ratio, suggesting a low oxidation regime affecting BrC molecular composition (Fig. S4). On the contrary, the lower summertime peak in BrC nTSI is mainly ascribable to highly oxidized compounds ( > 0.5) with a probable secondary origin (Gilardoni et al., 2020).
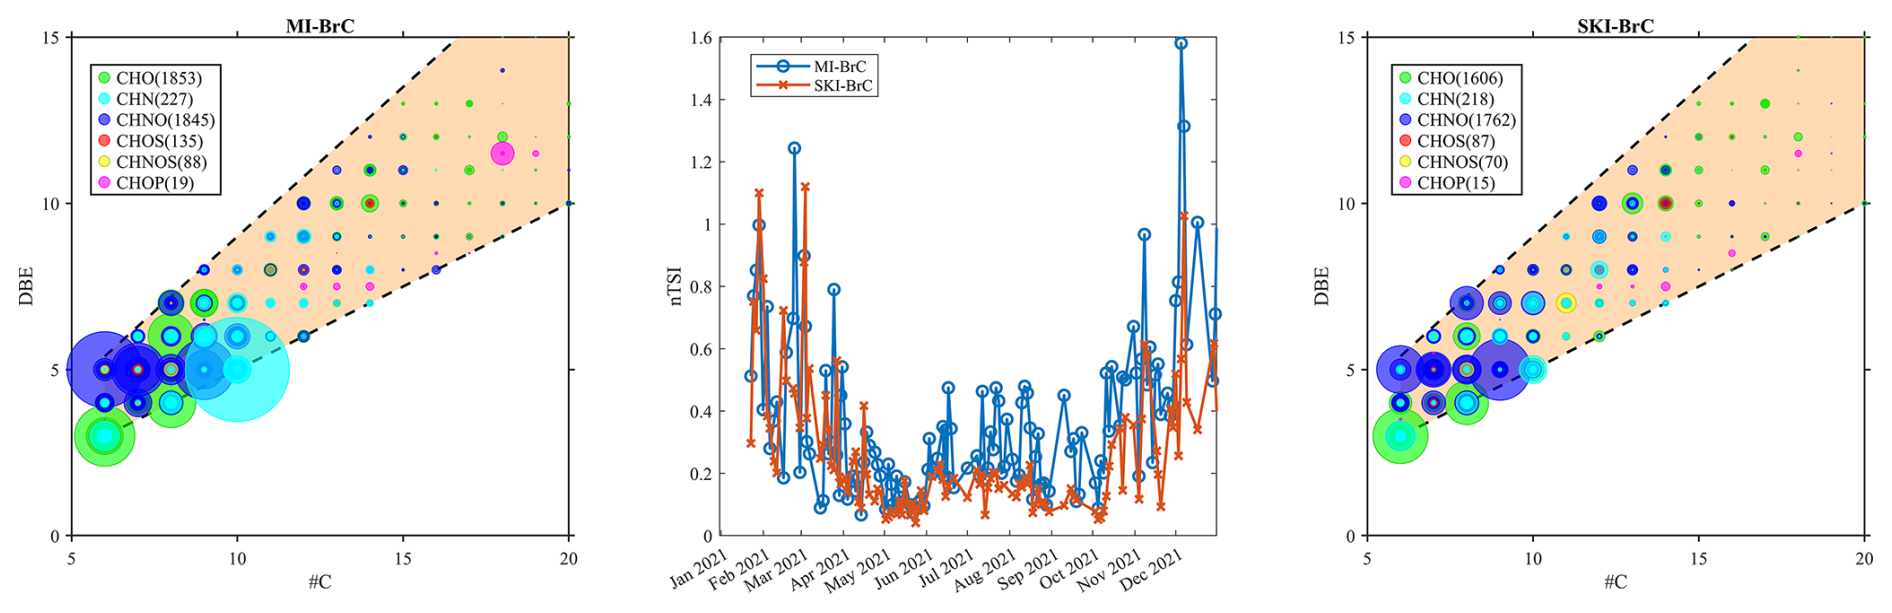
Figure 2Fingerprints of potential BrC compounds at MI (left) and SKI (right) sites and their nTSI time series over the year 2021. The orange-shaded area delineates the region in which potential BrC compounds are located.
In addition to the seasonality of elemental-composition groups and the BrC-related molecules, we focus on few individual tracers to confirm our hypothesis concerning their seasonal patterns. For instance, the later-generation product of monoterpene oxidation, that is 3-methyl-1,2,3-butane-tricarboxylic acid (MBTCA), peaks in summer. This is consistent with the higher monoterpene emission and stronger oxidative conditions from May to September. On the opposite, the CHNO compound nitrocatechol, a well-known combustion product from BB (Fredrickson et al., 2022), shows the opposite trend. The time series of these compounds, whose identification was allowed by the comparison with analytical standards (identification level 1, L1, based on Schymanski et al., 2014), are shown in Fig. S5.
Based on the blank-corrected annual average SI, we ranked the compounds with the highest values for the most representative molecular families (that are CHO and CHNO), which alone represent 60 % of the nTSI. Within the CHO(−) family, the formulae C4H6O5, C8H12O6, and C6H8O7 exhibit the highest average intensities. The first two compounds show a distinct seasonal trend, with intensities peaking in spring and reaching a maximum during the summer, followed by a decline during autumn. This pattern suggests that the conditions favorable for the emission or formation of these compounds are most prominent in summer. Together with the aforementioned MBTCA (L1, C8H12O6), the compound with the formula C4H6O5 and its pronounced increase during summer suggest a likely monoterpene-derived biogenic origin (L4, as suggested by Thoma et al., 2022, Chen et al., 2020, and the literature within). In contrast, the third-highest intensity compound, C6H8O7, appears to be an anthropogenic SOA tracer (ASOA) derived from the oxidation of benzene (L4, Cheng et al., 2021). For the CHNO(−) molecular family the highest signals occur during wintertime. At both sites, nitrocatechol (L1, C6H5NO4) ranks highest. Additionally, at the urban site, two isomers of C7H7NO4 were detected, likely representing methyl-nitrocatechol and nitroguaiacol (L4, Al-Naiema and Stone, 2017). Finally, SKI samples reveal a significant signal for C8H6N2O2, which can be attributed to nitroindole (L4), known as a BrC-related compound from the oxidation of indole in presence of NO2 (Jiang et al., 2024). The presence of this gaseous amine in the atmosphere has been attributed to many sources, such as vegetation, biomass burning, industrial activities and animal husbandry (literature within Xue et al., 2022). We observe a similar annual pattern for nitroindole at urban (MI) and rural-agricultural (SKI) sites. However, SKI exhibits higher signal intensities, indicating a closer proximity to the precursor sources, i.e. animal husbandry. Since the of nitroindole is 0.875, it is also highlighted in Fig. 2 as the blue circle with coordinates (7; 8). In positive ionization mode, the highest intensities for CHO(+) compounds are measured in MI as C11H22O5 and C12H26O5, attributed to ASOA from alkane photooxidation (Zhang et al., 2014), and more specifically to n-dodecane SOA (L4, Li et al., 2021). The third highest signal at MI corresponds to the highest one at SKI, i.e. C10H22O4, although no correspondence was found in the literature. At SKI site, C8H16O2 and C20H26O3, the second and third highest signals, are attributed to BBOA by Kong et al. (2021) and Smith et al. (2009). For the nitrogen-containing compounds (CHNO) detected in positive mode, the formulae corresponding to the values with the highest signals,are C9H11NO2, C12H17NO and C6H15NO for MI site and C9H18N2O, C12H23NO and C12H25NO for SKI, tentatively assigned to 1-[[(2R)-oxolan-2-yl]methyl]piperazine, a plant protection product (L4, ECHA CHEM database, 2024b), a compound found in agricultural residue burning (L4, Li et al., 2024) or to n-octyl pyrrolidone (L4, ECHA CHEM database, 2024a) also used as co-solvent in crop protection formulations, and N,N-dimethyl capramide, an additive in pesticide formulations (L4, PubChem, 2024). As these last mentioned compounds are anthropogenic chemicals, an unambiguous molecular identification can be achieved via target analysis.
3.2 Organic aerosol hierarchical clustering
In the following, we describe the hierarchical cluster analysis of the complete dataset. We conducted two independent cluster analyses for the two sites to ensure that the differences between the sites are maximized, enabling an unbiased assignment of a compound to a cluster regardless of its temporal behavior at the other site. It is important to clarify that the presence of a formula within a cluster does not necessarily indicate that the corresponding compound is emitted by the source after which the cluster is named. Rather, it may suggest a shared emission driver or reactive pathway that causes the compounds in the same cluster to exhibit a similar temporal pattern. However, many anthropogenic sources are known to be active year-round, with their influence often varying over time. In addition to the seasonality of emission strength, the meteorological variability can drive different reaction pathways. An increased oxidation of anthropogenic VOCs during the summer months might consequently lead to the assignment to a biogenic cluster. Even more difficult to assign to an anthropogenic cluster are SOA compounds that originate from the oxidation of volatile chemical products (VCP), such as limonene. On the other hand, such products may experience an increase in their concentration during wintertime due to a reduced mixing layer height. As such, the following discussion does not intend to definitively attribute a source to each detected compound, but rather to provide insights into their temporal trends and which other compounds show similar behavior over the course of the year and assign them to a representative molecular or sector-specific cluster. Furthermore, the use of highly resolved chromatographic and spectrometric techniques yields a large number of isomers, which cannot be precisely identified in the absence of specific reference standards of characteristic fragmentation spectra. As a result, comparisons with data from literature may also be subject to this inherent uncertainty. At each site we examined the compounds that were detected in more than 10 % of the analyzed samples. This leads to investigate via hierarchical cluster analysis (HCA) 6487 and 5499 parameters for MI and SKI, respectively. We also used external data from meteorological factors (such as global radiation, daily temperature, and relative humidity), gaseous species concentrations (NOx, O3, benzene and toluene), ion chromatographic and thermo-optical transmittance data (i.e., EC and OC) to improve our interpretation of the results. The HCA revealed seven main clusters for the urban site (Fig. S6) and five for the rural site (Fig. S7). According to the temporal patterns, three clusters at both sites showed a clear increase in intensity during the colder season. The higher signals observed during winter may arise from multiple contributing factors, acting either independently or in combination. Seasonal variations in emissions may lead to the presence of sources that are active or more intense in winter than in other periods of the year. In addition, meteorological conditions typical of winter, such as reduced atmospheric mixing and dispersion, can enhance aerosol concentrations. Partitioning processes may also play a role, with gas–particle equilibrium shifting toward the particulate phase under colder conditions. Furthermore, the absence or low abundance of certain compounds in summer does not necessarily imply a lack of emissions; rather, enhanced photochemical degradation may lead to their rapid transformation into other species. As a result, compounds that are prevalent in winter may be replaced in summer by secondary products that are only present at low levels during the colder season. In either case, this behavior suggests that the compounds in these clusters have a likely anthropogenic origin. Additionally, at MI, two clusters show an increase during the warmer season, whereas only one cluster exhibits this behavior at the rural site. The remaining clusters do not show a clear temporal pattern, which could be due to a sporadic rise or activation of the sources. The contribution of the clusters, as monthly average, is shown in Fig. 3. In the Supplement, we show the fingerprints of each cluster using the retention time versus the molecular mass of each compound, the Van Krevelen diagram, and the Kroll plot to infer the cluster's chemical signature. Finally, the molecular formulae with tentative identifications and cluster attribution are listed in Additional Data (Table A1).
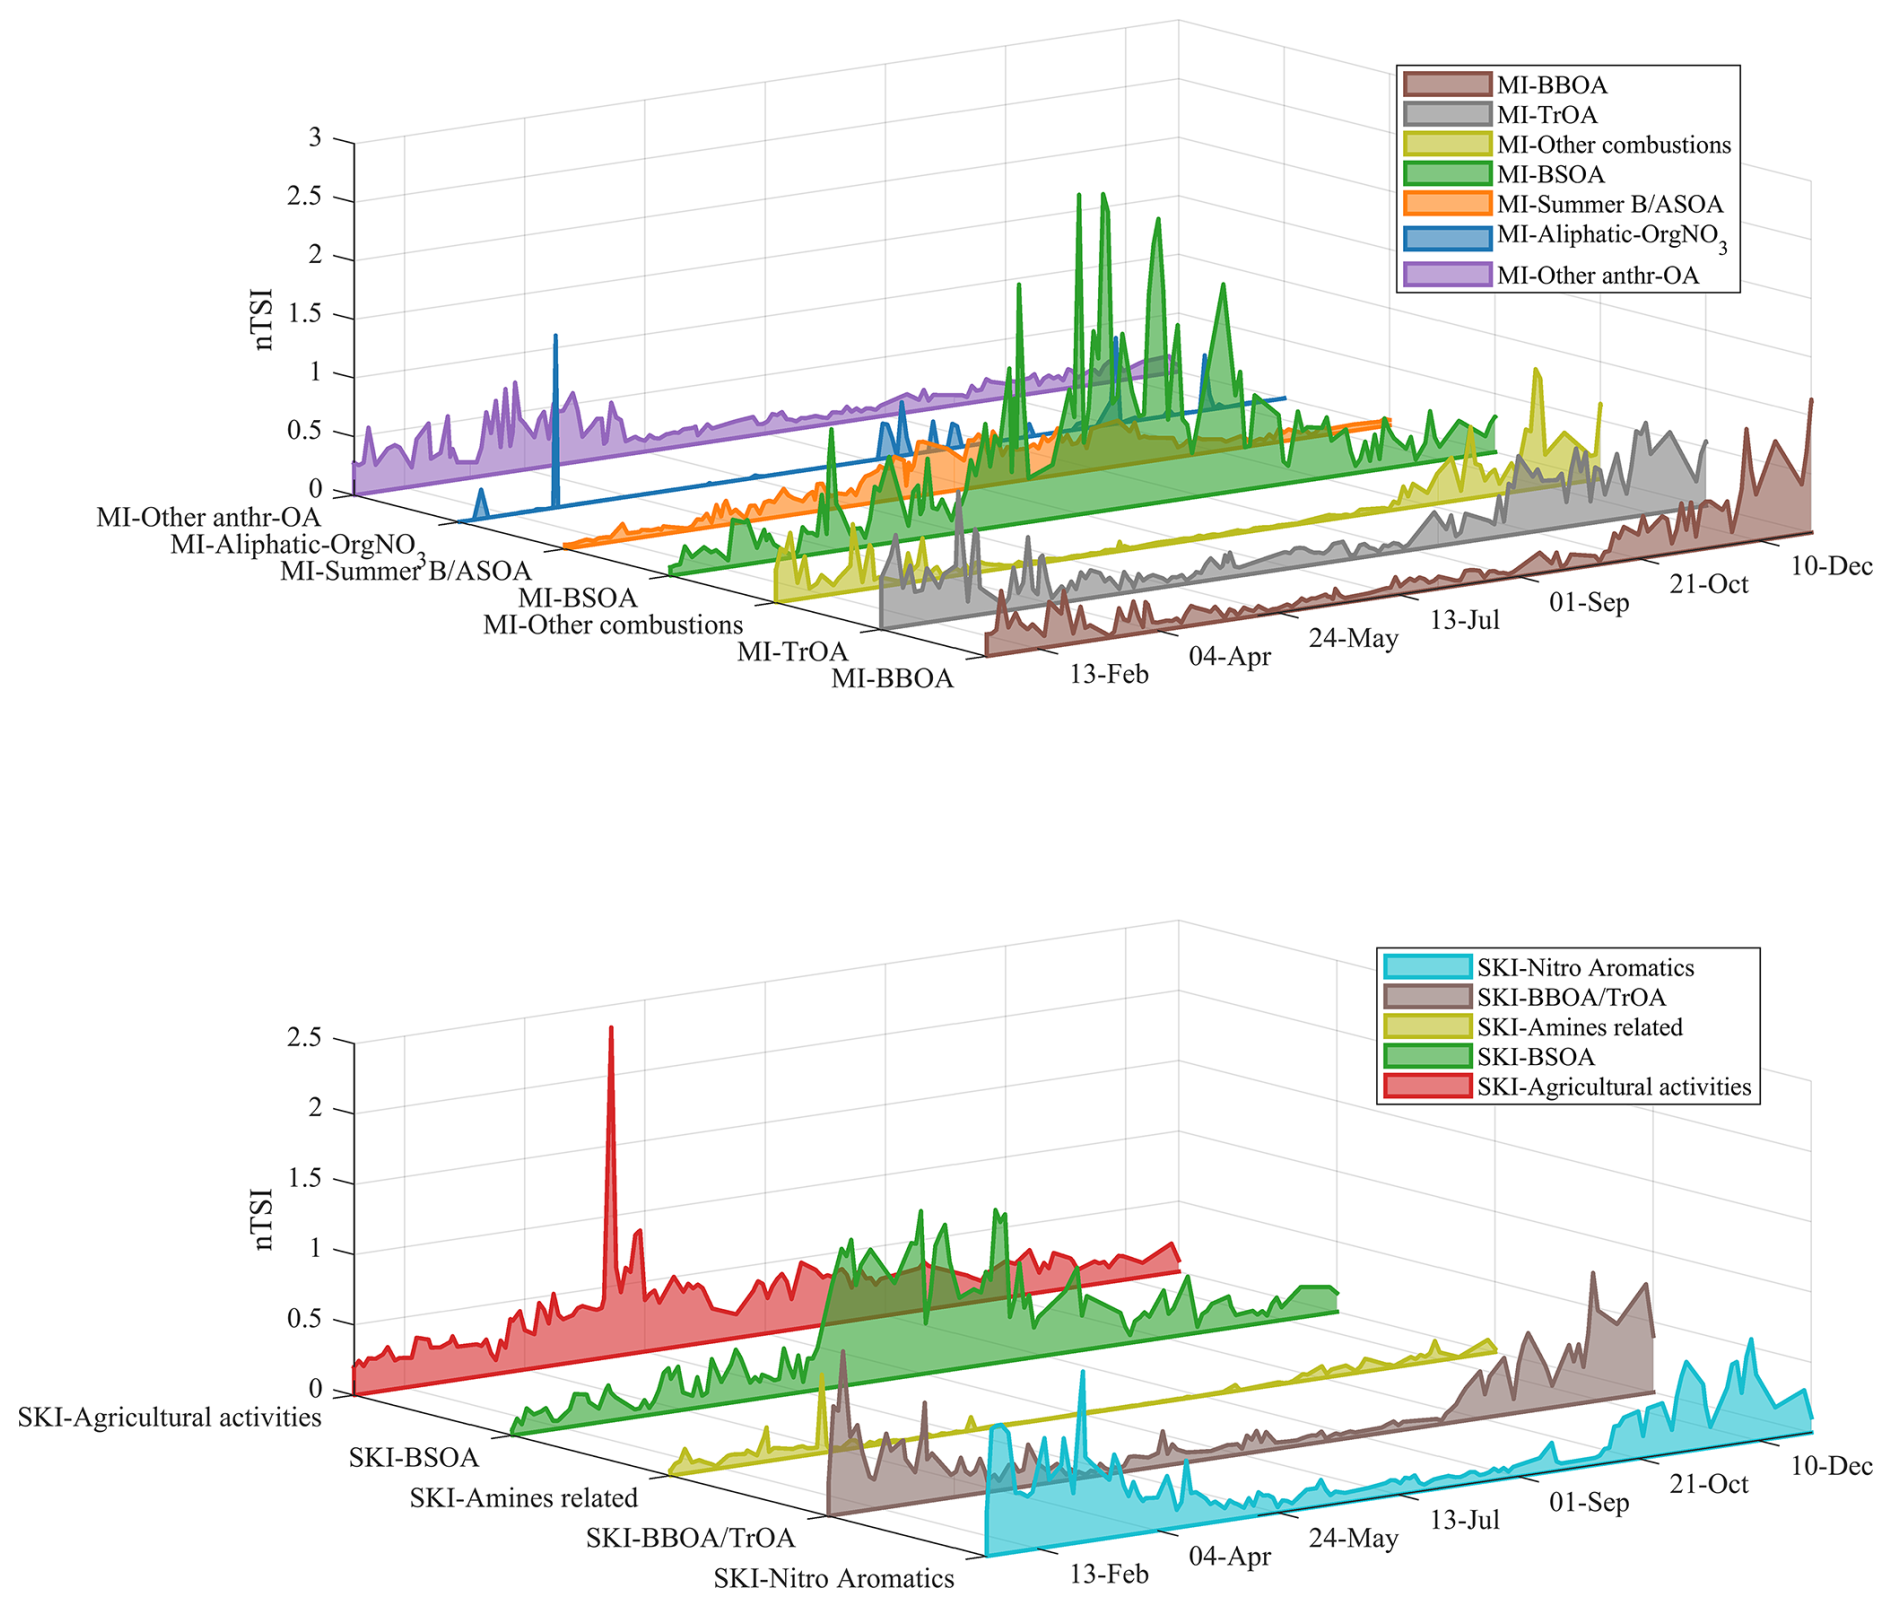
Figure 3Time series of the nTSI of the clusters identified at MI (upper plot) and SKI (lower plot) sites.
3.2.1 Wintertime clusters
The molecular fingerprints of the wintertime clusters (Figs. S8, S9, S10, S15, S16, and S17) are characterized by a significant contribution of N-containing compounds and low ratio values (median < 0.45). The region of the Van Krevelen diagram that is typically associated with aromatic compounds ( between 0 and approximately 1 and between approximately 0.5 and 1) is densely populated. At the urban site, we identify a distinct cluster in which this region is predominantly occupied by CHO compounds (Fig. S8). Notably, the nTSI of this cluster strongly correlates with soluble potassium (R2= 0.705) and levoglucosan (R2= 0.734), both established tracers of biomass burning sources (e.g., Yu et al., 2018). This suggests that biomass burning is likely the dominant source for most compounds in this cluster. A few CHNO compounds, such as nitrophenol (C6H5NO3, L1), isomers of methyl-nitrophenol (C7H7NO3, L4), methyl-nitrocatechol or nitroguaiacol (C7H7NO4, L4), vanillin (C8H8O3, L4) and vanillic acid (C8H8O4, L4), also fall within the aromatic region of the Van Krevelen diagram of this cluster. In the CHO class, we identified phthalic acid (L1) and its isomers. Phthalic acid is released into the atmosphere from several anthropogenic sources, such as combustion of plastics or oxidation of traffic exhaust PAHs, such as naphtalene (e.g., Lui et al., 2023; Al-Naiema et al., 2020; Al-Naiema and Stone, 2017; Deshmukh et al., 2016; Kawamura and Kaplan, 1987). The presence of biomass burning markers and the correlation with the external tracers suggest that BB is the dominant source for the “MI-BBOA” cluster. Its nTSI has the highest coefficient of determination with OC concentrations (R2=0.813), suggesting also that BB is a relevant source for carbonaceous matter concentrations at MI site during wintertime. The nTSI pattern of the cluster called “MI-Other combustion” (Fig. S9) shows a good correlation with soluble potassium (R2= 0.718) and levoglucosan (R2= 0.794, populated by nitrocatechol (C6H5NO4,L1), three isomers of methyl-nitrocatechol (C7H7NO4, L4) and coniferyl alcohol (C10H12O3, L1). The characteristic of this cluster is mainly the presence of a large number of CHN(+) compounds, such as C7H12N2, C8H14N2, C9H10N2, C12H10N2, which are formulae attributed to BBOA by Smith et al. (2009) and Fleming et al. (2018). Moreover, even with slightly weaker correlation, this cluster indicates an influence from traffic sources, as suggested by NO2 (R2= 0.567) and benzene (R2= 0.570), leading to a cluster possibly affected by both sources. However, we also observe a weak correlation to ECtraffic (R2= 0.354), estimated by the difference between EC and ECnon-fossil (Daellenbach et al., 2023). This approach derives from the parametrization described in Zotter et al. (2014), which reported a ECnon-fossil–to–levoglucosan ratio of 0.87 for stations south of the Alps and assuming that EC is due to fossil (coal combustion and traffic exhaust) and non-fossil combustion (wood burning). On the other hand, these external tracers correlate better with a third wintertime cluster found at the urban site (R2= 0.648, 0.829 and 0.747 for ECtraffic, NO2 and benzene, respectively), which fingerprint is shown in Fig. S10. The nTSI of this cluster shows increasing values during the weekdays and lower ones in the weekends. Many tracers attributed to traffic exhaust in the literature are found here: e.g. C4H6O4 (succinic acid, L4, Lui et al., 2023), C7H12O7 (L4, Thoma et al., 2022), and C9H8O4 (methylphthalic acid, L4, Ikemori et al., 2021). In addition, N-containing features enrich the so-called “MI-TrOA” (Traffic OA) cluster, including aliphatic amines such as C8H18N, C7H17N, C9H21N (as reported in Cao et al., 2023). This cluster contains probable cyclic compounds, like C10H14N2, which could be nicotine (L4) and nitro-aromatic compounds, C6H3N3O7 (picric acid, L4, Lin et al., 2015). More in general, it includes N-organic containing compounds (NOCs), some reported in the literature from traffic exhaust, like C9H19NO (N,N-dibutylformamide, Rogge et al., 1993, L4). These characteristics clearly distinguish this cluster from MI-BBOA and MI-Other Combustions clusters discussed earlier. In addition, we found some CHOP compounds, such as C18H39O7P (tris(2-butoxyethyl)-phosphate, L4, Ungeheuer et al., 2021), C18H15OP (triphenylphosphine oxide, L4, Faiz et al., 2018), and C8H19O5P (found in Lao et al., 2022), attributable to flame retardants. This class of compounds are often observed as non-combustion emission by vehicles too (Dong et al., 2025). Within the wintertime clusters, 96 out of the 239 compounds likely HOA are observed, based on their values of OSc (between −2 and −1) and #C (between 18 and 30) (Kroll et al., 2011), distributed as 16 %, 30 % and 54 % among BBOA, Other Combustion and TrOA clusters, respectively. As an example, C19H26O2 and C20H28O3 are attributed to BBOA (Zhang et al., 2023a and Smith et al., 2009, L4), whereas C18H28O to vehicular emissions (Li et al., 2021, L4). At the rural site, a total of 82 HOA compounds are found, of which 46 appear in one of the three clusters with a winter temporal pattern. The cluster named “SKI-BBOA/TrOA” (Fig. S15) exhibits a strong correlation with both biomass burning (i.e. soluble potassium, R2= 0.674, levoglucosan, R2= 0.708) and traffic (i.e. benzene, R2= 0.769, ECtraffic, R2= 0.539, and NO2, R2= 0.678) markers. Notable compounds include vanillic acid (C8H8O8, L4, Simoneit, 2002), nitrophenol (L1), dodecanitrile (C12H23N, L4, Simoneit et al., 2003), nitrocatechol (L1), nitrosalicylic acid (C7H5NO5, L4, He et al., 2022b), acetosyringone (C10H12O4, L4, Li et al., 2020b and references therein), phthalic acid (L1), methylphthalic acid (L4), and 4-hydroxy-3-nitrobenzyl alcohol (C7H7NO4, L4, Al-Naiema and Stone, 2017). Also, 33 HOA compounds fall in this cluster, such as C20H28O3, and C20H26O2, attributed by Smith et al. (2009) to BB sources. Similar to clusters identified in the MI dataset (Figs. S8 and S10), S-containing compounds were also detected in wintertime clusters. Among these, we found C12H20O7S (L4, literature in Srivastava et al., 2022), C8H18O4S (L4, Blair et al., 2017), both linked to SOA from traffic emissions or BSOA. These last include both polar compounds like C5H8O7S (L4, SOA from isoprene and SO2, Claeys and Maenhaut, 2021) or C4H6O7S (L4, SOA from isoprene and SO2, Lin et al., 2022), as well as larger compounds that were retained more effectively by the chromatographic column, such as C10H17NO7S (L4, Surratt et al., 2008). The temporal pattern of these wintertime S-containing compounds suggests the importance of the co-presence of their biogenic precursors and high NOx concentrations. At the SKI site, wintertime S-containing compounds are equally distributed between SKI-BBOA/TrOA and the second cluster with a winter temporal pattern (Fig. S17). We observed a moderate correlation with inorganic nitrate (R2= 0.541) and ammonium (R2= 0.415) ion concentrations, known for their significant contribution to PM2.5 during winter months in the Po Valley (Ferrero et al., 2019), EC (R2= 0.669, 0.524) and benzene (R2= 0.515). On the other hand, the cluster fingerprint clearly shows a strong contribution of nitro-aromatics compounds, such as nitrophenol and nitrocatechol, indicating a probable combustion source (BB) contributing to OA with reaction products sensitive to the same air conditions for ammonium nitrate gas-to-particle partitioning, and OC concentrations (R2= 0.681). Because of the strong presence of nitro-aromatics, we labeled this cluster “SKI-Nitro Aromatics”. Within this cluster, 11 P-containing compounds significantly contribute to the CHOP family's nTSI, as shown in Fig. 1. Among these, C6H15O4P, C2H7O4P, and C4H11O4P, show the highest nSI. The molecular formulae match with triethylphosphate, used as a flame retardant and as an additive in plant protection formulations, dimethylphosphate, and diethyl hydrogen phosphate, likely degradation products of other organophosphates (Liu et al., 2021). The third wintertime cluster detected at SKI (Fig. S16) contains many compounds assigned to “MI-Other combustion”. This SKI cluster primarily consist of NOCs (approximately 90 % of the features), mainly detected in positive ionization mode. This suggests a prevalence of reduced compounds, likely amine-related CHN(+). The Xc values below 2.5 for 65 % (median 2.3) of the features indicate that these compounds are mainly aliphatic. CHNO(+) compounds exhibit low (0.17 ± 0.04) and (1.2 ± 0.4) ratios, consistent with the presence of amino groups and O-containing substituents (average carbon number 8.11 ± 0.57). The peak abundance-weighted average of the nitrogen number in the CHN family is 1.98 ± 0.14. Based on these observations, we labeled this cluster as “SKI-Amines related”. The time series of this cluster reveals certain samples with high nTSI values for all the compounds it contains. This behavior is not observed for compounds in other clusters. The Kendrick mass defect analysis highlights homologous series such as CnH2nN2 (), CnH2n−2N2 (n= 5–13), CnH2nN2 (). These series suggest probable methylation/demethylation processes in their genesis. However, previous studies have shown that the presence of reduced NOCs in the atmosphere can stem from a variety of sources. Murphy et al. (2007) reported that cooking, industrial sources, biomass combustion, and traffic are just a few of the possible sources, emphasizing that livestock activities are the predominant contributors of these compounds. In this context, it is worth to notice that other authors (such as Silva et al., 2008 and Malloy et al., 2009) have demonstrated that the reaction of aliphatic amines with nitrate radicals leads to the formation of imines in the aerosol phase, while Smith et al. (2021) have described the ability of imines to interact with light, suggesting their role as a component of secondary BrC.
3.2.2 Summertime clusters
At both sites we detect highly populated cluster peaking during summertime, with 1487 and 1623 compounds for MI and SKI, respectively, mostly detected in negative mode. The molecular fingerprints of these two clusters (Figs. S11 and S18) are very similar. Summertime clusters are mainly constituted by aliphatic CHO and CHOS compounds, with short carbon chains (peak-abundance weighted average, #C = 6.7 ± 0.7). Interestingly, the values of the averaged carbon number (weighted by the peak area) increase during the summertime more than the averaged oxygen number, leading to lower ratios. Because of this, the average OSc decreases as well in the warmer season. Compared to the other summertime clusters, these clusters exhibit the highest ratio. CHO compounds have ratios ranging from 1 to 2 and ratios between 0.3 and 1.5. The high oxygen atom content (median = 6.0) observed in the S-containing compounds suggests that they are organosulfates. In this regard, many formulae match with ones we found in literature from isoprene oxidation products in presence of sulfuric acid, such as C4H8O7S, C4H8O6S (likely 2-methylglyceric acid organosulfate, L4, Claeys and Maenhaut, 2021), C5H12O7S (SOA from 2-methyltetrol organosulfate, L4, Lin et al., 2022) and C5H10O7S (L4, Nestorowicz et al., 2018), and from monoterpenes like C8H14O7S, C7H12O6S, C10H18O7S (L4, literature within Chen et al., 2018; Jiang et al., 2024). The two clusters include MBTCA (L1), many isomers of C8H14O4, which could be for example caric acid (L4, Gómez-González et al., 2012), SOA from limonene (C7H10O5, L4), β-pinene (C8H14O5) and Δ3-carene (C6H10O2), also found by Thoma et al. (2022) using HESI(−). Based on these indicators, we conclude that the two clusters at MI and SKI represent summertime biogenic SOA (“BSOA”). Alongside the CHO and CHOS compounds, a considerable amount (that are 205 and 104 compounds, which represent 13.8 % and 6.5 % of the total compounds in BSOA cluster for MI and SKI, respectively), even with lower nTSI, are N-containing compounds detected in positive ion mode. Many of these were also listed in Zhang et al. (2023a), and attributed to wood burning (L4). Although the identification level is only 4 (unequivocal molecular formula), we hypothesize that these compounds are rising during summertime from oxidized BBOA. In this season, the oxidative capacity of the atmosphere is enhanced by higher solar radiation, which leads to higher concentrations of oxidants species both during daytime (mainly OH radicals and O3) and nighttime (NO3 radicals). In this regards, due to the 24 h time-resolution, a contribution of both daytime and nighttime oxidation is expected to alter the OA composition. The presence of BBOA during summer has been previously demonstrated (Ferrero et al., 2018, 2021a, b). Indeed, the moderate correlation between NOCs for MI-BSOA and daily average O3 concentration (R2= 0.583) provides an insight of this. This hypothesis is further supported by the dominance of the CHNO(+) family contributing to the nTSI of the second summertime cluster identified at the urban site (Fig. S12). The whole group is mainly populated by compounds detected in positive ion mode and belonging to CHO and CHNO families (329 and 225 features, respectively). Both exhibit higher correlation with daily average O3 (R2= 0.576 and 0.458, respectively) and global radiation (0.434 and 0.381) values in respect to the same families belonging to MI-BSOA (0.414 and 0.366 with O3, 0.212 and 0.190 with the global radiation). While the cluster's ratio is close to the one of MI-BSOA (median 1.63 vs. 1.56, respectively), its ratio is significantly lower (0.37 vs. 0.60), resulting in a lower averaged OSc (−0.9 vs. −0.3). In this cluster we also found many features attributed to biogenic sources, such as C7H10O4, C8H11NO7, C10H15NO9 attributed to SOA from monoterpenes (L4, Finessi et al., 2014; Faxon et al., 2018; Pullinen et al., 2020), and falling in the SKI-BSOA cluster too. However, more than 40 % are features not detected at SKI, of which 70 % are detected in positive mode, like C9H20O4 and C13H24O4, which instead are found in Qi et al. (2019) in a urban site in Zurich and apportioned to cigarette smoke OA and cooking OA, respectively. Because of this strong mix of both biogenic and anthropogenic source assignments, we labeled this cluster as “MI-Summer B/ASOA”. Although terpenes are traditionally considered volatile organic compounds of predominantly biogenic origin, it is well established that fragranced consumer products, including cleaning agents, air fresheners, and personal care products, can contain and emit these compounds (Carslaw and Shaw, 2022; Sarwar et al., 2004; Singer et al., 2006; Steinemann, 2016; McDonald et al., 2018). In parallel, this cluster includes C12H27O4P, corresponding to tributyl phosphate (L4), which does not exhibit a similar seasonal pattern at the rural site. Tributyl phosphate is commonly used as a flame retardant additive, solvent, plasticizer, and antifoaming agent. It has also been reported in aerosol samples collected in indoor environments, such as residential settings and transportation microenvironments (García et al., 2007; He et al., 2018). The co-occurrence of this mixture of compounds suggests a contribution from volatile chemical products (VCPs) and, more broadly, from compounds emitted in indoor environments that undergo transformation and diffusion into the urban atmosphere. In this respect, it noteworthy that recently Zhou et al. (2025) demonstrated that the sources of volatile organic compounds in the atmosphere are rapidly changing showing that indoor environments contribute significantly to the levels of outdoor volatile compounds implying that indoor-to-outdoor emissions significantly contribute to urban VCP levels, rivaling traditional urban sources, e.g., power generation and biomass burning. Supporting the hypothesis of SOA from VCPs, we find in addition 29 compounds attributable to the HOA class of which only 8 were detected at the rural site. The BSOA clusters from both sites share only one HOA compound (C18H29NO3). However, at SKI, 11 out of 17 HOA compounds were unknown at the urban site. Hence, HOAs contribute significantly to the chemical variability between the two locations.
3.2.3 Agriculture and remaining clusters
HCA revealed additional clusters, which do not exhibit a distinct seasonal pattern. At the rural site we identified a cluster, which display a strong increase during the spring season, with a largest values in May. This is mainly due to a group of molecules belonging to CHNO family and that is responsible for the increase in the overall nTSI of this family shown in Fig. 1. Among these we found C12H25NO, which matches with N,N-dimethyl capramide, used as an additive in pesticide formulations (L4, ECHA, 2024), the aforementioned C12H23NO, attributed to n-octyl pyrrolidone, used in products as solvent for pesticides (L4, ECHA, 2024), C9H18N2O, attributed to 1-[[(2R)-oxolan-2-yl]methyl]piperazine (L4), another plant protection agent. By means of standard comparison, we confirmed the presence in SKI samples and the inclusion in this cluster of Metalaxyl (C15H21NO4, L1, fungicide), Prothioconazole (C14H15Cl2N3O, L1, fungicide), Metolachlor (C15H22ClNO2, L1, herbicide), Pyrimethanil (C12H13N3, L1, fungicide), Cyprodinil (C14H15N3, L1, fungicide), Clomazone (C12H14ClNO2, L1, herbicide), Terbuthylazine (C9H16ClN5, L1, herbicide), Dimethenamid (C12H18ClNO2S, L1, herbicide), and Tebuconazole (C16H22ClN3O, L1, fungicide). Although some compounds are from verified biogenic (such as pinic and pinonic acids, L1) or probably from other sources (such as C15H24O4 and C12H23NO, from agricultural residue burning, L4, Zhang et al., 2023a), we labeled this cluster “SKI-Agricultural activities”, pointing out the exclusiveness of many of these features found at SKI. In addition, the cluster fingerprint (Fig. S19) is enriched in S-containing compounds (approximately 14 % of the number of compounds populating SKI-Agricultural activities), of which 34 % are not detected at the urban site. Comparison of the chemical formulas of these S-containing compounds with the results reported by Blair et al. (2017) indicates that approximately 55 % yield a match (L4). Given that Blair et al. (2017) showed that organosulfates can form through the photooxidation of hydrocarbons emitted from diesel and biodiesel in the presence of SO2, the occurrence of organosulfates, such as (L4), exhibiting temporal trends consistent with those of pesticides and other agricultural activities may suggest a contribution from emissions associated with agricultural machinery (e.g., tractors). However, alternative sources and formation pathways cannot be excluded, highlighting the need to expand available libraries, such as the Aerosolomic database, in order to more confidently link compounds to specific sources. Out of a total of 1398 features that make up the cluster SKI-Agricultural activities, as many as 645 features are completely absent at the Milan site, of which more than 64 % are detected in positive mode. At the MI site, we isolated a cluster populated by CHNO compounds only, mainly measured in positive mode. These features show low nTSI variability along the year with the exception of few events, which show an increase in intensity by orders of magnitude. The fingerprint (Fig. S13) displays that the compounds forming this cluster fall in a very small area of the Van Krevelen diagram ( < 0.5 and 1.4 < < 2.1). Moreover, observing the relation between the chromatographic retention time and the molecular mass, we infer that a subset of these features is likely due to dimers from high-NOx terpene oxidation (Thoma et al., 2025). The median #C (16) value is the highest among the clusters found at MI, while the median OSc (−1.3) value is the lowest: this is due to the high amount of HOAs, which account for 39 % of the features which belong to this cluster. Very few formulae match with ones found in literature: some of them were attributed to cigarette smoke and cooking by Qi et al. (2019) and to agriculture residue burning by Zhang et al. (2023a). Finally, due to the area span in the Van Krevelen space, and the ratio above 3 (3.1 ± 1.4, average ± standard deviation), we labeled this cluster “MI-Aliphatic-OrgNO3”. The seventh cluster found in MI exhibits a sharp decrease in nTSI in mid-May 2021, stabilizing at nearly constant levels for the remainder of the year. Compounds detected in positive mode outnumber those detected in negative mode. The cluster fingerprint (Fig. S14) shows compounds mainly populating the Van Krevelen space of aliphatics, with a ratio close to 0.5 and an ratio (for CHNO) of 2.7 ± 0.6, which does not fully restrict the possibilities of N-containing functional groups other than nitrate ester ones. Marker compound matches do not strongly support any hypothesis about the origin of these molecules. We found p-coumaric acid (C9H8O3, L1), which is known to be a product from biomass burning, especially, but not only, from grasses one (Oros et al., 2006). Moreover, C11H22O5 was found in Li et al. (2021) (L4) during oxidation of n-dodecane experiments and C7H13NO2 was detected as m-xylene SOA (L4, Li et al., 2018). Due to the sharp decrease of the nTSI we can speculate that the driving source of this cluster is an anthropogenic activity but no clear hint is found. Thus, we labeled this cluster “Other anthr-OA”.
3.3 Organic aerosol molecular variability between Milan and Schivenoglia
The use of the HCA technique allowed us to characterize cluster of compounds with similar temporal pattern. Between the two sampling sites, similarities and differences in molecular composition of the interpreted clusters are discussed in Sect. 3.2. Their contribution to the annual nTSI is also diverse: winter-peaking clusters in Milan, linked to traffic, biomass burning, and a mix of both, account for about 16.1 %, 10.9 % and 8.1 % to annual nTSI, respectively. At Schivenoglia, mixed traffic and biomass burning sources account for 14.9 %, the cluster linked to biomass burning with ammonium nitrate formation account for 20.2 %, and the third cluster containing aliphatic amines possibly from agricultural reside burning, accounts for 2.6 % to the annual nTSI. The compounds attributed to biogenic-related sources, peaking during summertime, have a higher impact at MI (31.4 %) rather than at SKI (26.4 %): in addition, a fraction of MI-Summer B/ASOA cluster (11.0 %) might also be due to biogenic sources or stem from VCP (e.g. limonene) oxidation. At the urban site, anthropogenic sources have an additional 14.1 % contribution to the annual nTSI due to MI-other anthr-OA cluster, and 2.1 % due to MI-Aliphatic OrgNO3 one, even though no clear attribution is performed. At the rural site, anthropogenic activities linked to agricultural practices are clearly observed and quantified to 27.8 %. Notably, some clusters of MI and SKI show a similar molecular composition. For example, 61 % of compounds clustered in MI-BSOA are in common with SKI-BSOA, and in turn SKI-BSOA shares 56 % of its compounds with MI-BSOA and 12 % with MI-Summer B/ASOA. Both biogenic clusters show a number of compounds that are not classified at the other site: at MI 350 compounds are not detected (or detected in less than 10 % of the analyzed samples) in SKI, whereas a higher amount (436) are observed at the rural site but not at the urban one. This provides a first insight of the molecular variability between the two environments. For SKI, the cluster that contains the largest number of these site-specific compounds is SKI-Agricultural activities (645, i.e. 46 % of compounds falling into it). On the contrary, every cluster found in MI contains a comparable amount of site-specific compounds. The chord chart (adapted from Liu, 2025) in Fig. 4, graphically assists the assessment of the site differences, where the width of the flow-lines is proportional to the number of compounds that are common between the two connected clusters. The chart suggests that combustion sources have a different profile at the rural compared to the urban site. MI-BBOA, MI-TrOA and MI-Other combustion share 45 % (n=412), 19 % (n=175), and 33 % (n=306) compounds only with SKI-BBOA/TrOA, and 11 %, 30 % and 15 % with SKI-Nitro Aromatics, respectively. This leads to a percentage of site-specific combustion-related compounds from this MI clusters of 36 %, 40 %, and 30 % respectively.
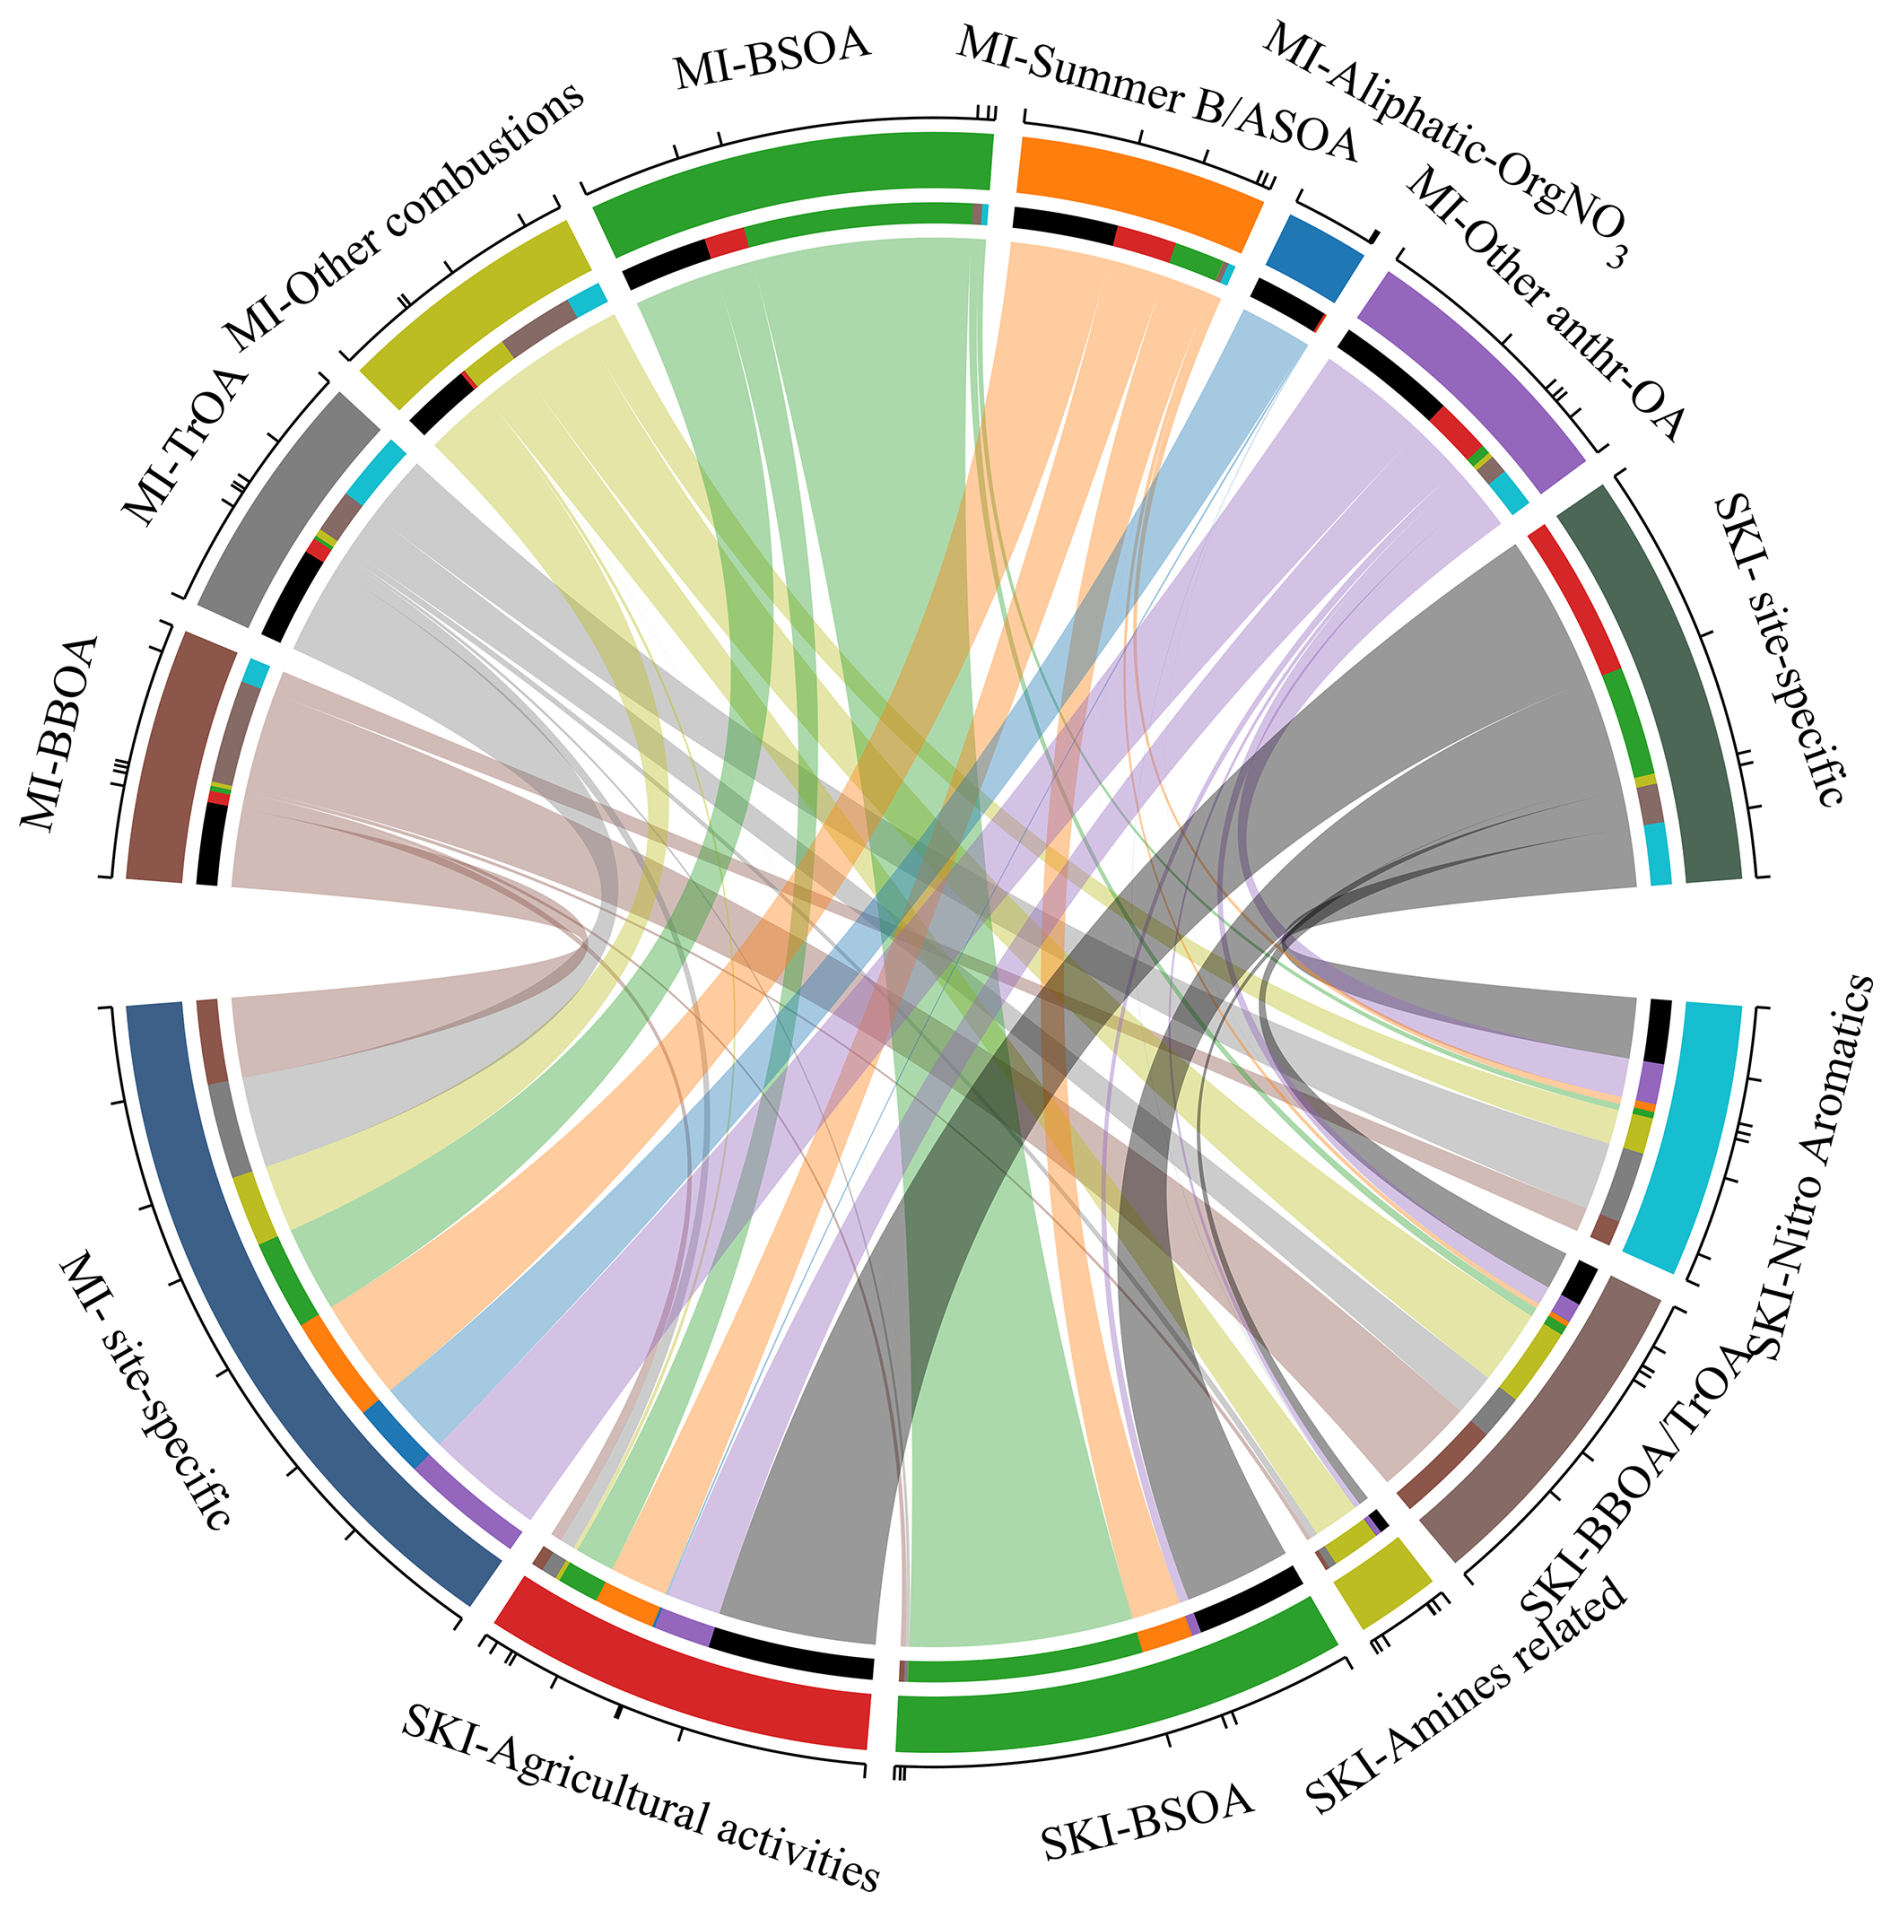
Figure 4Chord chart illustrating, for each cluster, the number of compounds shared between the two sites, as well as the number of cluster-specific compounds unassigned at the other site, which are considered site-specific.
We found a total of 2513 and 1525 compounds that are site-specific for MI and SKI, respectively, confirming the higher molecular-diversity at the urban site. The site-specific fingerprints, shown in Figs. S20 and S21, highlight that the urban site is richer in nonpolar compounds with high molecular mass, and in CHO-containing aromatics. Among aliphatics, N-containing compounds are the most prominent compounds present at the urban site. Figure 5 illustrates the contribution to the monthly nTSI of each cluster at both sites. As expected, during wintertime the nTSI explained by the site-specific compounds (in darker colors) is lower than in the other seasons. The reason is explainable by the lack of both weak oxidant conditions, leading to a longer lifetime of organic molecules, and meteorological events able to abate PM concentrations: as a result, aerosols disperse, mix and age in the lower layers of the troposphere in a vast area of the Po basin. Limiting the discussion on the site-specific features only, during winter in both sampling sites the anthropogenic clusters explain between 10 % and 15 % of the nTSI, whereas site-specific BSOA compounds are almost negligible. On the opposite, from May to September this cluster provides the highest molecular variability at MI in respect of SKI. The rural site, in fact, exhibits site-specific compound profiles predominantly originating from agricultural activities throughout the year, with only modest contributions from the SKI-Nitro-Aromatics cluster in winter and from source SKI-BSOA in summer. Between May and September, both sampling sites exhibit a significant molecular variability, which rises from 15 % to 25 %. It is worth noting that, at both sites, the lowest concentrations of OC were measured in May (2.0 ± 0.6 and 1.6 ± 0.3 µg m−3, Fig. 1). At the same time, the highest plant protection product intensities at the SKI site were detected in May, suggesting that, despite theoretically indicating a reduced health impact that month, the aerosols could have a non-negligible toxicological effect during that period at SKI. Simultaneously, the MI-Summer B/ASOA cluster, predominantly composed of compounds detected in positive mode, with a significant fraction unknown at the SKI site, shows its highest contribution to nTSI (7 % accounting for site-specifice compounds only) once again in May. These results highlight the need to assess the health effects of aerosols not only based on the mass quantification metrics but also, and perhaps most importantly, based on chemical composition and evaluate health effects of emissions from agricultural practices.
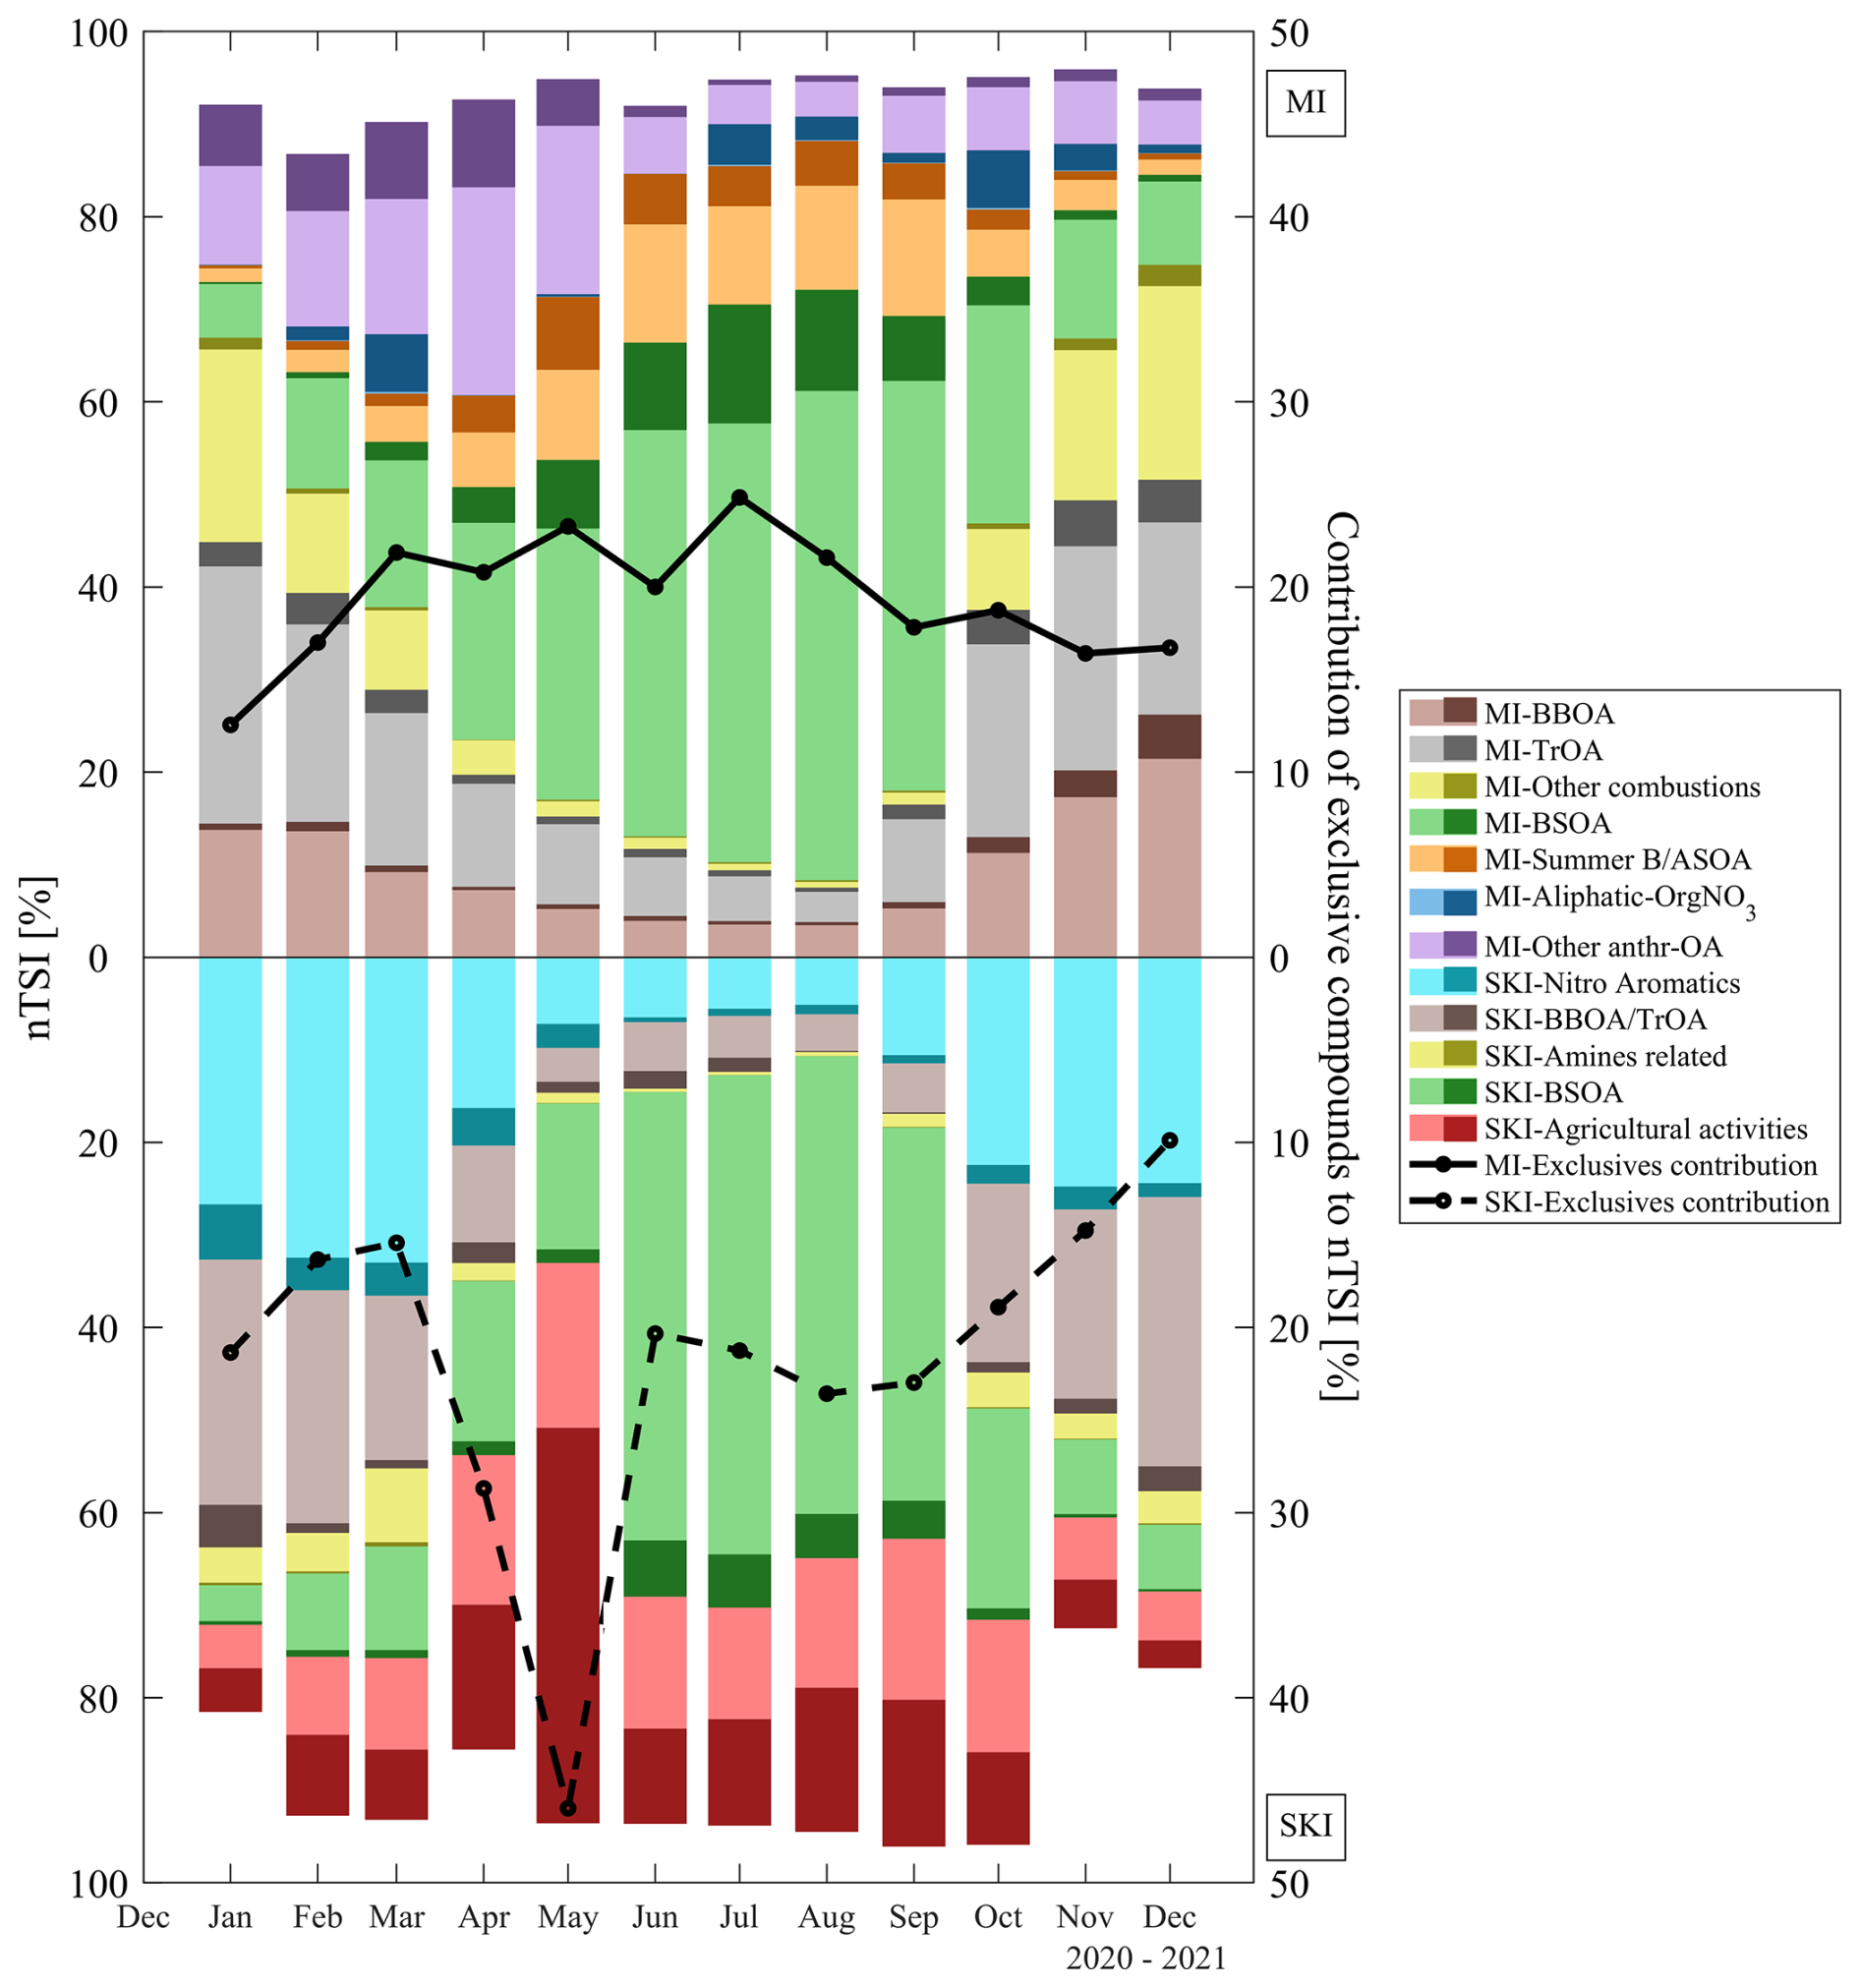
Figure 5Contribution to the normalized total signal intensity (nTSI) of the classified compounds divided by cluster attribution. Darker colors represent the fraction of site-specific features of each cluster.
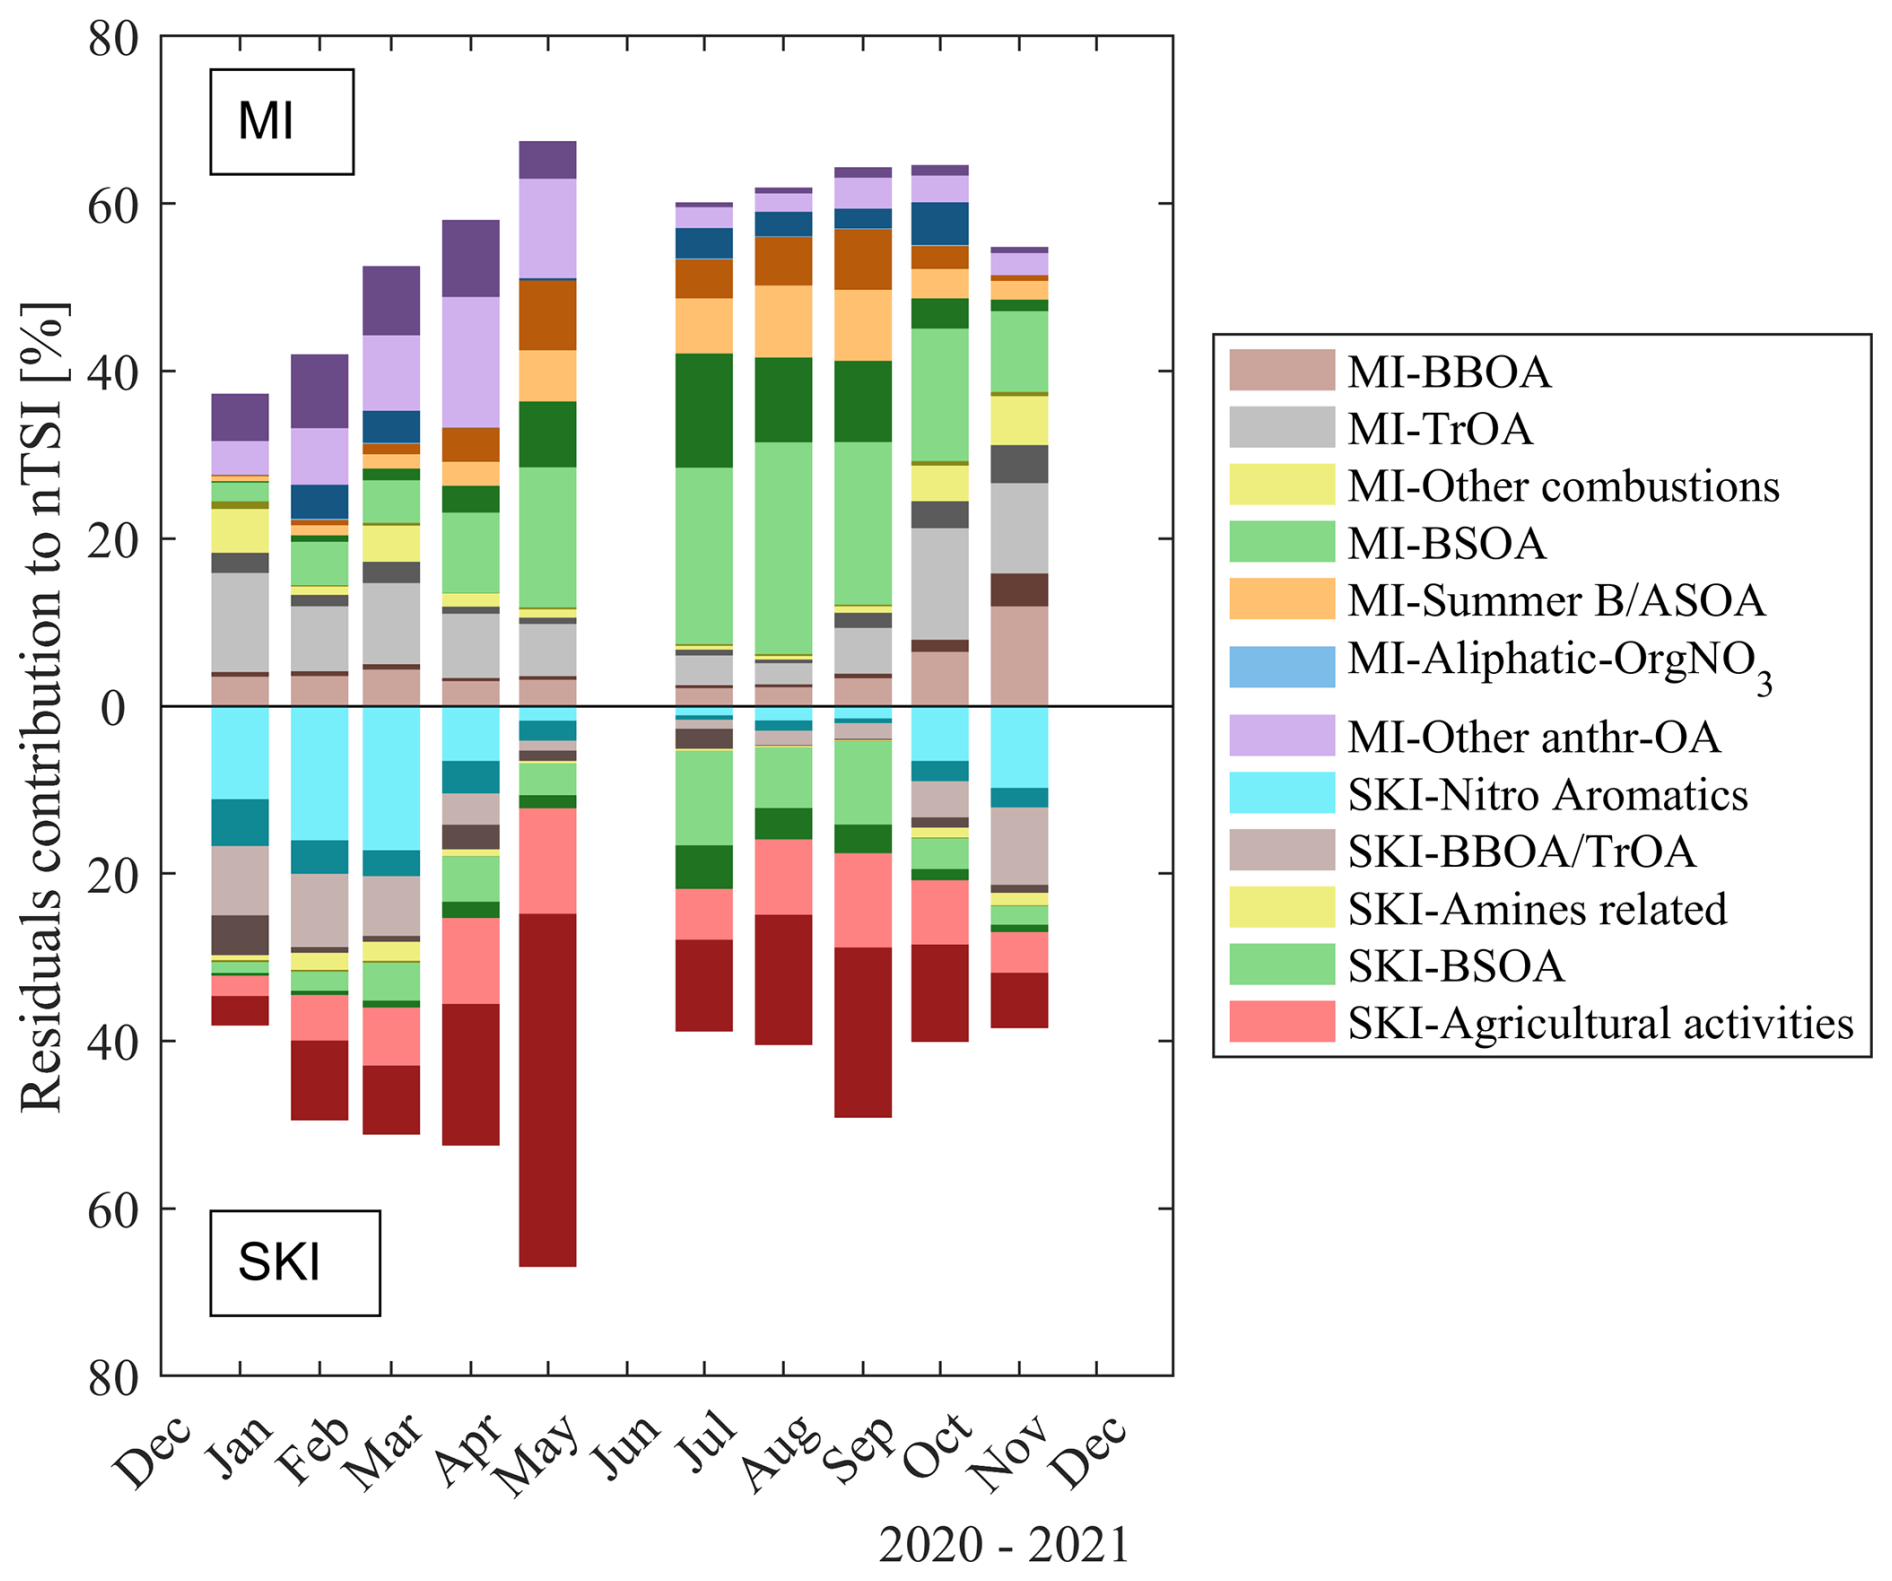
Figure 6Cluster attribution of the contributions to the nTSI from residuals, limited to pairs of samples that show similar OC concentrations and OC contribution to PM2.5. Darker colors indicate the fractional contribution from compounds that are site-specific to each sample.
Finally, we select sample pairs with similar OC concentrations (within a tolerance of 2.0 µg m−3) and contribution to PM2.5 concentration (within a tolerance of 5 %) collected on the same day at both sites (hereinafter referred as “similar samples”). Considering the full year, 116 sample pairs meet this criterion, although they are unevenly distributed over time (Fig. S22). In particular, the number of pairs is the lowest in June (#5), September (#1), and December (#1). When restricting the analysis to the subset of filters used in this study, the number of valid pairs decreases to 54, and no pairs meet the above criterion in June and December. Consequently, these months are not represented in the figures showing similar sample pairs (Figs. 6 and 8). These conditions lead us to select 54 sample pairs across all months but June and December 2021. The differences of the nSI highlight the dissimilarities between sample pairs of similar OC concentrations. Once again, we take advantage from the HCA performed (Sect. 3.2) and classify the enrichment in compounds based on their source attribution. The bar chart in Fig. 6 shows the compound membership clusters with residuals, averaged on a monthly scale, favorable to MI (upper semi-axis) or SKI (lower semi-axis) for the selected samples as contribution to nTSI (see Sect. S1.2, “Residuals contribution calculation”). Both semi-axes are plotted as absolute values to display only the magnitude of the residuals. At MI site, the molecular variability is mostly due to compounds detected at both sites (lighter colors) for the majority of the sources with a seasonal pattern. The residuals of common compounds contribute about 38 ± 7 % to nTSI (reported as an annual average), whereas the residuals of site-specific compounds contribute 18 ± 5 %. At SKI residual contributions of common compounds account to 26 ± 6 %, slightly higher than for site-specific ones (21 ± 11 %). In particular, Fig. 6 shows that the agricultural activities drive both the site-specific features and the high residual contributions. Moreover, the highest differences are observed in May, when the OC concentrations are the lowest. This reinforces the assertion that the sources at the two sites have distinct emission profiles and formation pathways.
In the initial dataset, we found 4370 compounds with ranging between 0.5 and 0.9 (Fig. 2), of which 1551 and 1247 were classified for MI and SKI, respectively, using HCA. Among these, we detect C8H7NO5 attributed to 3-methoxy-4-nitrobenzoic acid (L4, Li et al., 2020a), C7H6O2, attributed to benzoic acid or p-hydroxybenzalehyde (L4, Worton et al., 2011), p-coumaric acid, nitrophenol, nitrocatechol, acetosyringone (L4), phtalic acid, C10H10O3 assigned to coniferyl aldehyde (L4, Oros et al., 2006 and Huang et al., 2022), C6H6N2O3 attributed to amino-nitrophenol (L4, literature within Huang et al., 2025), C6H3N3O7 attributed to picric acid (L4, Lin et al., 2015), C8H6N2O2, likely nitroindole (L4). Potential BrC compounds are listed as Additional data (Table A2) together with their cluster attributions and the average percentage contribution to nTSI. The fingerprints of the classified BrC features at MI and SKI are shown in Figs. S23 and S24. The contribution of classified BrC-related compound to nTSI accounts for about 6 % at both sites during summer and increases up to 38 % during winter, with an annual average of 14 % at MI and 13 % at SKI, respectively. Most of BrC-related compounds fall into combustion clusters (Fig. S25): at the urban site, we observe that all BrC-combustive clusters exhibit a stronger contribution during wintertime, with the highest one due to the MI-Other combustion cluster, which is mainly populated by aliphatic-CHNO and CHN(+) compounds. MI-TrOA cluster seems to have less impact compared to MI-BBOA, which still shows the greatest contribution for combustion sources during the summer months. At the rural site, however, the largest contribution comes from the “SKI-NitroAromatics” cluster, which is also linked to combustion but, unlike at MI site, appears to have an increasing impact on nTSI until early spring. Here too, SKI-BBOA/TrOA contributes to the presence of potentially BrC compounds throughout the year, though with a smaller contribution relative to nTSI when compared to the role of the respective clusters found at MI. Considering the 54 sample pairs with very similar OC concentrations and contributions to PM2.5 mass (Sect. 3.2.3), Fig. 7 present nested annular plots illustrating the residual contributions of all (outer circle) and BrC-related compounds only (inner circle), averaged over the entire year. The plots confirm, as expected, that combustion sources are the dominant contributors to the annual variability of BrC, accounting for nearly 75 % of the residual contributions at both sites. However, the average contribution of site-specific BrC-related compounds is notably lower but still relevant: they constitute 23 % of the residuals at the urban site, compared to 16 % at the rural site. During the year the residual contribution of the clusters to nTSI does not vary substantially (between 2 % and 9 % for all classified BrC-related compounds, as shown in Fig. 8, secondary vertical axis) at both sites, even with a seasonality. However, because differences are observed both in abundance (residuals are not null) and in the molecular species present, a different interaction with light can be hypothesized, even under similar OC concentration conditions.
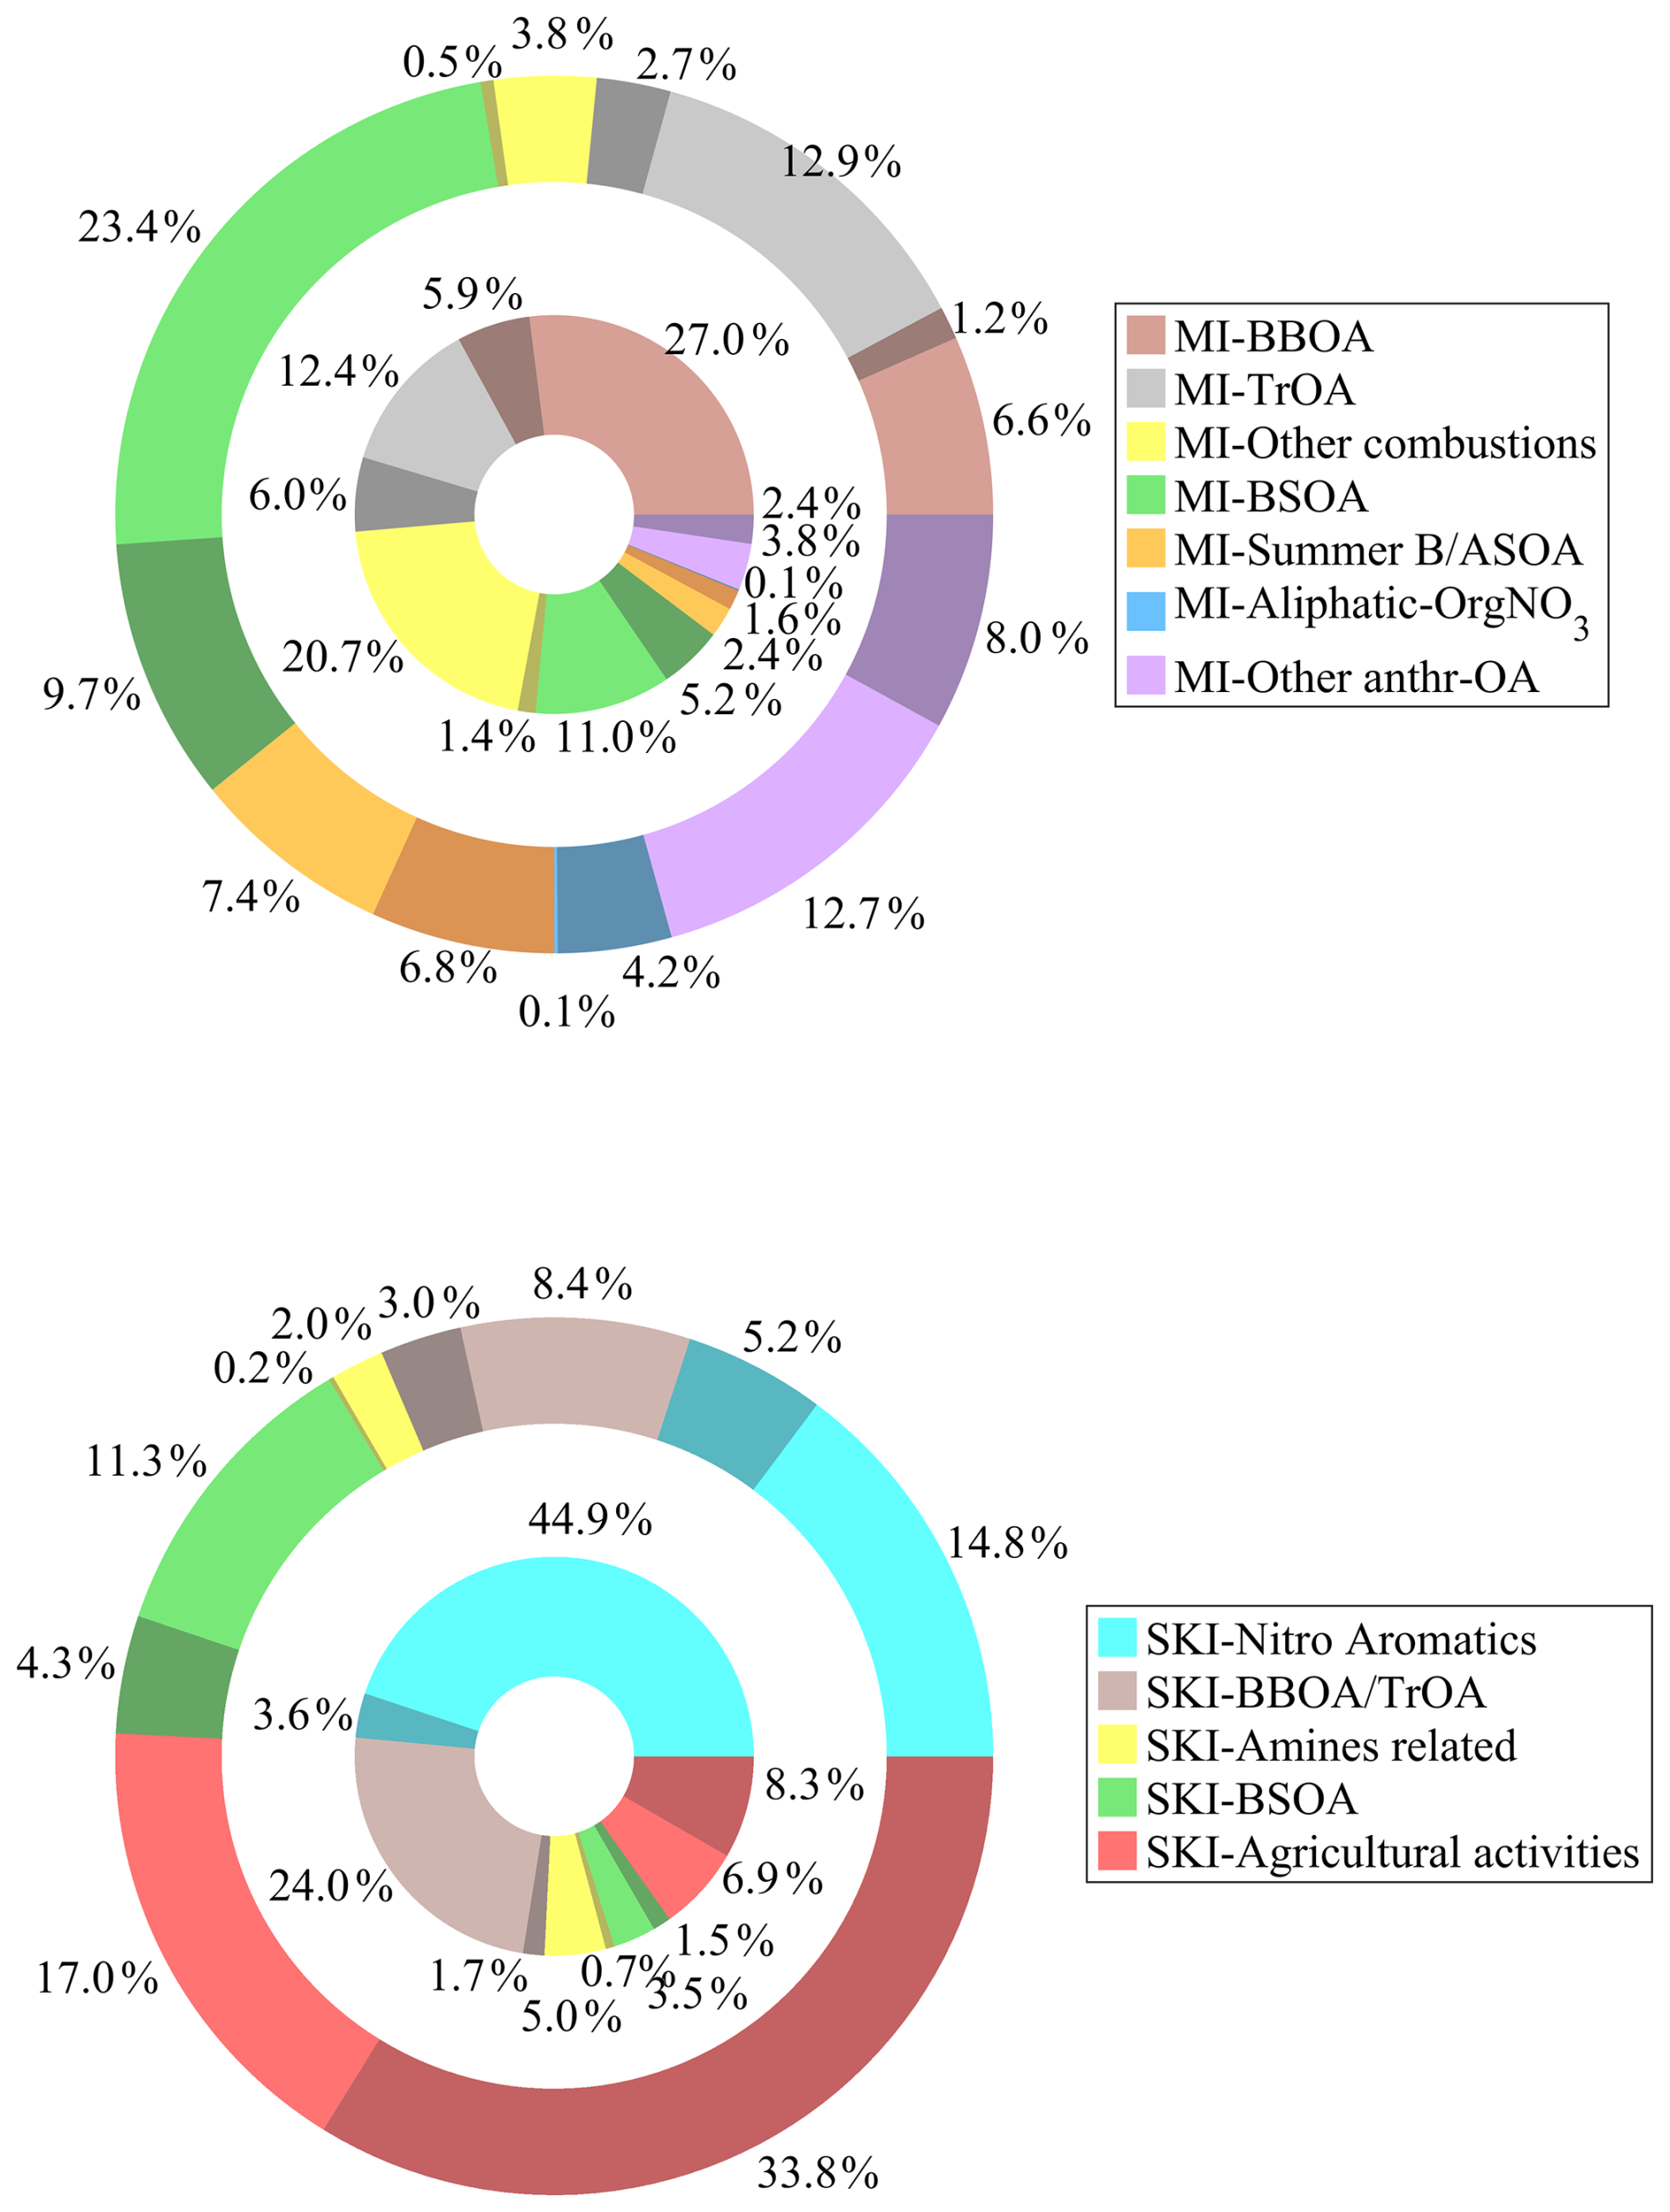
Figure 7Residuals calculated on samples with similar OC concentrations and contributions to PM2.5 for MI (upper plot) and SKI (lower plot). The outer circle illustrates the distribution of annual average residuals across all compounds attributed to sources identified at the reference site. In contrast, the inner circle focuses on the same distribution but is limited to compounds potentially classified as LAA. Darker shades highlight the contribution of the site-specific compounds.
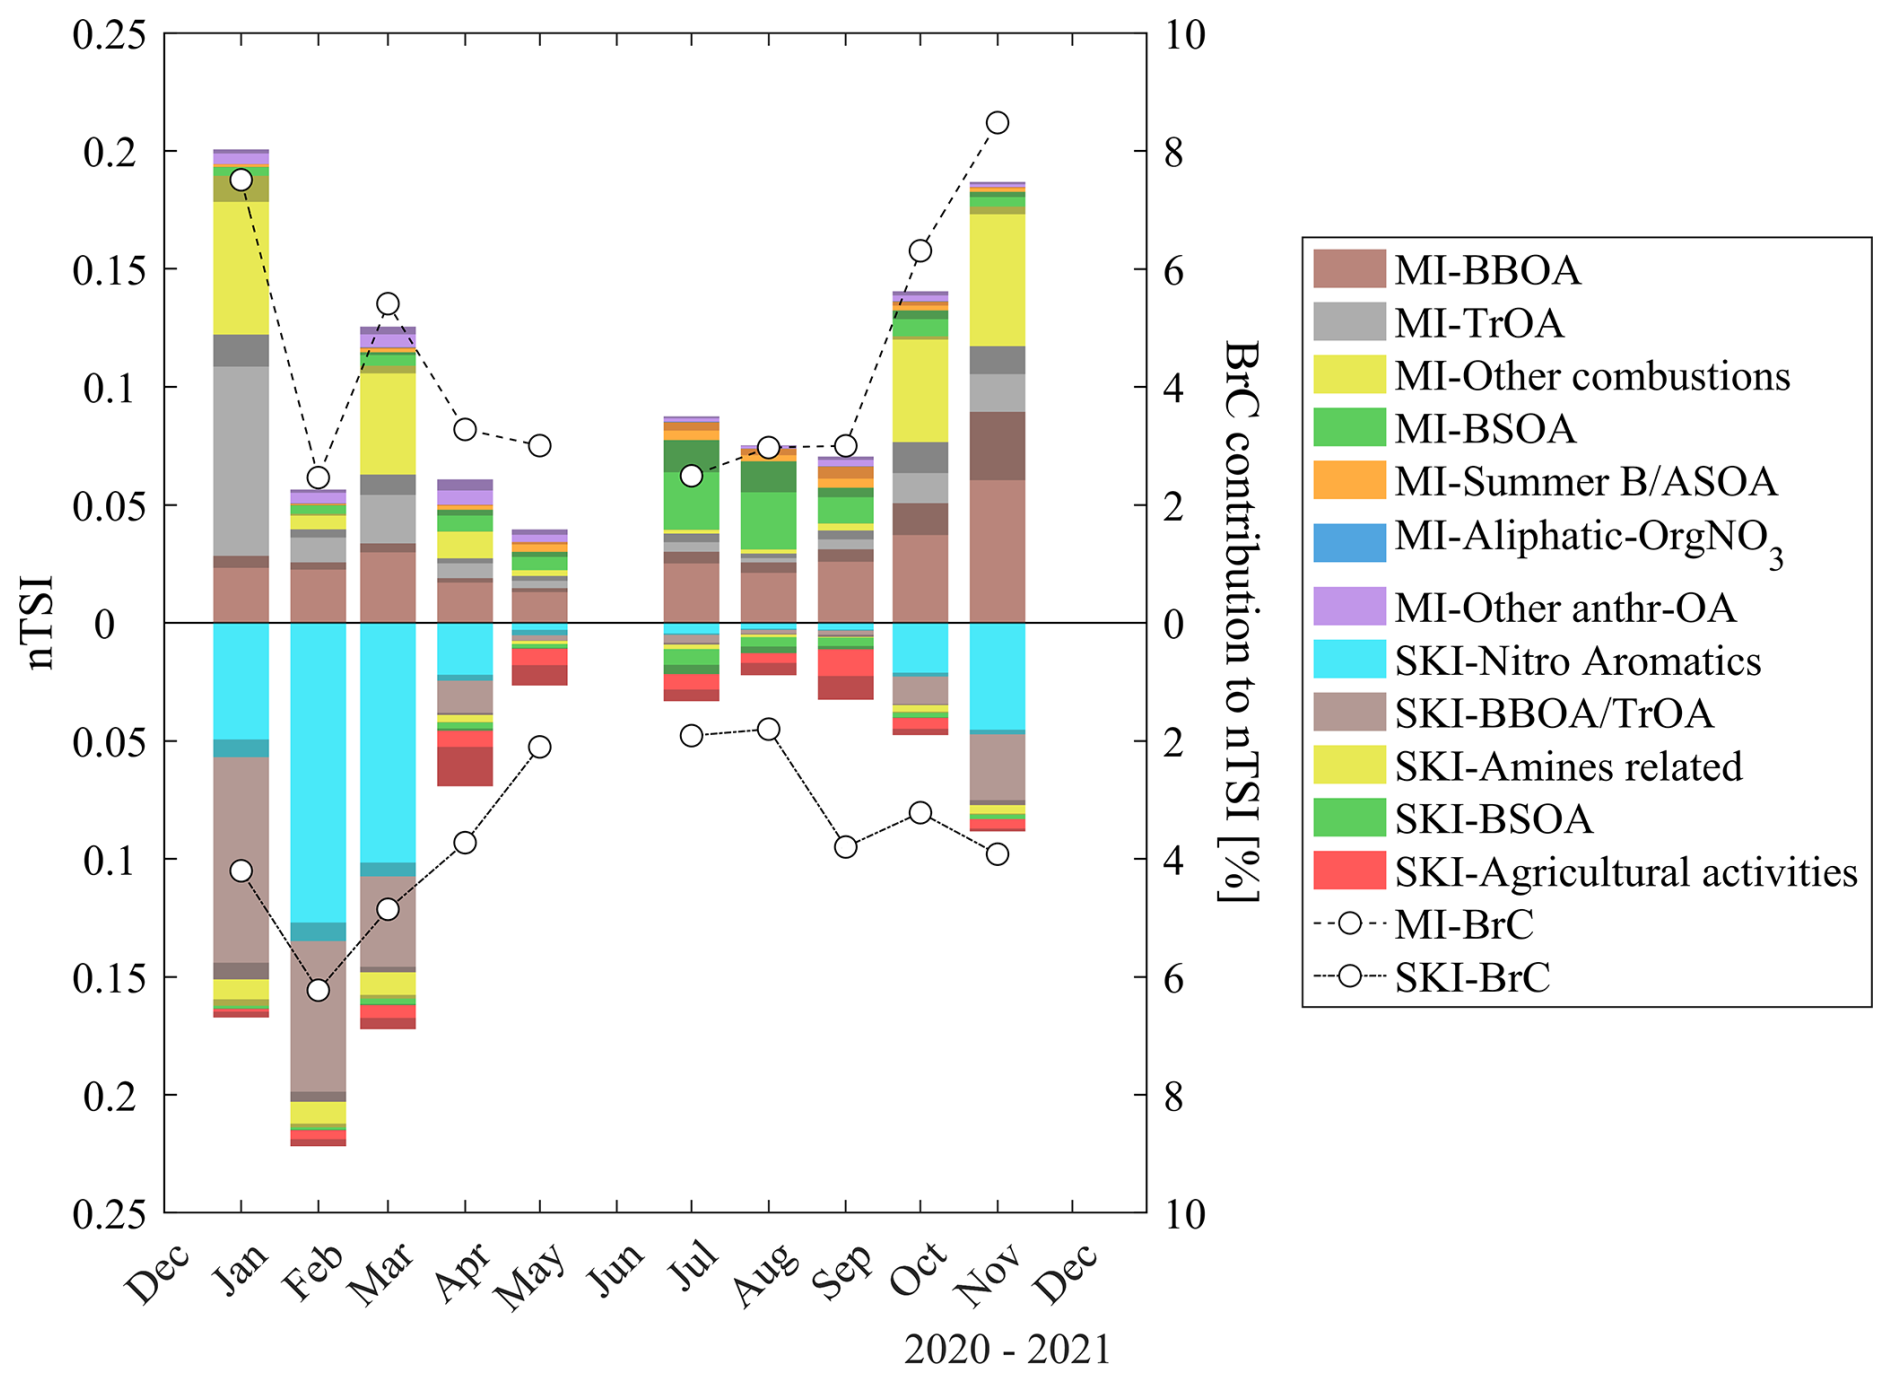
Figure 8BrC residuals at MI (top) and SKI (bottom) for samples with similar OC concentrations and contribution to PM2.5. Darker colors highlight site-specific BrC features. The secondary vertical axes show the monthly averaged contribution of the residual BrC-related compounds to the nTSI of the selected samples.
In this regards, the AAE of eight sample pairs collected at MI and SKI sites provides an insight of this (Fig. S26). For the majority of samples, the AAEs estimated for MI samples were higher than those collected at SKI: the median absolute differences were 1.40, 0.23, and 1.22 in the 230–250, 250–400, and 400–650 nm ranges, respectively, with absolute maximum up to 4.90. Although more measurements are needed, these results confirm that, even with a low OC concentration variability, the molecular differences between two sites lead to a different light-absorption behavior.
This study explores the chemical variability of organic aerosol in a European hotspot for air quality, such as the Po Valley. Historical data indicate that PM2.5 and OC concentrations are often similar across sampling sites, suggesting little variability in aerosol composition. To test this, PM2.5 samples collected in 2021 at a rural agricultural and an urban background site were analyzed. Using a hierarchical clustering approach on UHPLC-HESI-UHRMS data, compounds were grouped by known source markers and temporal patterns. At the urban site (Milan), seven clusters emerge: three peak in winter (linked to traffic combustion, biomass burning, and a mix of both), two in summer (one due to biogenic secondary organic compounds, the other made of biogenic and anthropogenic). The remaining two clusters without a clear seasonal trend likely represent unidentified anthropogenic activities. At the agricultural site (Schivenoglia), five clusters are identified, three of which peak in winter. One correlates with soluble potassium, levoglucosan, benzene, and NO2, suggesting combustion sources; another links biomass burning with ammonium nitrate formation, and the third contains aliphatic amines possibly from agricultural residue burning. A biogenic SOA cluster peaks as expected during summer, and one cluster clearly emerges in late spring tied to agricultural activities, as its main compounds are plant protection products. Focusing only on site-specific compounds of each site, the molecular richness of the urban site amounts to about 38 % of the total classified features, contributing between 11 % and 23 % to the nTSI on monthly basis. The agricultural site is characterized by 27 % site-specific features, contributing between 7 % and 23 % to the nTSI, with a peak of up to 55 % in May due to molecules associated with plant protection products. At both sites, the lowest contribution from molecular variability is observed in the winter months, suggesting that poor ventilation of the basin due to meteorological conditions results in a more homogeneous Po Valley during this season. The results indicate that, while the two sites may appear quantitatively similar, they exhibit significant qualitative differences. Although limitations in the analytical approach may influence the findings, the observed variability suggests that it could distinctly affect both the toxicity of organic aerosols and their interactions with radiation. In this regards, we demonstrate that PM2.5 extracts have significant spectral behavior differences. This work encourages the aerosol research community to deepen the molecular-level understanding of organic aerosols and to identify relationships with larger-scale effects, thereby guiding policy makers toward the adoption of more effective measures. Finally, the use of high-resolution and high-accuracy mass spectrometry enables the detection and identification of specific compounds based on targeted hypotheses and data contextualization. This approach allowed us to identify the contributions of certain sources, such as agricultural activities, which are often overlooked in traditional source apportionment methods. Although our analysis cannot be quantitative, it provides a more refined understanding of the contributions of various anthropogenic sources.
The data in the graphs, as well as the molecular formulas attributed to each cluster and related to BrC, are available on Zenodo (https://doi.org/10.5281/zenodo.19858542, D'Angelo, 2026). Data are available upon request to the corresponding authors.
The supplement related to this article is available online at https://doi.org/10.5194/acp-26-6799-2026-supplement.
LD analyzed the filters by HPLC-HESI-HRMS and PDA, performed the data analysis, interpreted the results, and drafted the paper. ALV, FU, JM, LF provided suggestions for data analysis, interpretation, and discussion and edited the manuscript. EC analyzed the filters by thermo-optical instrument and ion chromatography. CC, EC, BB, UD gave general advices and comments for this paper.
The contact author has declared that none of the authors has any competing interests.
Publisher's note: Copernicus Publications remains neutral with regard to jurisdictional claims made in the text, published maps, institutional affiliations, or any other geographical representation in this paper. The authors bear the ultimate responsibility for providing appropriate place names. Views expressed in the text are those of the authors and do not necessarily reflect the views of the publisher.
The authors thank the staff at ARPA Lombardia for providing the aerosol samples. We thank Georg Menzel for filter extraction laboratory work.
This research has been supported by the Deutsche Forschungsgemeinschaft (grant no. 410009325).
This open-access publication was funded by Goethe University Frankfurt.
This paper was edited by Benjamin A Nault and reviewed by two anonymous referees.
Adams, P. J., Seinfeld, J. H., Koch, D., Mickley, L., and Jacob, D.: General circulation model assessment of direct radiative forcing by the sulfate‐nitrate‐ammonium‐water inorganic aerosol system, J. Geophys. Res.-Atmos., 106, 1097–1111, https://doi.org/10.1029/2000JD900512, 2001. a
Ailshire, J., Karraker, A., and Clarke, P.: Neighborhood social stressors, fine particulate matter air pollution, and cognitive function among older U.S. adults, Soc. Sci. Med., 172, 56–63, https://doi.org/10.1016/j.socscimed.2016.11.019, 2017. a
Al-Naiema, I. M. and Stone, E. A.: Evaluation of anthropogenic secondary organic aerosol tracers from aromatic hydrocarbons, Atmos. Chem. Phys., 17, 2053–2065, https://doi.org/10.5194/acp-17-2053-2017, 2017. a, b, c
Al-Naiema, I. M., Offenberg, J. H., Madler, C. J., Lewandowski, M., Kettler, J., Fang, T., and Stone, E. A.: Secondary organic aerosols from aromatic hydrocarbons and their contribution to fine particulate matter in Atlanta, Georgia, Atmos. Environ., 223, 117227, https://doi.org/10.1016/j.atmosenv.2019.117227, 2020. a
Baronetti, A., González‐Hidalgo, J. C., Vicente‐Serrano, S. M., Acquaotta, F., and Fratianni, S.: A weekly spatio‐temporal distribution of drought events over the Po Plain (North Italy) in the last five decades, Int. J. Climatol., 40, 4463–4476, https://doi.org/10.1002/joc.6467, 2020. a
Basla, B., Agresti, V., Balzarini, A., Giani, P., Pirovano, G., Gilardoni, S., Paglione, M., Colombi, C., Belis, C. A., Poluzzi, V., Scotto, F., and Lonati, G.: Simulations of Organic Aerosol with CAMx over the Po Valley during the Summer Season, Atmosphere, 13, 1996, https://doi.org/10.3390/atmos13121996, 2022. a
Bell, M. L. and Ebisu, K.: Environmental Inequality in Exposures to Airborne Particulate Matter Components in the United States, Environ. Health Persp., 120, 1699–1704, https://doi.org/10.1289/ehp.1205201, 2012. a
Bernardoni, V., Calzolai, G., Chiari, M., Fedi, M., Lucarelli, F., Nava, S., Piazzalunga, A., Riccobono, F., Taccetti, F., Valli, G., and Vecchi, R.: Radiocarbon analysis on organic and elemental carbon in aerosol samples and source apportionment at an urban site in Northern Italy, J. Aerosol Sci., 56, 88–99, https://doi.org/10.1016/j.jaerosci.2012.06.001, 2013. a
Bigi, A. and Ghermandi, G.: Trends and variability of atmospheric PM2.5 and PM10–2.5 concentration in the Po Valley, Italy, Atmos. Chem. Phys., 16, 15777–15788, https://doi.org/10.5194/acp-16-15777-2016, 2016. a
Blair, S. L., MacMillan, A. C., Drozd, G. T., Goldstein, A. H., Chu, R. K., Paša-Tolić, L., Shaw, J. B., Tolić, N., Lin, P., Laskin, J., Laskin, A., and Nizkorodov, S. A.: Molecular Characterization of Organosulfur Compounds in Biodiesel and Diesel Fuel Secondary Organic Aerosol, Environ. Sci. Technol., 51, 119–127, https://doi.org/10.1021/acs.est.6b03304, 2017. a, b, c
Bluvshtein, N., Lin, P., Flores, J. M., Segev, L., Mazar, Y., Tas, E., Snider, G., Weagle, C., Brown, S. S., Laskin, A., and Rudich, Y.: Broadband optical properties of biomass‐burning aerosol and identification of brown carbon chromophores, J. Geophys. Res.-Atmos., 122, 5441–5456, https://doi.org/10.1002/2016jd026230, 2017. a
Breuninger, A., Schmidt, A., Ungeheuer, F., Zhou, L., Ma, J., Steimer, S. S., and Vogel, A. L.: Nontargeted Analysis Reveals Organic Compounds That Drive Oxidative Potential in Ambient Particulate Matter, Environ. Sci. Technol., 60, acs.est.5c07847, https://doi.org/10.1021/acs.est.5c07847, 2026. a
Budisulistiorini, S. H., Riva, M., Williams, M., Chen, J., Itoh, M., Surratt, J. D., and Kuwata, M.: Light-Absorbing Brown Carbon Aerosol Constituents from Combustion of Indonesian Peat and Biomass, Environ. Sci. Technol., 51, 4415–4423, https://doi.org/10.1021/acs.est.7b00397, 2017. a
Cao, C.-T., Chen, S., and Cao, C.: General Equation to Estimate the Physicochemical Properties of Aliphatic Amines, ACS Omega, 8, 49088–49097, https://doi.org/10.1021/acsomega.3c06992, 2023. a
Carslaw, N. and Shaw, D.: Modification of cleaning product formulations could improve indoor air quality, Indoor Air, 32, https://doi.org/10.1111/ina.13021, 2022. a
Chang, C.-Y., You, R., Armstrong, D., Bandi, A., Cheng, Y.-T., Burkhardt, P. M., Becerra-Dominguez, L., Madison, M. C., Tung, H.-Y., Zeng, Z., Wu, Y., Song, L., Phillips, P. E., Porter, P., Knight, J. M., Putluri, N., Yuan, X., Marcano, D. C., McHugh, E. A., Tour, J. M., Catic, A., Maneix, L., Burt, B. M., Lee, H.-S., Corry, D. B., and Kheradmand, F.: Chronic exposure to carbon black ultrafine particles reprograms macrophage metabolism and accelerates lung cancer, Science Advances, 8, eabq0615, https://doi.org/10.1126/sciadv.abq0615, 2022. a
Chen, L.-W. A., Chow, J. C., Wang, X., Cao, J., Mao, J., and Watson, J. G.: Brownness of Organic Aerosol over the United States: Evidence for Seasonal Biomass Burning and Photobleaching Effects, Environ. Sci. Technol., 55, 8561–8572, https://doi.org/10.1021/acs.est.0c08706, 2021. a
Chen, S.-Y., Wu, C.-F., Wu, C., Chan, C.-C., Hwang, J.-S., and Su, T.-C.: Urban Fine Particulate Matter and Elements Associated with Subclinical Atherosclerosis in Adolescents and Young Adults, Environ. Sci. Technol., 56, 7266–7274, https://doi.org/10.1021/acs.est.1c06347, 2022. a
Chen, X., Xie, M., Hays, M. D., Edgerton, E., Schwede, D., and Walker, J. T.: Characterization of organic nitrogen in aerosols at a forest site in the southern Appalachian Mountains, Atmos. Chem. Phys., 18, 6829–6846, https://doi.org/10.5194/acp-18-6829-2018, 2018. a
Chen, Y., Takeuchi, M., Nah, T., Xu, L., Canagaratna, M. R., Stark, H., Baumann, K., Canonaco, F., Prévôt, A. S. H., Huey, L. G., Weber, R. J., and Ng, N. L.: Chemical characterization of secondary organic aerosol at a rural site in the southeastern US: insights from simultaneous high-resolution time-of-flight aerosol mass spectrometer (HR-ToF-AMS) and FIGAERO chemical ionization mass spectrometer (CIMS) measurements, Atmos. Chem. Phys., 20, 8421–8440, https://doi.org/10.5194/acp-20-8421-2020, 2020. a
Cheng, X., Chen, Q., Jie Li, Y., Zheng, Y., Liao, K., and Huang, G.: Highly oxygenated organic molecules produced by the oxidation of benzene and toluene in a wide range of OH exposure and NOx conditions, Atmos. Chem. Phys., 21, 12005–12019, https://doi.org/10.5194/acp-21-12005-2021, 2021. a
Claeys, M. and Maenhaut, W.: Secondary Organic Aerosol Formation from Isoprene: Selected Research, Historic Account and State of the Art, Atmosphere, 12, 728, https://doi.org/10.3390/atmos12060728, 2021. a, b
Colombi, C., D’Angelo, L., Biffi, B., Cuccia, E., Dal Santo, U., and Lanzani, G.: Monitoring ammonia concentrations in more than 10 stations in the Po Valley for the period 2007–2022 in relation to the evolution of different sources, Frontiers in Environmental Health, 3, 1249457, https://doi.org/10.3389/fenvh.2024.1249457, 2024. a, b, c
Costabile, F., Gilardoni, S., Barnaba, F., Di Ianni, A., Di Liberto, L., Dionisi, D., Manigrasso, M., Paglione, M., Poluzzi, V., Rinaldi, M., Facchini, M. C., and Gobbi, G. P.: Characteristics of brown carbon in the urban Po Valley atmosphere, Atmos. Chem. Phys., 17, 313–326, https://doi.org/10.5194/acp-17-313-2017, 2017. a
Daellenbach, K., Manousakas, M., Jiang, J., Cui, T., Chen, Y., El Haddad, I., Fermo, P., Colombi, C., and Prévôt, A.: Organic aerosol sources in the Milan metropolitan area – Receptor modelling based on field observations and air quality modelling, Atmos. Environ., 307, 119799, https://doi.org/10.1016/j.atmosenv.2023.119799, 2023. a, b, c
Dall’Osto, M., Paglione, M., Decesari, S., Facchini, M. C., O’Dowd, C., Plass-Duellmer, C., and Harrison, R. M.: On the Origin of AMS “Cooking Organic Aerosol” at a Rural Site, Environ. Sci. Technol., 49, 13964–13972, https://doi.org/10.1021/acs.est.5b02922, 2015. a
D'Angelo, L.: Dataset of D'Angelo et al.: “Contrasting organic aerosol molecular composition between the urban and agricultural environment of the Po Valley”, Zenodo [data set], https://doi.org/10.5281/zenodo.19858542, 2026. a
Decesari, S., Allan, J., Plass-Duelmer, C., Williams, B. J., Paglione, M., Facchini, M. C., O'Dowd, C., Harrison, R. M., Gietl, J. K., Coe, H., Giulianelli, L., Gobbi, G. P., Lanconelli, C., Carbone, C., Worsnop, D., Lambe, A. T., Ahern, A. T., Moretti, F., Tagliavini, E., Elste, T., Gilge, S., Zhang, Y., and Dall'Osto, M.: Measurements of the aerosol chemical composition and mixing state in the Po Valley using multiple spectroscopic techniques, Atmos. Chem. Phys., 14, 12109–12132, https://doi.org/10.5194/acp-14-12109-2014, 2014. a, b
Deshmukh, D. K., Kawamura, K., Lazaar, M., Kunwar, B., and Boreddy, S. K. R.: Dicarboxylic acids, oxoacids, benzoic acid, α-dicarbonyls, WSOC, OC, and ions in spring aerosols from Okinawa Island in the western North Pacific Rim: size distributions and formation processes, Atmos. Chem. Phys., 16, 5263–5282, https://doi.org/10.5194/acp-16-5263-2016, 2016. a
Divisekara, T., Schum, S., and Mazzoleni, L.: Ultrahigh performance LC/FT-MS non-targeted screening for biomass burning organic aerosol with MZmine2 and MFAssignR, Chemosphere, 338, 139403, https://doi.org/10.1016/j.chemosphere.2023.139403, 2023. a, b
Dong, X., Pei, J., and Qu, M.: Organophosphate esters (OPEs) in the air and dust of new vehicle cabins: Concentrations, sources and contributions, Build. Environ., 267, 112188, https://doi.org/10.1016/j.buildenv.2024.112188, 2025. a
Drugé, T., Nabat, P., Mallet, M., and Somot, S.: Model simulation of ammonium and nitrate aerosols distribution in the Euro-Mediterranean region and their radiative and climatic effects over 1979–2016, Atmos. Chem. Phys., 19, 3707–3731, https://doi.org/10.5194/acp-19-3707-2019, 2019. a
Duarte, R. M., Almeida, A. S., Brandão, P. F., and Duarte, A. C.: Advances on analytical strategies for targeted and untargeted profiling of organic aerosols: Lessons learned and future challenges, J. Hazard. Mater., 12, 100375, https://doi.org/10.1016/j.hazadv.2023.100375, 2023. a
ECHA: European Chemical Agency Chemical Database, https://chem.echa.europa.eu/ (last access: 15 June 2024), 2024. a, b
ECHA CHEM database: Information on Chemicals – Registered Substances: N-(n-octyl)-2-pyrrolidinone, European Chemicals Agency, https://chem.echa.europa.eu/100.100.541/overview?searchText=n-octylpyrrolidone (last access: 15 June 2024), 2024a. a
ECHA CHEM database: Information on Chemicals – Registered Substances: 1-[(oxolan-2-yl)methyl]piperazine, European Chemicals Agency, https://chem.echa.europa.eu/100.153.595/identity?searchText=C9H18N2O (last access: 15 June 2024), 2024b. a
Faiz, Y., Siddique, N., He, H., Sun, C., and Waheed, S.: Occurrence and profile of organophosphorus compounds in fine and coarse particulate matter from two urban areas of China and Pakistan, Environ. Pollut., 233, 26–34, https://doi.org/10.1016/j.envpol.2017.09.091, 2018. a
Fann, N., Coffman, E., Timin, B., and Kelly, J. T.: The estimated change in the level and distribution of PM2.5-attributable health impacts in the United States: 2005–2014, Environ. Res., 167, 506–514, https://doi.org/10.1016/j.envres.2018.08.018, 2018. a
Faxon, C., Hammes, J., Le Breton, M., Pathak, R. K., and Hallquist, M.: Characterization of organic nitrate constituents of secondary organic aerosol (SOA) from nitrate-radical-initiated oxidation of limonene using high-resolution chemical ionization mass spectrometry, Atmos. Chem. Phys., 18, 5467–5481, https://doi.org/10.5194/acp-18-5467-2018, 2018. a
Ferrero, L., Riccio, A., Perrone, M., Sangiorgi, G., Ferrini, B., and Bolzacchini, E.: Mixing height determination by tethered balloon-based particle soundings and modeling simulations, Atmos. Res., 102, 145–156, https://doi.org/10.1016/j.atmosres.2011.06.016, 2011. a
Ferrero, L., Cappelletti, D., Moroni, B., Sangiorgi, G., Perrone, M., Crocchianti, S., and Bolzacchini, E.: Wintertime aerosol dynamics and chemical composition across the mixing layer over basin valleys, Atmos. Environ., 56, 143–153, https://doi.org/10.1016/j.atmosenv.2012.03.071, 2012. a
Ferrero, L., Castelli, M., Ferrini, B. S., Moscatelli, M., Perrone, M. G., Sangiorgi, G., D'Angelo, L., Rovelli, G., Moroni, B., Scardazza, F., Močnik, G., Bolzacchini, E., Petitta, M., and Cappelletti, D.: Impact of black carbon aerosol over Italian basin valleys: high-resolution measurements along vertical profiles, radiative forcing and heating rate, Atmos. Chem. Phys., 14, 9641–9664, https://doi.org/10.5194/acp-14-9641-2014, 2014. a
Ferrero, L., Močnik, G., Cogliati, S., Gregorič, A., Colombo, R., and Bolzacchini, E.: Heating Rate of Light Absorbing Aerosols: Time-Resolved Measurements, the Role of Clouds, and Source Identification, Environ. Sci. Technol., 52, 3546–3555, https://doi.org/10.1021/acs.est.7b04320, 2018. a, b
Ferrero, L., Riccio, A., Ferrini, B., D'Angelo, L., Rovelli, G., Casati, M., Angelini, F., Barnaba, F., Gobbi, G., Cataldi, M., and Bolzacchini, E.: Satellite AOD conversion into ground PM10, PM2.5 and PM1 over the Po valley (Milan, Italy) exploiting information on aerosol vertical profiles, chemistry, hygroscopicity and meteorology, Atmos. Pollut. Res., 10, 1895–1912, https://doi.org/10.1016/j.apr.2019.08.003, 2019. a
Ferrero, L., Bernardoni, V., Santagostini, L., Cogliati, S., Soldan, F., Valentini, S., Massabò, D., Močnik, G., Gregorič, A., Rigler, M., Prati, P., Bigogno, A., Losi, N., Valli, G., Vecchi, R., and Bolzacchini, E.: Consistent determination of the heating rate of light-absorbing aerosol using wavelength- and time-dependent Aethalometer multiple-scattering correction, Sci. Total Environ., 791, 148277, https://doi.org/10.1016/j.scitotenv.2021.148277, 2021a. a
Ferrero, L., Gregorič, A., Močnik, G., Rigler, M., Cogliati, S., Barnaba, F., Di Liberto, L., Gobbi, G. P., Losi, N., and Bolzacchini, E.: The impact of cloudiness and cloud type on the atmospheric heating rate of black and brown carbon in the Po Valley, Atmos. Chem. Phys., 21, 4869–4897, https://doi.org/10.5194/acp-21-4869-2021, 2021b. a, b
Finessi, E., Lidster, R. T., Whiting, F., Elliott, T., Alfarra, M. R., McFiggans, G. B., and Hamilton, J. F.: Improving the Quantification of Secondary Organic Aerosol Using a Microflow Reactor Coupled to HPLC-MS and NMR to Manufacture Ad Hoc Calibration Standards, Anal. Chem., 86, 11238–11245, https://doi.org/10.1021/ac5028512, 2014. a
Fleming, L. T., Lin, P., Laskin, A., Laskin, J., Weltman, R., Edwards, R. D., Arora, N. K., Yadav, A., Meinardi, S., Blake, D. R., Pillarisetti, A., Smith, K. R., and Nizkorodov, S. A.: Molecular composition of particulate matter emissions from dung and brushwood burning household cookstoves in Haryana, India, Atmos. Chem. Phys., 18, 2461–2480, https://doi.org/10.5194/acp-18-2461-2018, 2018. a
Fredrickson, C. D., Palm, B. B., Lee, B. H., Zhang, X., Orlando, J. J., Tyndall, G. S., Garofalo, L. A., Pothier, M. A., Farmer, D. K., Decker, Z. C. J., Robinson, M. A., Brown, S. S., Murphy, S. M., Shen, Y., Sullivan, A. P., Schobesberger, S., and Thornton, J. A.: Formation and Evolution of Catechol-Derived SOA Mass, Composition, Volatility, and Light Absorption, ACS Earth and Space Chemistry, 6, 1067–1079, https://doi.org/10.1021/acsearthspacechem.2c00007, 2022. a
García, M., Rodríguez, I., and Cela, R.: Microwave-assisted extraction of organophosphate flame retardants and plasticizers from indoor dust samples, J. Chromatogr. A, 1152, 280–286, https://doi.org/10.1016/j.chroma.2006.11.046, 2007. a
Gilardoni, S., Massoli, P., Paglione, M., Giulianelli, L., Carbone, C., Rinaldi, M., Decesari, S., Sandrini, S., Costabile, F., Gobbi, G. P., Pietrogrande, M. C., Visentin, M., Scotto, F., Fuzzi, S., and Facchini, M. C.: Direct observation of aqueous secondary organic aerosol from biomass-burning emissions, P. Natl. Acad. Sci. USA, 113, 10013–10018, https://doi.org/10.1073/pnas.1602212113, 2016. a
Gilardoni, S., Massoli, P., Marinoni, A., Mazzoleni, C., Freedman, A., Lonati, G., De Iuliis, S., and Gianelle, V.: Spatial and Temporal Variability of Carbonaceous Aerosol Absorption in the Po Valley, Aerosol Air Qual. Res., 20, 2624–2639, https://doi.org/10.4209/aaqr.2020.03.0085, 2020. a, b
Gómez-González, Y., Wang, W., Vermeylen, R., Chi, X., Neirynck, J., Janssens, I. A., Maenhaut, W., and Claeys, M.: Chemical characterisation of atmospheric aerosols during a 2007 summer field campaign at Brasschaat, Belgium: sources and source processes of biogenic secondary organic aerosol, Atmos. Chem. Phys., 12, 125–138, https://doi.org/10.5194/acp-12-125-2012, 2012. a
Gupta, T., Rajeev, P., and Rajput, R.: Emerging Major Role of Organic Aerosols in Explaining the Occurrence, Frequency, and Magnitude of Haze and Fog Episodes during Wintertime in the Indo Gangetic Plain, ACS Omega, 7, 1575–1584, https://doi.org/10.1021/acsomega.1c05467, 2022. a
Harris, M. H., Gold, D. R., Rifas-Shiman, S. L., Melly, S. J., Zanobetti, A., Coull, B. A., Schwartz, J. D., Gryparis, A., Kloog, I., Koutrakis, P., Bellinger, D. C., White, R. F., Sagiv, S. K., and Oken, E.: Prenatal and Childhood Traffic-Related Pollution Exposure and Childhood Cognition in the Project Viva Cohort (Massachusetts, USA), Environ. Health Persp., 123, 1072–1078, https://doi.org/10.1289/ehp.1408803, 2015. a
He, C., Wang, X., Thai, P., Baduel, C., Gallen, C., Banks, A., Bainton, P., English, K., and Mueller, J. F.: Organophosphate and brominated flame retardants in Australian indoor environments: Levels, sources, and preliminary assessment of human exposure, Environ. Pollut., 235, 670–679, https://doi.org/10.1016/j.envpol.2017.12.017, 2018. a
He, F., Yanosky, J. D., Fernandez‐Mendoza, J., Chinchilli, V. M., Al‐Shaar, L., Vgontzas, A. N., Bixler, E. O., and Liao, D.: Acute Impact of Fine Particulate Air Pollution on Cardiac Arrhythmias in a Population‐Based Sample of Adolescents: The Penn State Child Cohort, J. Am. Heart Assoc., 11, e026370, https://doi.org/10.1161/JAHA.122.026370, 2022a. a
He, Q., Li, C., Siemens, K., Morales, A. C., Hettiyadura, A. P. S., Laskin, A., and Rudich, Y.: Optical Properties of Secondary Organic Aerosol Produced by Photooxidation of Naphthalene under NOx Condition, Environ. Sci. Technol., 56, 4816–4827, https://doi.org/10.1021/acs.est.1c07328, 2022b. a
Hildmann, S. and Hoffmann, T.: Characterisation of atmospheric organic aerosols with one- and multidimensional liquid chromatography and mass spectrometry: State of the art and future perspectives, TRAC-Trend. Anal. Chem., 175, 117698, https://doi.org/10.1016/j.trac.2024.117698, 2024. a
Huang, R.-J., Yang, L., Shen, J., Yuan, W., Gong, Y., Ni, H., Duan, J., Yan, J., Huang, H., You, Q., and Li, Y. J.: Chromophoric Fingerprinting of Brown Carbon from Residential Biomass Burning, Environ. Sci. Tech. Let., 9, 102–111, https://doi.org/10.1021/acs.estlett.1c00837, 2022. a
Huang, Y., Li, X., Huang, D. D., Lei, R., Zhou, B., Zhang, Y., and Ge, X.: Machine-learning-assisted chemical characterization and optical properties of atmospheric brown carbon in Nanjing, China, Atmos. Chem. Phys., 25, 7619–7645, https://doi.org/10.5194/acp-25-7619-2025, 2025. a
Ikemori, F., Nishimura, R., Saito, S., Akiyama, M., Yamamoto, S., Iijima, A., and Sugata, S.: Organic Molecular Tracers in PM2.5 at Urban Sites during Spring and Summer in Japan: Impact of Secondary Organic Aerosols on Water-Soluble Organic Carbon, Atmosphere, 12, 579, https://doi.org/10.3390/atmos12050579, 2021. a
Jiang, F., Siemens, K., Linke, C., Li, Y., Gong, Y., Leisner, T., Laskin, A., and Saathoff, H.: Molecular analysis of secondary organic aerosol and brown carbon from the oxidation of indole, Atmos. Chem. Phys., 24, 2639–2649, https://doi.org/10.5194/acp-24-2639-2024, 2024. a, b
Kapoor, T. S., Navinya, C., Apte, A., Shetty, N. J., Lokhande, P., Singh, S., Murthy B. M., S., Deswal, M., Laura, J. S., Muthalagu, A., Qureshi, A., Bhardwaj, A., Sunder Raman, R., Lian, Y., Pandithurai, G., Chaudhary, P., Sinha, B., Rabha, S., Saikia, B. K., Najar, T. A., Jehangir, A., Mukherjee, S., Chatterjee, A., Phuleria, H. C., Chakrabarty, R. K., and Venkataraman, C.: Spatial Distribution in Surface Aerosol Light Absorption Across India, Geophys. Res. Lett., 51, e2024GL110089, https://doi.org/10.1029/2024GL110089, 2024. a
Kawamura, K. and Kaplan, I. R.: Motor exhaust emissions as a primary source for dicarboxylic acids in Los Angeles ambient air, Environ. Sci. Technol., 21, 105–110, https://doi.org/10.1021/es00155a014, 1987. a
Kiendler‐Scharr, A., Mensah, A. A., Friese, E., Topping, D., Nemitz, E., Prevot, A. S. H., Äijälä, M., Allan, J., Canonaco, F., Canagaratna, M., Carbone, S., Crippa, M., Dall Osto, M., Day, D. A., De Carlo, P., Di Marco, C. F., Elbern, H., Eriksson, A., Freney, E., Hao, L., Herrmann, H., Hildebrandt, L., Hillamo, R., Jimenez, J. L., Laaksonen, A., McFiggans, G., Mohr, C., O'Dowd, C., Otjes, R., Ovadnevaite, J., Pandis, S. N., Poulain, L., Schlag, P., Sellegri, K., Swietlicki, E., Tiitta, P., Vermeulen, A., Wahner, A., Worsnop, D., and Wu, H.: Ubiquity of organic nitrates from nighttime chemistry in the European submicron aerosol, Geophys. Res. Lett., 43, 7735–7744, https://doi.org/10.1002/2016GL069239, 2016. a
Kim, S., Chen, J., Cheng, T., Gindulyte, A., He, J., He, S., Li, Q., Shoemaker, B. A., Thiessen, P. A., Yu, B., Zaslavsky, L., Zhang, J., and Bolton, E. E.: PubChem 2025 update, Nucleic Acids Res., 53, D1516–D1525, https://doi.org/10.1093/nar/gkae1059, 2024. a
Kioumourtzoglou, M.-A., Schwartz, J., James, P., Dominici, F., and Zanobetti, A.: PM2.5 and mortality in 207 US cities: Modification by temperature and city characteristics, Epidemiology, https://doi.org/10.1097/EDE.0000000000000422, 2015. a
Kong, X., Salvador, C. M., Carlsson, S., Pathak, R., Davidsson, K. O., Le Breton, M., Gaita, S. M., Mitra, K., Hallquist, . M., Hallquist, M., and Pettersson, J. B.: Molecular characterization and optical properties of primary emissions from a residential wood burning boiler, Sci. Total Environ., 754, 142143, https://doi.org/10.1016/j.scitotenv.2020.142143, 2021. a
Kourtchev, I., Godoi, R. H. M., Connors, S., Levine, J. G., Archibald, A. T., Godoi, A. F. L., Paralovo, S. L., Barbosa, C. G. G., Souza, R. A. F., Manzi, A. O., Seco, R., Sjostedt, S., Park, J.-H., Guenther, A., Kim, S., Smith, J., Martin, S. T., and Kalberer, M.: Molecular composition of organic aerosols in central Amazonia: an ultra-high-resolution mass spectrometry study, Atmos. Chem. Phys., 16, 11899–11913, https://doi.org/10.5194/acp-16-11899-2016, 2016. a
Kroll, J. H., Donahue, N. M., Jimenez, J. L., Kessler, S. H., Canagaratna, M. R., Wilson, K. R., Altieri, K. E., Mazzoleni, L. R., Wozniak, A. S., Bluhm, H., Mysak, E. R., Smith, J. D., Kolb, C. E., and Worsnop, D. R.: Carbon oxidation state as a metric for describing the chemistry of atmospheric organic aerosol, Nat. Chem., 3, 133–139, https://doi.org/10.1038/nchem.948, 2011. a, b
Kumar, V., Giannoukos, S., Haslett, S. L., Tong, Y., Singh, A., Bertrand, A., Lee, C. P., Wang, D. S., Bhattu, D., Stefenelli, G., Dave, J. S., Puthussery, J. V., Qi, L., Vats, P., Rai, P., Casotto, R., Satish, R., Mishra, S., Pospisilova, V., Mohr, C., Bell, D. M., Ganguly, D., Verma, V., Rastogi, N., Baltensperger, U., Tripathi, S. N., Prévôt, A. S. H., and Slowik, J. G.: Highly time-resolved chemical speciation and source apportionment of organic aerosol components in Delhi, India, using extractive electrospray ionization mass spectrometry, Atmos. Chem. Phys., 22, 7739–7761, https://doi.org/10.5194/acp-22-7739-2022, 2022. a
Lao, J.-Y., Lin, H., Qin, X., Ruan, Y., Leung, K. M. Y., Zeng, E. Y., and Lam, P. K. S.: Insights into the Atmospheric Persistence, Transformation, and Health Implications of Organophosphate Esters in Urban Ambient Air, Environ. Sci. Technol., 56, 12003–12013, https://doi.org/10.1021/acs.est.2c01161, 2022. a
Laskin, J., Laskin, A., Nizkorodov, S. A., Roach, P., Eckert, P., Gilles, M. K., Wang, B., Lee, H. J. J., and Hu, Q.: Molecular Selectivity of Brown Carbon Chromophores, Environ. Sci. Technol., 48, 12047–12055, https://doi.org/10.1021/es503432r, 2014. a
Lee, M., Schwartz, J., Wang, Y., Dominici, F., and Zanobetti, A.: Long-term effect of fine particulate matter on hospitalization with dementia, Environ. Pollut., 254, 112926, https://doi.org/10.1016/j.envpol.2019.07.094, 2019. a
Li, C., He, Q., Hettiyadura, A. P. S., Käfer, U., Shmul, G., Meidan, D., Zimmermann, R., Brown, S. S., George, C., Laskin, A., and Rudich, Y.: Formation of Secondary Brown Carbon in Biomass Burning Aerosol Proxies through NO3 Radical Reactions, Environ. Sci. Technol., 54, 1395–1405, https://doi.org/10.1021/acs.est.9b05641, 2020a. a
Li, J., Wang, G., Zhang, Q., Li, J., Wu, C., Jiang, W., Zhu, T., and Zeng, L.: Molecular characteristics and diurnal variations of organic aerosols at a rural site in the North China Plain with implications for the influence of regional biomass burning, Atmos. Chem. Phys., 19, 10481–10496, https://doi.org/10.5194/acp-19-10481-2019, 2019. a
Li, J., Li, H., Li, K., Chen, Y., Zhang, H., Zhang, X., Wu, Z., Liu, Y., Wang, X., Wang, W., and Ge, M.: Enhanced secondary organic aerosol formation from the photo-oxidation of mixed anthropogenic volatile organic compounds, Atmos. Chem. Phys., 21, 7773–7789, https://doi.org/10.5194/acp-21-7773-2021, 2021. a, b, c
Li, K., Li, J., Wang, W., Li, J., Peng, C., Wang, D., and Ge, M.: Effects of Gas-Particle Partitioning on Refractive Index and Chemical Composition of m-Xylene Secondary Organic Aerosol, The J. Phys. Chem. A, 122, 3250–3260, https://doi.org/10.1021/acs.jpca.7b12792, 2018. a
Li, L., Han, Y., Li, J., Lin, Y., Zhang, X., Wang, Q., and Cao, J.: Effects of photochemical aging on the molecular composition of organic aerosols derived from agricultural biomass burning in whole combustion process, Sci. Total Environ., 946, 174152, https://doi.org/10.1016/j.scitotenv.2024.174152, 2024. a
Li, W., Wang, J., Qi, L., Yu, W., Nie, D., Shi, S., Gu, C., Ge, X., and Chen, M.: Molecular characterization of biomass burning tracer compounds in fine particles in Nanjing, China, Atmos. Environ., 240, 117837, https://doi.org/10.1016/j.atmosenv.2020.117837, 2020b. a
Liang, X., Chen, J., An, X., Liu, F., Liang, F., Tang, X., and Qu, P.: The impact of PM2.5 on children’s blood pressure growth curves: A prospective cohort study, Environ. Int., 158, 107012, https://doi.org/10.1016/j.envint.2021.107012, 2022. a
Lin, P., Liu, J., Shilling, J. E., Kathmann, S. M., Laskin, J., and Laskin, A.: Molecular characterization of brown carbon (BrC) chromophores in secondary organic aerosol generated from photo-oxidation of toluene, Phys. Chem. Chem. Phys., 17, 23312–23325, https://doi.org/10.1039/C5CP02563J, 2015. a, b
Lin, P., Fleming, L. T., Nizkorodov, S. A., Laskin, J., and Laskin, A.: Comprehensive Molecular Characterization of Atmospheric Brown Carbon by High Resolution Mass Spectrometry with Electrospray and Atmospheric Pressure Photoionization, Anal. Chem., 90, 12493–12502, https://doi.org/10.1021/acs.analchem.8b02177, 2018. a
Lin, Y., Han, Y., Li, G., Wang, Q., Zhang, X., Li, Z., Li, L., Prévôt, A. S. H., and Cao, J.: Molecular Characteristics of Atmospheric Organosulfates During Summer and Winter Seasons in Two Cities of Southern and Northern China, J. Geophys. Res.-Atmos., 127, e2022JD036672, https://doi.org/10.1029/2022JD036672, 2022. a, b
Liu, Q., Li, L., Zhang, X., Saini, A., Li, W., Hung, H., Hao, C., Li, K., Lee, P., Wentzell, J. J. B., Huo, C., Li, S.-M., Harner, T., and Liggio, J.: Uncovering global-scale risks from commercial chemicals in air, Nature, 600, 456–461, https://doi.org/10.1038/s41586-021-04134-6, 2021. a
Liu, Z.: Chord Chart, https://www.mathworks.com/matlabcentral/fileexchange/116550-chord-chart (last access: 10 March 2025), 2025. a
Lui, K. H., Lau, Y.-S., Poon, H. Y., Organ, B., Chan, M.-N., Guo, H., Ho, S. S. H., and Ho, K.: Characterization of chemical components of fresh and aged aerosol from vehicle exhaust emissions in Hong Kong, Chemosphere, 333, 138940, https://doi.org/10.1016/j.chemosphere.2023.138940, 2023. a, b
Ma, J., Ungeheuer, F., Zheng, F., Du, W., Wang, Y., Cai, J., Zhou, Y., Yan, C., Liu, Y., Kulmala, M., Daellenbach, K. R., and Vogel, A. L.: Nontarget Screening Exhibits a Seasonal Cycle of PM 2.5 Organic Aerosol Composition in Beijing, Environ. Sci. Technol., 56, 7017–7028, https://doi.org/10.1021/acs.est.1c06905, 2022. a
Malloy, Q. G. J., Li Qi, Warren, B., Cocker III, D. R., Erupe, M. E., and Silva, P. J.: Secondary organic aerosol formation from primary aliphatic amines with NO3 radical, Atmos. Chem. Phys., 9, 2051–2060, https://doi.org/10.5194/acp-9-2051-2009, 2009. a
Mazzi, G., Feltracco, M., Barbaro, E., Alterio, A., Favaro, E., Azri, C., and Gambaro, A.: Glyphosate and other plant protection products in size-segregated urban aerosol: Occurrence and dimensional trend, Environ. Pollut., 359, 124596, https://doi.org/10.1016/j.envpol.2024.124596, 2024. a
McDonald, B. C., De Gouw, J. A., Gilman, J. B., Jathar, S. H., Akherati, A., Cappa, C. D., Jimenez, J. L., Lee-Taylor, J., Hayes, P. L., McKeen, S. A., Cui, Y. Y., Kim, S.-W., Gentner, D. R., Isaacman-VanWertz, G., Goldstein, A. H., Harley, R. A., Frost, G. J., Roberts, J. M., Ryerson, T. B., and Trainer, M.: Volatile chemical products emerging as largest petrochemical source of urban organic emissions, Science, 359, 760–764, https://doi.org/10.1126/science.aaq0524, 2018. a
Mikati, I., Benson, A. F., Luben, T. J., Sacks, J. D., and Richmond-Bryant, J.: Disparities in Distribution of Particulate Matter Emission Sources by Race and Poverty Status, Am. J. Public Health, 108, 480–485, https://doi.org/10.2105/AJPH.2017.304297, 2018. a
Monteleone, B. and Borzí, I.: Drought in the Po Valley: Identification, Impacts and Strategies to Manage the Events, Water, 16, 1187, https://doi.org/10.3390/w16081187, 2024. a
Murphy, S. M., Sorooshian, A., Kroll, J. H., Ng, N. L., Chhabra, P., Tong, C., Surratt, J. D., Knipping, E., Flagan, R. C., and Seinfeld, J. H.: Secondary aerosol formation from atmospheric reactions of aliphatic amines, Atmos. Chem. Phys., 7, 2313–2337, https://doi.org/10.5194/acp-7-2313-2007, 2007. a
Nestorowicz, K., Jaoui, M., Rudzinski, K. J., Lewandowski, M., Kleindienst, T. E., Spólnik, G., Danikiewicz, W., and Szmigielski, R.: Chemical composition of isoprene SOA under acidic and non-acidic conditions: effect of relative humidity, Atmos. Chem. Phys., 18, 18101–18121, https://doi.org/10.5194/acp-18-18101-2018, 2018. a
Neuberger, A., Decesari, S., Aktypis, A., Andersen, H., Baumgardner, D., Bianchi, F., Busetto, M., Cai, J., Cermak, J., Dipu, S., Ekman, A., Fuzzi, S., Gramlich, Y., Haslett, S. L., Heikkinen, L., Joutsensaari, J., Kaltsonoudis, C., Kangasluoma, J., Krejci, R., Lupi, A., Marinoni, A., Matrali, A., Mattsson, F., Mohr, C., Nenes, A., Paglione, M., Pandis, S. N., Patel, A., Riipinen, I., Rinaldi, M., Steimer, S. S., Stolzenburg, D., Sulo, J., Vasilakopoulou, C. N., and Zieger, P.: From Molecules to Droplets: The Fog and Aerosol Interaction Research Italy (FAIRARI) 2021/22 Campaign, B. Am. Meteorol. Soc., 106, E23–E50, https://doi.org/10.1175/BAMS-D-23-0166.1, 2025. a
Nordmann, S., Cheng, Y. F., Carmichael, G. R., Yu, M., Denier van der Gon, H. A. C., Zhang, Q., Saide, P. E., Pöschl, U., Su, H., Birmili, W., and Wiedensohler, A.: Atmospheric black carbon and warming effects influenced by the source and absorption enhancement in central Europe, Atmos. Chem. Phys., 14, 12683–12699, https://doi.org/10.5194/acp-14-12683-2014, 2014. a
Oros, D. R., Abas, M. R. B., Omar, N. Y. M., Rahman, N. A., and Simoneit, B. R.: Identification and emission factors of molecular tracers in organic aerosols from biomass burning: Part 3. Grasses, Appl. Geochem., 21, 919–940, https://doi.org/10.1016/j.apgeochem.2006.01.008, 2006. a, b
Paglione, M., Gilardoni, S., Rinaldi, M., Decesari, S., Zanca, N., Sandrini, S., Giulianelli, L., Bacco, D., Ferrari, S., Poluzzi, V., Scotto, F., Trentini, A., Poulain, L., Herrmann, H., Wiedensohler, A., Canonaco, F., Prévôt, A. S. H., Massoli, P., Carbone, C., Facchini, M. C., and Fuzzi, S.: The impact of biomass burning and aqueous-phase processing on air quality: a multi-year source apportionment study in the Po Valley, Italy, Atmos. Chem. Phys., 20, 1233–1254, https://doi.org/10.5194/acp-20-1233-2020, 2020. a
Panda, U., Dey, S., Sharma, A., Singh, A., Reyes-Villegas, E., Darbyshire, E., Carbone, S., Das, T., Allan, J., McFiggans, G., Ravikrishna, R., Coe, H., Liu, P., and Gunthe, S. S.: Exploring the chemical composition and processes of submicron aerosols in Delhi using aerosol chemical speciation monitor driven factor analysis, Sci. Rep., 15, 14383, https://doi.org/10.1038/s41598-025-99245-9, 2025. a
Peralta, A. A., Schwartz, J., Gold, D. R., Vonk, J. M., Vermeulen, R., and Gehring, U.: Quantile regression to examine the association of air pollution with subclinical atherosclerosis in an adolescent population, Environ. Int., 164, 107285, https://doi.org/10.1016/j.envint.2022.107285, 2022. a
Perrone, M., Larsen, B., Ferrero, L., Sangiorgi, G., De Gennaro, G., Udisti, R., Zangrando, R., Gambaro, A., and Bolzacchini, E.: Sources of high PM2.5 concentrations in Milan, Northern Italy: Molecular marker data and CMB modelling, Sci. Total Environ., 414, 343–355, https://doi.org/10.1016/j.scitotenv.2011.11.026, 2012. a
Priestley, M., Bannan, T. J., Le Breton, M., Worrall, S. D., Kang, S., Pullinen, I., Schmitt, S., Tillmann, R., Kleist, E., Zhao, D., Wildt, J., Garmash, O., Mehra, A., Bacak, A., Shallcross, D. E., Kiendler-Scharr, A., Hallquist, Å. M., Ehn, M., Coe, H., Percival, C. J., Hallquist, M., Mentel, T. F., and McFiggans, G.: Chemical characterisation of benzene oxidation products under high- and low-NOx conditions using chemical ionisation mass spectrometry, Atmos. Chem. Phys., 21, 3473–3490, https://doi.org/10.5194/acp-21-3473-2021, 2021. a
Pullinen, I., Schmitt, S., Kang, S., Sarrafzadeh, M., Schlag, P., Andres, S., Kleist, E., Mentel, T. F., Rohrer, F., Springer, M., Tillmann, R., Wildt, J., Wu, C., Zhao, D., Wahner, A., and Kiendler-Scharr, A.: Impact of NOx on secondary organic aerosol (SOA) formation from α-pinene and β-pinene photooxidation: the role of highly oxygenated organic nitrates, Atmos. Chem. Phys., 20, 10125–10147, https://doi.org/10.5194/acp-20-10125-2020, 2020. a
PubChem: National Center for Biotechnology Information: Compound Summary for CID 26690, Dimethyl capramide, https://pubchem.ncbi.nlm.nih.gov/compound/Dimethyl-capramide (last access: 15 June 2024), 2024. a
Qi, L., Chen, M., Stefenelli, G., Pospisilova, V., Tong, Y., Bertrand, A., Hueglin, C., Ge, X., Baltensperger, U., Prévôt, A. S. H., and Slowik, J. G.: Organic aerosol source apportionment in Zurich using an extractive electrospray ionization time-of-flight mass spectrometer (EESI-TOF-MS) – Part 2: Biomass burning influences in winter, Atmos. Chem. Phys., 19, 8037–8062, https://doi.org/10.5194/acp-19-8037-2019, 2019. a, b, c
Ramanathan, V. and Carmichael, G.: Global and regional climate changes due to black carbon, Nat. Geosci., 1, 221–227, https://doi.org/10.1038/ngeo156, 2008. a
Rogge, W. F., Hildemann, L. M., Mazurek, M. A., Cass, G. R., and Simoneit, B. R. T.: Sources of fine organic aerosol. 2. Noncatalyst and catalyst-equipped automobiles and heavy-duty diesel trucks, Environ. Sci. Technol., 27, 636–651, https://doi.org/10.1021/es00041a007, 1993. a
Saarikoski, S., Carbone, S., Decesari, S., Giulianelli, L., Angelini, F., Canagaratna, M., Ng, N. L., Trimborn, A., Facchini, M. C., Fuzzi, S., Hillamo, R., and Worsnop, D.: Chemical characterization of springtime submicrometer aerosol in Po Valley, Italy, Atmos. Chem. Phys., 12, 8401–8421, https://doi.org/10.5194/acp-12-8401-2012, 2012. a, b
Saenz, J. L., Wong, R., and Ailshire, J. A.: Indoor air pollution and cognitive function among older Mexican adults, J. Epidemiol. Commun. H., 72, 21–26, https://doi.org/10.1136/jech-2017-209704, 2018. a
Sandrini, S., van Pinxteren, D., Giulianelli, L., Herrmann, H., Poulain, L., Facchini, M. C., Gilardoni, S., Rinaldi, M., Paglione, M., Turpin, B. J., Pollini, F., Bucci, S., Zanca, N., and Decesari, S.: Size-resolved aerosol composition at an urban and a rural site in the Po Valley in summertime: implications for secondary aerosol formation, Atmos. Chem. Phys., 16, 10879–10897, https://doi.org/10.5194/acp-16-10879-2016, 2016. a
Sarwar, G., Olson, D. A., Corsi, R. L., and Weschler, C. J.: Indoor Fine Particles: The Role of Terpene Emissions from Consumer Products, J. Air Waste Manage., 54, 367–377, https://doi.org/10.1080/10473289.2004.10470910, 2004. a
Schymanski, E. L., Jeon, J., Gulde, R., Fenner, K., Ruff, M., Singer, H. P., and Hollender, J.: Identifying Small Molecules via High Resolution Mass Spectrometry: Communicating Confidence, Environ. Sci. Technol., 48, 2097–2098, https://doi.org/10.1021/es5002105, 2014. a, b
Silva, P. J., Erupe, M. E., Price, D., Elias, J., G. J. Malloy, Q., Li, Q., Warren, B., and Cocker, D. R.: Trimethylamine as Precursor to Secondary Organic Aerosol Formation via Nitrate Radical Reaction in the Atmosphere, Environ. Sci. Technol., 42, 4689–4696, https://doi.org/10.1021/es703016v, 2008. a
Simoneit, B. R.: Biomass burning – a review of organic tracers for smoke from incomplete combustion, Appl. Geochem., 17, 129–162, https://doi.org/10.1016/S0883-2927(01)00061-0, 2002. a
Simoneit, B. R. T., Rushdi, A. I., Bin Abas, M. R., and Didyk, B. M.: Alkyl Amides and Nitriles as Novel Tracers for Biomass Burning, Environ. Sci. Technol., 37, 16–21, https://doi.org/10.1021/es020811y, 2003. a
Singer, B. C., Destaillats, H., Hodgson, A. T., and Nazaroff, W. W.: Cleaning products and air fresheners: emissions and resulting concentrations of glycol ethers and terpenoids, Indoor Air, 16, 179–191, https://doi.org/10.1111/j.1600-0668.2005.00414.x, 2006. a
Smith, J. S., Laskin, A., and Laskin, J.: Molecular Characterization of Biomass Burning Aerosols Using High-Resolution Mass Spectrometry, Anal. Chem., 81, 1512–1521, https://doi.org/10.1021/ac8020664, 2009. a, b, c, d
Smith, N. R., Montoya-Aguilera, J., Dabdub, D., and Nizkorodov, S. A.: Effect of Humidity on the Reactive Uptake of Ammonia and Dimethylamine by Nitrogen-Containing Secondary Organic Aerosol, Atmosphere, 12, 1502, https://doi.org/10.3390/atmos12111502, 2021. a
Song, K., Guo, S., Gong, Y., Lv, D., Wan, Z., Zhang, Y., Fu, Z., Hu, K., and Lu, S.: Non-target scanning of organics from cooking emissions using comprehensive two-dimensional gas chromatography-mass spectrometer (GC × GC-MS), Appl. Geochem., 151, 105601, https://doi.org/10.1016/j.apgeochem.2023.105601, 2023. a
Srivastava, D., Vu, T. V., Tong, S., Shi, Z., and Harrison, R. M.: Formation of secondary organic aerosols from anthropogenic precursors in laboratory studies, NPJ Climate and Atmospheric Science, 5, 22, https://doi.org/10.1038/s41612-022-00238-6, 2022. a
Steinemann, A.: Fragranced consumer products: exposures and effects from emissions, Air Qual. Atmos. Hlth., 9, 861–866, https://doi.org/10.1007/s11869-016-0442-z, 2016. a
Surratt, J. D., Gómez-González, Y., Chan, A. W. H., Vermeylen, R., Shahgholi, M., Kleindienst, T. E., Edney, E. O., Offenberg, J. H., Lewandowski, M., Jaoui, M., Maenhaut, W., Claeys, M., Flagan, R. C., and Seinfeld, J. H.: Organosulfate Formation in Biogenic Secondary Organic Aerosol, J. Phys. Chem. A, 112, 8345–8378, https://doi.org/10.1021/jp802310p, 2008. a
Tang, S., Lv, J., Liu, L., Li, F., Wang, Y., and Jiang, G.: Molecular characterization of atmospheric organic aerosols by ultrahigh resolution mass spectrometry: Advances, challenges, and opportunities, Trends in Environmental Anal. Chem., 50, e00305, https://doi.org/10.1016/j.teac.2026.e00305, 2026. a
Thoma, M., Bachmeier, F., Gottwald, F. L., Simon, M., and Vogel, A. L.: Mass spectrometry-based Aerosolomics: a new approach to resolve sources, composition, and partitioning of secondary organic aerosol, Atmos. Meas. Tech., 15, 7137–7154, https://doi.org/10.5194/amt-15-7137-2022, 2022. a, b, c, d, e, f, g
Thoma, M., Bachmeier, F., Knauf, K., David, J., Simon, M., and Vogel, A. L.: Seasonal analysis of organic aerosol composition resolves anthropogenic and biogenic sources at a rural background station in central Europe, EGU General Assembly 2025, Vienna, Austria, 27 Apr–2 May 2025, EGU25-15702, https://doi.org/10.5194/egusphere-egu25-15702, 2025. a, b
Tong, Y., Pospisilova, V., Qi, L., Duan, J., Gu, Y., Kumar, V., Rai, P., Stefenelli, G., Wang, L., Wang, Y., Zhong, H., Baltensperger, U., Cao, J., Huang, R.-J., Prévôt, A. S. H., and Slowik, J. G.: Quantification of solid fuel combustion and aqueous chemistry contributions to secondary organic aerosol during wintertime haze events in Beijing, Atmos. Chem. Phys., 21, 9859–9886, https://doi.org/10.5194/acp-21-9859-2021, 2021. a
Ungeheuer, F., van Pinxteren, D., and Vogel, A. L.: Identification and source attribution of organic compounds in ultrafine particles near Frankfurt International Airport, Atmos. Chem. Phys., 21, 3763–3775, https://doi.org/10.5194/acp-21-3763-2021, 2021. a
Wang, K., Huang, R.-J., Brüggemann, M., Zhang, Y., Yang, L., Ni, H., Guo, J., Wang, M., Han, J., Bilde, M., Glasius, M., and Hoffmann, T.: Urban organic aerosol composition in eastern China differs from north to south: molecular insight from a liquid chromatography–mass spectrometry (Orbitrap) study, Atmos. Chem. Phys., 21, 9089–9104, https://doi.org/10.5194/acp-21-9089-2021, 2021. a
Wang, T., Huang, R.-J., Jing, M., Che, J., Xing, J., Yang, L., Yuan, W., Wang, Y., Guo, J., Zhong, H., Huang, D. D., Huang, C., and Xu, W.: Overlooked Trace Molecules in Organic Aerosol Revealed by Gas Chromatography–Orbitrap Mass Spectrometry, Environ. Sci. Technol., 58, 18264–18272, https://doi.org/10.1021/acs.est.4c03171, 2024. a
Wang, X., Hayeck, N., Brüggemann, M., Yao, L., Chen, H., Zhang, C., Emmelin, C., Chen, J., George, C., and Wang, L.: Chemical Characteristics of Organic Aerosols in Shanghai: A Study by Ultrahigh‐Performance Liquid Chromatography Coupled With Orbitrap Mass Spectrometry, J. Geophys. Res.-Atmos., 122, https://doi.org/10.1002/2017JD026930, 2017. a
Weuve, J.: Exposure to Particulate Air Pollution and Cognitive Decline in Older Women, Arch. Intern. Med., 172, 219, https://doi.org/10.1001/archinternmed.2011.683, 2012. a
Worton, D. R., Goldstein, A. H., Farmer, D. K., Docherty, K. S., Jimenez, J. L., Gilman, J. B., Kuster, W. C., de Gouw, J., Williams, B. J., Kreisberg, N. M., Hering, S. V., Bench, G., McKay, M., Kristensen, K., Glasius, M., Surratt, J. D., and Seinfeld, J. H.: Origins and composition of fine atmospheric carbonaceous aerosol in the Sierra Nevada Mountains, California, Atmos. Chem. Phys., 11, 10219–10241, https://doi.org/10.5194/acp-11-10219-2011, 2011. a
Wu, Q.-Z., Li, S., Yang, B.-Y., Bloom, M., Shi, Z., Knibbs, L., Dharmage, S., Leskinen, A., Jalaludin, B., Jalava, P., Roponen, M., Lin, S., Chen, G., Guo, Y., Xu, S.-L., Yu, H.-Y., Zeeshan, M., Hu, L.-W., Yu, Y., Zeng, X.-W., and Dong, G.-H.: Ambient Airborne Particulates of Diameter ≤ 1 µm, a Leading Contributor to the Association Between Ambient Airborne Particulates of Diameter ≤ 2.5 µm and Children’s Blood Pressure, Hypertension, 75, 347–355, https://doi.org/10.1161/HYPERTENSIONAHA.119.13504, 2020. a
Xie, X., Wang, Y., Yang, Y., Xu, J., Zhang, Y., Tang, W., Guo, T., Wang, Q., Shen, H., Zhang, Y., Yan, D., Peng, Z., Chen, Y., He, Y., and Ma, X.: Long-term exposure to fine particulate matter and tachycardia and heart rate: Results from 10 million reproductive-age adults in China, Environ. Pollut., 242, 1371–1378, https://doi.org/10.1016/j.envpol.2018.08.022, 2018. a
Xue, J., Ma, F., Elm, J., Chen, J., and Xie, H.-B.: Atmospheric oxidation mechanism and kinetics of indole initiated by •OH and •Cl: a computational study, Atmos. Chem. Phys., 22, 11543–11555, https://doi.org/10.5194/acp-22-11543-2022, 2022. a
Yassine, M. M., Harir, M., Dabek‐Zlotorzynska, E., and Schmitt‐Kopplin, P.: Structural characterization of organic aerosol using Fourier transform ion cyclotron resonance mass spectrometry: Aromaticity equivalent approach, Rapid Commun. Mass Sp., 28, 2445–2454, https://doi.org/10.1002/rcm.7038, 2014. a, b
Yu, J., Yan, C., Liu, Y., Li, X., Zhou, T., and Zheng, M.: Potassium: A Tracer for Biomass Burning in Beijing?, Aerosol Air Qual. Res., 18, 2447–2459, https://doi.org/10.4209/aaqr.2017.11.0536, 2018. a
Zeng, Y., Shen, Z., Takahama, S., Zhang, L., Zhang, T., Lei, Y., Zhang, Q., Xu, H., Ning, Y., Huang, Y., Cao, J., and Rudolf, H.: Molecular Absorption and Evolution Mechanisms of PM2.5 Brown Carbon Revealed by Electrospray Ionization Fourier Transform–Ion Cyclotron Resonance Mass Spectrometry During a Severe Winter Pollution Episode in Xi'an, China, Geophys. Res. Lett., 47, e2020GL087977, https://doi.org/10.1029/2020GL087977, 2020. a
Zhang, J., Li, K., Wang, T., Gammelsæter, E., Cheung, R. K. Y., Surdu, M., Bogler, S., Bhattu, D., Wang, D. S., Cui, T., Qi, L., Lamkaddam, H., El Haddad, I., Slowik, J. G., Prevot, A. S. H., and Bell, D. M.: Bulk and molecular-level composition of primary organic aerosol from wood, straw, cow dung, and plastic burning, Atmos. Chem. Phys., 23, 14561–14576, https://doi.org/10.5194/acp-23-14561-2023, 2023a. a, b, c, d
Zhang, X., Schwantes, R. H., Coggon, M. M., Loza, C. L., Schilling, K. A., Flagan, R. C., and Seinfeld, J. H.: Role of ozone in SOA formation from alkane photooxidation, Atmos. Chem. Phys., 14, 1733–1753, https://doi.org/10.5194/acp-14-1733-2014, 2014. a
Zhang, Y., Gao, X., Hou, X., Liu, M., Han, J., and Zhang, H.: Chemical Characterization of Rural Organic Aerosol in the North China Plain Using Ultrahigh-Resolution Mass Spectrometry, Atmosphere, 14, 1636, https://doi.org/10.3390/atmos14111636, 2023b. a
Zhou, L., Jiao, X., Yang, B., Yuan, W., Zhao, W., Zhang, L., Huang, W., Long, S., Xu, J., Shen, H., and Wang, C.: The Impact of Indoor Environments on the Abundance of Urban Outdoor VOCs, Environ. Sci. Technol., 59, 9654–9664, https://doi.org/10.1021/acs.est.4c13133, 2025. a
Zhu, L., Henze, D. K., Bash, J. O., Cady-Pereira, K. E., Shephard, M. W., Luo, M., and Capps, S. L.: Sources and Impacts of Atmospheric NH3: Current Understanding and Frontiers for Modeling, Measurements, and Remote Sensing in North America, Current Pollution Reports, 1, 95–116, https://doi.org/10.1007/s40726-015-0010-4, 2015. a
Zhu, Q., Cao, L.-M., Tang, M.-X., Huang, X.-F., Saikawa, E., and He, L.-Y.: Characterization of Organic Aerosol at a Rural Site in the North China Plain Region: Sources, Volatility and Organonitrates, Adv. Atmos. Sci., 38, 1115–1127, https://doi.org/10.1007/s00376-020-0127-2, 2021. a
Zotter, P., Ciobanu, V. G., Zhang, Y. L., El-Haddad, I., Macchia, M., Daellenbach, K. R., Salazar, G. A., Huang, R.-J., Wacker, L., Hueglin, C., Piazzalunga, A., Fermo, P., Schwikowski, M., Baltensperger, U., Szidat, S., and Prévôt, A. S. H.: Radiocarbon analysis of elemental and organic carbon in Switzerland during winter-smog episodes from 2008 to 2012 – Part 1: Source apportionment and spatial variability, Atmos. Chem. Phys., 14, 13551–13570, https://doi.org/10.5194/acp-14-13551-2014, 2014. a