the Creative Commons Attribution 4.0 License.
the Creative Commons Attribution 4.0 License.
 | 18 May 2026
Strong springtime increase of ice-nucleating particle concentration in the Rocky Mountains
A. Gannet Hallar
Ian B. McCubbin
Joey Bail
Karl D. Froyd
Justin Jacquot
Xiaoli Shen
Christopher Rapp
Ottmar Möhler
Daniel Cziczo
Ice nucleating particles (INPs) exert a substantial impact on radiative properties and lifetimes of mixed-phase clouds and can modulate their precipitation efficiency. Advancing our understanding of the abundance and properties of INPs is essential to elucidate how clouds change in a warming climate. We conducted INP measurements at the Storm Peak Laboratory (3200 m a.s.l.), in the Rocky Mountains (CO, USA) during two field campaigns in 2021/2022 and in 2025. INP concentrations were continuously measured with the Portable Ice Nucleation Experiment between −22 and −32 °C. INP concentrations were remarkably similar during the two campaigns and followed a seasonal pattern. Lowest concentrations were observed during winter, with median January values falling below 10 INP stdL−1 at T>−26 °C. In spring, median INP concentrations increased by approximately one order of magnitude. Springtime is associated with increased dust concentrations in the Western United States, and back trajectories revealed regional and local dust regions as INP sources. As climate change is expected to intensify the influence of dust sources from deserts and semi-arid regions, this might impact INP concentrations. Moreover, INP sizes were investigated by ranked correlation coefficient analysis of parallel measurements of super-micrometer particles, and alternated INP measurements behind a 1 µm impactor. In addition, for the first time, PINE was coupled to a pumped counterflow virtual impactor to analyze the sizes of ice residuals. Overall, super-micrometer particles were found to contribute significantly to the INP population throughout the entire campaign, with a reduced importance during winter.
- Article
(8036 KB) - Full-text XML
- BibTeX
- EndNote


The role of clouds in a changing climate remains largely uncertain (e.g., Zelinka et al., 2017). Mixed-phase clouds, containing both cloud droplets and ice crystals, are one major cause of uncertainty in projecting climate change (e.g., Hofer et al., 2024). The first formation of ice crystals in mixed-phase clouds is initiated by specific aerosol particles, termed ice-nucleating particles (INPs; Vali et al., 2015). Although they are a small subset of the ambient aerosol particle population, the presence of INPs can impact the phase partitioning in clouds (e.g., Tan and Storelvmo, 2019), and thus their radiative properties and lifetime (e.g., Vergara-Temprado et al., 2018). Moreover, precipitation formation is most efficient via the ice phase (e.g., Pruppacher and Klett, 2010), making it susceptible to INPs (Fan et al., 2017; French et al., 2018). To the current state of knowledge, different aerosol particle types contribute to the INP population at different temperatures within the mixed-phase cloud regime. Mineral dust particles efficiently nucleate ice at temperatures below ∼ −20 °C (Hoose and Möhler, 2012; Murray et al., 2012), and were often found to remarkably contribute to the INP population in this temperature range (e.g., Kanji et al., 2017). Mineral dust particles are emitted from desert regions and can be transported over longer distances, such that it is also a relevant INP type even at high-altitude sites (e.g., Mertes et al., 2007; Richardson et al., 2007; Lacher et al., 2018; Brunner et al., 2022). At temperatures above ∼ −20 °C organic and biogenic particles can contribute to the INP population (e.g., Kanji et al., 2017), including soil dust particles and particles emitted from marine environments. Not only the particle type but also the size of INPs is yet to be investigated in more detail. Studies using measurements from elevated levels of the atmosphere as well as ground-based measurement sites (e.g., DeMott et al., 2010; Lacher et al., 2018; Mason et al., 2016) found a relation to the larger fraction of aerosol particles, which can be an indication for the importance of dust particles being INPs. However, in the absence of dust particles and in remote environments it might be possible that INPs are smaller (Wilson et al., 2015).
In general, attempts to identify INPs in ambient air are made indirectly by sampling in air masses which are dominated by one aerosol type. This approach is, however, limited since it is not guaranteed that a single aerosol type is present, which is crucial in the light of the very low fraction of ice active particles (e.g., sometimes 1 out of 1 billion; DeMott et al., 2010). For example, the ice activity of biomass burning events was found to be due to the presence of the mineral phase (Jahn et al., 2020)
A precise method to identify INPs using online instruments is the direct chemical and physical analysis of the INPs by using ice-selective inlets or cloud chambers coupled to pumped-counterflow virtual impactors (PCVI; Boulter et al., 2006; Hiranuma et al., 2016). The ice crystals that formed upon INPs are thereby separated and can be analyzed using sizing instrumentation (e.g., Mertes et al., 2007; Lacher et al., 2021) or single-particle mass spectrometry (e.g., Cziczo et al., 2003; Cziczo et al., 2009; Pratt et al., 2009; Kamphus et al., 2010; Cziczo et al., 2013; Cziczo and Froyd, 2014; Schmidt et al., 2017). The application of field instruments is more difficult given the naturally low INP concentrations and related low detection rates. As a result, the currently existing coupled setups for ambient measurements often focus on cirrus formation, where only discrimination between ice crystals and aerosol particles is needed). A recent study by Cornwell et al. (2019) also applied a coupled system of a continuous-flow diffusion chamber with a PCVI at a coastal marine site at mixed-phase cloud conditions. The identification of INPs in mixed-phase clouds is more challenging, as these clouds contain all three phases of water. Some phase-separating inlets exist (e.g., Mertes et al., 2007; Koolik et al., 2022), analyzing freshly formed INPs. However, the experiments depend on ambient conditions, including temperature and the presence of clouds. Coupled systems using online INP instruments and PCVI have the advantage to activate INPs in a broader temperature range and do not depend on sampling conditions in-cloud. Thus, they have the great potential to advance the understanding of chemical composition of INP in ambient air, and thus to identify main ice-active aerosol types and their source regions.
In addition to the identity of INPs, there is also missing information about the spatio-temporal abundance of INPs, limiting the predictability of the temperature-dependent INP concentration at different locations and in different seasons (e.g., Murray et al., 2021; Burrows et al., 2022). As aerosol sources can vary with season, it can also be assumed that INP concentrations have a seasonal difference. Indeed, seasonal trends were identified at different measurement locations. In a boreal forest, Schneider et al. (2021) attributed the seasonal cycle in INP concentration with a maximum in summer to biogenic particles. Moreover, a seasonal cycle in the Arctic region was identified (Creamean et al., 2022; Tobo et al., 2024; Sze et al., 2023) related to different phenomena such as sea ice opening and melt and the transport from lower latitudes during spring.
At different elevated sites in Europe and the US, seasonal cycles in the INP concentration were also identified. A maximum in INP concentration in the warm season was also found at Alpine high-altitude sites (Brunner et al., 2022), caused by the impact of boundary layer air containing biogenic particles such as pollen and soil dust with peak INP concentration measured during Saharan dust events (i.e., mineral dust events). Also, at a mountain site in central France, Bras et al. (2024) identified a seasonal cycle with minimum INP concentrations in winter and increasing values in spring. In a recent study in the Rocky Mountains, Zhou et al. (2026) found lower INP concentrations in winter and maximum concentrations in summer. Such measurements at elevated sites are especially relevant because the INP population can be directly important for ice crystal formation in clouds.
In this study, time-resolved INP concentration measurements were conducted using the Portable Ice Nucleation Experiment (PINE; Möhler et al., 2021) from autumn to spring at a high-altitude site in the Rocky Mountains, the Storm Peak Laboratory (SPL). The site is located at an altitude where mixed-phase clouds form (e.g., Lowenthal et al., 2019), and the measured INP concentration in the temperature range −22 to −32 °C can be assumed to be relevant when reaching higher (and colder) altitudes, which is likely as mountainous regions often act as an orographic lifting mechanism for particles. Moreover, the size of INPs was investigated using a PCVI downstream of PINE in combination with a sizing instrument, and impactor measurements upstream of PINE, giving insights into the physical properties of INPs.
2.1 Overview campaigns
INP concentration measurements were conducted at SPL (3220 m a.s.l.; Hallar et al., 2025) during two campaigns from October 2021, to May 2022, and from January to May 2025. SPL is situated on a 70 km long mountain ridge in the Rocky Mountains, and is approximately 1150 m above the closest valley. SPL can receive air masses both from local sources, as well as from long-range transport and regional sources via the free troposphere, especially in winter time and in the night hours (Obrist et al., 2008; Hallar et al., 2015; Collaud Coen et al., 2018). As such, a change in aerosol sources and types with season can be expected. For example, dust particles both from intercontinental and regional dust peak in spring (Hallar et al., 2011; Hallar et al., 2015)
INP concentration measurements were conducted using the Portable Ice Nucleation Experiment (PINE; Möhler et al., 2021; section 2.2) with continuous temperature scans between −22 and −32 °C. Only during a period in January and February 2022, PINE was operated at temperatures below −28 °C to allow the size investigation of INPs using a pumped-counterflow virtual impactor (Sect. 2.4).
2.2 The Portable Ice Nucleation Experiment PINE
PINE is an expansion chamber that mimics cloud formation upon air mass lifting, following the working principle of AIDA (Aerosol Interaction and Dynamics; Möhler et al., 2003). A detailed description about PINE is found in Möhler et al. (2021). For this campaign, the model PINE-1A was used, which is working fully automatically and operates continuously. The INP concentration measurements were conducted at one of the station`s aerosol inlets (Petersen et al., 2019).
PINE consists of an inlet system with a Nafion membrane dryer, a 7 L chamber which is cooled by an external chiller (Lauda RP855, Lauda-Königshofen, Germany), an optical particle counter (OPC; fidas-pine, Palas GmbH, Karlsruhe, Germany) that is attached in the pump-line downstream of the chamber, and a home-built LabVIEW software controlling the system and logging the obtained data. PINE operates in cycles of so-called flush mode, expansion mode, and refill mode. During the flush mode, the aerosol particles are guided through the chamber at a flow rate between 1–2 LPM (liters per minute) for about four to seven minutes, to ensure an exchange of the sampled air. For the actual cloud formation experiment, the expansion mode, a valve upstream of the chamber is closed and the air is continued to be pumped out at a constant volume flow rate of 3 LPM, causing a decrease in temperature and pressure, and an establishment of supersaturated conditions with respect to ice and water. During this campaign, the pressure was reduced by 150 mbar, making the cloud formation process to last about 40 s. Aerosol particles that are beforehand flushed through the chamber are exposed to cloud-like conditions, allowing them to induce cloud droplet and ice crystal formation based on the presence of cloud condensation nuclei and INP, respectively. Please note that the fidas-pine OPC has a sideward scattering geometry, such that aspherical ice crystals are detected with a higher scattering intensity than spherical cloud droplets of the same size, allowing it to detect ice crystals as larger particles compared to cloud droplets. The temperature assigned to the experiment is the coldest recorded temperature and has an uncertainty of ±1 °C. In the refill mode, the pressure inside the chamber is increased to ambient conditions by refilling filtered and dried air at the same flow rate as the flush mode. No ice-background correction is needed for the INP measurements, since the chamber is operated with frost-free walls, which is verified by frequent background experiments, when the sampled air is guided through a filter prior to entering the chamber in the flush mode. During this campaign, the temperature of PINE was continuously varied between −22 and −32 °C, resulting in temperature scans with a time resolution of approximately two hours. The limit of detection (LOD) of one experiment is 0.5 L−1, which informs the operation temperature of PINE due to the naturally very low INP concentration at temperatures above −20 °C. PINE has a particle cutoff size (D50; particle size at which 50 % of the particles are transmitted) of 4 µm, and for specific experiments (see next section), a 1 µm impactor was installed upstream of PINE to limit the sampled size distribution.
PINE measurements were conducted at a rime-free aerosol inlet, which is heated to 30 °C. The aerosol inlet's sampling efficiency has a 50 % cut off at an aerodynamic diameter of approximately 13 µm and wind speed of 0.5 m s−1 (Petersen et al., 2019). At higher wind speeds of 10 and 15 m s−1, the aerosol inlet has a D50 of approximately 7 and 5.5 µm, respectively (Petersen et al., 2019), allowing the transmission of particles that can enter PINE (D50 of 4 µm) as most of the time the wind speeds at SPL are below 10 m s−1 (Hallar et al., 2025).
2.3 Size investigation of INPs
One focus of the first campaign in 2021/2022 was the investigation of INP sizes which can help to identify potential sources and to improve transport modeling. We make use of three different methods: (1) We correlate the INP concentration in the temperature range of the PINE measurements with parallel measurements of particle concentration larger than 1 µm aerodynamic diameter measured with an aerosol particle sizer (APS; model 3321, TSI Inc., St. Paul, Minnesota, USA); this indirect approach is limited as the INP population is a small subset of the aerosol population, and their size distributions are not necessarily related. (2) A PCVI was installed downstream of PINE, and was combined with SPX (Single particle Photometer – eXperiment; Droplet Measurement Technology, Longmont, CO, USA), which is a modified version of the Single Particle Soot Photometer – Extended Range and specific for aerosol size measurements by using an optical technique. This allows the direct investigation of ice crystal residuals which formed in PINE upon INPs; however, this method is limited by the transmission efficiency of the setup which is crucial at low ambient INP concentrations (for more details see next section). Similar experiments were performed with ice-selective inlets, sampling freshly formed ice crystals in ambient air; however, such measurements are limited to the temperature of the ambient air (e.g., Mertes et al., 2007; Lacher et al., 2021). (3) We alternated our measurements between a total aerosol inlet and a PM1 impactor to exclude super-micrometer sized aerosol particles; this allows us to retrieve an estimate of the size range of the INPs. To-date, most size-investigative experiments using impactors sample aerosol particles on filters which are analyzed with offline freezing techniques (Mason et al., 2016). Hence these measurements are limited to temperatures above −25 °C, as this is a typical limit for such methods (e.g., Cziczo et al., 2017). In this study, we use the online INP chamber PINE with an impactor upstream, allowing us to investigate the size of the INP population in the temperature range −22 to −32 °C.
2.4 Coupling to a Pumped-Counterflow Virtual Impactor PCVI
For investigating the properties of INPs, a PCVI (described in more detail in Kulkarni et al. (2011)) was coupled to PINE. The setup was configured and tested during laboratory studies (see Appendix for these experiments) and configured, tested and applied during the SPL campaign in winter 2022. The aim of the laboratory studies was to determine the D50 using ammonium sulphate particles and to define preliminary configuration settings. In the field, the setup underwent more thorough testing for the separation of aerosol particles, cloud droplets and ice crystals, which is more complex as the differences in particle shape, density and phase can have an impact (e.g., Kulkarni et al., 2011). In general, a PCVI separates particles based on their aerodynamic size using different flows. Coupled to a cloud chamber like PINE, the aim is to only transmit (larger) ice crystals through the PCVI body (Fig. 1). During the cloud formation process (expansion mode) in PINE in the mixed-phase cloud regime, unactivated aerosol particles, cloud droplets, and ice crystals are present. These particles are first guided through an evaporation section downstream of PINE, to reduce the cloud droplet sizes, and second pass the fidas-pine OPC to allow the detection of the ice crystals to retrieve the INP concentration. Thereafter, the sample flow enters the PCVI body, where the gas phase, smaller aerosol particles and cloud droplets are removed in a side-ward directed flow, and only ice crystals, formed upon INPs, are transported further and can be investigated by aerosol analytical instruments.
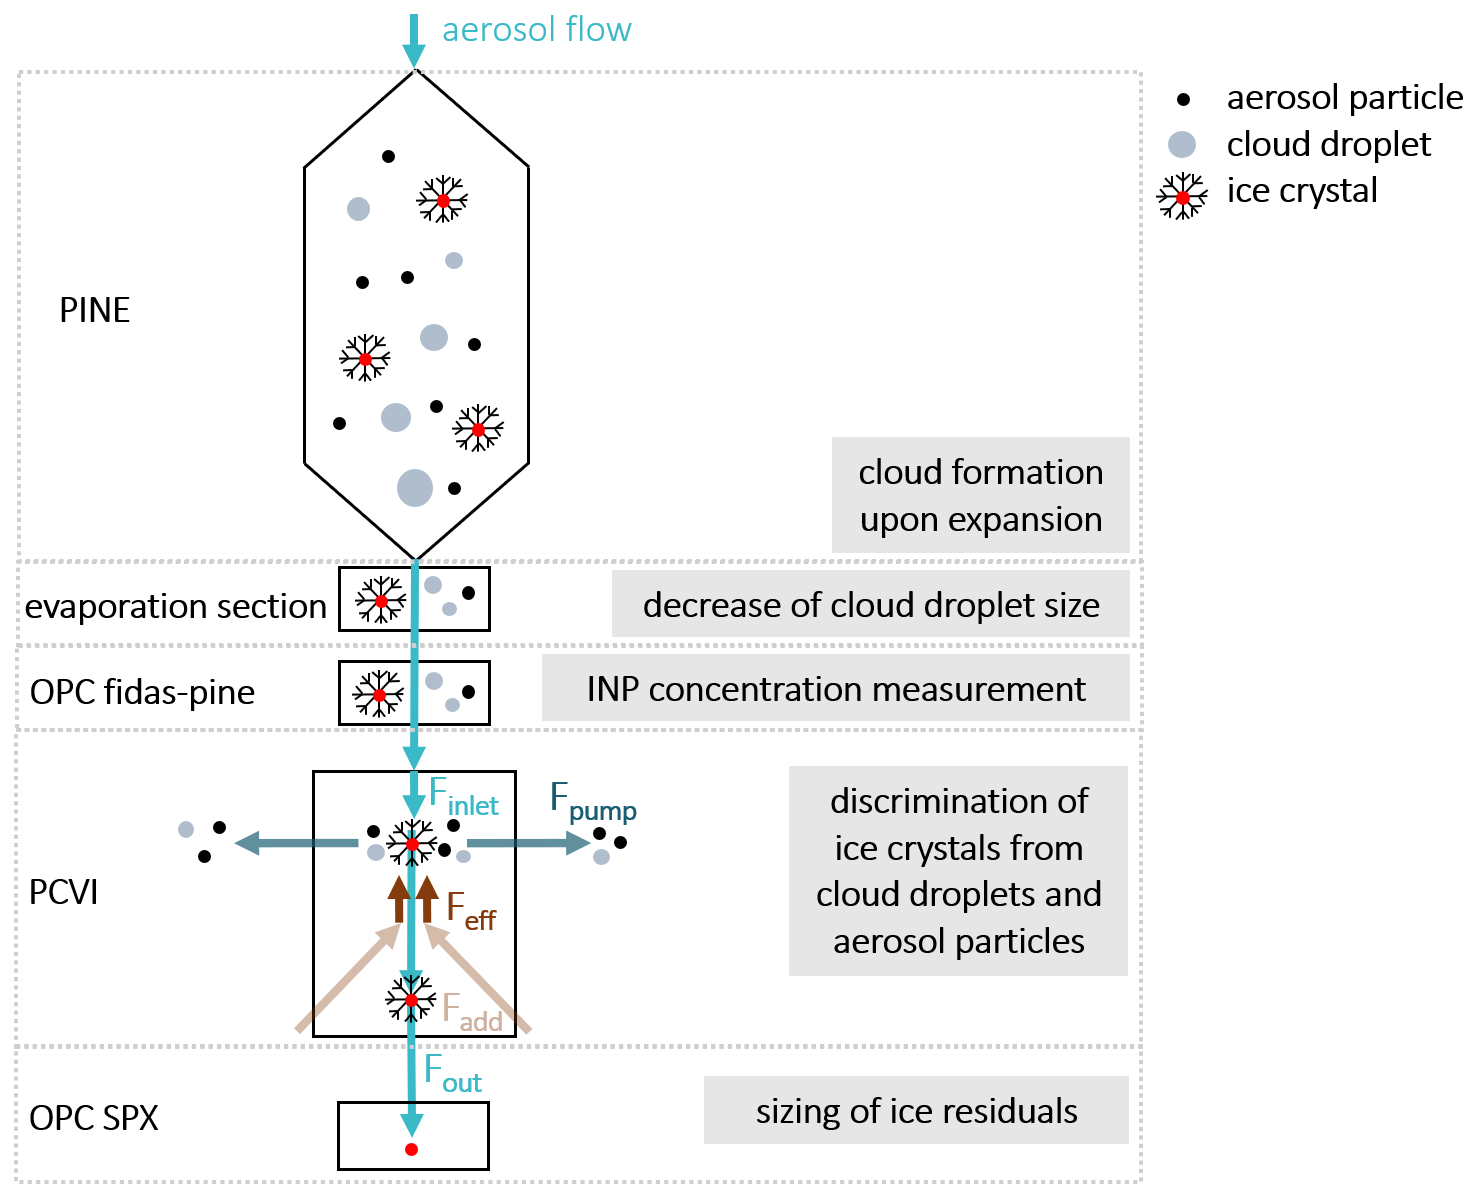
Figure 1Setup of PINE coupled to a PCVI. The cloud droplets, ice crystals, and unactivated aerosol particles that are in PINE during expansion pass an evaporation section and the fidas-pine OPC. Upon entering the PCVI body, only the larger ice crystals are of sufficient size, as compared to smaller cloud droplets and aerosol particles, to be selected and are then, after sublimation of ice, further analyzed for their size. The discrimination between these particles in the inlet flow (Finlet) is achieved by a combination of a pump flow (Fpump) and a counterflow (Feff). Ice residuals are transmitted in the output flow (Fout).
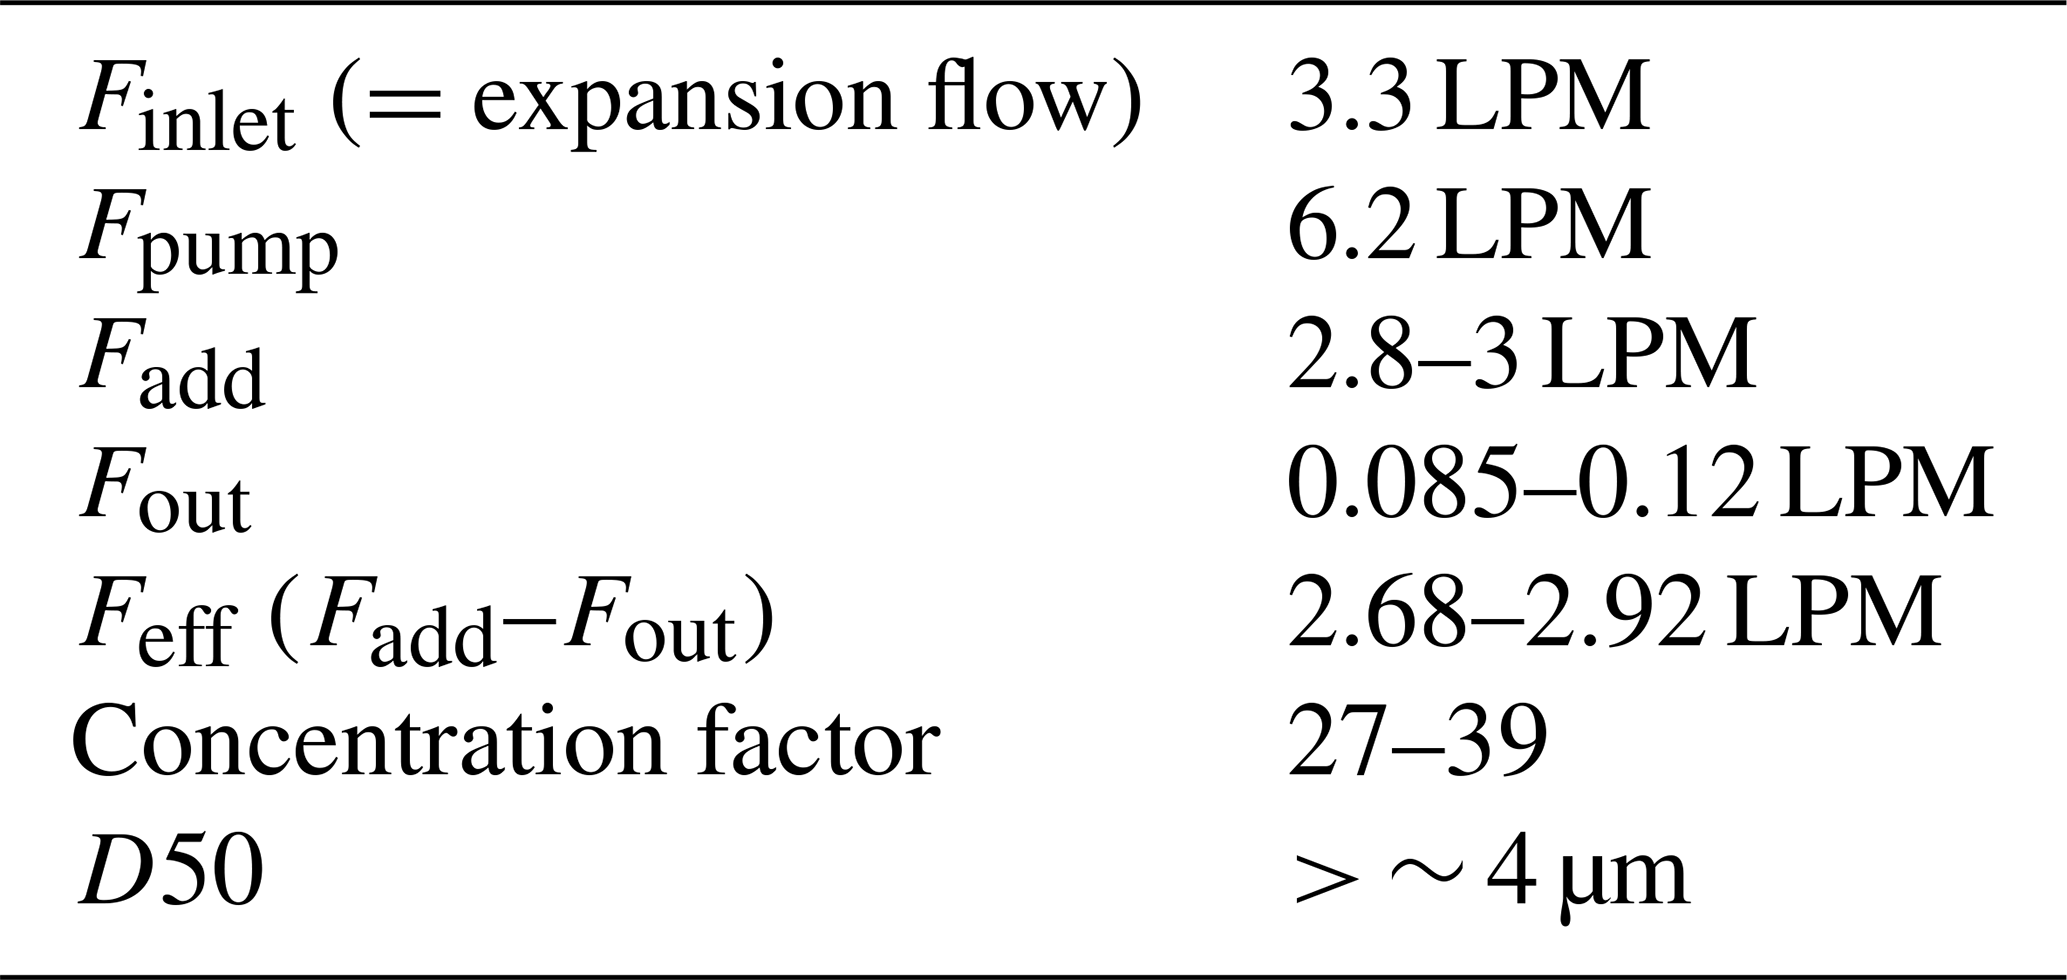
The flow configuration of the PCVI is the following: An inlet flow (Finlet), containing the polydisperse particles, enters the PCVI body in an acceleration nozzle. Inside the PCVI, a stagnation plane is established by an effective counterflow (Feff) which is created by a particle-free add flow (Fadd). There, aerosol particles with a low inertia (and thus smaller size) are rejected and exit the PCVI body within a side-ward directed pump flow (Fpump), while larger particles that have a higher inertia are able to pass the stagnation plane and are transmitted in the output flow (Fout). The D50 thereby depends on the ratios of the flows. The PCVI concentrates the ice particles (and thereby the residuals) by a factor of total inlet to total outlet flow. This concentration factor is, due to the nature virtual impaction (e.g., Sioutas et al., 1995), dependent on the size of the particles. However, this size-dependency was not determined specifically in this study. One experimental challenge for a coupling a PCVI to PINE is that the ice residual characterization instrument(s) must adapt to the rapidly changing system pressure during a PINE expansion experiment. The SPX inlet flow, which is Fout, was set to control at a constant volumetric flow of 0.12 LPM. During the start of expansions the flow dropped to as low as 0.085 LPM before the nominal flow was re-established. This initial flow reduction increased the PCVI counterflow slightly and increased the concentrating factor to as high as 38.6 but otherwise had little effect on PCVI operation. For the coupling of PINE to the PCVI, different flow configurations were tested (see Appendix for more details) to determine the optimal setup, which are listed in Table 1. Please note that Finlet equals the expansion flow in PINE and was adjusted from 4.2 (used in the first laboratory characterization experiments to determine the approximate size of the D50, Appendix, Fig. A3) to 3.3 LPM in the field. This might lead to a shift in the D50 towards larger sizes, as compared to the laboratory characterization experiments, making it is less likely that larger cloud droplets pass the PCVI. During expansion, cloud droplet sizes are determined by diffusional growth processes, and thus strongly depend on temperature; as it is necessary to not have cloud droplets larger than the D50 of the PCVI setup, the experiments were performed at temperatures below −29 °C (see Appendix for more details).
The coupled setup PINE-PCVI was tested using ATD (Arizona Test Dust), an efficient INP (e.g., Murray et al., 2012), at SPL to investigate the transmission of ice crystals upon the presence of ATD in PINE (Fig. 2). For this, ATD particles were dry dispersed and mixed with ambient air, the latter ensured that enough cloud droplets can form during the expansion to mimic realistic cloud formation conditions. This mixture was tested against ambient air only that naturally has a clearly lower ice nucleation activity than ATD. The size distribution was measured with the SPX and the flow settings of the final setup (Table 1) were used but with a slightly reduced Fadd of 2.5 LPM, and PINE was set to a temperature of −29 °C. The size distribution of the mixture of ambient particles with ATD (Fig. 2, panel a) shows an increase in particles larger than 0.15 µm as compared to the ambient particles only. During sampling downstream of the PINE-PCVI during the flush mode, when no cloud formation occurs, only some smaller particles are detected (Fig. 2, panel b) while during the expansion the size distribution clearly shows a large enhancement of both small and large ATD particles. As cloud droplets are not growing to sizes larger than the D50 of the setup (see Appendix for more details), the increase above background is due to ice crystals passing the PCVI. Please note that ambient aerosol particles > 4 µm could be transmitted and misclassified as ice crystals, however, their naturally very low concentration makes such a misclassification unlikely.
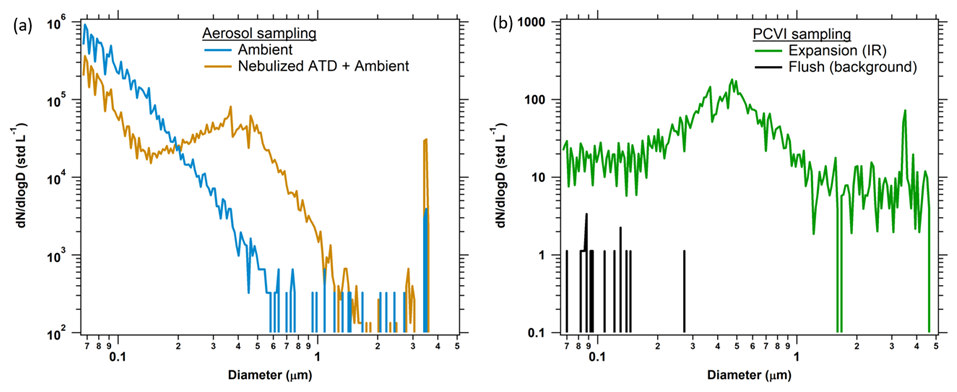
Figure 2Size distributions measured during a PCVI diagnostic experiment at SPL at a temperature of −29 °C determined with the SPX. (a) The size distribution of ambient aerosol compared to a mixture of ambient aerosol with a nebulized ATD solution (plus a dilution flow) clearly shows the presence of larger aerosol particles when ATD is present. (b) The size distribution determined downstream of the PCVI while PINE was in the flush mode (black line) and in the expansion mode (green line) sampling the ambient/dust mixture. Size distributions are the average of 47 PINE experiments. Above a size of 0.45 µm a clear reduction of particles in the flush (background) is observed. The ice residual concentrations during expansions of 31.9 and 29.7 stdL−1 (small particles below 0.45 µm, large particles above 0.45 µm) were higher than the background concentrations during the flush mode of 0.18 and 0 stdL−1 by a factor of 180 and more than 2560, respectively (lower limit). Concentrations in panel (b) are down-scaled by the PCVI concentrating factor of 31.8.
From the ratio of the diluted ambient/dust mixture to the flush average we estimate the PCVI's small aerosol rejection factor as ∼ 0.5–2×10⁴. During the expansions PINE measured an average INP concentration of 377 ± 83 stdL−1, giving a transmission efficiency of ice crystals as compared to INP concentration through the PCVI in this configuration of 16 %.
2.5 Back trajectory analysis and aridity conditions
For four selected events in April 2022 and 2025 with peak INP concentrations, back trajectory calculations were performed to investigate the main source regions of the air masses, using STILT (Stochastic Time-Inverted Lagrangian Transport Model, Lin et al., 2003, Fasoli et al., 2018). STILT is a particle dispersion model. It models the release of an ensemble of aerosol particles from the receptor site which is traced backward in time. The average trajectory of the ensemble is calculated using meteorological wind fields and random velocities which are typical features of boundary layer transport processes. By doing so, the upstream area that influences the air arriving at the receptor site is derived, so-called footprints.
For our analysis, we selected four events of elevated INP concentrations, lasting between 12 h and 3 d. For this, 1000 particle ensembles were calculated every hour from the receptor location (SPL) and tracked 72 hours back in time starting 4 h before to 4 h after each event. Then an average footprint for one event was calculated.
For an estimation of the impact of arid regions on the INP concentration at SPL, such as local and regional deserts in the United States (US) and other potential sources for dust particles, we use a novel approach and combined the STILT footprints with VegDRI (Vegetation Drought Response Index, Brown et al., 2008). VegDRI models drought stress on vegetation and is derived from a combination of satellite and climate data and surface properties like land cover, soil type, and elevation. While VegDRI is available for the entire US, we constrained our VegDRI mapping and analysis for arid ecoregions only, which are North American Desert regions (e.g., Omernik and Griffith, 2014).
3.1 Seasonal variability in INP concentration
PINE was operated from October 2021 to May 2022, and from January to May 2025 resulting in ∼ 60 000 single INP concentration measurements between −22 and −32 °C. With that, the seasonal change in INP concentration in a broad temperature range relevant for mixed-phase cloud formation is investigated, as well as annual differences between January to May 2022 and 2025. Typically, the temperature scans were performed continuously, with each scan taking approximately 2 h. This allowed us to detect short-term fluctuations related to, e.g., changes in the air mass and aerosol properties. An exception is a period in January and February 2022, when PINE was coupled to a PCVI for ice residual analysis that required that the measurements were performed below a temperature of −29 °C.
During winter 2025, the PINE deployment was part of the U.S. National Science Foundation sponsored Snow Sensitivity to Clouds in a Mountain Environment (S2noCliME) field campaign, which deployed a wide range of instrumentation in the Park Range of Northern Colorado to study cloud and precipitation processes in a mountainous environment during the 2024–2025 winter season.
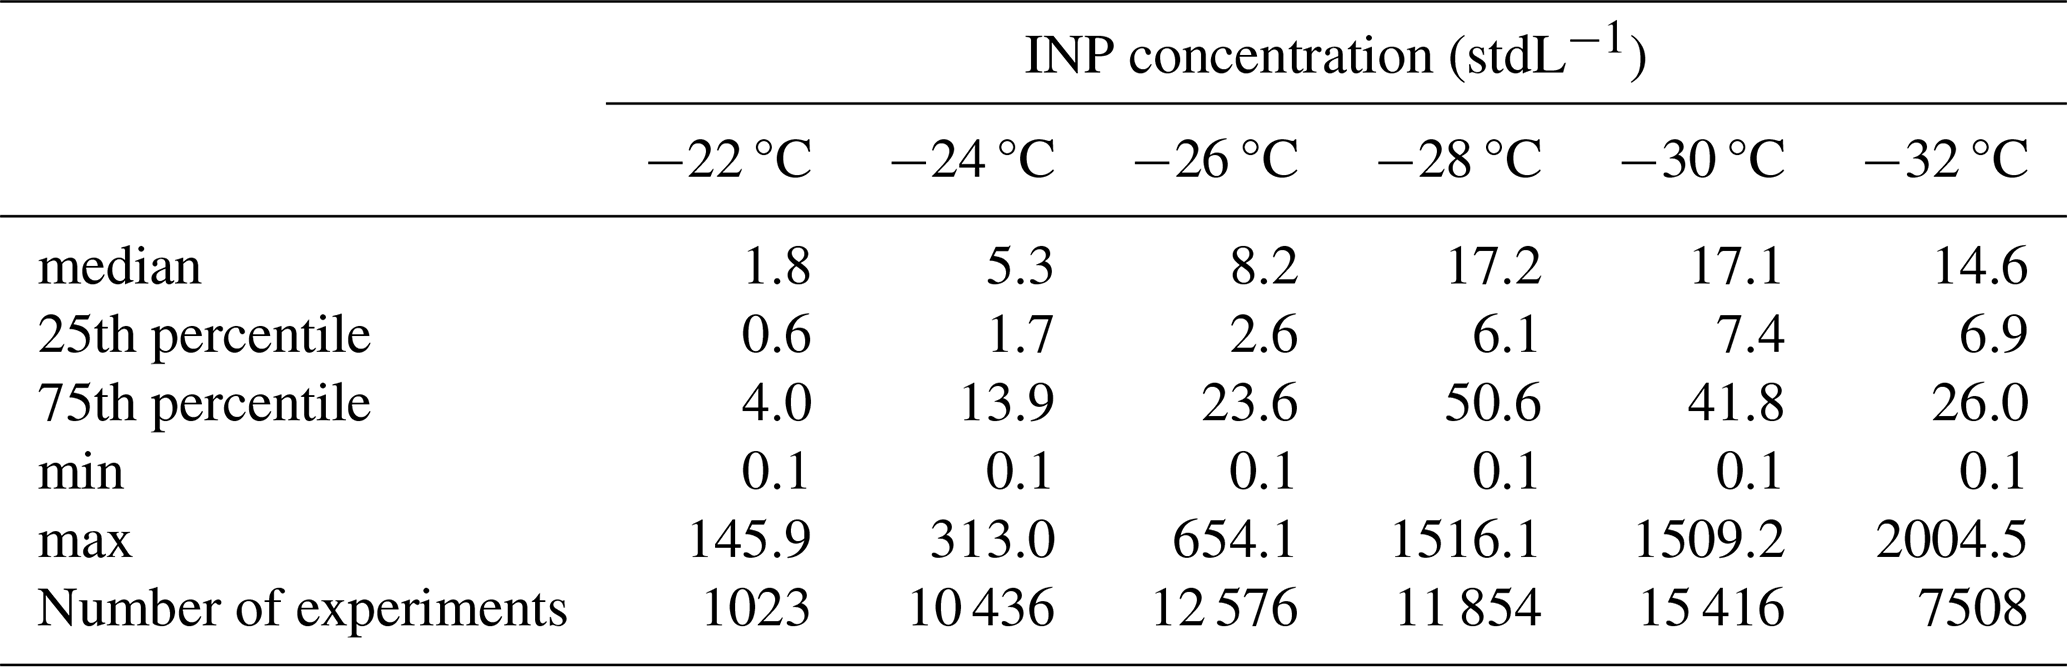
During the campaigns, the INP concentration spanned more than 5 orders of magnitudes in the observed temperature range, with values from below the LOD and up to 2000 INP stdL−1 (Fig. 3; Table 2). In general, INP concentrations below the LOD were frequently observed at temperatures above −24 °C from October to January, however, in spring, the INP concentrations across the observed temperature range increased. At temperatures below −24 °C, all measurements in spring 2022 and most measurements in April and May 2025 were above the LOD.
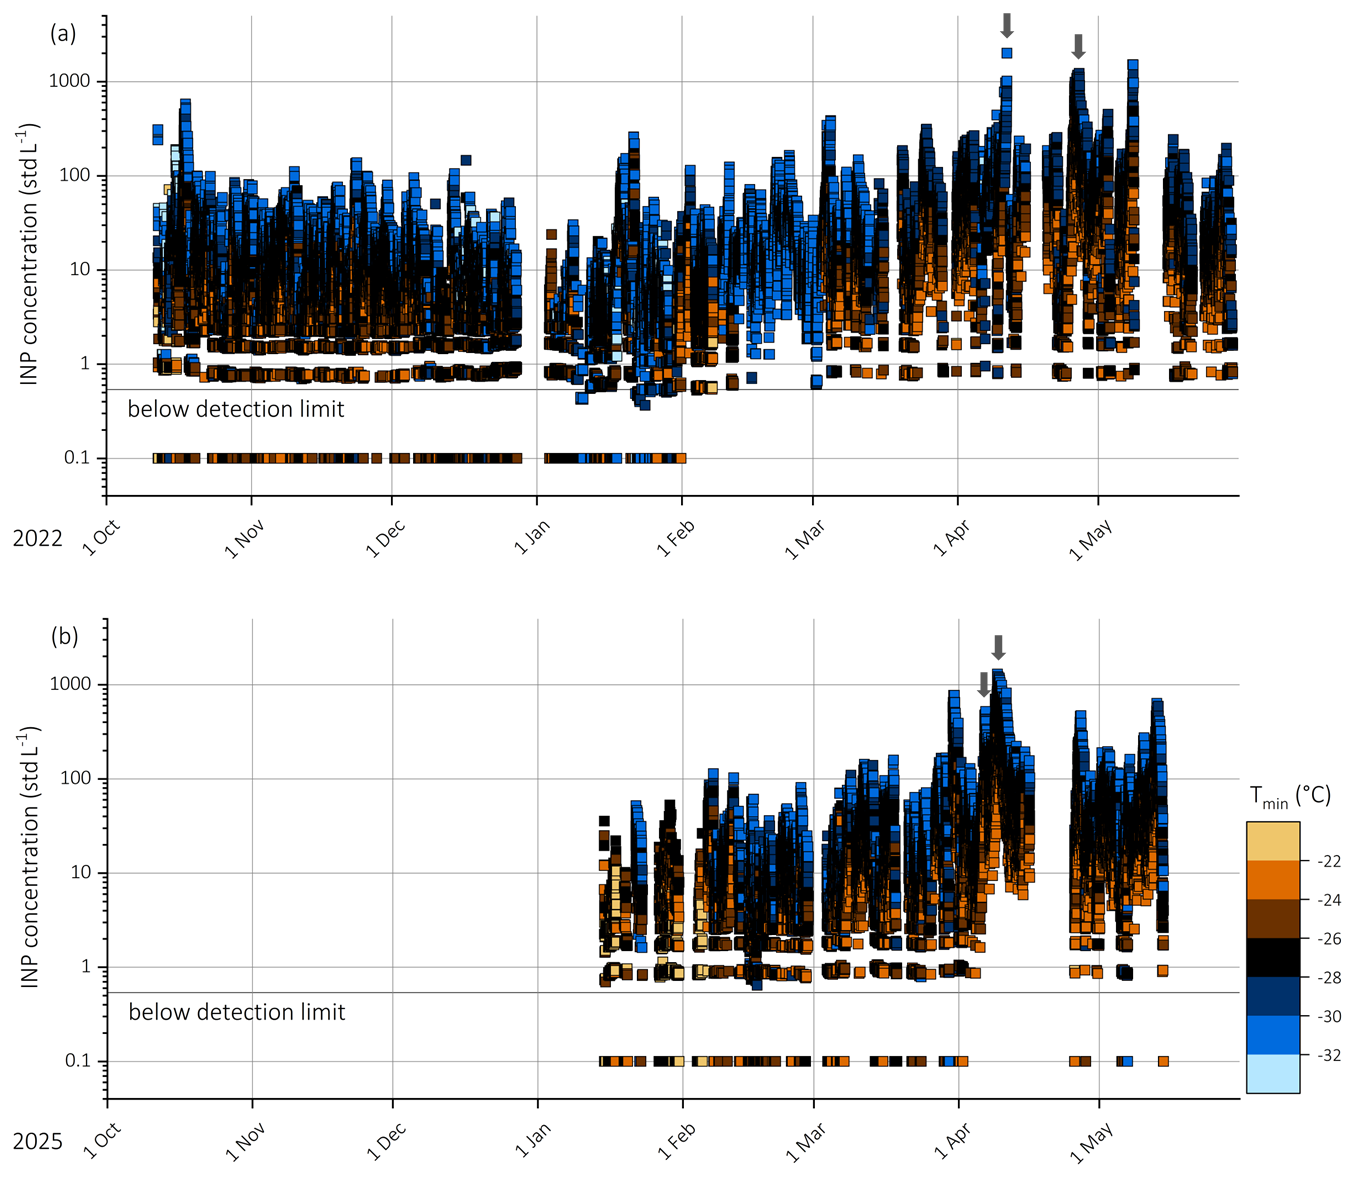
Figure 3Timeseries of the INP concentration from October 2021 to May 2022 (a) and from January to May 2025 (b). Colors represent the nucleation temperature (±1 °C) with INP concentrations below the LOD depicted as values of 0.1 stdL−1. Grey arrows indicate events of elevated INP concentrations that are discussed in Sect. 3.2.
Table 2INP concentration statistics at each measurement temperature (±1 °C) for the whole campaign. INP concentrations below the LOD depicted as values of 0.1 stdL−1.
In general, a seasonal variability is observed with a slight decrease in the median INP concentration from autumn (October/November) to winter (December/January/February) (Fig. 4; Table A1), and an increase in spring (March/April/May). Moreover, the median INP concentration in the observed temperature range is very similar for both measurement periods 2022 and 2025 (Fig. 4, panel b). The lowest INP concentration was observed in January 2022, with median values below 10 INP stdL−1 at all temperatures. In spring, an increase in the INP concentration is detected, with highest values in April when the median INP concentration increased to values above 10 stdL−1 across the observed temperature range. As compared to January and February, when only 42 % of the measurements are above 10 INP stdL−1 (45 % in January and February 2022 and 33 % in January and February 2025), 86 % of the measurements in April are above this value (84 % in April 2022 and 87 % in April 2025; Fig. 5). Such a variation in the INP concentration larger than one order of magnitude is relevant to cloud microphysical properties (Phillips et al., 2003). Moreover, as this feature is observed for both measurement periods in 2021/2022 and 2025, it is an indication for a seasonal trend at SPL.
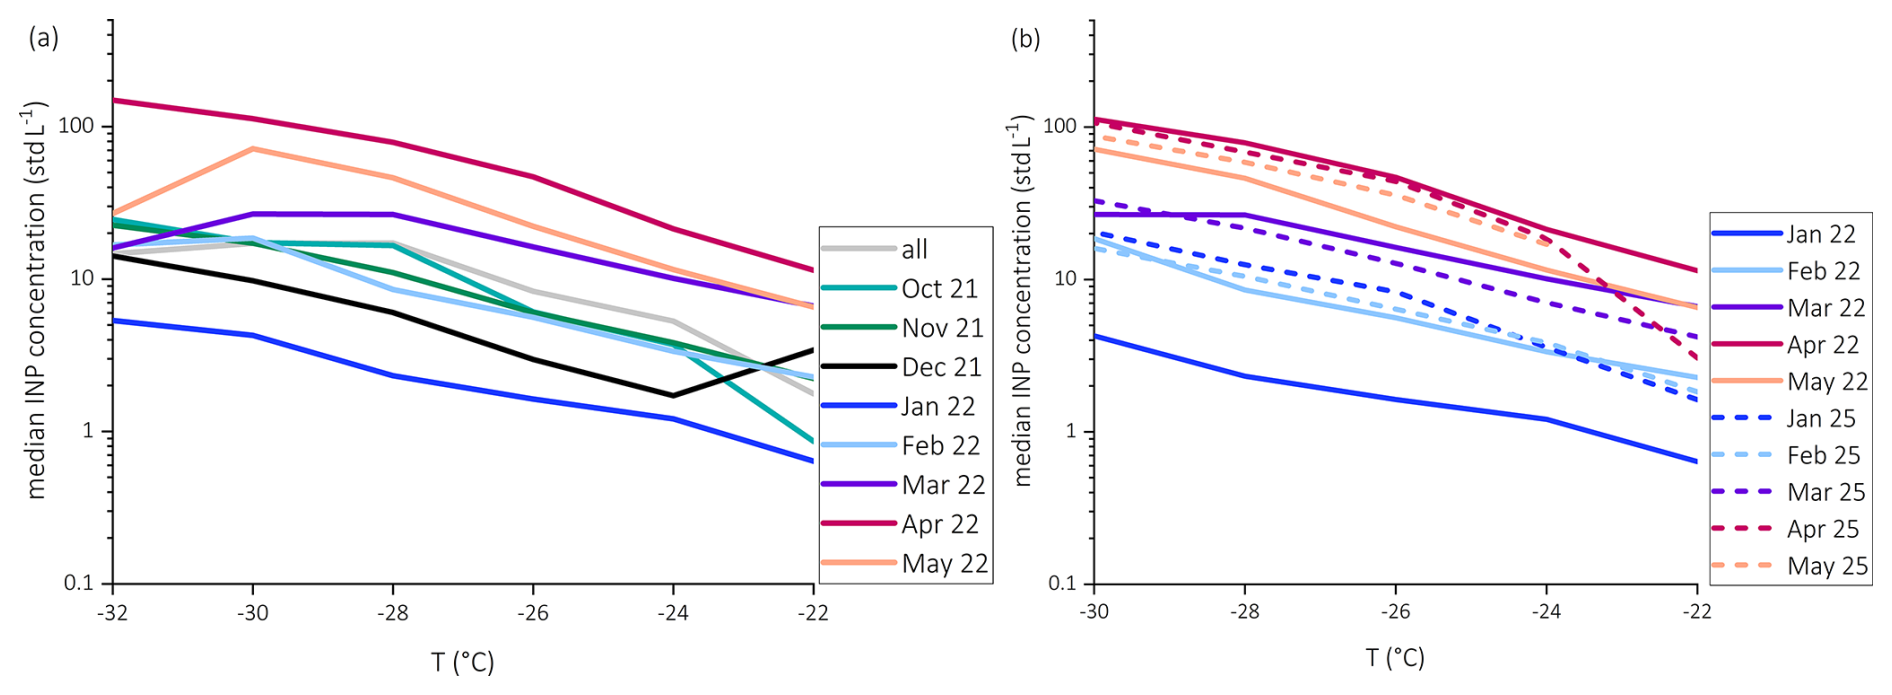
Figure 4Median INP concentrations as a function of temperature (±1 °C) for the whole campaign (2021/2022 and 2025) and the individual months (October 2021–May 2022, a) and for the months January to May from the two field campaigns in 2022 and 2025 (b). For calculating the medians, values below the LOD are included as 0.1 INP stdL−1.
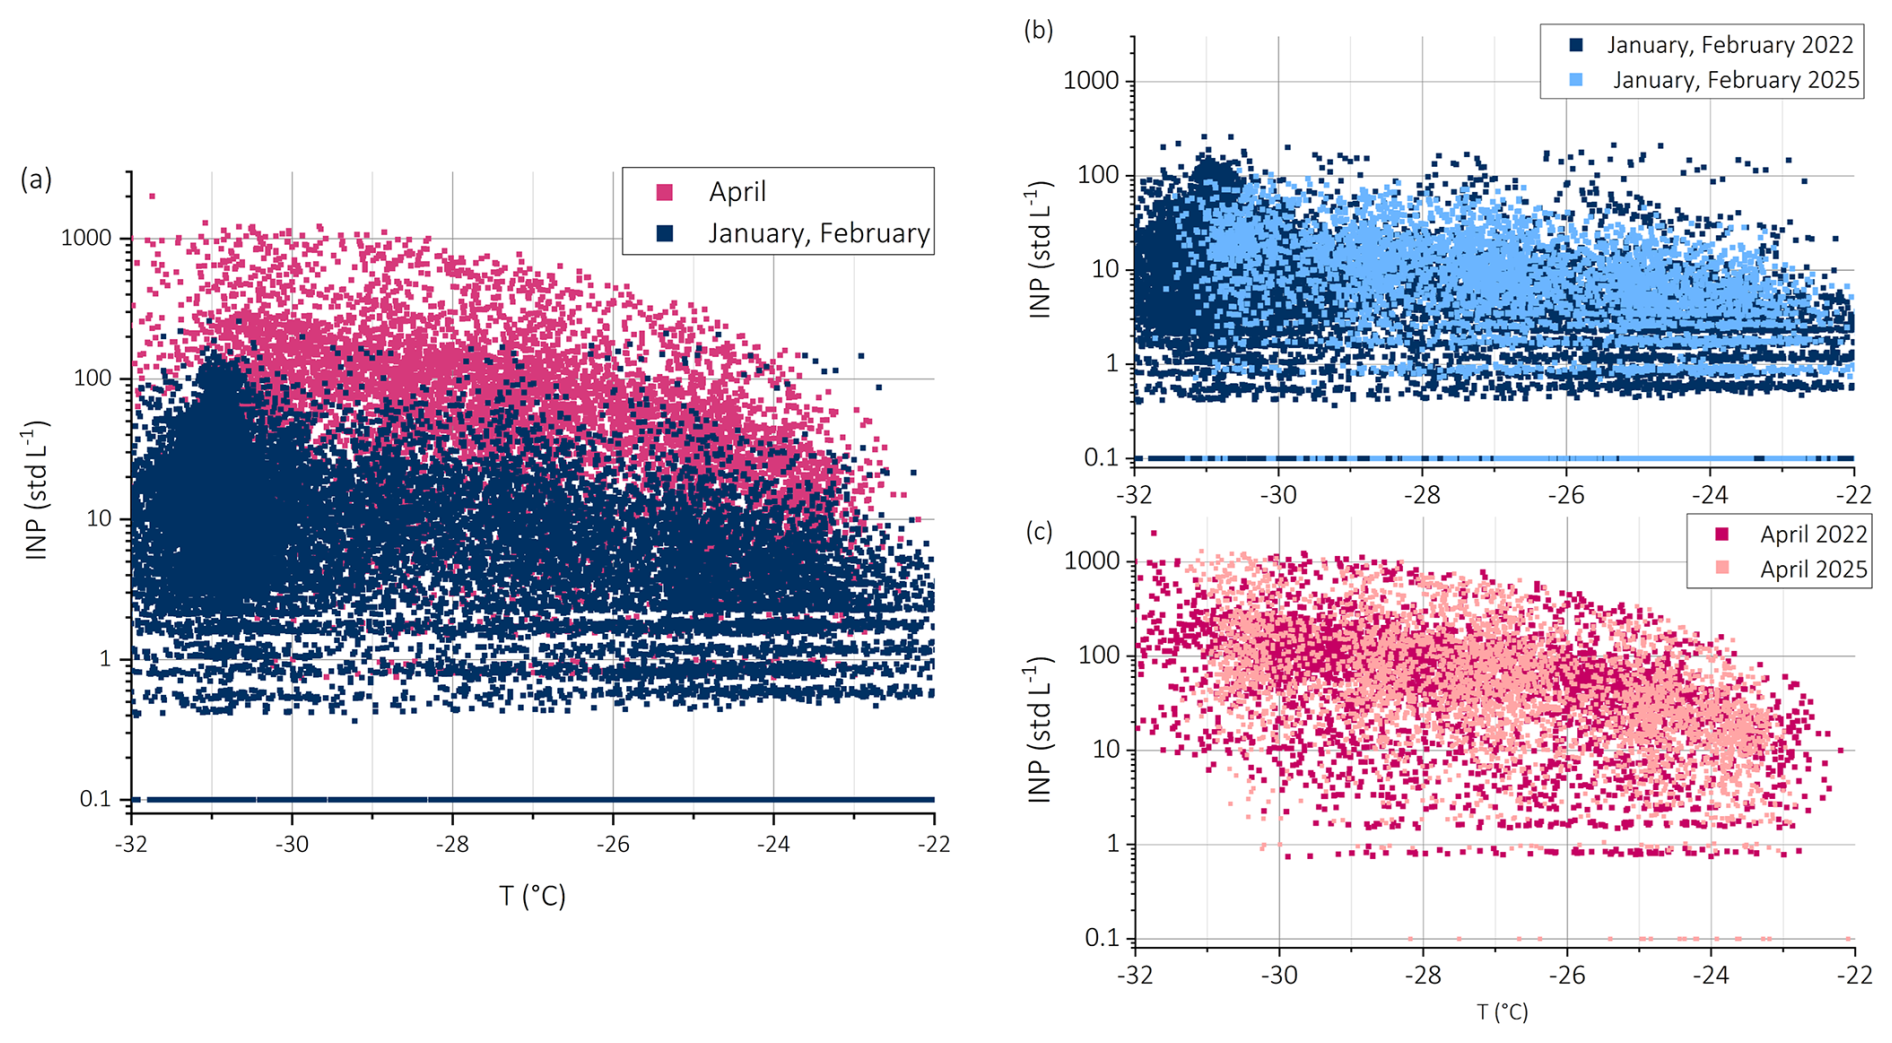
Figure 5INP concentration as a function of temperature for the measurements in April and January, February from both measurement campaigns in 2021/2022 and 2025 (a), for the measurements in January, February 2022 and 2025 (b) and for the measurements in April 2022 and 2025 (c). Values below the LOD are shown as 0.1 INP stdL−1.
Interestingly, the variability in the INP concentration is similar for each month, as indicated by the inter-quartile range (25 % to 75 % of the data; Fig. 6). For most months, the inter-quartile range is smaller than one order of magnitude (Fig. A1). An exception is the month of January 2022, when the lowest INP concentrations are observed, leading to a higher variability towards lower values. Especially at temperatures warmer than −24 °C, the 25 % quartile is below the LOD.
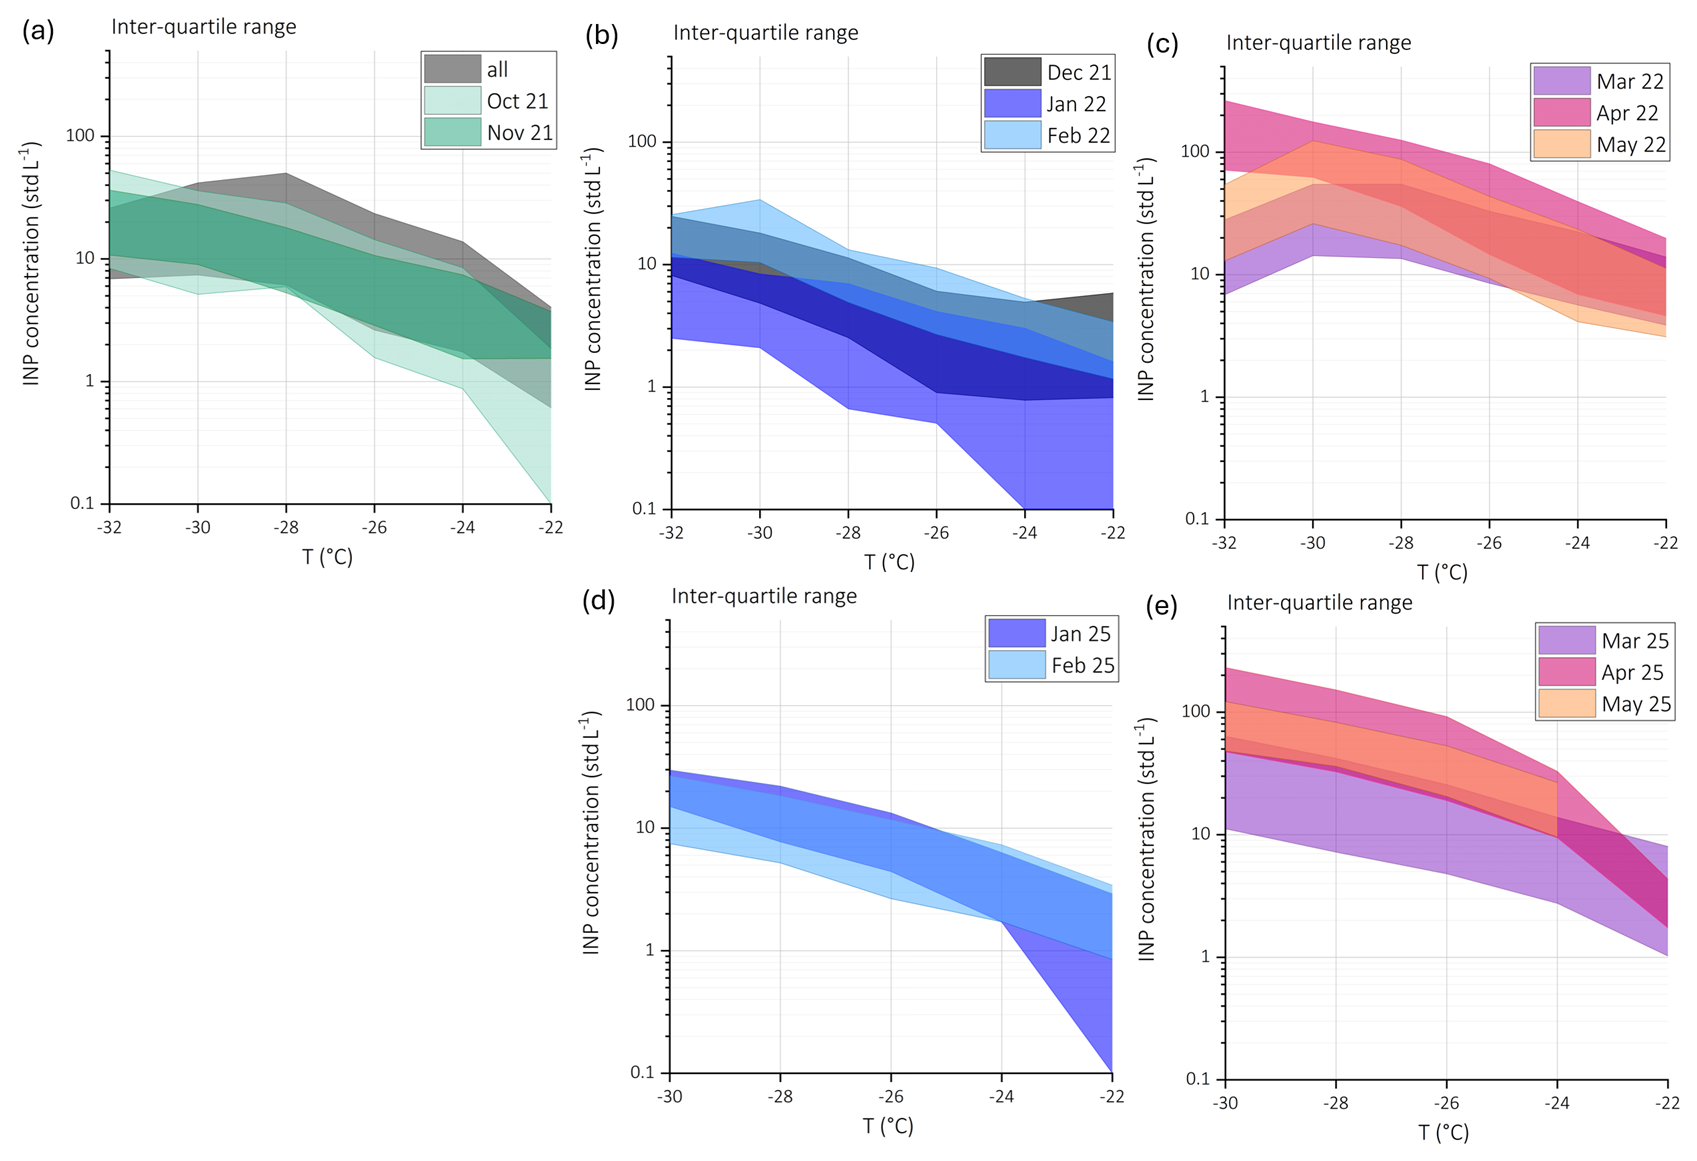
Figure 6Inter-quartile range (25 % to 75 % of the data) of INP concentrations as a function of temperature (±1 °C) for all the campaigns and autumn 2021 (a), winter 2021/2022 (b), spring 2022 (c), winter 2025 (d), and spring 2025 (e). Values below the LOD are included as values of 0.1 INP stdL−1.
An interesting feature of the data is the strong increase in the INP concentration of approximately one order of magnitude in spring, with the median value and inter-quartile range mostly exceeding 10 INP stdL−1 within the respective temperature range. This might be due to increased dust emissions during this time in the Western US (e.g., Kim et al., 2021). While transported dust across the Pacific Ocean can contribute to this increase, local dust sources from deserts and semi-arid regions are important as well, and subject to become more important with climate-driven changes (e.g., East and Sankey, 2020). A more detailed analysis of the contribution of local and regional dust to the INP population will be discussed in Sect. 3.2.
3.2 Impact of local and regional dust sources on INP concentration
During both April 2022 and 2025, the highest INP concentrations were measured with values above 1000 INP stdL−1 at −30 °C. For a better understanding of potential source regions during events of peak INP concentrations in the observed temperature range −22 to −32 °C, so-called footprints were calculated and combined with surface maps of aridity of arid ecoregions, namely North American Desert regions (see Sect. 2.5). The median INP concentration and IQR for these months are similar in the observed temperature range (see Sect. 3.1), and interestingly, also the occurrence of extreme drought and drought conditions in April 2022 and 2025 are also similar (Fig. A2).
Four case studies in April 2022 and 2025, when events of peak INP concentrations occurred were analyzed in more detail using back-trajectories in combination with aridity information (Fig. 7). An increase in INP concentration was observed across the entire measurement range (−22 to −32 °C). For clarity, the INP concentrations within the narrower range of −28 to −30 °C are presented below.
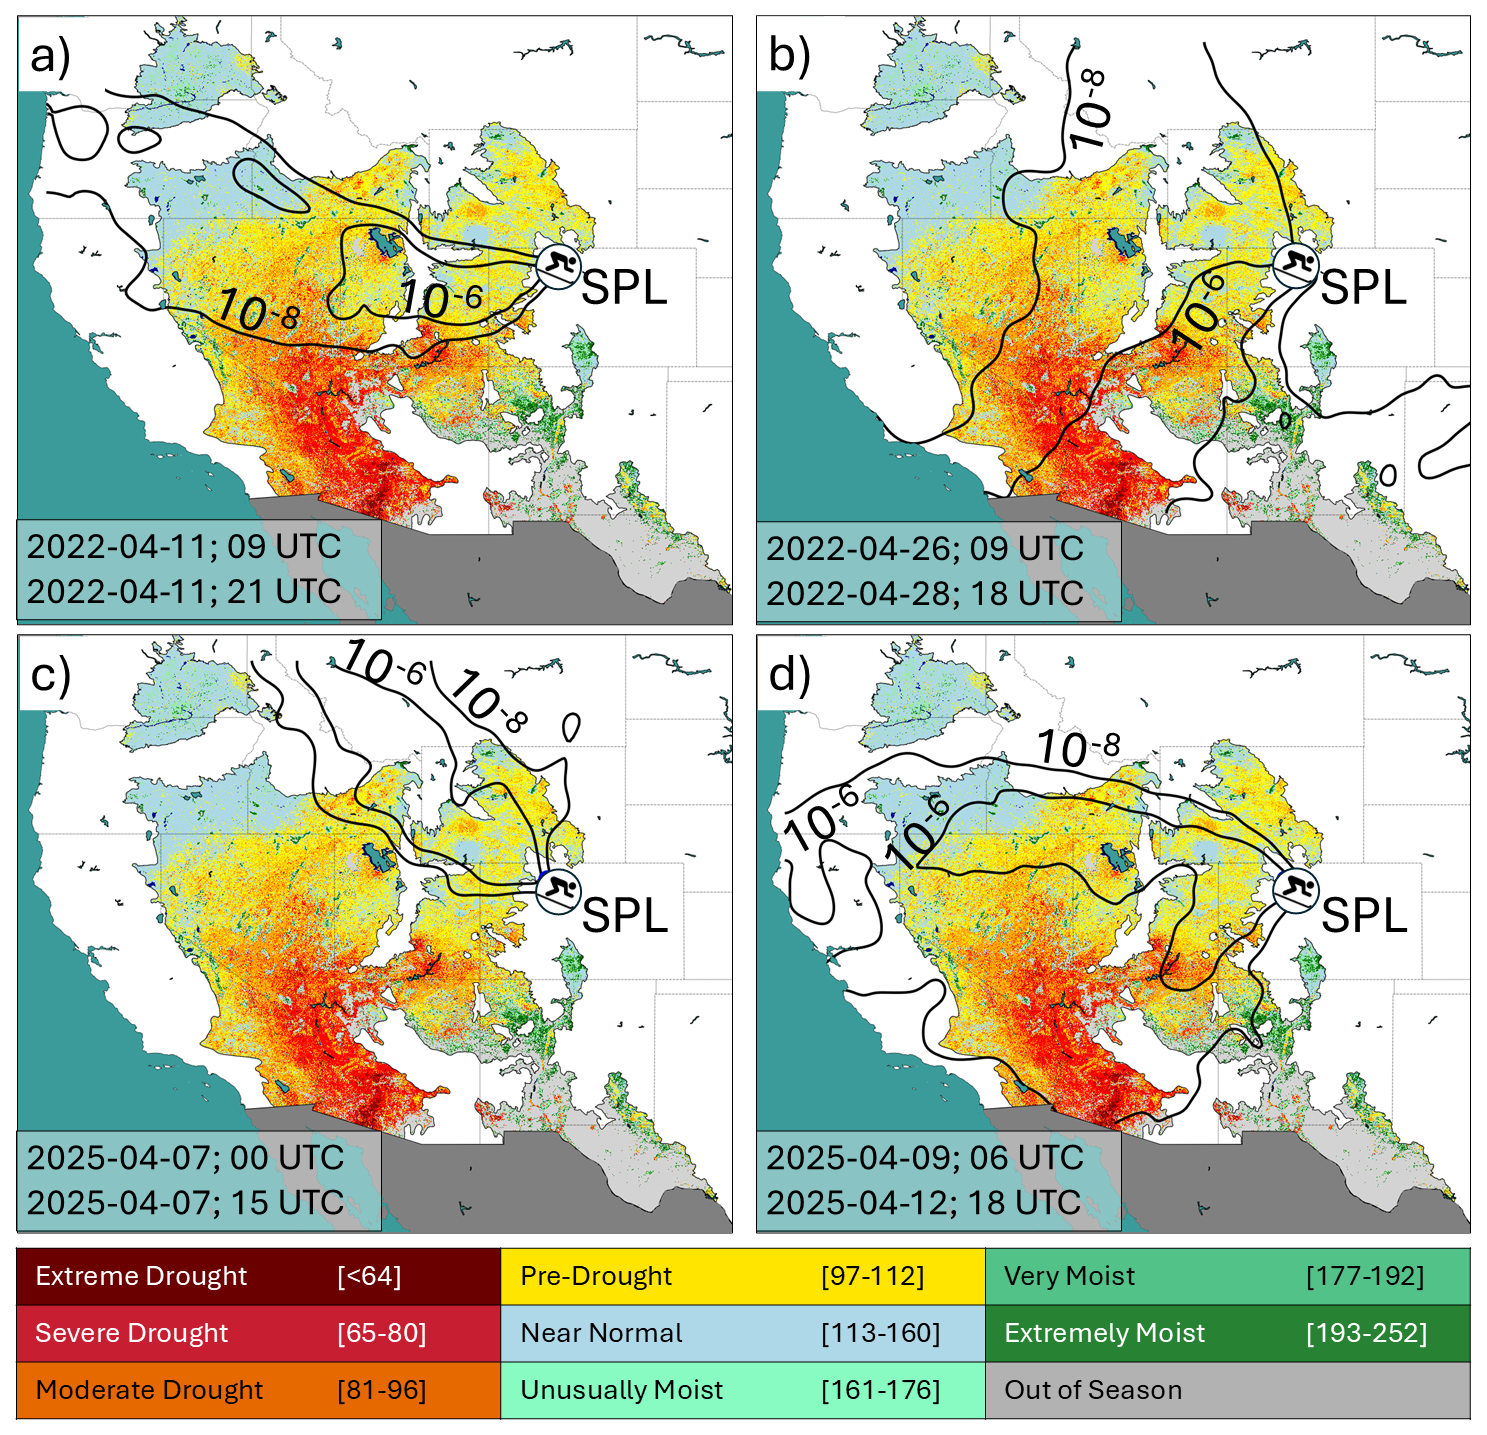
Figure 7Footprints computed with the STILT model combined with surface maps of aridity using VegDRI of North American Desert ecoregions. Contours of the footprint are in units of PPM/µmole m−2 s−1 (surface influence footprint; Fasoli et al., 2018). Events of elevated INP concentrations were analyzed on the 11 April 2022 (a, INP concentration at −30 °C up to 1000 INP stdL−1), on the 26 to 28 April 2022 (b, INP concentration at −30 °C up to 1000 INP stdL−1), on the 7 April 2025 (c, INP concentration at −30 °C up to 500 INP stdL−1), and on the 9 to 12 April 2025 (d, INP concentration at −30 °C up to 1000 INP stdL−1).
On the 11 (09:00–21:00 UTC) April 2022 (Fig. 7, panel a), the INP concentrations increased from approximately 100 to 900 INP stdL−1 , and on the 26 (09:00 UTC) to 28 (18:00 UTC) April 2022 (Fig. 7, panel b), an increase from below 100 INP stdL−1 to 1000 INP stdL−1 was observed. The footprints of the back-trajectories averaged over these events indicate arid regions west of SPL contributed to the air masses, where pre-drought to severe drought conditions were observed.
In 2025 on the 7 April (Fig. 7, panel c), a moderate increase in INP concentration was observed, from approximately 30 to 400 INP stdL−1and back-trajectories indicate north-westerly regions as a source of the air masses. However, in contrast to the other cases, only pre-drought conditions occurred in the source region, which might explain the less strong increase in INP concentration. During the second event in 2025, which started on 9 to 12 April (Fig. 7, panel d), a strong increase in INP concentration occurred, from approximately 100 to 1000 INP stdL−1. Again, here the source regions were west of SPL, where pre-drought to extreme drought conditions occurred, that might explain the strong increase in the INP concentration.
For comparison, we also performed back trajectory analyses in combination with surface maps of aridity for two cases of low INP concentration (Fig. A3). Interestingly, the footprints are more widespread as compared to the discussed cases of high INP concentration, and make an interpretation with regard to distinct local and regional dust sources difficult. The back trajectory calculations only (Fig. A4) show more clearly that the footprints for the low INP cases, in comparison to the high INP cases, are broader, indicating that during this time the station measured particles from a more diverse source of aerosols and not only local dust sources.
In general, springtime dust concentrations in the US are elevated (e.g., Kim et al., 2021) which is likely contributing to the observed elevated INP concentration in this season (see Sect. 3.1.), highlighting the importance of regional dust sources to INP concentration. This finding is in agreement to the study by Munroe et al. (2023), who identified regional dust sources to contribute clearly to the dust load in the Rocky Mountains. However, transported Asian dust can contribute to the INP population during different air mass conditions and at other locations in the US (e.g., Creamean et al., 2013; Hallar et al., 2015). Although dust emission sources are globally increasing due to land-use change and an increase in surface temperature (Mirzabaev et al., 2019), the dust activity over East Asia was found to decline from 2001 to 2017 (e.g., Wu et al., 2022). This can lead to a change in the relative importance of long-range transported Asian dust and regional dust in the US. Due to increasing droughts in this region (e.g., Williams et al., 2020), it can be expected that the atmospheric abundance of regional and local dust will increase. How this impacts INP number concentrations and mixed-phase cloud properties should be assessed in more detail in future studies. The establishment of monitoring networks in the US, such as ACTRIS in Europe, can help to better assess changes in cloud variables and improve model representations of ice processes (DeMott et al., 2025).
3.3 INP size
The investigation of the INP size distribution is a first step in getting an insight in their underlying nature (Vali, 1966). During the first campaign in 2021/2022, the sizes of the INPs were analyzed using three approaches: First, a comparison between the INP concentration and parallel measurements of particle concentration larger than 1 µm was conducted for the entire duration of the campaign; second, the size of the INPs was analyzed with a novel setup of PINE coupled with a PCVI, selecting ice residuals that are sized with an OPC during January and February 2022 (see Sect. 2.3); third, the dominant INP size range was investigated during May 2022 by comparing alternating measurements on and off impactor, restricting the sampled particle size distribution to below 1 µm.
3.3.1 Parallel measurements of super-micrometer-sized particles
Short-term fluctuations in the INP concentrations were frequently observed, with increases of more than one order of magnitude on the timescale of hours. Examples of two events in November 2021 (Fig. 8, panel a) and April 2022 (Fig. 8, panel b) reveal that the INP concentration in the observed temperature range increased together with the aerosol particle concentration larger than 1 µm. This indicates that super-micrometer particles contribute to the INP population at the site, and also highlights the need for high-time resolved measurements of INP and aerosol properties, as such short-term variabilities can have an impact on cloud properties (e.g., Tan and Storelvmo, 2016).
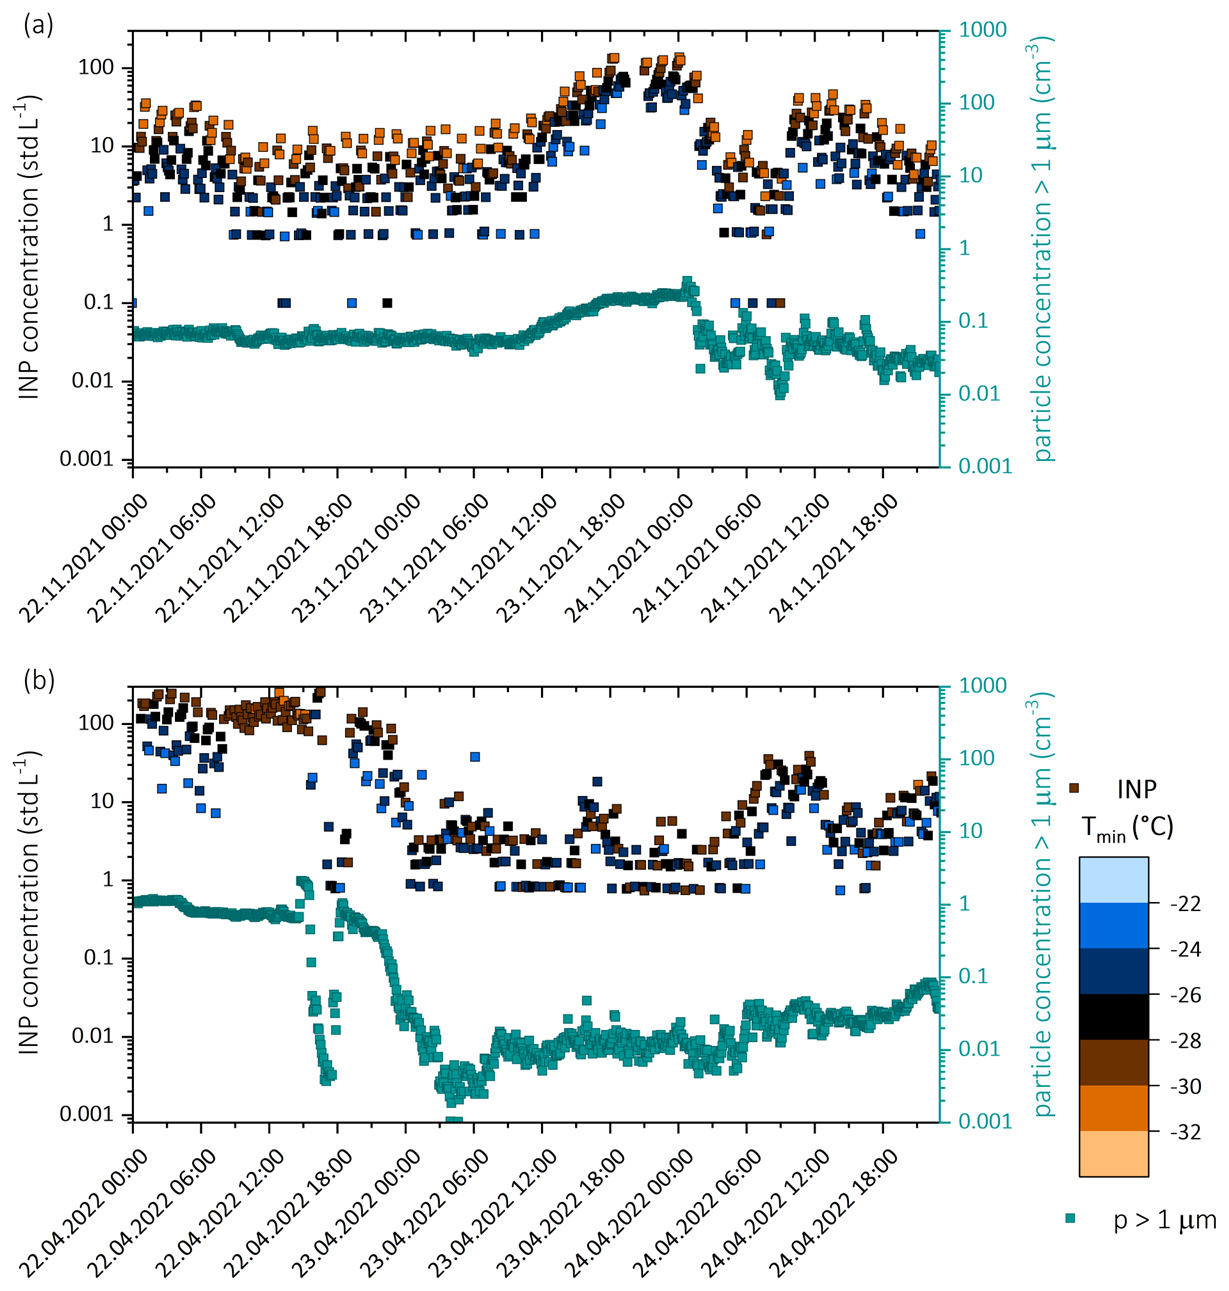
Figure 8Timeseries of the INP concentration and aerosol particle concentration larger than 1 µm from 22 to 24 November 2021 (a) and from 22 to 24 April 2022 (b). Blue and brown colors present the nucleation temperature (±1 °C), and green the aerosol particle concentration larger than 1 µm. INP concentrations below the LOD are presented as values of 0.1 stdL−1.
Indeed, an analysis of the Spearman's ranked correlation coefficient, for the whole campaign and for the individual months of 2021 to 2022, show moderate to strong positive correlations between INP concentration and the concentration of super-micrometer sized aerosol, with values up to 0.86 (Table 3. Fig. 9), especially in autumn and spring. This is a relatively high correlation coefficient compared to other studies. E.g., DeMott et al. (2010) investigated the relation between INP number concentration from global measurements and particle concentration > 0.5 µm and found values between 0.6 and 0.8 for temperatures between −11.5 and −33.5 °C. At an high-altitude station, correlation coefficients with values between 0.4 and 0.6 were found for INP concentration at −31 °C and particle concentration > 0.5 µm (Lacher et al., 2018). One driving factor of lower observed correlation coefficients in these studies might be the smaller size (0.5 µm as compared to 1 µm), suggesting that larger aerosol particles such as dust contributes considerably to the INP population in general and especially at SPL during these months. Interestingly, the relation is weaker during January and February as compared to the other months, with lowest correlation coefficients in February, suggesting that also smaller aerosol particles contribute to the INP population during this time.
Table 3Spearman's ranked correlation coefficient for aerosol particle concentration larger than 1 µm and the INP concentration at temperatures between −22 and −32 °C, for the whole campaign and the individual months. Bold font indicates correlation coefficients above 0.70.
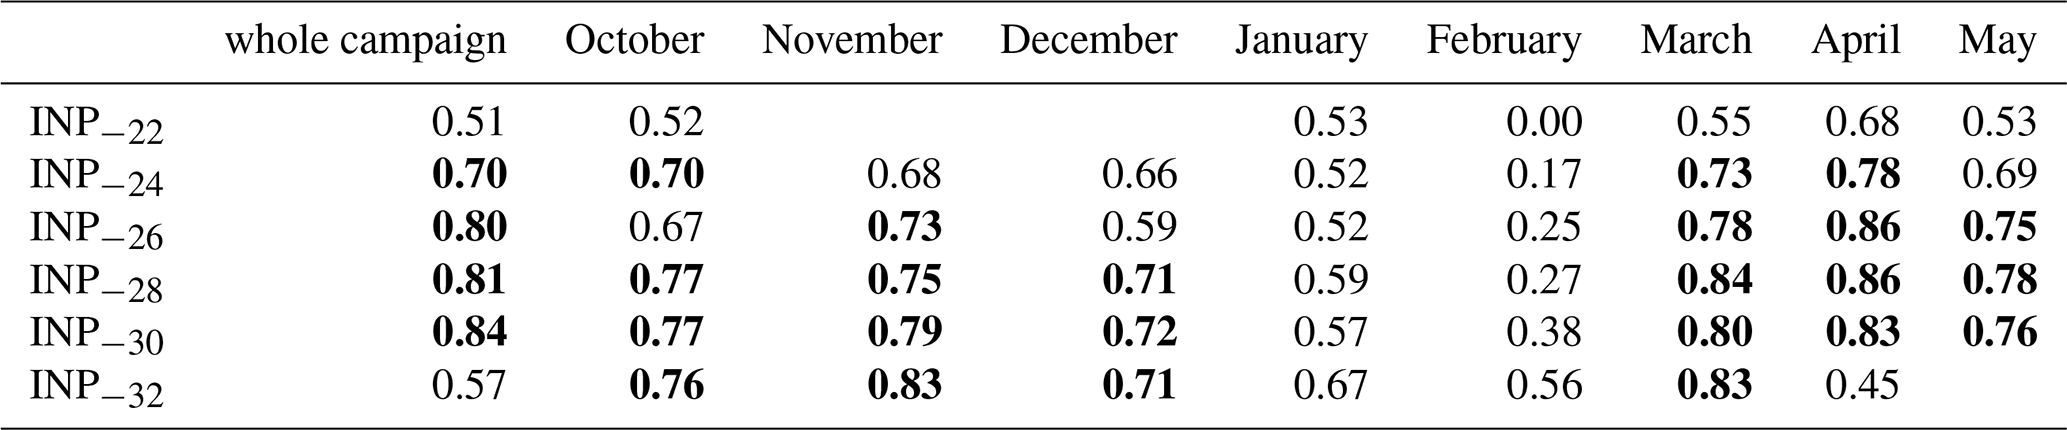
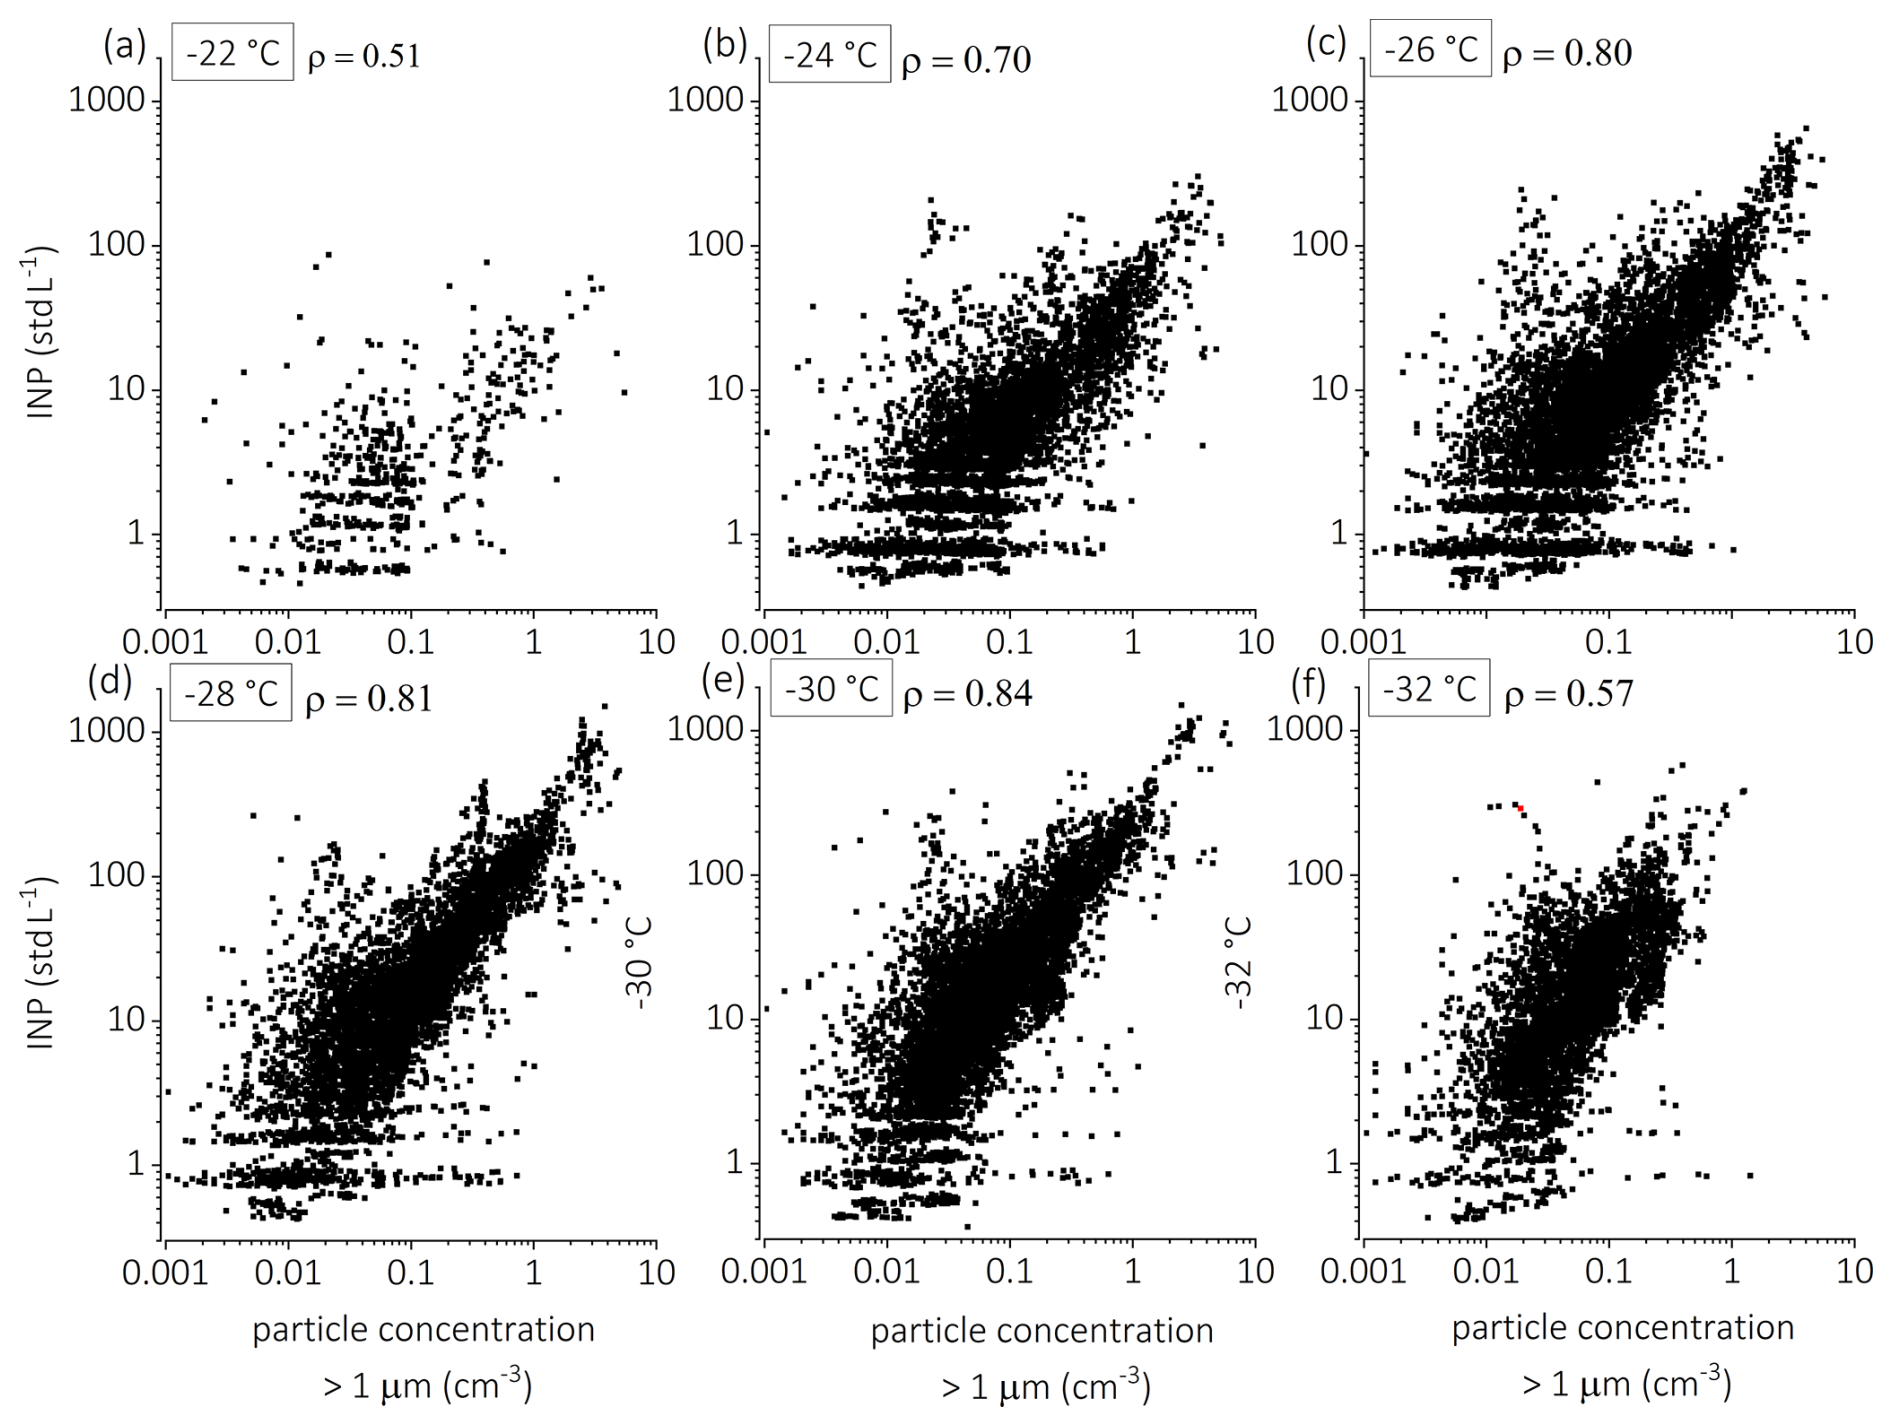
Figure 9Relation between the INP concentration and particle concentration larger than 1 µm for the whole campaign at temperatures between −22 and −32 °C (a–f). Spearman's correlation coefficients ρ are given for each temperature.
3.3.2 Ice residual measurements
The ice residual size distribution averaged over 3784 PINE expansions from the 12 to the 20 February 2022 show that both super- and submicrometer particles contributed to the INP population at temperatures below −29 °C (Fig. 10). The average size distribution downstream of the PCVI during PINE flush mode, when only aerosol particles are present, is compared to the average size distribution during expansions, when aerosol particles, cloud droplets and ice crystals can be present (Fig. 10, panel a). Average expansion concentrations were 2.0 and 0.3 stdL−1 for small and large sizes, respectively (break at a diameter of 0.45 µm), and are well above the background particle concentrations of 0.25 and 0.01 stdL−1 determined during the flush mode. Although it is possible that large droplets (and aerosols) passing through the PCVI also contribute to the measured residuals, we calculate that cloud droplets at this temperature reach sizes below the D50 of the PCVI (see Appendix for a calculation of cloud droplet growth and droplet evaporation), and we show in Fig. A4 that droplet transmission appears to subside at temperatures below −28 °C, such that the ice residual measurements at −29 °C should not be impacted by droplet residuals. Therefore, we conclude that the measured residuals are coming from ice crystals, demonstrating the feasibility of the novel setup of PINE coupled to a PCVI.
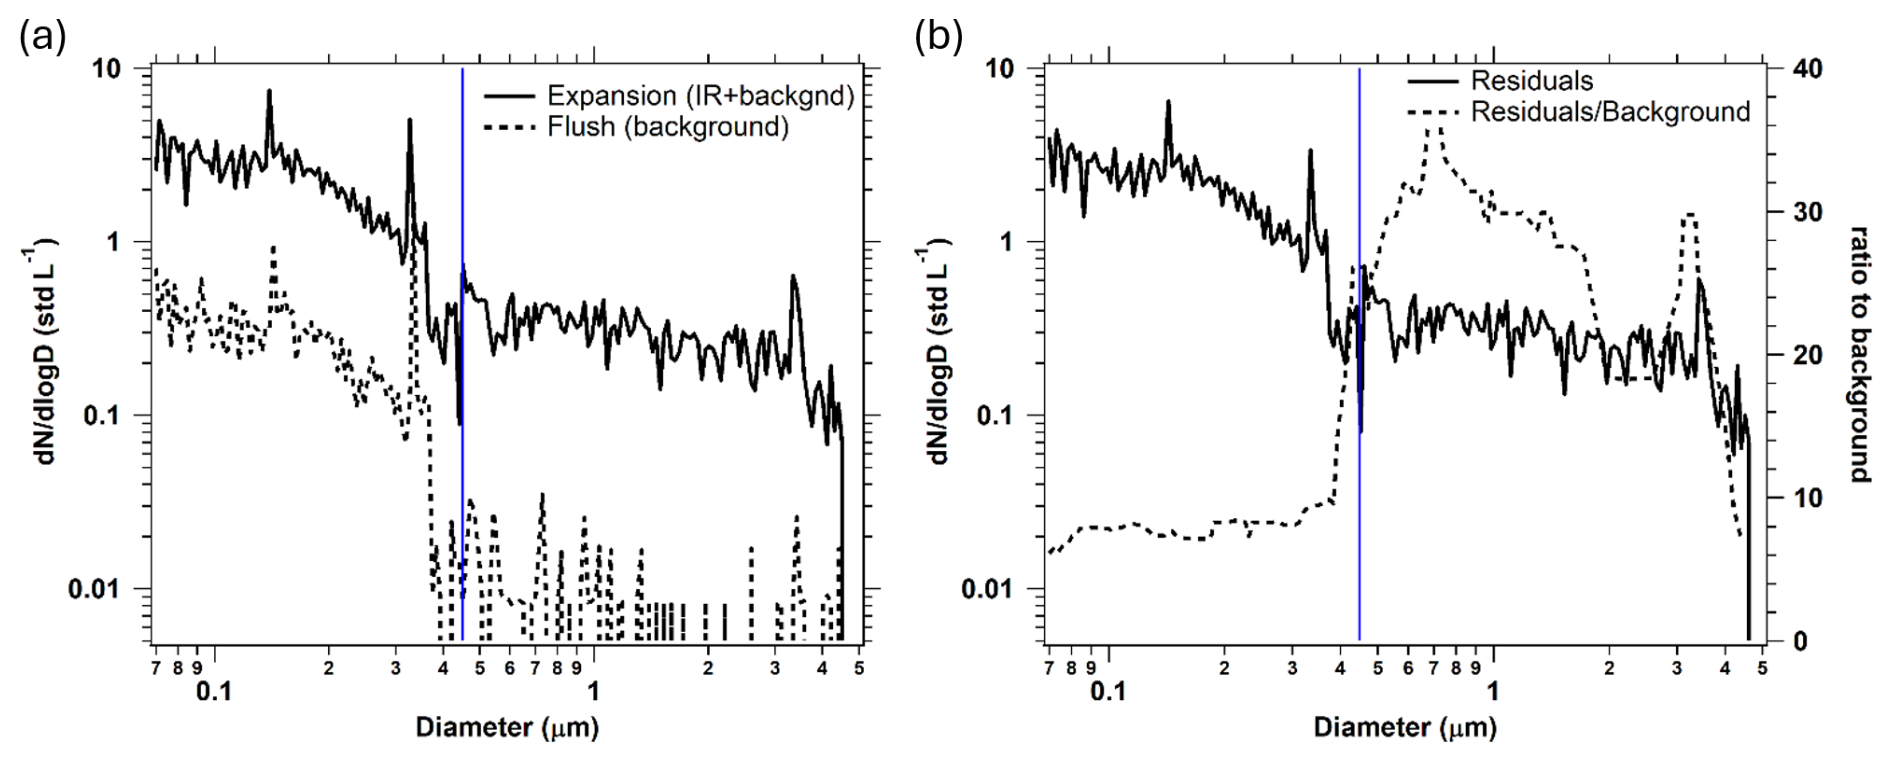
Figure 10Average particle size distributions recorded downstream of the PCVI for 3784 PINE expansions and corresponding flush modes during nearly continuous operation from 12–20 February 2022. (a) residuals plus background aerosol particles during expansion (solid line) and flush mode background particles (dashed line) at temperatures below −29 °C. (b) residual size distribution after subtracting the background (solid, left axis) and the ratio of residuals to background particles (dashed, right axis). All concentrations are reduced by the PCVI concentrating factor of 27.5. Blue lines indicate the break between small and large particles (0.45 µm). Sizes are reported as Polystyrene Latex particles diameter used for calibration and sizes are reported as optical diameters assuming spherical particles.
The resulting residual size distribution in Fig. 10, panel b, shows that both small and large particles contributed to the INP population. The larger particles have a greater enhancement during the expansion mode, when ambient particles, cloud droplets and ice crystals can be present, relative to the size distribution in the flush mode, which is the size distribution of the ambient particles only. Thus, super-micrometer sized particles are more efficiently activated into ice crystals than smaller aerosol particles. Please note that aerosol particles larger than 4 µm can be transmitted in PINE, however, we believe that this contribution is little as the D50 of PINE is at 4 µm and the ambient concentration of such large particles at the site is quite low.
However, it is notable that smaller ice residuals were more abundant than large residuals, and their size distribution strongly resembles the background during flush (Fig. 10, panel a and b). It is possible that processes within the PCVI such as transmission of unactivated particles in the wake of ice crystals (Pekour and Cziczo, 2011) contributed to small residuals during expansions. However, based on the experiments by Pekour and Cziczo (2011) at much higher concentrations, only 1 % of residuals might be artifacts from wake capture. Certainly, a so-far unknown mechanism in the PCVI being coupled to PINE could contribute to aerosol particles or small droplets being inadvertently transmitted. In future studies, such phenomena should be investigated further.
Moreover, the observation of a small particle ice residual mode could also be related to the sampling time in February, when total INP concentrations were fairly low. From the analysis of the correlation coefficient, the relation between INP concentration at −30 °C and aerosol particle concentration larger than 1 µm indeed showed only a weak relation (Spearman's ranked correlation coefficient = 0.38), from having more smaller particles being INPs. In the future, it would be interesting to deploy this setup in another season when a difference in the ice residual size distribution might be expected.
3.3.3 Impactor measurements
The size investigation of the INP population using consecutive measurements at the same temperature with and without a 1 µm impactor were performed in May 2022. Such measurements were performed once a day and results are shown as the fraction of INPs larger than 1 µm. Indeed, the majority of INPs are found to be larger than the size-cut of the impactor (Fig. 11). Interestingly, this finding is independent of the measurement temperature (−24 to −30 °C), indicating that super-micrometer particles dominate the INP population in this temperature range during May 2022. The results from the correlation coefficient analysis as well as the impactor measurements in May both suggest that super-micrometer particles have a remarkable contribution to the INP population. Interestingly, the results from the ice residual analysis using the coupled system PINE-PCVI-SPX reveal that smaller particles are also INPs, which might be related to the sampling time in January and February, when correlation coefficients with larger particles were lowest, with values between 0 and 0.67 (Table 3). In May, correlation coefficients between INP concentration and particle concentration larger than 1 µm reached elevated values between 0.53 and 0.78, suggesting that super-micrometer particles played a more important role.
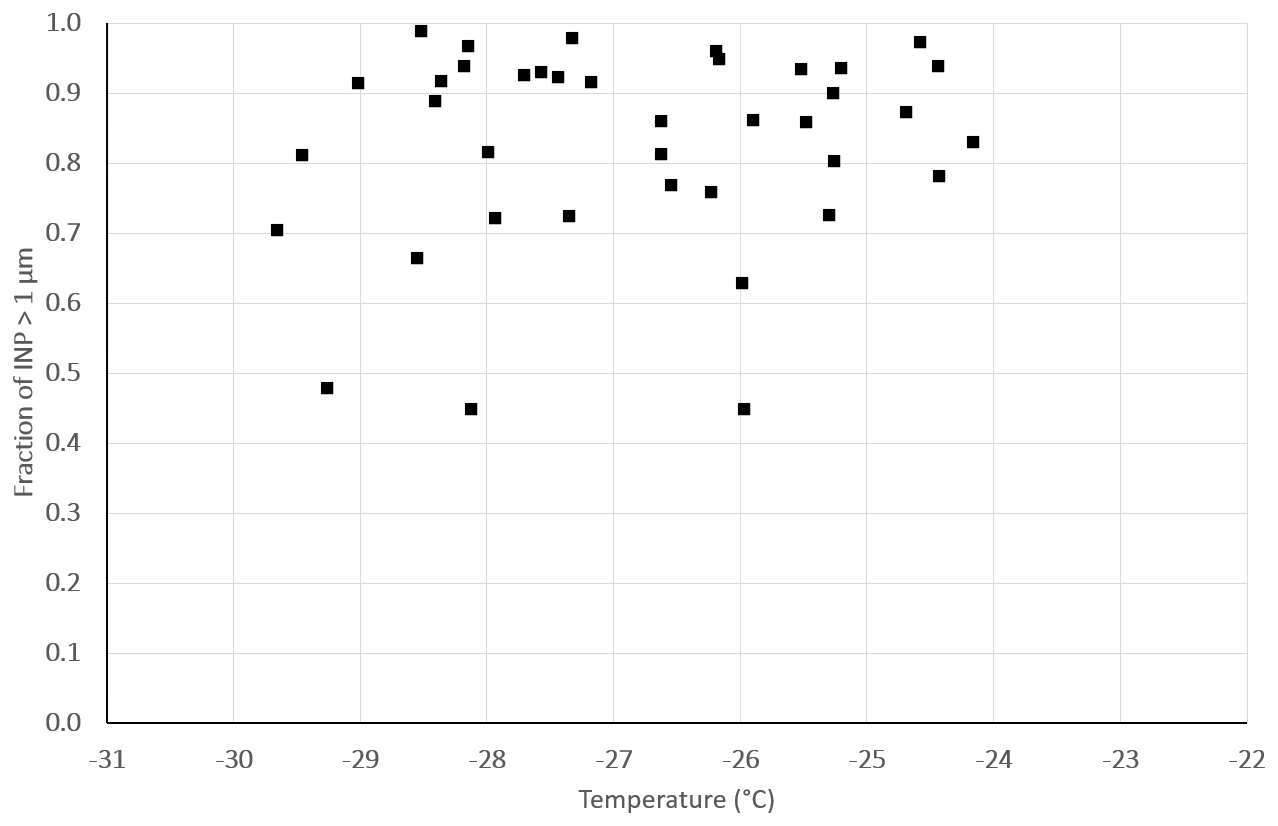
Figure 11Fraction of INPs larger than 1 µm as a function of temperature. Fractions were calculated using consecutive measurements on and off the PM1 impactor in May 2022.
Few studies have investigated the sizes of INPs at high-altitude stations. Mason et al. (2016) found that sub-micrometer particles had the greatest contribution to the INP population at an Alpine site (Whistler Mountain, 2181 m a.s.l.) at a freezing temperature of −25 °C. In contrast to SPL, this site does not have an upwind regional dust source. At another high-altitude site (Jungfraujoch, 3580 m a.s.l.), the analysis of ice residual sizes revealed a dominant contribution of sub-micrometer particles (Lacher et al., 2021). This might be related to the sampling location, where particles can undergo long-range transport and sedimentation processes that impact the size distribution prior to sampling. At the same location, Lacher et al. (2018) found a weak relation of INP concentrations at −31 °C and aerosol particle number concentration larger than 0.5 µm during times the site was within the free troposphere, and stronger relations during sampling conditions with a stronger impact from boundary layer air.
The results from this study indicate that during winter, when the station is likely more often exposed to free tropospheric conditions, or fewer sources of large INPs, such as dust, are present, sub-micrometer particles can have a considerable contribution to the INP population, while during autumn and spring, with likely more impact from boundary layer air and dust events, super micrometer particles play a crucial role for INPs.
Here, we present INP concentration measurements conducted at SPL (3200 m a.s.l.) located in the Rocky Mountains during two field campaigns in 2021/2022 (autumn to spring) and in 2025 (winter to spring). The INP concentration obtained with the online INP instrument PINE at temperatures between −22 and −32 °C exhibited a seasonal variability. A moderate decrease in concentration from autumn to winter was observed, and a pronounced increase in spring. Interestingly, the median INP concentrations and inter-quartile range for the individual months from the two campaigns were very similar. The highest median INP concentrations and highest inter-quartile ranges were recorded in both April 2022 and 2025.
For source identification during events of peak INP concentrations in spring 2022 and 2025, we use a novel approach by combining source footprints from back trajectory analyses with the Vegetation Drought Index to determine aridity in North American Desert regions. Indeed, this analysis indicates local US desert areas as source regions, which was found before at the measurement site (Hallar et al., 2011). We believe this observation of increasing springtime INP concentration is robust, however, likely depends on diverse factors such as meteorological conditions and soil-specific properties. As deserts and semi-arid areas are expected to expand in a warming climate (e.g., Kim et al., 2021), dust emission fluxes into the atmosphere might become more important in the future, which can further impact cloud properties. Thus, more and longer-term observations of INP properties should be conducted in combination with source emission sensitivity studies of dust sources. This could improve model representations of ice processes in the Western US.
Another focus of the campaign was the investigation of INP sizes, which can help identify potential sources and improve transport modeling. Since this is technically and statistically challenging due to the rarity of INPs, three different analytical approaches were applied. An analysis of ranked correlation coefficients between INP concentrations and concurrent measurements of super-micrometer particle concentration (larger than 1 µm) revealed values as high as 0.86, with stronger correlations observed in autumn and spring compared to winter, and at temperatures below −26 °C. This suggests that larger particles, such as dust, are important contributors to the INP population at SPL at colder temperatures and in some seasons. Supporting this, we alternated our INP measurements between a total aerosol inlet and a PM1 impactor in May to exclude super-micrometer aerosol particles from the measurements. This resulted in a strong reduction in the INP concentrations, highlighting the importance of coarse-mode particles for the INP population at this high-altitude site in spring.
Finally, a novel setup selecting ice residuals activated in PINE and separated in a PCVI was tested. This is the first time that PINE was coupled to a PCVI, which is different to existing setups, as the cloud formation process is based on a rapid reduction of pressure in PINE (expansion cooling). The setup was applied to continuous measurements in January and February 2022, where ice residual sizes were analyzed with a SPX size distribution instrument. One key advantage of the PINE-PCVI setup is that the PINE duty cycle naturally includes a PCVI background measurement for every expansion experiment. Under relatively clean atmospheric conditions super-micron ice residual particles were enhanced by 20–30 times above background. Interestingly, the results also point to a non-negligible fraction of sub-micrometer particles being INPs. This is consistent with the findings of the correlation coefficient analysis within this time period in winter, suggesting that not only super-micrometer particles contributed to the INP population throughout the year. However, more experiments using such a PINE-PCVI setup are needed to better understand the observed phenomena, and could be extended by the use of single-particle mass spectrometry. This is of particular scientific interest, as PINE is emerging as a key instrument for the continuous global measurement of INPs, and being coupled to a PCVI would allow for determining INP properties such as size and chemistry on a longer-termed period.
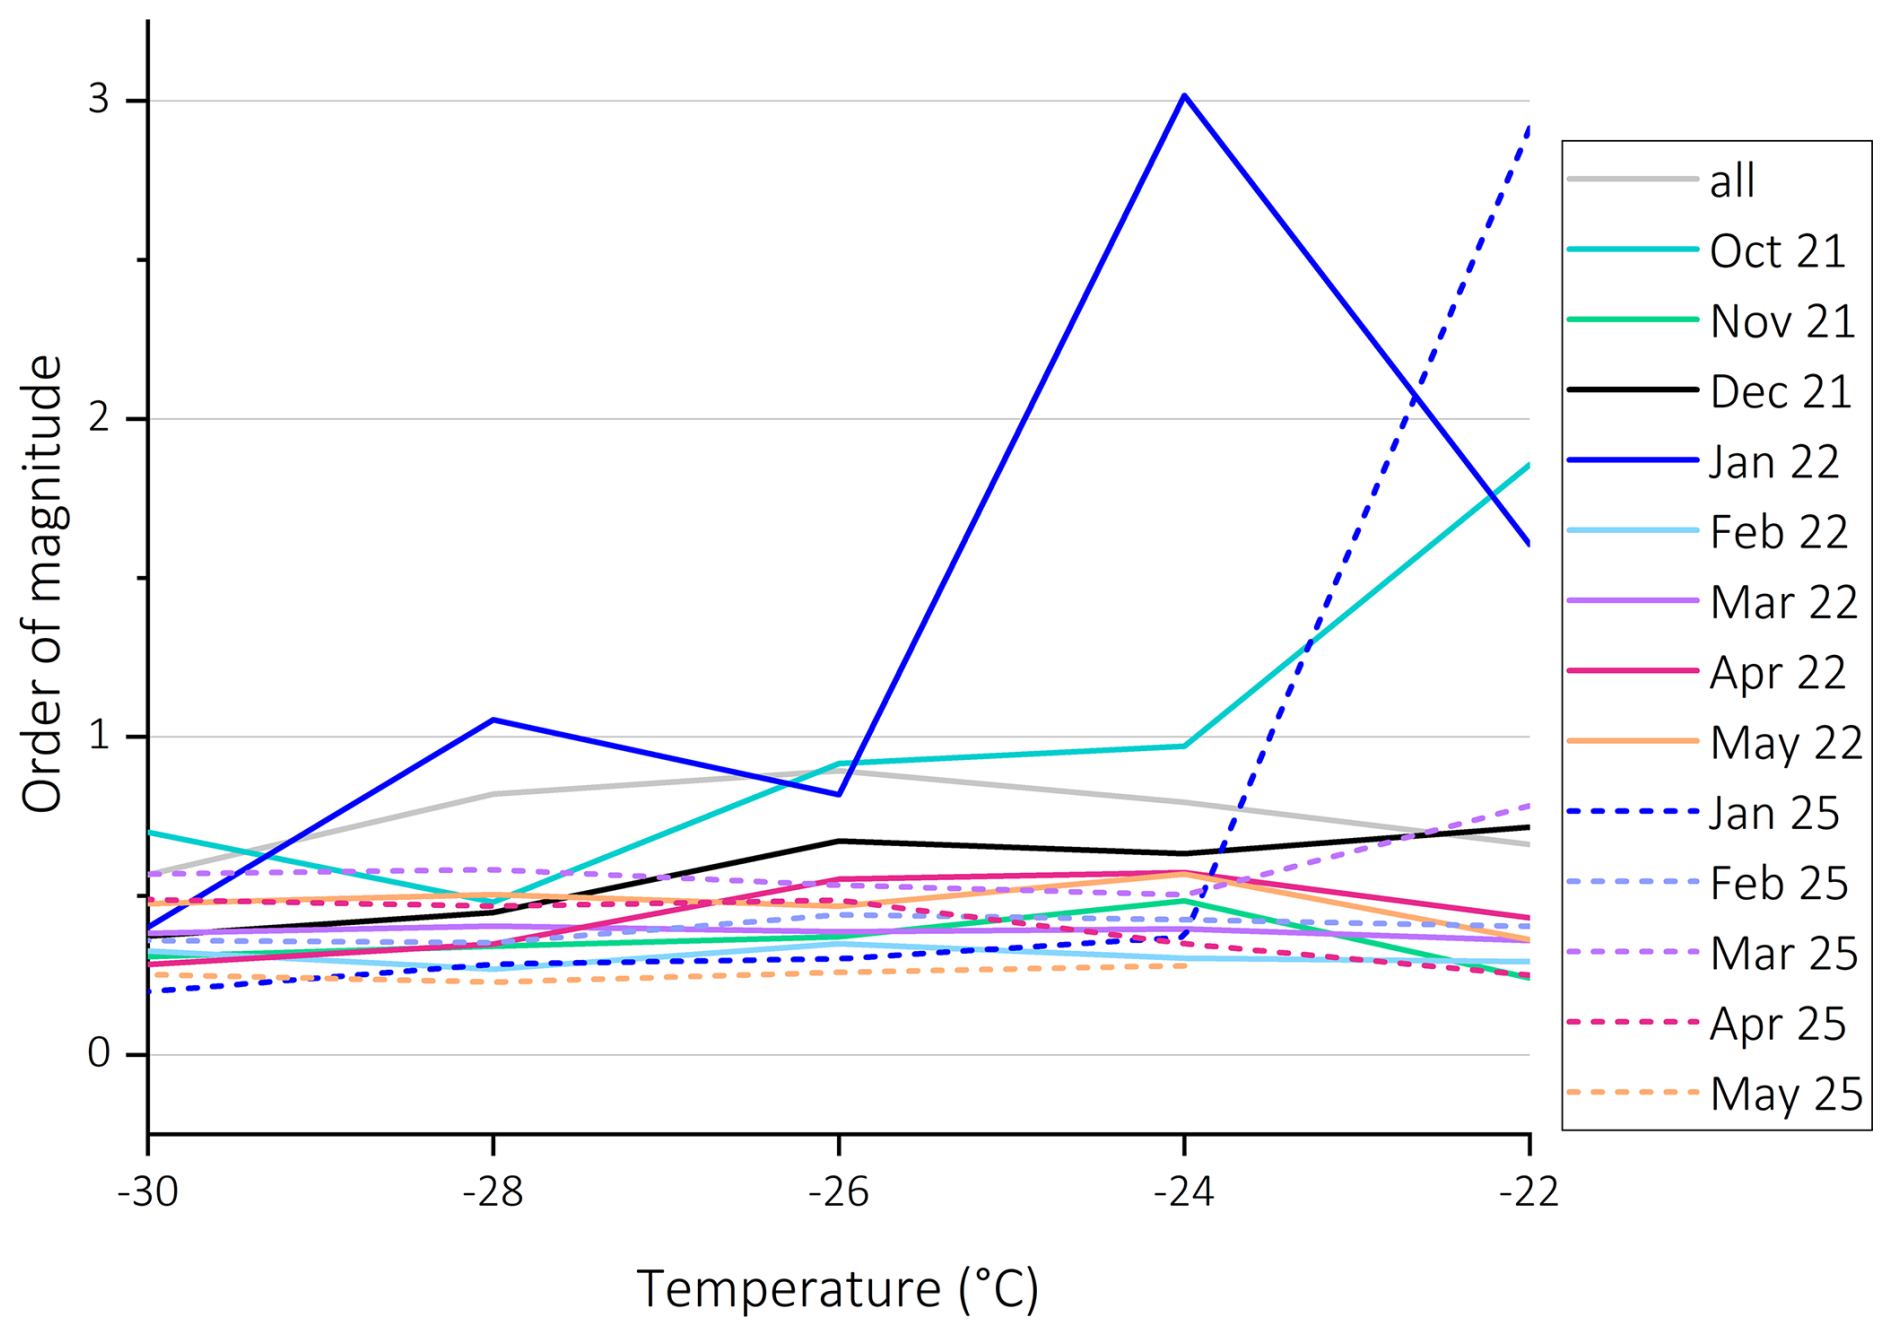
Figure A1Inter-quartile range in orders of magnitude, for all the measurements and the individual months.
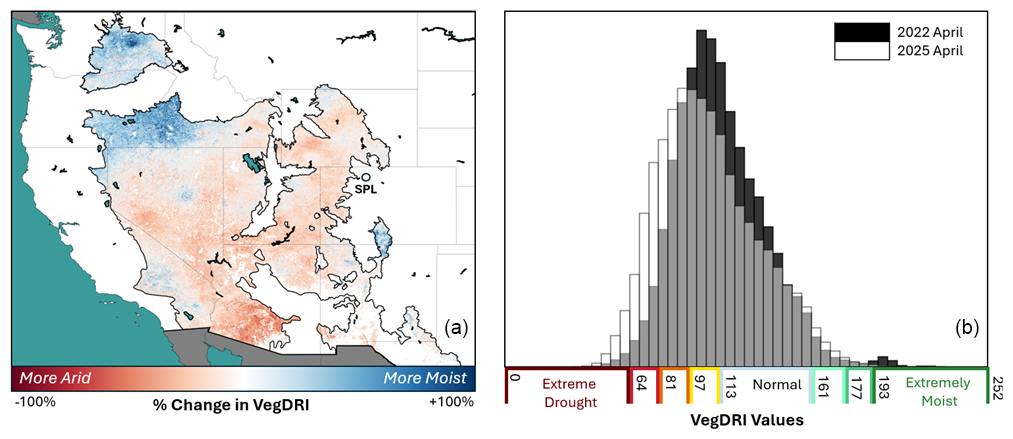
Figure A2Surface map of percentage change in aridity of April 2025 as compared to 2022 of North American desert regions as indicated by the Vegetation Drought Response Index (VegDRI) (a) and distribution of extreme drought and extreme moist conditions during April 2022 and 2025 (b); VegDRI values presented in panel (b) correspond to aridity values in Figs. 7 and A3. The VegDRI was retrieved and averaged over April 2022 and April 2025 separately. Differences between dry and moist conditions between these two months were calculated as percentage differences: 100 % ⋅ (avg_2025–avg_2022)(avg_2022).
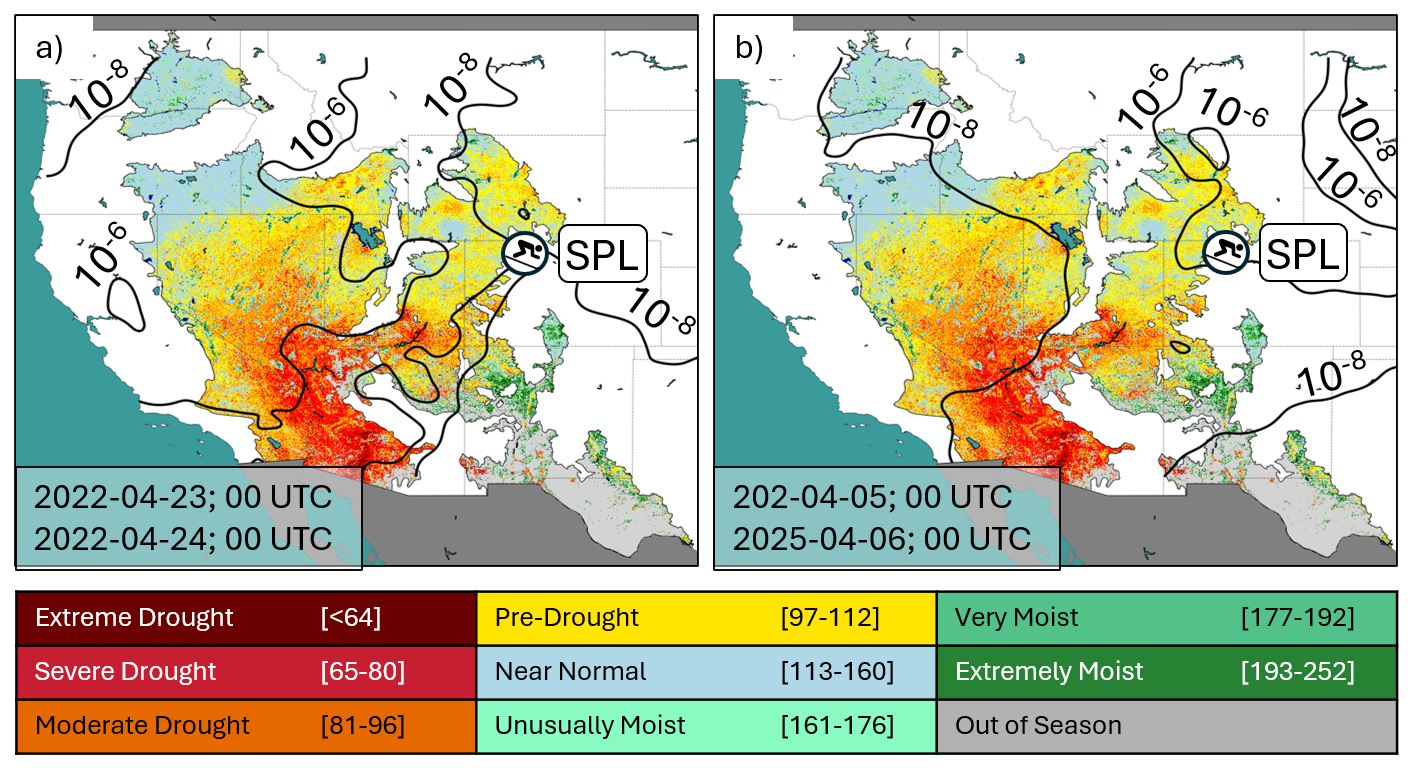
Figure A3Footprints computed with the STILT model combined with surface maps of aridity using VegDRI of North American Desert ecoregions. Contours of the footprint are in units of PPM/µmole m−2 s−1 (surface influence footprint; Fasoli et al., 2018). Events of low INP concentrations were analyzed on the 23 April 2022 (a, INP concentration at −30 °C mostly below 10 INP stdL−1), on the 5 April 2022 (b, INP concentration at −30 °C below 50 INP stdL−1).
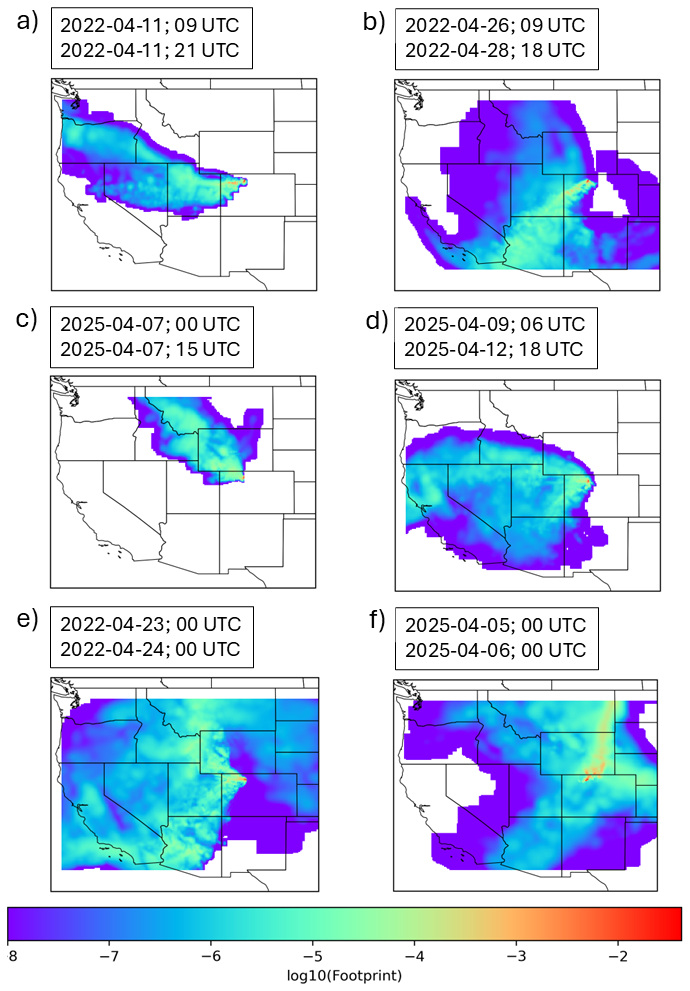
Figure A4Back trajectory calculations for cases of elevated INP concentration as discussed in Sect. 3.2, for 11 April 2022 (a), 26–28 April (b), 7 April 2025 (c), 9–12 April 2025 (d) and for low INP concentration for 23–24 April (e) and for 5–6 April (f); calculations were performed with the STILT model as discussed in Sect. 2.5 and shown as footprints.
A1 Validation experiments PINE-PCVI
In the following, validation experiments for the D50, and the PINE operation temperature are presented.
The D50 of the PCVI was tested using ammonium sulfate particles, to compare the original size distribution of the particles with the size distribution of particles being transmitted through the PCVI. The ammonium sulfate particles were aerosolized in a so-called bubbler and then sent through a diffusion dryer. Then the original size distribution and the size distribution downstream of the PCVI was measured with an APS (3320, TSI Incorporated, Shoreview, Minnesota, USA), having a sample flow of 1 LPM, which equals Fout. Finlet and Fpump were kept constant at values of 4.2 and 6.2 LPM, while Fadd was varied between values of 2.5 and 3.5 LPM. The comparison of the size distributions clearly shows a reduction of the number of particles smaller than 3–5 µm (Fig. A5) when using the PCVI, depending on Fadd. As expected, a lower Fadd of 2.5 LPM leads to a smaller D50 of ∼ 3 µm (purple curve), while a higher Fadd of 3 LPM resulted in a D50 of ∼ 4 µm (blue curve). However, even higher Fadd values of 3.5 LPM (yellow curve) also leads to a reduction in the number concentration of transmitted particles in the size range larger than the D50, as this higher Fadd leads to increased losses of larger particles in the PCVI body. The D50 estimates in this flow configuration represent lower limits to those under SPL measurement conditions. An inadvertent transmission of particles smaller than the D50 also occurs, which depends slightly on Fadd. At an Fadd of 3 LPM, approximately 100 particles cm−3 smaller than 4 µm are transmitted, as compared to a total particle concentration between 103 to 104 particles cm−3.
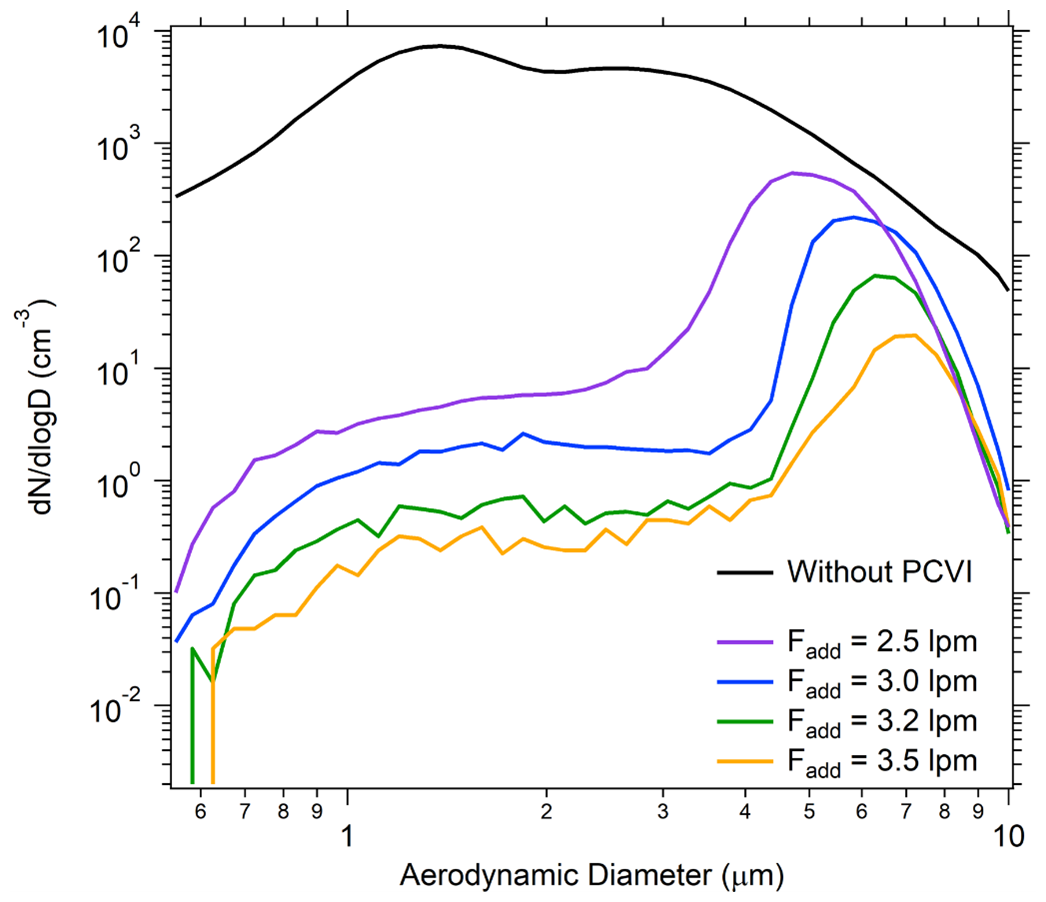
Figure A5Size distribution of ammonium sulfate particles before (black line) and behind the PCVI using different values for Fadd. Transmission at sizes larger than ∼ 5 µm is artificially low due to enhanced impaction losses in the aerosol generation system when the PCVI was installed. Curves are corrected for dilution and the PCVI concentrating factor of 3.7–4.7.
Based on these experiments, using an Fadd of 3 LPM leads to the transmission of particles larger than ∼ 4 µm while most smaller particles are rejected. The great majority of ambient aerosol particles at SPL are below this size, but at the same time the larger particles preferably get activated as cloud droplets in PINE due to their size (e.g., Dusek et al., 2006). For a discrimination between ice crystals and cloud droplets it is therefore required that cloud droplets are below this size threshold of 4 µm.
As cloud droplet size within the timescale of a PINE expansion is determined by diffusional growth, its size depends on temperature, supersaturation, and available cloud condensation nuclei (e.g., Pruppacher and Klett, 2010). Therefore, the PINE-PCVI setup was tested at different temperatures using ambient particles at SPL. The PINE temperature was varied between −21 and −32 °C, and a sizing instrument (SPX) determined the transmitted particle size distribution (Fig. A6) which is compared with the ice crystal and cloud droplet concentration by the fidas-pine OPC. We distinguish here between large and small residuals above and below 450 nm, respectively. It is apparent that at the higher temperatures (above −26 °C), more smaller residuals are transmitted, suggesting that cloud droplets are larger than the D50 and can be transmitted through the PCVI. However, residual concentration during expansions at temperatures colder than −28 °C did not scale with droplet concentrations (Fig. A6, panel b). Thus, it is likely that these particles are not droplet residuals. Instead, it is likely that the concentration enhancement during expansions was due to ice residuals. PINE measured an average INP concentration of 21±19 stdL−1 for these expansions.
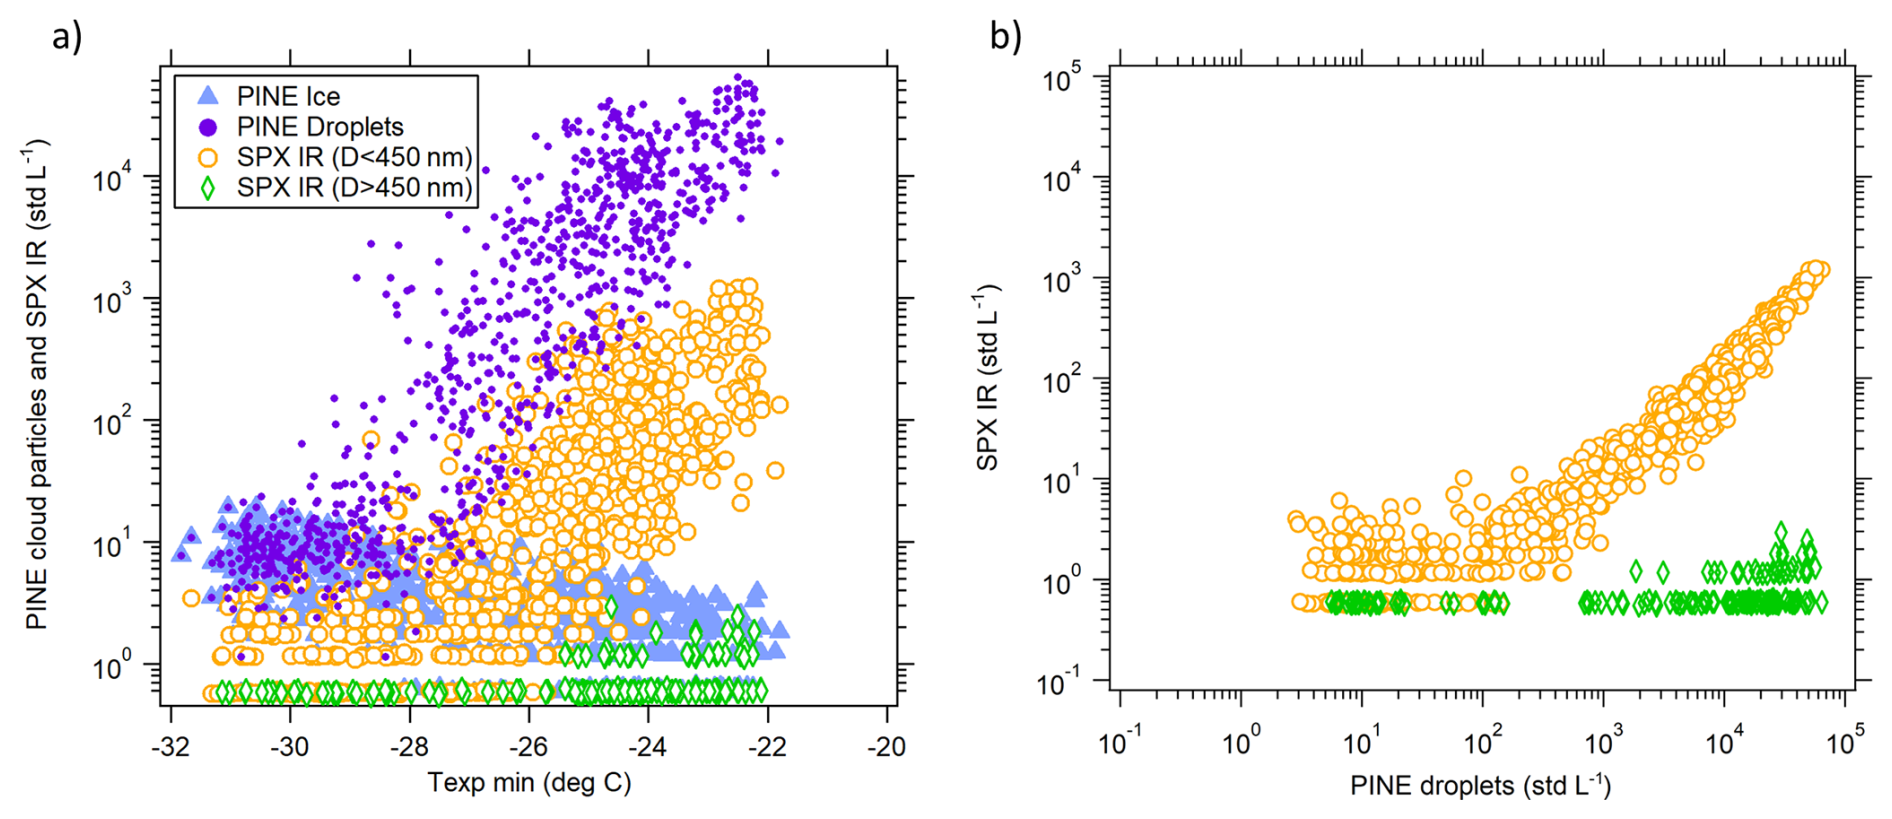
Figure A6Comparison of PINE residual concentrations (PINE Ice) with PINE cloud particle concentrations (PINE Droplets) during a series of 909 expansions on Jan 15-16, 2022 where the minimum temperature was varied from −22 to −32°C. Panel (a) Both small residuals (SPX IR (D<450 nm) and PINE droplet concentrations rise with increasing temperature (a). (b) A strong correlation is observed between small residuals and droplet concentration (at larger than 100 droplets stdL−1), corresponding to temperatures above −28 °C which is visible in panel a, indicating that the PCVI is transmitting droplets as well as ice. At temperatures below −28 °C, small residual concentrations become constant and represent the combination of small INP and interstitial aerosol breakthrough in the PCVI. Residual concentrations are corrected by the PCVI concentrating factor.
A2 Calculation of cloud droplet size and evaporation
To determine the maximum size of the cloud droplets that can enter the PCVI body, diffusional growth calculations during the cloud formation process in PINE are considered, and combined with evaporation calculations.
Cloud droplet sizes can be calculated by:
where r is the cloud droplet size as function of time t, r0 is the initial cloud droplet size which is set to 0.2 µm, S is the supersaturation,Fk is the thermodynamic term related to latent heat release, and Fd is the vapor diffusion term (e.g., Lohmann et al., 2016). PINE is operated at an expansion flow of 3 LPM, and it can be assumed that upon cloud droplet formation, the supersaturation is naturally controlled to values below 1.01, which is taken as an upper limit for the calculation. For the calculation of cloud droplet size, the temperature and duration of a typical expansion during the campaign was taken when the PCVI was attached, when the temperature decreased from −24 to −29 °C during 40 s (referred to an INP concentration measurement at −29 °C). Please note that the temperature during expansion in PINE is likely lower than the reading from the temperature sensor, due to its slow response time relative to the rapidly changing temperature. The formed cloud droplets during this experiment can reach sizes of 5.5 µm (Fig. A7). For comparison, the calculation for a temperature of −25 °C (referring to a temperature decrease during expansion from −20 to −25 °C) shows that cloud droplets can grow to 6.5 µm.
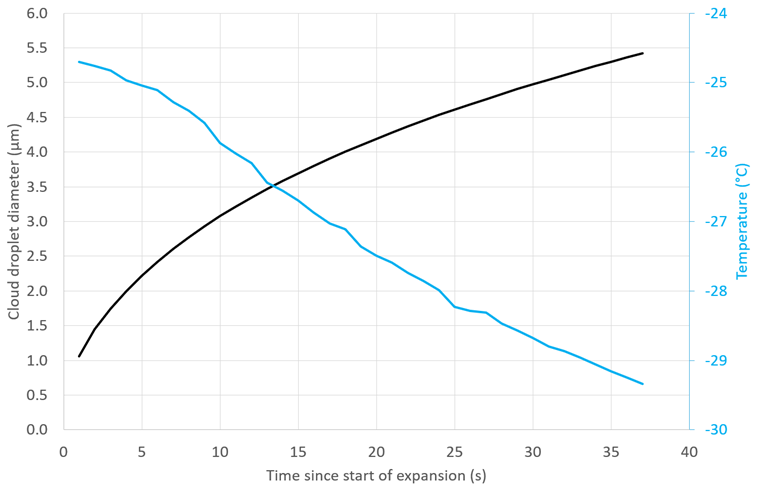
Figure A7Calculated cloud droplet diameter during a PINE expansion with a start temperature of −25 °C, based on diffusional growth calculations. Temperature measurements were taken from a typical expansion with an expansion flow of 3 LPM. Initial droplet sizes entering the PCVI are smaller than this calculation due to the usage of an evaporation section.
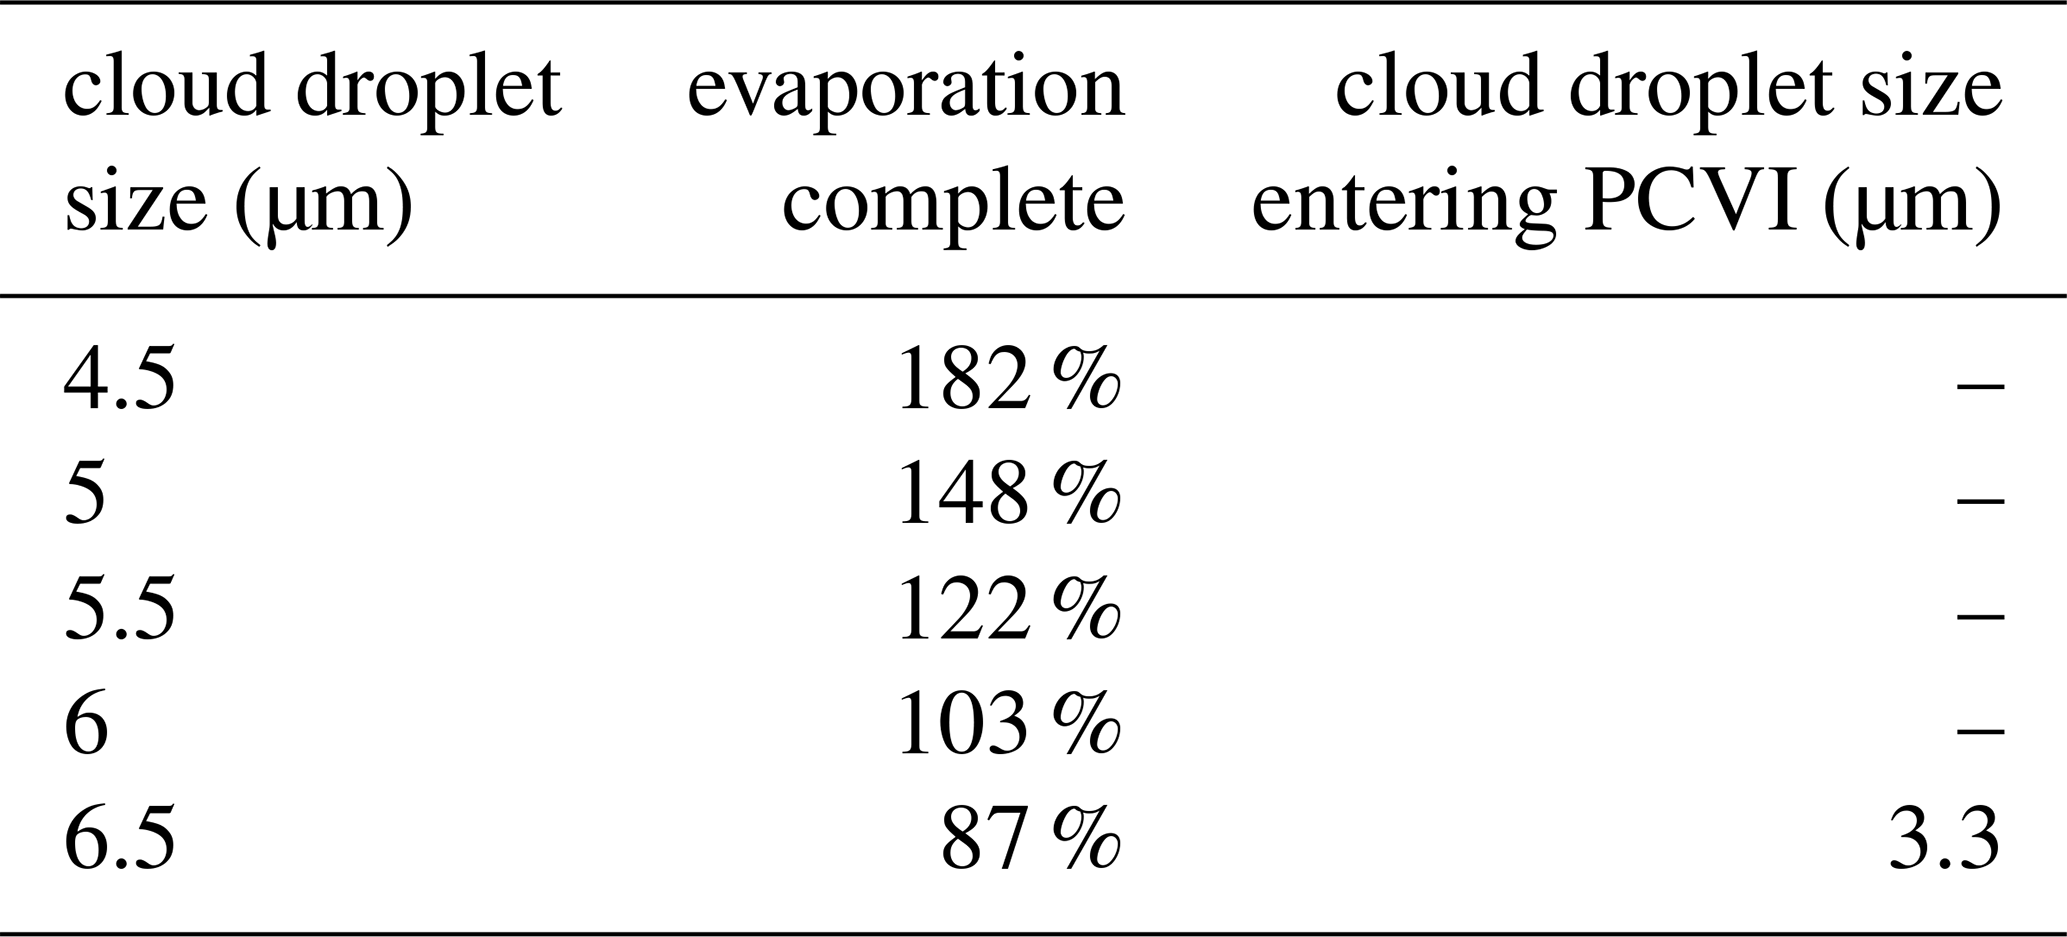
To finally calculate the cloud droplet size entering the PCVI body, the evaporation section between the PINE outlet and the PCVI further reduces the size of the cloud droplets. For this, calculations from Hinds (1999) Eqs. (3.15) and (3.19) are used and the evaporation is given as a percentage completed (Table A2). Cloud droplet sizes of 5.5 µm, which form at −29 °C, are completely evaporated before entering the PCVI body, and can thus be separated from ice crystals. Based on these calculations, cloud droplets of a size of 6.5 µm (formed at temperatures of −25 °C) µm are not completely evaporated, however, when entering the PCVI their size is still below the D50, and it can be assumed that the majority are still separated from ice crystals, but can lead to the observed increase in residuals during the experiments presented in Fig. A6.
Moreover, at higher supersaturations, cloud droplets could grow to larger sizes. E.g., for S = 1.05 and at −29 °C, cloud droplets could reach a size of 12 µm (17 µm for S = 1.1). However, we believe that the supersaturation in PINE once cloud droplets formed is below 1.01.
Table A1Statistics of INP concentration during individual months during the first measurement campaign in 2021–2022 (a) and in 2025 (b).
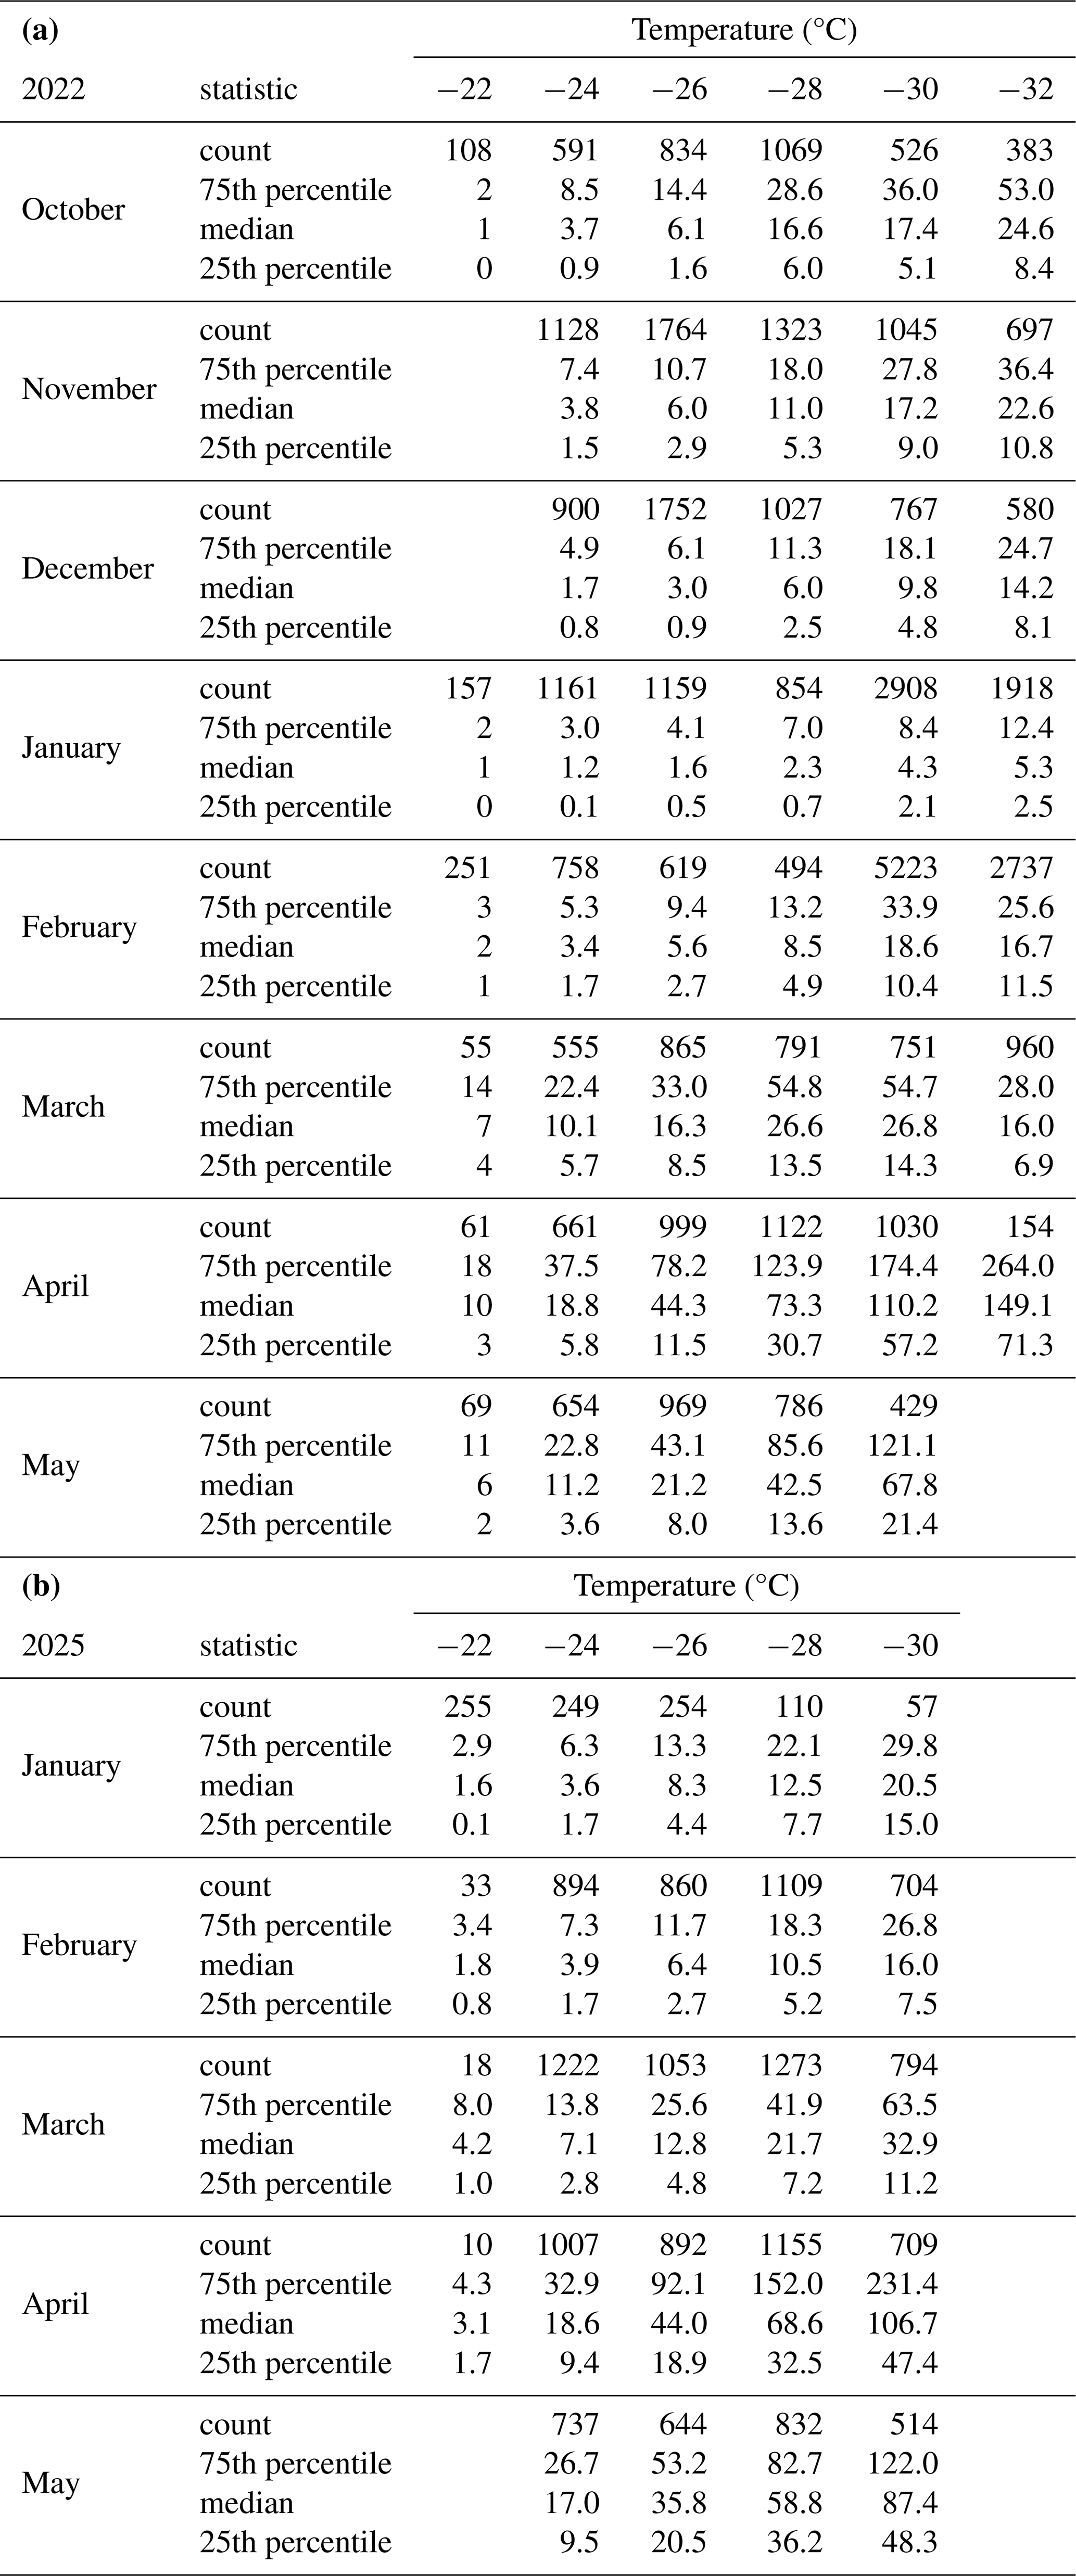
Table A2Cloud droplet size calculations for the PINE evaporation section.
Data is available under https://doi.org/10.35097/yy6adarzhy2xvgx7 (Lacher et al., 2026).
LL performed the measurements, analyzed the data and wrote the manuscript with contributions from all co-authors; AGH and IBM contributed to the experimental setup and manuscript outline and provided the aerosol information from the station; AGH, KW and JB performed the source emission sensitivity analysis; KF and LL performed the characterization experiments and setup of the PINE-PCVI setup with help from JJ; KF and XS performed the size distribution measurements using the SPX; CR contributed to the PINE installation and maintenance. LL, DJC and OM designed the study.
At least one of the (co-)authors is a member of the editorial board of Atmospheric Chemistry and Physics. The peer-review process was guided by an independent editor, and the authors also have no other competing interests to declare.
Publisher's note: Copernicus Publications remains neutral with regard to jurisdictional claims made in the text, published maps, institutional affiliations, or any other geographical representation in this paper. The authors bear the ultimate responsibility for providing appropriate place names. Views expressed in the text are those of the authors and do not necessarily reflect the views of the publisher.
We would like to acknowledge the technical and scientifical team from KIT, Purdue University and Storm Peak Laboratory, especially Rainer Buschbacher, Jens Nadolny, Steffen Vogt, Alexander Böhmländer, Kristina Höhler, Maria del Carmen Dameto de Espana, Gregory Schill and Dan Gilchrist.
This research was supported by the Postdoctoral Researchers International Mobility Experience (PRIME) program funded by the German Academic Exchange Service (DAAD) with funds from the German Federal Ministry of Education and Research (BMBF) under project number 57572852. This study was also supported by the United States National Science Foundation, Directorate for Geosciences (grant nos. 1749851 and 2054847).
The article processing charges for this open-access publication were covered by the Karlsruhe Institute of Technology (KIT).
This paper was edited by Ivy Tan and reviewed by two anonymous referees.
Boulter, J. E., Cziczo, D. J., Middlebrook, A. M., Thomson, D. S., and Murphy, D. M.: Design and Performance of a Pumped Counterflow Virtual Impactor, Aerosol Sci. Tech., 40, 969–976, https://doi.org/10.1080/02786820600840984, 2006.
Brunner, C., Brem, B. T., Collaud Coen, M., Conen, F., Steinbacher, M., Gysel-Beer, M., and Kanji, Z. A.: The diurnal and seasonal variability of ice-nucleating particles at the High Altitude Station Jungfraujoch (3580 m a.s.l.), Switzerland, Atmos. Chem. Phys., 22, 7557–7573, https://doi.org/10.5194/acp-22-7557-2022, 2022.
Bras, Y., Freney, E., Canzi, A., Amato, P., Bouvier, L., Pichon, J.-M., Picard, D., Minguillón, M. C., Pérez, N., and Sellegri, K.: Seasonal Variations, Origin, and Parameterization of Ice-Nucleating Particles at a Mountain Station in Central France, Earth Space Sci., 11, e2022EA002467, https://doi.org/10.1029/2022EA002467, 2024.
Brown, J. F., Wardlow, B. D., Tadesse, T., Hayes, M. J., and Reed, B. C.: The Vegetation Drought Response Index (VegDRI): A New Integrated Approach for Monitoring Drought Stress in Vegetation, GISci. Remote Sens., 45, 16–46,
doi10.2747/1548-1603.45.1.16, 2008.
Burrows, S. M., McCluskey, C. S., Cornwell, G., Steinke, I., Zhang, K., Zhao, B., Zawadowicz, M., Raman, A., Kulkarni, G., China, S., Zelenyuk, A., and DeMott, P. J.: Ice-Nucleating Particles That Impact Clouds and Climate: Observational and Modeling Research Needs, Rev. Geophys., 60, e2021RG000745, https://doi.org/10.1029/2021RG000745, 2022.
Collaud Coen, M., Andrews, E., Aliaga, D., Andrade, M., Angelov, H., Bukowiecki, N., Ealo, M., Fialho, P., Flentje, H., Hallar, A. G., Hooda, R., Kalapov, I., Krejci, R., Lin, N.-H., Marinoni, A., Ming, J., Nguyen, N. A., Pandolfi, M., Pont, V., Ries, L., Rodríguez, S., Schauer, G., Sellegri, K., Sharma, S., Sun, J., Tunved, P., Velasquez, P., and Ruffieux, D.: Identification of topographic features influencing aerosol observations at high altitude stations, Atmos. Chem. Phys., 18, 12289–12313, https://doi.org/10.5194/acp-18-12289-2018, 2018.
Cornwell, G. C., McCluskey, C. S., Levin, E. J. T., Suski, K. J., DeMott, P. J., Kreidenweis, S. M., and Prather, K. A.: Direct Online Mass Spectrometry Measurements of Ice Nucleating Particles at a California Coastal Site, J. Geophys. Res.-Atmos., 124, 12157–12172, https://doi.org/10.1029/2019JD030466, 2019.
Creamean, J. M., Barry, K., Hill, T. C. J., Hume, C., DeMott, P. J., Shupe, M. D., Dahlke, S., Willmes, S., Schmale, J., Beck, I., Hoppe, C. J. M., Fong, A., Chamberlain, E., Bowman, J., Scharien, R., and Persson, O.: Annual cycle observations of aerosols capable of ice formation in central Arctic clouds, Nat. Commun., 13, 3537, https://doi.org/10.1038/s41467-022-31182-x, 2022.
Creamean, J. M., Suski, K. J., Rosenfeld, D., Cazorla, A., DeMott, P. J., Sullivan, R. C., White, A. B., Ralph, F. M., Minnis, P., Comstock, J. M., Tomlinson, J. M., and Prather, K. A.: Dust and Biological Aerosols from the Sahara and Asia Influence Precipitation in the Western U.S, Science, 339, 1572–1578, https://doi.org/10.1126/science.1227279, 2013.
Cziczo, D. J., DeMott, P. J., Brock, C., Hudson, P. K., Jesse, B., Kreidenweis, S. M., Prenni, A. J., Schreiner, J., Thomson, D. S., and Murphy, D. M.: A Method for Single Particle Mass Spectrometry of Ice Nuclei, Aerosol Sci. Tech., 37, 460–470, https://doi.org/10.1080/02786820300976, 2003.
Cziczo, D. J., Stetzer, O., Worringen, A., Ebert, M., Weinbruch, S., Kamphus, M., Gallavardin, S. J., Curtius, J., Borrmann, S., Froyd, K. D., Mertes, S., Möhler, O., and Lohmann, U.: Inadvertent climate modification due to anthropogenic lead, Nat. Geosci., 2, 333–336, https://doi.org/10.1038/ngeo499, 2009.
Cziczo, D. J., Froyd, K. D., Hoose, C., Jensen, E. J., Diao, M. H., Zondlo, M. A., Smith, J. B., Twohy, C. H., and Murphy, D. M.: Clarifying the Dominant Sources and Mechanisms of Cirrus Cloud Formation, Science, 340, 1320–1324, https://doi.org/10.1126/science.1234145, 2013.
Cziczo, D. J. and Froyd, K. D.: Sampling the composition of cirrus ice residuals, Atmos. Res., 142, 15–31, https://doi.org/10.1016/j.atmosres.2013.06.012, 2014.
Cziczo, D. J., Ladino, L., Boose, Y., Kanji, Z. A., Kupiszewski, P., Lance, S., Mertes, S., and Wex, H.: Measurements of Ice Nucleating Particles and Ice Residuals, Meteor. Mon., 58, 8.1–8.13, https://doi.org/10.1175/amsmonographs-d-16-0008.1, 2017.
DeMott, P. J., Prenni, A. J., Liu, X., Kreidenweis, S. M., Petters, M. D., Twohy, C. H., Richardson, M. S., Eidhammer, T., and Rogers, D. C.: Predicting global atmospheric ice nuclei distributions and their impacts on climate, P. Natl. Acad. Sci. USA, https://doi.org/10.1073/pnas.0910818107, 2010.
DeMott, P. J., Mirrielees, J. A., Petters, S. S., Cziczo, D. J., Petters, M. D., Bingemer, H. G., Hill, T. C. J., Froyd, K., Garimella, S., Hallar, A. G., Levin, E. J. T., McCubbin, I. B., Perring, A. E., Rapp, C. N., Schiebel, T., Schrod, J., Suski, K. J., Weber, D., Wolf, M. J., Zawadowicz, M., Zenker, J., Möhler, O., and Brooks, S. D.: Field intercomparison of ice nucleation measurements: the Fifth International Workshop on Ice Nucleation Phase 3 (FIN-03), Atmos. Meas. Tech., 18, 639–672, https://doi.org/10.5194/amt-18-639-2025, 2025.
Dusek, U., Frank, G. P., Hildebrandt, L., Curtius, J., Schneider, J., Walter, S., Chand, D., Drewnick, F., Hings, S., Jung, D., Borrmann, S., and Andreae, M. O.: Size Matters More Than Chemistry for Cloud-Nucleating Ability of Aerosol Particles, Science, 312, 1375–1378, https://doi.org/10.1126/science.1125261, 2006.
East, A. E. and Sankey, J. B.: Geomorphic and Sedimentary Effects of Modern Climate Change: Current and Anticipated Future Conditions in the Western United States, Rev. Geophys., 58, e2019RG000692, https://doi.org/10.1029/2019RG000692, 2020.
Fan, J., Leung, L. R., Rosenfeld, D., and DeMott, P. J.: Effects of cloud condensation nuclei and ice nucleating particles on precipitation processes and supercooled liquid in mixed-phase orographic clouds, Atmos. Chem. Phys., 17, 1017–1035, https://doi.org/10.5194/acp-17-1017-2017, 2017.
Fasoli, B., Lin, J. C., Bowling, D. R., Mitchell, L., and Mendoza, D.: Simulating atmospheric tracer concentrations for spatially distributed receptors: updates to the Stochastic Time-Inverted Lagrangian Transport model's R interface (STILT-R version 2), Geosci. Model Dev., 11, 2813–2824, https://doi.org/10.5194/gmd-11-2813-2018, 2018.
French, J. R., Friedrich, K., Tessendorf, S. A., Rauber, R. M., Geerts, B., Rasmussen, R. M., Xue, L., Kunkel, M. L., and Blestrud, D. R.: Precipitation formation from orographic cloud seeding, P. Natl. Acad. Sci. USA, 115, 1168–1173, https://doi.org/10.1073/pnas.1716995115, 2018.
Hallar, A. G., Chirokova, G., McCubbin, I., Painter, T. H., Wiedinmyer, C., and Dodson, C.: Atmospheric bioaerosols transported via dust storms in the western United States, Geophys. Res. Lett., 38, https://doi.org/10.1029/2011GL048166, 2011.
Hallar, A. G., Petersen, R., Andrews, E., Michalsky, J., McCubbin, I. B., and Ogren, J. A.: Contributions of dust and biomass burning to aerosols at a Colorado mountain-top site, Atmos. Chem. Phys., 15, 13665–13679, https://doi.org/10.5194/acp-15-13665-2015, 2015.
Hallar, A. G., McCubbin, I. B., Borys, R., Lowenthal, D. H., Wetzel, M., Hindman, E., Brooks, S. D., Steenburgh, W. J., Gratz, L., Hoch, S., Stephens, B., Horel, J. D., Molotch, N. P., Mace, G. G., Bailey, A., Pettersen, C., Andrews, E., Cziczo, D. J., and Garcia, M.: Storm Peak Laboratory: A Research and Training Facility for the Atmospheric Sciences, B. Am. Meteorol. Soc., 106, E1130–E1148, https://doi.org/10.1175/BAMS-D-24-0043.1, 2025.
Hiranuma, N., Möhler, O., Kulkarni, G., Schnaiter, M., Vogt, S., Vochezer, P., Järvinen, E., Wagner, R., Bell, D. M., Wilson, J., Zelenyuk, A., and Cziczo, D. J.: Development and characterization of an ice-selecting pumped counterflow virtual impactor (IS-PCVI) to study ice crystal residuals, Atmos. Meas. Tech., 9, 3817–3836, https://doi.org/10.5194/amt-9-3817-2016, 2016.
Hinds, W.: Aerosol Technology: Properties, Behavior, and Measurement of Airborne Particles, Wiley, New York, ISBN 978-1-119-49404-1, 1999.
Hofer, S., Hahn, L. C., Shaw, J. K., McGraw, Z. S., Bruno, O., Hellmuth, F., Pietschnig, M., Mostue, I. A., David, R. O., Carlsen, T., and Storelvmo, T.: Realistic representation of mixed-phase clouds increases projected climate warming, Commun. Earth Environ., 5, 390, https://doi.org/10.1038/s43247-024-01524-2, 2024.
Hoose, C. and Möhler, O.: Heterogeneous ice nucleation on atmospheric aerosols: a review of results from laboratory experiments, Atmos. Chem. Phys., 12, 9817–9854, https://doi.org/10.5194/acp-12-9817-2012, 2012.
Jahn, L. G., Polen, M. J., Jahl, L. G., Brubaker, T. A., Somers, J., and Sullivan, R. C.: Biomass combustion produces ice-active minerals in biomass-burning aerosol and bottom ash, P. Natl. Acad. Sci. USA, 117, 21928–21937, https://doi.org/10.1073/pnas.1922128117, 2020.
Kamphus, M., Ettner-Mahl, M., Klimach, T., Drewnick, F., Keller, L., Cziczo, D. J., Mertes, S., Borrmann, S., and Curtius, J.: Chemical composition of ambient aerosol, ice residues and cloud droplet residues in mixed-phase clouds: single particle analysis during the Cloud and Aerosol Characterization Experiment (CLACE 6), Atmos. Chem. Phys., 10, 8077–8095, https://doi.org/10.5194/acp-10-8077-2010, 2010.
Kanji, Z. A., Ladino, L. A., Wex, H., Boose, Y., Burkert-Kohn, M., Cziczo, D. J., and Krämer, M.: Overview of Ice Nucleating Particles, Meteor. Mon., 58, 1.1–1.33, https://doi.org/10.1175/amsmonographs-d-16-0006.1, 2017.
Kim, D., Chin, M., Cruz, C. A., Tong, D., and Yu, H.: Spring Dust in Western North America and Its Interannual Variability – Understanding the Role of Local and Transported Dust, J. Geophys. Res.-Atmos., 126, e2021JD035383, https://doi.org/10.1029/2021JD035383, 2021.
Koolik, L., Roesch, M., Dameto de Espana, C., Rapp, C. N., Franco Deloya, L. J., Shen, C., Hallar, A. G., McCubbin, I. B., and Cziczo, D. J.: A phase separation inlet for droplets, ice residuals, and interstitial aerosol particles, Atmos. Meas. Tech., 15, 3213–3222, https://doi.org/10.5194/amt-15-3213-2022, 2022.
Kulkarni, G., Pekour, M., Afchine, A., Murphy, D. M., and Cziczo, D. J.: Comparison of Experimental and Numerical Studies of the Performance Characteristics of a Pumped Counterflow Virtual Impactor, Aerosol Sci. Tech., 45, 382–392, https://doi.org/10.1080/02786826.2010.539291, 2011.
Lacher, L., DeMott, P. J., Levin, E. J. T., Suski, K. J., Boose, Y., Zipori, A., Herrmann, E., Bukowiecki, N., Steinbacher, M., Gute, E., Abbatt, J. P. D., Lohmann, U., and Kanji, Z. A.: Background Free-Tropospheric Ice Nucleating Particle Concentrations at Mixed-Phase Cloud Conditions, J. Geophys. Res.-Atmos., 123, 10506–510525, https://doi.org/10.1029/2018JD028338, 2018.
Lacher, L., Clemen, H.-C., Shen, X., Mertes, S., Gysel-Beer, M., Moallemi, A., Steinbacher, M., Henne, S., Saathoff, H., Möhler, O., Höhler, K., Schiebel, T., Weber, D., Schrod, J., Schneider, J., and Kanji, Z. A.: Sources and nature of ice-nucleating particles in the free troposphere at Jungfraujoch in winter 2017, Atmos. Chem. Phys., 21, 16925–16953, https://doi.org/10.5194/acp-21-16925-2021, 2021.
Lacher, L., Hallar, A. G., McCubbin, I. B., Bail, J., Froyd, K. D., Jacquot, J., Shen, X., Rapp, C., Möhler, O., and Cziczo, D.: Dataset: Strong springtime increase of ice-nucleating particle concentration in the Rocky Mountains, Karlsruhe Institute of Technology [data set], https://doi.org/10.35097/yy6adarzhy2xvgx7, 2026.
Lin, J. C., Gerbig, C., Wofsy, S. C., Andrews, A. E., Daube, B. C., Davis, K. J., and Grainger, C. A.: A near-field tool for simulating the upstream influence of atmospheric observations: The Stochastic Time-Inverted Lagrangian Transport (STILT) model, J. Geophys. Res.-Atmos., 108, https://doi.org/10.1029/2002JD003161, 2003.
Lohmann, U., Lüönd, F., and Mahrt, F.: An Introduction to Clouds: From the Microscale to Climate, Cambridge University Press, Cambridge, ISBN 9781139087513, 2016.
Lowenthal, D. H., Hallar, A. G., David, R. O., McCubbin, I. B., Borys, R. D., and Mace, G. G.: Mixed-phase orographic cloud microphysics during StormVEx and IFRACS, Atmos. Chem. Phys., 19, 5387–5401, https://doi.org/10.5194/acp-19-5387-2019, 2019.
Mason, R. H., Si, M., Chou, C., Irish, V. E., Dickie, R., Elizondo, P., Wong, R., Brintnell, M., Elsasser, M., Lassar, W. M., Pierce, K. M., Leaitch, W. R., MacDonald, A. M., Platt, A., Toom-Sauntry, D., Sarda-Estève, R., Schiller, C. L., Suski, K. J., Hill, T. C. J., Abbatt, J. P. D., Huffman, J. A., DeMott, P. J., and Bertram, A. K.: Size-resolved measurements of ice-nucleating particles at six locations in North America and one in Europe, Atmos. Chem. Phys., 16, 1637–1651, https://doi.org/10.5194/acp-16-1637-2016, 2016.
Mertes, S., Verheggen, B., Walter, S., Connolly, P., Ebert, M., Schneider, J., Bower, K. N., Cozic, J., Weinbruch, S., Baltensperger, U., and Weingartner, E.: Counterflow Virtual Impactor Based Collection of Small Ice Particles in Mixed-Phase Clouds for the Physico-Chemical Characterization of Tropospheric Ice Nuclei: Sampler Description and First Case Study, Aerosol Sci. Tech., 41, 848–864, https://doi.org/10.1080/02786820701501881, 2007.
Mirzabaev, A., Wu, J., Evans, J., García-Oliva, F., Hussein, I. A. G., Iqbal, M. H., Kimutai, J., Knowles, T., Meza, F., Nedjraoui, D., Tena, F., Türkeş, M., Vázquez, R. J., and Weltz, M.: Desertification. In: Climate Change and Land: an IPCC special report on climate change, desertification, land degradation, sustainable land management, food security, and greenhouse gas fluxes in terrestrial ecosystems, edited by: Shukla, P. R., Skea, J., Calvo Buendia, E., Masson-Delmotte, V., Pörtner, H.-O., Roberts, D. C., Zhai, P., Slade, R., Connors, S., van Diemen, R., Ferrat, M., Haughey, E., Luz, S., Neogi, S., Pathak, M., Petzold, J., Portugal Pereira, J., Vyas, P., Huntley, E., Kissick, K., Belkacemi, M., and Malley, J., https://doi.org/10.1017/9781009157988.005, 2019.
Möhler, O., Stetzer, O., Schaefers, S., Linke, C., Schnaiter, M., Tiede, R., Saathoff, H., Krämer, M., Mangold, A., Budz, P., Zink, P., Schreiner, J., Mauersberger, K., Haag, W., Kärcher, B., and Schurath, U.: Experimental investigation of homogeneous freezing of sulphuric acid particles in the aerosol chamber AIDA, Atmos. Chem. Phys., 3, 211–223, https://doi.org/10.5194/acp-3-211-2003, 2003.
Möhler, O., Adams, M., Lacher, L., Vogel, F., Nadolny, J., Ullrich, R., Boffo, C., Pfeuffer, T., Hobl, A., Weiß, M., Vepuri, H. S. K., Hiranuma, N., and Murray, B. J.: The Portable Ice Nucleation Experiment (PINE): a new online instrument for laboratory studies and automated long-term field observations of ice-nucleating particles, Atmos. Meas. Tech., 14, 1143–1166, https://doi.org/10.5194/amt-14-1143-2021, 2021.
Munroe, J. S., Soderstrom, E. J., Kluetmeier, C. L., Tappa, M. J., Mallia, D. V., and Bauer, A. M.: Regional sources control dust in the mountain critical zone of the Great Basin and Rocky Mountains, USA, Environ. Res. Lett., 18, 104034, https://doi.org/10.1088/1748-9326/acfb26, 2023.
Murray, B. J., O'Sullivan, D., Atkinson, J. D., and Webb, M. E.: Ice nucleation by particles immersed in supercooled cloud droplets, Chem. Soc. Rev., 41, 6519–6554, https://doi.org/10.1039/C2CS35200A, 2012.
Murray, B. J., Carslaw, K. S., and Field, P. R.: Opinion: Cloud-phase climate feedback and the importance of ice-nucleating particles, Atmos. Chem. Phys., 21, 665–679, https://doi.org/10.5194/acp-21-665-2021, 2021.
Obrist, D., Hallar, A. G., McCubbin, I., Stephens, B. B., and Rahn, T.: Atmospheric mercury concentrations at Storm Peak Laboratory in the Rocky Mountains: Evidence for long-range transport from Asia, boundary layer contributions, and plant mercury uptake, Atmos. Environ., 42, 7579–7589, https://doi.org/10.1016/j.atmosenv.2008.06.051, 2008.
Omernik, J. M. and Griffith, G. E.: Ecoregions of the conterminous United States: evolution of a hierarchical spatial framework, Environ. Manage., 54, 1249–1266, https://doi.org/10.1007/s00267-014-0364-1, 2014.
Pekour, M. S. and Cziczo, D. J.: Wake Capture, Particle Breakup, and Other Artifacts Associated with Counterflow Virtual Impaction, Aerosol Sci. Tech., 45, 758–764, https://doi.org/10.1080/02786826.2011.558942, 2011.
Petersen, R. C., Hallar, A. G., McCubbin, I. B., Ogren, J. A., Andrews, E., Lowenthal, D., Gorder, R., Purcell, R., Sleeth, D., and Novosselov, I.: Numerical, wind-tunnel, and atmospheric evaluation of a turbulent ground-based inlet sampling system, Aerosol Sci. Tech., 53, 712–727, https://doi.org/10.1080/02786826.2019.1602718, 2019.
Phillips, V. T. J., Choularton, T. W., Illingworth, A. J., Hogan, R. J., and Field, P. R.: Simulations of the glaciation of a frontal mixed-phase cloud with the Explicit Microphysics Model, Q. J. Roy. Meteor. Soc., 129, 1351–1371, https://doi.org/10.1256/qj.02.100, 2003.
Pratt, K. A., DeMott, P. J., French, J. R., Wang, Z., Westphal, D. L., Heymsfield, A. J., Twohy, C. H., Prenni, A. J., and Prather, K. A.: In situ detection of biological particles in cloud ice-crystals, Nat. Geosci., 2, 398, https://doi.org/10.1038/ngeo521, 2009.
Pruppacher, H. R. and Klett, J. D.: Microphysics of Clouds and Precipitation, Springer Dordrecht, the Netherlands, https://doi.org/10.1007/978-0-306-48100-0, 2010.
Richardson, M. S., DeMott, P. J., Kreidenweis, S. M., Cziczo, D. J., Dunlea, E. J., Jimenez, J. L., Thomson, D. S., Ashbaugh, L. L., Borys, R. D., Westphal, D. L., Casuccio, G. S., and Lersch, T. L.: Measurements of heterogeneous ice nuclei in the western United States in springtime and their relation to aerosol characteristics, J. Geophys. Res.-Atmos., 112, https://doi.org/10.1029/2006jd007500, 2007.
Schmidt, S., Schneider, J., Klimach, T., Mertes, S., Schenk, L. P., Kupiszewski, P., Curtius, J., and Borrmann, S.: Online single particle analysis of ice particle residuals from mountain-top mixed-phase clouds using laboratory derived particle type assignment, Atmos. Chem. Phys., 17, 575–594, https://doi.org/10.5194/acp-17-575-2017, 2017.
Schneider, J., Höhler, K., Heikkilä, P., Keskinen, J., Bertozzi, B., Bogert, P., Schorr, T., Umo, N. S., Vogel, F., Brasseur, Z., Wu, Y., Hakala, S., Duplissy, J., Moisseev, D., Kulmala, M., Adams, M. P., Murray, B. J., Korhonen, K., Hao, L., Thomson, E. S., Castarède, D., Leisner, T., Petäjä, T., and Möhler, O.: The seasonal cycle of ice-nucleating particles linked to the abundance of biogenic aerosol in boreal forests, Atmos. Chem. Phys., 21, 3899–3918, https://doi.org/10.5194/acp-21-3899-2021, 2021.
Sioutas, C., Koutrakis, P., Ferguson, S. T., and Burton, R. M.: Development and Evaluation of a Prototype Ambient Particle Concentrator for Inhalation Exposure Studies, Inhal. Toxicol., 7, 633–644, https://doi.org/10.3109/08958379509014470, 1995.
Sze, K. C. H., Wex, H., Hartmann, M., Skov, H., Massling, A., Villanueva, D., and Stratmann, F.: Ice-nucleating particles in northern Greenland: annual cycles, biological contribution and parameterizations, Atmos. Chem. Phys., 23, 4741–4761, https://doi.org/10.5194/acp-23-4741-2023, 2023.
Tan, I. and Storelvmo, T.: Evidence of Strong Contributions From Mixed-Phase Clouds to Arctic Climate Change, Geophys. Res. Lett., 46, 2894–2902, https://doi.org/10.1029/2018GL081871, 2019.
Vali, G., DeMott, P. J., Möhler, O., and Whale, T. F.: Technical Note: A proposal for ice nucleation terminology, Atmos. Chem. Phys., 15, 10263–10270, https://doi.org/10.5194/acp-15-10263-2015, 2015.
Tan, I. and Storelvmo, T.: Sensitivity Study on the Influence of Cloud Microphysical Parameters on Mixed-Phase Cloud Thermodynamic Phase Partitioning in CAM5, J. Atmos. Sci., 73, 709–728, https://doi.org/10.1175/JAS-D-15-0152.1, 2016.
Tobo, Y., Adachi, K., Kawai, K., Matsui, H., Ohata, S., Oshima, N., Kondo, Y., Hermansen, O., Uchida, M., Inoue, J., and Koike, M.: Surface warming in Svalbard may have led to increases in highly active ice-nucleating particles, Commun. Earth Environ., 5, 516, https://doi.org/10.1038/s43247-024-01677-0, 2024.
Vali, G.: Sizes of Atmospheric Ice Nuclei, Nature, 212, 384–385, https://doi.org/10.1038/212384a0, 1966.
Vergara-Temprado, J., Miltenberger, A. K., Furtado, K., Grosvenor, D. P., Shipway, B. J., Hill, A. A., Wilkinson, J. M., Field, P. R., Murray, B. J., and Carslaw, K. S.: Strong control of Southern Ocean cloud reflectivity by ice-nucleating particles, P. Natl. Acad. Sci. USA, 115, 2687–2692, https://doi.org/10.1073/pnas.1721627115, 2018.
Williams, A. P., Cook, E. R., Smerdon, J. E., Cook, B. I., Abatzoglou, J. T., Bolles, K., Baek, S. H., Badger, A. M., and Livneh, B.: Large contribution from anthropogenic warming to an emerging North American megadrought, Science, 368, 314–318, https://doi.org/10.1126/science.aaz9600, 2020.
Wilson, T. W., Ladino, L. A., Alpert, P. A., Breckels, M. N., Brooks, I. M., Browse, J., Burrows, S. M., Carslaw, K. S., Huffman, J. A., Judd, C., Kilthau, W. P., Mason, R. H., McFiggans, G., Miller, L. A., Najera, J. J., Polishchuk, E., Rae, S., Schiller, C. L., Si, M., Temprado, J. V., Whale, T. F., Wong, J. P. S., Wurl, O., Yakobi-Hancock, J. D., Abbatt, J. P. D., Aller, J. Y., Bertram, A. K., Knopf, D. A., and Murray, B. J.: A marine biogenic source of atmospheric ice-nucleating particles, Nature, 525, 234–238, https://doi.org/10.1038/nature14986, 2015.
Wu, C., Lin, Z., Shao, Y., Liu, X., and Li, Y.: Drivers of recent decline in dust activity over East Asia, Nat. Commun., 13, 7105, https://doi.org/10.1038/s41467-022-34823-3, 2022.
Zelinka, M. D., Randall, D. A., Webb, M. J., and Klein, S. A.: Clearing clouds of uncertainty, Nat. Clim. Change, 7, 674–678, https://doi.org/10.1038/nclimate3402, 2017.
Zhou, R., Perkins, R., Juergensen, D., Barry, K., Ayars, K., Dutton, O., DeMott, P., and Kreidenweis, S.: Seasonal variability, sources, and parameterization of ice-nucleating particles in the Rocky Mountain region: importance of soil dust and biological contributions, Atmos. Chem. Phys., 26, 1515–1535, https://doi.org/10.5194/acp-26-1515-2026, 2026.