the Creative Commons Attribution 4.0 License.
the Creative Commons Attribution 4.0 License.
 | 18 May 2026
Surface ozone distribution and trends over Ireland: insights from long-term measurement record and source attribution modelling
Nikhil Korhale
Tabish Ansari
Tim Butler
Jurgita Ovadnevaite
Emmanuel Chevassus
Darius Ceburnis
Damien Martin
Colin D. O'Dowd
Liz Coleman
We present an analysis of long-term trends in surface ozone (O3) across Ireland, with specific focus on the Mace Head atmospheric research station, representative of Northern hemispheric background atmospheric conditions. Surface O3 dataset was characterised using advanced trajectory analysis and seasonal decomposition, revealing distinct seasonal and spatial patterns. Findings show a significant rising trend in surface O3 at Irish urban sites over the past two decades but without a similar trend at coastal sites. Highest O3 levels and exceedances were observed at remote coastal sites, which are less susceptible to influence from local and easterly emissions but heavily influenced by transboundary pollution and stratospheric intrusion.
At Mace Head, springtime O3 levels exhibit a declining trend, whereas wintertime levels show a rising trend. Focussing on the clean sector, the springtime decline remains significant, but without corresponding clean sector rising wintertime trends, implying the rising winter trends occur in response to declining local, United Kingdom (UK) and European emissions. Advanced modelling tools are used to quantify O3 source contributions, elucidating key drivers behind the observed changes. Characteristic springtime O3 maxima at Mace Head are predominantly attributed to stratospheric transport, hemispheric and long-range transport and lightning NOx. The complementary trend and sectoral observational analysis reveal a decline in total spring-time concentrations, with a more rapid decline in exceedances from the UK and continental sector.
This research highlights the importance of seasonal factors in air quality management across Ireland, emphasising the need for a multi-faceted approach to control O3 levels and reduce exceedances through global and regional emission reductions.
- Article
(3887 KB) - Full-text XML
-
Supplement
(1971 KB) - BibTeX
- EndNote


Surface Ozone (O3) has significant implications for health, vegetation, and climate. Its chemical production is driven by complex photochemical processes, responding non-linearly to pollution control, creating challenges for its effective regulation. Elevated O3 levels cause severe health issues with prolonged exposure to high O3 levels, causing respiratory issues, cardiovascular problems, and reduced lung function, particularly in sensitive populations such as children, the elderly, and individuals with pre-existing respiratory conditions (Lin et al., 2018; Todorović et al., 2019; Zhang et al., 2019, WHO, 2021). O3 pollution can adversely impact vegetation by reducing agricultural productivity (Ashmore, 2005; Paoletti, 2006). O3 is also the third most significant greenhouse gas after Carbon Dioxide (CO2) and methane (CH4), contributing to climate instability (IPCC et al., 2023). O3 can live for several weeks in the free troposphere, and it is affected by large-scale atmospheric circulation patterns (Wespes et al., 2017). Meteorological factors such as temperature, solar radiation, wind speed, and atmospheric stability play a significant role in O3 formation (Ding et al., 2023; Khiem et al., 2010).
O3 is formed in the atmosphere from precursors Nitrogen Oxides (NOx), carbon monoxide (CO), and volatile organic compounds (VOCs) through photochemical reactions. Photochemical production requires solar radiation, and reaction rates are correlated with temperature, it is noted that little photochemical production occurs at temperatures below 20 °C (Coates et al., 2016). The reactive, interdependent atmospheric chemistry leads to a non-linear relationship between O3 and its precursors (Seinfeld and Pandis, 2016), and effective O3 mitigation requires an understanding of processes influencing O3 production and removal mechanisms (Fowler et al., 2013).
NOx can suppress or enhance O3 formation, depending on local atmospheric chemistry regime. In polluted urban environments, high NOx emissions can lead to O3 dissociation, retarding photochemical O3 formation (NOx-saturated/VOC-limited regime), with local pollution events potentially titrating surface O3 completely, converting NO to NO2. This effect is more prevalent in wintertime, when temperatures are low, and there is little solar radiation to facilitate photochemical production of O3. In relatively clean environments, O3 formation is correlated with NOx concentration (Tavella and da Silva Júnior, 2021).
O3 and precursors can be transported over great distances in the troposphere, with transport from distant polluted regions accounting for 40 % of O3 abundance in remote regions (Sudo and Akimoto, 2007). While O3 is transported in air masses from distant sources, although titration occurs, O3 is replenished via mixing. Over Ireland, advection of O3 rich air from continental outflow is a significant source of Irish O3, but European continental air-masses can also transport pollutants to trigger O3 depletion events, but the O3 depleting effect of the air masses originating from Europe is in decline in response to European Union (EU) pollution control strategies (Derwent et al., 2024).
Seasonal and regional variations further complicate the regulation, with higher O3 levels observed in summer across the northern hemisphere due to increased temperatures, solar radiation, and abundant precursors (Moiseenko et al., 2021; Sicard et al., 2016). In marine boundary layers, O3 levels are generally lower than in continental regions, though specific oceanic environments can exhibit high O3 concentrations due to inflows from polluted areas (Boylan et al., 2014; Girach et al., 2020). Another factor which influences O3 levels is the North Atlantic Oscillation (NAO), which influences O3 levels in Western Europe. During a positive NAO phase, O3 levels increase. In contrast, during a negative NAO phase (NAO-low), O3 levels decrease. This effect is particularly notable in southwest, central, and northern Europe (Bonaccorso et al., 2015; Creilson et al., 2003; Pausata et al., 2012).
While Ireland's air quality is mostly governed by the influx of clean maritime air from the Atlantic Ocean (Tripathi et al., 2010), certain synoptic scenarios allow for the intrusion of polluted air masses from continental Europe. These events, though infrequent, can bring substantial amounts of O3 and its precursors (NOx and VOCs), contributing to short-term O3 pollution episodes.
The World Health Organisation (WHO) publishes Air Quality Guidelines (AQGs) as a non-legally binding global target for governments to achieve within their jurisdictions. These AQGs comprise evidence-based recommendations of limit values to protect public health. The current recommended AQGs for O3 is expressed as a daily maximum of 8-hourly running average O3 value of 100 µg m−3. Days when O3 levels exceed the recommended AQGs are classified as exceedance days. Factors contributing to exceedances include high solar radiation, stagnant air masses, and local emissions and regional and transboundary transport of O3 and precursors. Globally, over the past 150 years, there has been a 40 % increase in O3 levels owing to rising precursor emissions. (Archibald et al., 2020; Griffiths et al., 2021; Young et al., 2013). Despite European Union emission reduction policies, O3 pollution remains a problem, with over 94 % of those living in European cities exposed to O3 levels exceeding the WHO AQGs in 2022 (EEA, 2024; WHO, 2021). Over 22,000 premature deaths in the EU were attributable to short-term exposure to O3 in 2021 (Soares et al., 2023).
Long-term O3 measurement data from the Mace Head research station in Ireland reveal a distinct seasonal pattern with peaks during spring and lows in summer (Derwent, 1998; Derwent et al., 1994, 2018). Historical trends show increasing baseline O3 levels in the 1980s and 1990s, stability in the 2000s, and a decline in the 2010s (Derwent et al., 2013, 2018). Recent observational and modelling data have identified a broad O3 maximum in spring and early summer, aligning with peak stratospheric transport (Ansari et al., 2025; Lin et al., 2012; Russo et al., 2023). O3 dynamics are complex, and studies reveal discrepancies between model output and observations (Bessagnet et al., 2016; Vautard et al., 2012), highlighting the need for further understanding of factors governing O3 levels and trends.
This study investigates the distribution and trends of O3 and its precursors across Ireland, providing valuable insights into the regional and hemispheric impact on Irish surface O3 levels and exceedances. We analyse the long-term O3 observational dataset for Ireland, identifying the mean and range of O3 levels and seasonal variation at each site. We identify the long-term annual and monthly trends at each site, quantifying the significance of each trend according to TOAR guidelines (Chang et al., 2023). We also identify the frequency and seasonality of exceedance of the WHO AQGs for the protection of human health from O3 pollution for each site. The trends and seasonality are contextualised by looking at trends in the Irish instrumental record of dominant precursors of NOx and CH4 and we discuss the relationship between NOx and O3 by comparing anomalies between monthly average NOx and O3 during lockdown compared to the average values for the three years prior to lockdown. Advanced modelling results using the Tropospheric Ozone Attribution of Sources with Tagging 1.0 (TOAST 1.0) framework (Butler et al., 2018, 2020) are validated against measurements at various sites for simulation period 2000–2018, and the simulation results analysed to determine the geographical and sectoral source of precursors that contribute to simulated O3 at Mace Head, identifying seasonality and long-term trends in the sources. Finally, the observational data are classified using advanced trajectory clustering methods to separate air masses from the clean sector from those influenced by local, UK or EU emission sources, with seasonal trends identified for both clean and polluted sectors, and the exceedances classified as coming from either the clean or polluted sector.
This research highlights significant seasonal and temporal variations and long-term trends in O3 concentrations, and the integrated approach, including observational and modelling analysis, enhances our understanding of the drivers of O3 concentrations, trends and exceedances over Ireland and allows quantification of global and regional contributions to Irish surface O3.
2.1 Observational network and analysis approach
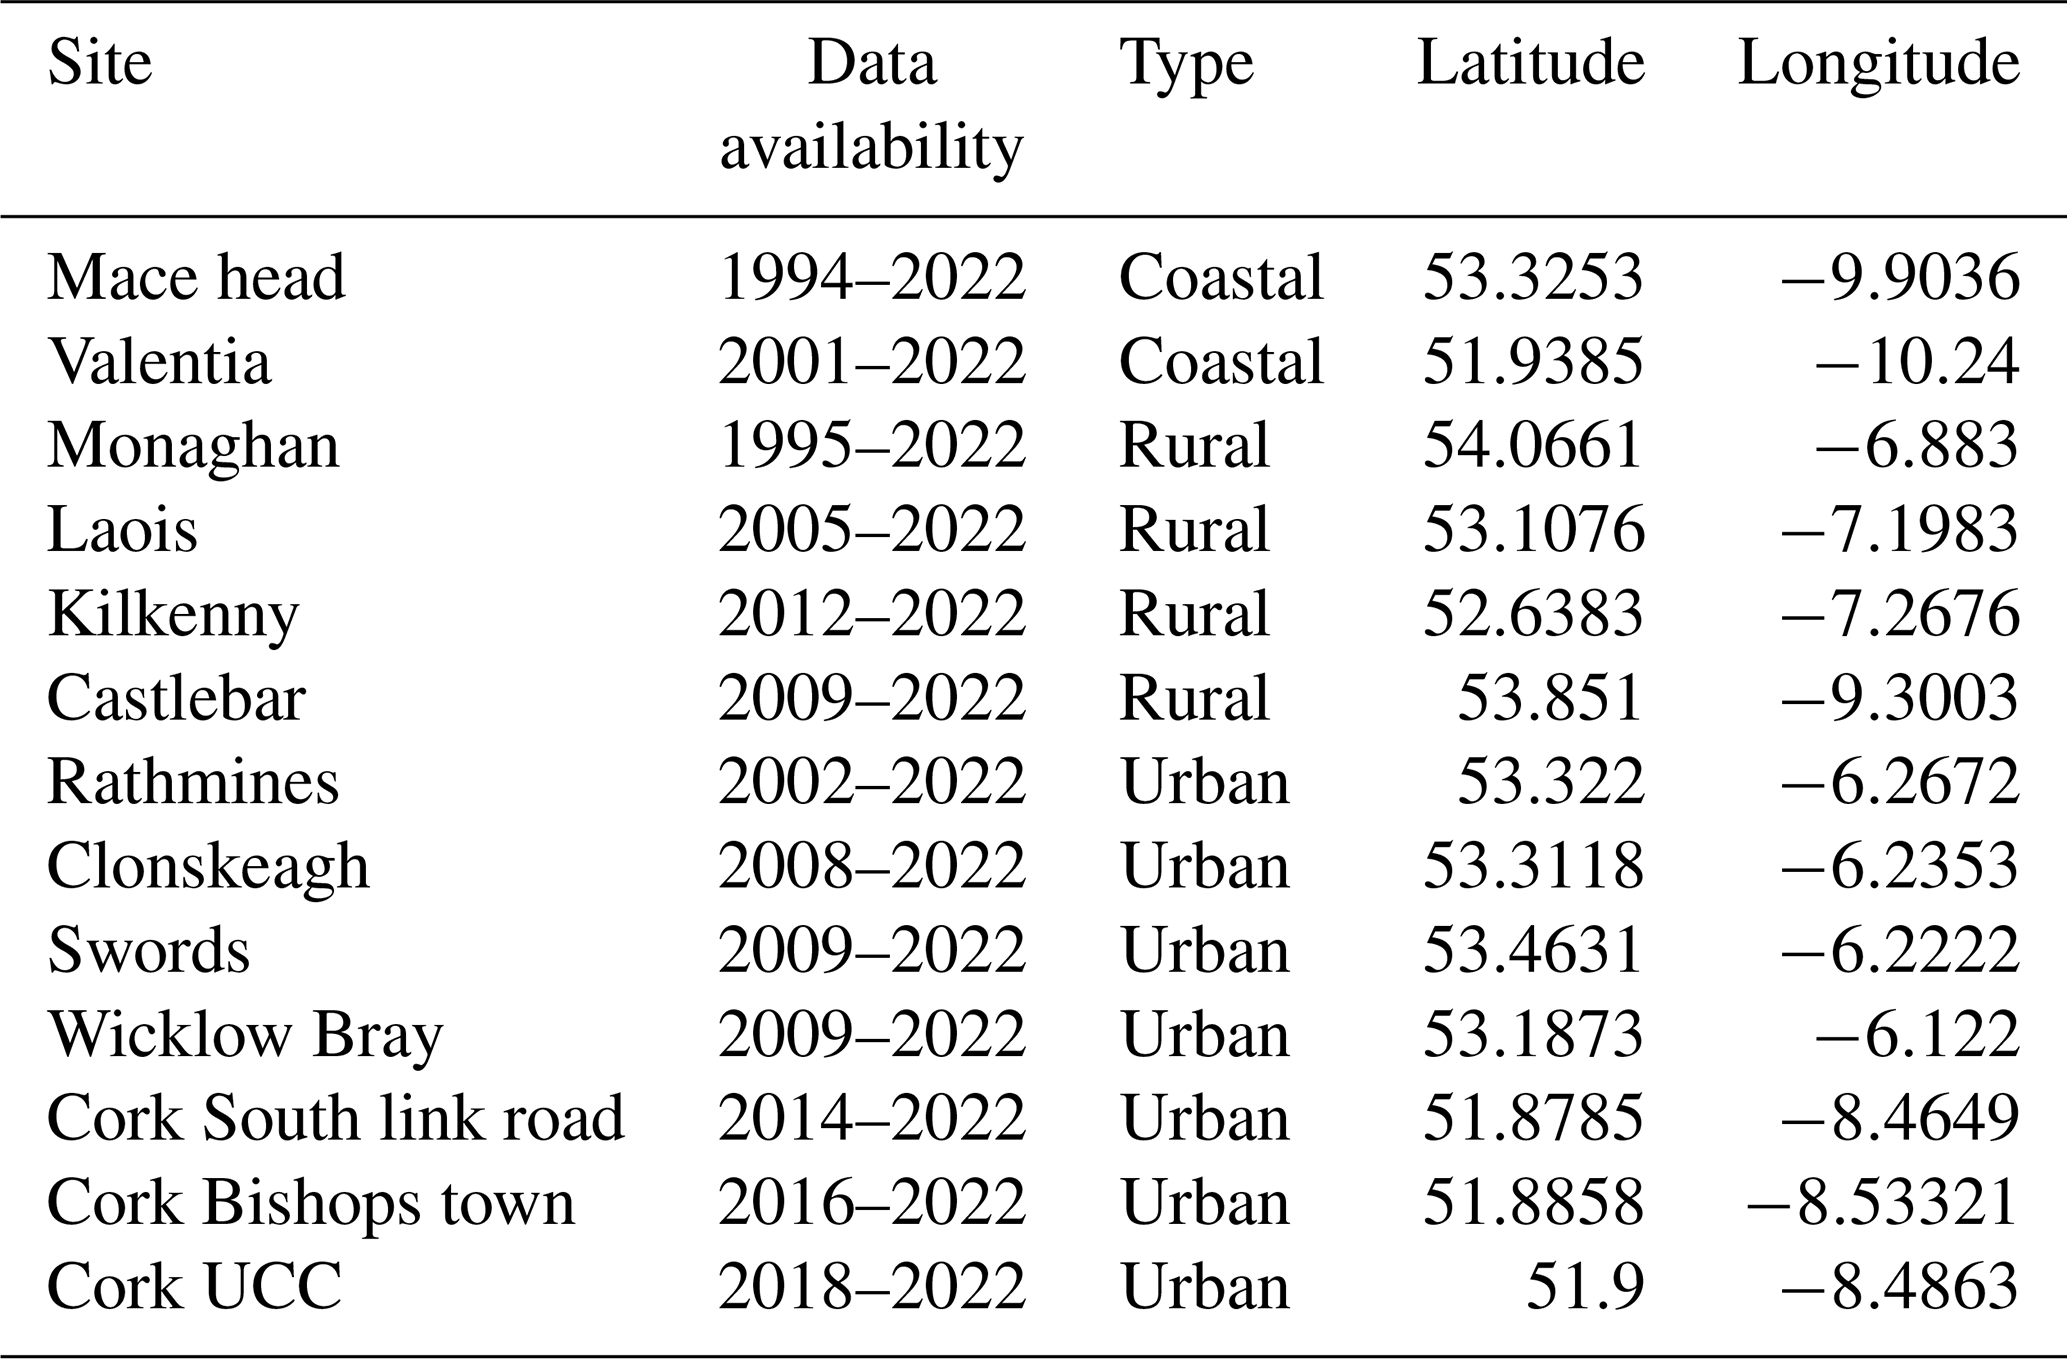
Measurement data is obtained from the Environmental Protection Agency, Ireland (EPA) (https://eparesearch.epa.ie/safer/, last access: 20 September 2023). The O3 monitoring network shown in Fig. 1 has been operational in Ireland since 1994. O3 is measured using an API M400 and O3 analyser based on UV photometry at all monitoring sites. At the Mace Head site, O3 was measured using a Monitor Labs 8810 analyzer and a Thermo Environmental O3 monitor. Measurement operating accuracy is within 1.0 ppb, based on precision, calibration and drift characteristics. Measurements of O3 precursors from EPA air quality monitoring sites are also monitored. The details of the measurements sites are shown in Table 1. Numerous previous studies have analysed this data, with a particular focus on the analysis of Mace Head data to assess background O3 (Carslaw, 2005; Derwent et al., 1994, 1998, 2001, 2004, 2008, 2013, 2018; Oltmans et al., 2013; Simmonds et al., 2004; Tripathi et al., 2010, 2012, 2013). CH4 data is obtained from the Integrated Carbon Observation System (ICOS) network, accessible at https://www.icoscp.eu/data-products/ATM_NRT_CO2_CH4 (last access: 15 February 2024).
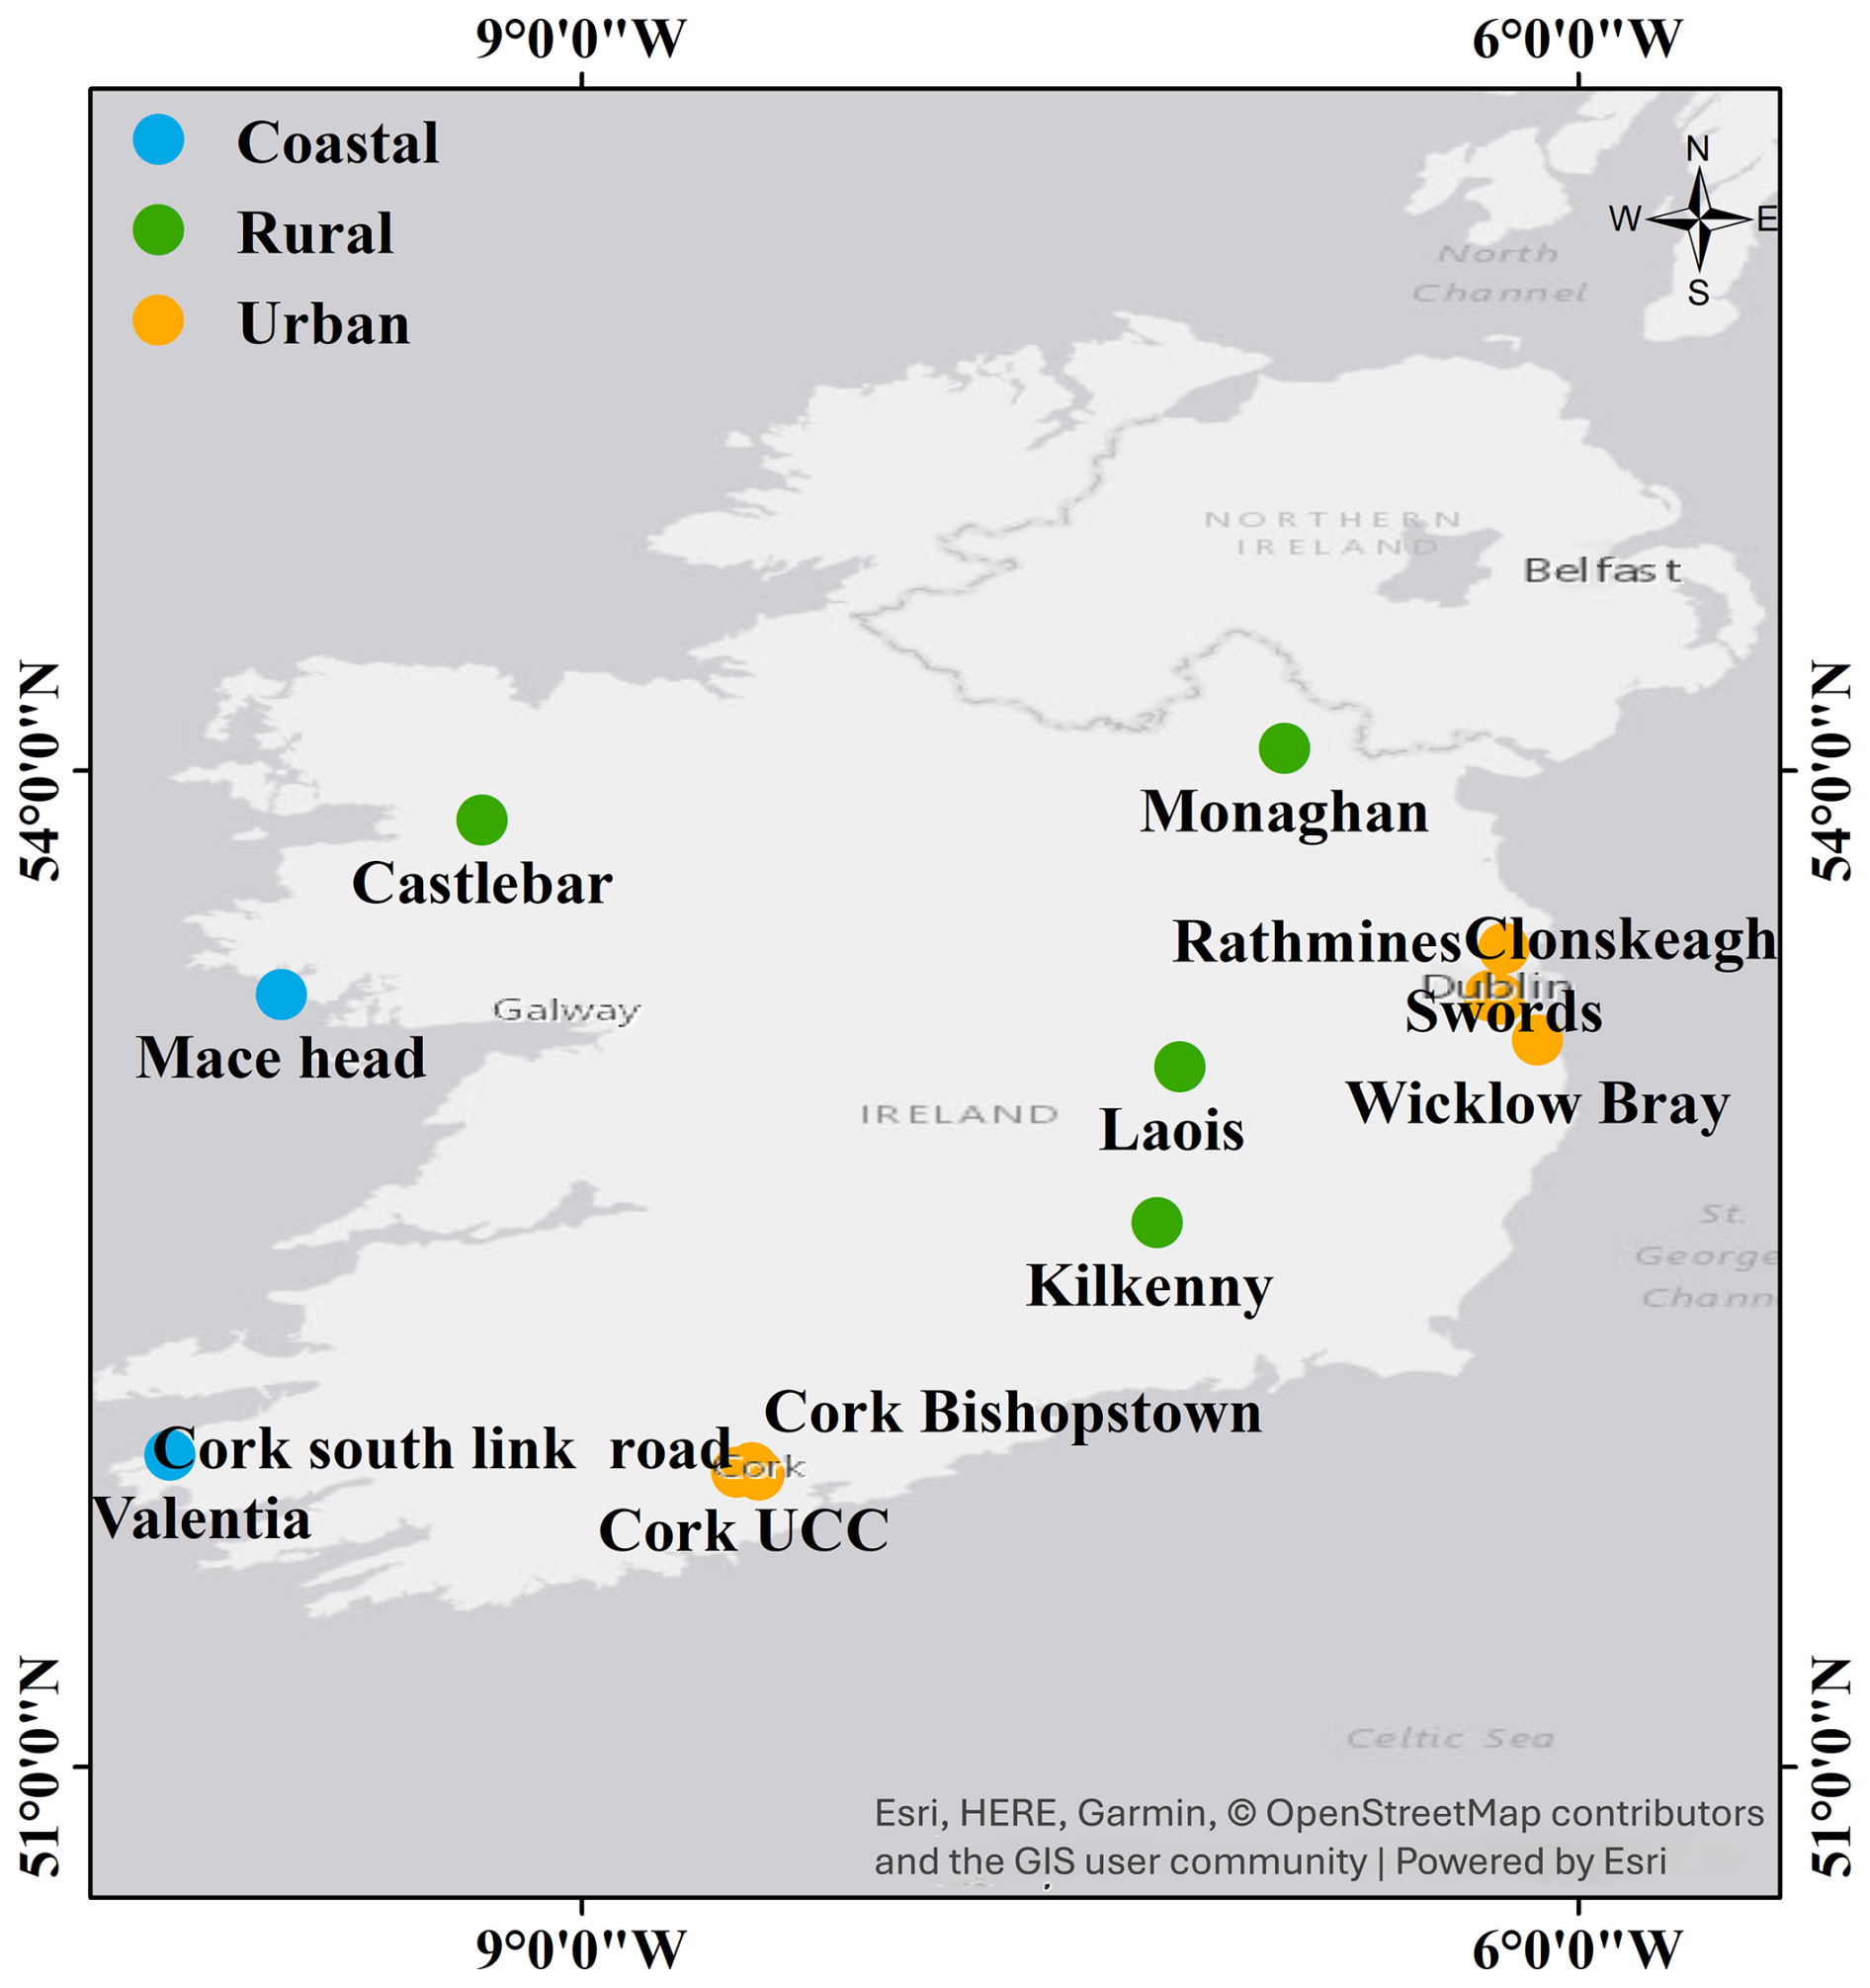
Figure 1The map of EPA O3 measurement sites over Ireland with classification of backgrounds.
Table 1Details of Environmental Protection Agency Ireland (EPA) O3 measurement sites over Ireland, with location information, and the data period used for the study.
For this analysis, the observational sites were classified into three categories: Coastal, Rural, and Urban, as shown in Fig. 1. The classification of the sites is based on Spohn et al. (2022), with the addition of the coastal category. Hourly data were used to evaluate annual trends based on monthly mean concentrations. Seasonal analysis conducted for the four main meteorological seasons in Ireland, namely Spring (March, April, May), Summer (June, July, August), Autumn (September, October, November), and Winter (December, January, February). O3 exceedances were calculated based on the WHO AQGs, indicating that the maximum daily average over 8 h (MDA8) should not exceed 100 µg m−3. A significant analysis was performed on data measured at the Mace Head Atmospheric Research Station (53°33′ N, 9°54′ W), which is exposed to pristine marine air masses approximately half of the time (Grigas et al., 2017; O'Dowd et al., 2014).
Trend analysis was conducted using the Openair package in R, software designed for the analysis of atmospheric composition data. Trends were determined using the Theil–Sen slope estimator and Mann–Kendall tests to quantify significance, in accordance with the Tropospheric Ozone Assessment Report (TOAR) guidelines (Lefohn et al., 2018). Theil-Sen directly provides a robust slope estimate. It is a reliable measure of change over time for direct interpretation and comparison. It is a robust method for estimating trend slopes in time series data, preferable to traditional least-squares regression, which can be sensitive to extreme values and outliers. Uncertainty or reliability of the trend is calibrated according to the p value, as outlined by Chang et al. (2023), consistent with the best statistical practices for analysis used in the second phase of TOAR.
2.2 Clean air sector identification from back trajectories
Baseline O3 refers to the concentration of O3 in air masses minimally influenced by local or regional anthropogenic emissions. Back-trajectory methods are widely used to estimate baseline O3 levels by analysing the origins and transport pathways of air masses reaching observation sites. Typically, Lagrangian dispersion models are used to trace air parcels backwards in time and identify their origin.
For this study, air mass trajectories arriving at Mace Head were calculated using the Hybrid Single Particle Lagrangian Integrated Trajectory Model (HYSPLIT) (Draxler, 2003; Stein et al., 2015) in conjunction with R software. The air masses were classified into two categories: the clean sector and EU-influenced sector. An air mass was considered part of the clean sector when air mass trajectories remained over the ocean surface for the previous 72 h, the remaining air mass trajectories are classified as the EU-influenced sector. Meteorological data for the analysis were derived from NOAA reanalysis data (Stunder, 2004). The 72 h duration captures regional/long-range transport without trajectory error from meteorological uncertainties. The 100 m height was used to represent the well-mixed flow of the boundary layer above the surface. The 06:00 UTC aligns with synoptic times and can match daily O3 cycles or measurement periods. Therefore, calculations were performed for 06:00 UTC each day, with a final trajectory height of 100 m, covering the years 2000 to 2022. The O3 concentrations observed during the clean sector were averaged to derive baseline levels, consistent with previous studies on baseline O3 trends and sources (Derwent et al., 2013; Oltmans et al., 2006).
2.3 CAM4-Chem model
The CAM-Chem air quality model, part of the Community Earth System Model (CESM), simulates atmospheric chemistry and the interactions among chemical constituents, meteorology, and climate. It incorporates detailed chemical mechanisms, emission inventories, and meteorological data to simulate pollutant dispersion, thereby allowing us to determine air quality trends. CAM-Chem has been applied in numerous studies, significantly contributing to the understanding of regional and global atmospheric processes (Lamarque et al., 2012; Tilmes et al., 2016). The model features a flexible chemical pre-processor to allow for detailed handling of atmospheric chemistry. Studies have demonstrated that CAM-Chem accurately represents conditions in both the troposphere (Aghedo et al., 2011; Lamarque et al., 2010) and the stratosphere (Lamarque et al., 2008; Lamarque and Solomon, 2010), including temperature structure and dynamics (Butchart et al., 2011). Offline CAM-Chem has also been utilised in the Hemispheric Transport of Air Pollution (HTAP) assessments (Anenberg et al., 2009; Fiore et al., 2009; Jonson et al., 2010; Shindell et al., 2008; Tan et al., 2018).
For the current study, we analyse simulations of the Community Atmospheric Model version 4 CAM4-Chem (Community Atmosphere Model version 4 with chemistry) (Lamarque et al., 2012). The model simulations were carried out at a horizontal resolution of 210 km × 280 km, with 56 vertical levels for the 2000–2018 period, with specified dynamics derived from MERRA2 reanalysis. (Molod et al., 2015). The coarse spatial resolution, it is still appropriate because it provides a reliable representation of the regional background atmosphere influencing the urban sites. The model captures large-scale features of atmospheric transport, seasonal variability, and background O3 levels, all of which are essential for interpreting urban observations. Comparing urban measurements with regional-scale CAM-Chem outputs allows local pollution effects to be distinguished from regional atmospheric influences.
Tagged source attribution of tropospheric ozone (TOAST 1.0) is a novel tagging methodology developed for the CESM to quantify source contributions to O3. Unlike traditional methods that rely on sensitivity simulations, TOAST uses an online tagging approach to track O3 production from specific NOx and VOC sources (e.g., anthropogenic, biogenic, biomass burning, lightning) directly within the model, allowing for efficient attribution of O3 to regional and sectoral emissions while maintaining full chemical coupling. The tool has been validated against observations and demonstrates utility in disentangling the impacts of different emission sectors on O3 pollution. (Butler et al., 2018, 2020; Lupaşcu et al., 2022; Nalam et al., 2025).
The model results have inherent standard uncertainties common in any modelling exercise, i.e., uncertainties in emission inventories in terms of magnitude and spatial accuracy; uncertainties in model parameters, e.g., surface resistance for deposition for various surfaces, boundary layer mixing, photolysis, chemical kinetic parameters (Wild and Ryan, 2026) and structural deficiencies such as a coarse resolution and missing processes (e.g., halogen chemistry; Saiz-Lopez et al., 2025). The sum of all tagged contributions very closely matches the total simulated ozone (which is simulated independently and is not just an algebraic sum of the tagged contributions) is a good validation of the tagging mechanism (Butler et al., 2018 and 2020).
Global CAM4-Chem model simulations are performed for the years 2000–2018 with NOx and VOC tagging (as described in Ansari et al., 2025; Nalam et al., 2025), with the base chemical mechanism (Emmons et al., 2012) and source code modified to account for extra tagged species representing regional and sectoral identities. Anthropogenic emissions of NOx, CO, and non-methane volatile organic compounds (NMVOCs) are incorporated from the Hemispheric Transport of Air Pollution version 3 emissions inventory (HTAPv3; Crippa et al., 2024), which includes land-based emissions, international shipping emissions, and aircraft emissions. Biomass burning emissions are sourced from the GFED-v4 inventory (Van Der Werf et al., 2010), while biogenic NMVOC emissions are derived from CAM4-GLOB-BIOv3.0. The O3 source attribution technique used for this study is described in Butler et al. (2020).
3.1 Yearly variation of O3
Figure 2 shows box plots, illustrating the average O3 concentrations for 13 sites over the duration of the available dataset, as discussed in Sect. 2.1, providing a comprehensive overview of the variability and distribution of O3 concentration. Coastal sites, Mace Head and Valentia, show higher O3 levels compared to other sites, with annual average concentrations of 77 and 69 µg m−3, respectively. In urban areas like Rathmines, Dublin, O3 concentrations remained consistently lower, with averages ranging from 39 to 56 µg m−3. Similarly, South link road and Bishopstown sites in Cork city, recorded relatively lower concentrations compared to coastal and rural locations, reflecting the impact of high urban NOx emissions. Rural sites like Laois and Kilkenny showed intermediate O3 concentrations, less influenced by urban emissions. These sites consistently show O3 averages ranging between 50 to 57 µg m−3, with little variability, highlighting the predominant role of steady background O3 contributions in rural sites. O3 concentrations vary significantly with proximity to emission sources adjacent to urban areas. O3 levels can be lower due to titration, where O3 reacts with NO, causing O3 depletion, but the transport of precursors can cause an increase in O3 concentration downwind of the sources (Jeon et al., 2014; Monks et al., 2015; Zhu et al., 2012).
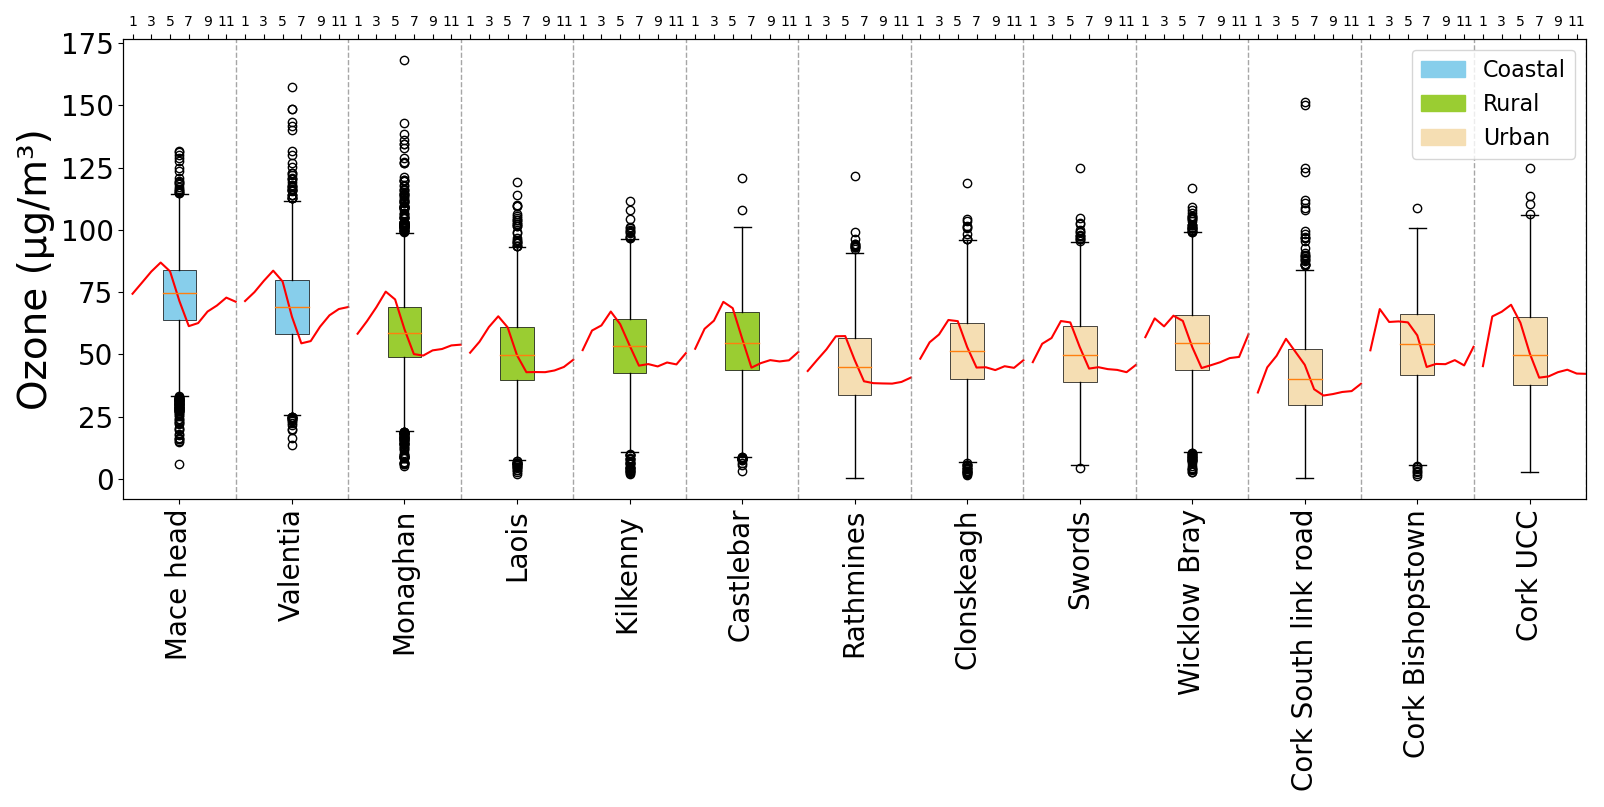
Figure 2Annual average O3 concentration at different sites in Ireland. In each box, the lowest whisker level represents the 5th percentile, the box spans from the 25th to the 75th percentile, the horizontal line within the box represents the median 50th percentile, and the upper whisker represents the 95th percentile. The average of monthly O3 values calculated for the entire period of each station, and the red line shows the average monthly O3 variation of all sites top axis shows the month (1–12).
The red line over the box shows a clear seasonal pattern in O3 concentration for each site, with a springtime (March–April) peak and summertime (June–July) dip, with the highest peaks in the coastal sites, and lowest dips in urban sites, influenced by local emissions, e.g. Cork South Link Road and Swords.
3.2 O3 trend analysis
3.2.1 Yearly trend
Table 2 summarises the Theil-Sen trends in O3 concentration (in µg m−3 yr−1) across 13 monitoring sites in Ireland over different periods: 5 years (2018–2022), 10 years (2013–2022), 15 years (2008–2022), and the available years of data for each site. In the coastal regions, Mace Head shows a consistent decrease in O3 levels over the 5, 10, and 15 year periods, although the entire dataset exhibits a small rising trend 0.02 µg m−3 yr−1. These trends are mostly in agreement with previous studies, where there was a positive trend observed in background O3 up to the mid-2000s, which stabilised and began to decline in the 2010s (Derwent et al., 2018). Valentia shows a long-term decreasing trend of −0.23 µg m−3 yr−1, consistent with the previous study by Tripathi et al. (2010).
Table 2Trends in surface O3 concentration (µg m−3 yr−1) calculated for 13 sites in Ireland over different periods over the complete dataset: 5 years (2018–2022), 10 years (2013–2022), 15 years (2008–2022), and the available measurement record for the site. The p value evaluates the reliability of the trend, whereas a lower p value indicates trend certainty. Adopting the trend reliability scale defined for TOAR-II studies (Chang et al., 2023). Statistical significance of trend is indicated using star notation: denotes p≤0.01 (very high certainty), denotes (high certainty), denotes (medium certainty), * denotes (low certainty), and no star denotes p>0.33 (very low certainty).
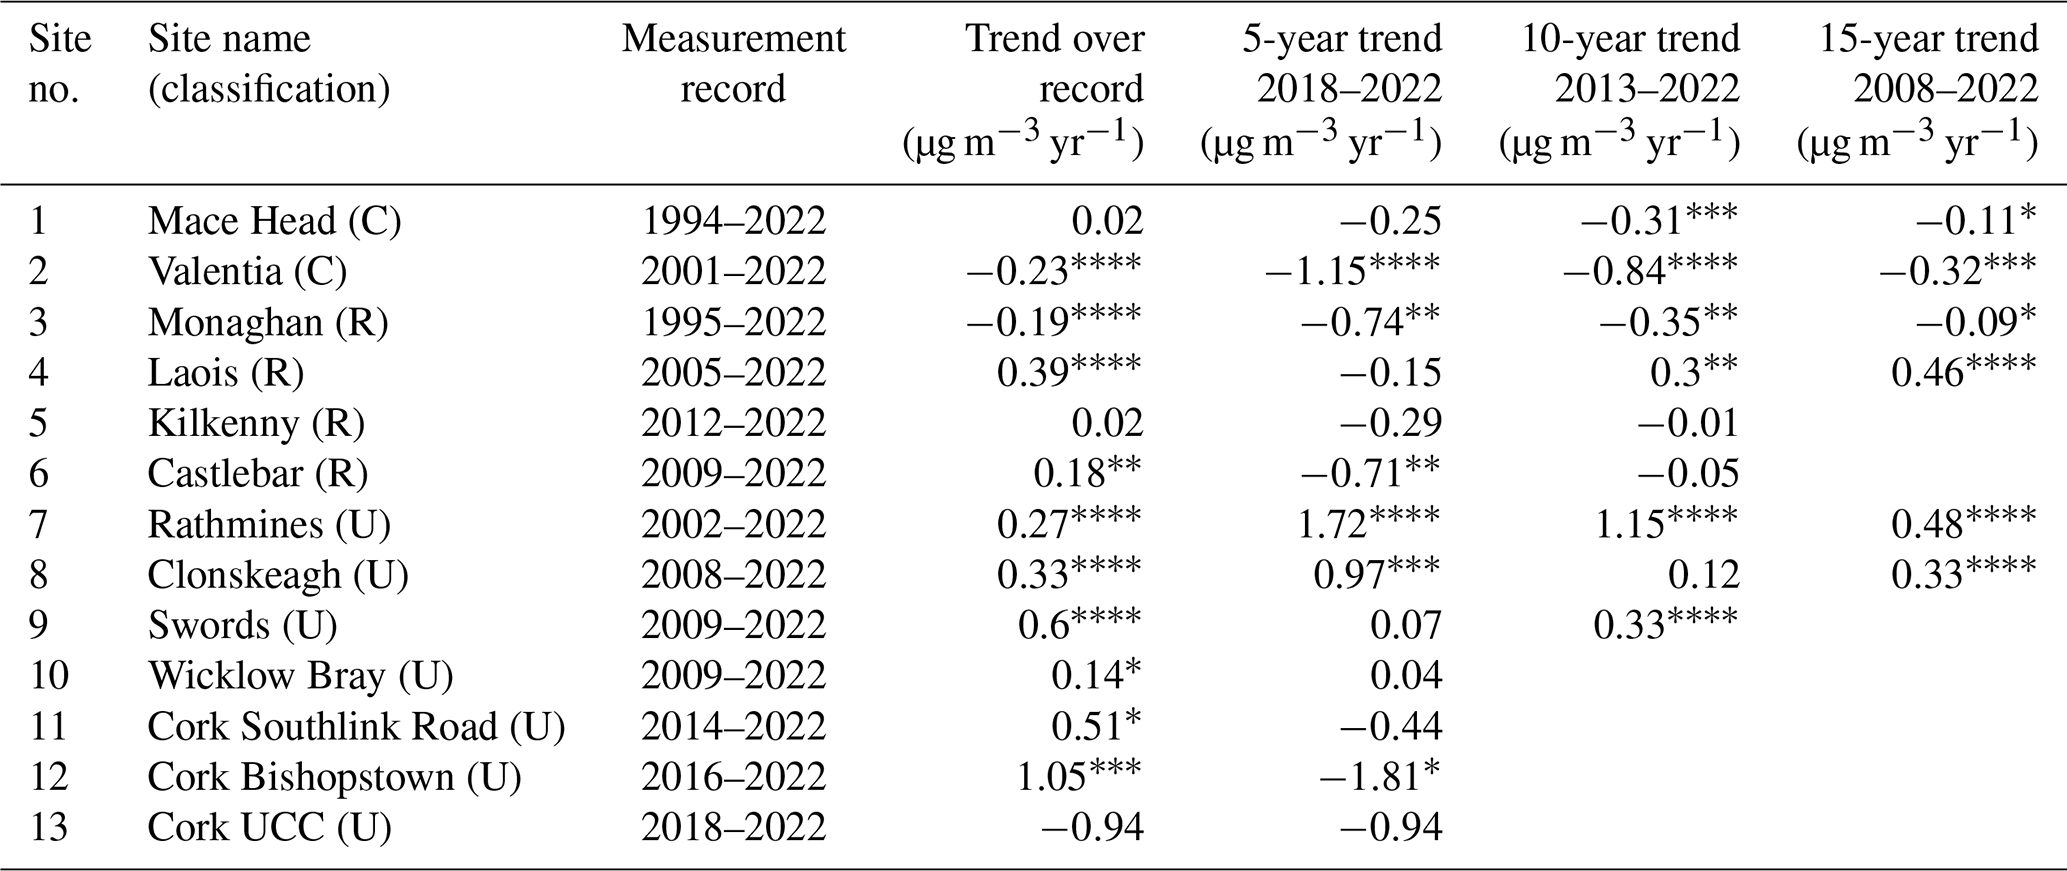
In rural areas, Monaghan exhibits a declining trend in O3 concentrations across all time periods, indicating an overall reduction. Laois shows an upward trend over the 10 and 15 year periods, though there is a slight decline in the most recent 5 years. Kilkenny presents slight negative trends over the 5 and 10 year periods (−0.29 and −0.01 µg m−3 yr−1). Negative trends are observed in Castlebar (0.71 and −0.05 µg m−3 yr−1).
The Dublin urban area sites (Rathmines, Clonskeagh, Swords) predominantly show increasing trends in O3 levels, indicative of changes in urban pollution or local emissions, with decreased suppression of O3 levels in urban regions due to decreased local emissions (Derwent et al., 2024). This is consistent with the “weekend effect”, as observed by Atkinson-Palombo et al. (2006) whereby a reduction in NOx due to reduced weekend traffic decreases O3 removal by NOx titration, leading to higher surface O3 levels, likely to occur in wintertime, and in regions with low photochemical production due to low insolation and temperatures, as observed in Ireland. It is duly noted that NOx driven O3 removal dominates over photochemical production in these sites. A comparable study in the UK carried out by Finch and Palmer (2020) attributed similarly rising trends in surface O3 between 1999 and 2019 to decreasing NOx, characterising UK observation sites as VOC-limited. Mixed results are observed at the urban stations of Cork, with a positive trend at the South-link Road and Bishopstown, but a negative trend at the UCC station. The UCC station, although classified as urban, lies within the university campus; hence, it would not be subject to significant local emissions. Coastal sites like Mace Head and Valentia generally show decreasing trends, potentially due to less local emission sources but with more significant impacts from regional and long-range transport, However, a detailed analysis of the trends requires consideration of seasonal effects.
Previous studies indicate that in northeast Europe, peak surface ozone concentrations have generally declined, reflecting the effectiveness of emission control measures (Yan et al., 2018). In contrast, background and lower-level O3 concentrations have continued to increase, particularly at rural and suburban sites. Consistent with this, urban observations from 2000–2021 show increasing trends in median and lower-percentile O3 levels, while the highest extremes have mostly decreased (Nelson and Drysdale, 2025).
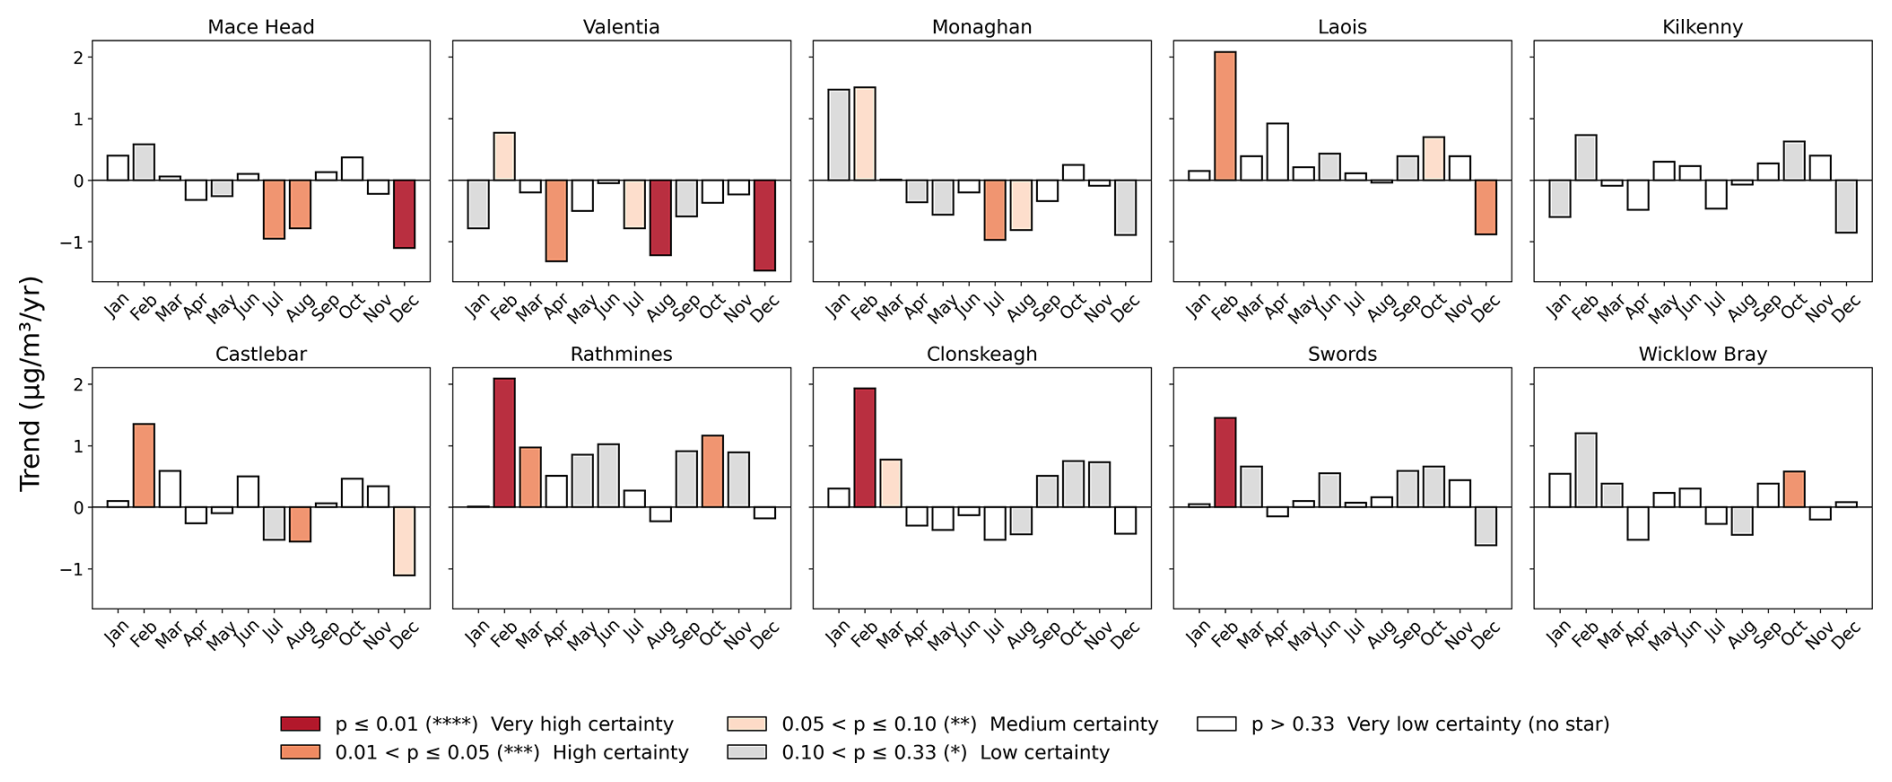
Figure 3Monthly trend analysis of O3 at different sites for 10 year period (2012–2022). Adopting the trend reliability scale defined for TOAR-II studies (Chang et al., 2023), trends significance highlighted by colour.
3.2.2 Monthly trend
Figure 3 shows the monthly trend for 10 years from the period 2012–2022. Mace Head (coastal) and Monaghan (rural) sites predominantly show a rising trend in winter/early spring, with a decreasing trend in late spring to summer. Valentia shows a decreasing trend in every month except February when levels are significantly impacted by long-range transport and stratospheric sources (Auvray and Bey, 2005; Pan et al., 2018). Urban sites show a general increasing monthly trend, as yearly trend but with a seasonal signal in Clonskeagh with an increase in winter-spring and a decrease in late spring or summer. Laois is characterised as a rural site yet exhibits rising trends similar to the urban sites for all months except December, indicating that the measurement station is affected by nearby emissions. Seasonal trends of the 15-year dataset are supplied in Sect. S1 in the Supplement (Fig. S2), where coastal stations exhibit a pronounced increase in late winter, and a decrease in late summer, with a consistent near-year-round increase in Rathmines and Laois.
3.3 O3 exceedance
The O3 exceedances at 13 sites in Ireland over the available measurement dataset are identified according to WHO criteria, and the results are shown in Fig. 4. The highest and lowest numbers of O3 exceedances were observed at Mace Head and Rathmines, representing coastal and urban sites, respectively. Most exceedances occurred in spring (March, April, May), coinciding with the spring-time maximum. Rathmines had its highest number of exceedances in April 2019, while Laois reached a peak of 13 exceedances in May 2017. Castlebar and Swords show increased exceedance occurrences in spring and early summer, particularly notable spikes occurring in 2010, 2013, 2016, and 2019. Conversely, Wicklow Bray exhibited a different pattern, showing significant spikes in February and March 2022, alongside occasional exceedances during March, April, and May, for example, in 2012 and 2018. Cork South link Road also recorded exceedances, particularly in March and notably in June. Cork Bishoptown shows exceedances, especially in February and March 2019, while Cork UCC recorded exceedances in April and May 2019. Kilkenny consistently exhibited exceedances during spring and summer, with April and May often recording the highest numbers, particularly in 2019. This highlights the impact of seasonal atmospheric conditions on O3 levels. It is noted that summertime exceedances, although less frequent in occurrence, indicate photochemical production events that would be required to elevate O3 levels from the annual dip in the seasonal cycle to exceed the WHO AQG threshold. These episodic spikes are characteristic of unique climatic or pollution events and warrant further study.
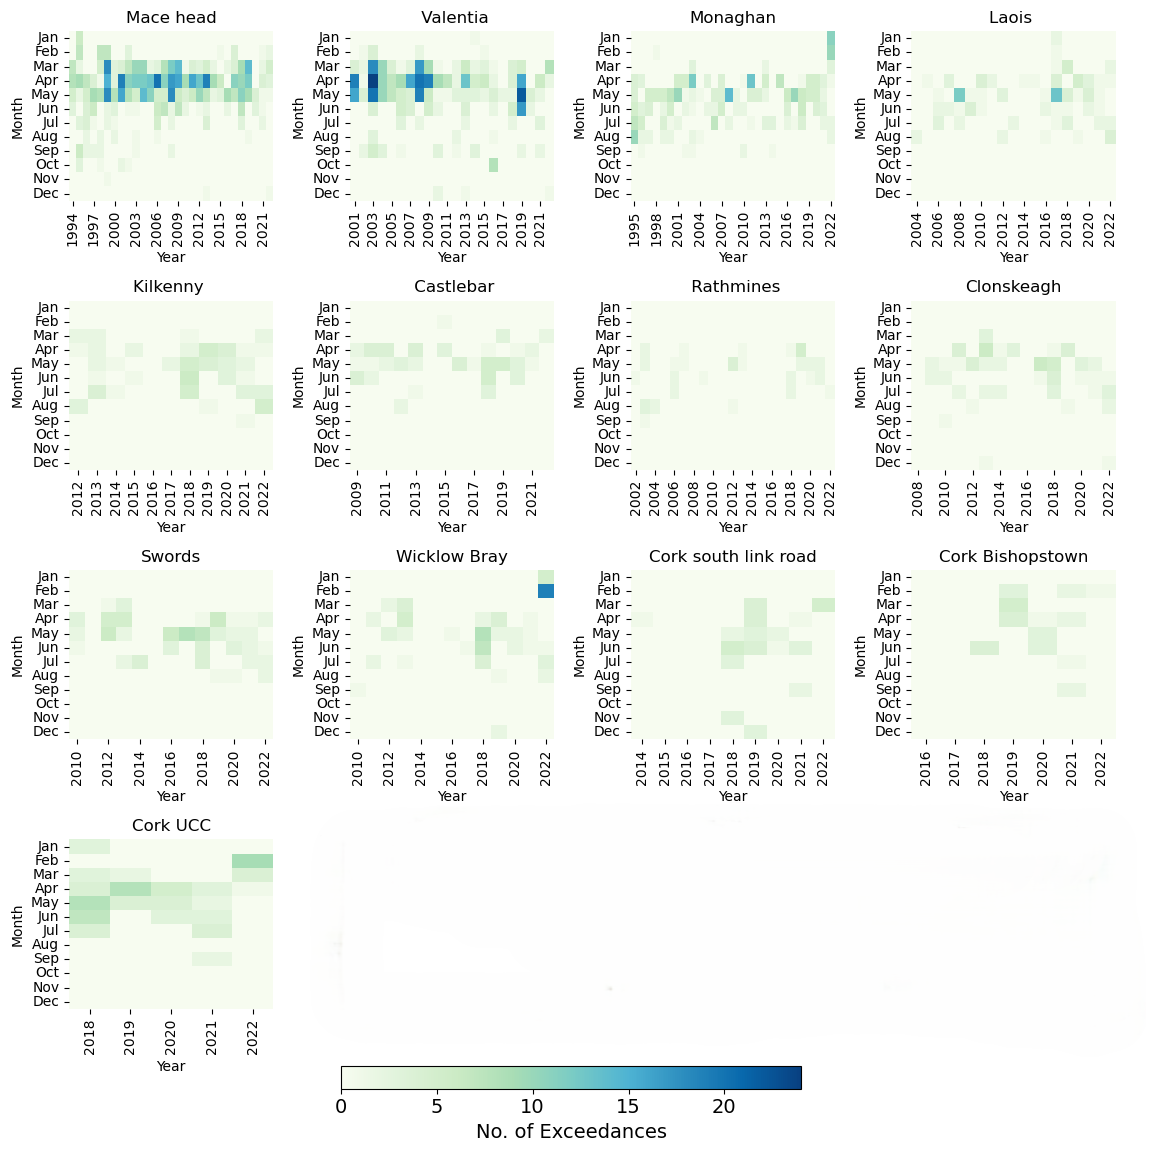
Figure 4Monthly O3 exceedance at different sites in Ireland. Exceedances are defined as days on which the maximum 8 h running average of ozone (O3) exceeds 100 µg m−3.
Figure 5 depicts trends in NO2 and CH4 concentrations across various Irish measurement sites.
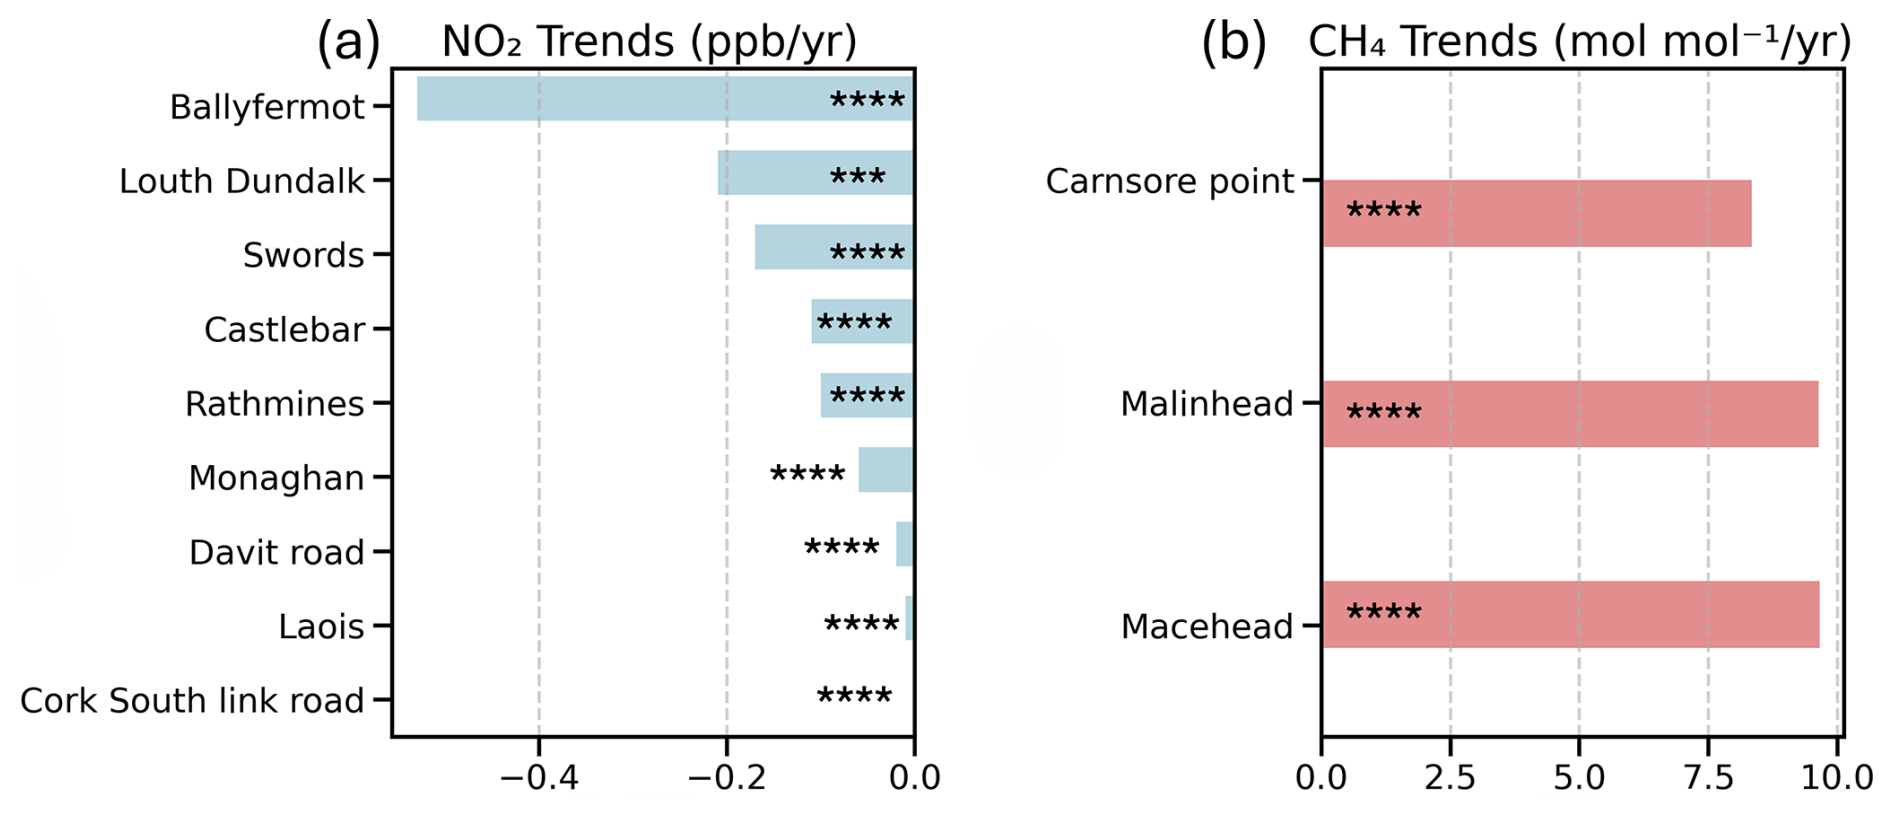
Figure 5Trend in O3 precursors NO2 (a), and CH4 (b) at different sites. Statistical significance of trend is indicated, increasing * with increasing trend reliability, as in Table 1.
NO2 trend calculations are based on site-specific data periods, Cork South link Road (2014–2022), Ballyfermot (2003–2022), Davit Road (2018–2023), Rathmines (1995–2024), Swords (2011–2025), Laois (2014–2026), Castlebar (2003–2027), Louth Dundalk (2019–2028), and Monaghan (2001–2029). For CH4, the data cover the period 2010–2022. Most monitored sites exhibit a decreasing trend in NO2 concentrations, most likely in response to pollution control on transportation, industrial activities, and energy production in the EU and North America (Coleman et al., 2013; Donlon et al., 2024). In contrast, CH4 levels observed at three sites – Mace Head, Malin Head, and Carnsore Point indicate a significant and persistent rise in CH4 concentrations. Mace Head is known for its clean Atlantic air and Malin Head, situated at Ireland's northern tip near the UK border, offers a unique position to observe both clean marine air and transboundary pollution, whereas Carnsore Point in the southeast captures air masses from both the UK and mainland Europe (Spohn et al., 2022). These NO2 and CH4 trends reveal a dual dynamic: while NO2 levels are decreasing due to effective emission controls, CH4 levels relentlessly rise, highlighting the need for enhanced mitigation strategies targeting CH4.
To evaluate the relationship between NOx and O3 concentrations in an Irish context and the potential benefit of abrupt enforcement of NOx control measures, we assess the impact of the COVID-19 2020 lockdown, Spring 2020, whereby the lockdown period saw a prominent relative decrease in NO2, yet an increase in surface O3 compared to average measurements for the same months 2017-2019 in most national monitoring stations (Fig. 6). The negative correlation between O3 and NO2 is indicative of a NOx-saturated regime, normally associated with polluted urban environments and NOx titration events. Analysis of the impact of the lockdown on Irish O3 is discussed by Spohn et al. (2022), and a similar O3 decrease was widely observed across Europe during the COVID lockdown (Ordóñez et al., 2020; Tavella and da Silva Júnior, 2021; Zhang and Stevenson, 2022). Significant enhancement of O3 occurs at the inland measurement sites, despite a 2020 springtime decrease in O3 observed at background coastal sites, Mace Head and Valentia. These coastal stations are less sensitive to changes in European NOx emissions than inland sites and more sensitive to stratospheric and hemispheric transport (Tan et al., 2018). It is noted that April and May 2020 had unique meteorological conditions compared to previous years, with lower wind speed, less rain and significantly higher solar radiation, see Fig. 12 in Spohn et al. (2022). These meteorological conditions would potentially facilitate photochemical O3 production, contributing to positive O3 anomalies during the lockdown period in addition to NOx reduction, also potentially enhancing dry deposition to the ocean. Further investigation into this topic would warrant model sensitivity studies, beyond the scope of this current work.
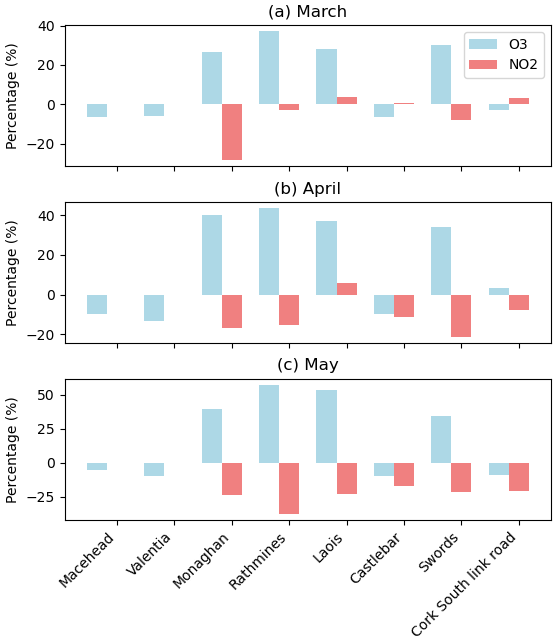
Figure 6Percentage change in NO2 and O3 during the lockdown period of 2020 as compared to the 2017–2019 average at different sites in Ireland for (a) March, (b) April and (c) May.
The negative correlation between NOx and O3 under relatively clean atmospheric conditions indicates that O3 levels are influenced predominantly by transport and chemical removal, and local photochemical production does not represent a significant surface O3 source owing to periods of low-insolation periods and low temperature, which are characteristic of Irish meteorology and frequent cloud cover (Pallé and Butler, 2002)
3.4 Model and observations comparison
3.4.1 Comparison between CAM4-Chem model and observations
Global simulations were performed with the CAM4-Chem model enabled with source tagging (Butler et al., 2018) for 2000–2018 and the modelled O3 over Ireland was compared with surface O3 measurements at five sites. The grid details are shown in Sect. S4 (Fig. S5). This model has already been comprehensively evaluated on a global scale (Nalam et al., 2025) against the TOAR-1 dataset, whereby the model performed well, albeit with a high bias attributable to the model's coarse resolution and implications for the resolution of urban chemistry (Ansari et al., 2025). Figure 7 shows the comparison of monthly O3 CAM4-Chem and ground station O3 data. From this figure, it is observed that CAM4-Chem exhibits negative (positive) bias in rural and coastal (urban) sites. The underestimation at Mace Head is probably caused by the coarse grid resolution, covering a large area not representative of Mace Head conditions.
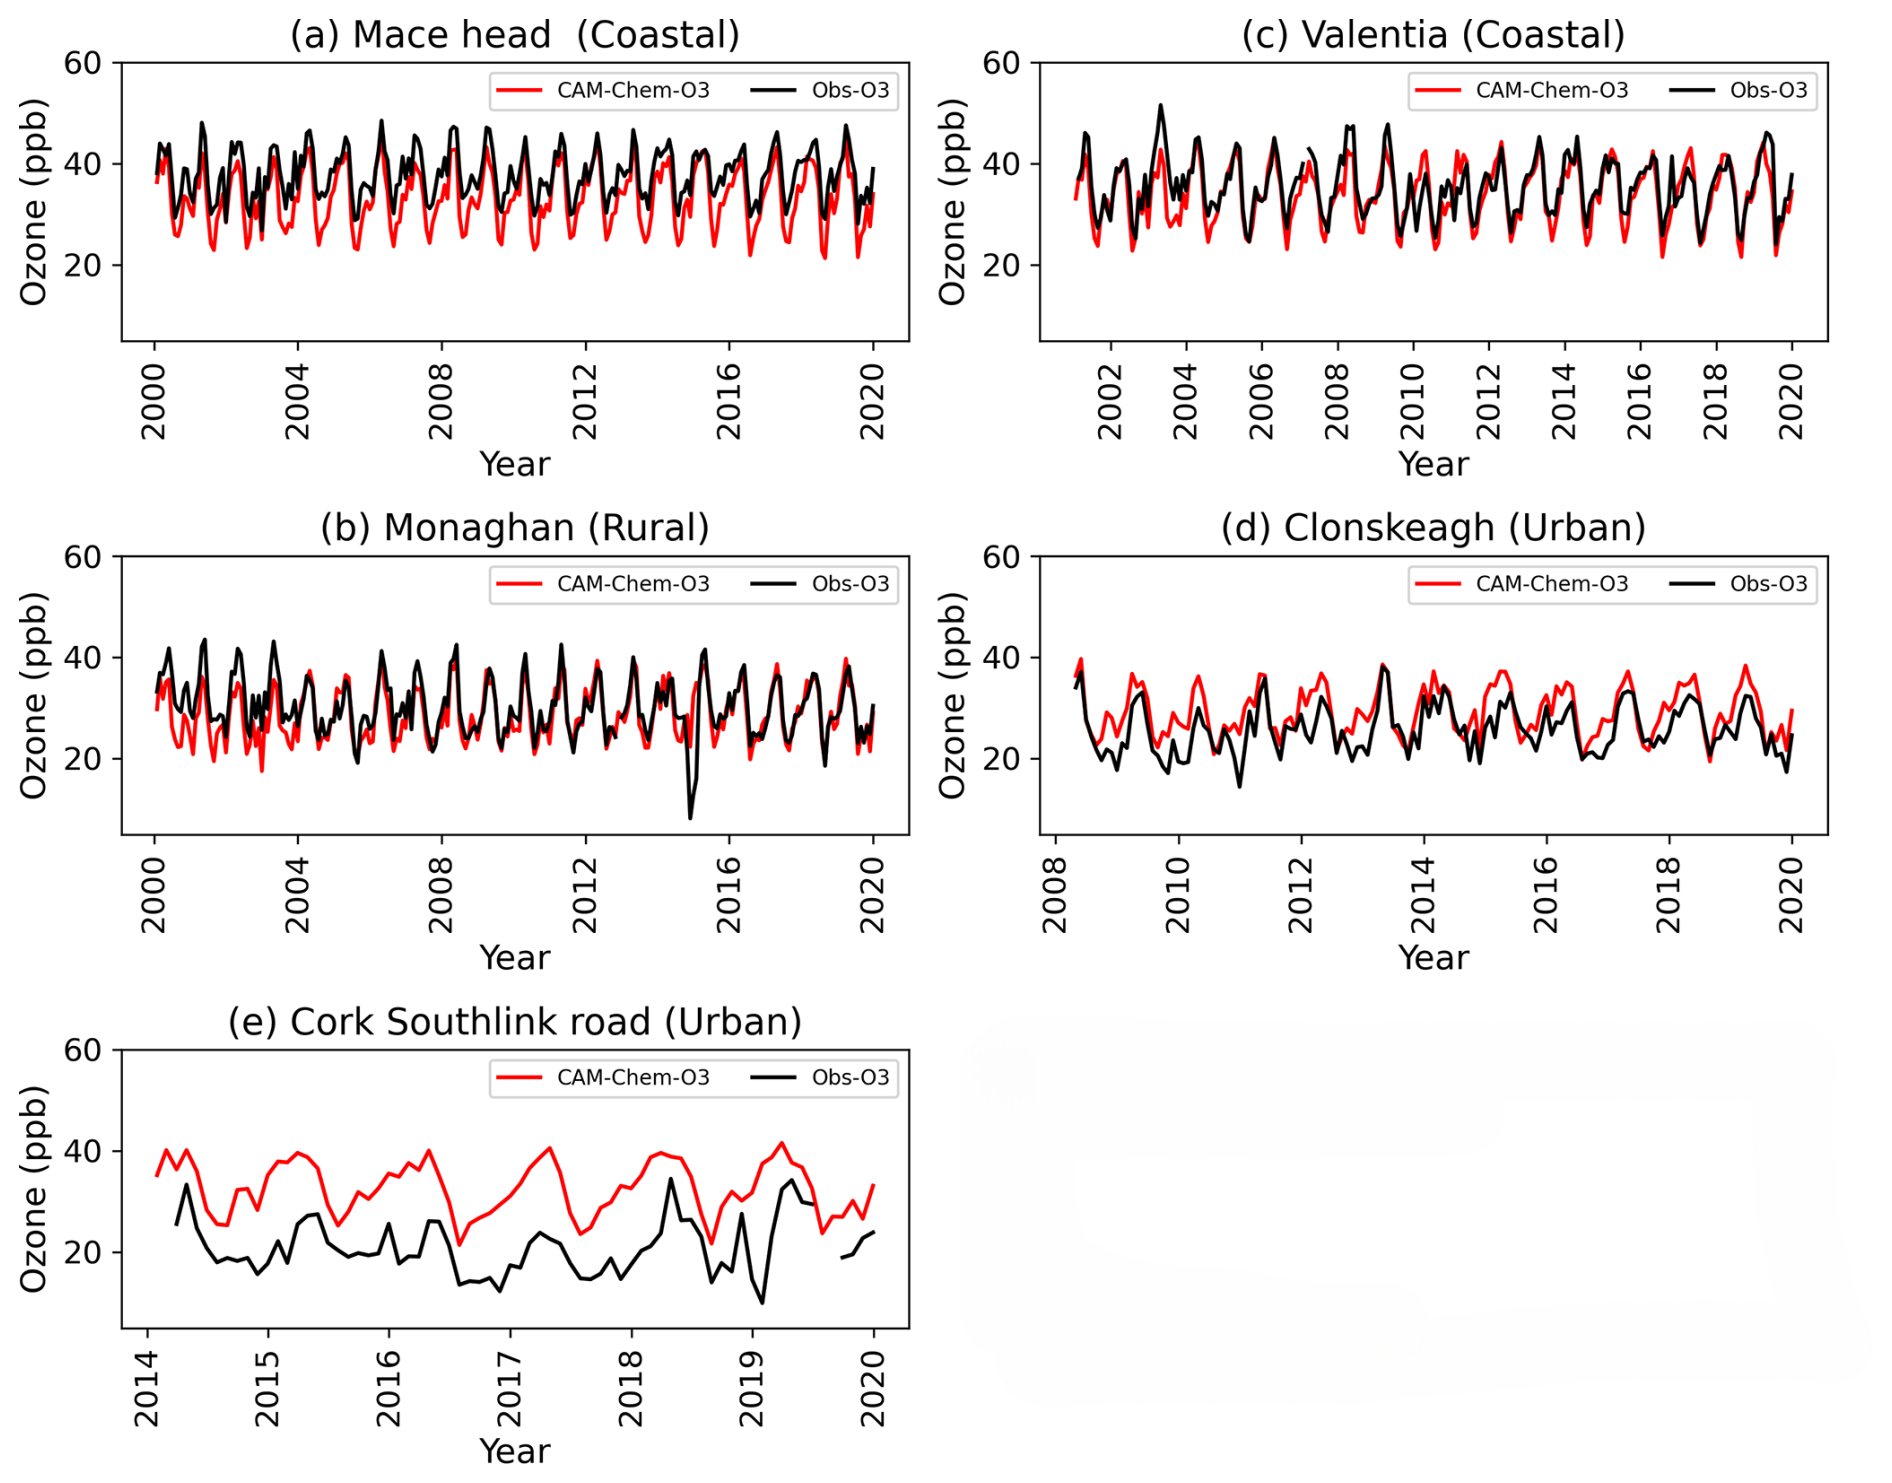
Figure 7The comparison of Monthly CAM4-Chem O3 and monthly O3 observations at five sites in Ireland.
The influence of coastal meteorology, which suppresses O3 formation due to cooler temperatures and persistent cloud cover (McVeigh et al., 2010), also leads to an underestimation of O3 (Yerramilli et al., 2012). The dry deposition rate over land would exceed that over the ocean, leading to a lower simulated O3 concentration for the grid cell which covers both land and ocean surface. Dry deposition is enhanced by solar radiation (Coleman et al., 2012, 2013; Pio et al., 2000) hence model measurement discrepancy is at a maximum in late summer months. As outlined by Fiore et al. (2009), models average the landscape characteristics within a grid cell, which can enhance O3 deposition and result in lower simulated O3 concentrations; hence, the discrepancy is more pronounced in the clean sector data.
Overestimation of O3 in Clonskeagh and Cork South link Road is likely due to coarse grid handling of localised emissions and subsequent atmospheric chemistry.
At Mace Head, the model shows a negative mean bias of −4.42 (−11.68 % normalized mean bias) but strong correlation (r=0.83). In Monaghan and Valentia, the model shows smaller biases of −1.43 and −1.54, normalized mean biases of −4.74 % and −1.54 %, and correlation coefficients of 0.73 and 0.72, respectively. These high correlations are in line with Tilmes et al. (2015). However, at Clonskeagh and Cork South Link Road, the model overestimates, with positive biases (3.38 and 11.98) and weaker correlations (0.68 and 0.49). Statistics are given in more detail in Sect. S4 (Table S1 in the Supplement). These results suggest better model performance at coastal/rural sites and greater discrepancies in areas affected by local sources, as expected at this model resolution.
3.4.2 Source attribution using CAM4-Chem
To quantify the contribution of various precursor emission sources to modelled O3 concentrations, the TOAST1.0 dual NOx and VOC tagging technique was utilised (Butler et al., 2018). This allows attribution of modelled O3 to the emissions of NOx and VOC precursors across different source sectors and geographical regions as listed in Table 3.
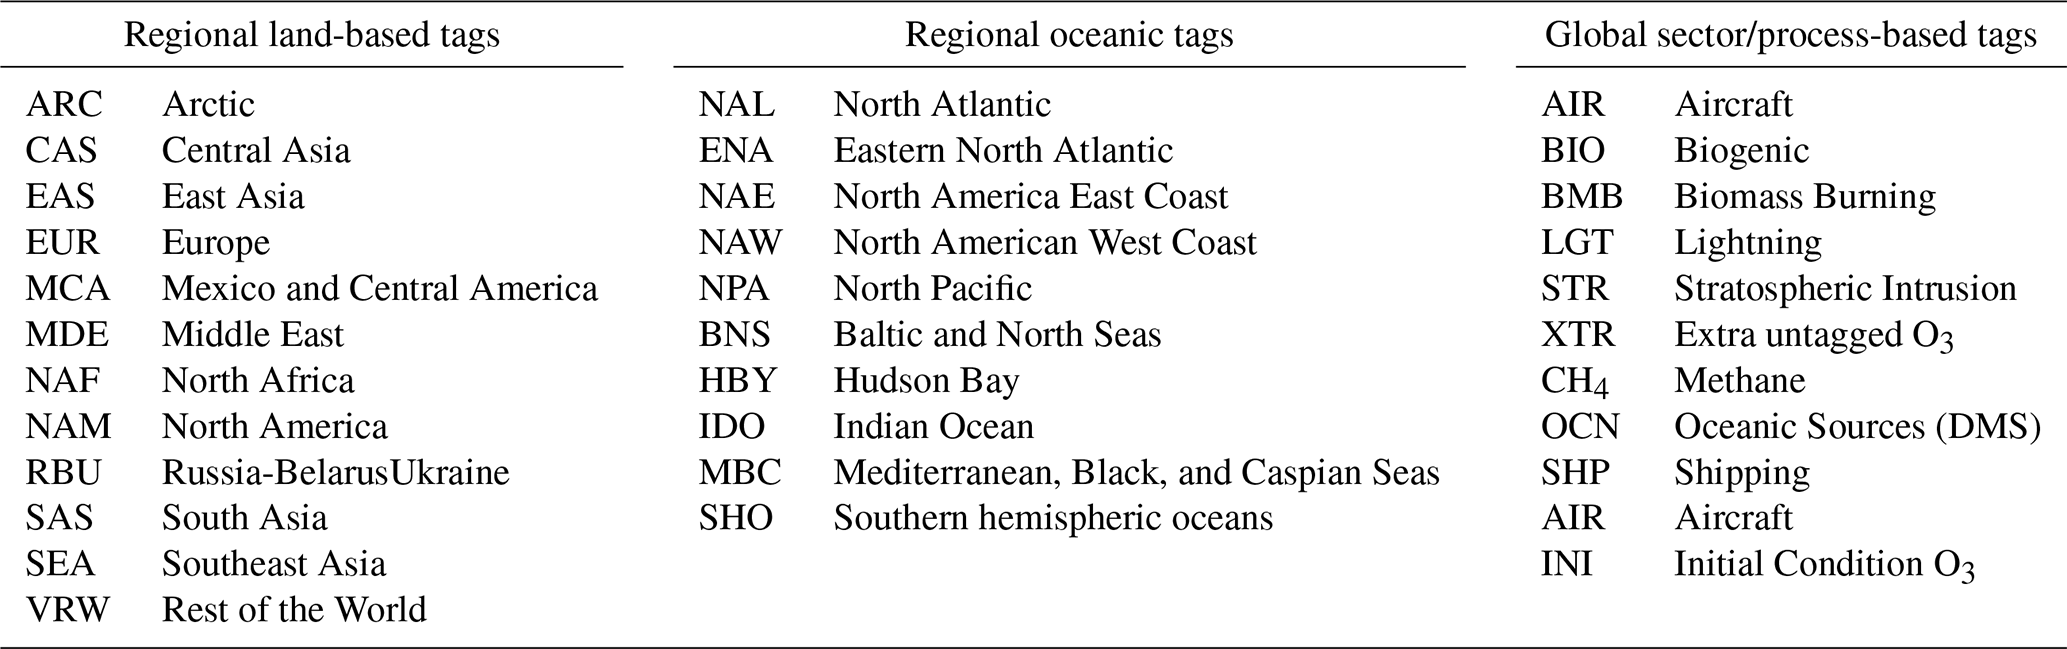
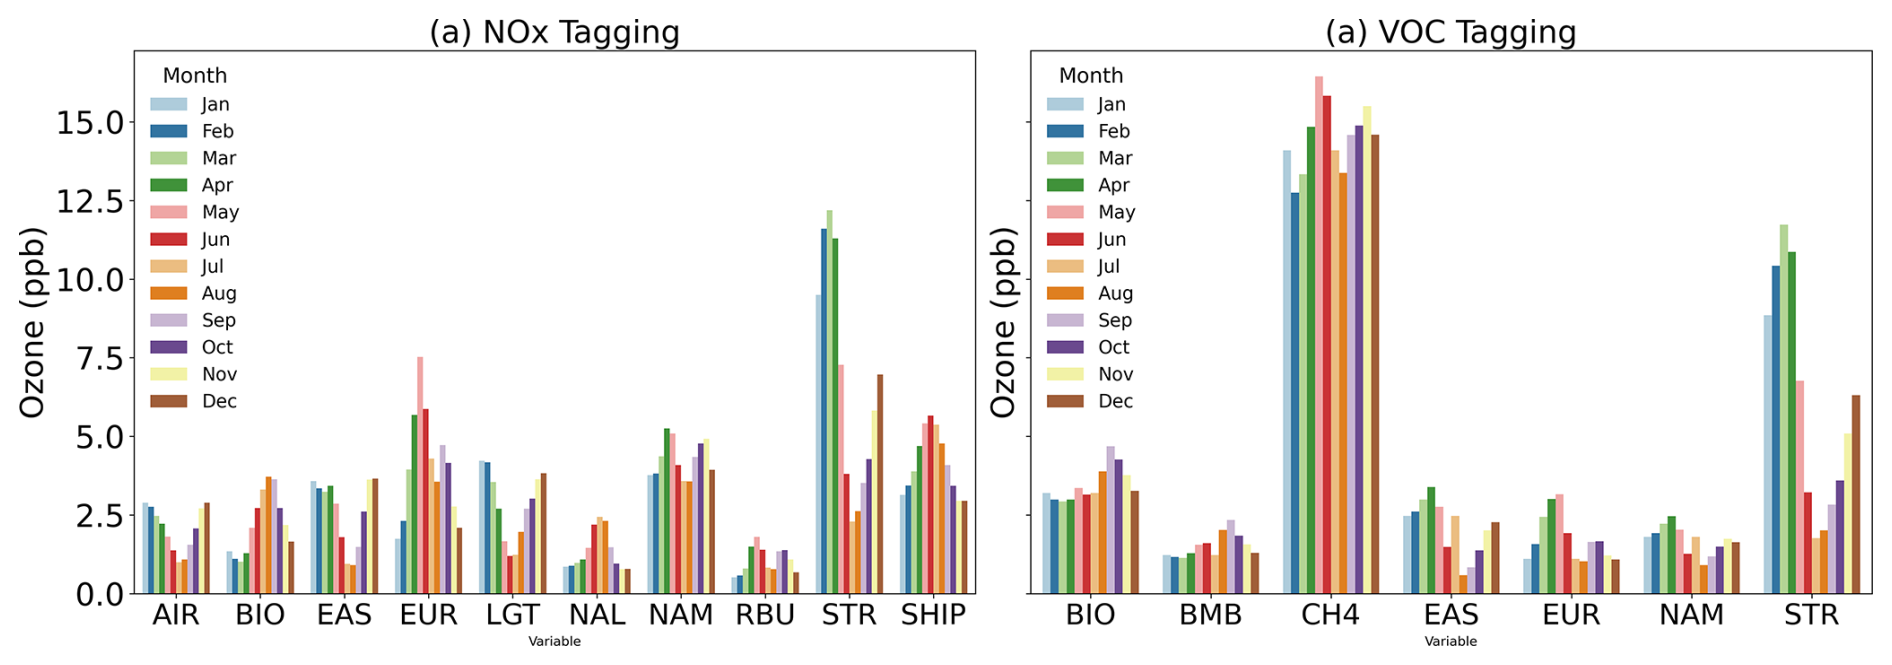
Figure 8Absolute contribution of major NOx sources (a) (NOx Tagging) and VOC source (b) (NOx Tagging) to the CAM4-Chem simulated surface O3 for the Mace Head grid cell between 2000–2018.
The monthly tagged major precursor contributions to surface O3 at Mace Head, averaged over the 2000–2018 simulation period, are shown in Fig. 8. The stratospheric source of O3 dominates in Winter-Spring, contributing to the spring-time maxima due to vigorous stratospheric transport. European NOx emissions contribution peaks in May, while lightning NOx has the greatest impact in winter. North American (NAM) NOx emissions contribute 3.5 to 5.25 ppb, comparable to European NOx, but with an earlier peak in April. Aviation emissions contribute 1 to 3 ppb, with the highest contributions in winter and spring. Biogenic NOx, significant between June and October, contributes an average of 3.6 ppb, with higher contributions during August and September. O3 derived from biogenic VOC sources average over 4 ppb during late autumn, maintaining a more sustained contribution throughout the year. East Asian NOx emissions, contribute up to 3.6 ppb, with a minimum contribution in July and August. North Atlantic shipping NOx (NAL) accounts for up to 2.4 ppb of O3 during July. The total shipping NOx (SHIP) also contributes significantly It is the addition of all oceanic emissions and shows the highest contribution in June.
Methane (CH4) is the dominant reactive carbon molecule contributing to O3 formation. VOC emissions from biomass burning also play a measurable role, contributing 1 to 2 ppb, with their largest contributions in August and September. Finally, European VOC emissions contribute 1 to 3 ppb, with the largest impact from March to May, coinciding with the spring-time peak in surface O3.
These findings allow quantification of specific sources amidst the complex interplay of regional and global sources in driving seasonal variations in surface O3 levels over the Irish domain, highlighting the roles of stratospheric processes, anthropogenic emissions, biogenic sources, and lower-latitude contributions in shaping the observed patterns at background monitoring sites such as Mace Head.
Figure 9 shows the monthly changes in contributions to surface O3 at Mace Head over the simulation period (2000–2018). A negative (blue) trend indicates that the contribution of the source to simulated surface O3 in this grid cell has declined over the simulation period, whereas a positive trend (red) indicates the contribution to surface O3 has risen. Figure 9a shows that simulated O3 at Mace Head originating from European or North American NOx decreases over the simulation period, consistent with EU & North American emission reductions (Guerreiro et al., 2014). More significant reduction occurs in late Spring through late summer, when EU NOx contributions are most significant to Mace Head O3 concentrations (as seen in Fig. 8).
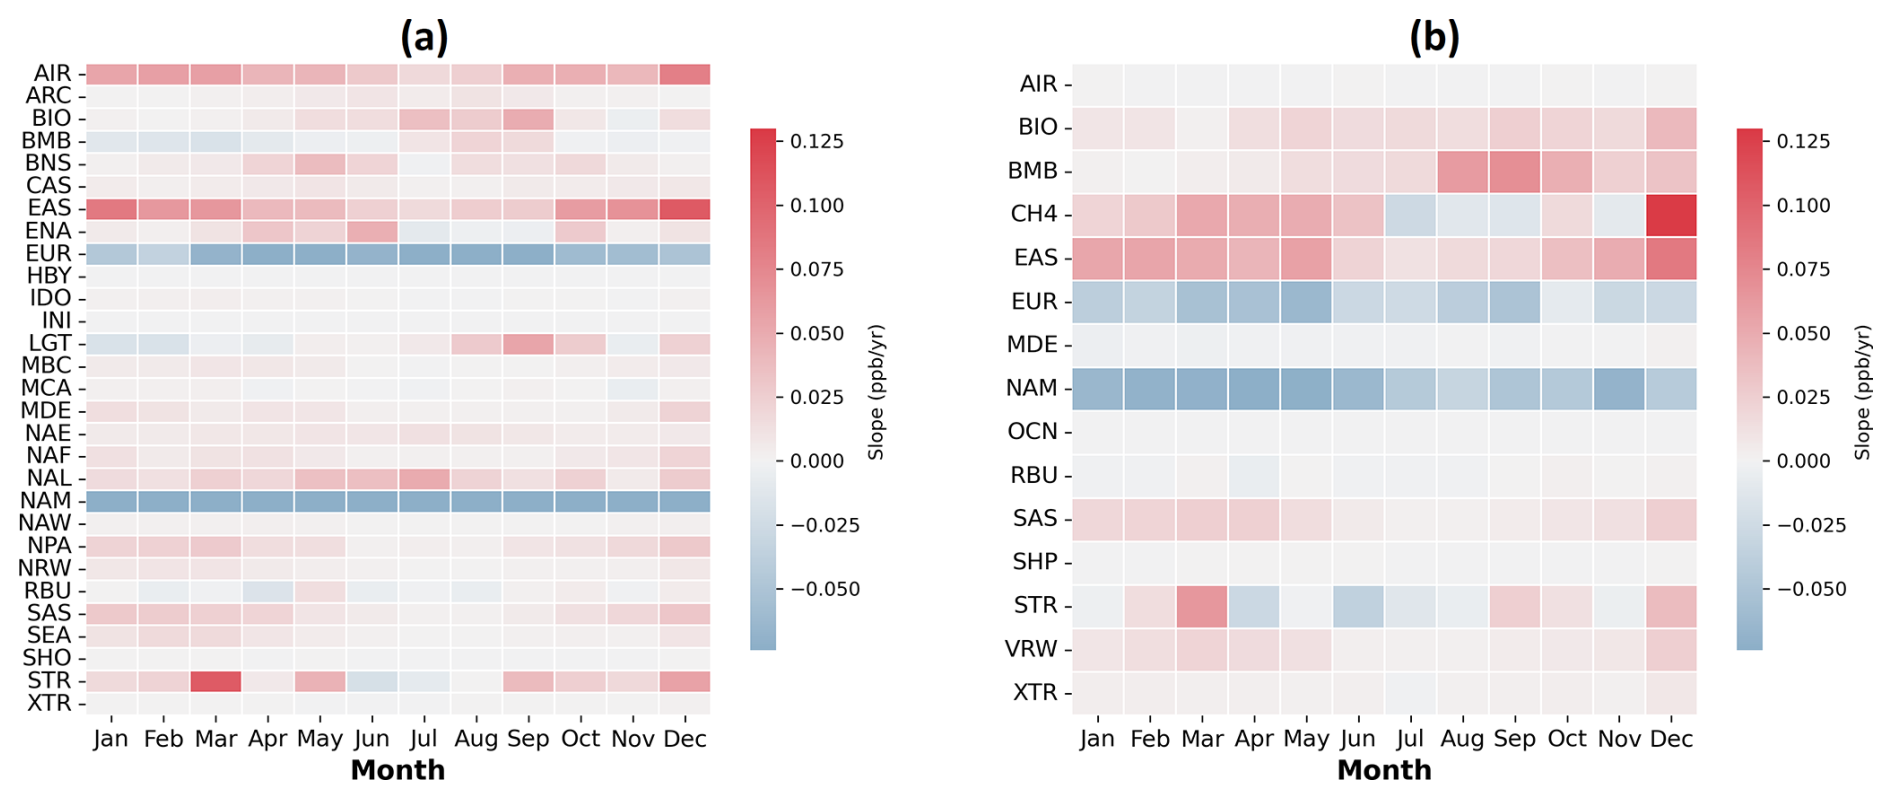
Figure 9Trends in contributions to monthly average modelled Mace Head grid cell surface O3 for the 2000–2018 period derived from (a) NOx tagging and (b) VOC tagging.
There is a rising trend in simulated surface O3 originating from NOx emissions from global aviation, from East Asia, and to a lesser extent from South Asia, which is more pronounced in the wintertime. Wintertime temperatures in South Asia are still high enough to sufficiently produce local ozone, especially when NOx emissions are rising (Crippa et al., 2023). The relatively longer, atmospheric lifetime of O3 in the free troposphere during winter enables longer-range intercontinental transport (Huang et al., 2017; Yu et al., 2013). This seasonality in source contributions explains the observed reduction in spring-time maxima and increase in winter-time levels from the measurement record. EastAsian and South-Asian VOCs also contribute to a rising trend in simulated O3, with a more pronounced increase in winter and spring. This highlights a different pattern in hemispheric O3 contributions, where EU and NAM emission reductions coincide with increased contribution from lower latitudes which could potentially become a more significant source of background O3 in the Northern Hemisphere in the future. The contribution of CH4 also has a positive trend over the simulation period, but the CH4 trend has a reliable correlation only in December and spring periods, with very low certainty in CH4 contribution trends for summer months (correlation coefficient, p>0.33). Contribution to simulated O3 at Mace Head from EU and NAM anthropogenic VOC show a negative trend for all months, consistent with trends from EU and NAM anthropogenic NOx.
Table 4 shows the overall trend in the main contributors to NOx and VOC tagging. It is observed that there is an increase in simulated surface O3 originating from NOx contributions from aviation and East Asia, while there is a decrease in European (EUR) and North American (NAM) NOx contributions. In VOC tagging, Methane (CH4) and East Asian anthropogenic VOC (EAS) contribute to a rising trend over the (EUR) and North America (NAM) show a negative trend.
Table 4Overall Trend in contributions to Mace Head grid cell O3 simulated by CAM4-Chem for NOx tagging and VOC tagging over the simulation period in units of ppb per year. reliability scale defined for TOAR-II studies (Chang et al., 2023), Statistical significance of trend is indicated using star notation: denotes p≤0.01 (very high certainty), denotes (high certainty), denotes (medium certainty), * denotes 0.33 (low certainty), and no star denotes p>0.33 (very low certainty).
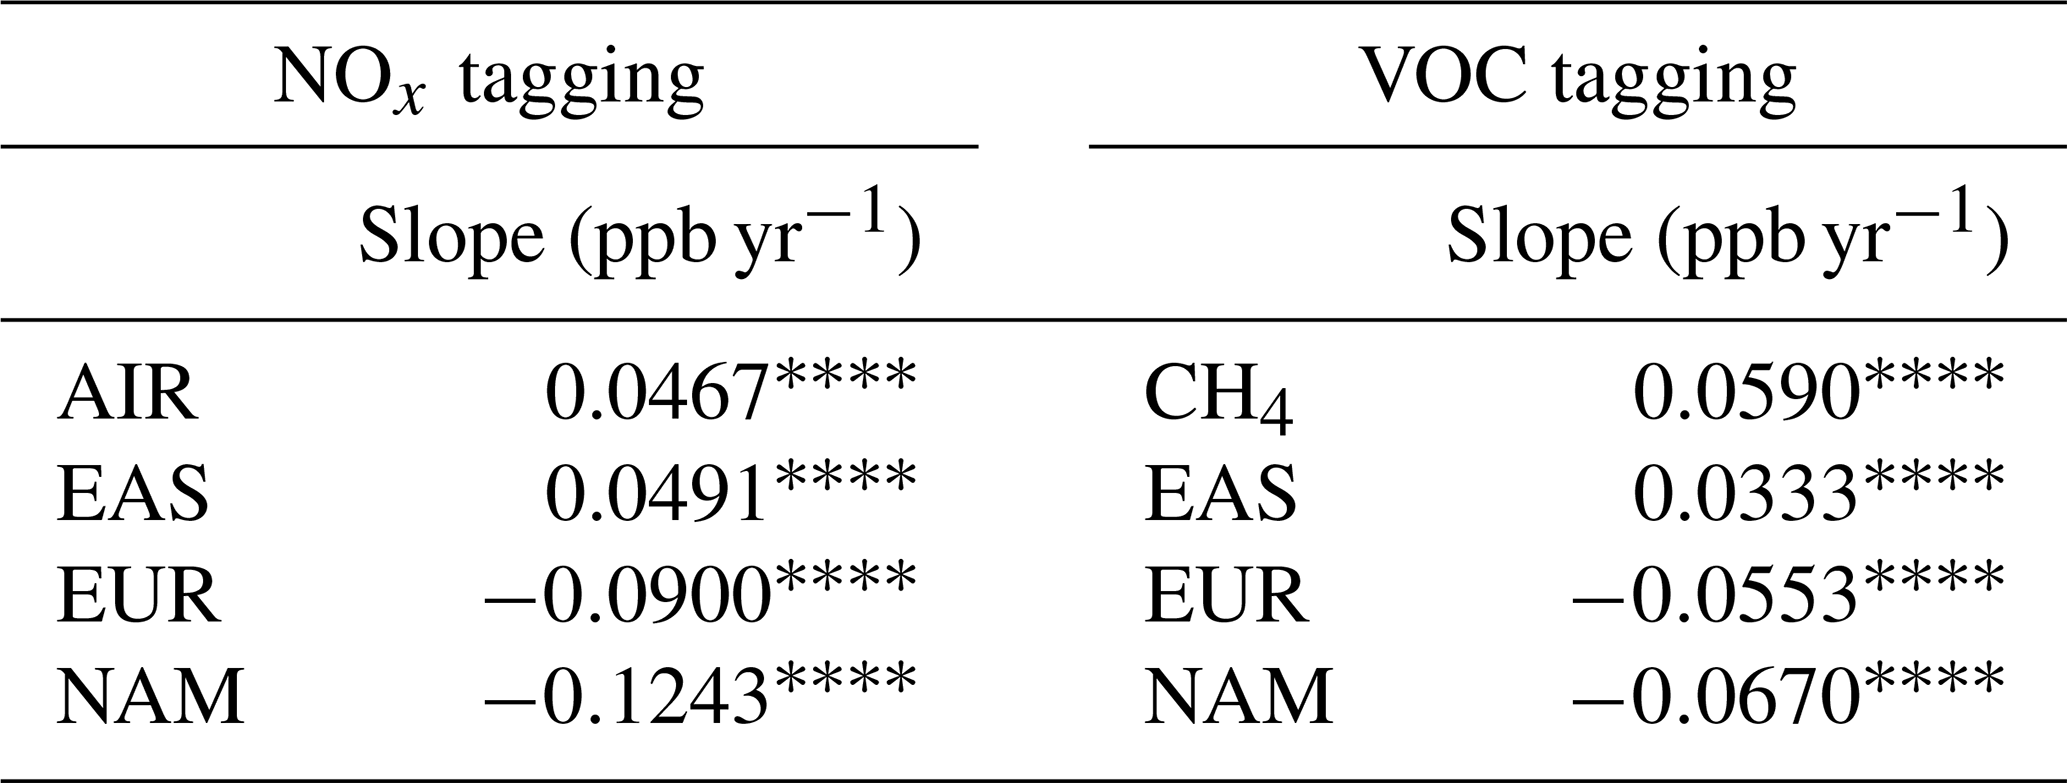
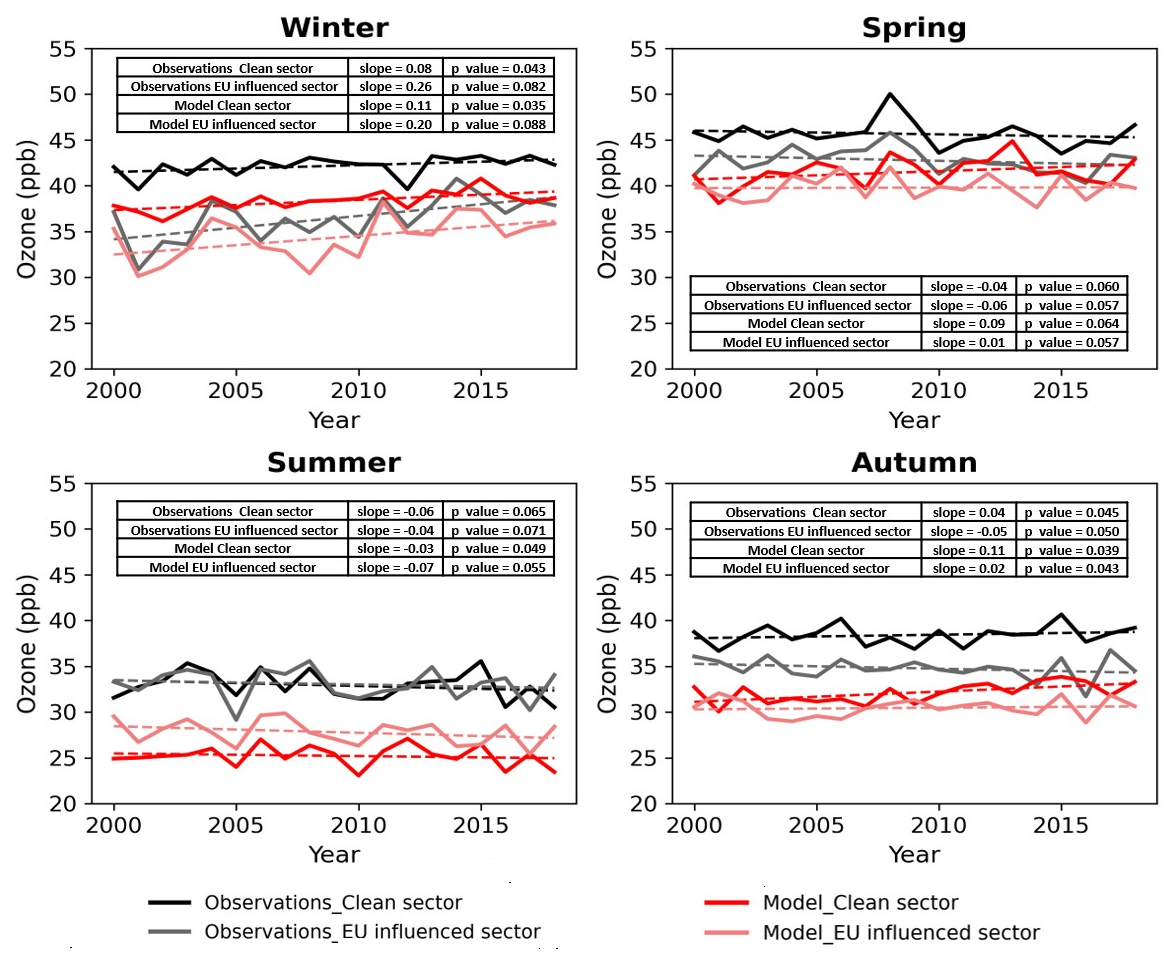
Figure 10Trend in seasonal Average of observed O3 (black) and Model O3 (red) at Mace head, separated into clean sector and EU-influenced sector.
3.5 O3 trends in background and EU influenced sector air masses at Mace Head
Although Mace Head is classified as a global background site, quantification of the baseline pollution levels requires trajectory analysis, whereby both measured and modelled data is filtered to limit the data to that arriving from the clean sector, unaffected by land-based emission sources, as discussed in Sect. 2.2. Figure 10 displays trends in observed and simulated O3 at Mace Head, separated into seasons and clean/EU influenced sectors according to the trajectory analysis. The figure shows that the clean sector has consistently higher O3 concentrations than the EU influenced sector for Winter, Spring and Autumn, with the most significant disparity between clean and EU sectors in winter/spring when stratospheric intrusion and lightning NOx contribute most significantly to O3, as discussed in Sect. 3.4.2. O3 originating from EU airmasses is susceptible to higher rates of dry deposition and removal via local pollution while traversing the land-mass westwards towards Mace Head, leading to higher O3 in clean-sector air masses consistent with previous studies (Coleman et al., 2013). A decreasing trend in mean spring-time levels is observed for both clean and EU influenced sectors, consistent with the sustained decrease in precursor emissions in Europe and North America as displayed in Fig. 9. An increasing trend (0.26 ppb yr−1) is observed in the winter-time EU influenced sector, with a trend of smaller magnitude (0.08 ppb yr−1) observed in the clean sector, indicating a decrease in winter-time O3 depletion events due to decreasing European emissions (from the EU nfluenced sector), consistent with the conclusions from previous studies of Mace Head surface O3 (Derwent et al., 2024). Summer-time values do not exhibit a notable trend or a discrepancy between the clean and EU influenced sector measurements, indicating that there is little O3 advected into Europe from the west in the summer months. It is noted that the seasonal trends exhibit slopes with p-values ranging between , which denote trends of medium to high certainty, as defined by TOAR assessment criteria of Chang et al. (2023).
Although the model results display a negative bias for reasons outlined in Sect. 3.4.1, the clean sector consistently exhibits higher simulated O3 concentrations than the EU-influenced sector, except during the summer season. In the winter season, a significant increasing trend is observed for simulated O3 from both sectors, aligning with observations. A decreasing trend is observed during the summer season, again consistent with the observations for both sectors. In spring and autumn, modelled O3 exhibits a positive trend over the simulation period.
Trends in contributors of model O3 during the different seasons for the clean and EU-influenced sector are shown in Tables S3 to S4 in Sect. S6. Aviation and East Asian NOx show consistently positive and significant trends in both sectors, while North America NOx shows strong negative trends throughout the year in the clean sector. For the EU-influenced sector in NOx tagged (Table S2), similar positive trends observed for aviation and East Asian, with North America NOx remaining negative and European NOx showing more significant declines in spring and winter. In case of VOC tagged O3, the East Asian VOCs shows an increasing trend and North America VOCs show a negative across all seasons in both sectors (Table S3 and S4). European VOCs also show a consistent negative trend, particularly strong in the EU-influenced sector. Methane trends are seasonally positive, especially in spring and winter.
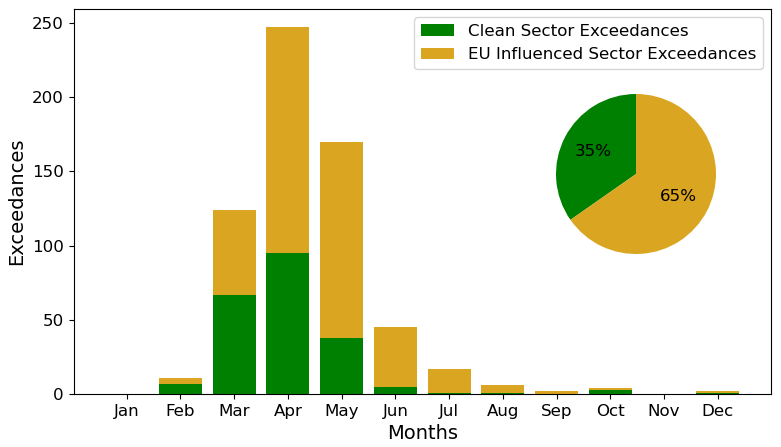
Figure 11Exceedances measured at Mace Head per month from 2000 until 2022, during the clean air sector(green) and EU influenced sector (yellow). The percentage of both to total exceedances is shown in the inlay.
It is observed that the model consistently simulates O3 at lower concentrations than that observed at Mace Head. This is not surprising, considering the coarse resolution of the model, which limits its ability to represent fine-scale processes and dry deposition accurately. Dry deposition is typically higher over land, and the grid cell covering Mace Head includes land area, as shown in Sect. S4 (Fig. S5). Further, as explained by Fiore et al. (2009), models average the landscape characteristics within a grid cell, which can enhance O3 deposition and result in lower simulated O3 concentrations; hence, the discrepancy is more pronounced in the clean sector data.
3.6 Exceedances from the clean and EU-influenced sector at Mace Head
Exceedances observed at Mace Head between 2000 and 2022 are separated into clean and EU-influenced sectors based on trajectory air masses and shown in Fig. 11. 35 % of all exceedances for this period occurred in clean air masses, the remainder occurring when air masses include EU outflow and contribution from local sources to enhance surface O3 at Mace Head, which is already elevated compared to inland and urban sites. It is notable that there is a higher proportion of exceedances that occur from EU-influenced sector, despite higher mean observations from the clean sector for all seasons. The EU influence on exceedance becomes more proportionally prominent in late spring and summer, with more frequent easterly airflow when there is a higher occurrence of stagnation events.
Figure 12 shows the trend in spring-time exceedances and the 95th percentile Springtime O3 measured at Mace Head between 2000 and 2022. A decreasing trend in exceedances is observed, with a greater decreasing trend from the EU and the locally influenced sector. This indicates that the changes that are driving the reduction in the exceedances in Europe are coming into effect at a quicker rate than the changes that are driving the O3 event reduction over the North Atlantic. The trends in the exceedance counts are not significant, according to the criteria in Chang et al. (2023), but there is a statistically significant decreasing trend in the 95th percentile springtime surface O3 over the measurement record. Figure 12b shows the trend in spring-time surface O3 measured at Mace Head segregated into the Clean and EU-influenced sector. The trend is more significant both in magnitude and statistical certainty for the EU-influenced sector, indicating that European emission changes have a more pronounced effect on springtime O3 measured at Mace Head O3 as compared to changes affecting O3 transported or formed over the North Atlantic.
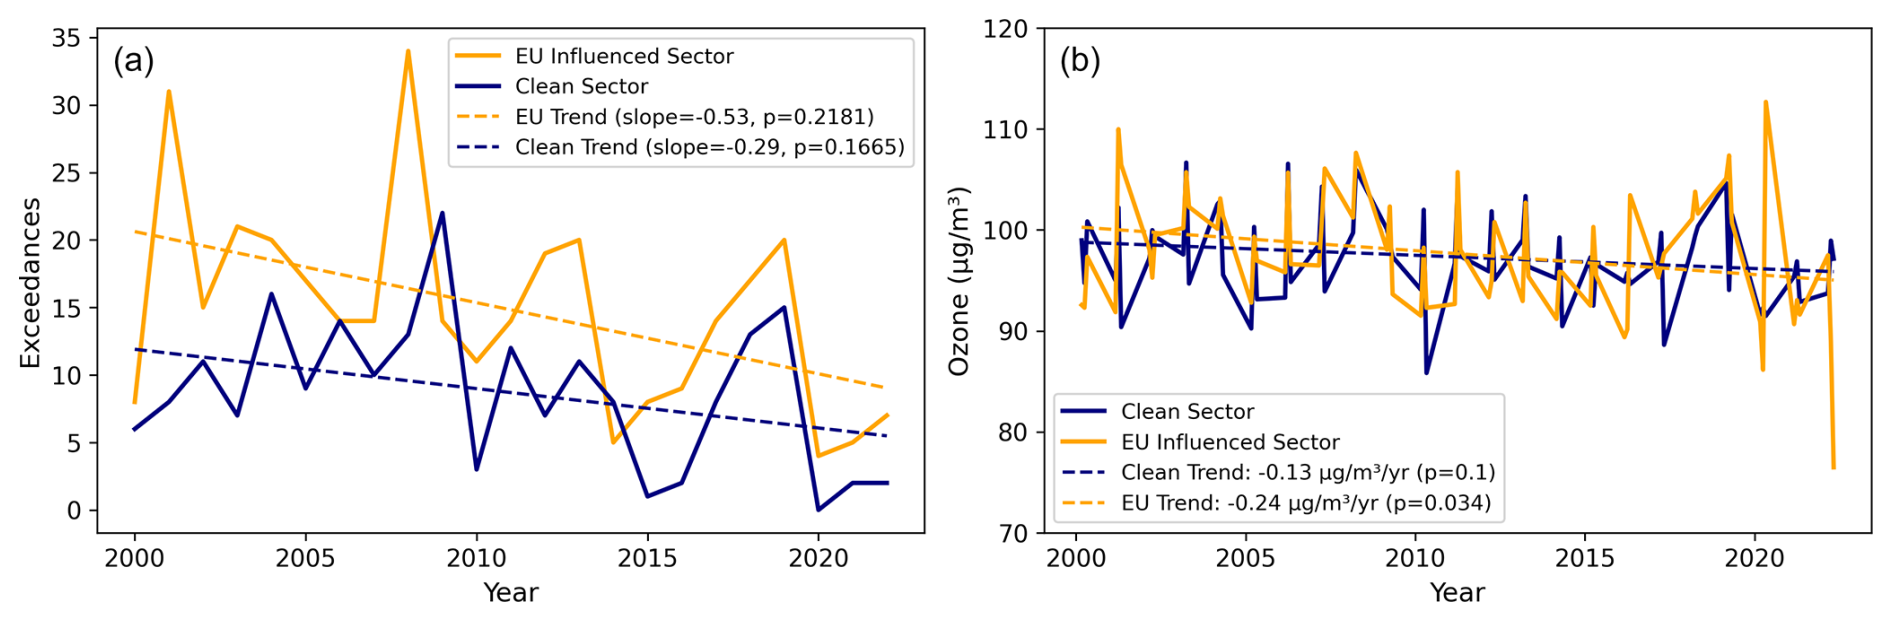
Figure 12(a) The trend in Spring-time exceedances measured at Mace Head between 2000 and 2022 (blue) with the clean-air exceedances (gold), and (b) the trend in the 95th percentile of spring (March–May) O3 measured in µg m−3 for the clean sector (blue) and the EU-influenced sector (gold).
Figure 13 shows monthly cumulative contributions to simulated O3 concentrations within the Mace Head grid cell for NOx and VOC tagging during O3 exceedance. First, the exceedances were identified from O3 observations as discussed in Sect. 3.3 and then these exceedances were divided into two sectors the EU-influenced sector and the clean sector. In Fig. 13, the hourly O3 exceedance cumulative concentrations in ppb, along with the contributions from different parameters, are shown. It indicates which parameters contribute more to the exceedances, in both the EU-influenced sector or the clean sector. In this, the µg m−3-to-ppb conversion is applied to the exceedances.
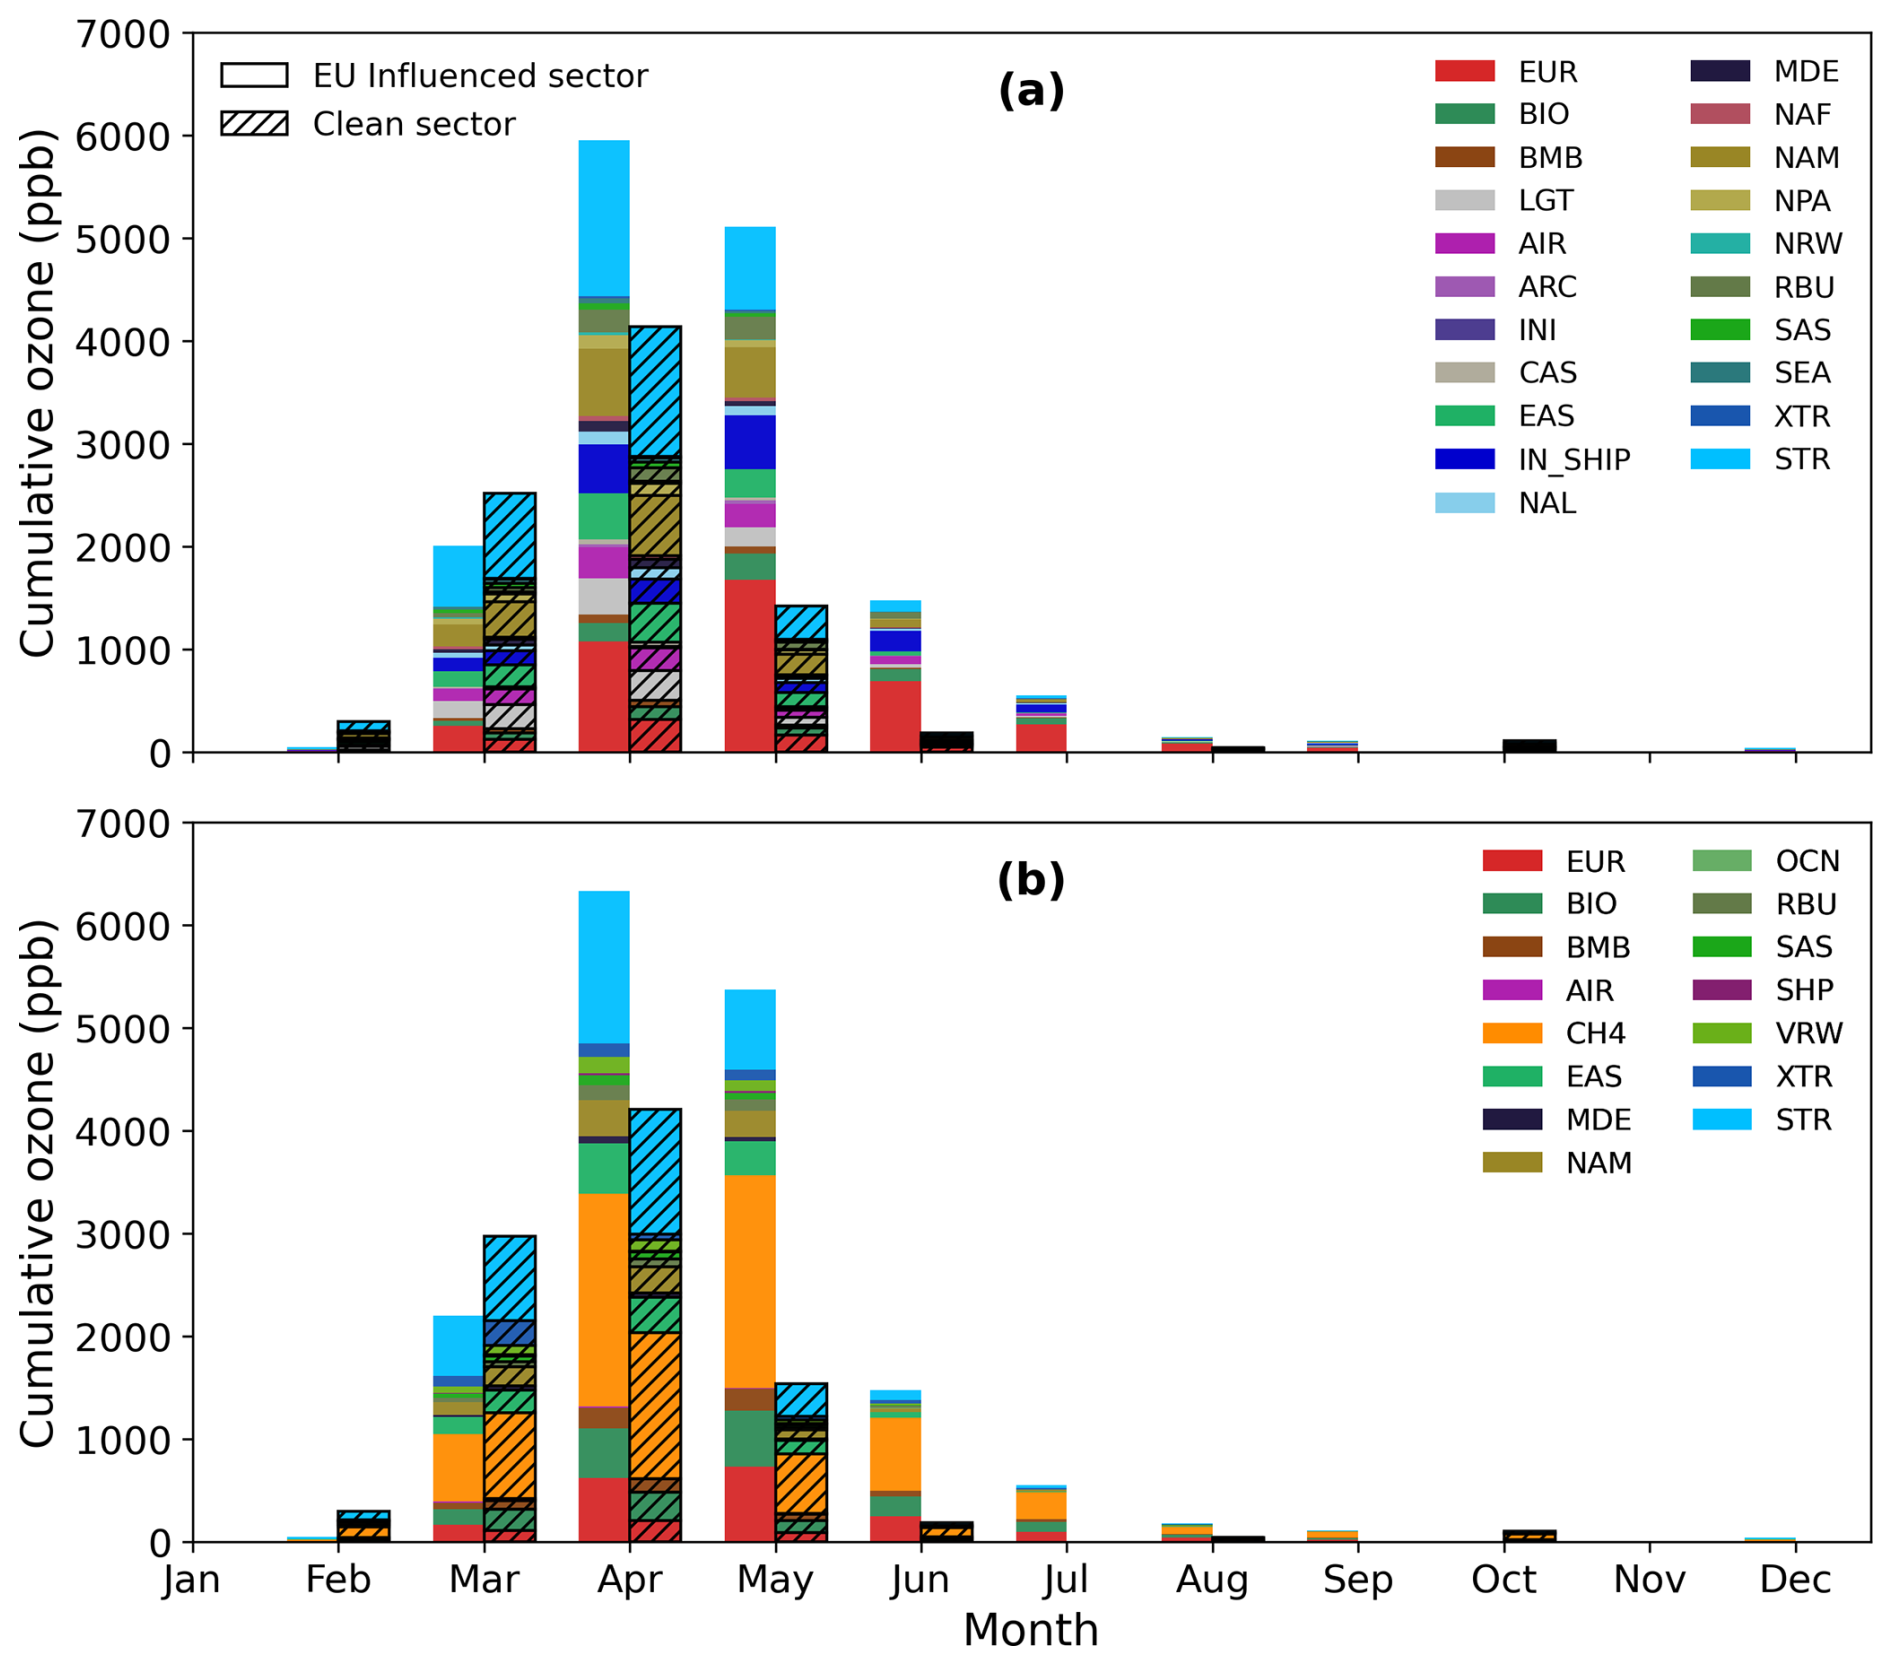
Figure 13Monthly cumulative Mace Head grid cell O3 contributions to EU influenced sector and clean sector exceedances (a) NOx tagging and (b) VOC tagging Mace Head grid cell.
These exceedances are categorised into clean and EU-influenced sectors. The maximum exceedances are observed in March to May. From Fig. 13a, it is clear that stratospheric intrusion, North American NOx, European NOx, and East Asian NOx are the major contributors driving exceedances at Mace Head during the spring months (March to May).
European emissions dominate the supply of NOx precursors in April, reaching their peak in May. Figure 13b shows that CH4 is the most dominant VOC source, followed by stratospheric intrusion and Biomass burning. North American and European VOC emissions also contribute significantly to O3 formation during this period. Collectively, these findings highlight the complex interplay of regional and global sources in driving surface O3 exceedances over the Irish domain.
North American NOx also contributes significantly to exceedance in both clean and EU-influenced sectors at Mace Head during March to May month, likely due to long-range transport and mixing, regional stagnation or synoptic-scale recirculation. In the case of VOC tagging, stratospheric intrusion, and CH4 show notable contributions. Biomass burning, East Asian emissions and North American VOC emissions also play a role in O3 exceedances. The IN_SHIP indicates the total contribution of all international shipping emissions (ENA, NAE, NAW, NPA, BNS, HBY, IDO, MBC, SHO) which is significant in April and May.
This study highlights the complexities of O3 pollution in Ireland, revealing that coastal areas experience higher O3 concentrations than rural and urban environments, attributed to the effect of transboundary pollution and stratospheric intrusion. Over the last two decades, urban sites have shown a significant increasing trend in O3 levels, particularly in winter, influenced by decreasing anthropogenic pollution in Europe, the UK, North America and local to the observation sites, representing a decline in chemical removal mechanism (Derwent et al., 2024; Simmonds and Derwent, 1991). The analysis also points out that the majority of exceedances at coastal monitoring sites coincide with the annual spring maxima. Using the advanced capabilities of the CAM4-Chem model with dual NOx and VOC tagging, we identified key factors affecting seasonal O3 variations, such as the spring-time peak and summer dip, driven by a mix of stratospheric intrusion, NOx emissions from lightning, long range and hemispheric transport, regional emissions and aviation related emissions. Trend analysis from simulation results identified East Asian and aviation emissions as significant contributors to the rising winter trends in O3, while reductions in North American and European emissions accounted for the decrease in spring peaks. This study provides a comprehensive understanding of the various factors affecting O3 levels in Ireland, offering important insights for the development of O3 pollution control policies.
All data are available upon request.
The supplement related to this article is available online at https://doi.org/10.5194/acp-26-6557-2026-supplement.
LC designed the study. NK analyzed the data and wrote the manuscript. TA and TB provided CAM-Chem model results and reviewed the manuscript. EC contributed to the air mass trajectories analysis. JO, CD and DM reviewed the manuscript and edited it. LC edited it with contributions from all co-authors.
At least one of the (co-)authors is a member of the editorial board of Atmospheric Chemistry and Physics. The peer-review process was guided by an independent editor, and the authors also have no other competing interests to declare.
Publisher's note: Copernicus Publications remains neutral with regard to jurisdictional claims made in the text, published maps, institutional affiliations, or any other geographical representation in this paper. The authors bear the ultimate responsibility for providing appropriate place names. Views expressed in the text are those of the authors and do not necessarily reflect the views of the publisher.
The authors acknowledge the Environmental Protection Agency (EPA) of Ireland for their financial support of the Ozone project under the EPA Research Programme 2021–2030 (project number 2022-CE-1133), and the European Union's Horizon Europe Research and Innovation programme under HORIZON-CL5-2022-D1-02 (grant no. 101081430-PARIS).
This research has been supported by the Environmental Protection Agency (grant no. 2022-CE-1133) and the HORIZON EUROPE Climate, Energy and Mobility (grant nos. 101081430-PARIS and HORIZON-CL5-2022-D1-02).
This paper was edited by Jayanarayanan Kuttippurath and reviewed by William Collins and Rama Krishna Karumuri.
Aghedo, A. M., Bowman, K. W., Worden, H. M., Kulawik, S. S., Shindell, D. T., Lamarque, J. F., Faluvegi, G., Parrington, M., Jones, D. B. A., and Rast, S.: The vertical distribution of ozone instantaneous radiative forcing from satellite and chemistry climate models, J. Geophys. Res.-Atmos., 116, https://doi.org/10.1029/2010JD014243, 2011.
Anenberg, S. C., West, J. J., Fiore, A. M., Jaffe, D. A., Prather, M. J., Bergmann, D., Cuvelier, K., Dentener, F. J., Duncan, B. N., Gauss, M., Hess, P., Jonson, J. E., Lupu, A., Mackenzie, I. A., Marmer, E., Park, R. J., Sanderson, M. G., Schultz, M., Shindell, D. T., Szopa, S., Vivanco, M. G., Wild, O., and Zeng, G.: Intercontinental impacts of ozone pollution on human mortality, Environ. Sci. Technol., 43, 6482–6487, https://doi.org/10.1021/es900518z, 2009.
Ansari, T., Nalam, A., Lupaşcu, A., Hinz, C., Grasse, S., and Butler, T.: Explaining trends and changing seasonal cycles of surface ozone in North America and Europe over the 2000–2018 period: a global modelling study with NOx and VOC tagging, Atmos. Chem. Phys., 25, 16833–16876, https://doi.org/10.5194/acp-25-16833-2025, 2025.
Archibald, A. T., Neu, J. L., Elshorbany, Y. F., Cooper, O. R., Young, P. J., Frost, G. J., Galbally, I. E., Gerosa, G., Granier, C., and Griffiths, P. T.: Tropospheric Ozone Assessment Report: A critical review of changes in the tropospheric ozone burden and budget from 1850 to 2100, Elementa, 8, 34, https://doi.org/10.1525/elementa.2020.034, 2020.
Ashmore, M. R.: Assessing the future global impacts of ozone on vegetation, Plant Cell Environ., 28, 949–964, https://doi.org/10.1111/j.1365-3040.2005.01341.x, 2005.
Atkinson-Palombo, C. M., Miller, J. A., and Balling, R. C.: Quantifying the ozone “weekend effect” at various locations in Phoenix, Arizona, Atmos. Environ., 40, 7644–7658, https://doi.org/10.1016/j.atmosenv.2006.05.023, 2006.
Auvray, M. and Bey, I.: Long-range transport to Europe: Seasonal variations and implications for the European ozone budget, J. Geophys. Res.-Atmos., 110, https://doi.org/10.1029/2004JD005503, 2005.
Bessagnet, B., Pirovano, G., Mircea, M., Cuvelier, C., Aulinger, A., Calori, G., Ciarelli, G., Manders, A., Stern, R., Tsyro, S., Garciá Vivanco, M., Thunis, P., Pay, M. T., Colette, A., Couvidat, F., Meleux, F., Rouïl, L., Ung, A., Aksoyoglu, S., Baldasano, J. M., Bieser, J., Briganti, G., Cappelletti, A., D'Isidoro, M., Finardi, S., Kranenburg, R., Silibello, C., Carnevale, C., Aas, W., Dupont, J. C., Fagerli, H., Gonzalez, L., Menut, L., Prévôt, A. S. H., Roberts, P., and White, L.: Presentation of the EURODELTA III intercomparison exerciseevaluation of the chemistry transport models' performance on criteria pollutants and joint analysis with meteorology, Atmos. Chem. Phys., 16, 12667–12701, https://doi.org/10.5194/acp-16-12667-2016, 2016.
Bonaccorso, B., Peres, D. J., Cancelliere, A., and Di Mauro, G.: Probabilistic forecasting of drought class transitions in Sicily (Italy) using Standardized Precipitation Index and North Atlantic Oscillation Index, J. Hydrol., 526, 136–150, https://doi.org/10.1016/j.jhydrol.2015.01.070, 2015.
Boylan, P., Helmig, D., and Oltmans, S.: Ozone in the Atlantic Ocean marine boundary layer, Elementa, 1–13, https://doi.org/10.12952/journal.elementa.000045, 2014.
Butchart, N., Charlton-Perez, A. J., Cionni, I., Hardiman, S. C., Haynes, P. H., Krüger, K., Kushner, P. J., Newman, P. A., Osprey, S. M., Perlwitz, J., Sigmond, M., Wang, L., Akiyoshi, H., Austin, J., Bekki, S., Baumgaertner, A., Braesicke, P., Brhl, C., Chipperfield, M., Dameris, M., Dhomse, S., Eyring, V., Garcia, R., Garny, H., Jöckel, P., Lamarque, J. F., Marchand, M., Michou, M., Morgenstern, O., Nakamura, T., Pawson, S., Plummer, D., Pyle, J., Rozanov, E., Scinocca, J., Shepherd, T. G., Shibata, K., Smale, D., Teyssèdre, H., Tian, W., Waugh, D., and Yamashita, Y.: Multimodel climate and variability of the stratosphere, J. Geophys. Res.-Atmos., 116, https://doi.org/10.1029/2010JD014995, 2011.
Butler, T., Lupascu, A., Coates, J., and Zhu, S.: TOAST 1.0: Tropospheric ozone attribution of sources with tagging for CESM 1.2.2, Geosci. Model Dev., 11, 2825–2840, https://doi.org/10.5194/gmd-11-2825-2018, 2018.
Butler, T., Lupascu, A., and Nalam, A.: Attribution of ground-level ozone to anthropogenic and natural sources of nitrogen oxides and reactive carbon in a global chemical transport model, Atmos. Chem. Phys., 20, 10707–10731, https://doi.org/10.5194/acp-20-10707-2020, 2020.
Carslaw, D. C.: On the changing seasonal cycles and trends of ozone at Mace Head, Ireland, Atmos. Chem. Phys., 5, 3441–3450, https://doi.org/10.5194/acp-5-3441-2005, 2005.
Chang, K.-L., Schultz, M. G., Koren, G., and Selke, N.: Guidance note on best statistical 1108 practices for TOAR analyses, arXiv [preprint], arXiv:2304.14236, https://doi.org/10.48550/arXiv.2304.14236, 2023.
Coates, J., Mar, K. A., Ojha, N., and Butler, T. M.: The influence of temperature on ozone production under varying NOx conditions – a modelling study, Atmos. Chem. Phys., 16, 11601–11615, https://doi.org/10.5194/acp-16-11601-2016, 2016.
Coleman, L., McVeigh, P., Berresheim, H., Martino, M., and O'Dowd, C. D.: Photochemical impact on ozone fluxes in coastal waters, Adv. Meteorol., 2012, https://doi.org/10.1155/2012/943785, 2012.
Coleman, L., Martin, D., Varghese, S., Jennings, S. G., and O'Dowd, C. D.: Assessment of changing meteorology and emissions on air quality using a regional climate model: Impact on ozone, Atmos. Environ., 69, 198–210, https://doi.org/10.1016/j.atmosenv.2012.11.048, 2013.
Creilson, J. K., Fishman, J., and Wozniak, A. E.: Intercontinental transport of tropospheric ozone: A study of its seasonal variability across the North Atlantic utilizing tropospheric ozone residuals and its relationship to the North Atlantic Oscillation, Atmos. Chem. Phys., 3, 2053–2066, https://doi.org/10.5194/acp-3-2053-2003, 2003.
Crippa, M., Guizzardi, D., Butler, T., Keating, T., Wu, R., Kaminski, J., Kuenen, J., Kurokawa, J., Chatani, S., Morikawa, T., Pouliot, G., Racine, J., Moran, M. D., Klimont, Z., Manseau, P. M., Mashayekhi, R., Henderson, B. H., Smith, S. J., Suchyta, H., Muntean, M., Solazzo, E., Banja, M., Schaaf, E., Pagani, F., Woo, J.-H., Kim, J., Monforti-Ferrario, F., Pisoni, E., Zhang, J., Niemi, D., Sassi, M., Ansari, T., and Foley, K.: The HTAP_v3 emission mosaic: merging regional and global monthly emissions (2000–2018) to support air quality modelling and policies, Earth Syst. Sci. Data, 15, 2667–2694, https://doi.org/10.5194/essd-15-2667-2023, 2023.
Crippa, M., Guizzardi, D., Pagani, F., Schiavina, M., Melchiorri, M., Pisoni, E., Graziosi, F., Muntean, M., Maes, J., Dijkstra, L., Van Damme, M., Clarisse, L., and Coheur, P.: Insights into the spatial distribution of global, national, and subnational greenhouse gas emissions in the Emissions Database for Global Atmospheric Research (EDGAR v8.0), Earth Syst. Sci. Data, 16, 2811–2830, https://doi.org/10.5194/essd-16-2811-2024, 2024.
Derwent, R. G.: Observation and interpretation of the seasonal cycles in the surface concentrations of ozone and carbon monoxide at Mace Head, Ireland from 1990 to 1994, Atmos. Environ., 32, 2310, https://doi.org/10.1016/S1352-2310(97)00338-5, 1998.
Derwent, R. G., Simmonds, P. G., and Collins, W. J.: Ozone and carbon monoxide measurements at a remote maritime location, mace head, Ireland, from 1990 to 1992, Atmos. Environ., 28, 2623–2637, https://doi.org/10.1016/1352-2310(94)90436-7, 1994.
Derwent, R. G., Collins, W. J., Johnson, C. E., and Stevenson, D. S.: Transient behaviour of tropospheric ozone precursors in a global 3-D CTM and their indirect greenhouse effects, Climatic Change, 49, 463–487, https://doi.org/10.1023/A:1010648913655, 2001.
Derwent, R. G., Stevenson, D. S., Collins, W. J., and Johnson, C. E.: Intercontinental transport and the origins of the ozone observed at surface sites in Europe, Atmos. Environ., 38, 1891–1901, https://doi.org/10.1016/j.atmosenv.2004.01.008, 2004.
Derwent, R. G., Stevenson, D. S., Doherty, R. M., Collins, W. J., and Sanderson, M. G.: How is surface ozone in Europe linked to Asian and North American NOx emissions?, Atmos. Environ., 42, 7412–7422, https://doi.org/10.1016/j.atmosenv.2008.06.037, 2008.
Derwent, R. G., Manning, A. J., Simmonds, P. G., Spain, T. G., and O'Doherty, S.: Analysis and interpretation of 25 years of ozone observations at the Mace Head Atmospheric Research Station on the Atlantic Ocean coast of Ireland from 1987 to 2012, Atmos. Environ., 80, 361–368, https://doi.org/10.1016/j.atmosenv.2013.08.003, 2013.
Derwent, R. G., Manning, A. J., Simmonds, P. G., and Doherty, S. O.: Long-term trends in ozone in baseline and European regionally-polluted air at Mace Head, Ireland over a 30-year period, Atmos. Environ., 179, 279–287, https://doi.org/10.1016/j.atmosenv.2018.02.024, 2018.
Derwent, R. G., Parrish, D. D., Manning, A. J., Spain, T. G., Simmonds, P. G., and O'Doherty, S.: Ozone at Mace Head, Ireland from 1987 to 2021: Declining baselines, phase-out of European regional pollution, COVID-19 impacts, Atmos. Environ., 320, https://doi.org/10.1016/j.atmosenv.2023.120322, 2024.
Ding, J., Dai, Q., Fan, W., Lu, M., Zhang, Y., Han, S., and Feng, Y.: Impacts of meteorology and precursor emission change on O3 variation in Tianjin, China from 2015 to 2021, J. Environ. Sci., 126, 506–516, https://doi.org/10.1016/j.jes.2022.03.010, 2023.
Donlon, B., Cahalane, A., and Fanning, A.: Ireland's State of the Environment Report 2024 Editors, Environmental Protection Agency, https://epawebapp.epa.ie/ebooks/soe2024/3/ (last access: 6 December 2024), 2024.
Draxler, R. R.: Evaluation of an Ensemble Dispersion Calculation, http://wesley.wwb.noaa.gov/reanalysis.html (last access: 6 October 2024), 2003.
EEA: Exceedance of air quality standards in Europe (Indicator AIR003, Issue.1109), https://www.eea.europa.eu/en/analysis/indicators/exceedance-of-air-quality-standards (last access: 21 May 2025), 2024.
Emmons, L. K., Hess, P. G., Lamarque, J.-F., and Pfister, G. G.: Tagged ozone mechanism for MOZART-4, CAM-chem and other chemical transport models, Atmos. Chem. Phys., 12, 4607–4622, https://doi.org/10.5194/acp-12-4607-2012, 2012.
Finch, D. P. and Palmer, P. I.: Increasing ambient surface ozone levels over the UK accompanied by fewer extreme events. Atmos. Environ., 237, 117627, https://doi.org/10.1016/j.atmosenv.2020.117627, 2020.
Fiore, A. M., Dentener, F. J., Wild, O., Cuvelier, C., Schultz, M. G., Hess, P., Textor, C., Schulz, M., Doherty, R. M., Horowitz, L. W., MacKenzie, I. A., Sanderson, M. G., Shindell, D. T., Stevenson, D. S., Szopa, S., Van Dingenen, R., Zeng, G., Atherton, C., Bergmann, D., Bey, I., Carmichael, G., Collins, W. J., Duncan, B. N., Faluvegi, G., Folberth, G., Gauss, M., Gong, S., Hauglustaine, D., Holloway, T., Isaksen, I. S. A., Jacob, D. J., Jonson, J. E., Kaminski, J. W., Keating, T. J., Lupu, A., Manner, E., Montanaro, V., Park, R. J., Pitari, G., Pringle, K. J., Pyle, J. A., Schroeder, S., Vivanco, M. G., Wind, P., Wojcik, G., Wu, S., and Zuber, A.: Multimodel estimates of intercontinental source-receptor relationships for ozone pollution, J. Geophys. Res.-Atmos., 114, https://doi.org/10.1029/2008JD010816, 2009.
Fowler, D., Coyle, M., Skiba, U., Sutton, M. A., Cape, J. N., Reis, S., Sheppard, L. J., Jenkins, A., Grizzetti, B., Galloway, J. N., Vitousek, P., Leach, A., Bouwman, A. F., Butterbach-Bahl, K., Dentener, F., Stevenson, D., Amann, M., and Voss, M.: The global nitrogen cycle in the Twentyfirst century, Philos. T. Roy. Soc. B, 368, https://doi.org/10.1098/rstb.2013.0164, 2013.
Girach, I. A., Tripathi, N., Nair, P. R., Sahu, L. K., and Ojha, N.: O3 and CO in the South Asian outflow over the Bay of Bengal: Impact of monsoonal dynamics and chemistry, Atmos. Environ., 233, https://doi.org/10.1016/j.atmosenv.2020.117610, 2020.
Griffiths, P. T., Murray, L. T., Zeng, G., Shin, Y. M., Abraham, N. L., Archibald, A. T., Deushi, M., Emmons, L. K., Galbally, I. E., Hassler, B., Horowitz, L. W., Keeble, J., Liu, J., Moeini, O., Naik, V., O'Connor, F. M., Oshima, N., Tarasick, D., Tilmes, S., Turnock, S. T., Wild, O., Young, P. J., and Zanis, P.: Tropospheric ozone in CMIP6 simulations, Atmos. Chem. Phys., 21, 4187–4218, https://doi.org/10.5194/acp-21-4187-2021, 2021.
Grigas, T., Ovadnevaite, J., Ceburnis, D., Moran, E., McGovern, F. M., Jennings, S. G., and O'Dowd, C.: Sophisticated Clean Air Strategies Required to Mitigate Against Particulate Organic Pollution, Sci. Rep., 7, https://doi.org/10.1038/srep44737, 2017.
Guerreiro, C. B. B., Foltescu, V., and de Leeuw, F.: Air quality status and trends in Europe, Atmos. Environ., 98, 376–384, https://doi.org/10.1016/j.atmosenv.2014.09.017, 2014.
Huang, M., Carmichael, G. R., Pierce, R. B., Jo, D. S., Park, R. J., Flemming, J., Emmons, L. K., Bowman, K. W., Henze, D. K., Davila, Y., Sudo, K., Jonson, J. E., Lund, M. T., Janssens-Maenhout, G., Dentener, F. J., Keating, T. J., and Saiz-Lopez, A.: Impact of intercontinental pollution transport on North American ozone air pollution: An HTAP phase 2 multi-model study, Atmos. Chem. Phys., 17, 5721–5750, https://doi.org/10.5194/acp-17-5721-2017, 2017.
IPCC, Masson-Delmotte, V., Zhai, P., Chen, Y., Goldfarb, L., Gomis, M. I., Matthews, J. B. R., Berger, S., Huang, M., Yelekçi, O., Yu, R., Zhou, B., Lonnoy, E., Maycock, T. K., Waterfield, T., Leitzell, K., and Caud, N.: Working Group I Contribution to the Sixth Assessment Report of the Intergovernmental Panel on Climate Change, Cambridge University Press, https://doi.org/10.1017/9781009157896, 2023.
Jeon, W. B., Lee, S. H., Lee, H., Park, C., Kim, D. H., and Park, S. Y.: A study on high ozone formation mechanism associated with change of NOx VOCs ratio at a rural area in the Korean Peninsula, Atmos. Environ., 89, 10–21, https://doi.org/10.1016/j.atmosenv.2014.02.005, 2014.
Jonson, J. E., Stohl, A., Fiore, A. M., Hess, P., Szopa, S., Wild, O., Zeng, G., Dentener, F. J., Lupu, A., Schultz, M. G., Duncan, B. N., Sudo, K., Wind, P., Schulz, M., Marmer, E., Cuvelier, C., Keating, T., Zuber, A., Valdebenito, A., Dorokhov, V., De Backer, H., Davies, J., Chen, G. H., Johnson, B., Tarasick, D. W., Stübi, R., Newchurch, M. J., Von Der Gathen, P., Steinbrecht, W., and Claude, H.: A multi-model analysis of vertical ozone profiles, Atmos. Chem. Phys., 10, 5759–5783, https://doi.org/10.5194/acp-10-5759-2010, 2010.
Khiem, M., Ooka, R., Huang, H., Hayami, H., Yoshikado, H., and Kawamoto, Y.: Analysis of the Relationship between Changes in Meteorological Conditions and the Variation in Summer Ozone Levels over the Central Kanto Area, Adv. Meteorol., 2010, 1–13, https://doi.org/10.1155/2010/349248, 2010.
Lamarque, J. F. and Solomon, S.: Impact of changes in climat.e and halocarbons on recent lower stratosphere ozone and temperature trends, J. Climate, 23, 2599–2611, https://doi.org/10.1175/2010JCLI3179.1, 2010.
Lamarque, J. F., Kinnison, D. E., Hess, P. G., and Vitt, F. M.: Simulated lower stratospheric trends between 1970 and 2005: Identifying the role of climate and composition changes, J. Geophys. Res.-Atmos., 113, https://doi.org/10.1029/2007JD009277, 2008.
Lamarque, J. F., Bond, T. C., Eyring, V., Granier, C., Heil, A., Klimont, Z., Lee, D., Liousse, C., Mieville, A., Owen, B., Schultz, M. G., Shindell, D., Smith, S. J., Stehfest, E., Van Aardenne, J., Cooper, O. R., Kainuma, M., Mahowald, N., McConnell, J. R., Naik, V., Riahi, K., and Van Vuuren, D. P.: Historical (1850–2000) gridded anthropogenic and biomass burning emissions of reactive gases and aerosols: Methodology and application, Atmos. Chem. Phys., 10, 7017–7039, https://doi.org/10.5194/acp-10-7017-2010, 2010.
Lamarque, J. F., Emmons, L. K., Hess, P. G., Kinnison, D. E., Tilmes, S., Vitt, F., Heald, C. L., Holland, E. A., Lauritzen, P. H., Neu, J., Orlando, J. J., Rasch, P. J., and Tyndall, G. K.: CAMchem: Description and evaluation of interactive atmospheric chemistry in the Community Earth System Model, Geosci. Model Dev., 5, 369–411, https://doi.org/10.5194/gmd-5-369-2012, 2012.
Lefohn, A. S., Malley, C. S., Smith, L., Wells, B., Hazucha, M., Simon, H., Naik, V., Mills, G., Schultz, M. G., Paoletti, E., De Marco, A., Xu, X., Zhang, L., Wang, T., Neufeld, H. S., Musselman, R. C., Tarasick, D., Brauer, M., Feng, Z., Tang, H., Kobayashi, K., Sicard, P., Solberg, S., and Gerosa, G.: Tropospheric ozone assessment report: Global ozone metrics for climate change, human health, and crop/ecosystem research, Elementa, 6, https://doi.org/10.1525/elementa.279, 2018.
Lin, M., Fiore, A. M., Cooper, O. R., Horowitz, L. W., Langford, A. O., Levy, H., Johnson, B. J., Naik, V., Oltmans, S. J., and Senff, C. J.: Springtime high surface ozone events over the western United States: Quantifying the role of stratospheric intrusions, J. Geophys. Res.-Atmos., 117, https://doi.org/10.1029/2012JD018151, 2012.
Lin, Y., Jiang, F., Zhao, J., Zhu, G., He, X., Ma, X., Li, S., Sabel, C. E., and Wang, H.: Impacts of O3 on premature mortality and crop yield loss across China, Atmos. Environ., 194, 41–47, https://doi.org/10.1016/j.atmosenv.2018.09.024, 2018.
Lupaşcu, A., Otero, N., Minkos, A., and Butler, T.: Attribution of surface ozone to NOx and volatile organic compound sources during two different high ozone events, Atmos. Chem. Phys., 22, 11675–11699, https://doi.org/10.5194/acp-22-11675-2022, 2022.
McVeigh, P., O'Dowd, C., and Berresheim, H.: Eddy Correlation Measurements of Ozone Fluxes over Coastal Waters West of Ireland, Adv. Meteorol., 2010, https://doi.org/10.1155/2010/754941, 2010.
Moiseenko, K. B., Vasileva, A. V., Skorokhod, A. I., Belikov, I. B., Repin, A. Y., and Shtabkin, Y. A.: Regional Impact of Ozone Precursor Emissions on NOX and O3 Levels at ZOTTO Tall Tower in Central Siberia, Earth Space Sci., 8, https://doi.org/10.1029/2021EA001762, 2021.
Molod, A., Takacs, L., Suarez, M., and Bacmeister, J.: Development of the GEOS-5 atmospheric general circulation model: Evolution from MERRA to MERRA2, Geosci. Model Dev., 8, 1339–1356, https://doi.org/10.5194/gmd-8-1339-2015, 2015.
Monks, P. S., Archibald, A. T., Colette, A., Cooper, O., Coyle, M., Derwent, R., Fowler, D., Granier, C., Law, K. S., Mills, G. E., Stevenson, D. S., Tarasova, O., Thouret, V., von Schneidemesser, E., Sommariva, R., Wild, O., and Williams, M. L.: Tropospheric ozone and its precursors from the urban to the global scale from air quality to short-lived climate forcer, Atmos. Chem. Phys., 15, 8889–8973, https://doi.org/10.5194/acp-15-8889-2015, 2015.
Nalam, A., Lupaşcu, A., Ansari, T., and Butler, T.: Regional and sectoral contributions of NOx and reactive carbon emission sources to global trends in tropospheric ozone during the 2000–2018 period, Atmos. Chem. Phys., 25, 5287–5311, https://doi.org/10.5194/acp-25-5287-2025, 2025.
Nelson, B. S. and Drysdale, W. S.: Urban ozone trends in Europe and the USA (2000–2021), Atmos. Chem. Phys., 25, 16009–16026, https://doi.org/10.5194/acp-25-16009-2025, 2025.
O'Dowd, C., Ceburnis, D., Ovadnevaite, J., Vaishya, A., Rinaldi, M., and Facchini, M. C.: Do anthropogenic, continental or coastal aerosol sources impact on a marine aerosol signature at Mace Head?, Atmos. Chem. Phys., 14, 10687–10704, https://doi.org/10.5194/acp-14-10687-2014, 2014.
Oltmans, S. J., Lefohn, A. S., Harris, J. M., Galbally, I., Scheel, H. E., Bodeker, G., Brunke, E., Claude, H., Tarasick, D., Johnson, B. J., and Simmonds, P.: Long-term changes in tropospheric ozone, Atmos. Environ., 40, 3156–3173, https://doi.org/10.1016/j.atmosenv.2006.01.029, 2006.
Oltmans, S. J., Lefohn, A. S., Shadwick, D., Harris, J. M., Scheel, H. E., Galbally, I., Tarasick, D. W., Johnson, B. J., Brunke, E. G., Claude, H., Zeng, G., Nichol, S., Schmidlin, F., Davies, J., Cuevas, E., Redondas, A., Naoe, H., Nakano, T., and Kawasato, T.: Recent tropospheric ozone changes – A pattern dominated by slow or no growth, Atmos. Environ., 67, 331–351, https://doi.org/10.1016/j.atmosenv.2012.10.057, 2013.
Ordóñez, C., Garrido-Perez, J. M., and García-Herrera, R. Early spring near-surface ozone in Europe during the COVID-19 shutdown: Meteorological effects outweigh emission changes, Sci. Total Environ., 747, 141322, https://doi.org/10.1016/j.scitotenv.2020.141322, 2020.
Pallé, E. and Butler, C. J.: Comparison of sunshine records and synoptic cloud observations: a case study for Ireland, Phys. Chem. Earth Pt. A/B/C, 27, 405–414, 2002.
Pan, C., Zhu, B., Gao, J., Hou, X., Kang, H., and Wang, D.: Quantifying Arctic lower stratospheric ozone sources in winter and spring, Sci. Rep., 8, https://doi.org/10.1038/s41598-018-27045-5, 2018.
Paoletti, E.: Impact of ozone on Mediterranean forests: A review, Environ. Pollut., 144, 463–474, https://doi.org/10.1016/j.envpol.2005.12.051, 2006.
Pausata, F. S. R., Pozzoli, L., Vignati, E., and Dentener, F. J.. North Atlantic Oscillation and tropospheric ozone variability in Europe: Model analysis and measurements intercomparison, Atmos. Chem. Phys., 12, 6357–6376, https://doi.org/10.5194/acp-12-6357-2012, 2012.
Pio, C. A., Feliciano, M. S., Vermeulen, A. T., and Sousa, E. C.: Seasonal variability of ozone dry deposition under southern European climate conditions, in Portugal, Atmos. Environ., 34, 195–205, 2000.
Russo, M. R., Kerridge, B. J., Abraham, N. L., Keeble, J., Latter, B. G., Siddans, R., Weber, J., Griffiths, P. T., Pyle, J. A., and Archibald, A. T.: Seasonal, interannual and decadal variability of tropospheric ozone in the North Atlantic: comparison of UM-UKCA and remote sensing observations for 2005–2018, Atmos. Chem. Phys., 23, 6169–6196, https://doi.org/10.5194/acp-23-6169-2023, 2023.
Saiz-Lopez, A., Mahajan, A. S., Abbatt, J., Bobrowski, N., Brown, S. S., Burrows, J. P., Carpenter, L. J., Chipperfield, M. P., Cuevas, C. A., Fernandez, R., Hossaini, R., Kinnison, D. E., Lamarque, J.-F., Finlayson-Pitts, B. J., Plane, J. M. C., Platt, U., Pratt, K., Ravishankara, A. R., Salawitch, R. J., Saltzman, E. S., Simpson, W. R., Solomon, S., Thornton, J. A., and Wang, T.: The influence of short-lived halogens on atmospheric chemistry and climate, Nature, 648, 289–299, https://doi.org/10.1038/s41586-025-09753-x, 2025.
Seinfeld, J. H. and Pandis, S. N.: Atmospheric Chemistry and Physics: From Air Pollution to Climate Change, in: 3rd Edn., Wiley, Hoboken, NJ, ISBN 978-1-118-94740-1, 2016.
Shindell, D. T., Chin, M., Dentener, F., Doherty, R. M., Faluvegi, G., Fiore, A. M., Hess, P., Koch, D. M., MacKenzie, I. A., Sanderson, M. G., Schultz, M. G., Schulz, M., Stevenson, D. S., Teich, H., Textor, C., Wild, O., Bergmann, D. J., Bey, I., Bian, H., Cuvelier, C., Duncan, B. N., Folberth, G., Horowitz, L. W., Jonson, J., Kaminski, J. W., Marmer, E., Park, R., Pringle, K. J., Schroeder, S., Szopa, S., Takemura, T., Zeng, G., Keating, T. J., and Zuber, A.: A multi-model assessment of pollution transport to the Arctic, Atmos. Chem. Phys., 8, 5353–5372, https://doi.org/10.5194/acp-8-5353-2008, 2008.
Sicard, P., Serra, R., and Rossello, P.: Spatiotemporal trends in ground-level ozone concentrations and metrics in France over the time period 1999–2012, Environ. Res., 149, 122–144, https://doi.org/10.1016/j.envres.2016.05.014, 2016.
Simmonds, P. G. and Derwent, R. G.: Measurements of ozone and other radiatively active gases at Mace Head in the Republic of Ireland, Atmos. Environ., 23, 1795–1808, https://doi.org/10.1016/0960-1686(91)90264-8, 1991.
Simmonds, P. G., Derwent, R. G., Manning, A. L., and Spain, G.: Significant growth in surface ozone at Mace Head, Ireland, 1987–2003, Atmos. Environ., 38, 4769–4778, https://doi.org/10.1016/j.atmosenv.2004.04.036, 2004.
Soares, J., Plass, D., Kienzler, S., González Ortiz, A., Gsella, A., and Horálek, J.: Health Risk Assessment of Air Pollution: assessing the environmental burden of disease in Europe in 2021, Eionet Report – ETC HE 2023/7, European Topic Centre on Human Health and the Environment, https://www.eionet.europa.eu/etcs/all-etc-reports (last access: 19 April 2025), 2023.
Spohn, T. K., Martin, D., Geever, M., and O'Dowd, C.: Effect of COVID-19 lockdown on regional pollution in Ireland, Air Qual. Atmos. Health, 15, 221–234, https://doi.org/10.1007/s11869-021-01098-4, 2022.
Stein, A. F., Draxler, R. R., Rolph, G. D., Stunder, B. J. B., Cohen, M. D., and Ngan, F.: NOAA's HYSPLIT atmospheric transport and dispersion modeling system, B. Am. Meteorol. Soc., 96, 2059–2077, https://doi.org/10.1175/BAMS-D-14-00110.1, 2015.
Stunder, B. J. B.: Global Data Assimilation System (GDAS) Archive Information, NOAA Air Resources Laboratory, Silver Spring, MD, USA, https://www.ready.noaa.gov/data/archives/gdas1/ (last access: 6 October 2024), 2004.
Sudo, K. and Akimoto, H.: Global source attribution of tropospheric ozone: Long-range transport from various source regions, J. Geophys. Res., 112, D12302, https://doi.org/10.1029/2006JD007992, 2007.
Tan, J., Fu, J. S., Dentener, F., Sun, J., Emmons, L., Tilmes, S., Flemming, J., Takemura, T., Bian, H., Zhu, Q., Yang, C. E., and Keating, T.: Source contributions to sulfur and nitrogen deposition – An HTAP II multi-model study on hemispheric transport, Atmos. Chem. Phys., 18, 12223–12240, https://doi.org/10.5194/acp-18-12223-2018, 2018.
Tavella, R. A. and da Silva Júnior, F. M. R.: Watch out for trends: did ozone increased or decreased during the COVID-19 pandemic?, Environ. Sci. Pollut. Res., 28, 67880–67885, https://doi.org/10.1007/s11356-021-17142-w, 2021.
Tilmes, S., Lamarque, J. F., Emmons, L. K., Kinnison, D. E., Ma, P. L., Liu, X., Ghan, S., Bardeen, C., Arnold, S., Deeter, M., Vitt, F., Ryerson, T., Elkins, J. W., Moore, F., Spackman, J. R., and Val Martin, M.: Description and evaluation of tropospheric chemistry and aerosols in the Community Earth System Model (CESM1.2), Geosci. Model Dev., 8, 1395–1426, https://doi.org/10.5194/gmd-8-1395-2015, 2015.
Tilmes, S., Sanderson, B. M., and O'Neill, B. C.: Climate impacts of geoengineering in a delayed mitigation scenario, Geophys. Res. Lett., 43, 8222–8229, https://doi.org/10.1002/2016GL070122, 2016.
Todorović, M. N., Radenković, M. B., Rajšić, S. F., and Ignjatović, L. M.: Evaluation of mortality attributed to air pollution in the three most populated cities in Serbia, Int. J. Environ. Sci. Technol., 16, 7059–7070, https://doi.org/10.1007/s13762-019-02384-6, 2019.
Tripathi, O. P., Jennings, S. G., O'Dowd, C. D., Coleman, L., Leinert, S., O'Leary, B., Moran, E., O'Doherty, S. J., and Spain, T. G.: Statistical analysis of eight surface ozone measurement series for various sites in Ireland, J. Geophys. Res.-Atmos., 115, 1–20, https://doi.org/10.1029/2010JD014040, 2010.
Tripathi, O. P., Jennings, S. G., O'Dowd, C., O'Leary, B., Lambkin, K., Moran, E., O'Doherty, S. J., and Gerard Spain, T.: An assessment of the surface ozone trend in Ireland relevant to air pollution and environmental protection, Atmos. Pollut. Res., 3, 341–351, https://doi.org/10.5094/APR.2012.038, 2012.
Tripathi, O. P., Jennings, S. G., Colman, L., Lambkin, K., Moran, E., and O'Dowd, C.: Ozone levels, changes and trends over Ireland: an integrated analysis. STRIVE Programme 2007–2013, 2006-AQ-MS, Technical Report, Environmental Protection Agency of Ireland, Johnstown Castle, Ireland, 137 pp., https://centaur.reading.ac.uk/32556/1/STRIVE_FINAL_REPORT_OZONE_2006-AQ-MS-50.pdf (last access: 27 November 2024), 2013.
Vautard, R., Moran, M. D., Solazzo, E., Gilliam, R. C., Matthias, V., Bianconi, R., Chemel, C., Ferreira, J., Geyer, B., Hansen, A. B., Jericevic, A., Prank, M., Segers, A., Silver, J. D., Werhahn, J., Wolke, R., Rao, S. T., and Galmarini, S.: Evaluation of the meteorological forcing used for the Air Quality Model Evaluation International Initiative (AQMEII) air quality simulations, Atmos. Environ., 53, 15–37, https://doi.org/10.1016/j.atmosenv.2011.10.065, 2012.
Van Der Werf, G. R., Randerson, J. T., Giglio, L., Collatz, G. J., Mu, M., Kasibhatla, P. S., Morton, D. C., Defries, R. S., Jin, Y., and Van Leeuwen, T. T.: Global fire emissions and the contribution of deforestation, savanna, forest, agricultural, and peat fires (1997–2009), Atmos. Chem. Phys., 10, 11707–11735, https://doi.org/10.5194/acp-10-11707-2010, 2010.
Wespes, C., Hurtmans, D., Clerbaux, C., and Coheur, P. F.: O3 variability in the troposphere as observed by IASI over 2008–2016: Contribution of atmospheric chemistry and dynamics, J. Geophys. Res., 122, 2429–2451, https://doi.org/10.1002/2016JD025875, 2017.
WHO: WHO global air quality guidelines: particulate matter (PM2.5 and PM10), ozone, nitrogen dioxide, sulfur dioxide and carbon monoxide, World Health Organization, https://iris.who.int/handle/10665/345329 (last access: 20 December 2025), 2021.
Wild, O. and Ryan, E. M.: Quantifying and addressing the uncertainties in tropospheric ozone and OH in a global chemistry transport model, Atmos. Chem. Phys., 26, 2255–2273, https://doi.org/10.5194/acp-26-2255-2026, 2026.
Yan, Y., Pozzer, A., Ojha, N., Lin, J., and Lelieveld, J.: Analysis of European ozone trends in the period 1995–2014, Atmos. Chem. Phys., 18, 5589–5605, https://doi.org/10.5194/acp-18-5589-2018, 2018.
Yerramilli, A., Srinivas Challa, V., Rao Dodla, V. B., Myles, L. T., Pendergrass, W. R., Vogel, C. A., Tuluri, F., Baham, J. M., Hughes, R., Patrick, C., Young, J., and Swanier, S. Simulation of surface ozone pollution in the Central Gulf Coast region during summer synoptic condition using WRF/Chem air quality model, Atmos. Pollut. Res., 3, 55–71, https://doi.org/10.5094/APR.2012.005, 2012.
Young, P. J., Archibald, A. T., Bowman, K. W., Lamarque, J.-F., Naik, V., Stevenson, D. S., Tilmes, S., Voulgarakis, A., Wild, O., Bergmann, D., Cameron-Smith, P., Cionni, I., Collins, W. J., Dalsøren, S. B., Doherty, R. M., Eyring, V., Faluvegi, G., Horowitz, L. W., Josse, B., Lee, Y. H., MacKenzie, I. A., Nagashima, T., Plummer, D. A., Righi, M., Rumbold, S. T., Skeie, R. B., Shindell, D. T., Strode, S. A., Sudo, K., Szopa, S., and Zeng, G.: Pre-industrial to end 21st century projections of tropospheric ozone from the Atmospheric Chemistry and Climate Model Intercomparison Project (ACCMIP), Atmos. Chem. Phys., 13, 2063–2090, https://doi.org/10.5194/acp-13-2063-2013, 2013.
Yu, H., Chin, M., West, J. J., Atherton, C. S., Bellouin, N., Bergmann, D., Bey, I., Bian, H., Diehl, T., Forberich, O., Hess, P., Schulz, M., Takemura, T., and Tan, Q.: A multimodel assessment of the influence of regional anthropogenic emission reductions on aerosol direct radiative forcing and the role of intercontinental transport, J. Geophys. Res.-Atmos., 118, 7004–7025, https://doi.org/10.1002/jgrd.50502, 2013.
Zhang, C. and Stevenson, D.: Characteristic changes of ozone and its precursors in London during COVID-19 lockdown and the ozone surge reason analysis, Atmos. Environ., 273, 118980, https://doi.org/10.1016/j.atmosenv.2022.118980, 2022.
Zhang, J. J., Wei, Y., and Fang, Z.: Ozone pollution: A major health hazard worldwide, Front. Immunol., 10, 1–10, https://doi.org/10.3389/fimmu.2019.02518, 2019.
Zhu, T., Melamed, M., Parrish, D., Gauss, M., Klenner, L. G., Lawrence, M., Konare, A., and Liousse, C.: Impacts of Megaci-ties on Air Pollution and Climate, WMO, Geneva, https://igacproject.org/sites/default/files/2016-07/GAW Report 205.pdf (last access: 12 January 2025), 2012.