the Creative Commons Attribution 4.0 License.
the Creative Commons Attribution 4.0 License.
Measurement report: Optical properties of carbonaceous aerosols modulated by source variations of spring haze
Yuan Cheng
Xu-bing Cao
Yang-mei Guo
Ying-jie Zhong
Zhi-qing Zhang
Ke-bin He
Carbonaceous aerosols exert unique impacts on earth energy balance, but are not well constrained in air quality and climate models yet. In this study, a field campaign was conducted in a Chinese megacity during a spring season to explore the optical properties of carbonaceous aerosols modulated by dramatic variations of particulate matter sources. We first integrated the light absorption results derived from different methods, including both on-line and off-line approaches. Then by synthesizing a series of source-relevant signatures, three types of haze episodes were identified. In general, agricultural fire emissions exerted strong influences on brown carbon (BrC), by effectively increasing the mass absorption efficiency (MAE) of bulk BrC, and emitting chromophores with a characteristic absorption peak at ∼ 365 nm. Specifically, fires with low combustion efficiencies were more capable of enhancing the impacts of BrC on bulk aerosol absorption, and were more favorable for the emissions of organic compounds with relatively high molecular weights and aromatic contents. In addition, the agricultural fires, especially those with relatively low efficiencies, resulted in overestimations of black carbon (BC) mass by thermal-optical method due to unique emitted species. BC concentrations were also overestimated for the dust episodes. By excluding the impacts from agricultural fires and dusts, we unfolded the influence of secondary aerosol formation on the MAE of BC (MAEBC). With the enhancement of secondary aerosols, MAEBC was found to exhibit a clear increasing trend, which could be translated into the light absorption enhancement (Eabs) factors of up to ∼ 2.3.
- Article
(3369 KB) - Full-text XML
-
Supplement
(861 KB) - BibTeX
- EndNote
Carbonaceous aerosols, which consist of organic compounds and black carbon (BC), exert unique impacts on earth energy balance (Bond et al., 2013), e.g., through absorbing and scattering solar radiation, influencing cloud processes, and deposition on ice and snow cover. However, as a complex mixture of compounds with continuing changes in chemical and physical properties (Pöschl, 2005; Andreae and Gelencsér, 2006), carbonaceous aerosols remained poorly constrained in air quality and climate models. For example, challenges still existed in the simulation of the sources, abundances, optical properties and radiative forcing of BC (Samset et al., 2014; Winiger et al., 2019; Gao et al., 2022; Chen et al., 2025; Wang et al., 2025). Similarly, discrepancies in the modeled and observed results were also evident for organic aerosol (OA), e.g., as indicated by the difficulties in proper predictions of several key fractions including primary OA emitted by open burning (Zhong et al., 2023), secondary OA (SOA) formed by volatility organic compounds (VOCs) with relatively low saturation vapor concentrations (Chang et al., 2022), and light absorbing OA, i.e., brown carbon (Tuccella et al., 2025). On one hand, state-of-the-art models were subject to various uncertainties such as those associated with the emission inventories, the treatments of BC lifetime and mixing state, the formation pathways of SOA, and the parameterization of brown carbon. On the other hand, there were also uncertainties in the observational results of carbonaceous aerosols. For example, measured BC were frequently found to differ by several times among various detection approaches such as the thermal-optical (e.g., carbon analyzer), light absorption (e.g., Aethalometer) and laser-induced incandescence (e.g., single-particle soot photometer) ones (Tinorua et al., 2024). These techniques are mainly based on the high thermal-stability, strong light-absorbing, and refractory properties of black carbon, respectively, while none of them has been established as a reference method (Petzold et al., 2013). In addition, it was commonly believed that inter-method differences in BC results were closely related to aerosol sources, but the influencing factors at play were not well understood (Pileci et al., 2021). Thus, largely constrained by the multitude of measurement principles, it remained challenging to integrate the observational and the subsequent interpretation (e.g., source apportionment) results on carbonaceous aerosols across studies and regions (Putaud et al., 2025).
In China, the ambient fine particulate matter (PM2.5) pollution has been reduced substantially since 2013 (Geng et al., 2024). More recently, the Ministry of Ecology and Environment (MEE) of China released stricter Ambient Air Quality Standards for PM2.5 (MEE, 2026), e.g., starting from 2031, the Class 2 standards will be reduced to 25 from 35 µg m−3 for annual average (with an interim limit of 30 µg m−3 for 2026–2030) and to 50 from 75 µg m−3 for 24 h average (with an interim limit of 60 µg m−3). The new standards provide additional impetus for air quality improvement and meanwhile place great demands on a stronger observational support for PM2.5 pollution control. This is particularly the case for Northeast China, which was overlooked by all of the national-level action plans implemented during 2013–2025 and showed relatively slow decreasing rate of PM2.5 (Xiao et al., 2022).
Northeast China comprises three provinces (i.e., Liaoning, Jilin and Heilongjiang) and involves two national-level city clusters, i.e., Harbin-Changchun (HC) and Central-Southern Liaoning. Among the two city-cluster regions, HC differs more significantly from the traditional hotspots for air pollution control, e.g., Beijing and the surrounding areas. The distinctiveness of HC could be seen from two aspects (Cheng and He, 2026). First, HC is located in a severe cold climate region (e.g., with a seasonal average of −15 °C in Harbin's winter), leading to intensive energy use in the cold winters for heating and thus high emissions of anthropogenic pollutants. Second, HC is within a major agricultural region, where open burning of crop residues remains prevalent after autumn harvesting and before spring planting in the next year. The agricultural fires frequently resulted in heavy pollution episodes, e.g., with record-high PM2.5 concentration of ∼ 2350 µg m−3 (1 h average) in Harbin (Cheng et al., 2021). Despite the distinct emission system, the aerosols in HC (e.g., regarding their chemical compositions, source contributions, optical properties and impacts) have not been comprehensively explored, as indicated by the limited number of studies available (e.g., Wu et al., 2020; Zhang et al., 2020; Xie et al., 2024).
By combining on-line and off-line measurements, a field campaign was conducted in the central city of HC during a period with dramatic variations of aerosol sources and compositions. From a technical perspective, we elucidated the inter-method discrepancies in light absorption coefficients of carbonaceous aerosols, including both black and brown carbon. From a scientific perspective, we highlighted the signatures of various types of episodes and unfolded the responses of aerosol optical properties to agricultural fire emissions and secondary aerosol formation. We also demonstrated that nocturnal nitrate formation could be effectively enhanced by agricultural fires, and thermal-optical measurement of BC mass could be subject to substantial artifacts during specific episodes. This study provided insights into the links between optical and chemical properties of aerosols in Northeast China, which are essential for understanding the haze pollution in this distinct but largely unexplored region.
2.1 On-line observations
Aerosol optical properties and mass concentrations of gaseous pollutants were measured with high time resolutions for about one month (from 1 April to 2 May 2023) in Harbin. The observation was performed on the campus of Harbin Institute of Technology (HIT), an urban site surrounded by residential and commercial areas. For aerosol measurements, ambient air was drawn into a stainless-steel sampling line at a flow rate of 16.7 L min−1, using a vacuum pump (VACUUBRAND, Wertheim, Germany) and a mass flow controller (Alicat Scientific Inc., AZ, USA). After passing through a PM2.5 cyclone (URG-2000-30EH; URG Corp., NC, USA) and a Nafion dryer (MD-700; Perma Pure LLC, NJ, USA), the sampled aerosols were measured by a photoacoustic extinctiometer (PAX; Droplet Measurement Technologies LLC, CO, USA) and a dual-spot Aethalometer (AE33; Aerosol d.o.o., Ljubljana, Slovenia). The PAX was operated at a wavelength (λ) of 870 nm based on in-situ measurement approaches, i.e., photoacoustic method for the light absorption coefficient (babs) and a wide-angle integrating reciprocal nephelometer for the scattering coefficient (bscat). The single scattering albedo (SSA) was calculated as the ratio of bscat to extinction coefficient (bext, the sum of babs and bscat). While the in-situ approach of PAX was used as the reference method for light absorption measurements, the AE33, which was operated with M8060 filter tapes, provided aerosol absorption coefficients at seven wavelengths (i.e., 370, 470, 520, 590, 660, 880 and 950 nm). It has been widely acknowledged that filter-based absorption measurement could be biased by the loading effect and the multiple scattering effect (Weingartner et al., 2003; Collaud Coen et al., 2010). For AE33, the former had been accounted for by a compensation algorithm based on absorption measurements from two differently loaded filter spots (Drinovec et al., 2015), while the latter was typically corrected using an empirical parameter (C). The manufacture recommended a constant of 1.39 for C, but the experimentally determined C values were frequently found to deviate considerably from the suggested value, with tempo-spatial variations and dependences on aerosol properties (Ferrero et al., 2021; Yus-Díez et al., 2021, 2025; Renzi et al., 2026). In this study, the default multiple scattering correction (assuming C=1.39) was not applied and the corresponding absorption coefficients, which had only been corrected for the loading effect, will be specified as (babs)∗. Refer to Supplement for a more detailed description of (babs)∗. The aerosol absorption Ångström exponent (AAEbulk) was determined as the slope derived from the linear regression of ln[(babs)∗] against ln(λ), over the wavelength range of 370–880 nm.
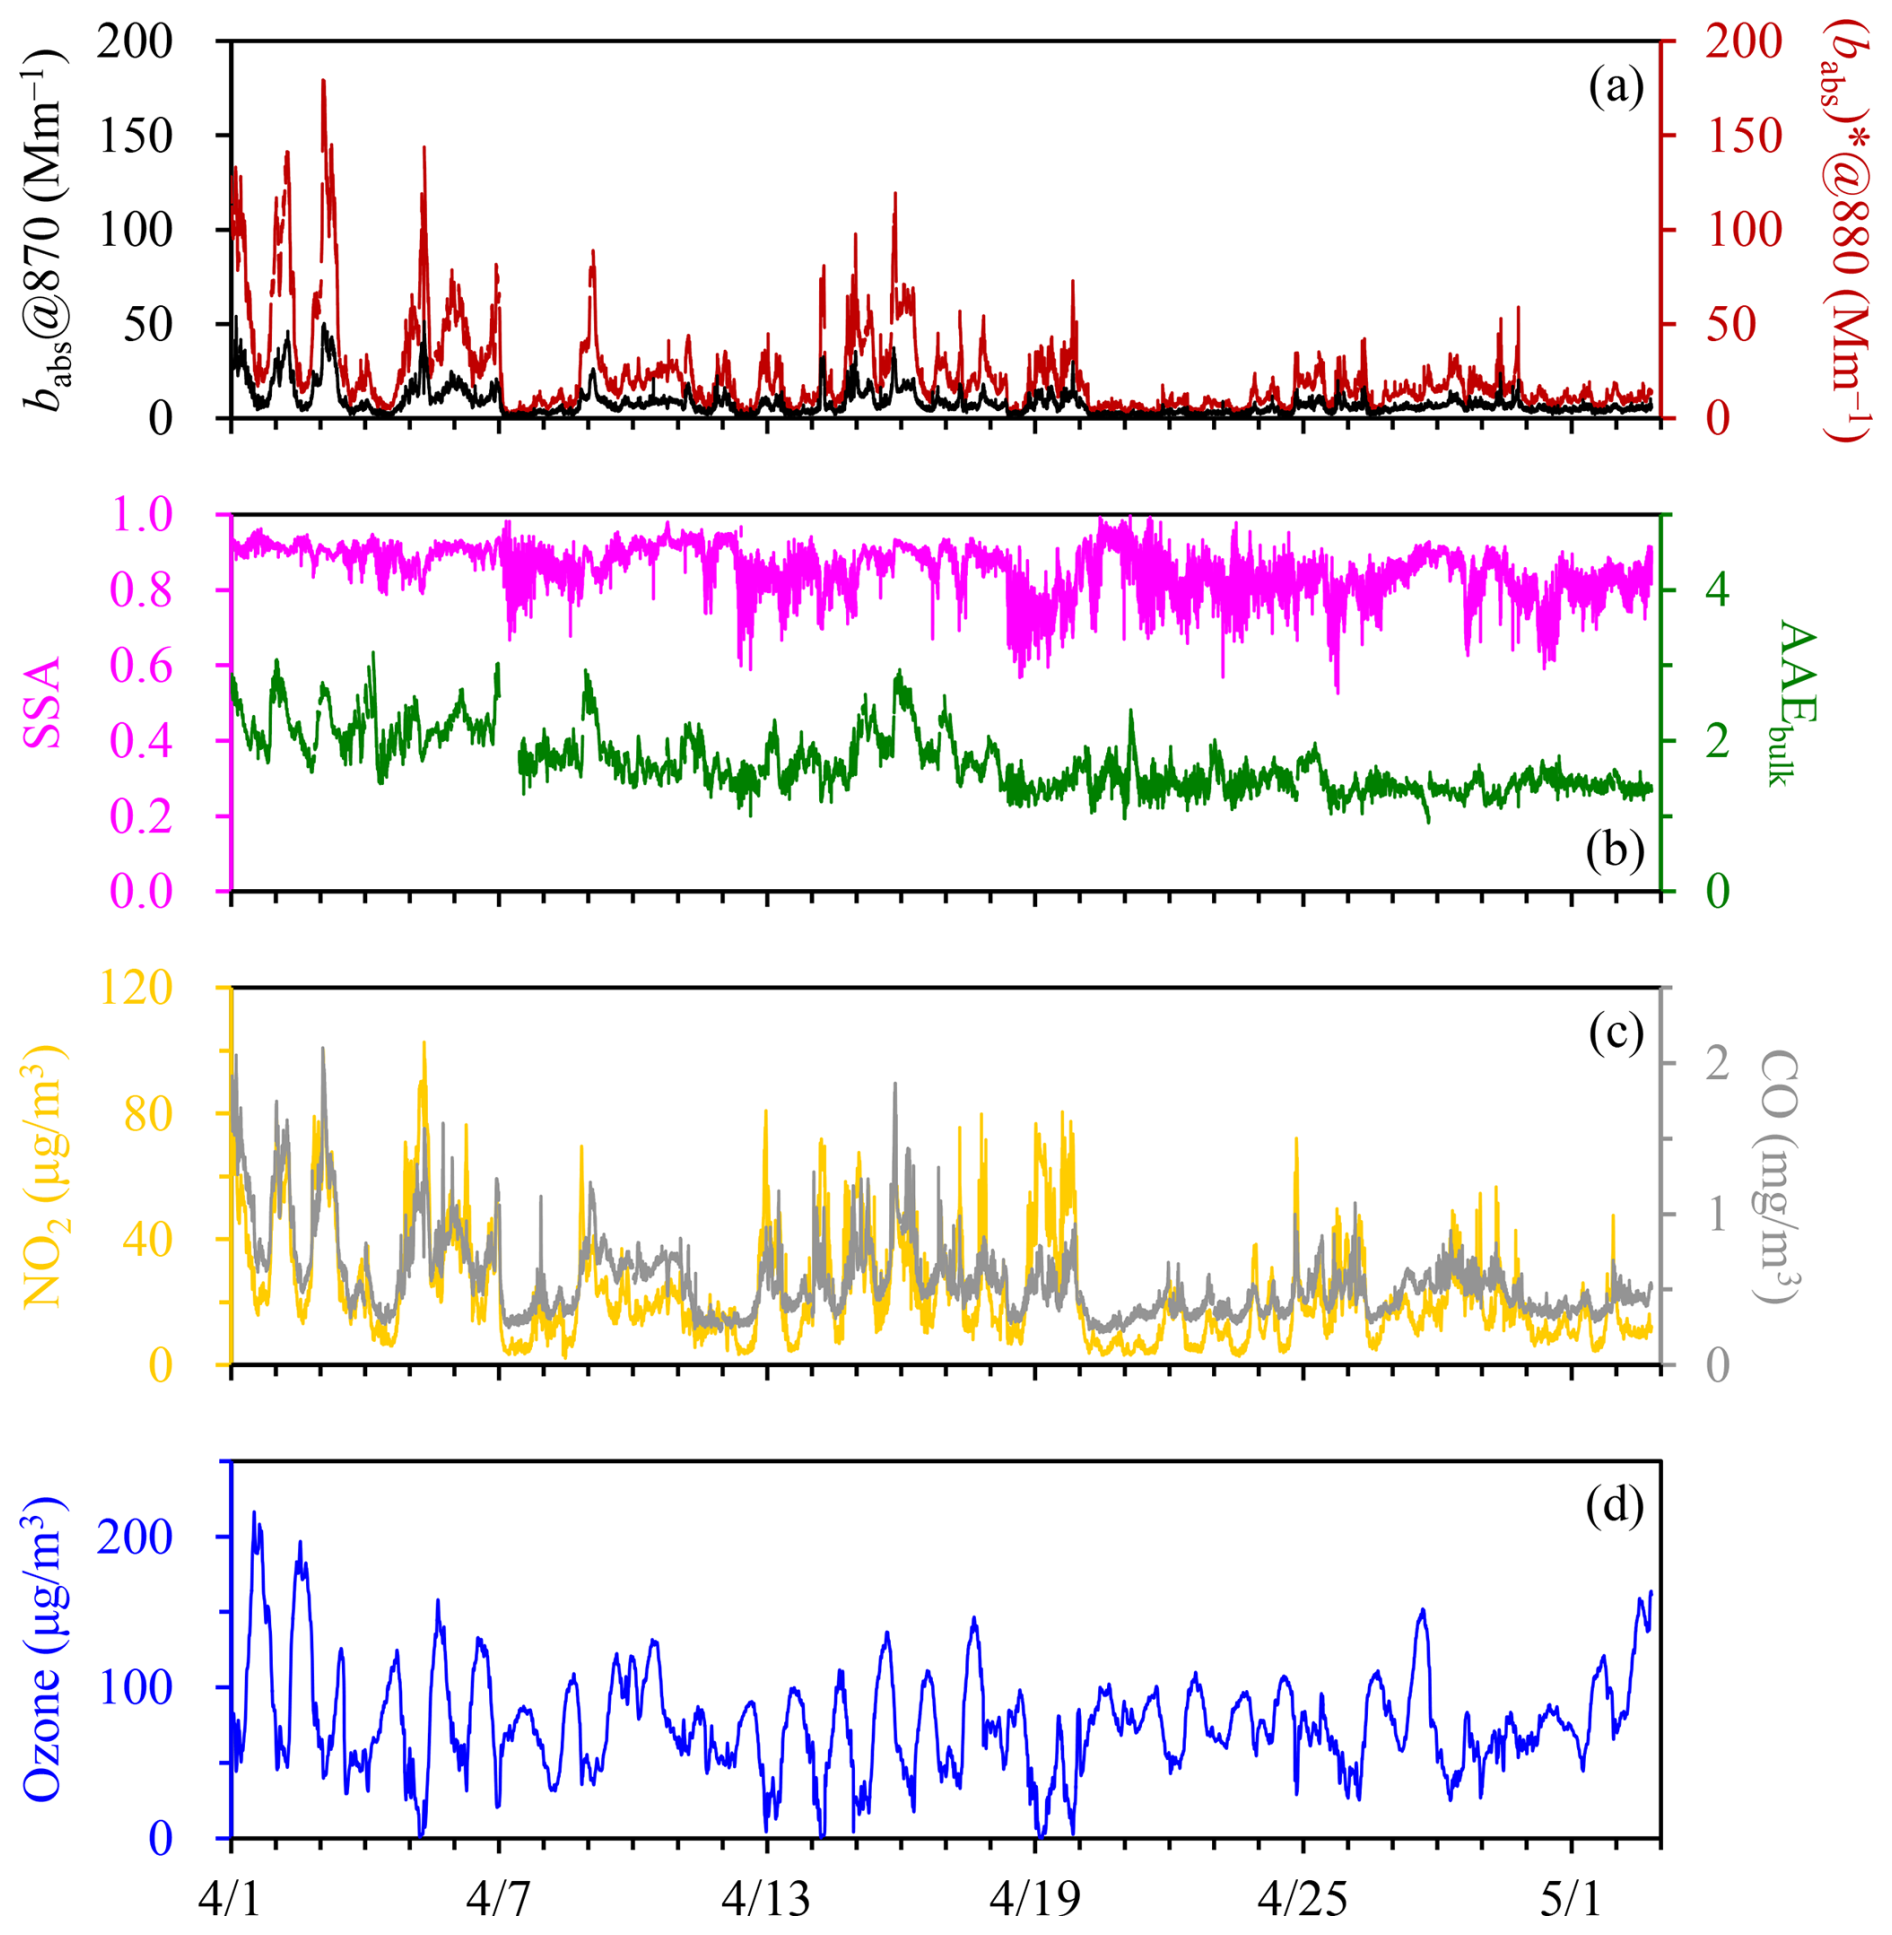
Figure 1Time series of (a) the PAX-based babs at 870 nm and the AE33-based (babs)∗ at 880 nm, (b) the PAX-based SSA and the AE33-based AAEbulk, (c) NO2 and CO, and (d) ozone. The results were shown with a time resolution of 1 min.
For the measurement of gaseous pollutants, ambient air was filtered and then drawn into a PTFE sampling line. A non-dispersive infrared analyzer (XHCO2000B) was used to measure carbon monoxide (CO), and two chemiluminescence-based analyzers (XHOZ7000 and XHN2000B) were operated to determine ozone (O3) and nitrogen dioxide (NO2), respectively. The instruments were manufactured by Hebei Sailhero Inc. (Shijiazhuang, China) in compliance with the reference methods released by the Ministry of Ecology and Environment of China.
The time resolutions were 1 s for PAX and 1 min for the other instruments. Thus the raw results from PAX were converted to 1 min averages before further analyses. The on-line measurement results were summarized in Fig. 1.
2.2 Off-line measurements
Daytime and nighttime PM2.5 samples were collected at the same site with the on-line instruments during the campaign. The sampling was done by a mass flow controlled high-volume sampler (TE-6070BLX-2.5-HVS; Tisch Environmental Inc., OH, USA), which was operated at a flow rate of 1.13 m3 min−1 using pre-baked quartz-fiber filters (Pall Corp., NY, USA). To avoid rush hours, the daytime and nighttime samples were collected from 09:00 to 16:00 and from 21:00 to 05:00 of the next day, respectively.
Organic carbon (OC) and elemental carbon (EC) of the filter samples were measured by a thermal/optical carbon analyzer (DRI-2001; Atmoslytic Inc., CA, USA), using the IMPROVE-A temperature protocol with the transmittance charring correction. The carbon analyzer also provided optical attenuation (ATN) results for the filter samples. ATN was calculated as ln(), where Iinitial and Ifinal indicate the filter transmittance signals (I) measured at the beginning (i.e., when the particle-laden filter has not been heated) and the end (i.e., when all the deposited carbon has been combusted off the filter) of thermal-optical analysis, respectively. Then the absorption coefficient (Mm−1) could be determined as ATN , where A is the filter area loaded with particles (mm2) and V is the volume of the air sampled (m3). It should be noted that when using the carbon analyzer, the absorption coefficients were derived at a single wavelength of 632 nm without any correction, for either the loading effect or the multiple scattering effect.
Water extracts of the filter samples were analyzed for inorganic ions using an ion chromatography system. The samples were also extracted by methanol to measure brown carbon (BrC). Light absorption spectra of the methanol extracts were detected over the wavelength range of 200–1110 nm, using a spectrophotometer (Ocean Optics Inc., FL, USA) coupled with a 2.5 m long liquid waveguide capillary cell (LWCC; World Precision Instruments Inc., FL, USA). The absorption coefficients determined in this approach, which were actually the absorption coefficients of the dissolved brown carbon (i.e., methanol-soluble BrC), will be referred to as (babs)MS-BrC.
2.3 Open-access data
Air quality data, e.g., hourly PM2.5 and PM10 concentrations, were obtained from a nearby air quality monitoring site (∼ 2 km away from the HIT site) operated by the China National Environmental Monitoring Center (CNEMC; https://air.cnemc.cn:18007/, last access: 14 May 2026). Meteorological data (e.g., temperature, relatively humidity and wind speed) were obtained with a time resolution of 1 h from Weather Underground (https://www.wunderground.com/, last access: 14 May 2026).
3.1 Integrating optical parameters derived from different methods
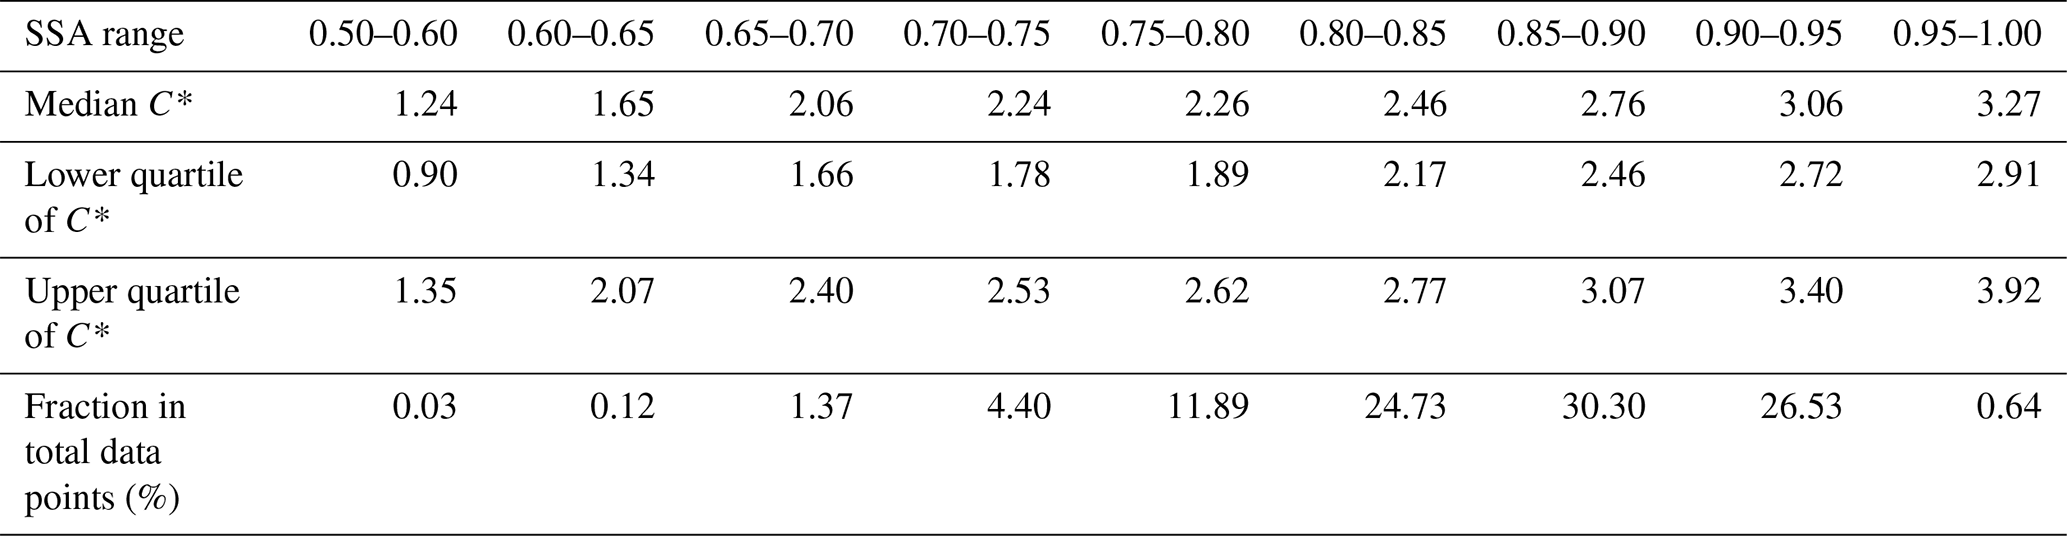
We first compared the light absorption coefficients derived from the PAX at 870 nm and from the AE33 at 880 nm, which will be termed babs@870 and (babs)∗@880, respectively. The babs@870 results were not subject to artifacts associated with filter-based absorption measurement, as they were obtained using in-situ technology. For (babs)∗@880, although the loading effect had been accounted for, other artifacts still existed, which could be attributed mainly to the multiple scattering by the filter fibers and the scattering by the particles embedded in the filter. The experimental setup used in this study did not allow distinguishing the two artifacts. However, their overall effect could be determined by comparing (babs)∗@880 with babs@870. The (babs)∗@880 to babs@870 ratios, which will be termed C∗, generally exhibited a normal distribution for the spring campaign, with a mean of 2.67 and a standard deviation of 0.54 (Fig. S1 in the Supplement). The values suggested that the overall effect of multiple scattering and aerosol scattering resulted in a significant overestimation of light absorption by (babs)∗@880. Further investigations indicated that the variation of C∗ was closely related to SSA (Figs. 2 and S2; Table 1). The median C∗ was as low as 1.24 for the lower end of SSA (below 0.60) encountered in the spring campaign. Then C∗ increased sharply as SSA became higher, e.g., with a median of 2.06 for the SSA range of 0.65–0.70. However, the variation of C∗ was largely flattened when SSA further increased. For example, compared to that observed for the SSA range of 0.65–0.70, the median C∗ was only ∼ 0.4 higher when SSA reaching 0.80-0.85. Finally, with increasing SSA, the increase of C∗ became sharp again, e.g., with a median C∗ of 3.27 for the higher end of SSA (0.95–1.00). The clear dependence of C∗ on SSA suggested the limitation of using a fixed value for the scattering-associated correction in filter-based absorption measurement. To enhance the relevance of time-resolved C∗ to future studies, the median values of C∗ were presented in Table 1 for various SSA bins (from below 0.60 to above 0.95), which covered the typical SSA levels observed for ambient conditions. We applied the SSA-dependent median C∗ (Table 1) to AE33 and found that the corrected (babs)∗@880 were in reasonable agreement with babs@870 (Fig. 3a), demonstrating the practicability of the SSA-dependent C∗ results.
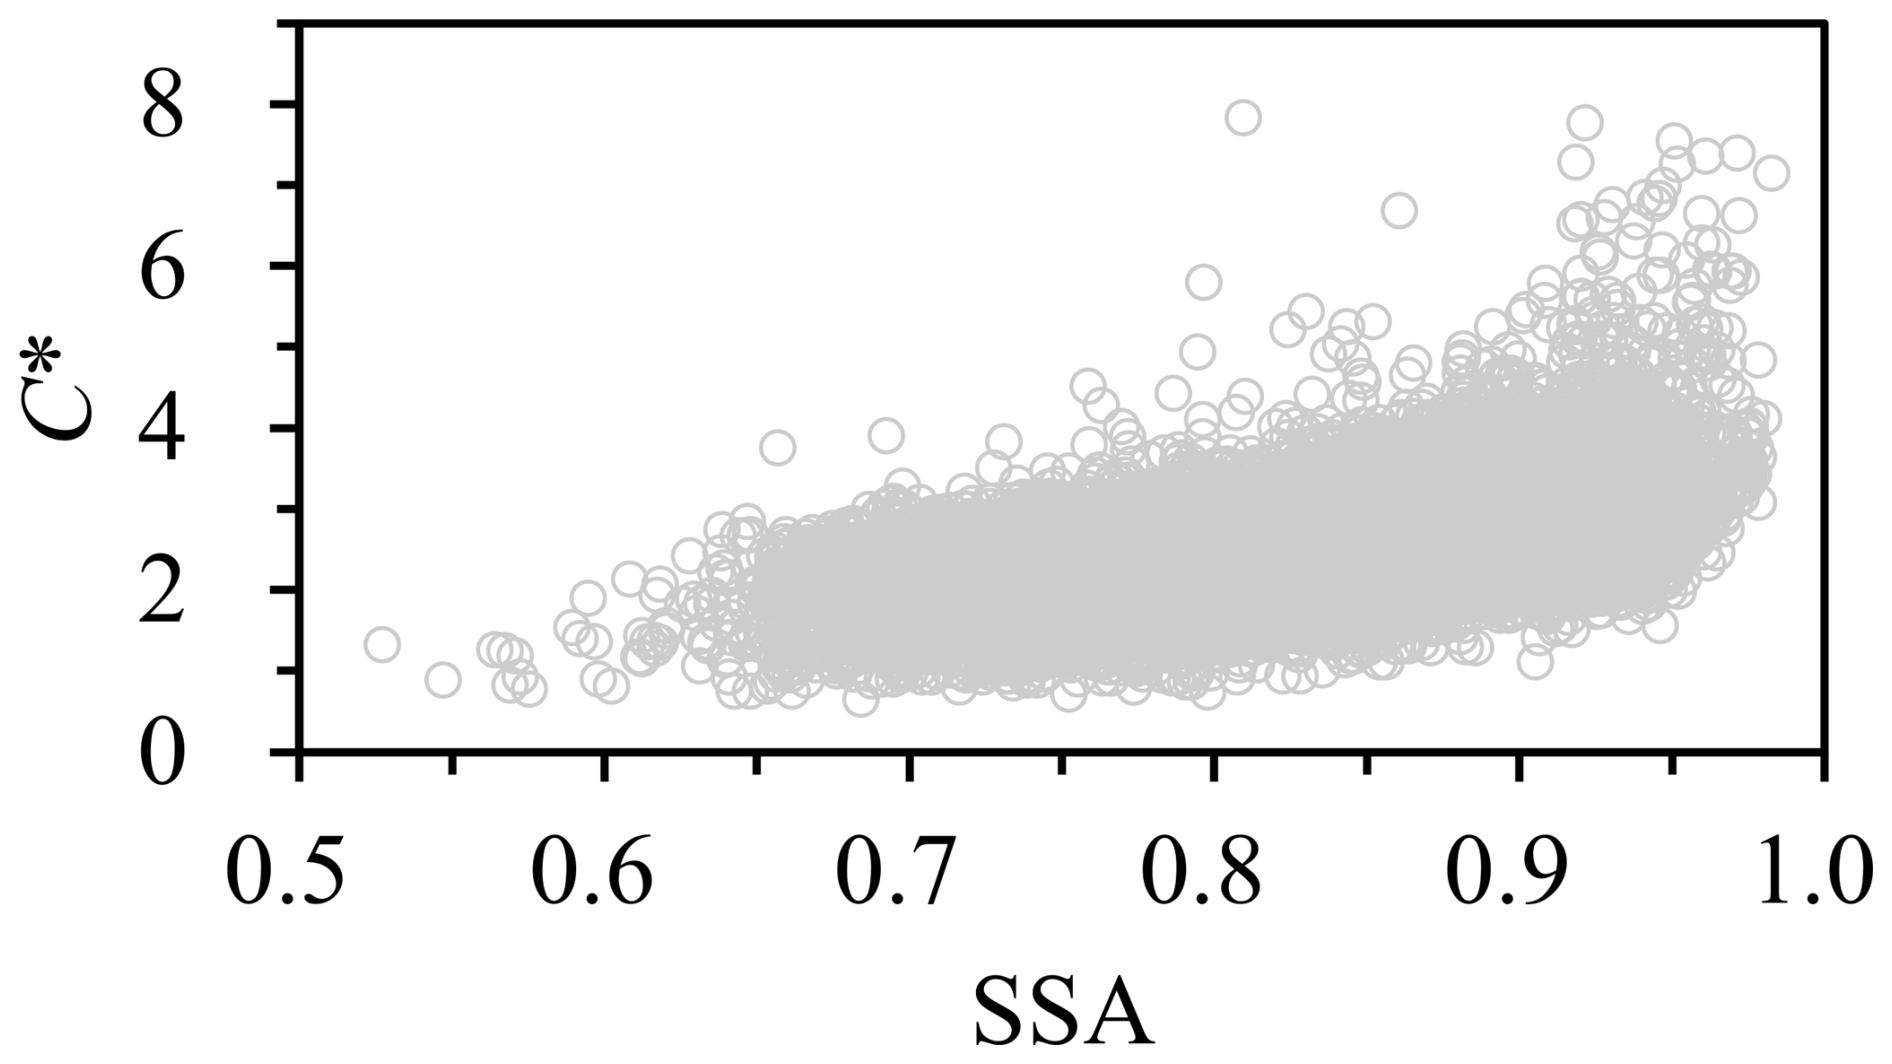
Figure 2Dependence of C∗ on SSA, both of which had a time resolution of 1 min. Results involved in this figure were for the entire measurement period.
Table 1SSA-dependent C* results determined during the spring campaign.
We then compared the light absorption coefficients determined by the AE33 and off-line carbon analyzer. The off-line results, which were obtained at 632 nm with no correction, will be specified as (babs)#@632. To align with (babs)#@632, the AE33-based absorption coefficients at the same wavelength, i.e., (babs)∗@632, were converted from the directly-measured (babs)∗ at 660 nm using AAEbulk, which described the wavelength dependence of (babs)∗. The time-resolved (babs)∗@632 results were first averaged for the filter sampling segments and then compared to the off-line (babs)#@632. As shown in Fig. 3b, the off-line measurements always resulted in higher absorption coefficients compared to AE33, and their relationship could be approximated by the following linear function: ( ( (r=0.98). As the differences in measurement wavelength and time resolution had been accounted for, a likely cause for the observed discrepancies was the difference in filter media used by the two instruments. As stated in the Methods section, the carbon analyzer used quartz filters, whereas the AE33 was operated with M8060 filter tapes. Although the material of M8060 was not specified by the AE33 manufacture, the multiple scattering correction factors of M8060 were determined to be generally comparable with the previously used M8020 (i.e., PTFE-coated glass-fiber filter), e.g., with relative standard deviations of within 5 % for different types of sites in Europe (Yus-Díez et al., 2021). Field campaigns conducted at various locations suggested that compared to M8020, quartz filter showed stronger multiple scattering effect and thus required a higher correction factor, e.g., 2.14 vs. 1.57 for the fresh aerosols in Klagenfurt, Austria (Drinovec et al., 2015) and 3.43 vs. 2.64 for the aged aerosols in Milan, Italy (Ferrero et al., 2021). This indicated that when running two AE33 side-by-side with different filter media, quartz filter would lead to higher (babs)∗ than M8020, by factors of about 1.3–1.4. A comparable discrepancy was observed in St. Louis for the absorption coefficients measured by quartz and glass-fiber filters, which differed by a factor of 1.41 (Snyder and Schauer, 2007). These ratios (∼ 1.3–1.4) were close to the slope shown in Fig. 3b, indicating that the (babs)#@632 vs. (babs)∗@632 discrepancies could be attributed primarily to the use of different types of filters in off-line and on-line measurements. In addition, it was noticed that the linear dependence of (babs)#@632 on (babs)∗@632 did not hold for the two samples collected on the nights of 1 and 2 April 2023, which showed the highest carbon loadings (above 115 µgC cm−2 for the sum of OC and EC) and ATN levels (exceeding ∼ 2.5) throughout the campaign. For these two heavily-loaded samples, the ratios of (babs)#@632 to (babs)∗@632 were only 1.27 and 1.18, respectively. It appeared that the absorption coefficients derived from the carbon analyzer could be biased low at high filter loadings. This artifact was to some extent similar to the loading effect in the Aethalometer measurement but seemed unapparent at relatively low filter loadings.
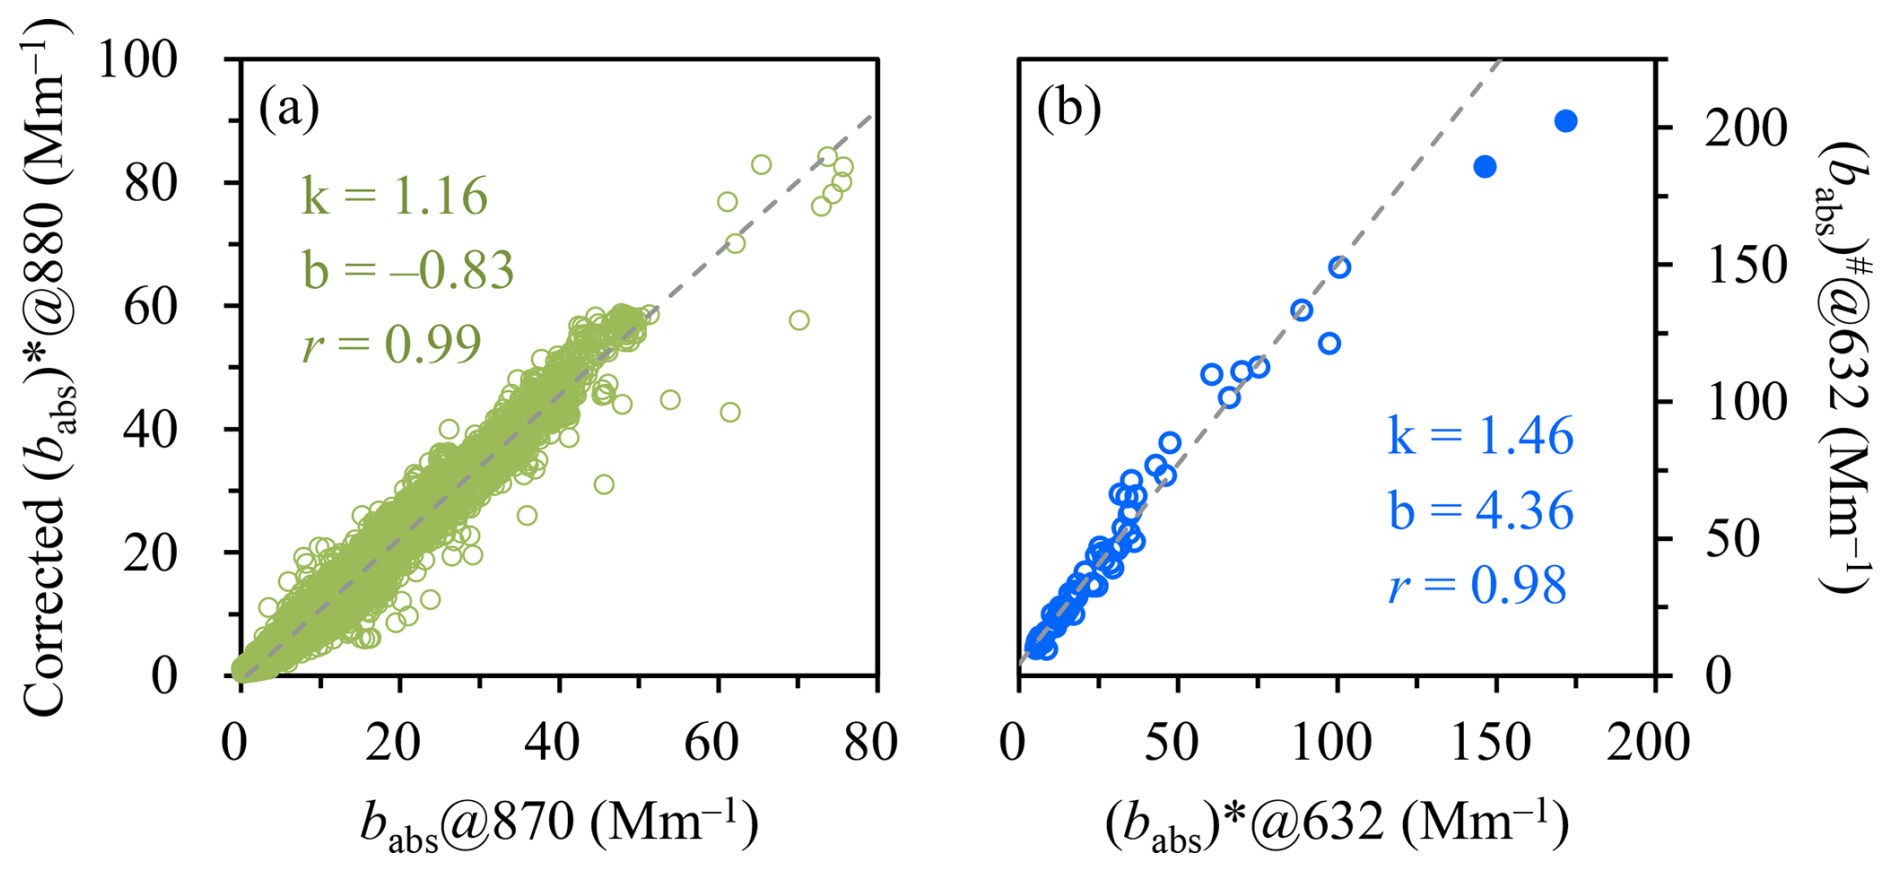
Figure 3(a) Comparison of the corrected (babs)∗@880 and the PAX-based babs@870 for the entire measurement period. The two parameters had the same time resolution of 1 min and showed a median RSD (relative standard deviation) of 8.5 %. The correction of (babs)∗@880 was based on the median C∗ values in Table 1. (b) Comparison of (babs)#@632 and (babs)∗@632. The former was directly derived from the carbon analyzer without any correction, while the latter was obtained by extrapolating the AE33-based (babs)∗@660 to 632 nm. In (a) and (b), the dashed lines indicate the linear regression results with k as the slope and b as the intercept. In (b), the linear dependence did not hold for two heavily loaded filters which were highlighted by the solid circles.
We also compared the brown carbon results measured by the AE33 and off-line (i.e., methanol extraction) approaches. It has been widely accepted that methanol could dissolve the vast majority (e.g., ∼ 90 %) of organic aerosol, making methanol-soluble OC (MSOC) a frequently-used surrogate for BrC (Laskin et al., 2015, 2025). The absorption coefficients of MSOC, which were directly measured, will be primarily investigated at 365 nm and the corresponding results will be termed (babs)MS-BrC@365. For AE33, the absorption coefficient of BrC at 370 nm was calculated as:
In Eq. (1), (babs)@370 and (babs)@880 indicate the absorption coefficients at 370 and 880 nm, respectively, both of which had been corrected for the scattering-associated artifacts using the C* values in Table 1; AAEBC is the absorption Ångström exponent of black carbon, a parameter describing the wavelength dependence of BC-induced light absorption. Two assumptions were involved in the calculation, including (i) the light absorption coefficient measured at 880 nm could be attributed only to black carbon and (ii) the coefficients observed at shorter wavelengths could be broken down into the contributions from BC and BrC (Lack and Langridge, 2013). A variety of AAEBC were tested in this study, first from 0.7 to 1.4 with an increment of 0.05. As shown in Fig. 4, the AE33-based (babs)BrC@370 and the solution-based (babs)MS-BrC@365 kept strong correlation (with r staying above 0.99) regardless of the values assumed for AAEBC. In addition, when increasing the AAEBC from 0.7 to 1.4, the regression slope decreased slowly from 1.52 to 1.24 whereas the intercept changed sharply from +3.16 to −2.56. The intercept turned from a positive value into negative when the AAEBC was changed from 1.05 to 1.10. Thus we further tested various AAEBC values in this range with a smaller increment of 0.01. The intercept was found to be closest to zero () for an AAEBC value of 1.10 (Fig. S3), e.g., compared to an intercept of for an AAEBC of 1.09. It appeared that a reasonable correlation could be reached for the on-line and off-line BrC results by assuming AAEBC=1.10. However, a slope of 1.38 retrieved under this assumption suggested that the AE33-based absorption coefficients of BrC were considerably higher than results from the methanol extracts of filter samples. This discrepancy should be associated with the states of the measured BrC, since particulate brown carbon has been found to show higher absorption coefficients than dissolved BrC (Liu et al., 2013; Washenfelder, et al., 2015). Another likely cause for this discrepancy was the OC insoluble in methanol (MIOC), which could be a considerable contributor to BrC absorption but was missed by the solution-based approach for BrC determination (Atwi et al., 2022).
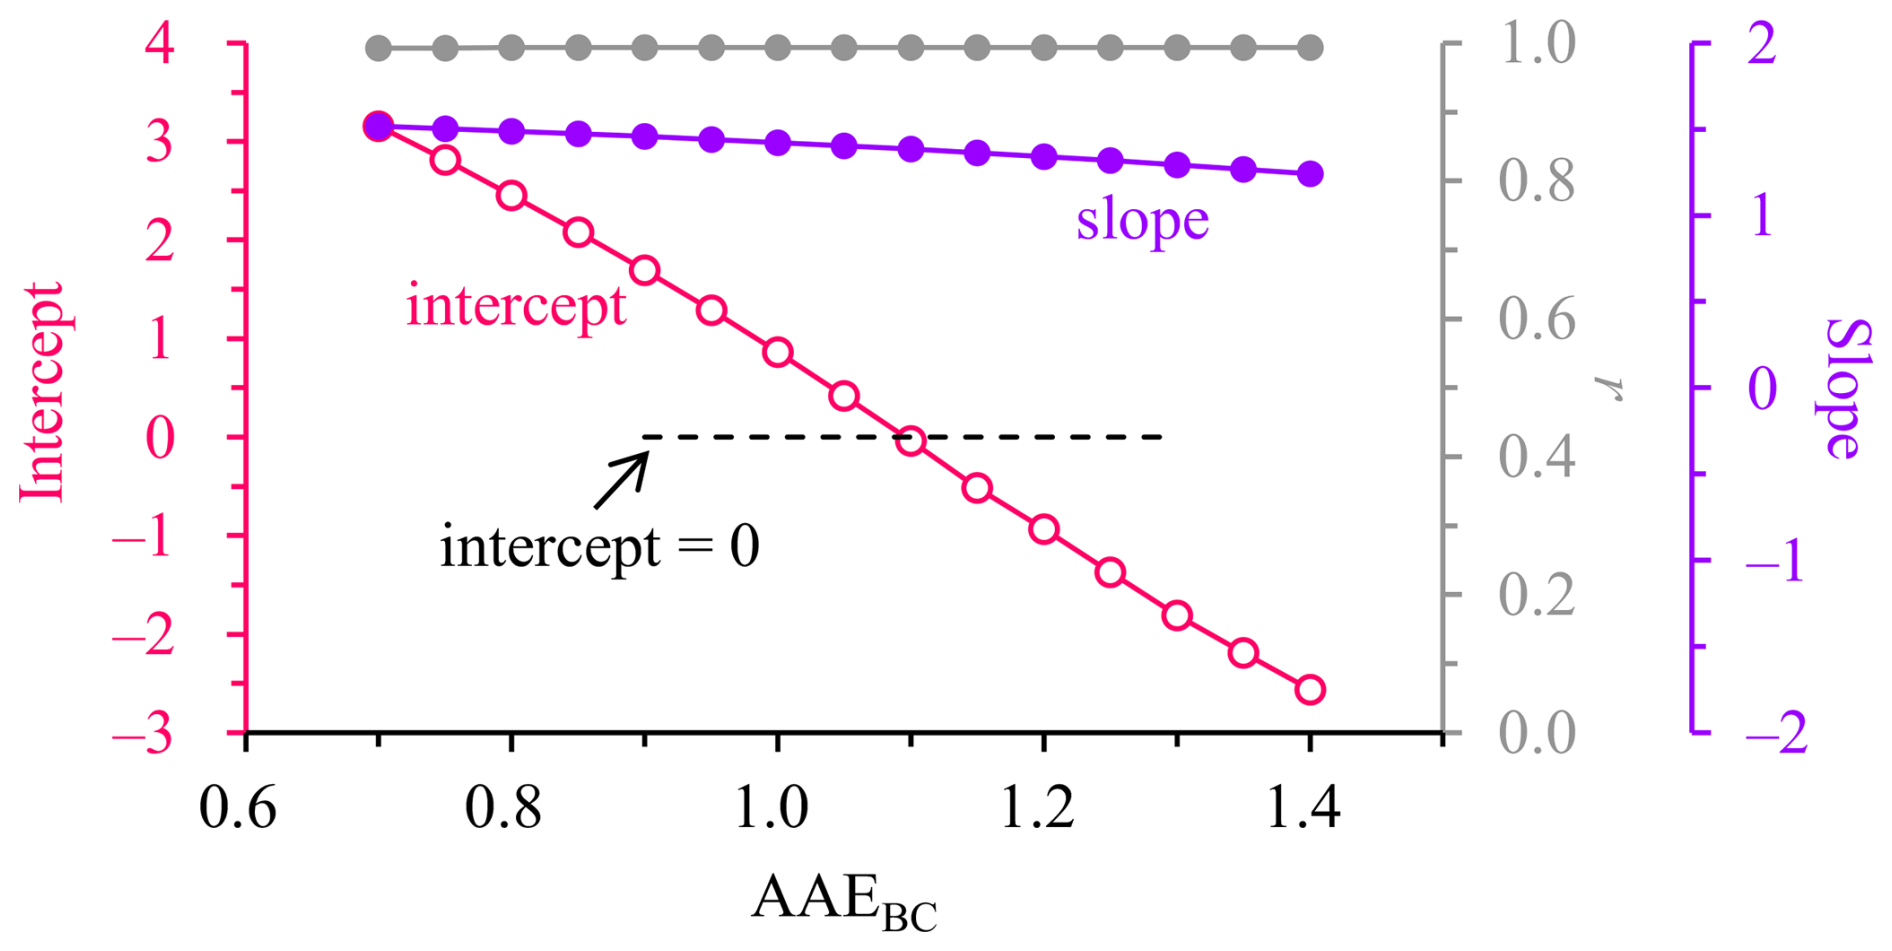
Figure 4Slope, intercept and r determined by regressing the AE33-based (babs)BrC@370 against the solution-based (babs)MS-BrC@365. Different AAEBC values were assumed to retrieve the time-resolved (babs)BrC@370, which were first averaged for the filter sampling segments and then used for the regression.
3.2 Identification of different episodes
There have been numerous evidences suggesting pronounced influences of aerosol sources on the mass absorption efficiency of brown carbon (MAEBrC), which is defined as the ratio of BrC's absorption coefficient to its mass concentration. For example, regarding seasonal variations, MAEBrC typically peaked in winter due to increased emissions from coal combustion and/or biomass burning (Mo et al., 2024). In addition, MAEBrC were found to show diurnal variations with higher nighttime levels during winter in Northeast China, and this pattern was inferred to be driven primarily by the emissions from heavy-duty diesel trucks, which were allowed to operate only at night for the main urban area (Cheng et al., 2023). Spatial variations were also evident for MAEBrC, e.g., water-soluble BrC, which was strongly associated with SOA, was observed to be more absorbing in Los Angeles compared to Atlanta (Zhang et al., 2011). In that study, SOA were traced back mainly to anthropogenic VOCs for Los Angeles, and to biogenic precursors for Atlanta. The authors then speculated that secondary BrC from anthropogenic precursors likely had stronger capacities of light absorption compared to biogenic SOA, while this inference was confirmed shortly by chamber studies (Lambe et al., 2013; Liu et al., 2016).
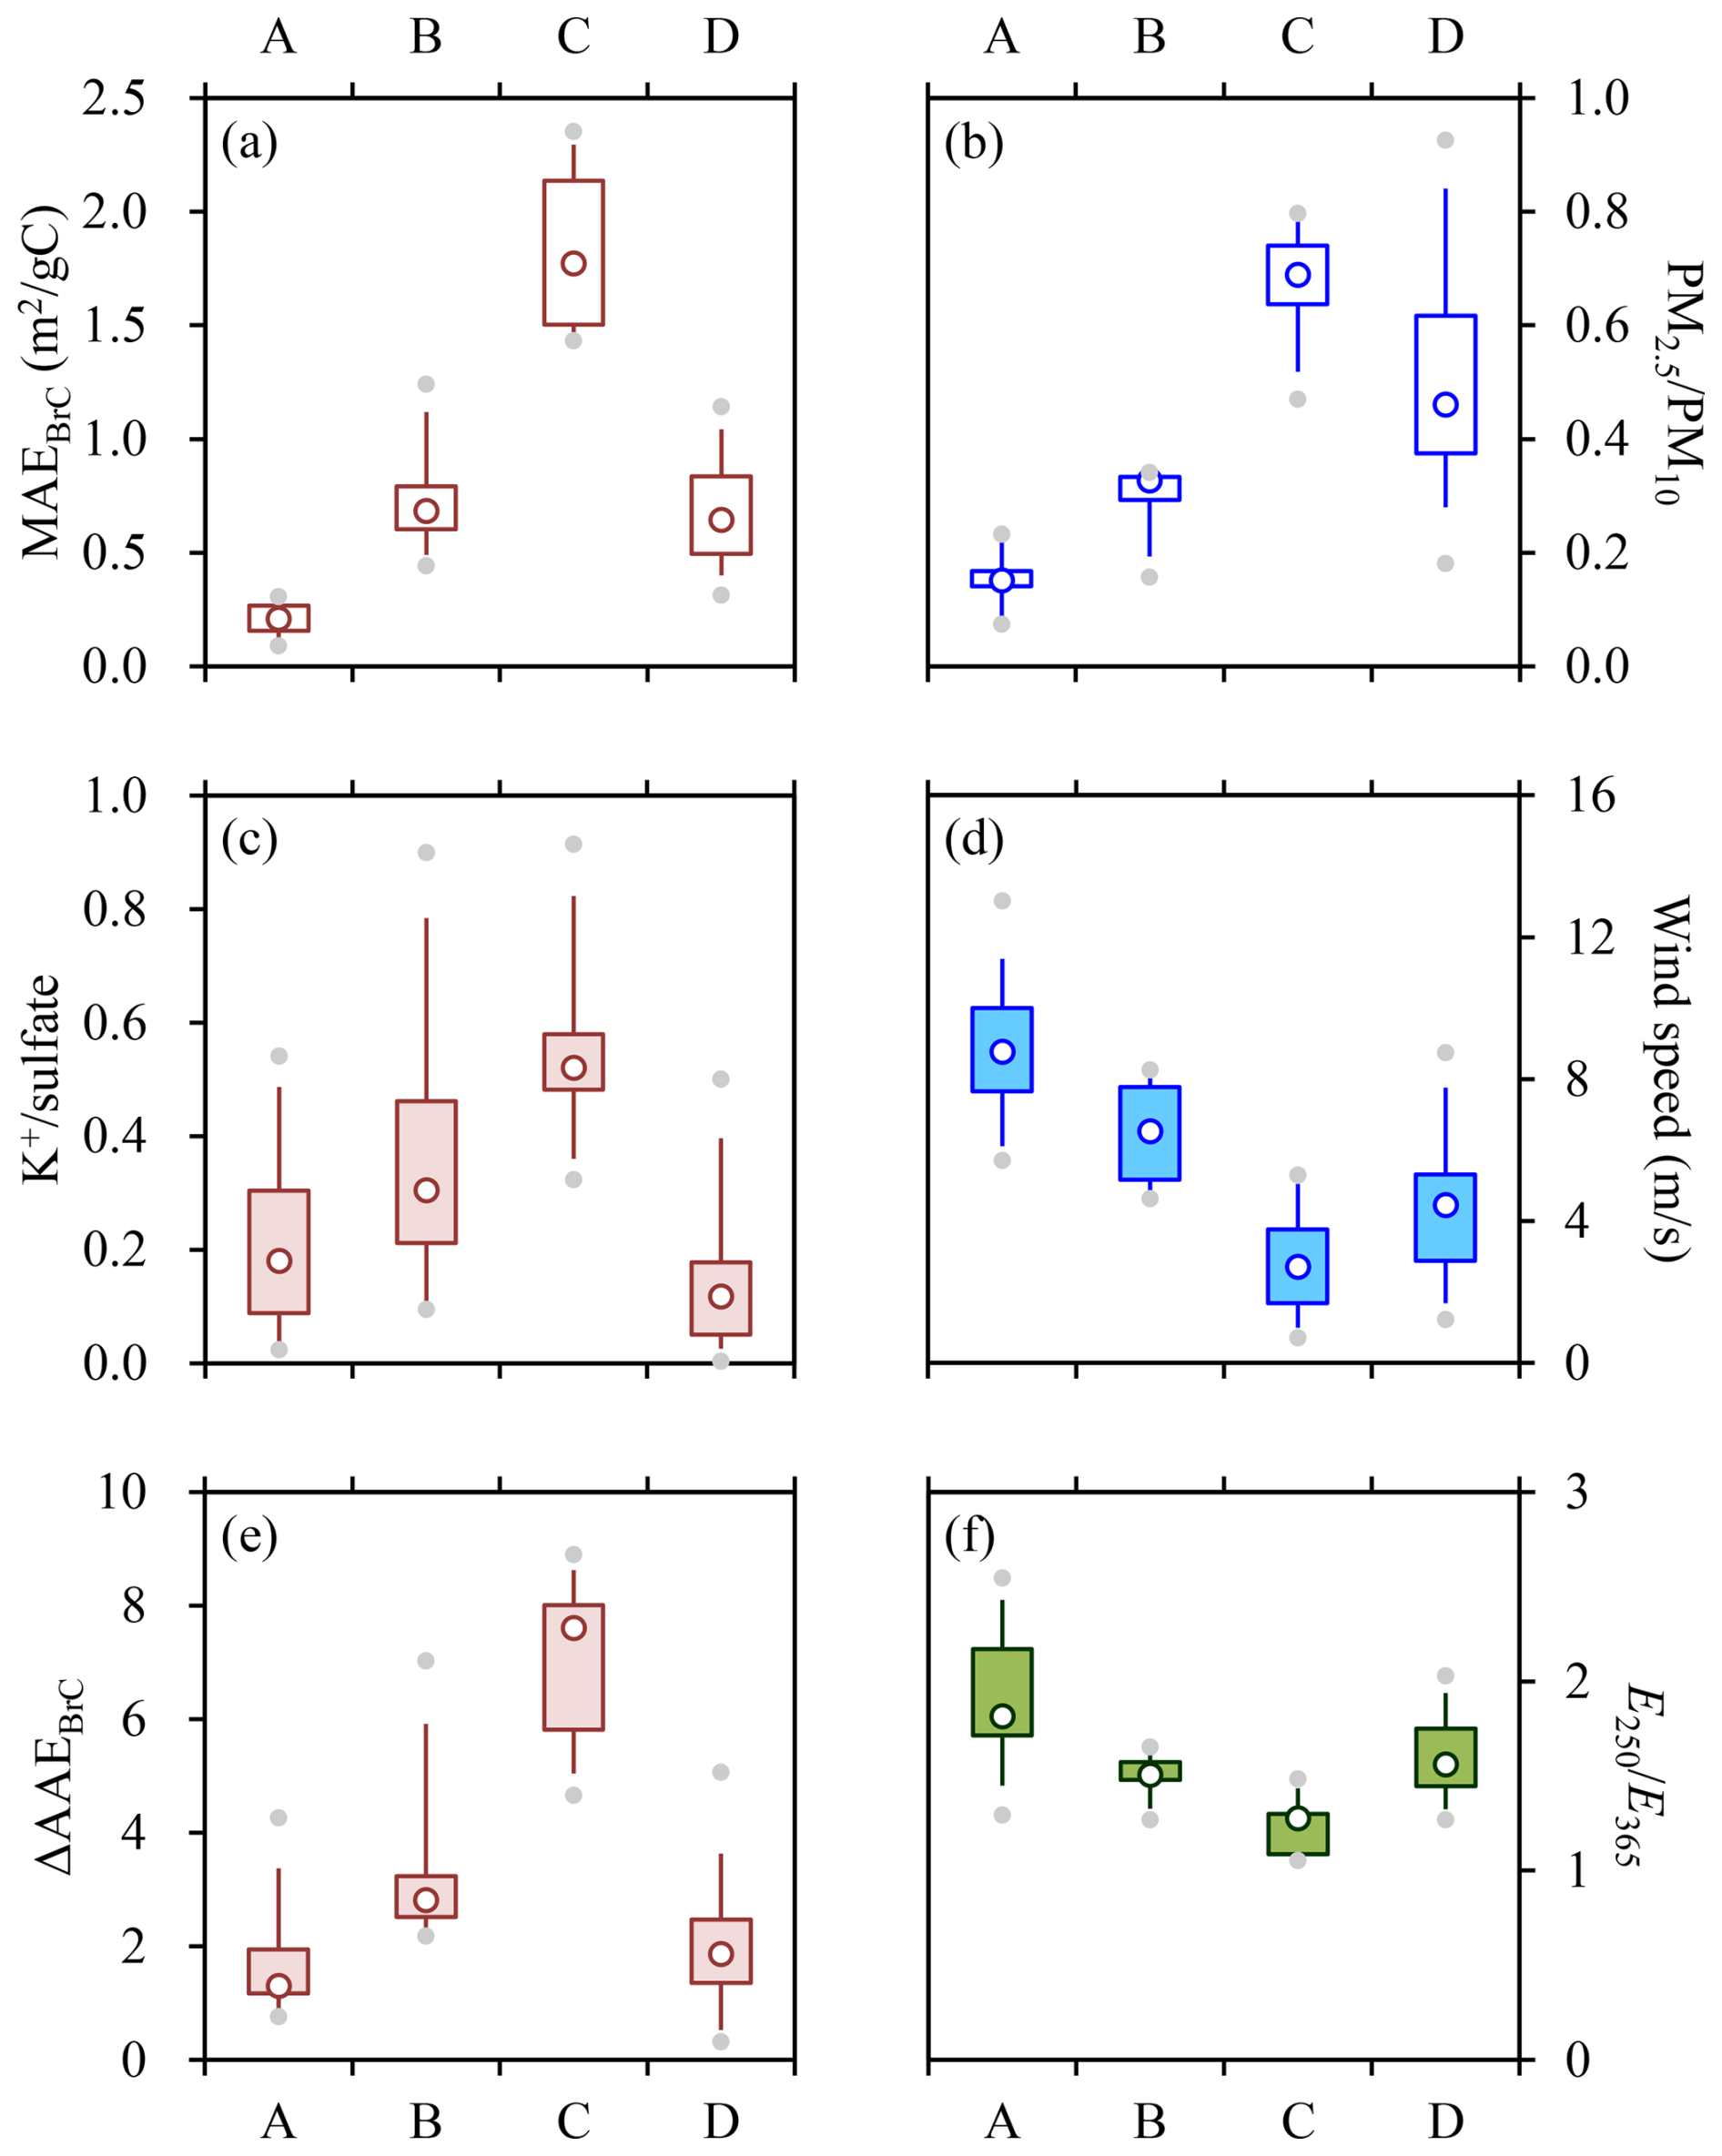
Figure 5Variations of (a) MAEBrC, (b) PM2.5 PM10, (c) K+ sulfate, (d) wind speeds, (e) ΔAAEBrC and (f) across cases of A–D, which correspond to the dust-impacted, fire&dust-impacted, fire-impacted and typical samples, respectively. Lower and upper box bounds indicate the 25th and 75th percentiles, the whiskers below and above the box indicate the 5th and 95th percentiles, the solid circles below and above the box indicate the minimum and maximum, and the open circle within the box marks the median.
Given its close association with aerosol sources, in this study, MAEBrC was first investigated to distinguish different types of pollution episodes. To avoid the omission of MIOC contribution, we applied the bulk BrC light absorption from AE33 and calculated MAEBrC as the ratio of (babs)BrC@370 to OC. For each filter sample, the off-line OC was used as BrC mass while the corresponding BrC absorption coefficient took the average of the AE33-based results during the filter sampling period. The MAEBrC results were found to vary significantly (from 0.12 to 3.23 m2 gC−1) during the spring campaign, pointing to changeable drivers for the haze pollution. Two groups of samples were most noticeable, showing MAEBrC levels at the lower and higher ends of the spring results, respectively. The first group (N=13, case A in Fig. 5) had a MAEBrC range of 0.12 to 0.40 m2 gC−1 (Fig. 5a), and the samples exhibited the following characteristics (Fig. 5b–d): relatively low ratios of PM2.5 to PM10 (0.15 in terms of median value; same hereafter), relatively high wind speeds (8.77 m s−1), and relatively low ratios of K+ to sulfate (0.18). The PM2.5 to PM10 ratio (PM2.5 PM10) was strongly related to the dust influence, typically with a decreasing trend as the dust impact became stronger (Putaud et al., 2010). Thus for the first group of samples, the reduced PM2.5 PM10 together with the elevated wind speeds presumably indicated considerable influences of dusts. In addition, observational results from Northeast China suggested that agricultural fires could effectively enhance the abundances of K+ but was not a significant contributor to sulfate (Cheng et al., 2021), resulting in spikes of K+ to sulfate ratios (K+ sulfate) that typically coincided with the peaks of levoglucosan to OC ratios (LG OC). Thus similar to increased LG OC, enhanced K+ sulfate could also be used as an indicator for agricultural fires. Conversely, reduced K+ sulfate could be translated into little impact of open burning. The clear association between K+ sulfate and agricultural fires was also supported by the contrasting fire hotspot detection results between periods with different K+ sulfate levels (Fig. S4). Then based on a synthesis of PM2.5 PM10, wind speed and K+ sulfate, it was concluded that the first group of samples were subject to strong influences of dusts but insignificant impacts from agricultural fires. Contrasting to the first group, the second group of samples (N=8, case C in Fig. 5) accompanied with the higher-end MAEBrC values (1.75–3.23 m2 gC−1) showed quite different features (Fig. 5a–d), including higher PM2.5 PM10 (0.69), lower wind speeds (2.71 m s−1) and larger K+ sulfate (0.52). These signatures suggested strong influences of agricultural fires but little impact of dusts. In the following discussions, the first and second groups of samples will be referred to as dust-impacted and fire-impacted ones, respectively.
After excluding the two distinct groups discussed above, the remaining samples showed moderate MAEBrC levels but considerable variations in other signatures. Some of the samples (N=7, the third group; case B in Fig. 5) were heavily polluted in PM10 (∼ 140–305 µg m−3) and exhibited mixed features of the dust-impacted and fire-impacted samples (Fig. 5b–d), with the median values of all the three signatures (i.e., PM2.5 PM10, wind speed and K+ sulfate) falling in-between the first two groups. The other samples (N=35, the fourth group; case D in Fig. 5) had substantially lower PM10 (averaging 53.45±29.78 µg m−3) and were characterized by pretty low K+ sulfate (0.12), and moderate levels of both PM2.5 PM10 (0.46) and wind speeds (4.44 m s−1). It appeared that neither agricultural fires nor dusts exerted a strong influence on these samples, which could thus be used to represent the typical conditions of the spring campaign. In the following discussions, the third and fourth groups of samples will be termed fire&dust-impacted and typical ones, respectively. For different group of samples (i.e., cases A–D), the distributions of their sampling segments were highly irregular during the spring campaign (Fig. S5), suggesting dramatic variations of aerosol sources for the measurement period.
The identification of the four groups was also supported by the spectral measurement results from the methanol extracts of filter samples. It has been commonly recognized that light absorption by brown carbon exhibits stronger wavelength (λ) dependence compared to black carbon, leading to larger absorption Ångström exponent of BrC (AAEBrC). Using the solution-based light absorption spectra, AAEBrC could be determined as the slope derived from the linear regression of ln[(babs)MS-BrC] against ln(λ). As shown by our previous study in Northeast China, when the agricultural fire impact was insignificant, ln[(babs)MS-BrC] exhibited a strong linear correlation with ln(λ) and thus AAEBrC could be readily determined over a relatively wide wavelength range of 310–460 nm (Cheng et al., 2023). During agricultural fire episodes, however, the dependence of ln[(babs)MS-BrC] on ln(λ) tended to be non-linear, since the fire-emitted chromophores could result in a distinct absorption peak at ∼ 365 nm (Cheng et al., 2023). The non-linear correlation between ln[(babs)MS-BrC] and ln(λ) was also evident for the fire-impacted samples in this study. To quantitatively describe the non-linearity, we calculated the difference in AAEBrC over two wavelength ranges (i.e., 410–460 and 310–360 nm) and defined this difference as ΔAAEBrC (Fig. S6). As shown in Fig. 5e, different groups of samples indeed showed considerable discrepancies in ΔAAEBrC. For example, the ΔAAEBrC levels were found to be highest for the fire-impacted samples (7.60 in terms of median value), moderate for the fire&dust-impacted samples (2.81), and lowest for the dust-impacted samples (1.30). In addition, ΔAAEBrC differed significantly between the fire&dust-impacted and typical samples (2.81 vs. 1.86), demonstrating the necessity for further distinguishing the two groups of samples despite their comparable MAEBrC levels.
Another diagnostic parameter that could be derived from the light absorption spectra of MSOC was the ratio of (babs)MS-BrC at 250 nm to that at 365 nm, which was usually termed . This ratio was proposed as an indicator for the chemical properties of the dissolved organics, e.g., higher typically indicated smaller molecular sizes and lower aromaticity (Duarte et al., 2005; Chen et al., 2019). In this study, exhibited a clear decreasing trend across the dust-impacted, fire&dust-impacted and fire-impacted samples (Fig. 5f), i.e., with increasing impacts of agricultural fires. On one hand, this trend confirmed the heterogeneity of different groups of samples, from the perspective of the chemical properties of MSOC. On the other hand, this trend suggested that compared to those associated with dusts, the fire-emitted organic compounds were likely characterized by higher molecular weights and higher aromatic contents, which should be highly responsible for the strong light absorption capacities of the fire-impacted samples.
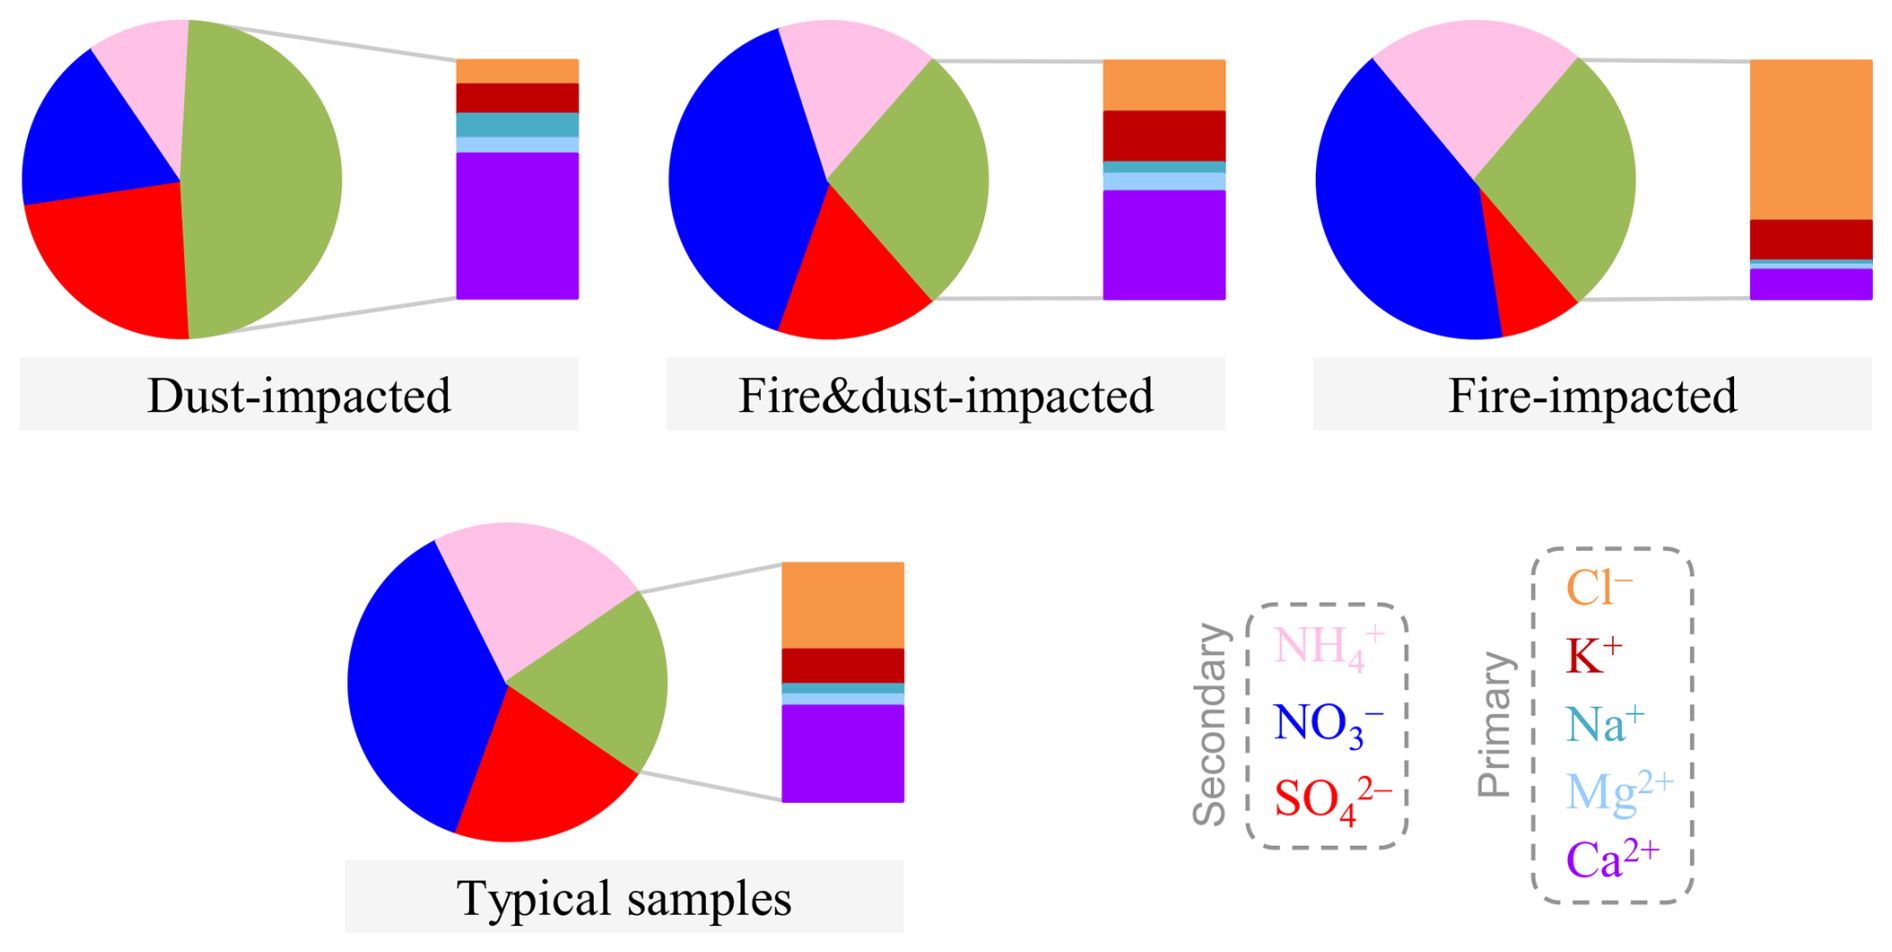
Figure 6Comparison of water-soluble ion compositions across the dust-impacted, fire&dust-impacted, fire-impacted and typical samples. In each pie chart, the unlabeled fraction indicates the sum of the primary ions.
3.3 Comparison of inorganic species across different episodes
Figure 6 compares the compositions of water-soluble inorganic ions among different groups of samples. The ions were broadly separated into secondary species (i.e., sulfate, nitrate and ammonium) and primary components (i.e., Cl−, K+, Na+, Mg2+ and Ca2+). Based on the ion concentrations averaged for each group, the dust-impacted samples were found to differ significantly from the other ones in three aspects, including higher fraction of primary species in total ions (48% vs. <30 %), larger contribution of Ca2+ to primary ions (61 % vs. <45 %) and higher ratio of sulfate to nitrate (1.31 vs. <0.6). The fire-impacted samples also exhibited several distinct features, including the dominant contribution of Cl− to primary ions (68 % vs. <40% for the other groups) and the remarkably high ratio of nitrate to sulfate (4.73). Actually, the fraction of Ca2+ in primary ions showed a clear decreasing trend across the dust-impacted, fire&dust-impacted and fire-impacted episodes (from 61 % to 12 %), while an opposite trend was observed for the fraction of Cl− (from 10 % to 68 %). These patterns were not surprising, since Ca2+ and Cl− had been commonly identified in dust and agricultural fire emissions, respectively (Bi et al., 2019). One may argue that Cl− should be used in Sect. 3.2 for the separation of samples into different groups. Besides open burning, however, there existed other important sources for Cl− (Bi et al., 2019), e.g., coal combustion. Given the relatively low temperatures during the spring campaign (averaging 8.5 and around 0 °C for ∼ 25 % of the samples), coal combustion was expected to contribute considerably. The prevalence of coal combustion emissions was in line with the largely comparable Cl− to sulfate ratios observed for the samples after excluding the fire-impacted ones (Fig. S7). The substantial contribution of Cl− to primary ions (37 %) determined for the typical samples also confirmed the substantial contribution of coal combustion. The discussions above indicated that the relative abundances of Cl− could be used to isolate the periods with strong influences of fires, but were less capable of identifying other episodes (e.g., the fire&dust-impacted samples).
The fire-impacted samples showed significantly higher relative abundance of nitrate compared to sulfate (Fig. 6), likely pointing to enhanced formation of nitrate under strong influences of agricultural fire emissions. This inference was supported by the comparison of nitrogen oxidation ratios (NOR) among different episodes (Fig. 7a). For the typical conditions of spring (i.e., as reflected by the typical samples), NOR generally exhibited an increasing trend as ozone became higher (Fig. 7a), showing larger values (accompanied with elevated ozone) during the daytime (Fig. S8). The positive dependence of NOR on ozone held as well for the fire-impacted samples, all of which occurred at night. However, it is noteworthy that the fire-impacted samples generally showed higher NOR values than the typical ones with comparable ozone levels. Although drivers for the increased NOR remained unclear based on the available observations, it was hypothesized that some distinct dark-reactions occurred in the agricultural fire plumes and ultimately enhanced the nitrate formation. As suggested by results from the laboratory-generated biomass burning smoke (Ahern et al., 2018) and ambient open-burning plume (Decker et al., 2019), such nocturnal processes may include the production of NO3 radicals and N2O5, the heterogeneous transformation of N2O5 into nitrate (e.g., on the surface of the abundant biomass-burning particles), and the reaction of NO3 radicals with biomass burning VOCs (which could result in complex products including nitrate). In addition, for the fire-impacted samples, the conditions with relatively low ratios of NO2 to CO (NO2 CO) seemed more favorable for the enhancement of NOR (Fig. 7b). Results from the laboratory measurement and satellite-based observation of biomass burning smoke suggested that decreased NO2 CO ratios were typically associated with more smoldering combustion, which would emit large amounts of CO but was less favorable for NO2 production (van der Velde et al., 2021; Anderson et al., 2023). Thus the association between elevated NOR and reduced NO2 CO likely indicated that the low-efficiency fires were more favorable for the nocturnal nitrate formation. It should also be noted that NOR exhibited considerable sample-by-sample variations at similarly low levels of NO2 CO (e.g., below ∼ 0.05). A possible explanation was that the NO2 CO values presented in Fig. 7b were the averages of the time-resolved results measured during the fire episodes, and thus were only rough indicators for the overall burning conditions. Another likely cause was that besides the combustion efficiency, there existed other influencing factors for NOR in the fire plumes. The detailed chemical mechanisms for the fire-induced enhancement in nocturnal NOR, including the roles of combustion efficiencies (which are expected to influence the profiles of the fire emissions), merit further investigations.
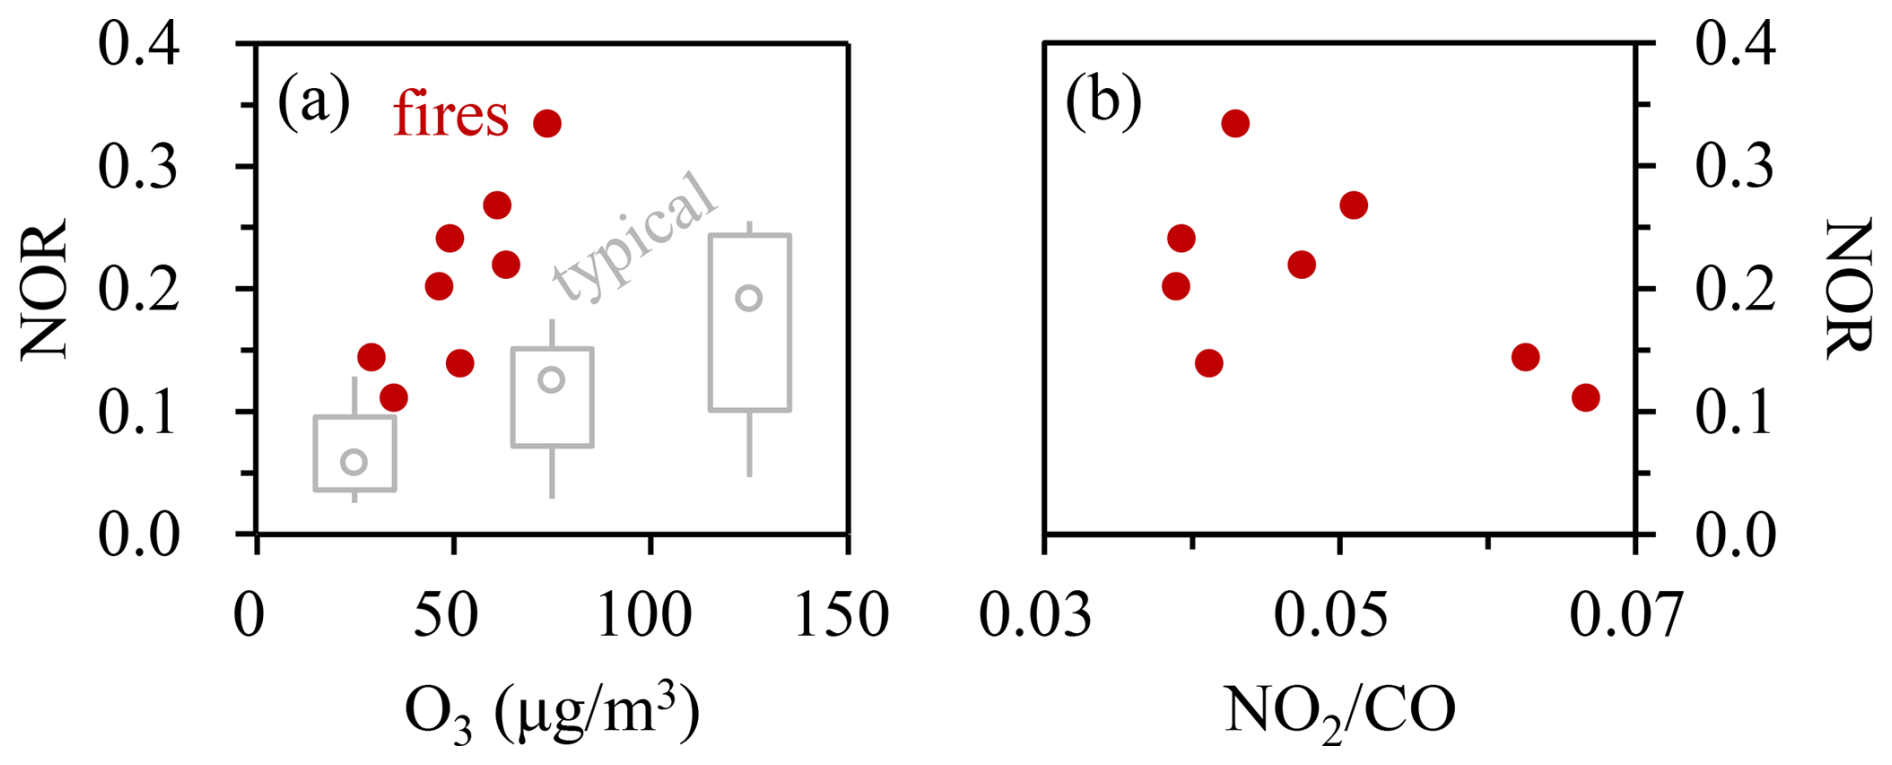
Figure 7Dependences of NOR on (a) ozone (as shown by the solid circles) and (b) NO2 CO for the fire-impacted samples. In (a), results from the typical samples are also presented for comparison, as shown by the overlaying box plot. Here the typical samples were divided into three subgroups with ozone concentrations of below 50, 50–100 and 100–150 µg m−3, respectively. NOR was calculated as n-nitrate/(n-nitrate + n-NO2), where “n” indicates the molar concentration. To align with the off-line nitrate, the time-resolved NO2 were first averaged for the filter sampling segments and then used for the NOR calculation.
3.4 Impacts of open burning and secondary formation on the BrC-related signatures
As discussed in Sect. 3.2, agricultural fire emissions exhibited pronounced influences on MAEBrC, ΔAAEBrC and , by enhancing the light absorption capacity of bulk BrC, emitting distinct chromophores with a characteristic absorption peak at ∼ 365 nm, and producing organic compounds with relatively high molecular weights and aromatic contents, respectively. Besides these signatures, the wavelength dependence of aerosol absorption (AAEbulk) and the relative importance of BrC absorption (primarily investigated at 370 nm as fBrC@370) were also significantly impacted by the fire emissions. Here fBrC@370 was calculated as the ratio of (babs)BrC@370 to (babs)@370, with (babs)@370 obtained by applying the C* values in Table 1 to the AE33 results and (babs)BrC@370 determined by Eq. (1) using an AAEBC of 1.10. As can be seen from Figs. 8a and S9, both AAEbulk and fBrC@370 showed clear increasing trends as the fire impacts became stronger. For example, the median AAEbulk increased substantially across the dust-impacted, fire&dust-impacted and fire-impacted samples (from 1.50 to 2.45). Meanwhile, the median fBrC@370 was enhanced by 2.5 folds, from 28 % to 70 %. These patterns were not surprising, given the significance of biomass burning as a BrC source (Washenfelder et al., 2015) and the fact that the light absorption by BrC typically shows stronger wavelength dependence, i.e., increases more sharply towards shorter wavelengths, compared to BC. In addition, it appeared that AAEbulk could be considered as an alternative estimate for the BrC contribution to aerosol absorption, since a consistent dependence of fBrC@370 on AAEbulk was observed for different episodes, regardless of the variations of aerosol sources (Fig. 8b).
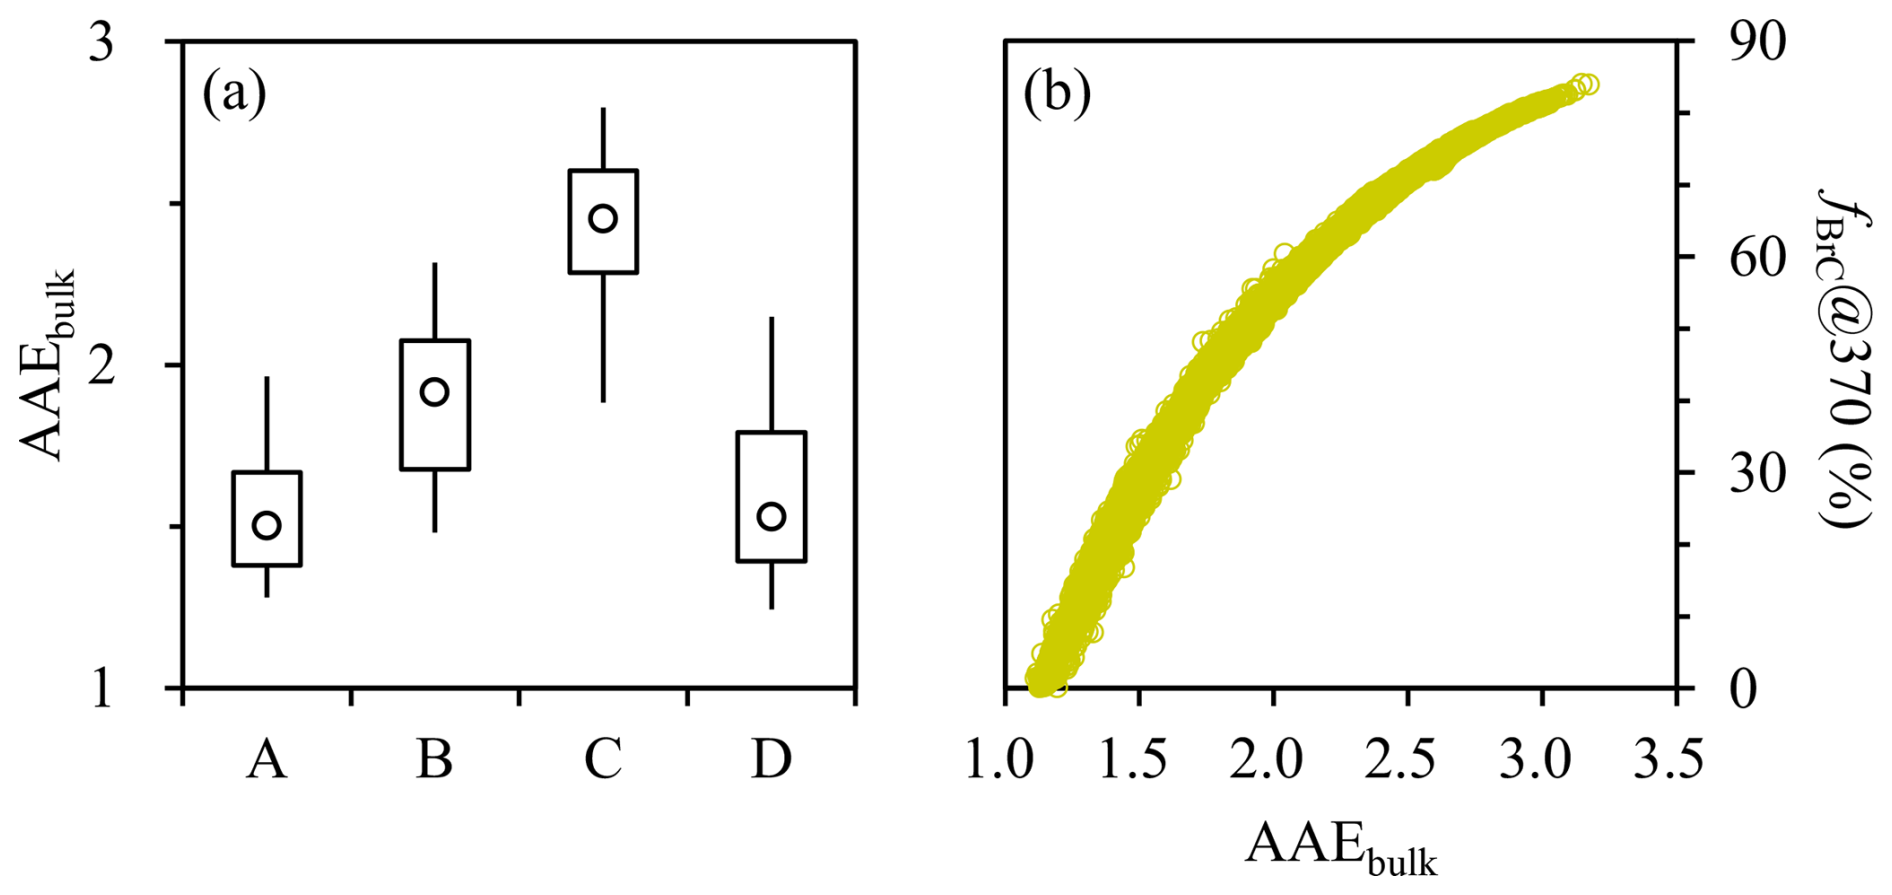
Figure 8(a) Variation of AAEbulk across cases of A–D, which correspond to the dust-impacted, fire&dust-impacted, fire-impacted and typical samples, respectively. (b) Relationship between fBrC@370 and AAEbulk (results from different cases were not distinguished). Time-resolved AAEbulk and fBrC@370 were first extracted for the filter sampling segments and then used for the comparisons.
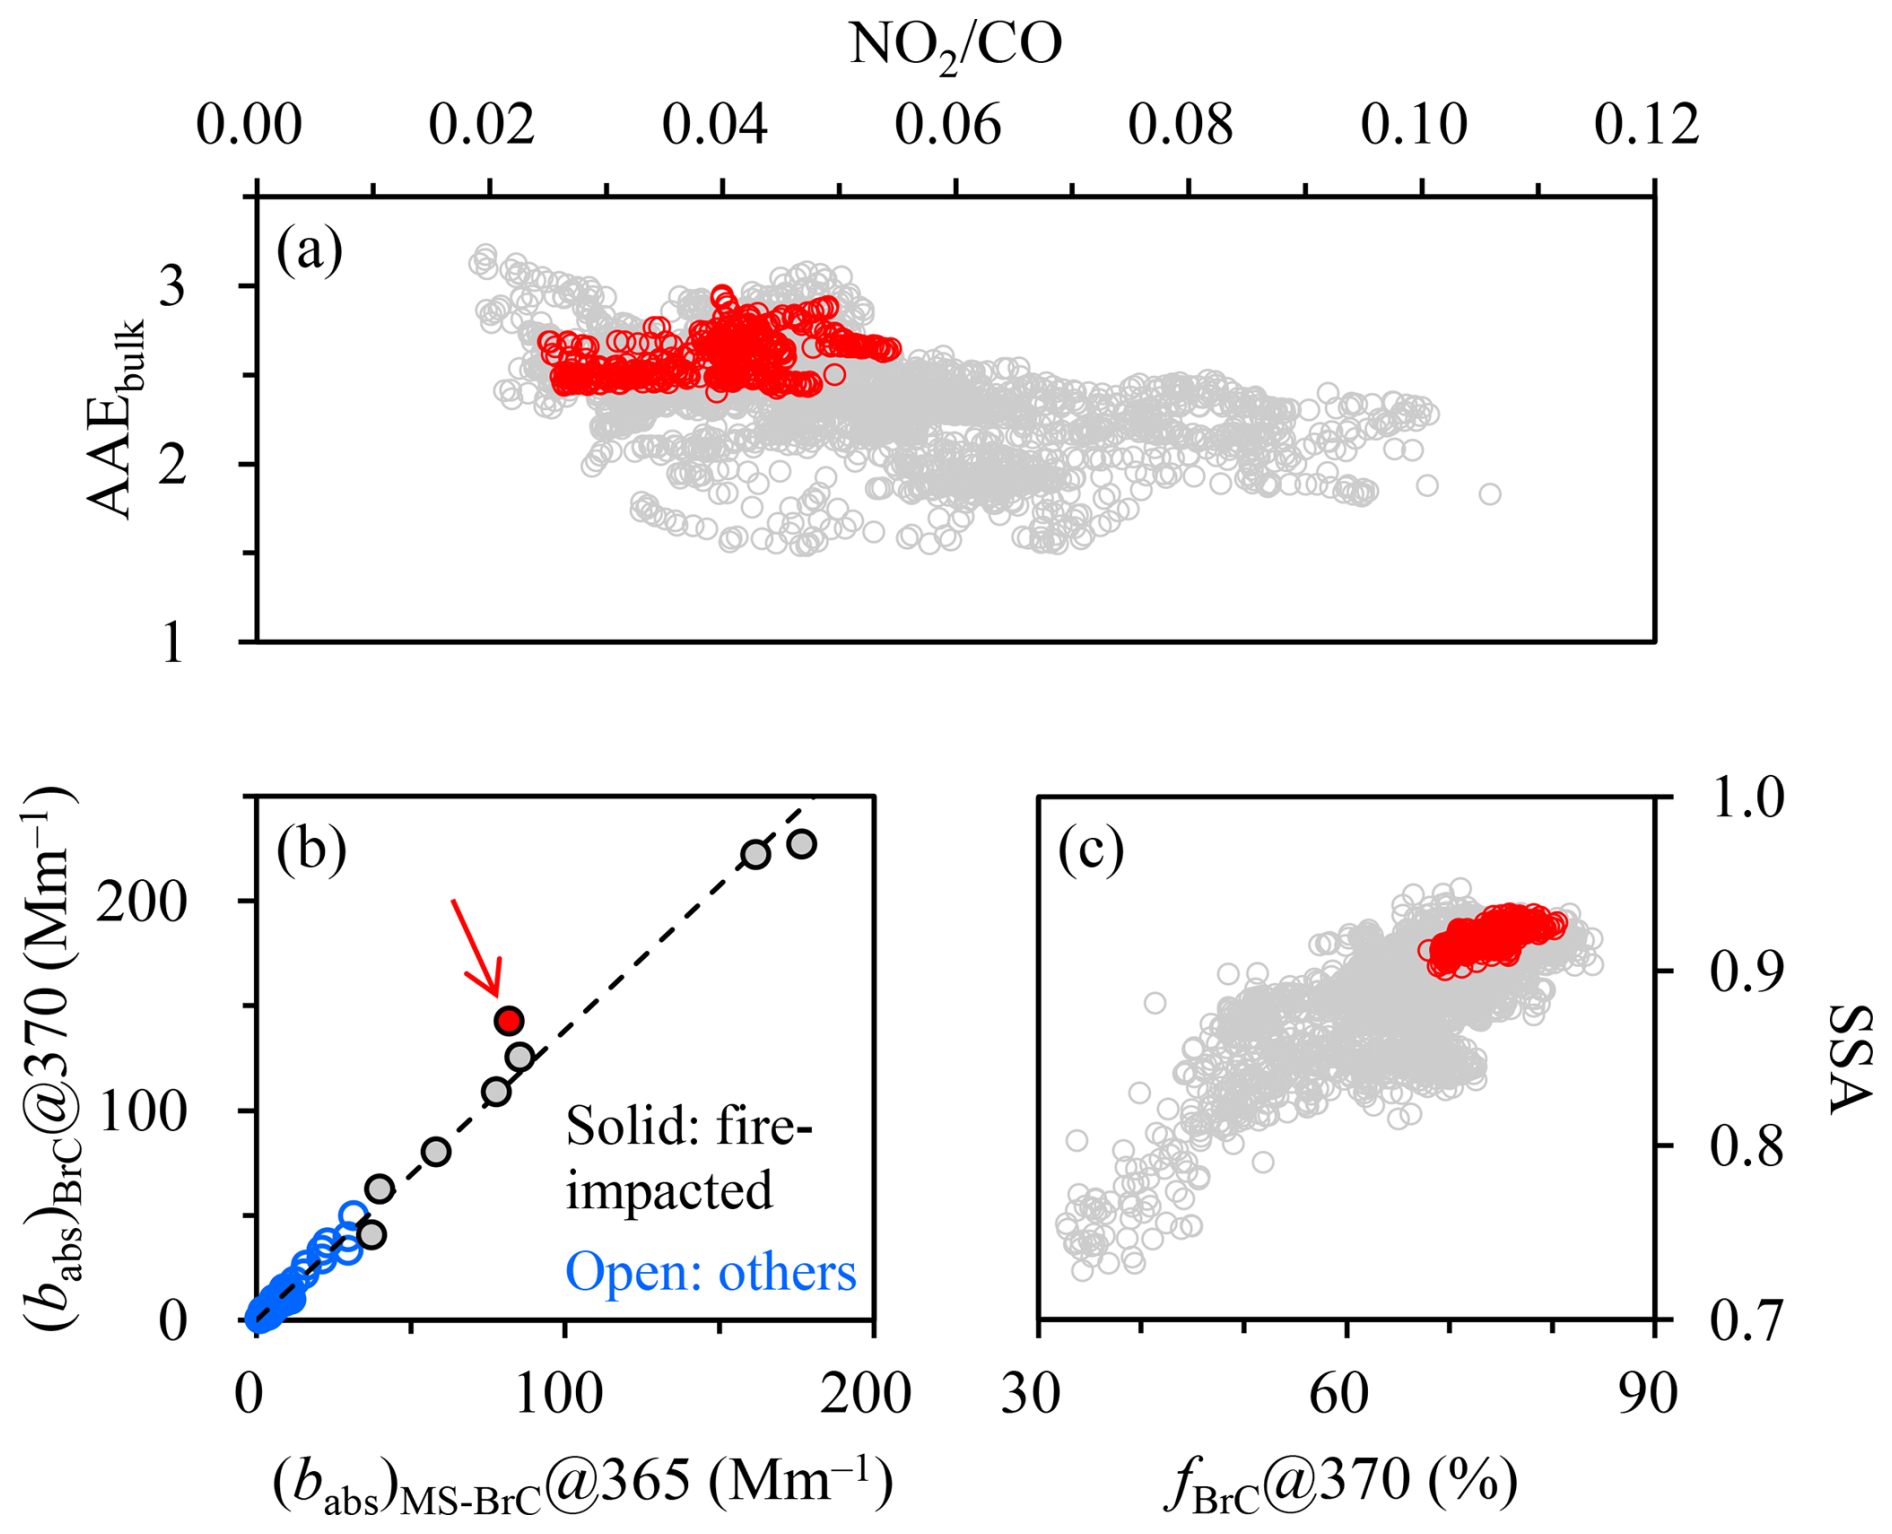
Figure 9(a) Relationship between time-resolved AAEbulk and NO2 CO for the fire episodes. (b) Comparison of the AE33-based (babs)BrC@370 and the filter-based (babs)MS-BrC@365. (c) Relationship between time-resolved SSA and fBrC@370 for the fire episodes. In (b), results from the fire-impacted and other samples were shown separately, while the dashed line indicates the linear regression result determined based on all of the spring samples. The sample collected on the night of 15 April 2023 was indicated by the arrow. In (a) and (c), results during the collection period of this specific sample were also highlighted, as shown by the red data points.
For the agricultural fire episodes, AAEbulk generally exhibited a negative dependence on the ratio of NO2 to CO, e.g., elevated AAEbulk usually occurred at relatively low NO2 CO levels (Fig. 9a). Recalling the association between decreased NO2 CO and more smoldering combustion, the low-efficiency fire emissions were presumably an important driver for the increase of AAEbulk, i.e., the enhancement of fBrC@370. In addition, one fire-impacted sample (collected on the night of 15 April 2023) was noticed to exhibit relatively large discrepancy between the AE33-based (babs)BrC@370 and the solution-based (babs)MS-BrC@365 (Fig. 9b), likely suggesting an increase in the fraction of methanol-insoluble species in total OC. This sample was also characterized by relatively low levels of NO2 CO, pointing to the prevalence of low-efficiency fires for the sampling period and the potential contribution of such fires to methanol-insoluble OC. This inference was partially supported by association of reduced with decreased NO2 CO (Fig. S10), which indicated that the low-efficiency fires favored the emissions of organic compounds with relatively high molecular weights and aromatic contents. It is also noteworthy that although the BrC particles from agricultural fires, especially those with low efficiencies, contributed considerably to aerosol absorption in the ultraviolet wavelength range, they likely appeared more scattering at 870 nm, the wavelength for the PAX-based SSA determination. For example, SSA exhibited a clear increasing trend as fBrC@370 became higher (Fig. 9c), indicating that the BrC particles exerted limited impact on the aerosol absorption at 870 nm.
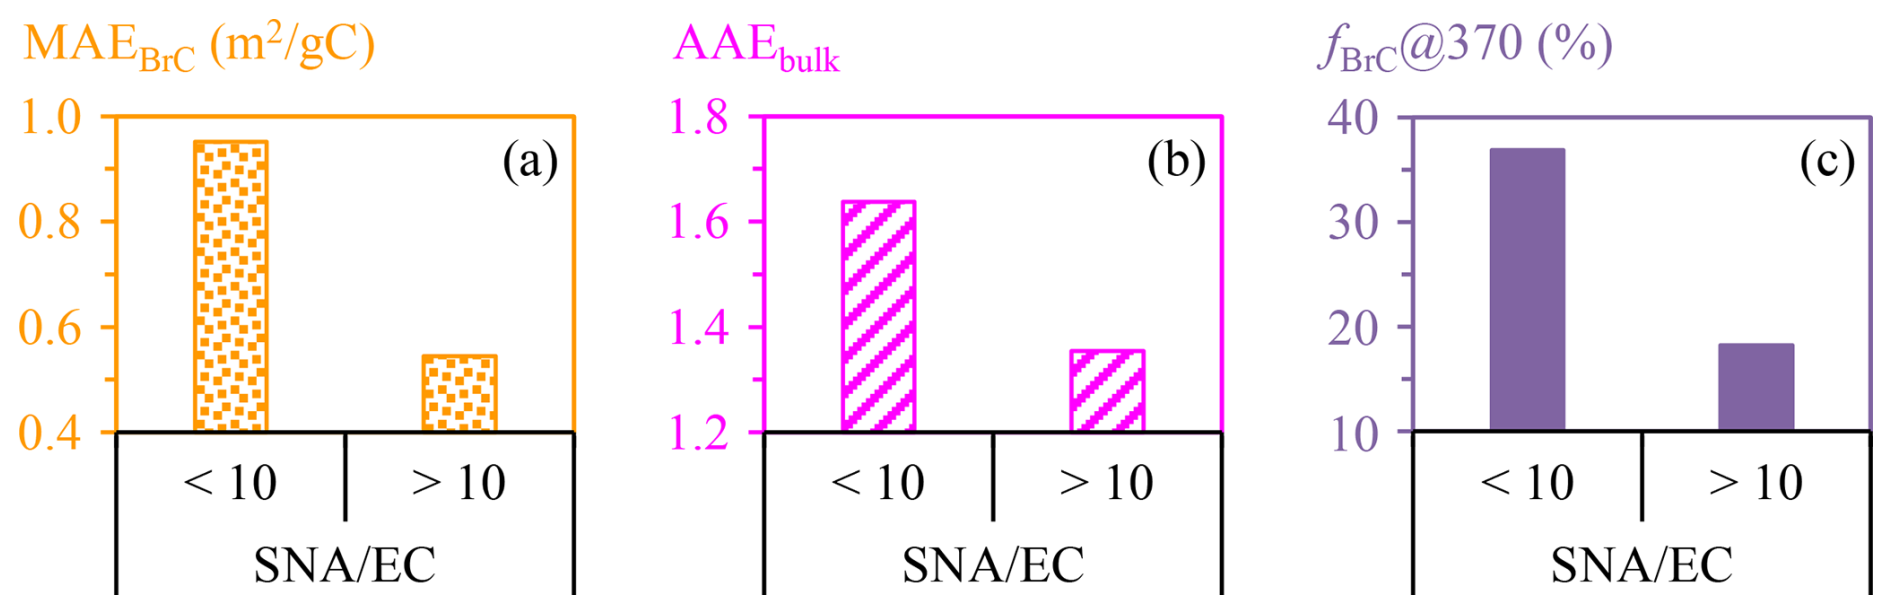
Figure 10Comparisons of (a) MAEBrC, (b) AAEbulk and (c) fBrC@370 with SNA EC ratios of below and above 10, for the typical samples. Time-resolved AAEbulk and fBrC@370 were first extracted for the filter sampling segments and then used for the comparisons. Only the median values are shown here. Refer to Fig. S11 for detailed comparisons.
SOA formation was identified as another influencing factor for BrC. Here we focused on the typical samples to minimize the impacts of agricultural fires and dusts. Although SOA tracer was not directly measured in this study, the ratio of SNA (i.e., the sum of secondary inorganic ions including sulfate, nitrate and ammonium) to EC could be used as an indirect indicator for the significance of SOA formation. The effectiveness of this indicator was supported by the concurrent enhancements in SNA and SOA repeatedly observed in Harbin (Cheng et al., 2021; Cheng and He, 2026). As shown in Fig. 10a, MAEBrC dropped considerably once the SNA to EC ratio (SNA EC) exceeded 10, with the median MAEBrC almost halved (from 0.95 to 0.51 m2gC−1). It appeared that the bulk BrC tended to be less absorbing as more SOA was produced. This pattern was with expectation, since SOA typically had weaker light absorption capacities than primary organic matters (Kumar et al., 2018; Cappa et al., 2020). Similar to MAEBrC, AAEbulk and fBrC@370 were also substantially lower for the SNA EC range of above 10 (Fig. 10b–c), with their median values decreasing from 1.64 to 1.35 and from 37 % to 18 %, respectively. The discussions above suggested that SOA formation could reduce the MAE of bulk BrC and the influence of BrC on the total light absorption of aerosol.
3.5 Evidences for considerable light absorption enhancement of black carbon
Similar to MAEBrC, the mass absorption efficiency of BC (MAEBC) was calculated as the ratio of the PAX-based (babs)@870 to EC, and the results were specified as MAEBC@870. A consensus had been reached that the mass absorption efficiency of uncoated black carbon should be at least 5 m2 g−1 at 550 nm (Bond et al., 2013; Petzold et al., 2013). This lower limit, which was suggested as a fundamental physical property of black carbon, could be converted to a threshold value of 3.02 m2 g−1 at 870 nm (using an AAEBC of 1.1). For the dust-impacted, fire&dust-impacted and fire-impacted episodes, the majority (∼ 55 %–90 %) of the samples showed MAEBC@870 values smaller than 3.02 m2 g−1, and the median MAEBC@870 were only 1.59, 1.95 and 2.25 m2 g−1, respectively (Fig. 11a). Such unrealistically low MAEBC@870 could hardly be explained by uncertainties in the PAX-based absorption measurement but pointed to overestimation of black carbon mass by EC. In thermal-optical analysis, the interfering components for EC determination may include carbonate and brown carbon, which were closely associated with dusts and biomass burning, respectively. For example, previous studies suggested that calcium carbonate (CaCO3) did not completely decompose at 650 °C when heated in an inert atmosphere (Karanasiou et al., 2011), and tar balls from open burning could retain ∼ 30% of their volumes at 600 °C (Adachi et al., 2017; Sedlacek III et al., 2018). For the IMPROVE-A temperature protocol used in this study, the peak temperature of the inert mode was 580 °C. Thus when the dust and/or agricultural fire impacts were significant, it was very likely that a fraction of the carbonate and/or brown carbon could slip into the oxidizing mode of the analysis and then be misidentified as EC. It is also noteworthy that among the fire episodes, the events with unrealistically low MAEBC@870 values (e.g., around 2 m2 g−1) typically showed relatively smaller NO2 CO (Fig. S12), suggesting the low-efficiency fires as an important source for the interfering species in thermal-optical EC measurement.
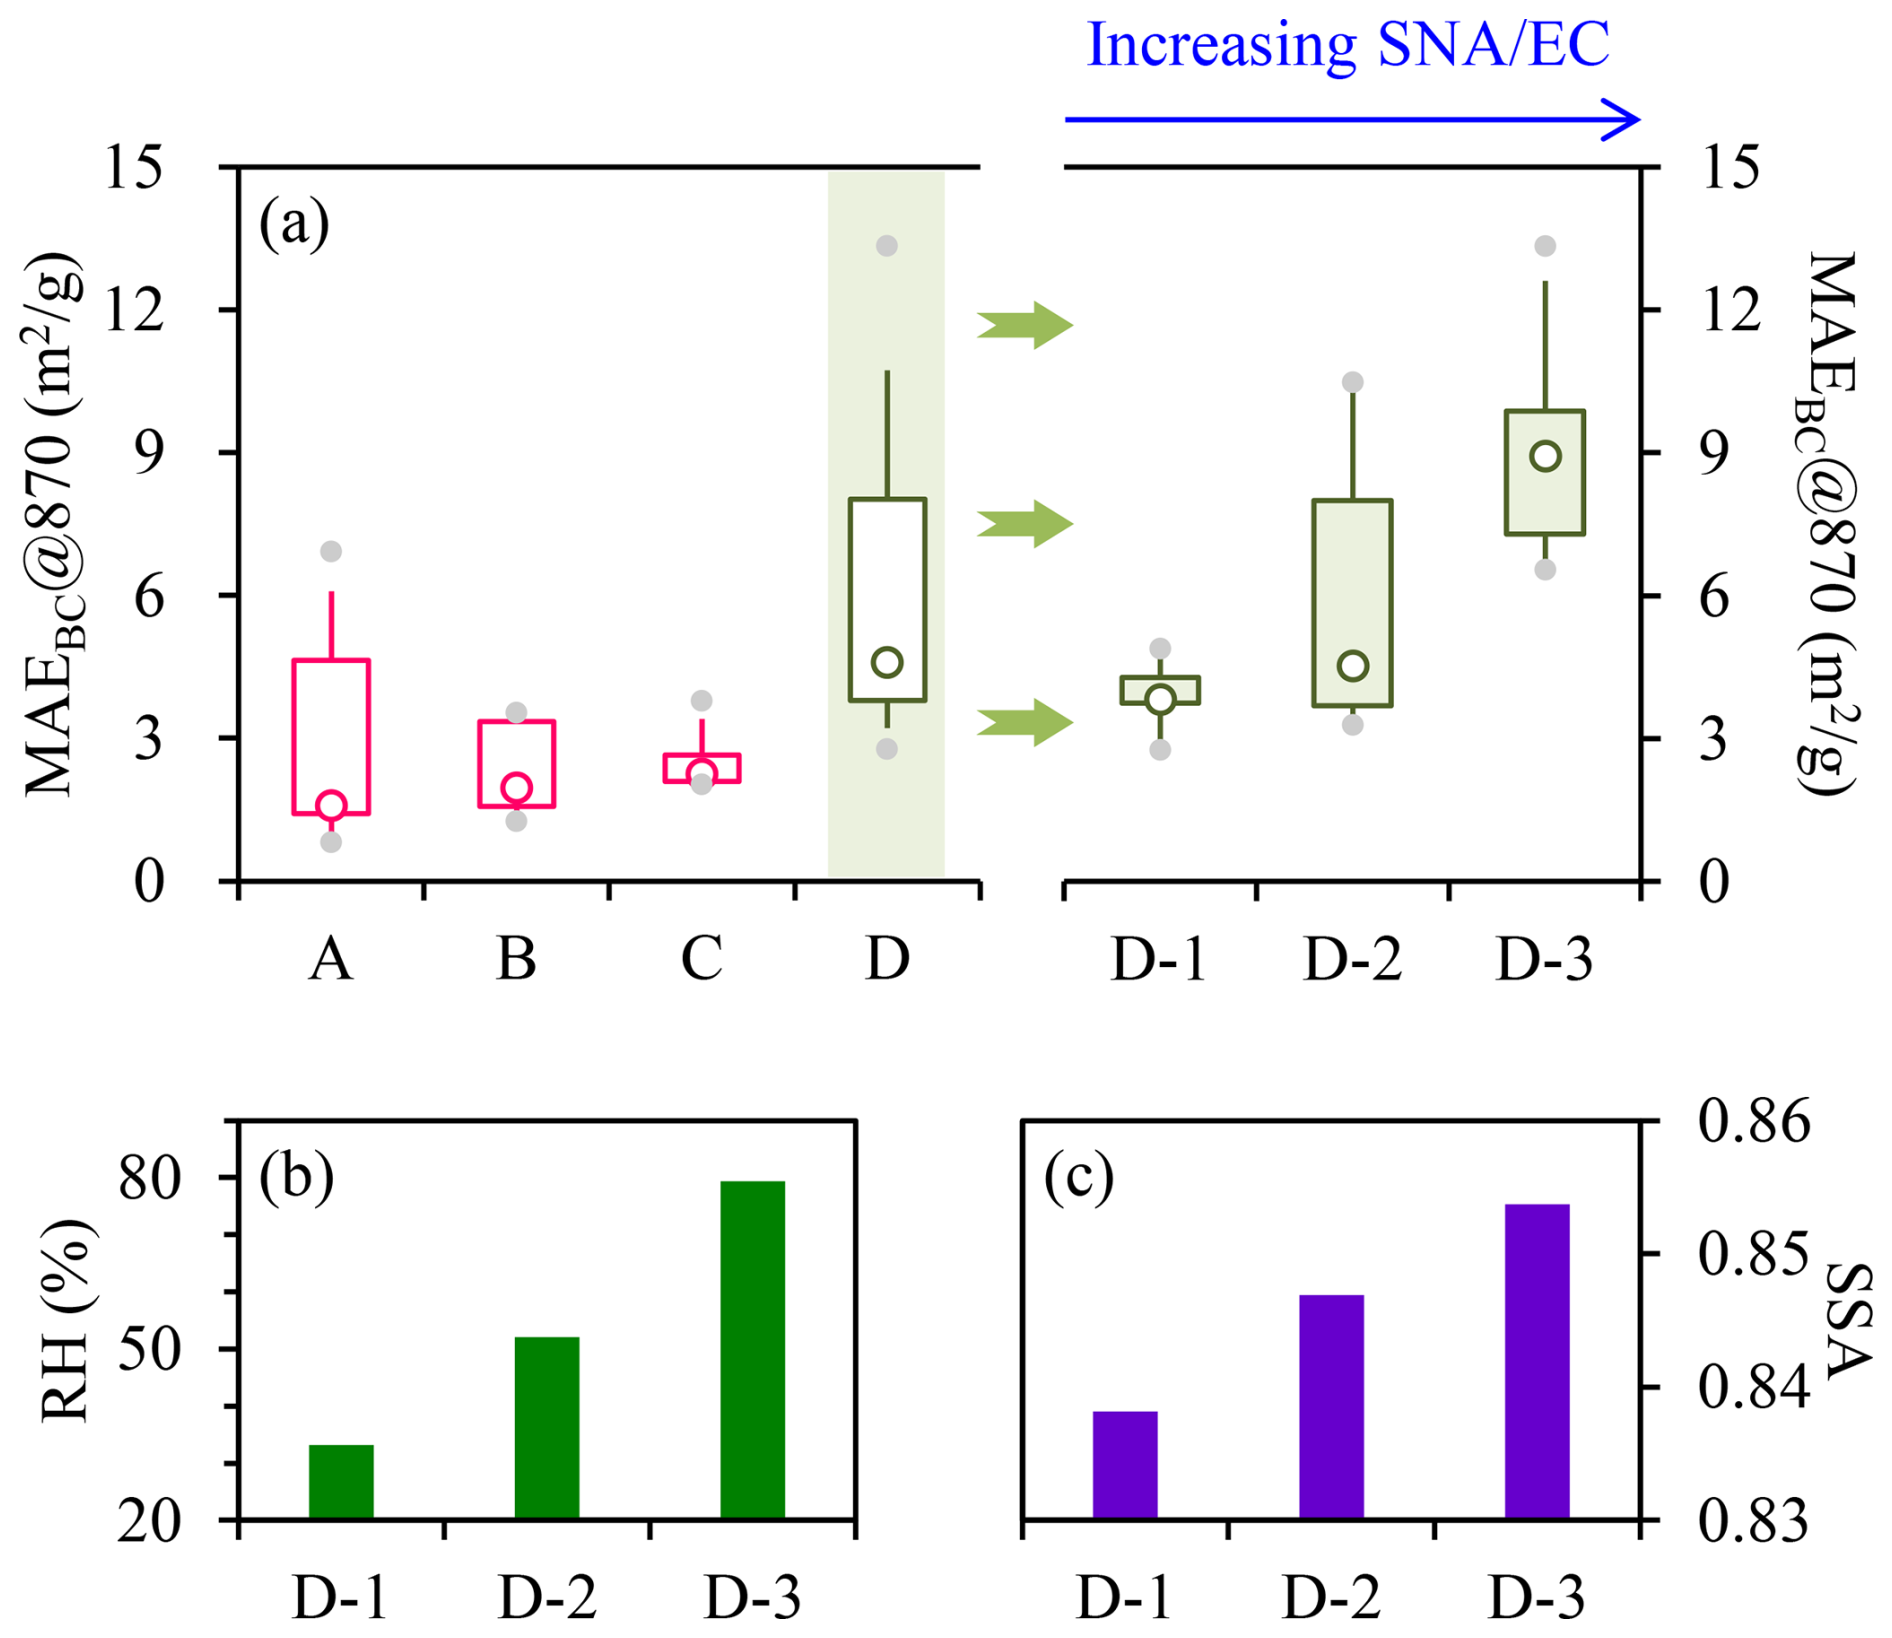
Figure 11(a) Variation of MAEBC@870 across cases of A–D, which correspond to the dust-impacted, fire&dust-impacted, fire-impacted and typical samples, respectively. Results from the typical samples were further divided into three subgroups, i.e., D-1 to D-3 which had SNA EC ratios of below 5, 5–10 and above 10, respectively. Comparisons of (b) RH and (c) SSA across D-1 to D-3 (only the median values are shown).
The overestimation of EC mass became non-evident for the typical samples, as indicated by their MAEBC@870 levels which stayed above ∼ 3 m2 g−1 (Fig. 11a). In addition, the MAEBC@870 values were found to exhibit significant sample-by-sample variations. In general, MAEBC is strongly influenced by the particle mixing state, with relatively low levels for uncoated black carbon. As BC is internally mixed with (i.e., coated by) non-refractory components (e.g., sulfate), MAEBC typically tends to increase to varying degrees, and the specific magnitude depends on many factors such as the complex refractive index of the coating materials (Liu et al., 2014) and the detailed particle morphology (e.g., the position of BC within the coating materials; Huang et al., 2024). In this study, the variations of MAEBC@870 were closely related to the changes in SNA EC. As shown in Fig. 11a, MAEBC@870 showed a clear increasing trend across the SNA EC ranges of below 5, 5–10 and above 10, with the median MAEBC@870 increasing from 3.83 to 4.53 m2 g−1 and finally reaching 8.94 m2 g−1. SNA EC was not only a direct measure of secondary inorganic aerosol production but also an indirect indicator for SOA formation (as discussed in Sect. 3.4). Thus the positive dependence of MAEBC@870 on SNA EC was presumably driven by secondary aerosols, which could effectively enhance BC absorption by internal mixing. Using the median MAEBC@870 determined for the SNA EC range of below 5 as the reference, the light absorption enhancement (Eabs) factors were estimated to be 1.18 and 2.33 for the SNA EC ranges of 5–10 and above 10, respectively. Given that RH increased substantially across the three SNA EC ranges (Fig. 11b), heterogeneous reactions involving aerosol water was inferred to be highly favorable for the secondary aerosol production and BC absorption enhancement. In addition, SSA elevated slightly with increasing SNA EC (Fig. 11c), indicating that the particles tended to be more scattering as the secondary aerosol formation was enhanced.
During a spring period with dramatic variations of PM2.5 sources, PAX, AE33 and off-line observations were integrated to explore the aerosol optical properties in a representative megacity in Northeast China. PAX was used as the reference method to constrain the scattering-associated artifacts in the AE33-based absorption measurement. The correction factor retrieved (C∗) was found to depend positively on SSA whereas their relationship was non-linear. To enhance the relevance of the time-resolved correction factors to future studies, we determined the median C∗ for various SSA bins, which covered the typical SSA ranges encountered in ambient conditions. After applying the SSA-dependent C∗, the corrected AE33 results were in reasonable agreement with the PAX-based absorption coefficients. We also observed considerable differences but strong correlations between the AE33 and off-line absorption measurements. For the absorption coefficient of bulk aerosol, the carbon analyzer reported higher values than AE33, with (babs)#@632 approximately 50 % larger than (babs)∗@632. This discrepancy was primarily attributed to the different filter materials used by the two instruments. In addition, for the absorption coefficient of brown carbon, results from the AE33 were ∼ 1.4 times higher than those obtained by the spectrophotometric measurement of BrC solutions. A likely cause for this discrepancy was the difference in the states of the measured BrC (particulate vs. dissolved), while another contributor was inferred to be the chromophores insoluble in methanol, which were not accounted for in the solution-based approach.
After elucidating the relationships between the optical parameters determined by different approaches, we identified three types of episodes (i.e., dust-impacted, fire&dust-impacted, and fire-impacted) and the typical periods for the spring campaign. The classification was based on a synthesis of various signatures, including the MAE of BrC, the PM2.5 to PM10 ratio, wind speed and the K+ to sulfate ratio. The classification results were also supported by another two signatures, ΔAAEBrC and .
By comparing results from different periods, we highlighted the strong impacts of agricultural fire emissions on BrC. For example, the fires effectively enhanced the light absorption capacity of bulk BrC, emitted distinct chromophores with a characteristic absorption peak at ∼ 365 nm (as indicated by the increased ΔAAEBrC), and produced organic compounds with relatively high molecular weights and aromatic contents (as indicated by the decreased ). In addition, the agricultural fires, especially those having relatively low combustion efficiencies, effectively increased the AAE of bulk aerosol and the BrC contribution to total absorption in the ultraviolet wavelength range.
We also unfolded the responses of BrC and BC optical properties to secondary aerosol formation. For typical samples, i.e., those without significant impacts from agricultural fires or dusts, we found that with the enhancement of secondary aerosol, the bulk BrC appeared less absorbing and consequently, the BrC influences on the light absorption of total aerosol became weaker, as reflected by the concurrent decreases in AAEbulk and fBrC@370. However, there was observational evidence pointing to a considerable increase in the MAE of BC driven by secondary aerosol production, which could be translated into Eabs factors of up to ∼ 2.3.
Finally, our results revealed the distinctiveness of the low-efficiency agricultural fire emissions in Northeast China. In addition to emitting unique organic matters (e.g., those with relatively high molecular weights and aromatic contents, and those strongly interfering thermal-optical EC determination), and effectively enhancing the BrC impacts on total aerosol light absorption, such fires could also promote nocturnal nitrate formation, likely due to some distinct dark-reactions. We suggest that the low-efficiency fires merit further investigations, e.g., for the emissions of gaseous and particulate species, the plume evolution, and the interactions of the fire emissions with other anthropogenic pollutants.
Data described in this manuscript can be accessed at https://doi.org/10.5281/zenodo.18898994 (Cheng, 2026).
The supplement related to this article is available online at https://doi.org/10.5194/acp-26-6541-2026-supplement.
YC and JL designed the study and prepared the paper, with inputs from all the co-authors. XC, YG, YZ and ZZ carried out the experiments. KH validated the results and supervised the study.
The contact author has declared that none of the authors has any competing interests.
Publisher's note: Copernicus Publications remains neutral with regard to jurisdictional claims made in the text, published maps, institutional affiliations, or any other geographical representation in this paper. The authors bear the ultimate responsibility for providing appropriate place names. Views expressed in the text are those of the authors and do not necessarily reflect the views of the publisher.
The authors thank Dr. Yue-mei Han at Institute of Earth Environment, Chinese Academy of Sciences for the help in sample analysis.
This research has been supported by the Jing-Jin-Ji Regional Integrated Environmental Improvement-National Science and Technology Major Project (2026ZD1216000), the National Natural Science Foundation of China (42222706), the Natural Science Foundation of Heilongjiang Province (YQ2024D011), and the Fundamental Research Funds for the Central Universities.
This paper was edited by Zhibin Wang and reviewed by two anonymous referees.
Adachi, K., Sedlacek III, A. J., Kleinman, L., Chand, D., Hubbe, J. M., and Buseck, P. R.: Volume changes upon heating of aerosol particles from biomass burning using transmission electron microscopy, Aerosol Sci. Technol., 52, 46–56, https://doi.org/10.1080/02786826.2017.1373181, 2017.
Ahern, A. T., Goldberger, L., Jahl, L., Thornton, J., and Sullivan, R. C.: Production of N2O5 and ClNO2 through nocturnal processing of biomass-burning aerosol, Environ. Sci. Technol., 52, 550–559, https://doi.org/10.1021/acs.est.7b04386, 2018.
Anderson, L. D., Dix, B., Schnell, J., Yokelson, R., Veefkind, J. P., Ahmadov, R., and de Gouw, J.: Analyzing the impact of evolving combustion conditions on the composition of wildfire emissions using satellite data, Geophys. Res. Lett., 50, e2023GL105811, https://doi.org/10.1029/2023GL105811, 2023.
Andreae, M. O. and Gelencsér, A.: Black carbon or brown carbon? The nature of light-absorbing carbonaceous aerosols, Atmos. Chem. Phys., 6, 3131–3148, https://doi.org/10.5194/acp-6-3131-2006, 2006.
Atwi, K., Cheng, Z. Z., El Hajj, O., Perrie, C., and Saleh, R.: A dominant contribution to light absorption by methanol-insoluble brown carbon produced in the combustion of biomass fuels typically consumed in wildland fires in the United States, Environ. Sci. Atmos., 2, 182–191, https://doi.org/10.1039/d1ea00065a, 2022.
Bi, X., Dai, Q., Wu, J., Zhang, Q., Zhang, W., Luo, R., Cheng, Y., Zhang, J., Wang, L., Yu, Z., Zhang, Y., Tian, Y., and Feng, Y.: Characteristics of the main primary source profiles of particulate matter across China from 1987 to 2017, Atmos. Chem. Phys., 19, 3223–3243, https://doi.org/10.5194/acp-19-3223-2019, 2019.
Bond, T. C., Doherty, S. J., Fahey, D. W., Forster, P. M., Berntsen, T., DeAngelo, B. J., Flanner, M. G., Ghan, S., Kärcher, B., Koch, D., Kinne, S., Kondo, Y., Quinn, P. K., Sarofim, M. C., Schultz, M. G., Schulz, M., Venkataraman, C., Zhang, H., Zhang, S., Bellouin, N., Guttikunda, S. K., Hopke, P. K., Jacobson, M. Z., Kaiser, J. W., Klimont, Z., Lohmann, U., Schwarz, J. P., Shindell, D., Storelvmo, T., Warren, S. G., and Zender, C. S.: Bounding the role of black carbon in the climate system: a scientific assessment, J. Geophys. Res., 118, 5380–5552, https://doi.org/10.1002/jgrd.50171, 2013.
Cappa, C. D., Lim, C. Y., Hagan, D. H., Coggon, M., Koss, A., Sekimoto, K., de Gouw, J., Onasch, T. B., Warneke, C., and Kroll, J. H.: Biomass-burning-derived particles from a wide variety of fuels – Part 2: Effects of photochemical aging on particle optical and chemical properties, Atmos. Chem. Phys., 20, 8511–8532, https://doi.org/10.5194/acp-20-8511-2020, 2020.
Chang, X., Zhao, B., Zheng, H. T., Wang, S. X., Cai, S. Y., Guo, F. Q., Gui, P., Huang, G. H., Wu, D., Han, L. C., Xing, J., Man, H. Y., Hu, R. L., Liang, C. R., Xu, Q. C., Qiu, X. H., Ding, D., Liu, K. Y., Han, R., Robinson, A. L., and Donahue, N. M.: Full-volatility emission framework corrects missing and underestimated secondary organic aerosol sources, One Earth, 5, 403–412, 2022.
Chen, Q. C., Mu, Z., Song, W. H., Wang, Y. Q., Yang, Z. H., Zhang, L. X., and Zhang, Y. L.: Size-resolved characterization of the chromophores in atmospheric particulate matter from a typical coal-burning city in China, J. Geophys. Res.-Atmos., 124, 10546–10563, https://doi.org/10.1029/2019JD031149, 2019.
Chen, X. Y., Ching, J., Wu, F., Matsui, H., Jacobson, M. Z., Zhang, F., Wang, Y. Y., Zhang, Z. X., Liu, D. T., Zhu, S. P., Rudich, Y., Shi, Z. B., Yoo, H., Jeon, K. J., and Li, W. J.: Locating the missing absorption enhancement due to multi-core black carbon aerosols, Nat. Commun., 16, 10187, https://doi.org/10.1038/s41467-025-65079-2, 2025.
Cheng, Y.: Optical properties of carbonaceous aerosols modulated by source variations of spring haze, Zenodo [data set], https://doi.org/10.5281/zenodo.18898994, 2026.
Cheng, Y. and He, K. B.: Northeast China: an emerging hotspot of atmospheric sciences, Sci. Bull., 71, 64–66, https://doi.org/10.1016/j.scib.2025.06.023, 2026.
Cheng, Y., Yu, Q., Liu, J., Cao, X., Zhong, Y., Du, Z., Liang, L., Geng, G., Ma, W., Qi, H., Zhang, Q., and He, K.: Dramatic changes in Harbin aerosol during 2018–2020: the roles of open burning policy and secondary aerosol formation, Atmos. Chem. Phys., 21, 15199–15211, https://doi.org/10.5194/acp-21-15199-2021, 2021.
Cheng, Y., Cao, X., Liu, J., Zhong, Y., Yu, Q., Zhang, Q., and He, K.: Measurement report: Diurnal variations of brown carbon during two distinct seasons in a megacity in northeast China, Atmos. Chem. Phys., 23, 6241–6253, https://doi.org/10.5194/acp-23-6241-2023, 2023.
Collaud Coen, M., Weingartner, E., Apituley, A., Ceburnis, D., Fierz-Schmidhauser, R., Flentje, H., Henzing, J. S., Jennings, S. G., Moerman, M., Petzold, A., Schmid, O., and Baltensperger, U.: Minimizing light absorption measurement artifacts of the Aethalometer: evaluation of five correction algorithms, Atmos. Meas. Tech., 3, 457–474, https://doi.org/10.5194/amt-3-457-2010, 2010.
Decker, Z. C. J., Zarzana, K. J., Coggon, M., Min, K. E., Pollack, I., Ryerson, T. B., Peischl, J., Edwards, P., Dubé, W. P., Markovic, M. Z., Roberts, J. M., Veres, P. R., Graus, M., Warneke, C., de Gouw, J., Hatch, L. E., Barsanti, K. C., and Brown, S. S.: Nighttime chemical transformation in biomass burning plumes: a box model analysis initialized with aircraft observations, Environ. Sci. Technol., 53, 2529–2538, https://doi.org/10.1021/acs.est.8b05359, 2019.
Drinovec, L., Močnik, G., Zotter, P., Prévôt, A. S. H., Ruckstuhl, C., Coz, E., Rupakheti, M., Sciare, J., Müller, T., Wiedensohler, A., and Hansen, A. D. A.: The “dual-spot” Aethalometer: an improved measurement of aerosol black carbon with real-time loading compensation, Atmos. Meas. Tech., 8, 1965–1979, https://doi.org/10.5194/amt-8-1965-2015, 2015.
Duarte, R. M. B. O., Pio, C. A., and Duarte, A. C.: Spectroscopic study of the water-soluble organic matter isolated from atmospheric aerosols collected under different atmospheric conditions, Anal. Chim. Acta, 530, 7–14, https://doi.org/10.1016/j.aca.2004.08.049, 2005.
Ferrero, L., Bernardoni, V., Santagostini, L., Cogliati, S., Soldan, F., Valentini, S., Massabò, D., Močnik, G., Gregorič, A., Rigler, M., Prati, P., Bigogno, A., Losi, N., Valli, G., Vecchi, R., and Bolzacchini, E.: Consistent determination of the heating rate of light-absorbing aerosol using wavelength- and time-dependent Aethalometer multiple-scattering correction, Sci. Total Environ., 791, 148277, https://doi.org/10.1016/j.scitotenv.2021.148277, 2021.
Gao, C. Y., Heald, C. L., Katich, J. M., Luo, G., and Yu, F. Q.: Remote aerosol simulated during the Atmospheric Tomography (ATom) campaign and implications for aerosol lifetime, J. Geophys. Res.-Atmos., 127, e2022JD036524, https://doi.org/10.1029/2022JD036524, 2022.
Geng, G. N., Liu, Y. X., Liu, Y., Liu, S. G., Cheng, J., Yan, L., Wu, N. N., Hu, H. W., Tong, D., Zheng, B., Yin, Z. C., He, K. B., and Zhang, Q.: Efficacy of China's clean air actions to tackle PM2.5 pollution between 2013 and 2020, Nat. Geosci., 17, 987–994, https://doi.org/10.1038/s41561-024-01540-z, 2024.
Huang, X. F., Peng, Y., Wei, J., Peng, J. F., Lin, X. Y., Tang, M. X., Cheng, Y., Men, Z., Fang, T., Zhang, J. S., He, L. Y., Cao, L. M., Liu, C., Zhang, C. C., Mao, H. J., Seinfeld, J. H., and Wang, Y.: Microphysical complexity of black carbon particles restricts their warming potential, One Earth, 7, 136–145, https://doi.org/10.1016/j.oneear.2023.12.004, 2024.
Karanasiou, A., Diapouli, E., Cavalli, F., Eleftheriadis, K., Viana, M., Alastuey, A., Querol, X., and Reche, C.: On the quantification of atmospheric carbonate carbon by thermal/optical analysis protocols, Atmos. Meas. Tech., 4, 2409–2419, https://doi.org/10.5194/amt-4-2409-2011, 2011.
Kumar, N. K., Corbin, J. C., Bruns, E. A., Massabó, D., Slowik, J. G., Drinovec, L., Močnik, G., Prati, P., Vlachou, A., Baltensperger, U., Gysel, M., El-Haddad, I., and Prévôt, A. S. H.: Production of particulate brown carbon during atmospheric aging of residential wood-burning emissions, Atmos. Chem. Phys., 18, 17843–17861, https://doi.org/10.5194/acp-18-17843-2018, 2018.
Lack, D. A. and Langridge, J. M.: On the attribution of black and brown carbon light absorption using the Ångström exponent, Atmos. Chem. Phys., 13, 10535–10543, https://doi.org/10.5194/acp-13-10535-2013, 2013.
Lambe, A. T., Cappa, C. D., Massoli, P., Onasch, T. B., Forestieri, S. D., Martin, A. T., Cummings, M. J., Croasdale, D. R., Brune, W. H., Worsnop, D. R., and Davidovits, P.: Relationship between oxidation level and optical properties of secondary organic aerosol, Environ. Sci. Technol., 47, 6349–6357, https://doi.org/10.1021/es401043j, 2013.
Laskin, A., Laskin, J., and Nizkorodov, S. A.: Chemistry of atmospheric brown carbon, Chem. Rev., 115, 4335–4382, https://doi.org/10.1021/cr5006167, 2015.
Laskin, A., West, C. P., and Hettiyadura A. P. S.: Molecular insights into the composition, sources, and aging of atmospheric brown carbon, Chem. Soc. Rev., 54, 1583, https://doi.org/10.1039/d3cs00609c, 2025.
Liu, J., Bergin, M., Guo, H., King, L., Kotra, N., Edgerton, E., and Weber, R. J.: Size-resolved measurements of brown carbon in water and methanol extracts and estimates of their contribution to ambient fine-particle light absorption, Atmos. Chem. Phys., 13, 12389–12404, https://doi.org/10.5194/acp-13-12389-2013, 2013.
Liu, J., Lin, P., Laskin, A., Laskin, J., Kathmann, S. M., Wise, M., Caylor, R., Imholt, F., Selimovic, V., and Shilling, J. E.: Optical properties and aging of light-absorbing secondary organic aerosol, Atmos. Chem. Phys., 16, 12815–12827, https://doi.org/10.5194/acp-16-12815-2016, 2016.
Liu, S., Aiken, A. C., Gorkowski, K., Dubey, M. K., Cappa, C. D., Williams, L. R., Herndon, S. C., Massoli, P., Fortner, E. C., Chhabra, P. S., Brooks, W. A., Onasch, T. B., Jayne, J. T., Worsnop, D. R., China, S., Sharma, N., Mazzoleni, C., Xu, L., Ng, N. L., Liu, D., Allan, J. D., Lee, J. D., Fleming, Z. L., Mohr, C., Zotter, P., Szidat, S., and Prévôt, A. S. H.: Enhanced light absorption by mixed source black and brown carbon particles in UK winter, Nat. Commun., 6, 8435, https://doi.org/10.1038/ncomms9435, 2014.
MEE (Ministry of Ecology and Environment of China): Ambient air quality standards (GB 3095-2026), https://www.mee.gov.cn/ywgz/fgbz/bz/bzwb/dqhjbh/dqhjzlbz/202602/t20260225_1144419.shtml (last access: 14 May 2026), 2026.
Mo, Y., Li, J., Zhong, G., Zhu, S., Zhao, S., Tang, J., Jiang, H., Cheng, Z., Tian, C., Chen, Y., and Zhang, G.: The water-insoluble organic carbon in PM2.5 of typical Chinese urban areas: light-absorbing properties, potential sources, radiative forcing effects, and a possible light-absorbing continuum, Atmos. Chem. Phys., 24, 7755–7772, https://doi.org/10.5194/acp-24-7755-2024, 2024.
Petzold, A., Ogren, J. A., Fiebig, M., Laj, P., Li, S.-M., Baltensperger, U., Holzer-Popp, T., Kinne, S., Pappalardo, G., Sugimoto, N., Wehrli, C., Wiedensohler, A., and Zhang, X.-Y.: Recommendations for reporting ”black carbon” measurements, Atmos. Chem. Phys., 13, 8365–8379, https://doi.org/10.5194/acp-13-8365-2013, 2013.
Pileci, R. E., Modini, R. L., Bertò, M., Yuan, J., Corbin, J. C., Marinoni, A., Henzing, B., Moerman, M. M., Putaud, J. P., Spindler, G., Wehner, B., Müller, T., Tuch, T., Trentini, A., Zanatta, M., Baltensperger, U., and Gysel-Beer, M.: Comparison of co-located refractory black carbon (rBC) and elemental carbon (EC) mass concentration measurements during field campaigns at several European sites, Atmos. Meas. Tech., 14, 1379–1403, https://doi.org/10.5194/amt-14-1379-2021, 2021.
Pöschl, U.: Atmospheric aerosols: composition, transformation, climate and health effects, Angew. Chem. Int. Ed., 44, 7520–7540, https://doi.org/10.1002/anie.200501122, 2005.
Putaud, J. P., Van Dingenen, R., Alastuey, A., Bauer, H., Birmili, W., Cyrys, J., Flentje, H., Fuzzi, S., Gehrig, R., Hansson, H. C., Harrison, R. M., Herrmann, H., Hitzenberger, R., Hüglin, C., Jones, A. M., Kasper-Giebl, A., Kiss, G., Kousa, A., Kuhlbusch, T. A. J., Löschau, G., Maenhaut, W., Molnar, A., Moreno, T., Pekkanen, J., Perrino, C., Pitz, M., Puxbaum, H., Querol, X., Rodriguez, S., Salma, I., Schwarz, J., Smolik, J., Schneider, J., Spindler, G., ten Brink, H., Tursic, J., Viana, M., Wiedensohler, A., and Raes, F.: A European aerosol phenomenology-3: Physical and chemical characteristics of particulate matter from 60 rural, urban, and kerbside sites across Europe, Atmos. Environ., 44, 1308–1320, 2010.
Putaud, J. P., Cavalli, F., Yttri, K. E., Chow, J. C., Watson, J. G., Sinha, B., Venkataraman, C., Ikemori, F., Jaffrezo, J. L., Uzu, G., Moreno, I., Krejci, R., Laj, P., Gupta, T., Hu, M., Kim, S. W., Mayol-Bracero, O., Quinn, P., Aas, W., Alastuey, A., Andrade, M., Angelucci, M., Anurag, G., Beukes, J. P., Bhardwaj, A., Chatterjee, A., Chaudhary, P., Chhangani, A. K., Conil, S., Degorska, A., Devaliya, S., Dhandapani, A., Duhan, S. S., Dumka, U. C., Habib, G., Hamzavi, Z., Haswani, D., Herrmann, H., Holubova, A., Hueglin, C., Imran, M., Jehangir, A., Kapoor, T. S., Karanasiou, A., Khaiwal, R., Kim, J., Kolesa, T., Kozakiewicz, J., Kranjc, I., Laura, J. S., Lian, Y., Liu, J. W., Manwani, P., Mardoñez-Balderrama, V., Marticorena, B., Matsuki, A., Mor, S., Mukherjee, S., Murthy, S., Muthalagu, A., Najar, T. A., Kumar, R. N., Pandithurai, G., Perez, N., Phairuang, W., Phuleria, H. C., Poulain, L., Prasad, L., Pullokaran, D., Qadri, A. M., Qureshi, A., Ramírez, O., Roy, S., Rüdiger, J., Saikia, B. K., Saikia, P., Sauvage, S., Savvides, C., Sharma, R., Singh, T., Singh, G. K., Spoor, R., Srivastava, A. K., Raman, R. S., Van Zyl, P. G., Vecchiocattivi, M., Voiron, C., Xin, J. Y., and Yadav, K.: A worldwide aerosol phenomenology: elemental and organic carbon in PM2.5 and PM10, Atmos. Environ., 358, 121338, https://doi.org/10.1016/j.atmosenv.2025.121338, 2025.
Renzi, L., Di Biagio, C., Heuser, J., Zanatta, M., Cazaunau, M., Bergé, A., Pangui, E., Yon, J., Isolabella, T., Massabò, D., Vernocchi, V., Mazzini, M., Vogel, F., Yu, C., Formenti, P., Picquet-Varrault, B., Doussin, J.-F., and Marinoni, A.: The role of size in the multiple scattering correction C for dual-spot aethalometer: a field and laboratory investigation, Atmos. Meas. Tech., 19, 1365–1383, https://doi.org/10.5194/amt-19-1365-2026, 2026.
Samset, B. H., Myhre, G., Herber, A., Kondo, Y., Li, S.-M., Moteki, N., Koike, M., Oshima, N., Schwarz, J. P., Balkanski, Y., Bauer, S. E., Bellouin, N., Berntsen, T. K., Bian, H., Chin, M., Diehl, T., Easter, R. C., Ghan, S. J., Iversen, T., Kirkevåg, A., Lamarque, J.-F., Lin, G., Liu, X., Penner, J. E., Schulz, M., Seland, Ø., Skeie, R. B., Stier, P., Takemura, T., Tsigaridis, K., and Zhang, K.: Modelled black carbon radiative forcing and atmospheric lifetime in AeroCom Phase II constrained by aircraft observations, Atmos. Chem. Phys., 14, 12465–12477, https://doi.org/10.5194/acp-14-12465-2014, 2014.
Sedlacek III, A. J., Buseck, P. R., Adachi, K., Onasch, T. B., Springston, S. R., and Kleinman, L.: Formation and evolution of tar balls from northwestern US wildfires, Atmos. Chem. Phys., 18, 11289–11301, https://doi.org/10.5194/acp-18-11289-2018, 2018.
Snyder, D. C. and Schauer, J. J.: An inter-comparison of two black carbon aerosol instruments and a semi-continuous elemental carbon instrument in the urban environment, Aerosol Sci. Technol., 41, 463–474, https://doi.org/10.1080/02786820701222819, 2007.
Tinorua, S., Denjean, C., Nabat, P., Pont, V., Arnaud, M., Bourrianne, T., Dias Alves, M., and Gardrat, E.: A 2-year intercomparison of three methods for measuring black carbon concentration at a high-altitude research station in Europe, Atmos. Meas. Tech., 17, 3897–3915, https://doi.org/10.5194/amt-17-3897-2024, 2024.
Tuccella, P., Di Antonio, L., Di Muzio, A., Colaiuda, V., Lidori, R., Menut, L., Pitari, G., and Raparelli, E.: Modeling the black and brown carbon absorption and their radiative impact: the June 2023 intense Canadian boreal wildfires case study, J. Geophys. Res.-Atmos., 130, e2024JD042674, https://doi.org/10.1029/2024JD042674, 2025.
van der Velde, I. R., van der Werf, G. R., Houweling, S., Eskes, H. J., Veefkind, J. P., Borsdorff, T., and Aben, I.: Biomass burning combustion efficiency observed from space using measurements of CO and NO2 by the TROPOspheric Monitoring Instrument (TROPOMI), Atmos. Chem. Phys., 21, 597–616, https://doi.org/10.5194/acp-21-597-2021, 2021.
Wang, Y. Y., Zheng, Z. H., Sun, Y., Yao, Y., Ma, P. L., Zhang, A. X., Zhu, S. P., Zhang, Z. X., Chen, X. Y., Pang, Y. E., Wang, Q. Y., Che, H. Z., Ching, J., and Li, W. J.: Improved representation of black carbon mixing structures suggests stronger direct radiative heating, One Earth, 8, 101311, https://doi.org/10.1016/j.oneear.2025.101311, 2025.
Washenfelder, R. A., Attwood, A. R., Brock, C. A., Guo, H., Xu, L., Weber, R. J., Ng, N. L., Allen, H. M., Ayres, B. R., Baumann, K., Cohen, R. C., Draper, D. C., Duffey, K. C., Edgerton, E., Fry, J. L., Hu, W. W., Jimenez, J. L., Palm, B. B., Romer, P., Stone, E. A., Wooldridge, P. J., and Brown, S. S.: Biomass burning dominates brown carbon absorption in the rural southeastern United States, Geophys. Res. Lett., 42, 653–664, https://doi.org/10.1002/2014GL062444, 2015.
Weingartner, E., Saathoff, H., Schnaiter, M., Streit, N., Bitnar, B., and Baltensperger, U.: Absorption of light by soot particles: determination of the absorption coefficient by means of aethalometers, J. Aerosol Sci., 34, 1445–1463, https://doi.org/10.1016/S0021-8502(03)00359-8, 2003.
Winiger, P., Barrett, T. E., Sheesley, R. J., Huang, L., Sharma, S., Barrie, L. A., Yttri, K. E., Evangeliou, N., Eckhardt, S., Stohl, A., Klimont, Z., Heyes, C., Semiletov, I. P., Dudarev, O. V., Charkin, A., Shakhova, N., Holmstrand, H., Andersson, A., and Gustafsson, Ö.: Source apportionment of circum-Arctic atmospheric black carbon from isotopes and modeling, Sci. Adv., 5, eaau8052, https://doi.org/10.1126/sciadv.aau8052, 2019.
Wu, X., Cao, F., Haque, M., Fan, M. Y., Zhang, S. C., and Zhang, Y. L.: Molecular composition and source apportionment of fine organic aerosols in Northeast China, Atmos. Environ., 239, 117722, https://doi.org/10.1016/j.atmosenv.2020.117722, 2020.
Xiao, Q. Y., Geng, G. N., Xue, T., Liu, S. G., Cai, C. L., He, K. B., and Zhang, Q.: Tracking PM2.5 and O3 pollution and the related health burden in China 2013–2020, Environ. Sci. Technol., 56, 6922–6932, https://doi.org/10.1021/acs.est.1c04548, 2022.
Xie, X. C., Zhang, Y. Z., Liang, R. S., Chen, W., Zhang, P. X., Wang, X., Zhou, Y., Cheng, Y., and Liu, J. M.: Wintertime heavy haze episodes in Northeast China driven by agricultural fire emissions, Environ. Sci. Tech. Lett., 11, 150–157, https://doi.org/10.1021/acs.estlett.3c00940, 2024.
Yus-Díez, J., Bernardoni, V., Močnik, G., Alastuey, A., Ciniglia, D., Ivančič, M., Querol, X., Perez, N., Reche, C., Rigler, M., Vecchi, R., Valentini, S., and Pandolfi, M.: Determination of the multiple-scattering correction factor and its cross-sensitivity to scattering and wavelength dependence for different AE33 Aethalometer filter tapes: a multi-instrumental approach, Atmos. Meas. Tech., 14, 6335–6355, https://doi.org/10.5194/amt-14-6335-2021, 2021.
Yus-Díez, J., Drinovec, L., Alados-Arboledas, L., Titos, G., Bazo, E., Casans, A., Patrón, D., Querol, X., Gonzalez-Romero, A., Perez García-Pando, C., and Močnik, G.: Characterization of filter photometer artifacts in soot and dust measurements – laboratory and ambient experiments using a traceably calibrated aerosol absorption reference, Atmos. Meas. Tech., 18, 3073–3093, https://doi.org/10.5194/amt-18-3073-2025, 2025.
Zhang, J., Liu, L., Xu, L., Lin, Q., Zhao, H., Wang, Z., Guo, S., Hu, M., Liu, D., Shi, Z., Huang, D., and Li, W.: Exploring wintertime regional haze in northeast China: role of coal and biomass burning, Atmos. Chem. Phys., 20, 5355–5372, https://doi.org/10.5194/acp-20-5355-2020, 2020.
Zhang, X. L., Lin, Y. H., Surratt, J. D., Zotter, P., Prévôt, A. S. H., and Weber, R. J.: Light-absorbing soluble organic aerosol in Los Angeles and Atlanta: a contrast in secondary organic aerosol, Geophys. Res. Lett., 38, L21810, https://doi.org/10.1029/2011GL049385, 2011.
Zhong, Q. R., Schutgens, N., van der Werf, G. R., Takemura, T., van Noije, T., Mielonen, T., Checa-Garcia, R., Lohmann, U., Kirkevåg, A., Olivié, D. J. L., Kokkola, H., Matsui, H., Kipling, Z., Ginoux, P., Le Sager, P., Rémy, S., Bian, H. S., Chin, M., Zhang, K., Bauer, S. E., and Tsigaridis, K.: Threefold reduction of modeled uncertainty in direct radiative effects over biomass burning regions by constraining absorbing aerosols, Sci. Adv., 9, eadi3568, https://doi.org/10.1126/sciadv.adi3568, 2023.