the Creative Commons Attribution 4.0 License.
the Creative Commons Attribution 4.0 License.
 | 12 May 2026
Spatial-scale dependence of aerosol indirect effects over land in eastern China: a comparative analysis
Yuqin Liu
Tao Lin
Jiahua Zhang
Meixia Lin
Yuan Chen
Yiyi Huang
Hongkai Geng
Xin Cao
The aim of this study is to reveal patterns of the sensitivity of aerosol indirect effects to spatial scales and investigate the regulatory role of the liquid water path (LWP) in aerosol-cloud interactions over land in eastern China. Using MODIS and CALIOP satellite observations, we systematically analyzed the relationships between aerosol optical depth (AOD) and cloud properties (cloud droplet effective radius, CER; cloud droplet number concentration, Nd) during two periods: 2008–2014 (period 1, high AOD) and 2015–2022 (period 2, decreasing AOD). The results show three distinct regimes of CER variation with LWP: a rapid growth regime (LWP g m−2), a decreasing regime (LWP =55–135/50–100 g m−2) and a slow growth regime (LWP >135/100 g m−2) (thresholds vary by period). The slow growth regime is not analyzed further due to limited data. The sensitivity of CER to AOD (SCER) exhibited a negative correlation, with stronger sensitivity in the decreasing LWP regime than in the rapid growth regime. The spatial scale (characterized by buffer size and study area) significantly modulated these sensitivities: and the positive sensitivity of Nd to AOD (SNd) both decreased with increasing spatial scale. Optimal buffer sizes range from 6°×6° to 10°×10°: increasing with study area in period 2 but decreasing in period 1 for the decreasing LWP regime. Compared with period 1, in period 2 significantly reduced, reflecting the weakened aerosol-cloud interactions due to declining aerosol concentrations. Additionally, the optimal buffer sizes for SNd were larger in the 8°×8° and 10°×10° study areas than in 4°×4° and 6°×6° areas. This study reveals the scale-dependence of aerosol-cloud interactions, providing quantitative observational constraints for optimizing scale-aware aerosol-cloud parameterization schemes, particularly for constraining scale-dependent aerosol activation and cloud droplet autoconversion processes.
- Article
(8914 KB) - Full-text XML
- BibTeX
- EndNote


Aerosol particles, depending on their chemical composition and size, can serve as cloud condensation nuclei (CCN) in liquid clouds or as ice nucleating particles (INP) in ice clouds. When CCN are activated, they can alter the microphysical properties of clouds and affect precipitation, indirectly impacting the Earth's radiative budget through aerosol-cloud interactions (aci) (Tao et al., 2012; Fan et al., 2016; Rosenfeld et al., 2019; Rao and Dey, 2020; Bellouin et al., 2020; Dagan et al., 2023). An increase in CCN concentrations results in a larger number of cloud droplets (Nd), and if the cloud liquid water path (LWP) remains constant, it leads to a reduction in the cloud droplet effective radius (CER) (Twomey, 1974; Feingold, 2003). The reduced CER leads to an increased reflection of solar radiation, i.e. a higher cloud albedo, and enhances radiative forcing due to aci (RFaci). The impact of increasing aerosol particle numbers on cloud properties, while maintaining a constant LWP, is commonly known as the “Twomey” effect (Twomey, 1977; Feingold, et al., 2001; Matheson et al., 2005; Koren et al., 2005; Meskhidze and Nenes, 2010; Costantino and Bréon, 2010, 2013). Another aspect of RFaci involves quick adjustments, which could also cause changes in other cloud characteristics due to the rise in Nd and the decrease of CER. For example, this may lead to a reduction in precipitation efficiency, causing an increase in the LWP and cloud cover. As a result, the reflection of solar radiation is intensified (Albrecht, 1989). These two effects of aci are often categorized as the cloud albedo effect and the cloud lifetime effect (Quaas et al., 2008).
Extensive research on the impact of aerosols on the microphysical properties of clouds has been conducted utilizing satellite observations (Liu et al., 2017; Jia et al., 2022), aircraft measurements (Jia et al., 2019; Zheng et al., 2024), ground-based monitoring (Sarna and Russchenberg, 2016; Zheng et al., 2020), and numerical simulations (Lee et al., 2025; Li et al., 2008). Among these, satellite-based instruments have become a vital observational tool for studying aci due to their wide spatial coverage and high spatiotemporal resolution. However, optical satellite sensors such as the Moderate Resolution Imaging Spectroradiometer (MODIS) cannot effectively penetrate cloud layers (King et al., 2003; Kaufman et al., 2005; Remer et al., 2005), making it difficult to directly retrieve the optical properties of aerosols underneath clouds. Currently, aerosol data are mainly obtained in cloud-free conditions as determined using cloud detection methods. This limitation results in significant spatial mismatches between aerosol and cloud properties, often requiring aggregation of satellite data over large-scale grids for statistical analysis to determine relationships between aerosol and cloud parameters. The discrepancy between this large-scale analysis and the actual process scale frequently leads to biases in quantifying aerosol indirect effects, thereby significantly increasing the uncertainty in radiative forcing estimates (Lebsock et al., 2013; Altaratz et al., 2014; Ma et al., 2015; Possner et al., 2016; Bender et al., 2019).
In recent years, studies based on multi-source satellite data or multi-instrument joint observations have demonstrated that aerosol particles significantly influence cloud microphysical properties (Saponaro et al., 2017; Liu et al., 2018; Pandey et al., 2020). Numerous studies have validated the existence of the Twomey effect (Jones et al., 2009; Christensen et al., 2016; Jia et al., 2019). However, also studies have been published with findings that contradict the Twomey effect, particularly over land, where an increase in aerosol optical depth (AOD) results in an increase in CER (Feingold et al., 2001; Yuan et al., 2008; Grandey and Stier, 2010; Tang et al., 2014; Wang et al., 2015; Ma et al., 2018; Jia et al., 2019; Liu et al., 2020). These inconsistent findings highlight the complexity and regional variability of aci mechanisms, and further in-depth research is needed to reveal the underlying processes.
Currently, researchers usually use grid methods (such as 1°×1°, 2°×2°, etc.) to study the aerosol indirect effects in large areas (Bréon et al., 2002; Kaufman et al., 2005; Bulgin et al., 2008; Quaas et al., 2008). For instance, Grandey and Stier (2010) estimated the relationship between aerosols and CER on a global scale (60° N–60° S) using multiple spatial resolutions (1°×1°, 4°×4°, 8°×8°, 15°×15°, and 60°×60°). They concluded that the sensitivity of retrieved CER to AOD generally exhibited positive values over land and negative values over oceans, and pointed out that using grids larger than 4°×4° could introduce significant errors due to the spatial variability of aerosol and cloud parameters. Additionally, the study highlighted that, when using grids larger than 4°×4° to investigate the relationship between aerosols and CER, significant errors could be introduced in calculating the aerosol indirect effect index due to the spatial variability of aerosol and cloud parameters.
For studies focusing on smaller regions, researchers often employ a moving window or a fixed area referred to as a buffer zone, within which the distribution of aerosol concentrations is assumed to be uniform. Spatially matched samples are constructed by averaging AOD and cloud parameters within the window or buffer zone. The choice of the window or buffer size is often arbitrary, and existing studies rarely systematically explore how the detection of aci signals is influenced by the size of the area. For example, Yuan et al. (2008) used a 100 km ×100 km moving window to calculate the mean values of AOD and cloud properties to investigate the relationship between aerosols and CER across seven global regions. Their results indicated that only two of these regions, near the coasts of the Gulf of Mexico and the South China Sea, exhibited a positive correlation between CER and AOD. Similarly, Jones et al. (2009) utilized multi-source remote sensing data and applied a point spread function to derive the mean AOD within a 20 km range, which was designed to match the native 20 km resolution of the corresponding cloud properties (cloud optical thickness, COT; LWP; CER; cloud top pressure, CTP). Their study examined the influence of aerosol types, cloud conditions, and atmospheric factors on aerosol indirect effects across six different oceanic regions globally, finding that the sensitivity of cloud properties to AOD varied substantially with regional characteristics. In addition, significant progress has been made in research utilizing observations from the Cloud-Aerosol Lidar with Orthogonal Polarization (CALIOP) data (Winker et al., 2007). For instance, Costantino and Bréon (2010) used CALIOP data to investigate the aerosol influence on CER in stratocumulus clouds over the coastal regions of Namibia and Angola. They performed the analysis by co-locating an aerosol index (based on AOD and the Ångström exponent) with CER within a 150 km buffer zone around CALIOP observations. They found that there was no correlation between aerosol load and CER when aerosol and cloud layers were clearly separated, but a strong correlation when lidar profiles indicated mixing. Costantino and Bréon (2013) further analyzed the statistical relationship between aerosol concentrations and cloud physical parameters by examining aerosol and cloud properties within a 20 km buffer zone around CALIOP samples, integrating vertical profiles of aerosol and cloud data. Their statistics also clearly showed that cloud micro-physical properties were affected by aerosols when aerosol and cloud layers were mixed, decreasing the CER. It is noted that these two studies by Costantino and Bréon (2010, 2013) reached consistent conclusions about aci (i.e., aerosols modulate CER when layers interact), by adopting different buffer sizes (150 km vs. 20 km) to target distinct study areas. This demonstrates that the buffer size is tailored to the research objectives rather than through a systematic sensitivity analysis. Wang et al. (2015) revealed an inverse “Twomey” effect between aerosols and CER in eastern China by analyzing aerosol concentrations and CER within a 50 km buffer zone around CALIOP samples. Their results showed that larger CER was associated with high AOD, which was attributed to the feedback of microphysical processes from intense competition for vapor in the presence of high aerosol concentrations and the evaporation of smaller, less hygroscopic, droplets. Similarly, Liu et al. (2017) systematically examined the response mechanisms of warm cloud macro- and microphysical parameters to increasing AOD in the Yangtze River Delta region, also using CALIOP samples within a 50 km buffer zone. They found that the relation between cloud properties and AOD depended on the aerosol abundance, with a different behavior for low and high AOD (i.e. AOD <0.35 and AOD >0.35). However, both Wang et al. (2015) and Liu et al. (2017) used a fixed 50 km buffer zone without justifying the choice or exploring how varying buffer sizes might alter the strength or robustness of their findings – a common limitation in regional aci studies. More recently, Liu et al. (2024) quantified the relative importance of aerosols, meteorological parameters and their interactions for cloud properties in the eastern coastal and inland regions of China, utilizing MODIS 1°×1° aerosol and cloud product data. Their study confirmed that CER decreased with the increase in AOD in the moderately polluted atmosphere (0.1< AOD <0.3) over the East China Sea, whereas, in contrast, CER increased with increasing AOD in the polluted atmosphere (AOD >0.3) over the Yangtze River Delta. These studies have provided critical scientific insights into aci at regional scales, but the lack of systematic scale sensitivity analysis – especially for varying window/buffer sizes within the same regional domain – leaves uncertainties about the generalizability of their conclusions.
However, the properties and interaction processes of aerosols and clouds are spatially significantly heterogeneous and scale dependent (McComiskey et al., 2009; McComiskey and Feingold, 2012; Chen et al., 2015; Glotfelty et al., 2020). McComiskey and Feingold (2012) explicitly pointed out that the “scale problem” is a major challenge in quantifying aerosol indirect effects, as the spatial scale of observation can mask or exaggerate the true interaction signals. In previous studies, the definitions of window size and buffer size have often been subjective, inadvertently introducing uncertainties into the research on aci. Although studies have explored the relationship between aerosols and CER across different observational scales, these investigations have primarily focused on larger spatial scales, leaving a gap in sensitivity analysis of aerosol indirect effects at smaller regional scales. For example, Grandey and Stier (2010) focused on global-scale grid resolutions but did not explore the scale dependence within regional domains; Wang et al. (2015) and Liu et al. (2017) used fixed buffer sizes (50 km) without investigating how varying buffer sizes affect the results. Therefore, identifying the spatial scale dependence of the aerosol indirect effect over eastern China provides observationally based coefficients. These coefficients can be used to develop regionally adapted, scale-aware parameterization schemes that better represent regional ACI characteristics.
Aerosol properties in China have significantly changed between 2008 and 2022 due to economic development and the implementation of emission reduction policies. The AOD over China increased until 2007 to become among the highest worldwide and remained high between 2008 and 2014 with large interannual variations. The enforcement of emission reduction measures, in particular the implementation of the 2013–2017 Clean Air Action Plan, resulted in the decline of the AOD between 2014 and 2018 (de Leeuw et al., 2021, 2022, 2023) and a further decrease resulted in an AOD lower than that in 2000 (de Leeuw et al., 2023). This distinct two-period variation (high AOD vs. decreasing AOD) provides a unique opportunity to investigate how changes in aerosol loading modulate the scale dependence of aerosol indirect effects, a topic that has not been systematically addressed in previous studies. Based on these observations, in this study we conduct a comparative analysis of the sensitivity of cloud parameters (CER and Nd) to AOD variation using data from two distinct periods: 2008–2014 (period 1, high AOD) and 2015–2022 (period 2, decreasing AOD). The main objectives of this study are to: (1) reveal patterns of the sensitivity of aerosol indirect effects to spatial scales by investigating how spatial scale modulates the sensitivity of CER to AOD (SCER) and the sensitivity of Nd to AOD (SNd) over eastern China during the two periods; and (2) clarify the regulatory role of LWP in aci by examining the LWP-stratified responses of SCER and SNd to spatial scale and AOD variations. This study reveals the spatial scale-dependent sensitivity of aerosol indirect effects, supporting the development of scale-adaptable parameterization modules and improved regional aerosol effect assessment under different model grid resolutions.
2.1 Study area
Eastern China (30–40° N, 112–122° E; Fig. 1) has undergone remarkable economic expansion over the past three decades, which was accompanied by a substantial increase in AOD. Eastern China presents a unique atmospheric laboratory due to its complex aerosol composition – featuring both anthropogenic pollutants from industrial emissions and natural mineral dust transported from Central Asian deserts, particularly during the spring (Proestakis et al., 2018; Liu et al., 2021). The multitude of sources and the persistent nature of these aerosol particles, which can remain suspended for days to weeks and be transported over long distances in the absence of precipitation (Costantino and Bréon, 2013; Li et al., 2016; Leung et al., 2023), makes eastern China an ideal study area for investigating aci. Our research leverages satellite observations to systematically evaluate the sensitivity of cloud properties (SCER and SNd) to the AOD variation, thereby revealing the scale-sensitive patterns of aerosol indirect effects and clarifying the regulatory role of LWP in aci over this region.
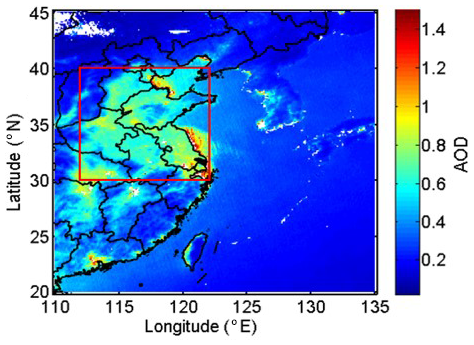
Figure 1Map of annual averaged MODIS/AQUA level 2 AOD for all years during the period from 2008 to 2022. The red rectangle (30–40° N, 112–122° E) indicates the study area.
2.2 Data used
Data used in this study were acquired by the MODIS instrument aboard NASA's Aqua satellite, which features an extensive swath width of approximately 2300 km and comprehensive spectral coverage across multiple bands (King et al., 2003). The satellite's equator crossing time is 13:30 (Local time, i.e. in the early afternoon, coinciding with optimal development conditions for continental warm cloud systems (Wang et al., 2014; Liu et al., 2024). For aerosol characterization, we utilized the MODIS Collection 6.1 aerosol product (MOD04), generated from cloud-screened pixels with a native resolution of 500 m at nadir and subsequently aggregated to 10 km grid cells (Remer et al., 2005; Levy et al., 2010). AOD retrieval over land uses radiances measured at the top of the atmosphere (TOA) at wavelengths of 0.47, 0.66, and 2.13 µm (Remer et al., 2005). The MODIS AOD (at 550 nm) Level 2 product (10 km ×10 km) has been validated against ground-based remote sensing data and the results show that 69.40 % of the MODIS AOD data fall within the expected uncertainty of ± (0.05+15 %) over land (Levy et al., 2013). In this study, AOD larger than 1.5 was excluded from further analysis to mitigate potential retrieval overestimation. This threshold was selected based on two key considerations: (1) Christensen et al. (2017) used MOD06 C6 data (1 km ×1 km) and reported that “large aerosol optical depths remain in the MODIS-observed pixels near cloud edges, due primarily to 3D effects (Várnai and Marshak, 2009) and the swelling of aerosols by higher relative humidity”; (2) the threshold of 1.5 aligns with widely adopted thresholds in regional aci studies over eastern China, where high AOD often coincides with complex surface conditions (e.g., urbanization, heterogeneous land cover) that exacerbate retrieval biases (Wang et al., 2015; Liu et al., 2017, 2021).
The cloud properties used in this study, including CER, LWP, COT, CTP, and cloud phase infrared (CPI) index, were derived from the Collection 6.1 MODIS Level 2 cloud product (MYD06) (King et al., 2003). The retrieval of these cloud characteristics utilizes six spectral channels spanning wavelengths from the visible to the near-infrared (0.66, 0.86, 1.24, 1.64, 2.12, and 3.75 µm) as described by King et al. (1997). Uncertainties in the MODIS C6.1 cloud parameters over land originate from instrument calibration, atmospheric correction, land surface properties, and model assumptions (Platnick et al., 2017, 2018). For COT, these include scene-dependent Level 1B data errors (1.5 %–30 %), land surface albedo errors (±15 %), and atmospheric correction errors (±20 %). The C6.1 algorithm addresses some prior limitations by inheriting C6's optimized lookup table design, which reduces interpolation errors to 0.1 %–0.2 % for near-nadir views and corrects C5's overestimation of thin-cloud COT (Platnick et al., 2017). CER uncertainties, stemming from solar irradiance error (∼4 % at 3.7 µm), atmospheric correction, and scattering differences, are mitigated as C6.1 retains C6's separate multi-band reporting, thereby eliminating C5's systematic bias (Platnick et al., 2017). LWP uncertainty is linked to COT/CER retrieval errors and cloud-phase classification accuracy; the latter is improved by C6's voting-based phase algorithm (preserved in C6.1), which reduces misclassification over complex surfaces like vegetation and deserts (Marchant et al., 2016; Platnick et al., 2017). For CTP (1 km resolution), uncertainties from viewing angles and cloud structure are partially countered in C6.1 by assigning fill values when the 1 km retrieval fails, avoiding surface parameter defaults. For land clouds above 3 km, CTP accuracy reaches ∼ 50 hPa (Baum et al., 2012). Finally, CPI adopts C6's weighted voting logic (replacing C5's sequential tree), with C6.1 maintaining an enhanced Phase Agreement Fraction against CALIOP/POLDER data, which reduces uncertainties from weak thin-cloud signals and complex land interference (Marchant et al., 2016; Platnick et al., 2017).
Following the methodology of Platnick et al. (2017), CER and COT measurements at 3.7 µm were used to estimate Nd through adiabatic approximation principles (Quaas et al., 2006). Previous investigations have demonstrated that implementing filters based on cloud adiabaticity produced minimal effects on SNd estimates while significantly reducing the available dataset by up to 63.00 % (Gryspeerdt et al., 2022). Therefore, such filtering procedures were not adopted in the current analysis. Instead, Nd calculations are initially performed at the native pixel resolution (approximately 1 km) prior to spatial aggregation, thereby avoiding potential biases associated with deriving Nd from nonlinear combinations of CER and COT at coarser resolutions (Feingold et al., 2022). To maintain data quality, the analysis incorporated several quality control measures: only single-phase liquid clouds (CPI =1) with CTP exceeding 700 hPa and LWP smaller than 200 g m−2 are considered, consistent with the typical atmospheric distribution of aerosols in the lower troposphere (Michibata et al., 2014). Pixels with CER values smaller than 4 µm or COT values smaller than 4 were excluded due to increased retrieval uncertainties (Sourdeval et al., 2016). Additionally, observations were restricted to solar zenith angles <65.00° and sensor zenith angles <41.40°. This constraint was intended to reduce the influence of well-documented biases, as elaborated in Grosvenor et al. (2018).
CALIPSO (Cloud-Aerosol Lidar and Infrared Pathfinder Satellite Observations) operates within the A-Train constellation alongside the Aqua satellite and other NASA Earth-observing platforms. The primary instrument aboard CALIPSO is the Cloud-Aerosol Lidar with Orthogonal Polarization (CALIOP). CALIOP is a two-wavelength, polarization-sensitive lidar specifically designed to provide high-resolution vertical profiles of aerosols and clouds on a global scale (Winker et al., 2009). The mission and its lidar instrument are described in Winker et al. (2009), and the associated Level 1 data products are detailed in Winker et al. (2010). This advanced sensor features an exceptionally narrow ground footprint of 70 m diameter for each laser pulse. The vertical resolution of CALIOP's products varies with altitude: 30 m within 0–8.2 km, 60 m between 8.2–20.2 km, and 180 m from 20.2–30.1 km, while maintaining a consistent 5 km horizontal resolution along the track direction (Liu et al., 2009).
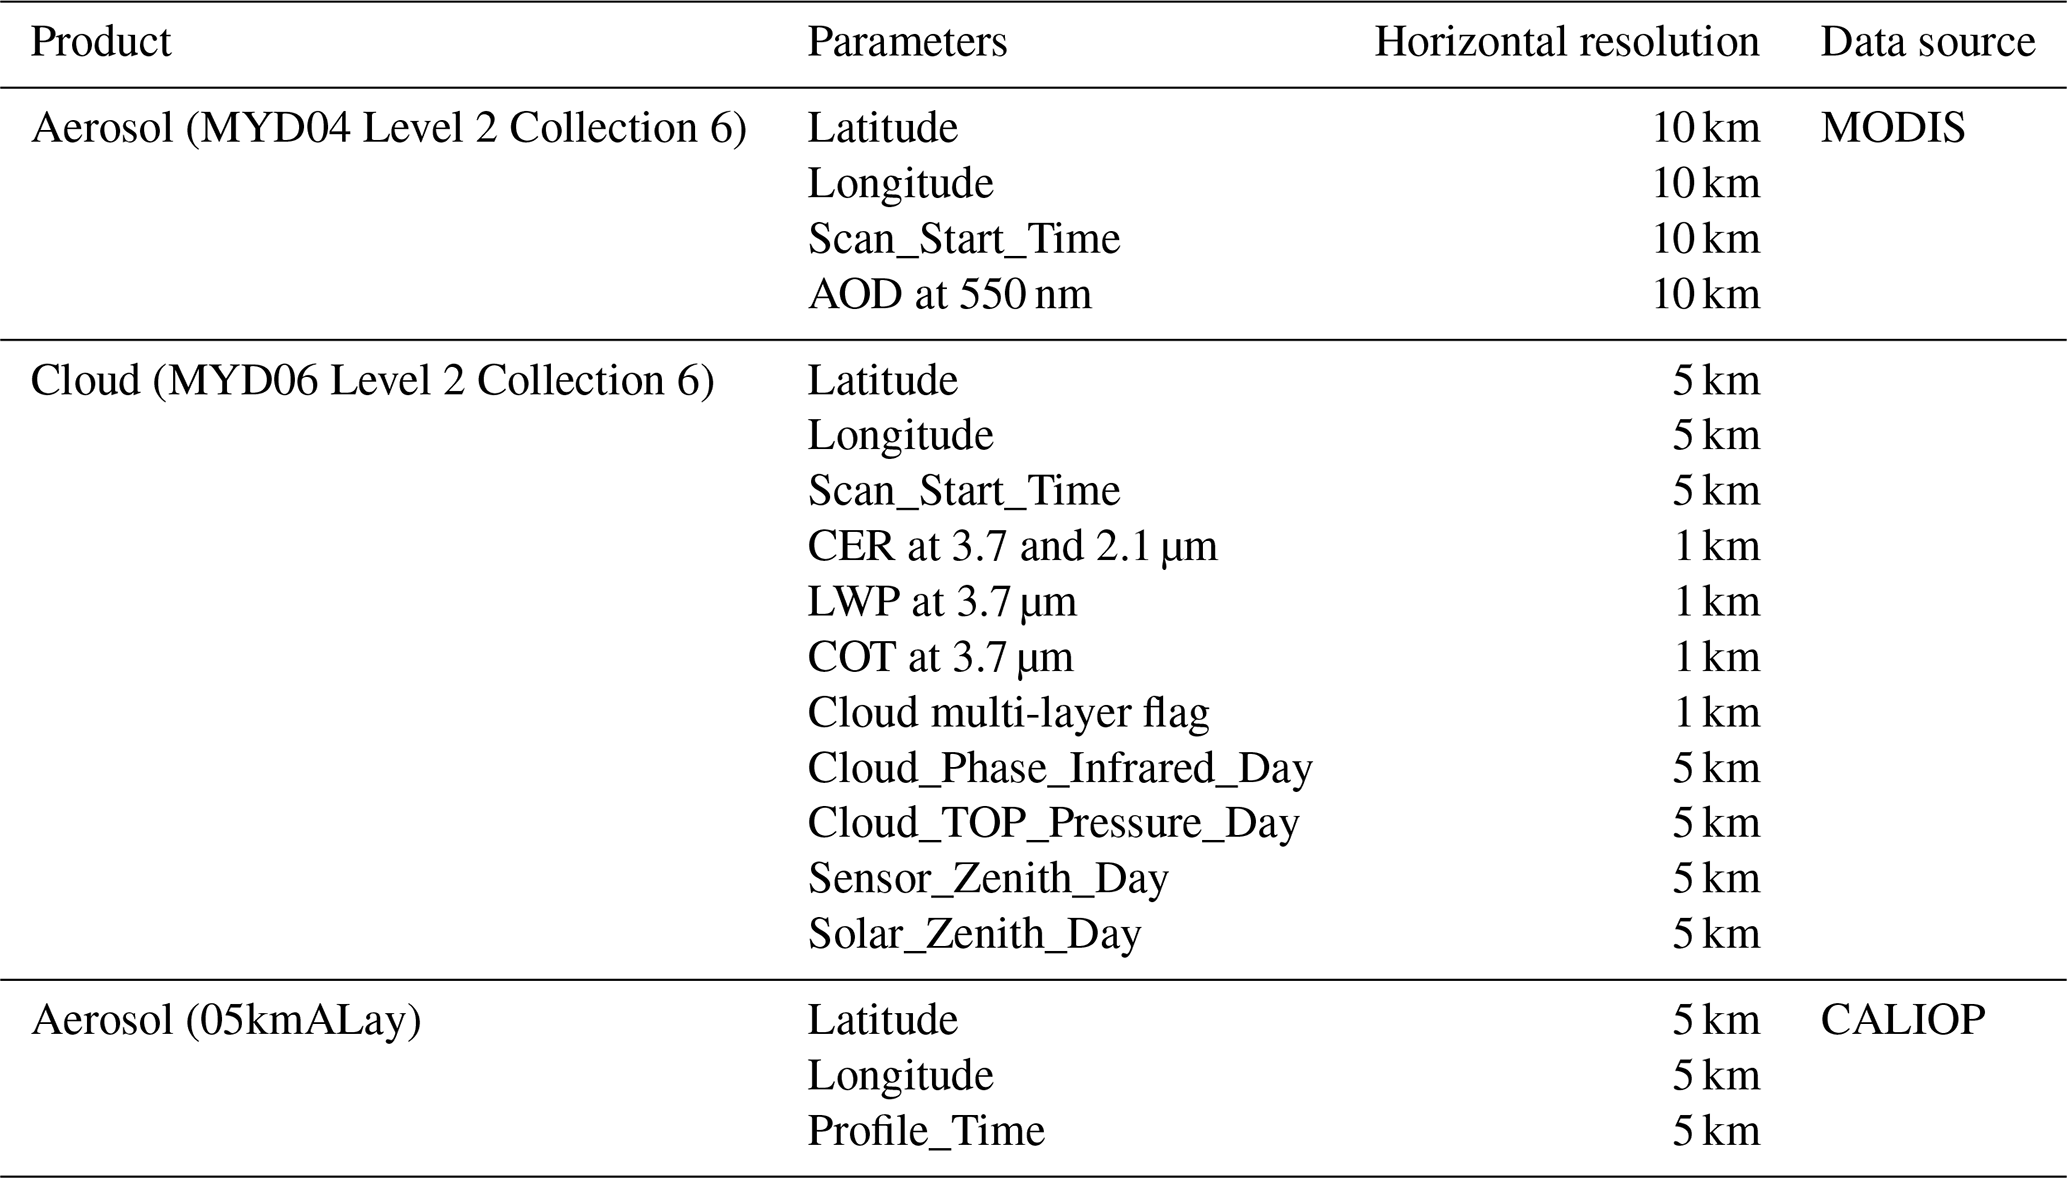
The coordinated A-Train configuration ensures near-simultaneous observations (within 1–2 min) between MODIS/Aqua and CALIOP/CALIPSO for identical atmospheric targets (Stephens et al., 2002). This temporal synchronization guarantees data consistency when extracting coincident measurements, avoiding interferences such as aerosol diffusion and cloud evolution caused by observational time lags – an advantage unparalleled by positioning methods like random grid points and ground-based stations. For spatial compatibility, we resampled the higher-resolution MODIS cloud products (CER, LWP, and Nd at 1 km native resolution) to match CALIOP's 5 km along-track scale, while directly utilizing the 5 km-resolution CTP and CPI parameters. In cases where CALIOP detected aerosol presence, we computed spatial averages of MODIS aerosol and cloud retrieval products across multiple observation scales (detailed in Sect. 2.4) centred on CALIOP targets. This approach assumes reasonable homogeneity of aerosol properties between adjacent clear and cloudy regions (Anderson et al., 2003; Quaas et al., 2008). Table 1 provides a comprehensive overview of the aerosol and cloud datasets including the parameters used from each product, the resolution, and the data source, used in this study.
Table 1Aerosol and cloud products, parameters, horizonal resolutions, and their sources applied in the present study.
2.3 Calculation of sensitivities
Variations in aerosol loading significantly influence cloud optical properties (such as COT) and microphysical parameters (such as CER). Under specific environmental conditions, aerosol particles can transform into CCN or INP, a process primarily determined by their chemical composition and ambient temperature (Bellouin et al., 2020). When these nuclei are activated, water vapor condenses on their surfaces to form cloud droplets or ice particles. As the concentration of aerosol particles increases, the number of CCN or INP may rise correspondingly, leading to an increase in the number of cloud droplets. Notably, under conditions where the liquid water content in clouds remains constant (i.e., LWP), the same amount of water vapor is distributed across more cloud droplets, resulting in a reduction in the size of individual droplets. Specifically, as aerosol concentration increases, the CER decreases, while cloud albedo increases. On the basis of findings of Kaufman and Fraser (1997), Feingold et al. (2001) pointed out that the sensitivity of cloud microphysical properties (e.g., CER) to changes in the number concentration of aerosol particles (e.g., using AOD as a measure) can be described by the following formula:
where re represents the CER and α represents the AOD. Following Andreae (2009), AOD and CCN are correlated and AOD varies with CCN following a power law relationship. Equation (1) describes the relative change of CER with the relative change of the AOD for constant LWP. It is noted that this formulation differs from that used in recent studies (e.g., Bellouin et al., 2020) where S is expressed in terms of Nd with no restriction in LWP. The sensitivity S of CER to AOD can be determined as the slope of a linear fit to a log-log plot of CER versus AOD. The effect of aerosols on CER is analyzed by comparing the difference in SCER and correlation coefficients between AOD and CER under different spatial scales (Sect. 2.4) and LWPs (Sect. 3.2).
In this study, the variation in Nd with CCN is referred to as the susceptibility SNd. Following the method of Gryspeerdt et al. (2023), the sensitivity, SNd, of a cloud property, Nd, to α is defined here as
Relations between CER and Nd and AOD are determined through Eqs. (1) and (2) and correlation coefficients R. The significance of these relations is determined by using the student's t test, i.e. the results are statistically significant when the p value is smaller than 0.01, where p is defined as the probability of obtaining a result equal to or “more extreme” than what was actually observed.
This method quantifies the sensitivity of CER and Nd to AOD variations via linear regression in log-log space, using Eqs. (1) and (2), respectively. Its core assumptions, uncertainties, and limitations are highly consistent: both rely on AOD as an aerosol proxy variable, assume constant cloud liquid water content and a linear sensitivity relationship, and depend on the reliability of satellite-retrieved parameters (Feingold et al., 2001; Gryspeerdt et al., 2023). However, AOD cannot distinguish aerosol size and hygroscopicity, retrieval errors are substantial in clean conditions, and linear fitting fails to capture nonlinear/non-monotonic responses. Both methods are constrained by satellite retrieval biases, limited scenario applicability (only valid for specific homogeneous clouds and aerosol types), the omission of key modulating factors (dynamical conditions, aerosol type) and feedback processes, and can only assess first-order direct effects. Reliability requires scenario constraints and uncertainty analysis; the only nuances come from the target variable (CER vs. Nd), which do not alter the shared methodological limitations.
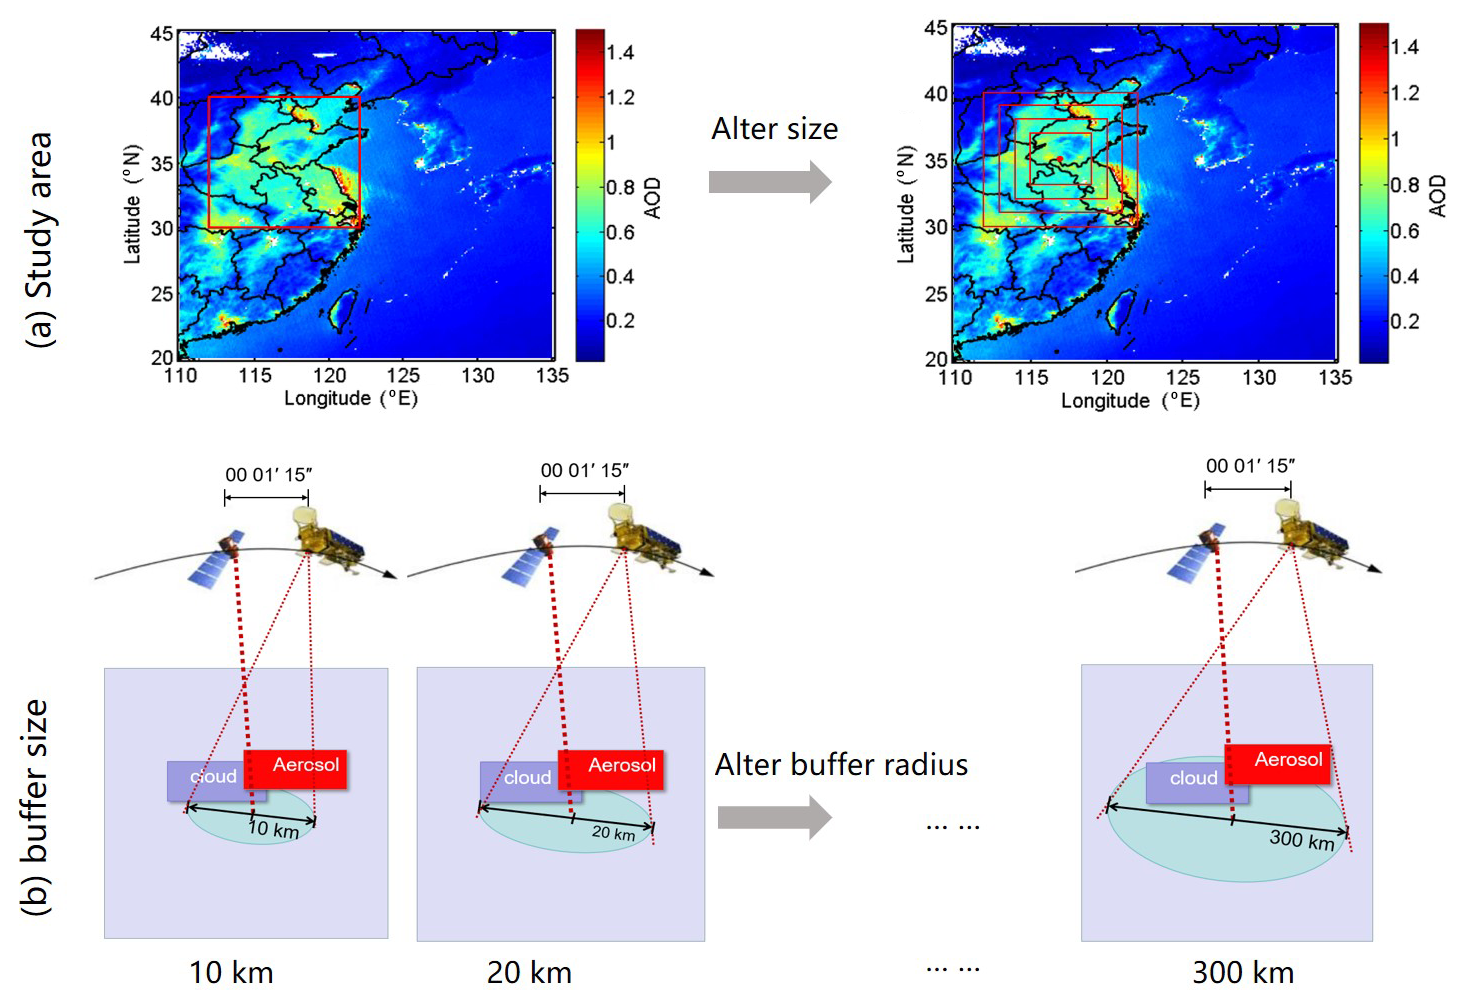
Figure 2(a) Schematic diagram of study area and buffer size patterns applied in this study. (b) scheme of CALIPSO-MODIS coincidence methodology. When CALIPSO detects the presence of aerosol and cloud fields, we look for MODIS retrievals within a buffer size from the CALIPSO target. The temporal coincidence is insured by the coordinated satellite orbits.
2.4 Research design for scale effects analysis
This study was conducted at multiple spatial scales to examine the scale dependence of SCER and SNd in delineating aci (Fig. 2). Here, the spatial scales are described by two parameters: study area size (the geographic scope of the analysis) and buffer size (the local spatial extent around each observation point for aggregating aerosol and cloud data). To this end, the study area was divided into four congruent square research areas all centered at the same geographical location (35° N, 117° E) over Eastern China. Hence, spatial extent varies from the whole study area as defined in Sect. 2.1 (30–40° N, 112–122° E) to successively smaller areas simulated by decreasing the study area in steps of 2 to 4°×4° as illustrated in Fig. 2a.
Buffer size refers here to a circular spatial domain centered at each point in the study area where CALIOP detected the presence of aerosols. Within this circular domain, MODIS-retrieved cloud and aerosol data (AOD, CER, Nd, LWP) are spatially averaged to construct matched aerosol-cloud datasets at different local scales. As previously noted, this approach relies on the assumption that aerosol properties are reasonably homogeneous between adjacent clear and cloudy regions (Anderson et al., 2003; Quaas et al., 2008), and this premise is supported by the short-range transport of aerosols (e.g., 10–300 km) and the near-simultaneous observations (1–2 min) by MODIS and CALIOP within the A-Train constellation.
Buffer zones with sizes increasing from 10 to 300 km (10, 20, 30, 40, 50, 60, 70, 80, 90, 100, 120, 140, 150, 160, 180, 200, 250, and 300 km) were determined within the whole study area by using CALIOP data. Previous observations indicate that the typical horizontal scale of cloud clusters ranges from tens to hundreds of kilometers (Zhang et al., 2024; Cai et al., 2022), supported by CloudSat/CALIPSO satellite data showing power-law distributed cloud scales (10–1000 km fitting range) covering major cloud types (Zhang et al., 2024) and regional evidence of consistent multi-season, multi-latitude cloud extents (Cai et al., 2022). Meanwhile, aerosol spatial homogeneity varies with distance: local-scale aerosols (≤50 km) exhibit high homogeneity due to consistent sources and stable diffusion, while regional-scale aerosols (>100 km) show enhanced heterogeneity from multi-source mixing and atmospheric transport (Hassan et al., 2024; Mohebalhojeh et al., 2026). Thus, the 10–300 km buffer range covers both cloud characteristic scales and the aerosol homogeneity transition range, ensuring that MODIS data averaging effectively captures aci. This range avoids insufficient MODIS pixel coverage due to excessively small buffer sizes (<10 km). It also prevents conflation between regional meteorological variations and local aci signals arising from overly large buffer sizes (>300 km), as synoptic-scale circulation and other regional meteorological changes may interfere with local aci signals (Quaas et al., 2010). Meanwhile, this range aligns with the 50–150 km buffer sizes widely adopted in regional aci studies (Wang et al., 2015; Liu et al., 2017, 2024), enabling cross-validation of results and ensuring that MODIS data averaging effectively captures aci.
MODIS-retrieved cloud and aerosol data were averaged over a buffer area around each CALIOP data point with a radius varying from 10 to 300 km. Thus, a dataset including aerosol and cloud properties was constructed with different buffer sizes. The effect of buffer size on the sensitivity of CER and Nd to variations in AOD was determined in each study area varying from 4°×4° to 10°×10°. To this end, for each buffer size, the averaged AOD and cloud parameters were paired to calculate the sensitivities SCER (Eq. 1) and SNd (Eq. 2), as well as their correlation coefficients (R) between cloud properties (e.g., CER, Nd) and AOD. The optimal buffer size for each study area is defined as the one maximizing the R. This definition is adopted based on two core considerations. Firstly, it aligns with the statistical principle that a higher R value indicates a stronger linear correlation between the two variables in log-log space, minimizing the interference of random noise and non-aerosol confounding factors on the sensitivity estimation (Quaas et al., 2006; Gryspeerdt et al., 2022). This ensures that the derived SCER can reliably reflect the intrinsic relationship between aerosol loading and cloud droplet effective radius, rather than spurious correlations caused by inappropriate spatial scales. Secondly, this definition also facilitates comparability with existing literature, as it aligns with the methodological framework of satellite-based aci studies (Saponaro et al., 2017; Liu et al., 2021). In these studies, the optimal spatial scale is typically identified by maximizing the statistical robustness of variable correlations.
The dataset was used to study the characteristics of aerosol indirect effects as function of buffer size and study area, for two different periods: one with a high aerosol content (2008–2014) and another one with a decreasing aerosol content (2015–2022). This approach determined the optimal buffer size for aerosol indirect effect estimations as a function of study domain size, providing key observational constraints for constructing scale-adaptive parameterization frameworks suitable for different domain sizes over eastern China.
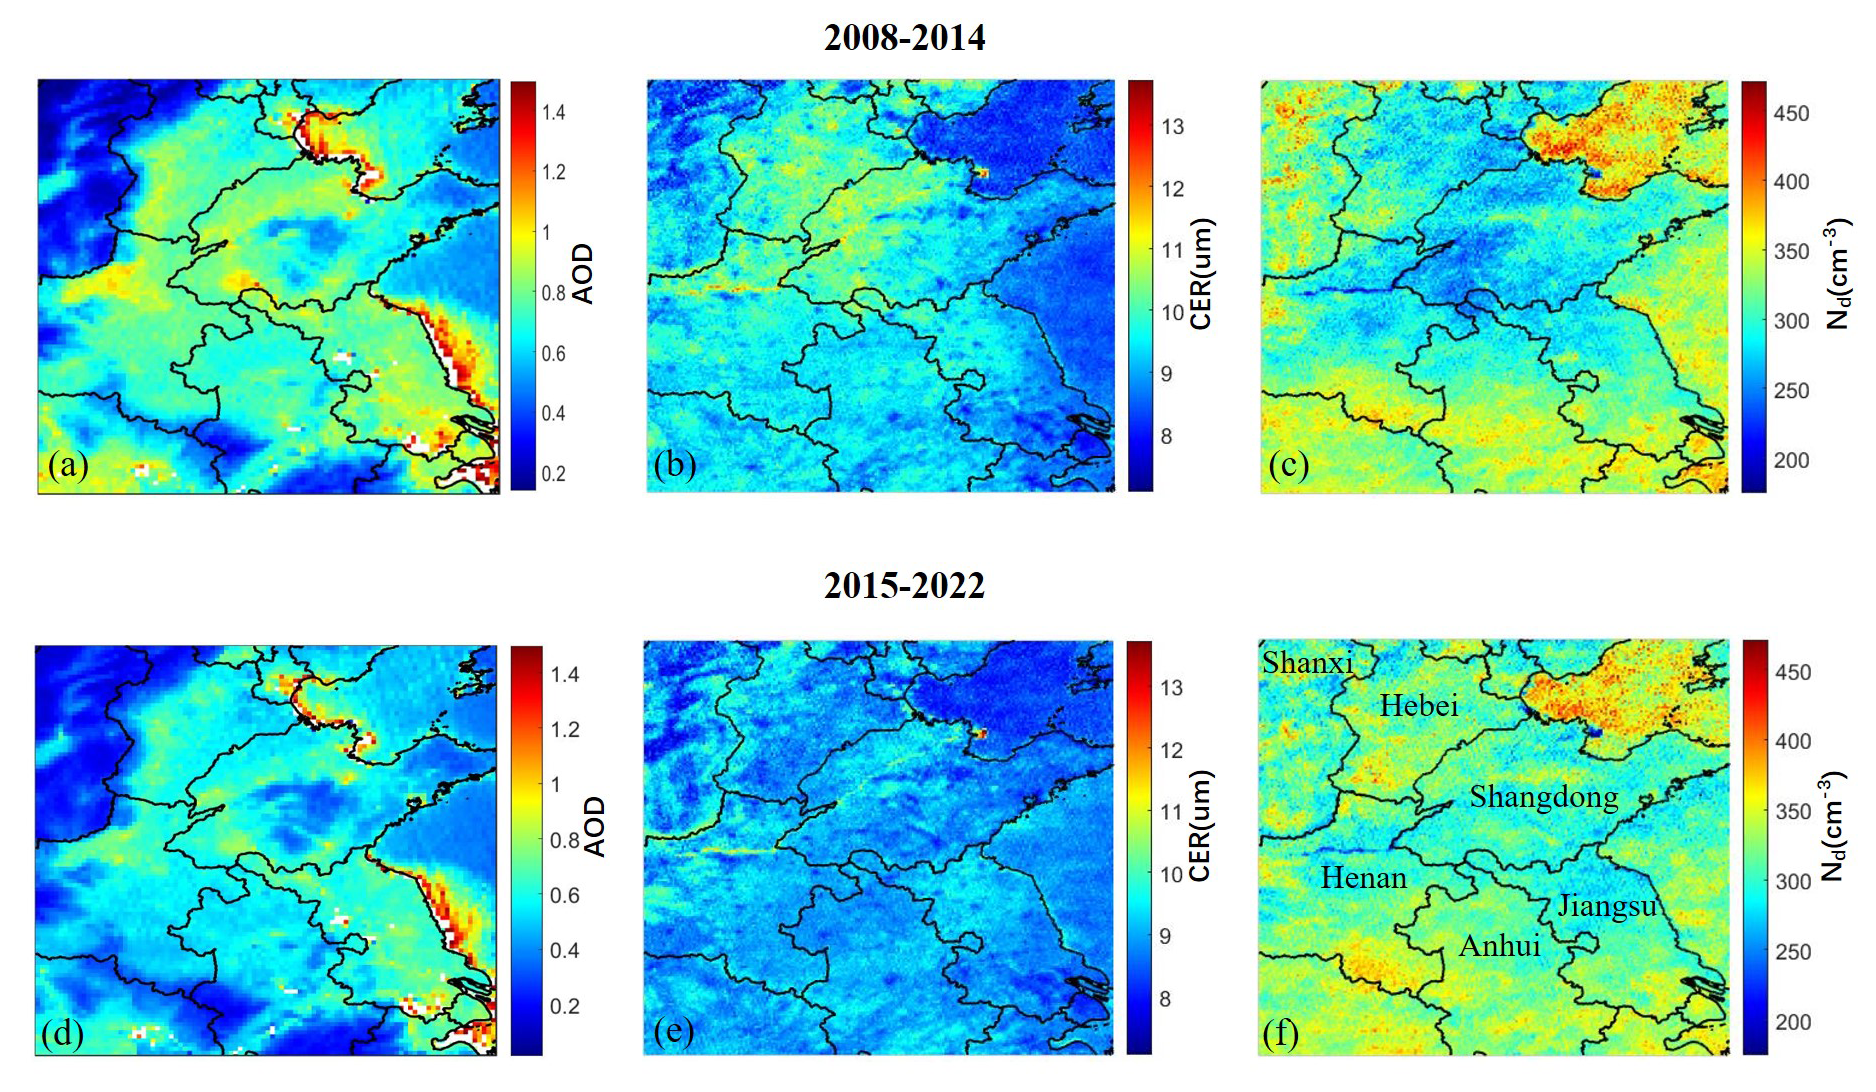
Figure 3Spatial distributions of AOD (a, d), CER (b, e) and Nd (c, f), averaged over the years 2008–2014 (top row) and 2015–2022 (bottom row) over the study area. The lines are provincial borders and the names of provinces mentioned in the text are indicated in (f).
3.1 Spatial variations of aerosol and cloud parameters
Figure 3 illustrates the spatial distributions of AOD and cloud properties (CER and Nd) across the study region, averaged for the periods 2008–2014 and 2015–2022. The AOD spatial patterns (Fig. 3a, d) show similar spatial distributions during both periods, but with notably reduced values during the latter. Pronounced spatial gradients in AOD are evident during both periods. The lowest AOD values occur over the mountainous regions of Shanxi province in the northwest, while elevated concentrations appear in the southeastern areas encompassing the Hebei and Shandong provinces. This geographical contrast arises from the mountain ranges that demarcate the heavily industrialized, densely populated North China Plain (NCP) in the east – characterized by substantial anthropogenic emissions – from the relatively cleaner western regions. Under prevailing southeasterly wind conditions, these topographic barriers effectively block transport of atmospheric pollutants which accumulate along their windward slopes (Sundström et al., 2012). The concentration of heavy industries and power generation facilities in the NCP are primarily responsible for the observed high AOD concentrations, together with meteorological and geographical conditions. Additionally, lower AOD values appear in southern Anhui and central Shandong relative to the surrounding regions.
The CER spatial distributions (Fig. 3b, e) reveal distinct differences between the two periods. During 2008–2014, larger cloud droplets predominated in the northern sectors, particularly throughout Hebei and western Shandong. Notably, the spatial correspondence between AOD and CER maxima aligns with the anti-Twomey effect, suggesting that the high aerosol loading promoted cloud droplet growth rather than suppression – consistent with findings from Wang et al. (2014) and Liu et al. (2018). The 2015–2022 period shows markedly reduced CER values (typically <10 µm) with enhanced spatial homogeneity.
Similarly, Nd exhibits contrasting spatial patterns between the two periods (Fig. 3c, f). The earlier timeframe shows depressed Nd values in central regions surrounded by elevated concentrations peripherally. This pattern reverses during 2015–2022, with increases of Nd in the central area accompanied by overall reduction of the cloud droplet concentrations in the surrounding regions.
3.2 Sensitivity of CER to AOD stratified by LWP
Before analyzing the influence of AOD on CER, the relationship between CER and LWP should be investigated. The values of the LWP were divided into 40 subsets with a width of 5 g m−2, and then the average value of CER in each subset was calculated and plotted as function of LWP (Fig. 4).
The variation of CER with LWP shows three regimes. For LWP smaller than 55 g m−2 (period 1) or 50 g m−2 (period 2), CER increased rapidly with the increase of LWP. This first LWP regime is referred to as a rapid growth regime (LWP1). The second LWP regime, referred to as a decreasing regime (LWP2), applies to the LWP range from 55 to 135 g m−2 (period 1) or 50–100 g m−2 (period 2) and CER decreased with the increase of LWP. When LWP was greater than 135 g m−2 (period 1) or 100 g m−2 (period 2), CER increased with increasing LWP but at a much slower rate than during the first regime; the third LWP regime is therefore referred to as a slow growth regime (LWP3). These results show that CER is very sensitive to the changes in LWP, which is consistent with the study of Liu et al. (2021). Specifically, CER exhibited a three-stage variation with LWP: rapid growth when LWP <50 g m−2 (with the fastest change rate), a stable state during 50–150 g m−2 , and slow growth when LWP >150 g m−2 (at a rate much lower than the first stage). This highlighted the necessity of fixing LWP conditions to accurately investigate the impact of AOD on CER. To separate the effects of changing LWP on CER from those of changing AOD on CER, relations between CER and AOD were evaluated for constant LWP (McComiskey and Feingold, 2012), for each of the three regimes mentioned above, by using double-logarithmic plots of AOD versus CER. The number of CER observations in the third regime is too small to achieve statistically meaningful results, therefore the sensitivity of CER to AOD was only analyzed for the rapid growth and decreasing regimes.
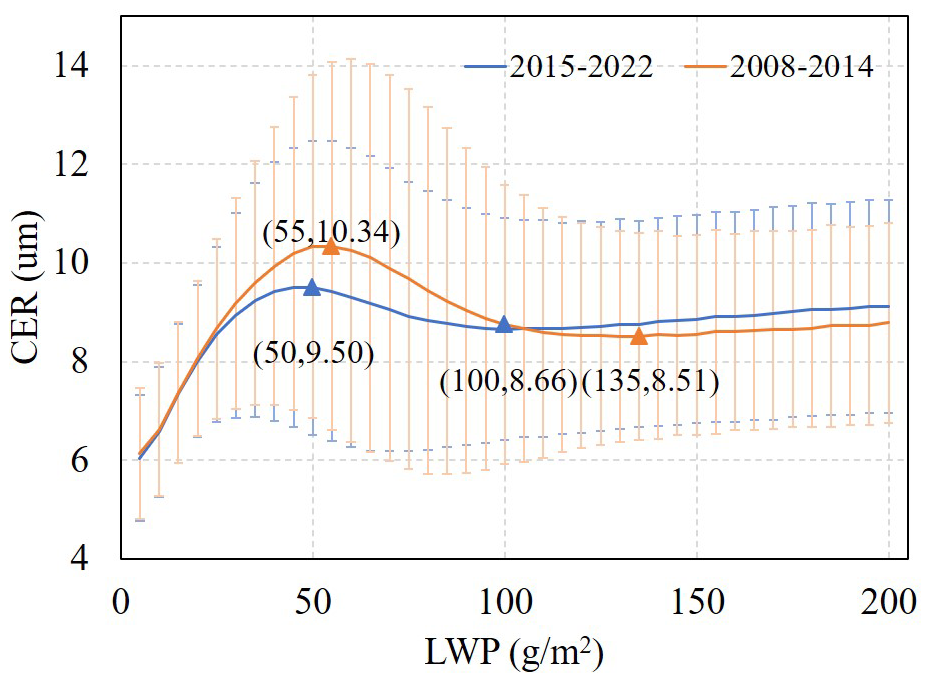
Figure 4Variation of CER with LWP over the study area. Here all CER data were averaged in LWP bins, from 0 to 200 g m−2 with a width of 5 g m−2. The red line is a fit to the data during 2008–2014 and the blue line for the data during 2015–2022. The numbers in parentheses indicate the (LWP, CER) values for the inflection points between the regimes. The error bars (the vertical lines) denote the standard deviations, indicating the variability of CER around the average at each LWP value.
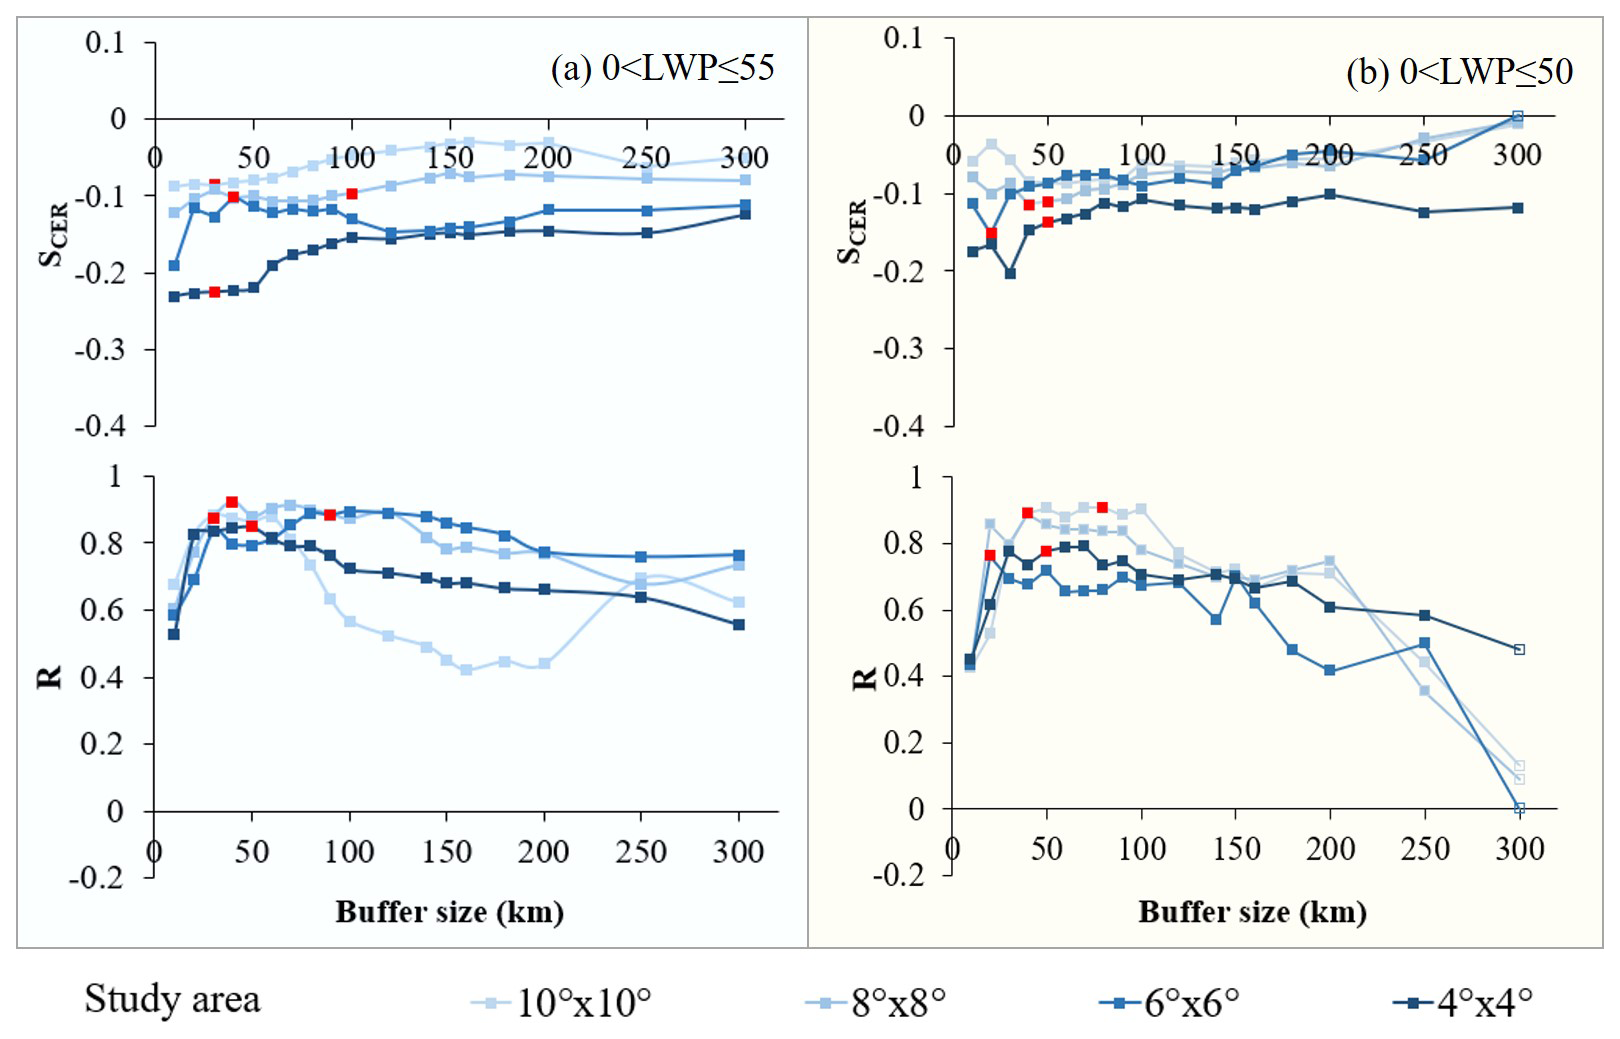
Figure 5Variation of SCER (top) and correlation coefficient R (bottom) with buffer size for different study areas (see legend at the bottom) for (a) the LWP regime with 0< LWP ≤55 g m−2 over the years 2008–2014 and (b) the LWP regime with 0< LWP ≤50 g m−2 over the years 2015–2022. Filled squares indicate that the results are significant at the 0.01 level and open squares indicate that the results are not statistically significant. Red solid squares indicate the optimal buffer sizes for each study area, as shown in Appendix Table A1.
3.2.1 Rapid CER growth regime
For the first LWP regime, the SCER is negative (as shown in Fig. 5). This aligns with the Twomey effect (Twomey, 1977): an increase in aerosols raises the number of CCN, and with constant LWP, less water vapor is available per cloud droplet, reducing CER, increasing cloud albedo, and ultimately cooling the atmosphere. This indicates that, in the rapid growth regime, the interaction between AOD and CER in the target region is in agreement with the Twomey effect. The data in Fig. 5a show that during period 1, SCER varies with buffer size and that the variations are different for different study areas. The value of is smallest for the largest study area (10°×10°) and decreases with buffer size to a minimum for buffer size of 150 km and then increases. For the smallest study area (4°×4°), the sensitivity exhibits a much stronger negative correlation, with its magnitude decreasing as the buffer size expands, especially for 50 km < buffer size <100 km. For the 2 intermediate study areas, the sensitivities are initially similar (except for the smallest buffer size) and diverge for buffer size >100 km. The data show that the value of overall becomes smaller as study area increases. The decrease of with increasing study area is mechanistically tied to scale-dependent aerosol indirect effect theory and meteorological confounding (Quaas et al., 2009; McComiskey and Feingold, 2012). The correlation coefficients R (bottom of Fig. 5 a) are similar for all four study areas at small buffer sizes, increase fast with buffer size to a maximum for a buffer size of about 50 km and then decrease and diverge. The largest decrease is observed for the study area of 10°×10°. In this study, the optimal scale for each study area is indicated in Fig. 5 with a red solid square. A plot of the optimal scale versus the size of the study area in Fig. 6 (curve LWP1-period1) shows that, as the study area size increased from 6°×6° to 10°×10°, the optimal scale decreased from 100 to 30 km.
As compared with period 1, in period 2 (Fig. 5b) the value of the also decreases as the buffer size increases. However, the scale sensitivity analysis for period 2 reveals two distinct characteristics different from period 1: (1) the four SCER curves for different study areas are much closer than during period 1; (2) with the exception of the study area of 10°×10°, the values of the for the other three study areas are significantly reduced (closer to zero), indicating a corresponding weakening of aci intensity against the background of decreased aerosol concentrations. Particularly noteworthy is that during period 1, the R values for the 10°×10° study area show a sharp declining trend when the buffer size exceeds 60 km, while in period 2 this happens for buffer size larger than 110 km and the R value curves for all study areas significantly expand their high-value ranges. Also for period 2, the R values for the study areas of 10°×10° and 8°×8° are very similar, in contrast to period 1 when only the R values for the study areas of 10°×10° decreases fast. Across different study areas, the optimal scale (Curve LWP1-peirod2) shows a behavior opposite to that during period 1: as the study area size increases from 6°×6° to 10°×10°, the optimal scale increases from 20 to 80 km. It is noted that for a study area of 4°×4° the optical scale is 50 km in both periods. For the first LWP regime, SCER estimates and correlation coefficients R by period and optimal buffer size across 4°×4° to 10°×10° study areas are given in Appendix Table A1.
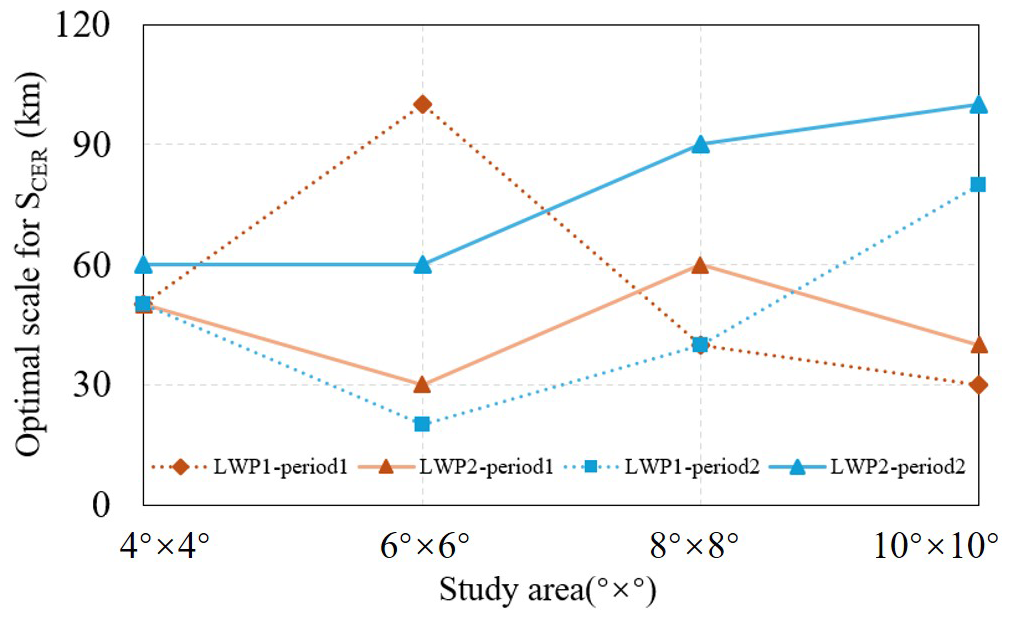
Figure 6Relationship between optimal scale for SCER and the size of the study area. Here LWP1-period1 and LWP2-period1 indicate the optimal scale in period 2008–2014 for the first LWP regime and that for the second LWP regime, respectively. LWP1-period2 and LWP2-priod2 indicate the optimal scale in period 2015–2022 for the first LWP regime and that for the second LWP regime, respectively.
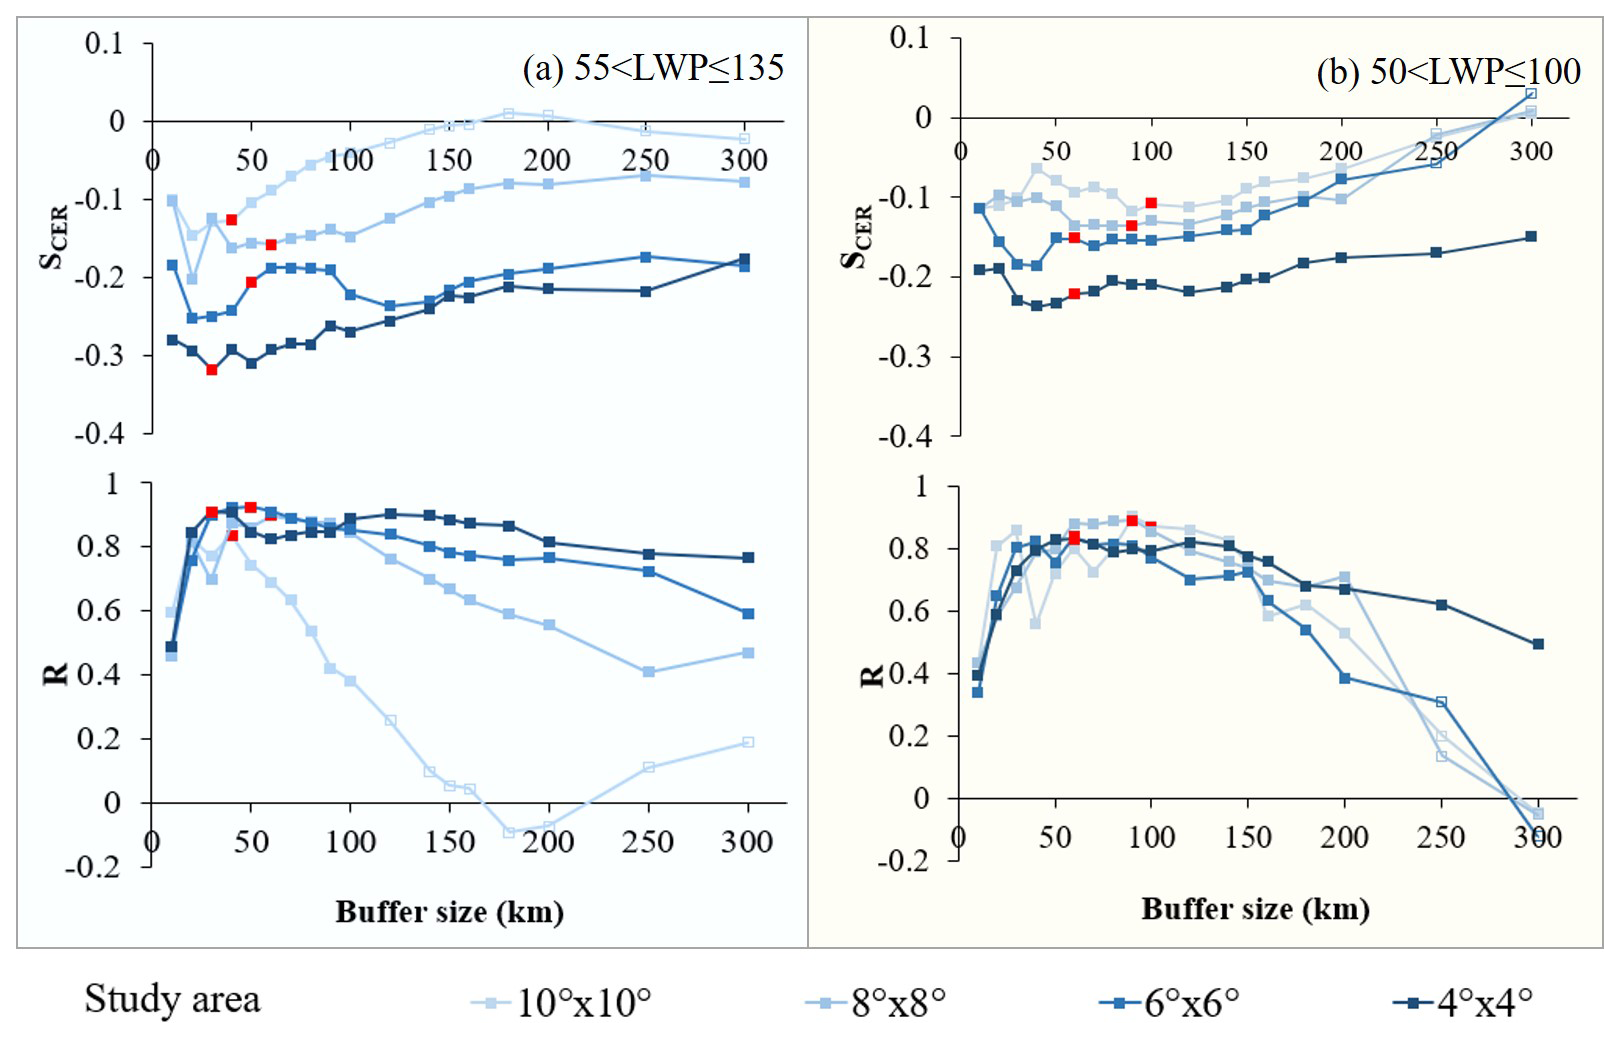
Figure 7Variation of SCER (top) and correlation coefficient R (bottom) with buffer size for different study areas (see legend at the bottom) for (a) the LWP regime with 55< LWP ≤135 g m−2 over the years 2008–2014 and (b) the LWP regime with 50< LWP ≤100 g m−2 over the years 2015–2022. Filled squares indicates that the results are significant at the 0.01 level and the open squares indicates that the results are not statistically significant. Red solid squares indicate the optimal buffer sizes for each study area, as shown in Appendix Table A1.
3.2.2 Decreasing CER regime
During the second LWP regime (Fig. 7), the AOD and CER is also negatively correlated (SCER<0) during both periods, but the values of SCER vary stronger with the size of study area: the curve dispersion increases in the second LWP regime, the values of are larger overall, and the relatively concentrated trend in the period 1 shifts to more scattered fluctuations in the period 2. During period 1, for the largest (10°×10°) study area: the value of (Fig. 7a) decreases with increasing buffer size, nearing zero at ∼ 150 km, briefly turning slightly positive, then slowly falling below zero by 220 km. For the three smaller study areas, the SCER values are all negative and overall decreased with increasing buffer size. Through the sensitivity of SCER to buffer size across varying study areas during period 1, the value of for a given buffer size becomes smaller with increasing study area size. Additionally, across all study areas, initially increases with the increase of the buffer size, then decreases, and gradually stabilizes thereafter. The data in Fig. 6 (Curve LWP2-peirod1), show that, the optimal size varies between 30 and 60 km with no clear dependence on the size of the study area.
Compared with period 1, the value of in period 2 (Fig. 7b) also decreased overall with increasing buffer size, and at the same buffer size, decreased as study area increased. However, the scale sensitivity analysis for period 2 revealed two distinct characteristics: (1) the four curves for different study areas were closer than during period 1; (2) the for the study area of 10°×10° was overall larger, while the values of the SCER curves for the study areas of 4°×4° and 6°×6° were significantly reduced and that for the study area of 8°×8° was slightly reduced. The reduction may be attributed to weakened aci resulting from decreased regional aerosol concentrations (Jia et al., 2022; Li et al., 2024; Zhao et al., 2025). The variation of the optimal scale (Curve LWP2-period2) with the size of the study area is similar to that during period 1 in the rapid growth LWP regime: as the study area size increased from 6°×6° to 10°×10°, the optimal scale increased from 60 to 100 km. For the second LWP regime, SCER estimates and correlation coefficients R between CER and AOD by period and optimal buffer size across 4°×4° to 10°×10° study areas are given in Appendix Table A1.
Through comparative analysis of SCER data distribution across different LWP regimes under different aerosol conditions (i.e. high AOD and decreasing AOD), we found that the in the second LWP regime was significantly larger than that in first LWP regime except for the study area of 10°×10° for buffer size >100 m, where SCER curves corresponding to different study areas showed greater dispersion. This pattern highlights the dominant role of LWP in regulating aci sensitivity, with AOD variations further modulating the magnitude of such differences. Sample sizes of CER and AOD for the two LWP regimes across both study periods, all buffer sizes and study areas, are presented in Appendices Tables A3–A6.
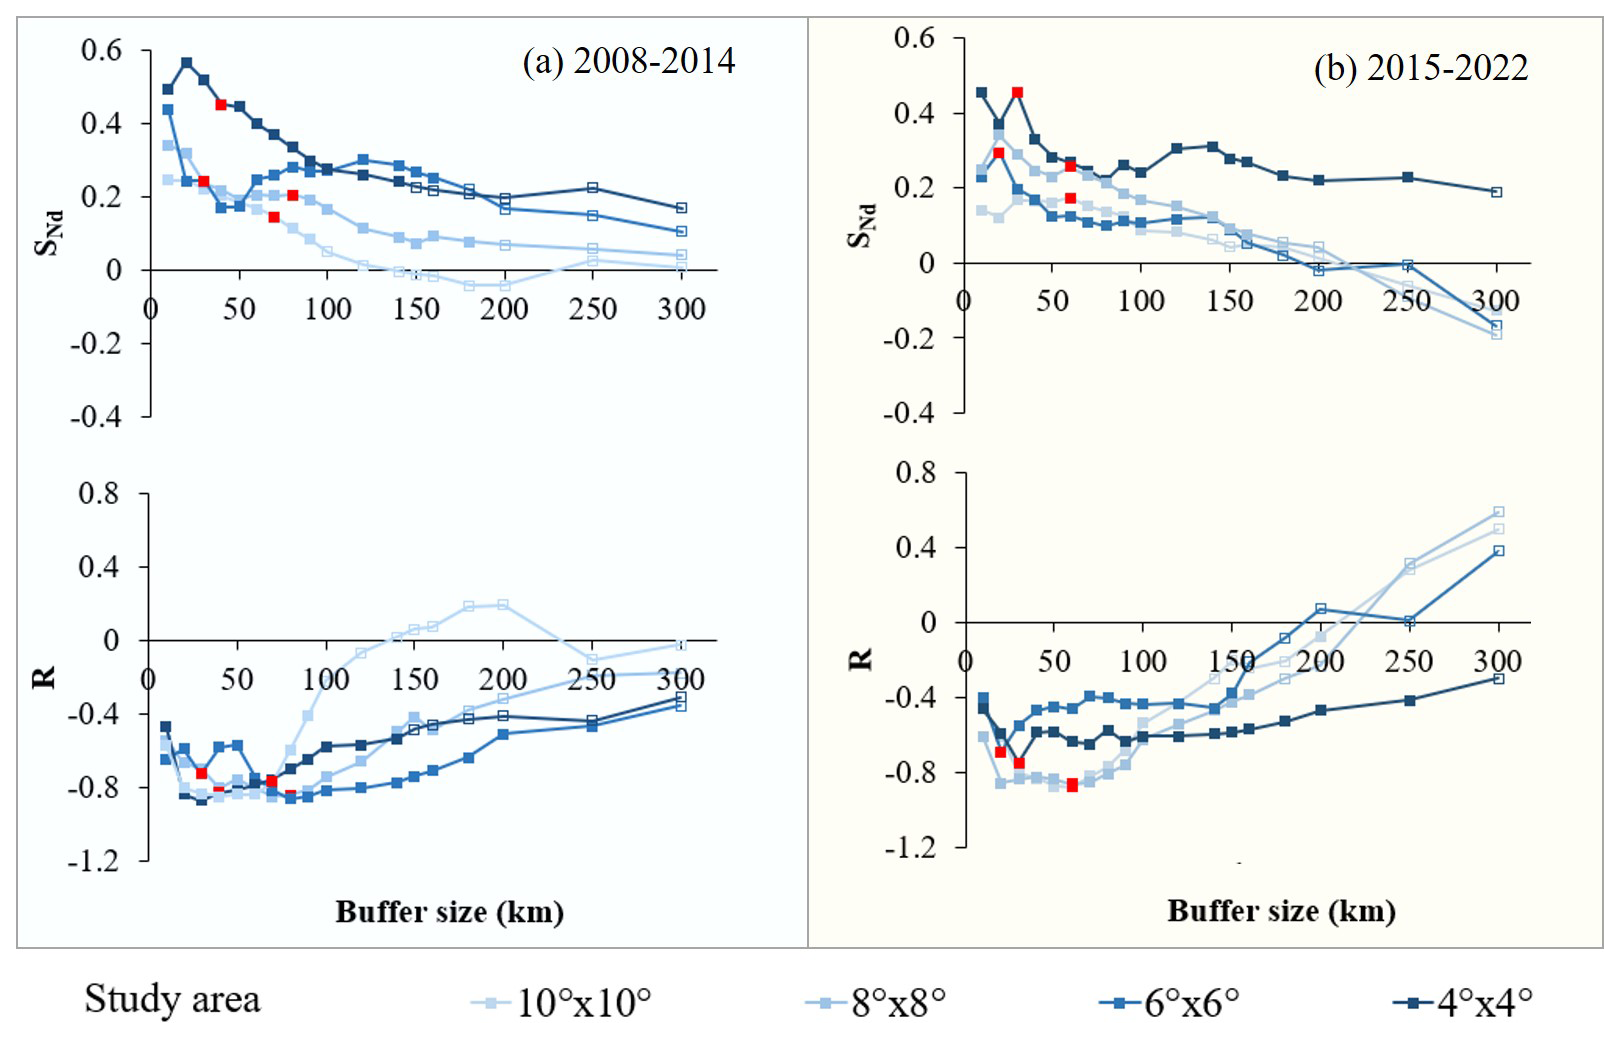
Figure 8Variation of SNd (top) and correlation coefficient R (bottom) with buffer size for different study areas (see legend at the bottom) for the LWP regime with 0< LWP ≤200 g m−2 over the years 2008–2014 (a) and 2015–2022 (b). Filled squares indicates that the results are significant at the 0.01 level and open squares indicate that the results are not statistically significant. Red solid squares indicate the optimal buffer size for each study area, as shown in Appendix Table A2.
3.3 Sensitivity of Nd to AOD
The sensitivity SNd is defined as the slope of a linear fit to a log-log plot of SNd versus AOD (Eq. 2). For each period, we binned the data into AOD intervals of 0.02 and averaged Nd within each bin. Figure 8 shows the variation of SNd with buffer size for different study areas. In contrast to SCER, SNd is predominantly positive (p<0.01) in both periods and decreases with increasing buffer size. During period 1 (2008–2014, high AOD), SNd for the 6°×6° study area decreases rapidly to a minimum at buffer sizes of 40–50 km, then increases to a maximum at a buffer size of 120 km. For buffer size ≥120 km, the two smallest study areas (4°×4° and 6°×6°) yield similar SNd values, which are substantially larger than those for the two larger study areas (8°×8° and 10°×10°). During period 2 (2015–2022, decreasing AOD), we can see an initial increase of SNd for the study area of 6°×6° and 8°×8°, and variation of SNd for the study area of 10°×10° and 4°×4°. After that, SNd for the study area of 4°×4° and 6°×6° decreases rapidly to a minimum for a buffer size of 80 km, followed by an increase to a maximum for a buffer size of 140 km.
The optimal buffer sizes (maximizing R) are larger for the 8°×8° and 10°×10° study areas than for the 8°×8° and 10°×10° areas (Fig. 9), reflecting different aci characteristics under varying AOD conditions. Estimates of SNd and R, stratified by optimal buffer size, for study areas ranging from 4°×4° to 10°×10° during the two periods are presented in the Appendix Table A2. Sample sizes of Nd and AOD across both study periods, all buffer sizes and study areas, are presented in Appendices Tables A7–A8.
Expanding the study area inevitably increases spatial heterogeneity in aerosol loading, meteorology, and cloud type, while also introducing larger satellite retrieval uncertainties. This spatial mixing blends clean and polluted air masses, thereby introducing a statistical dilution effect on the estimated SNd. Therefore, the decrease in SNd with increasing study area size (Fig. 8) reflects not only a genuine weakening of aerosol-cloud interactions but also the combined effects of meteorological confounding, cloud regime transitions, and retrieval limitations. It is noted that SCER and SNd exhibit distinct anomalies in large buffer zones, which may be associated with all these factors.
Changes in aerosol chemical composition between the two periods may also modulate SNd. During 2008–2014, aerosols over eastern China were dominated by sulfate (30 %–40 % of PM2.5 mass; Huang et al., 2014; Zheng et al., 2018). Given the strong hygroscopicity of sulfate-dominated aerosols (Zhang et al., 2012; Liu et al., 2023), their CCN activation efficiency was likely high, providing a favorable physical basis for aci (Lee et al., 2009). In contrast, during 2015–2022, policy interventions (e.g., the Air Pollution Prevention and Control Action Plan; Zheng et al., 2018) drove a structural transition: the sulfate mass fraction dropped sharply to 15 %–25 % (an absolute reduction of >50 %), while less hygroscopic components (nitrate, carbonaceous aerosols, and secondary organic aerosols) increased in relative proportion (Huang et al., 2014; Zheng et al., 2018). As these components generally exhibit weaker hygroscopicity compared with sulfate (Zhang et al., 2012; Liu et al., 2023), this compositional shift may have reduced CCN activation efficiency under the same AOD, thereby weakening the sensitivity of Nd to AOD and altering aci intensity (Lee et al., 2009).
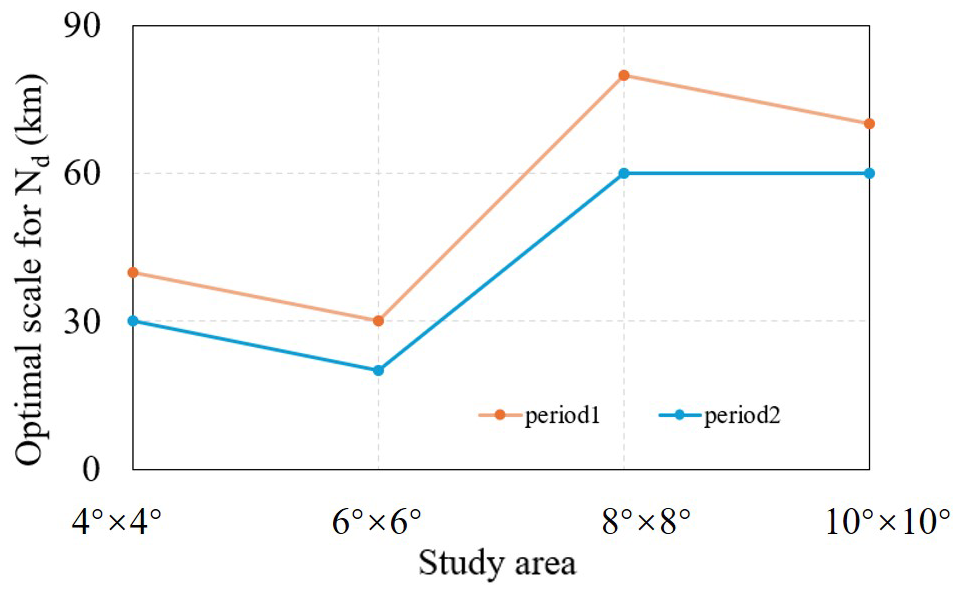
Figure 9Relationship between optimal scale for Nd and the size of the study area. Here period1 and period2 indicate the optimal scale in period 2008–2014 and the optimal scale in period 2015–2022, respectively.
4.1 The importance of liquid water path constraint
LWP is a critical parameter governing cloud radiative properties (Murray-Watson and Gryspeerdt, 2022). The quantification of albedo effects strongly depends on the spatial scale and the LWP. Neglecting LWP constraints in aci studies can weaken microphysical signals, leading to underestimation of radiative forcing (McComiskey and Gryspeerdt, 2012). To address this, we first systematically investigated the dynamic relationship between CER and LWP before analyzing CER sensitivity to AOD. The results demonstrate pronounced CER sensitivity to LWP variations, which can be categorized into three distinct regimes (Fig. 4).
In the first LWP regime, CER increases rapidly with LWP, i.e. the evolution of CER is predominantly driven by changes in LWP. This dominance may lead to overestimation of the influence of the AOD on CER (Liu et al., 2021).
In the second LWP regime, CER decreases with increasing LWP. In this regime, the regulatory effect of LWP on CER weakens significantly, and CER variations become increasingly governed by aerosol-related processes, indicating the growing dominance of aerosol indirect effects.
The third regime contains an insufficient number of CER observations to yield statistically significant results, which excludes the analysis of the sensitivity of CER to AOD.
Comparative analysis of scale-conditioned SCER across LWP regimes in periods 1 and 2 revealed markedly enhanced sensitivity of SCER to AOD in the second LWP regime. A trade-off exists between AOD and LWP under conditions of insufficient water vapor. This trade-off leads to smaller CER values. As suggested by Costantino and Bréon (2013), the LWP response to aerosol invigoration is influenced by two competing mechanisms: a drying effect caused by enhanced entrainment of dry air at cloud top (dominant in optically thin clouds) and a moistening effect from precipitation suppression (dominant in optically thick clouds). For larger LWP, the supply of cloud water is sufficient. The increase in aerosol number concentrations significantly affects the distribution of cloud droplet number concentrations and sizes. This further enhances the sensitivity of CER to AOD. For small aerosol concentrations, the values of (Figs. 5b, 7b) decreased overall with expanding buffer size within the same study area. For fixed buffer size, decreased as the study area increased. The ranges of values across different study areas showed a convergent pattern. These values typically remained small and close to zero. During the high AOD period (2008–2014), anthropogenic emissions and dust transport provided abundant CCN. This laid the material foundation for strong aci. It enhanced the synergistic effect of “sufficient liquid water + abundant CCN” in the second LWP regime. This synergistic effect amplified the difference in SCER between the two LWP regimes. In the period of decreasing AOD (2015–2022), CCN concentration decreased following the implementation of clean air policies (de Leeuw et al., 2021, 2023). This reduction weakened the direct impact of aerosols on CER. However, the LWP-driven microphysical differences persisted. Thus, SCER in the second regime remained significantly smaller than that in the first regime, albeit with a smaller difference. Additionally, the complexity of aerosol types during the high AOD period (e.g., mixing of anthropogenic pollutants and natural dust) may have adjusted the value of SCER. However, it did not alter the dominant role of LWP. This aligns with the theory that “aerosol indirect effects are jointly regulated by concentration and type” (Liu et al., 2017).
The larger SCER observed at larger spatial scales (Figs. 5 and 7) may be attributed to meteorological confounding effects. In addition, clouds with larger LWP are usually associated with strong updrafts (such as convective clouds), and stronger turbulence and vertical transport will bring more aerosols into the clouds, increasing CCN concentration and a decrease in particle size, making them more sensitive to changes in AOD (Jones et al., 2009; Han et al., 2022; Fan et al., 2025). Therefore, this phenomenon is the result of the combined action of cloud microphysical processes (CCN activation, cloud droplet competition growth) and dynamic processes (updrafts, turbulent mixing). If the characteristics of aerosols (such as composition) change in the second LWP regime, this sensitivity may be further amplified. Consequently, the LWP-stratified SCER quantification framework enables precise characterization of scale-dependent aci, providing robust physical insights for climate effect assessments and effectively reducing uncertainties in future climate projections.
The central hypothesis of this study – that LWP is relatively consistent between the two periods (2008–2014 and 2015–2022), supporting valid comparisons of the spatial sensitivity of AOD-CER relationships –is well-supported by the following analysis. The differences in the mean, median, 25th, and 50th percentiles of LWP between the two periods are all less than 5 %, indicating a stable overall water vapor supply level. The spatial patterns of high-LWP regions (e.g., southeastern areas) and low-LWP regions (e.g., the mountainous areas in northern Shanxi) remained stable across the two periods (see Appendix Fig. A1), demonstrating that LWP spatial distribution characteristics are highly consistent. The sample proportions of LWP in the rapid growth regime are 59.30 % (period 1: 0–55 g m−2) and 55.36 % (period 2: 0–50 g m−2), while those in the decreasing regime are 29.64 % (period 1: 55–135 g m−2) and 24.59 % (period 2: 50–100 g m−2), suggesting that there is no systematic temporal shift in the LWP distribution. Meanwhile, short-term fluctuations are smoothed by multi-year averaging and large-sample statistics, resulting in a weak indirect impact of aerosols on LWP (LWP only increased by 5.6 %, much smaller than the 24 % decrease in AOD). Additionally, LWP-stratified analysis (i.e., binning LWP into 5 g m−2 intervals) further isolates interference. The validation of the core hypothesis provides a reliable premise for accurately quantifying the impact of aerosol concentration changes on the sensitivity of cloud parameters and their spatial scale dependence.
4.2 Scale dependence of cloud parameters sensitivities to aerosol variations
Extensive studies have demonstrated a significant spatial scale dependence of aerosol indirect effects (McComiskey and Feingold, 2012; Possner et al., 2016; Glotfelty et al., 2020; Ekman et al., 2023). Failure to explicitly define the scale-dependent behavior of aerosol indirect effects may introduce systematic biases and inconsistencies in subsequent process analyses. Based on satellite observations, this study confirms statistically significant negative correlations between CER and AOD, as well as positive correlations between Nd and AOD during periods with different aerosol concentrations, aligning with classical aci theory (Quaas et al., 2009). Analysis of scale-conditioned SCER and SNd reveals that for fixed buffer size, an increase in the size of the study area leads to a systematic reduction in SCER (less negative) and SNd, corroborating the nonlinear attenuation of aerosol signals with spatial domain expansion (Quaas et al., 2009). The results from this study suggest that AOD-cloud property correlations in large study areas are susceptible to meteorological confounding effects (Quaas et al., 2010; Boucher and Quaas, 2012; Gryspeerdt et al., 2014; Liu et al., 2024). Theoretically, aerosol regulation of cloud microphysics is strongly local: smaller domains (e.g., 4°×4°) feature homogeneous meteorological conditions (humidity, updrafts), preserving undiluted aci signals and yielding larger (pronounced Twomey effect). In contrast, expanded domains (e.g., 10°×10°) encompass heterogeneous meteorological conditions (circulation differences, boundary layer variability) that independently modulate cloud droplet growth. For example, strong updrafts enhance liquid water supply, offsetting aerosol-induced radius reduction (Altaratz et al., 2014), weakening aerosol-CER correlations and reducing . Consistent with Grandey and Stier (2010), large-scale domains introduce “dilution bias” via non-target meteorological variability. This scale-dependent confounding mechanism elucidates uncertainties in aerosol indirect effect assessments at regional scales.
Multi-scale spatial analysis identifies different optimal buffer sizes for SCER and SNd in different periods. These findings align closely with satellite-based aerosol indirect effect studies (Wang et al., 2015; Liu et al., 2017), providing critical scale benchmarks for satellite product validation. Wang et al. (2015) reported an inverse “Twomey” effect between aerosols and CER in eastern China by analyzing aerosol and CER within a 50 km buffer zone around CALIOP samples. Similarly, Liu et al. (2017) systematically examined the response mechanisms of warm cloud macro- and microphysical parameters to increasing AOD in the Yangtze River Delta region, also using CALIOP samples within a 50 km buffer zone. The present study further shows that, as aerosol concentrations decrease, SCER values across different study areas with the same buffer size exhibit convergence characteristics, with generally smaller SCER (closer to zero). This indicates a significant weakening of aci intensity and reduced spatial extent dependency in low aerosol loading conditions. This phenomenon is consistent with the simulated behavior of aerosol-limited cloud regimes, where aci are quantitatively modulated by moisture availability and lose their sensitivity to large-scale dynamical stability, leading to a weaker and more homogeneous effect (Zhao et al., 2025).
By systematically quantifying the scale-response characteristics of aerosol indirect effects, this work not only elucidates the dynamic scale behavior of aci, but also, more critically, establishes criteria for determining optimal buffer size in regional aerosol indirect effect studies. These results provide quantitative observational constraints for refining scale-dependent parameterization modules in climate models, particularly for representing the modulation of ACI by spatial scale and LWP, thereby improving model predictive reliability.
4.3 Contrasting sensitivity patterns of cloud parameters in response to AOD
A comprehensive comparison of the sensitivity SCER and SNd reveals that the responses of CER and Nd to AOD exhibit distinct yet inherently interconnected characteristics. These characteristics are jointly modulated by spatial scale and LWP regimes (Figs. 5, 7, 8; Appendices Tables A1–A2), which profoundly reflect the core microphysical mechanisms of aci. Details are elaborated as follows.
4.3.1 Core differences in response modes between SCER and Nd to AOD
SCER is consistently negative across both periods and all LWP regimes () (Figs. 5, 7; Appendix Table A1), indicating that an increase in AOD leads to a decrease in CER. This aligns with the core principle of the Twomey effect (Twomey, 1977; Feingold et al., 2001). The values of are larger in the second LWP regime than in the first regime, reflecting stronger aerosol modulation of cloud microphysical properties when liquid water is abundant (McComiskey and Feingold, 2012). In contrast, SNd maintains a significant positive correlation with AOD across all scenarios () (Fig. 8; Appendix Table A2), confirming that higher AOD directly promotes CCN activation and thereby increases cloud droplet number concentration (Andreae, 2009).
4.3.2 Synergistic modulation of AOD and spatial scale
Using the LWP interval corresponding to SNd (0< LWP ≤200 g m−2) as a benchmark, comparisons between the two periods (incorporating average values of SCER across two LWP regimes) reveal distinct characteristics:
For the small-scale study area (4°×4°): In period 1, the average across two LWP regimes is 0.271 (0.2232 for the 0–55 g m−2 LWP regime, 0.3189 for the 55–135 g m−2 LWP regime) and SNd=0.4496, both significantly higher than those in period 2 (average , with 0.0863 for the 0–50 g m−2 LWP regime and 0.2212 for the 50–100 g m−2 LWP regime; SNd=0.2903). The negative correlation between AOD and CER is more significant in period 1, as sufficient CCN in small-scale areas amplifies both cloud droplet number increase and size reduction, enhancing the Twomey effect.
For the medium-to-large scale study areas (6°×6°, 8°×8°, 10°×10°): In period 1, the average across the two LWP regimes is 0.1683 (0.1305 for 0–55, 0.2061 for 55–135 g m−2), 0.13065 (0.1026 for 0–55 g m−2, 0.1587 for 55–135 g m−2), and 0.1067 (0.0858 for 0–55 g m−2, 0.0885 for 55–135 g m−2), respectively, all higher than the corresponding values in period 2 (0.1516, 0.1246, 0.0985). However, SNd in period 1 (0.2430, 0.2050, 0.1430) is lower than that in period 2 (0.2960, 0.2680, 0.1740), with no significant difference in the negative correlation between AOD and CER between the two periods.
This characteristic indicates that meteorological confounding effects are enhanced at larger scales, weakening the regulation of SNd by aerosols, while at small scales the aci is directly driven by AOD levels.
4.4 Limitations and future perspectives
This study has three significant limitations. Firstly, similar to most previous studies (Wang et al., 2015; Liu et al., 2021), this study only utilized MODIS data with a resolution of 10 km to explore scale effects, ignoring finer or coarser resolution data. Therefore, using a 10 km buffer size as the minimum observation unit, this limitation makes the indirect effects of aerosols on smaller scales still unknown, which may lead to inaccurate evaluation of aerosol indirect effects. Therefore, future research can improve the sensitivity of aerosol indirect effects to scale changes by using observation data with higher accuracy or model simulations. Secondly, the current research focuses on the influence of buffer size and study areas, the potential impact of spatial aggregation methods (especially zoning directionality) on the quantitative results of aerosol indirect effects has not been systematically evaluated. Future research should further investigate the sensitivity of aerosol indirect effects to zoning direction. Moreover, the current study employs a uniform buffer size for both aerosol and cloud parameters, failing to account for potential interaction effects arising from discrepancies of buffer size between them. Therefore, clarifying scale dependence will avoid directly extrapolating local observation results to a larger study area when downscaling climate models or formulating regional environmental policies.
Based on MODIS and CALIOP satellite observations of aerosol and cloud parameters over land in eastern China, a comparative analysis was conducted of the sensitivity of cloud microphysical parameters (CER and Nd) to variations in AOD during two characteristic periods: 2008–2014 (period 1, high AOD) and 2015–2022 (period 2, decreasing AOD). Through systematic analysis of the relationship between CER and LWP and their response mechanisms to AOD across these two periods, the following key conclusions were drawn:
Firstly, CER exhibited three distinct regimes with varying LWP. During the rapid growth regime (LWP g m−2), CER showed significant negative sensitivity to AOD (SCER), consistent with the Twomey effect; during the decreasing regime (LWP =55–135/50–100 g m−2), SCER remained negative but with enhanced sensitivity; and during the slow growth regime (LWP >135/100 g m−2), the rate of CER change significantly decreased. These findings confirmed that LWP is a crucial, regulatory factor influencing the CER response to AOD.
Secondly, scale dependence analysis led to the conclusion that characteristics in aci are significantly scale-dependent, with systematic variations of both SCER and SNd with changes in buffer size and study area. The results of the study show that SCER systematically increased as buffer size increased and became negligible for buffer sizes larger than 150–200 km, while the optimal buffer sizes varied substantially with the size of the study area in the range from 6°×6° to 10°×10°: increased as study area increased during period 2, but decreased in period 1 for regime 2. Particularly noteworthy is the enhanced consistency of SCER across different study areas and the significant increase in SCER during period 2, reflecting weaker aci due to declining regional aerosol concentrations.
Finally, the sensitivity of Nd to AOD (SNd) exhibited distinct characteristics compared to SCER: SNd showed a significant positive correlation (p<0.01) and demonstrated nonlinear attenuation with increasing buffer size and study area. The optimal buffer size for SNd was smaller during period 2 than during period 1 and increased with the study area size, being substantially larger for study areas of 8°×8° and 10°×10° than for study areas of 4°×4° and 6°×6° areas.
These observed patterns correspond to the fundamental microphysical pathway of aci, whereby increased aerosol loading enhances Nd and reduces CER under constant LWP conditions. The results emphasize that accurate quantification of ACI must explicitly consider both the phase-dependent characteristics of LWP and spatial scale effects when assessing aerosol indirect effects.
These findings deepen our understanding of aerosol indirect effects and provide quantitative observational constraints for improving aerosol–cloud parameterization in climate models. Our results highlight that ACI parameterization should explicitly incorporate LWP regime-dependent behavior and spatial scale-dependent interaction strengths to improve realistic representation.
Table A1Estimates of SCER, computed using Eq. (1), and correlation coefficients R between CER and AOD, stratified by LWP, and optimal buffer size (see text), for study areas varying from 4°×4° to 10°×10°, during the periods 2008–2014 and 2015–2022. Statistically significant data points are indicated with * (p value <0.01).
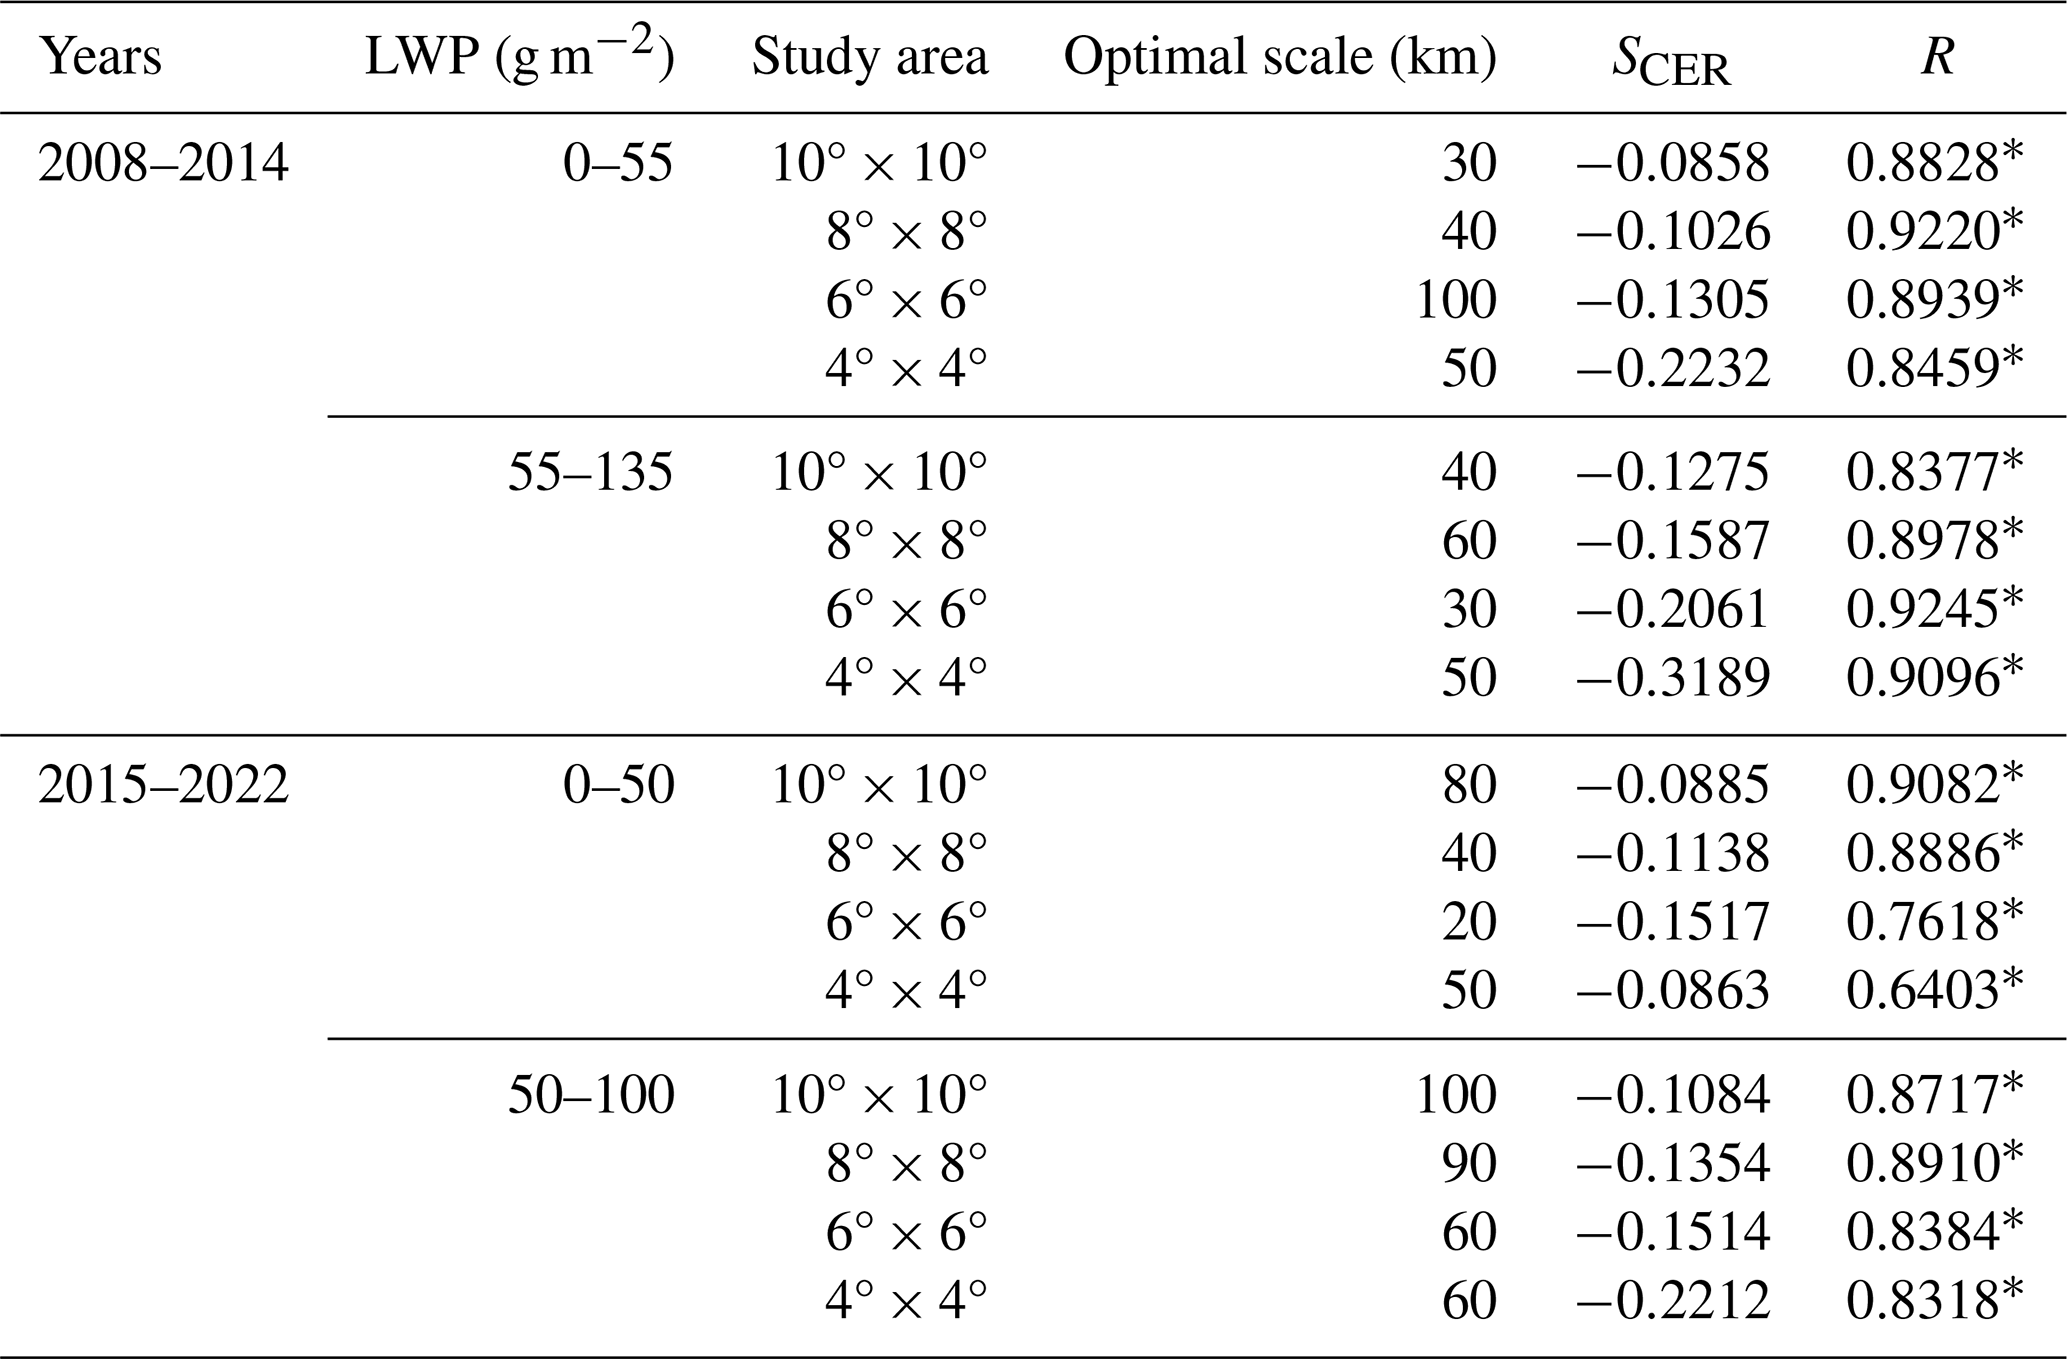
Table A2Estimates of SNd, computed using Eq. (2), and correlation coefficients R between Nd and AOD, stratified by optimal buffer size (see text) for study areas varying from 4°×4° to 10°×10°, during the periods 2008–2014 and 2015–2022. Statistically significant data points are indicated with * (p value <0.01).
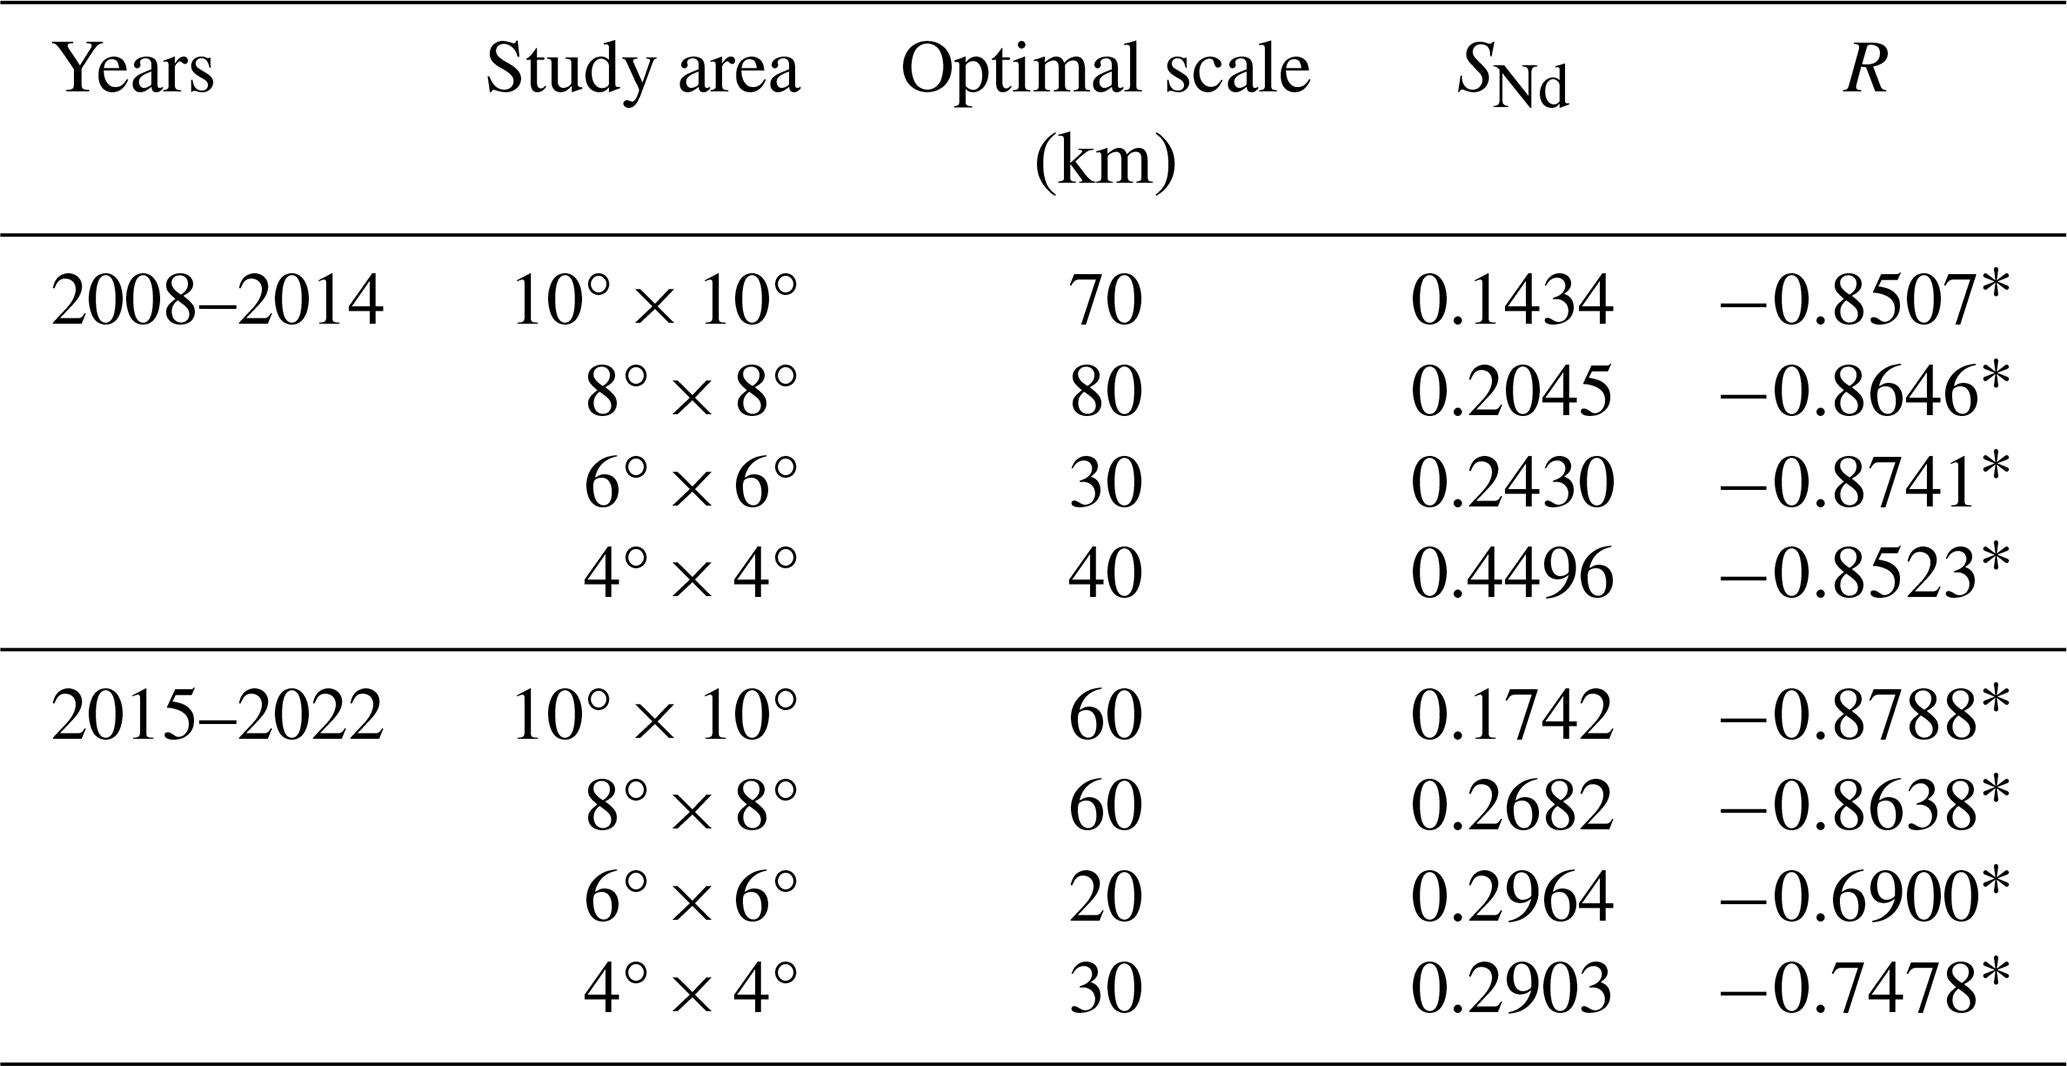
Table A3Sample sizes of cloud droplet effective radius (CER) and aerosol optical depth (AOD) across different buffer sizes, study areas (LWP regime 1, 2008–2014).
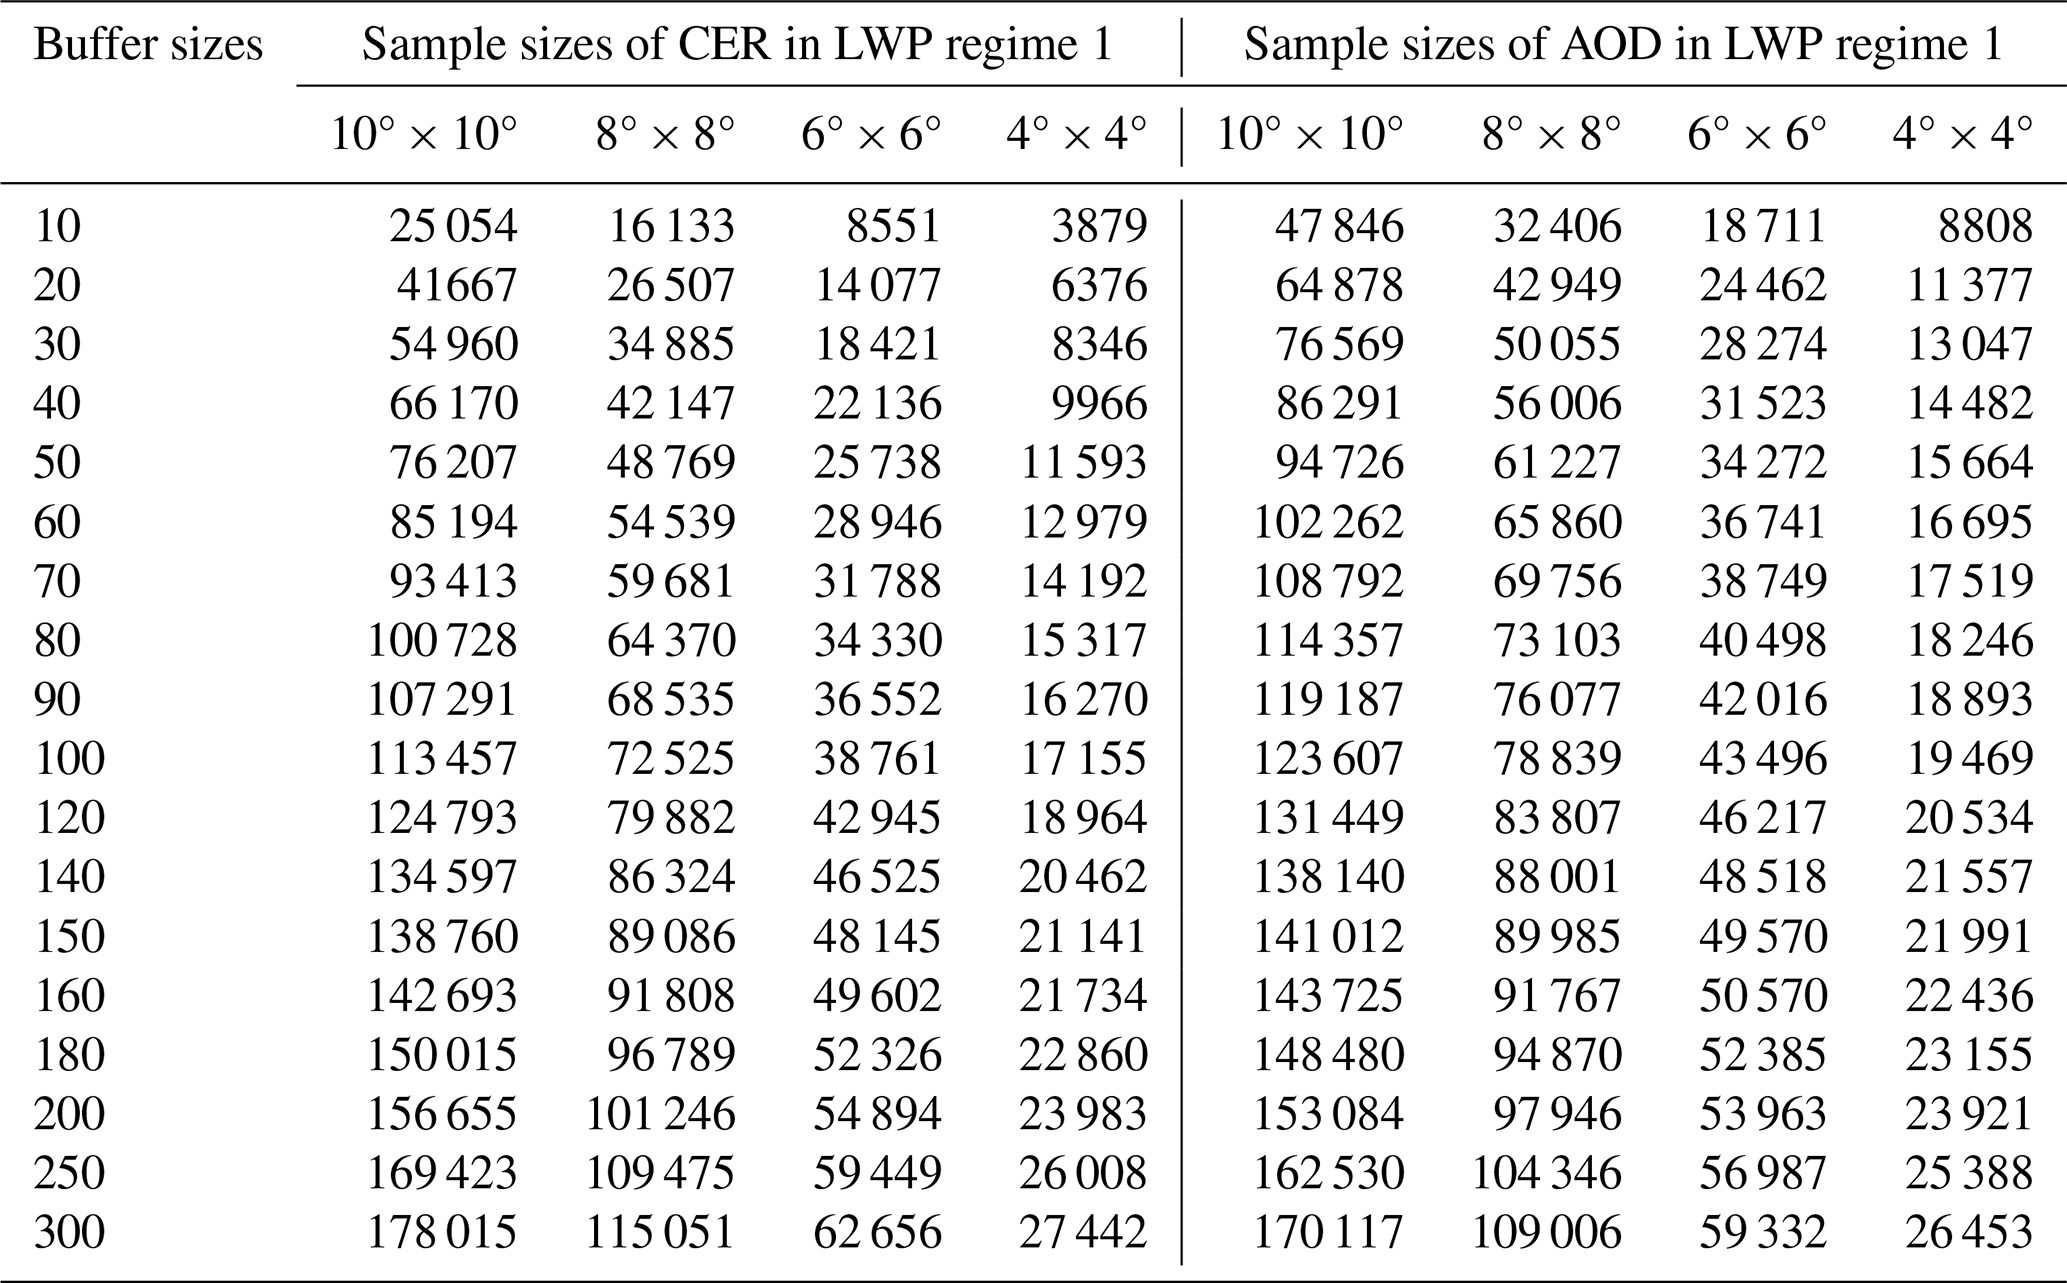
Table A4Sample sizes of cloud droplet effective radius (CER) and aerosol optical depth (AOD) across different buffer sizes, study areas (LWP regime 2, 2008–2014).
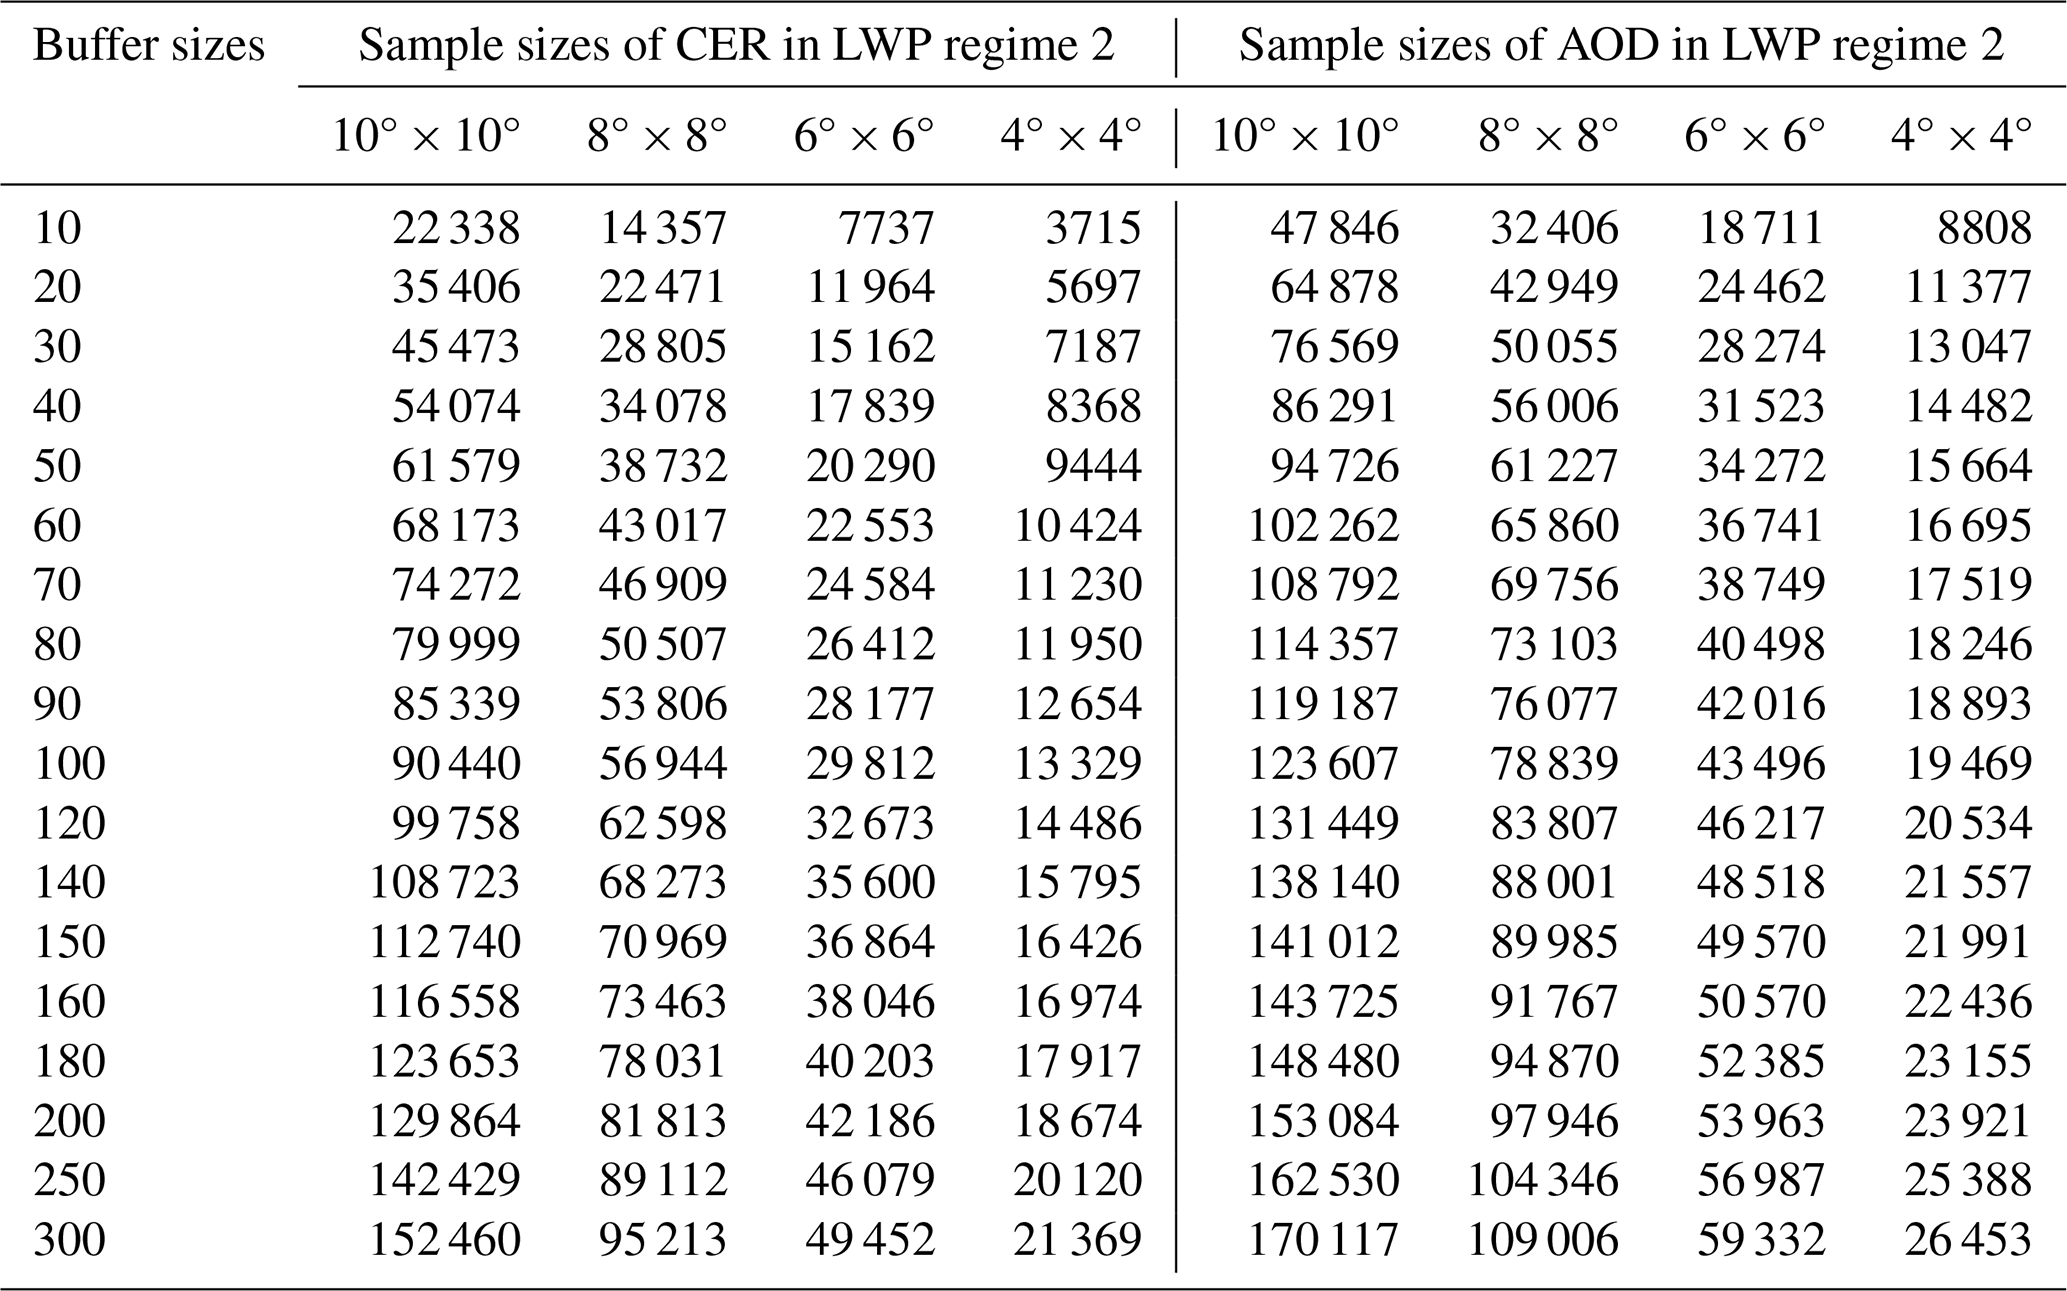
Table A5Sample sizes of cloud droplet effective radius (CER) and aerosol optical depth (AOD) across different buffer sizes, study areas (LWP regime 1, 2015–2022).
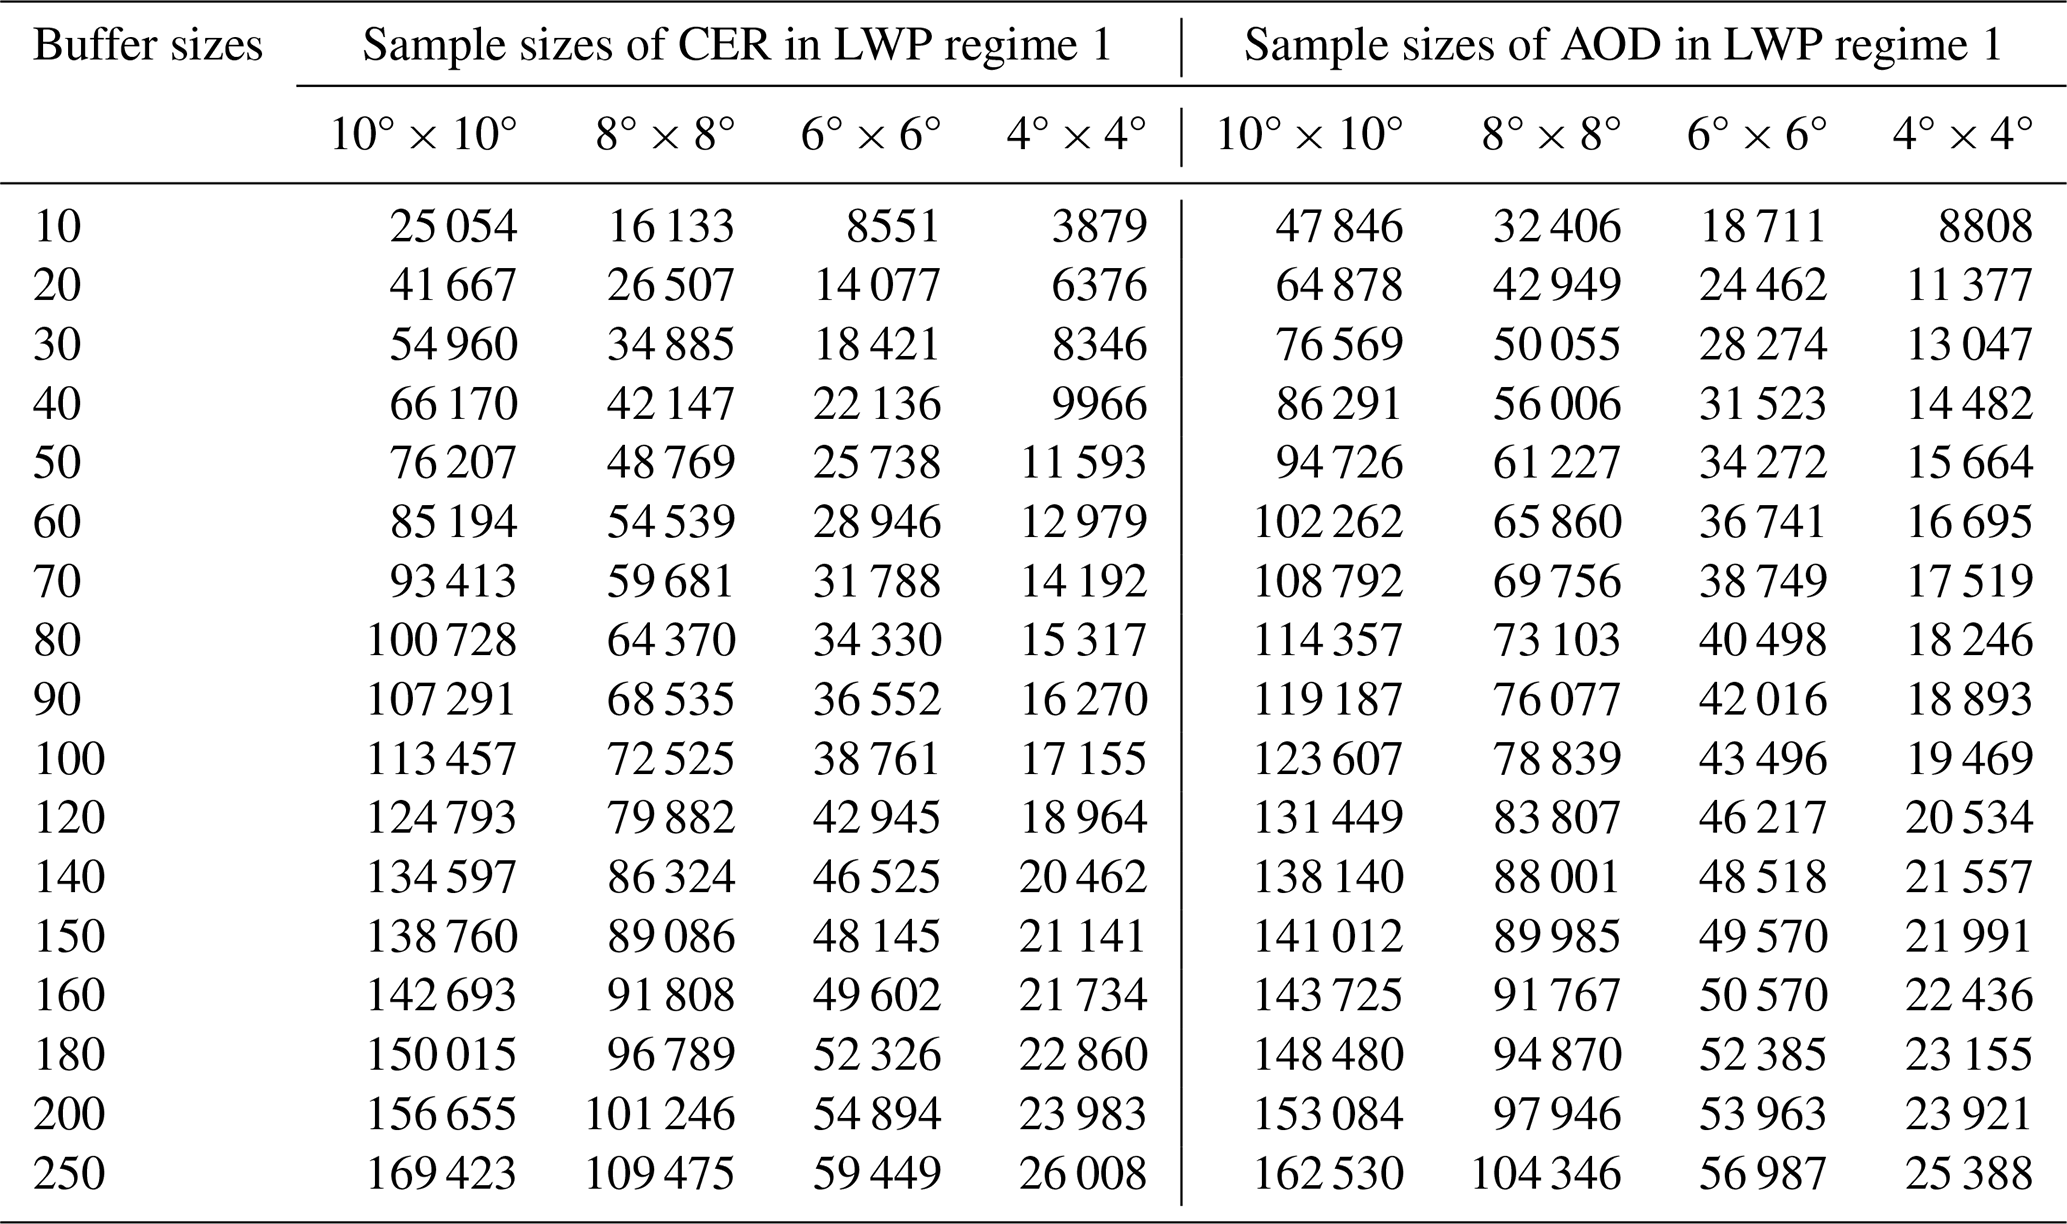
Table A6Sample sizes of cloud droplet effective radius (CER) and aerosol optical depth (AOD) across different buffer size, study areas (LWP regime 2, 2015–2022).
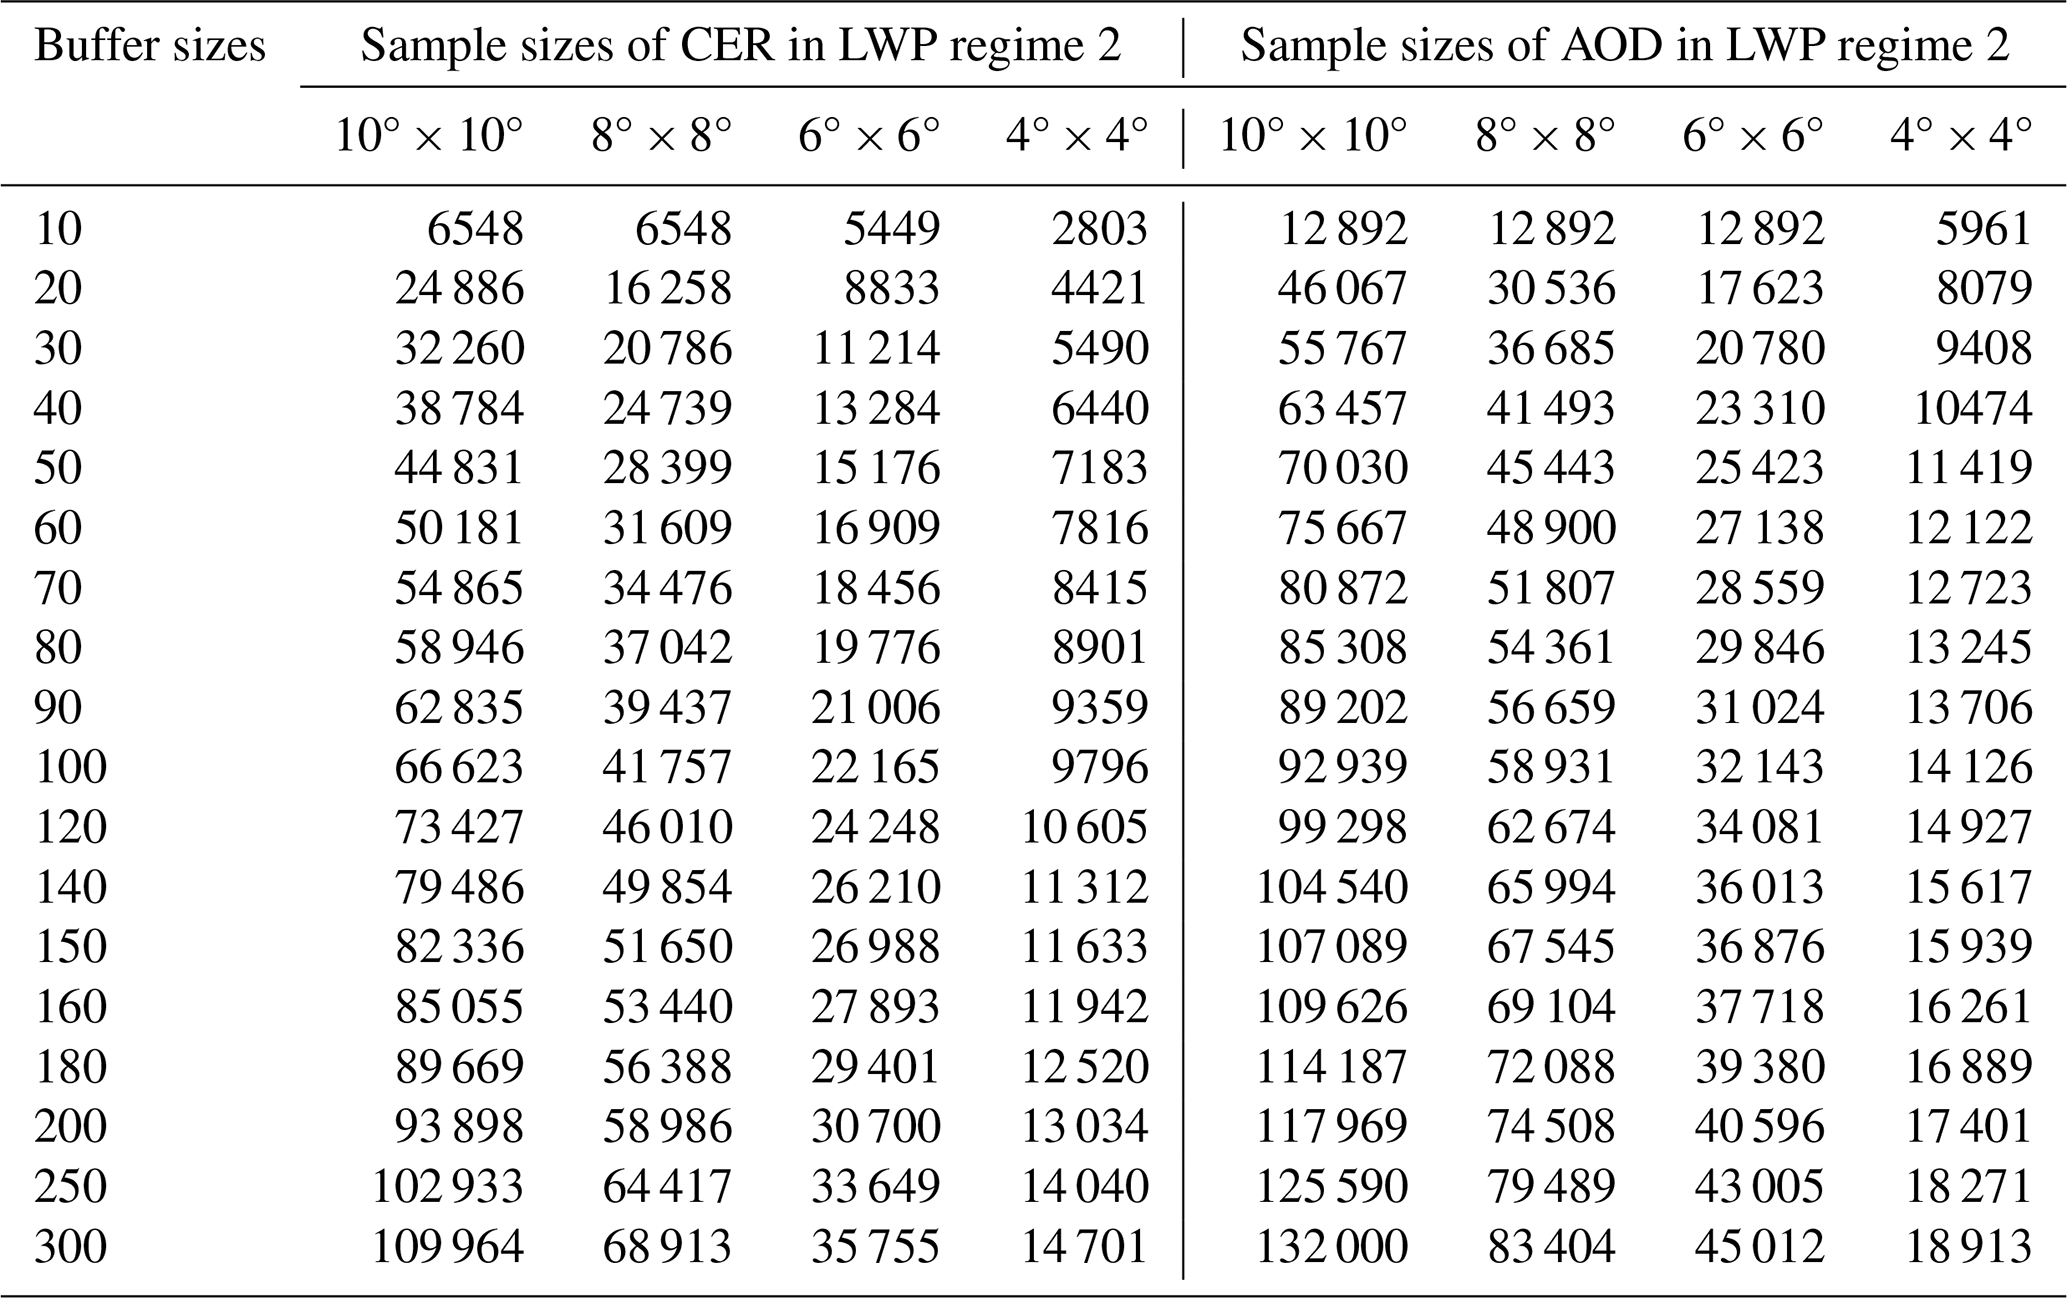
Table A7Sample sizes of cloud droplet number concentration (Nd) and aerosol optical depth (AOD) across different buffer sizes and study areas during 2008–2014.
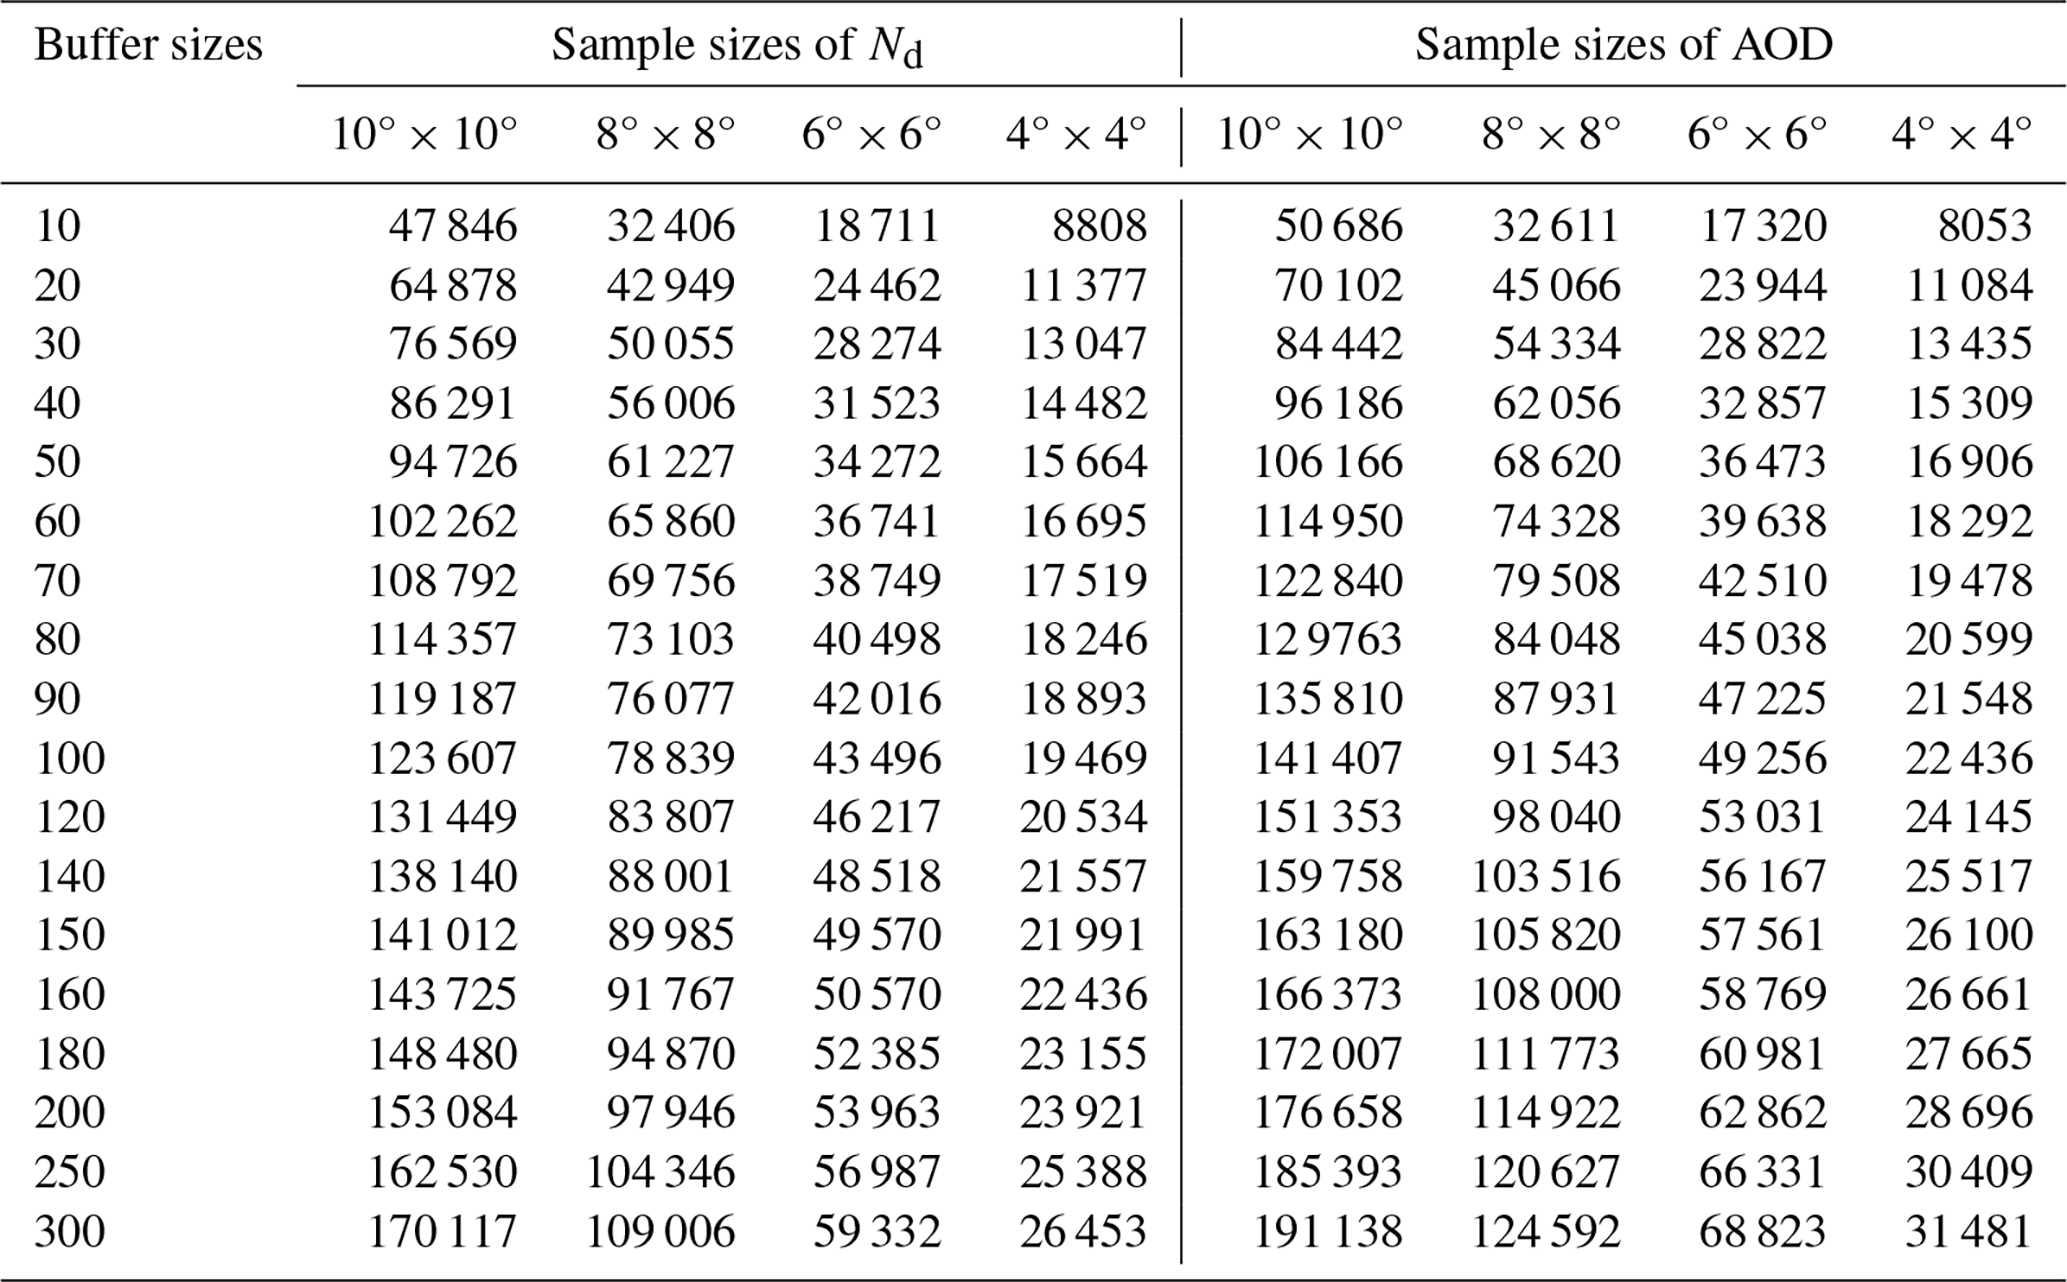
Table A8Sample sizes of cloud droplet number concentration (Nd) and aerosol optical depth (AOD) across different buffer sizes and study areas during 2015–2022.
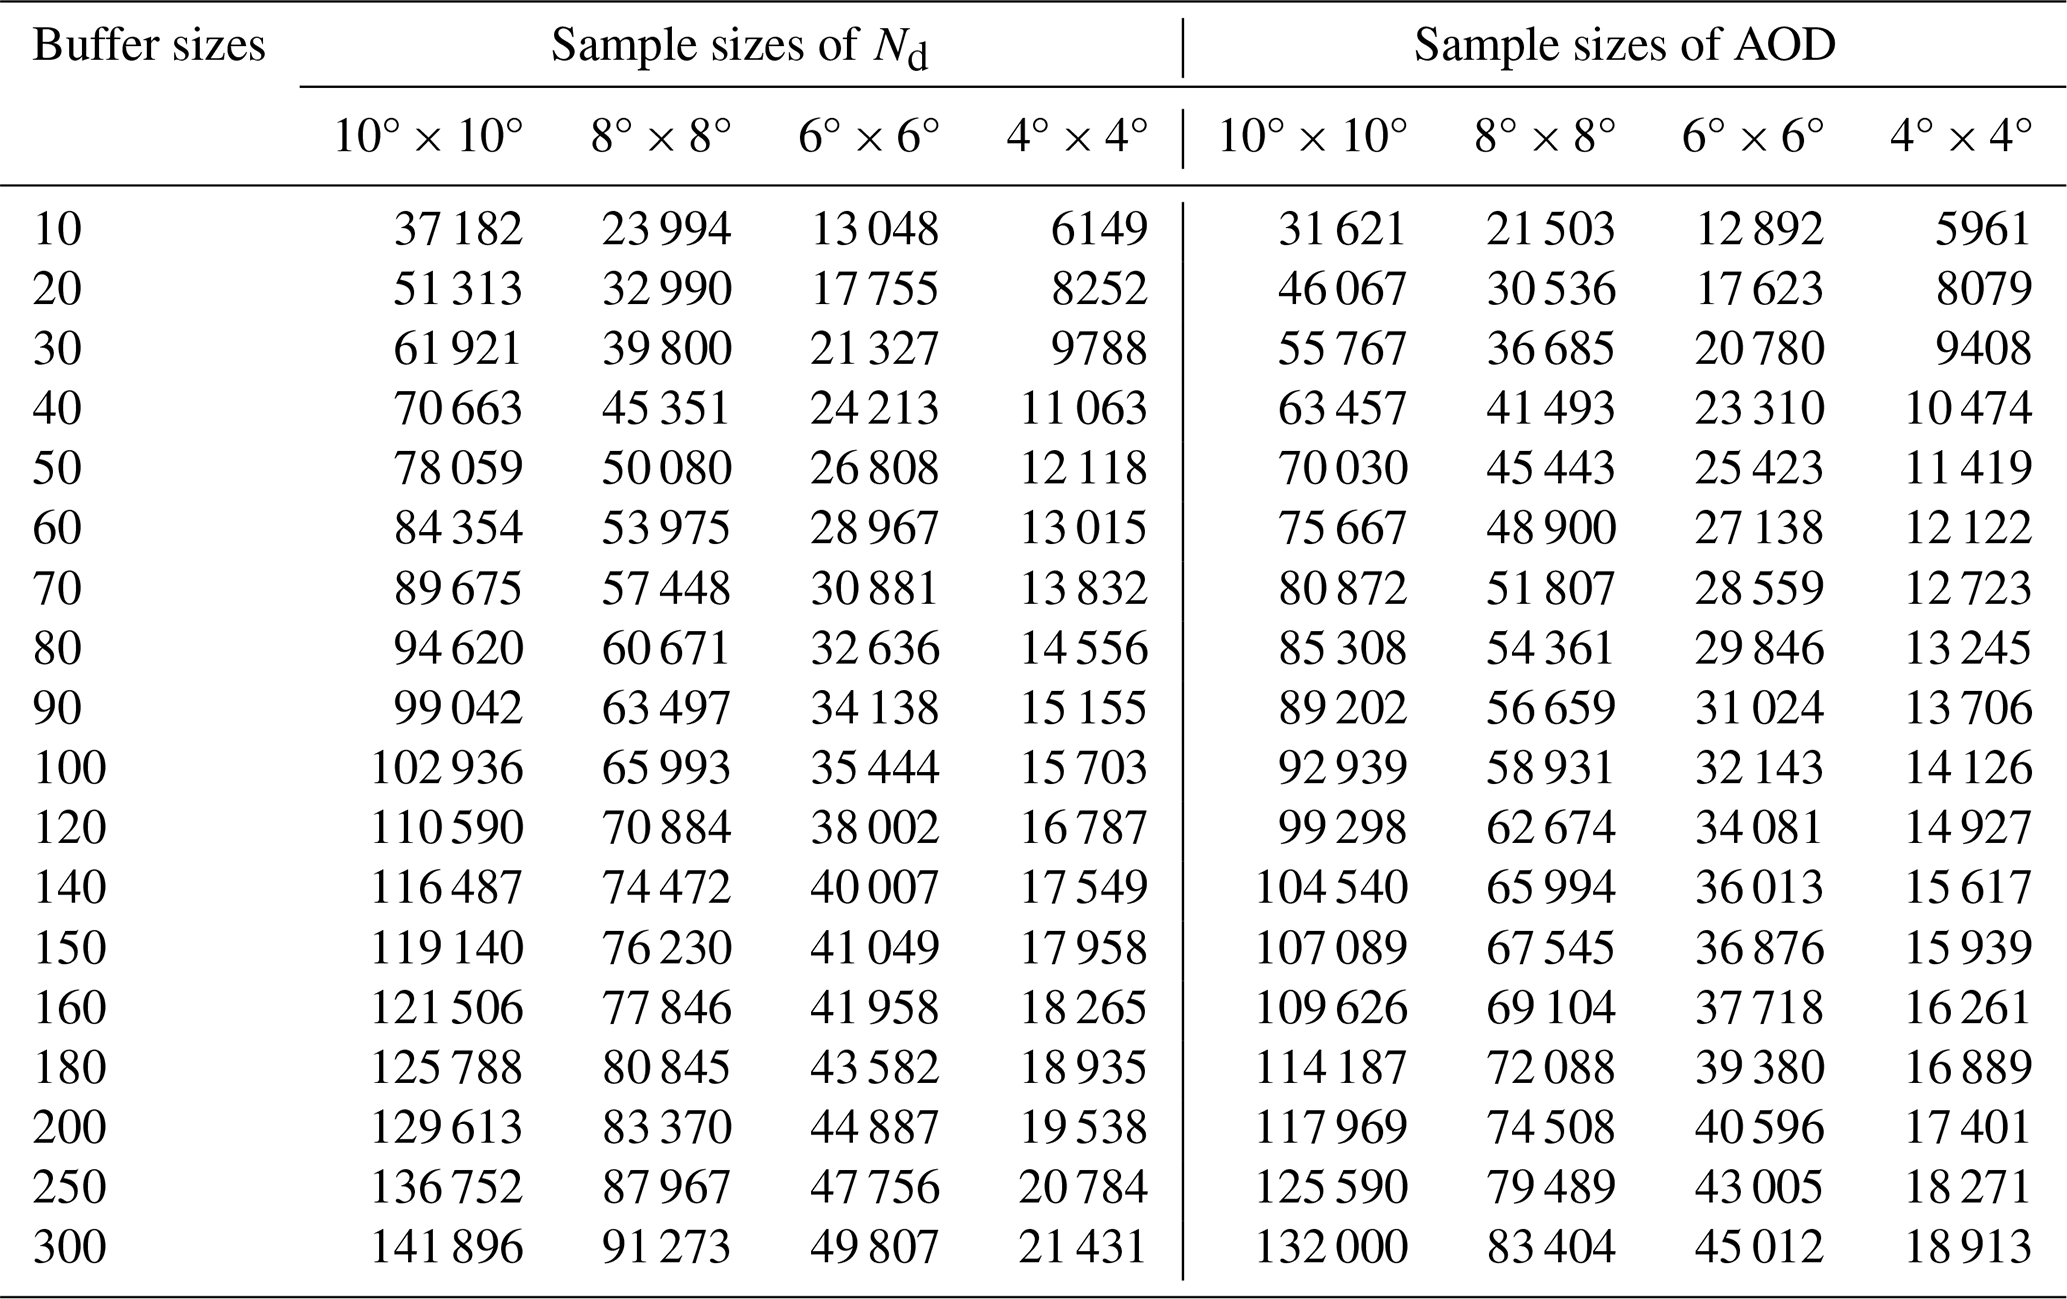
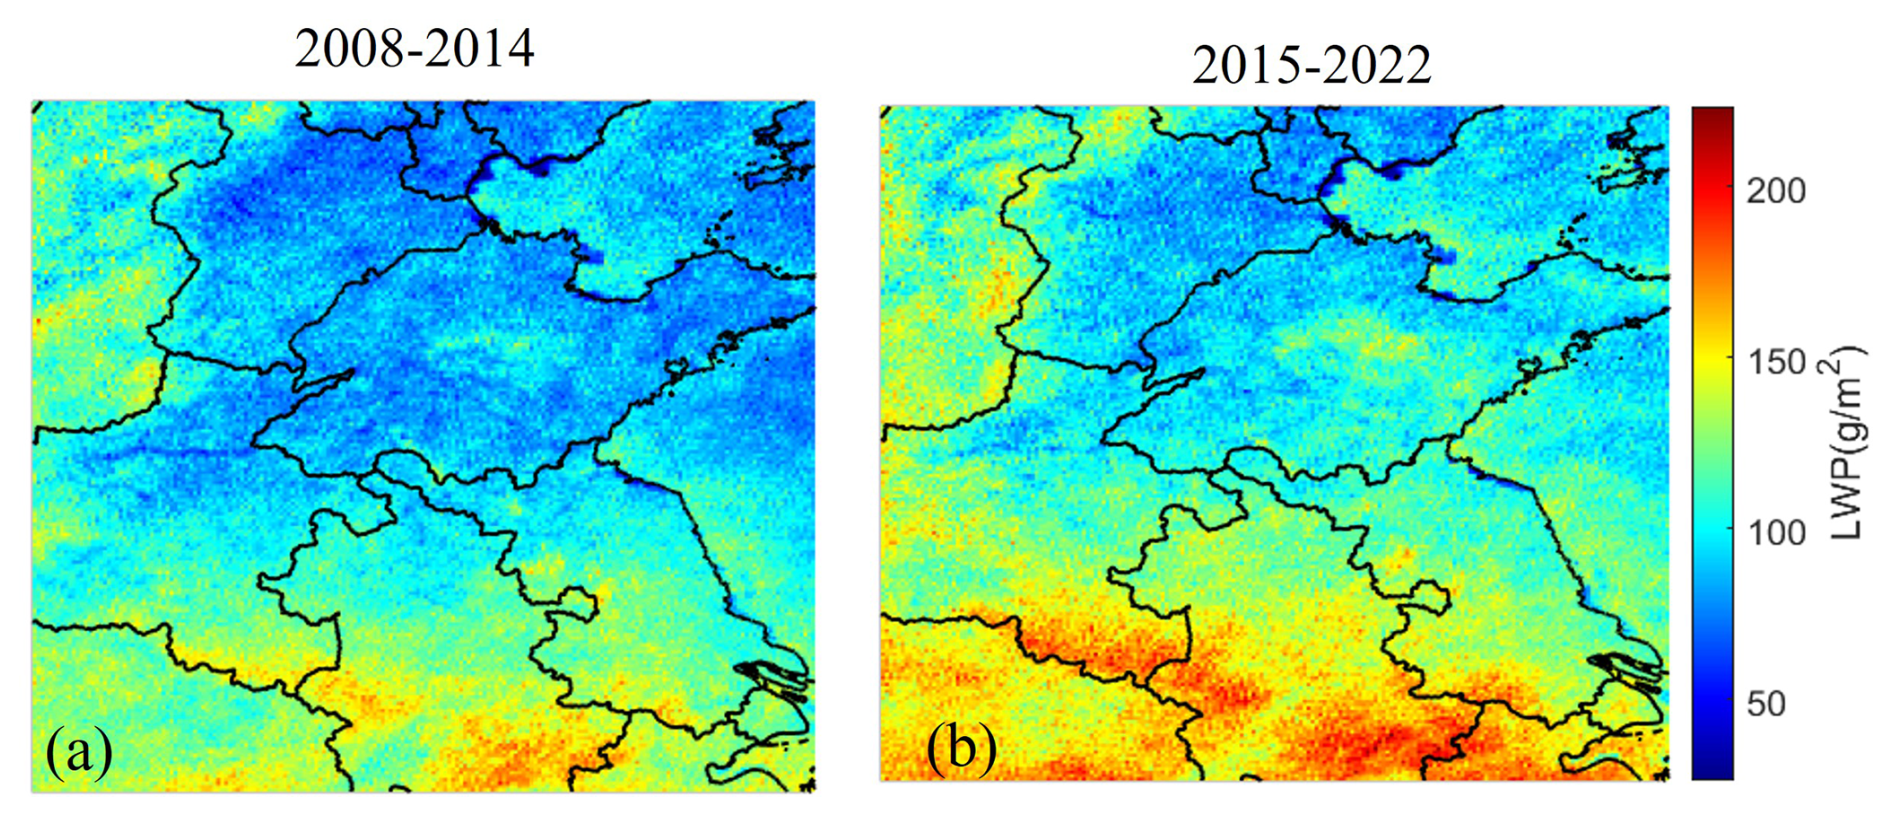
Figure A1Spatial distributions of LWP averaged over the years 2008–2014 (a) and 2015–2022 (b) over the study area. The lines are provincial borders and the names of provinces mentioned in the text are indicated in Fig. 3f.
All data used in this study are publicly available. The satellite data from the MODIS instrument used in this study were obtained from https://ladsweb.nascom.nasa.gov/search/ (last access: 2 July 2025). The satellite data from CALIOP were obtained from https://subset.larc.nasa.gov/calipso/login.php (last access: 2 July 2025).
YL, LT and GL designed the research. YL and LT led the analyses. YL and GL wrote the manuscript with major input from JH, and further input from all other authors. All authors contributed to interpreting the results and to the finalization and revision of the manuscript.
The contact author has declared that none of the authors has any competing interests.
Publisher's note: Copernicus Publications remains neutral with regard to jurisdictional claims made in the text, published maps, institutional affiliations, or any other geographical representation in this paper. The authors bear the ultimate responsibility for providing appropriate place names. Views expressed in the text are those of the authors and do not necessarily reflect the views of the publisher.
The authors greatly appreciate NASA CloudSat Data Processing Center that provided the data used in this study. This work was supported by the National Natural Science Foundation of China (Grant No. 42001290), the Natural Natural Science Foundation of China (Grant No. 42271299), the Natural Science Foundation Project of Xiamen (Grant No. 3502Z202472037) and the Chinese Academy of Sciences President's International Fellowship Initiative, Grant No. 2025PVA0014_Y1.
This research has been supported by the National Natural Science Foundation of China (grant nos. 42001290, 42271299), the Natural Science Foundation Project of Xiamen (grant no. 3502Z202472037) the Chinese Academy of Sciences President's International Fellowship Initiative (grant no. 2025PVA0014_Y1).
This paper was edited by Stelios Kazadzis and reviewed by yong zha and two anonymous referees.
Albrecht, B. A.: Aerosols, cloud microphysics, and fractional cloudiness, Science, 245, 1227–1230, https://doi.org/10.1126/science.245.4923.1227, 1989.
Altaratz, O., Koren, I., Remer, L. A., and Hirsch, E.: Review: Cloud invigoration by aerosols – Coupling between microphysics and dynamics, Atmos. Res., 140–141, 38–60, https://doi.org/10.1016/j.atmosres.2014.01.009, 2014.
Anderson, T. L., Charlson, R. J., Winker, D. M., Ogren, J. A., and Holmén, K.: Mesoscale Variations of Tropospheric Aerosols, J. Atmos. Sci., 60, https://doi.org/10.1175/1520-0469(2003)060<0119:MVOTA>2.0.CO;2, 2003.
Andreae, M. O.: Correlation between cloud condensation nuclei concentration and aerosol optical thickness in remote and polluted regions, Atmos. Chem. Phys., 9, 543–556, https://doi.org/10.5194/acp-9-543-2009, 2009.
Baum, B. A., Paul Menzel, W., Frey, R. A., and Tobin, D.: MODIS cloud-top property refinement for Collection 6, J. Appl. Meteorol. Clim., 51, 1145–1163, https://doi.org/10.1175/JAMC-D-11-0203.1, 2012.
Bellouin, N., Quaas, J., Gryspeerdt, E., Kinne, S., Stier, P., Watson-Parris, D., Boucher, O., Carslaw, K. S., Christensen, M., Daniau, A-L., Dufresne, J.-L., Feingold, G., Fiedler, S., Foster, P., Gettelman, A., Haywood, J. M., Lohmann, U., Malavelle, F., Mauritsen, T., McCoy, D. T., Schulz, M., Schwartz, S. E., Sourdeval, O., Storelvmo, T., Toll, V., Winker, D., and Stevens, B: Bounding global aerosol radiative forcing of climate change, Rev. Geophys., 58, e2019RG000660, https://doi.org/10.1029/2019RG000660, 2020.
Bender, F. A. M., Frey, L., McCoy, D. T., Grosvenor, D. P., and Mohrmann, J. K.: Assessment of aerosol–cloud–radiation correlations in satellite observations, climate models and reanalysis, Clim. Dynam., 52, 4371–4392, https://doi.org/10.1007/s00382-018-4384-z, 2019.
Boucher, O. and Quaas, J.: Water vapour affects both rain and aerosol optical depth, Nat. Geosci., 6, 4–5, https://doi.org/10.1038/ngeo1692, 2012.
Bréon, F. M., Tanré, D., and Generoso, S.: Aerosol effect on cloud droplet size monitored from satellite, Science, 295, 834–838, https://doi.org/10.1126/science.1066434, 2002.
Bulgin, C. E., Palmer, P. I., Thomas, G. E., Arnold, C. P. G., Campmany, E., Carboni, E., Grainger, R. G., Poulsen, C., Siddans, R., and Lawrence, B. N.: Regional and seasonal variations of the Twomey indirect effect as observed by the ATSR-2 satellite instrument, Geophys. Res. Lett., 35, https://doi.org/10.1029/2007GL031394, 2008.
Cai, H., Yang, Y., and Chen, Q.: Distribution Characteristics of Cloud Types and Cloud Phases over China and Their Relationship with Cloud Temperature, Remote Sens., 14, https://doi.org/10.3390/rs14215601, 2022.
Chen, G., Wang, W.-C., and Chen, J.-P.: Aerosol–stratocumulus–radiation interactions over southeast Pacific, J. Atmos. Sci., 72, 2612–2621, https://doi.org/10.1175/JAS-D-14-0319.1, 2015.
Christensen, M. W., Chen, Y.-C., and Stephens, G. L.: Aerosol indirect effect dictated by liquid clouds, J. Geophys. Res., 121, 14636–14650, https://doi.org/10.1002/2016JD025245, 2016.
Christensen, M. W., Neubauer, D., Poulsen, C. A., Thomas, G. E., McGarragh, G. R., Povey, A. C., Proud, S. R., and Grainger, R. G.: Unveiling aerosol–cloud interactions – Part 1: Cloud contamination in satellite products enhances the aerosol indirect forcing estimate, Atmos. Chem. Phys., 17, 13151–13164, https://doi.org/10.5194/acp-17-13151-2017, 2017.
Costantino, L. and Bréon, F. M.: Analysis of aerosol-cloud interaction from multi-sensor satellite observations, Geophys. Res. Lett., 37, L11801, https://doi.org/10.1029/2009GL041828, 2010.
Costantino, L. and Bréon, F.-M.: Aerosol indirect effect on warm clouds over South-East Atlantic, from co-located MODIS and CALIPSO observations, Atmos. Chem. Phys., 13, 69–88, https://doi.org/10.5194/acp-13-69-2013, 2013.
Dagan, G., Yeheskel, N., and Williams, A. I. L.: Radiative forcing from aerosol–cloud interactions enhanced by large-scale circulation adjustments, Nat. Geosci., 16, 1092–1098, https://doi.org/10.1038/s41561-023-01319-8, 2023.
de Leeuw, G., van der A, R., Bai, J., Xue, Y., Varotsos, C., Li, Z., Fan, C., Chen, X., Christodoulakis, I., Ding, J., Hou, X., Kouremadas, G., Li, D., Wang, J., Zara, M., Zhang, K., and Zhang, Y.: Air Quality over China, Remote Sens., 13, 3542, https://doi.org/10.3390/rs13173542, 2021.
de Leeuw, G., Fan, C., Li, Z., Dong, J., Li, Y., Ou, Y., and Zhu, S.: Spatiotemporal variation and provincial scale differences of the AOD across China during 2000–2021, Atmos. Pollut. Res., 13, 101359, https://doi.org/10.1016/j.apr.2022.101359, 2022.
de Leeuw, G., Kang, H., Fan, C., Li, Z., Fang, C., and Zhang, Y.: Meteorological and anthropogenic contributions to changes in the Aerosol Optical Depth (AOD) over China during the last decade, Atmos. Environ., 301, 119676, https://doi.org/10.1016/j.atmosenv.2023.119676, 2023.
Ekman, A. M. L., Nygren, E., Pérez, A. B., Schwarz, M., Svensson, G., and Bellouin, N.: Influence of horizontal resolution and complexity of aerosol–cloud interactions on marine stratocumulus and stratocumulus-to-cumulus transition in HadGEM3-GC3.1, Q. J. Roy. Meteor. Soc., 149, 2049–2066, https://doi.org/10.1002/qj.4494, 2023.
Fan, J., Wang, Y., Rosenfeld, D., and Liu, X.: Review of aerosol-cloud interactions: Mechanisms, significance, and challenges, J. Atmos. Sci., 73, 4221–4252, https://doi.org/10.1175/JAS-D-16-0037.1, 2016.
Fan, J., Zhang, Y., Li, Z., Yan, H., Prabhakaran, T., Rosenfeld, D., and Khain, A.: Unveiling aerosol impacts on deep convective clouds: Scientific concept, modeling, observational analysis, and future direction, J. Geophys. Res.-Atmos., 130, e2024JD041931, https://doi.org/10.1029/2024JD041931, 2025.
Feingold, G.: Modeling of the first indirect effect: analysis of measurement requirements, Geophys. Res. Lett., 30, 1997, https://doi.org/10.1029/2003GL017967, 2003.
Feingold, G., Remer, L. A., Ramaprasad, J., and Kaufman, Y. J.: Analysis of smoke impact on clouds in Brazilian biomass burning regions: an extension of Twomey's approach, J. Geophys. Res., 106, 22907–22922, https://doi.org/10.1029/2001JD000732, 2001.
Feingold, G., Goren, T., and Yamaguchi, T.: Quantifying albedo susceptibility biases in shallow clouds, Atmos. Chem. Phys., 22, 3303–3319, https://doi.org/10.5194/acp-22-3303-2022, 2022.
Grandey, B. S. and Stier, P.: A critical look at spatial scale choices in satellite-based aerosol indirect effect studies, Atmos. Chem. Phys., 10, 11459–11470, https://doi.org/10.5194/acp-10-11459-2010, 2010.
Gryspeerdt, E., Stier, P., and Partridge, D. G.: Satellite observations of cloud regime development: the role of aerosol processes, Atmos. Chem. Phys., 14, 1141–1158, https://doi.org/10.5194/acp-14-1141-2014, 2014.
Gryspeerdt, E., McCoy, D. T., Crosbie, E., Moore, R. H., Nott, G. J., Painemal, D., Small-Griswold, J., Sorooshian, A., and Ziemba, L.: The impact of sampling strategy on the cloud droplet number concentration estimated from satellite data, Atmos. Meas. Tech., 15, 3875–3892, https://doi.org/10.5194/amt-15-3875-2022, 2022.
Gryspeerdt, E., Povey, A. C., Grainger, R. G., Hasekamp, O., Hsu, N. C., Mulcahy, J. P., Sayer, A. M., and Sorooshian, A.: Uncertainty in aerosol–cloud radiative forcing is driven by clean conditions, Atmos. Chem. Phys., 23, 4115–4122, https://doi.org/10.5194/acp-23-4115-2023, 2023.
Glotfelty, T., Alapaty, K., He, J., Hawbecker, P., Song, X., and Zhang, G. Studying Scale Dependency of Aerosol–Cloud Interactions Using Multiscale Cloud Formulations, Mon. Weather Rev., 77, 3847–3868, https://doi.org/10.1175/JAS-D-19-0203.1, 2020.
Grosvenor, D. P., Sourdeval, O., Zuidema, P., Ackerman, A., Alexandrov, M. D., Bennartz, R., Boers, R., Cairns, B., Chiu, J. C., Christensen, M., Deneke, H., Diamond, M., Feingold, G., Fridlind, A., Hünerbein, A., Knist, C., Kollias, P., Marshak, A., McCoy, D., Merk, D., Painemal, D., Rausch, J., Rosenfeld, D., Russchenberg, H., Seifert, P., Sinclair, K., Stier, P., Diedenhoven, B. V., Wendisch, M., Werner, F., Wood, R., Zhang, Z., and Quaas, J.: Remote sensing of droplet number concentration in warm clouds: A review of the current state of knowledge and perspectives, Rev. Geophys., 56, 409–453, https://doi.org/10.1029/2017RG000593, 2018.
Han, X., Zhao, B., Lin, Y., Chen, Q., Shi, H., Jiang, Z., Fan, X., Wang, J., Liou, L. N., and Gu, Y.: Type-dependent impact of aerosols on precipitation associated with deep convective cloud over East Asia, J. Geophys. Res.-Atmos., 127, e2021JD036127, https://doi.org/10.1029/2021JD036127, 2022.
Hassan, T., Zhang, K., Li, J., Singh, B., Zhang, S., Wang, H., and Ma, P.-L.: Impacts of spatial heterogeneity of anthropogenic aerosol emissions in a regionally refined global aerosol–climate model, Geosci. Model Dev., 17, 3507–3532, https://doi.org/10.5194/gmd-17-3507-2024, 2024.
Huang, R.-J., Zhang, Y. L., Bozzetti, C., Ho, K.-F., Cao, J.-J., Han, Y., Daellenbach, K. R., Slowik, J. G., Platt, S. M., Canonaco, F., Zotter, P., Wolf, R., Pieber, S. M., Bruns, E. A., Crippa, M., Ciarelli, G., Piazzalunga, A., Schwikowski, M., Abbaszade, G., Schnelle-Kreis, J., Zimmerman, R., An, Z., Szidat, S., Baltensperger, U., Haddad, I. E., and Prévôt, A. S. H.: High secondary aerosol contribution to particulate pollution during haze events in China, Nature, 514, 218–222, https://doi.org/10.1038/nature13774, 2014.
Jia, H., Ma, X., Quaas, J., Yin, Y., and Qiu, T.: Is positive correlation between cloud droplet effective radius and aerosol optical depth over land due to retrieval artifacts or real physical processes?, Atmos. Chem. Phys., 19, 8879–8896, https://doi.org/10.5194/acp-19-8879-2019, 2019.
Jia, H., Quaas, J., Gryspeerdt, E., Böhm, C., and Sourdeval, O.: Addressing the difficulties in quantifying droplet number response to aerosol from satellite observations, Atmos. Chem. Phys., 22, 7353–7372, https://doi.org/10.5194/acp-22-7353-2022, 2022.
Jones, T. A., Christopher, S. A., and Quaas, J.: A six year satellite-based assessment of the regional variations in aerosol indirect effects, Atmos. Chem. Phys., 9, 4091–4114, https://doi.org/10.5194/acp-9-4091-2009, 2009.
Koren, I., Kaufman, Y. J., Rosenfeld, D., Remer, L. A., and Rudich, Y.: Aerosol invigoration and restructuring of Atlantic convective clouds, Geophys. Res. Lett., 32, L14828, https://doi.org/10.1029/2005GL023187, 2005.
Kaufman, Y. J. and Fraser, R. S.: The effect of smoke particles on clouds and climate forcing, Science, 277, 1636–1639, https://doi.org/10.1126/science.277.5332.1636, 1997.
Kaufman, Y. J., Remer, L., Tanré, D., Li, R., Kleidman, R., Mattoo, S., Levy, R., Eck, T., Holben, B., Ichoku, C., Martins, J., and Koren, I.: A critical examination of the residual cloud contamination and diurnal sampling effects on MODIS estimates of aerosol over ocean, IEEE T. Geosci. Remote, 43, 2886–2897, https://doi.org/10.1109/TGRS.2005.858430, 2005.
King, M. D., Tsay, S. C., Platnick, S. E., Wang, M., and Liou, K. N.: Cloud Retrieval Algorithms for MODIS: Optical Thickness, Effective Particle Radius, and Thermodynamic Phase, MODIS Algorithm Theoretical Basis Document, http://eospso.nasa.gov/sites/default/files/atbd/atbd_mod05.pdf (last access: 6 May 2026), 1997.
King, M. D., Menzel, W. P., Kaufman, Y. J., Tanré, D., Gao, B. C., Platnick, S., Ackerman, S. A., Remer, L. A., Pincus, R., and Hubanks, P. A.: Cloud and aerosol properties, precipitable water, and profiles of temperature and water vapor from MODIS, IEEE T. Geosci. Remote, 41, 442–458, https://doi.org/10.1109/TGRS.2002.808226, 2003.
Lebsock, M., Morrison, H., and Gettelman, A.: Microphysical implications of cloud-precipitation covariance derived from satellite remote sensing, J. Geophys. Res.-Atmos., 118, 6521–6533, https://doi.org/10.1002/jgrd.50347, 2013.
Levy, R. C., Remer, L. A., Kleidman, R. G., Mattoo, S., Ichoku, C., Kahn, R., and Eck, T. F.: Global evaluation of the Collection 5 MODIS dark-target aerosol products over land, Atmos. Chem. Phys., 10, 10399–10420, https://doi.org/10.5194/acp-10-10399-2010, 2010.
Levy, R. C., Mattoo, S., Munchak, L. A., Remer, L. A., Sayer, A. M., Patadia, F., and Hsu, N. C.: The Collection 6 MODIS aerosol products over land and ocean, Atmos. Meas. Tech., 6, 2989–3034, https://doi.org/10.5194/amt-6-2989-2013, 2013.
Lee, H.-H., Zheng, X., Qiu, S., and Wang, Y.: Numerical case study of the aerosol–cloud interactions in warm boundary layer clouds over the eastern North Atlantic with an interactive chemistry module, Atmos. Chem. Phys., 25, 6069–6091, https://doi.org/10.5194/acp-25-6069-2025, 2025.
Lee, S. S., Donner, L. J., and Phillips, V. T. J.: Impacts of aerosol chemical composition on microphysics and precipitation in deep convection, Atmos. Res., 94, 220–237, https://doi.org/10.1016/j.atmosres.2009.05.015, 2009.
Leung, G. R., Saleeby, S. M., Sokolowsky, G. A., Freeman, S. W., and van den Heever, S. C.: Aerosol–cloud impacts on aerosol detrainment and rainout in shallow maritime tropical clouds, Atmos. Chem. Phys., 23, 5263–5278, https://doi.org/10.5194/acp-23-5263-2023, 2023.
Li, G. H., Wang, Y., and Zhang, R. Y.: Implementation of a two-moment bulk microphysics scheme to the WRF model to investigate aerosol-cloud interaction, J. Geophys. Res.-Atmos., 113, D15, https://doi.org/10.1029/2007JD009361, 2008.
Li, Y., Liu, X., and Cai, H.: Numerical simulation of aerosol concentration effects on cloud droplet size spectrum evolutions of warm stratiform clouds in Jiangxi, China, Atmos. Chem. Phys., 24, 13525–13540, https://doi.org/10.5194/acp-24-13525-2024, 2024.
Li, Z., Lau, W. K.-M., Ramanathan, V., Wu, G., Ding, Y., Manoj, M. G., Liu, J., Qian, Y., Li, J., Zhou, T., Fan, J., Rosenfeld, D., Ming, Y., Wang, Y., Huang, J., Wang, B., Xu, X., Lee, S.-S., Cribb, M., Zhang, F., Yang, X., Zhao, C., Takemura, T., Wang, K., Xia, X., Yin, Y., Zhang, H., Guo, J., Zhai, P. M., Sugimoto, N., Babu, S. S., and Brasseur, G. P.: Aerosol and monsoon climate interactions over Asia, Rev. Geophys., 54, 866–929, https://doi.org/10.1002/2015RG000500, 2016.
Liu, Q., Duan, S. Y., He, Q. S., Chen, Y. H., Zhang, H., Cheng, N. X., Huang, Y. W., Chen, B., Zhan, Q. Y., and Li, J. Z.: The variability of warm cloud droplet radius induced by aerosols and water vapor in Shanghai from MODIS observations, Atmos. Res., 253, 105470, https://doi.org/10.1016/j.atmosres.2021.105470, 2021.
Liu, Q., Shen, X., Li, L., Sun, J., Liu, Z., Zhu, W., Zhong, J., Zhang, Y., Hu, X., Liu, S., Che, H., and Zhang, X.: Impacts of Aerosol Chemical Composition on Cloud Condensation Nuclei (CCN) Activity during Wintertime in Beijing, China, Remote Sens., 15, 4119, https://doi.org/10.3390/rs15174119, 2023.
Liu, T. Q., Liu, Q., Chen, Y. H., Wang, W. C., Zhang, H., Li, D., and Sheng, J.: Effect of aerosols on the macro- and micro-physical properties of warm clouds in the Beijing-Tianjin-Heibei region, Sci. Total Environ., 720, 137618, https://doi.org/10.1016/j.scitotenv.2020.137618, 2020.
Liu, Y., de Leeuw, G., Kerminen, V.-M., Zhang, J., Zhou, P., Nie, W., Qi, X., Hong, J., Wang, Y., Ding, A., Guo, H., Krüger, O., Kulmala, M., and Petäjä, T.: Analysis of aerosol effects on warm clouds over the Yangtze River Delta from multi-sensor satellite observations, Atmos. Chem. Phys., 17, 5623–5641, https://doi.org/10.5194/acp-17-5623-2017, 2017.
Liu, Y., Zhang, J., Zhou, P., Lin, T., Hong, J., Shi, L., Yao, F., Wu, J., Guo, H., and de Leeuw, G.: Satellite-based estimate of the variability of warm cloud properties associated with aerosol and meteorological conditions, Atmos. Chem. Phys., 18, 18187–18202, https://doi.org/10.5194/acp-18-18187-2018, 2018.
Liu, Y., Lin, T., Zhang, J., Wang, F., Huang, Y., Wu, X., Ye, H., Zhang, G., Cao, X., and de Leeuw, G.: Opposite effects of aerosols and meteorological parameters on warm clouds in two contrasting regions over eastern China, Atmos. Chem. Phys., 24, 4651–4673, https://doi.org/10.5194/acp-24-4651-2024, 2024.
Liu, Z., Vaughan, M., Winker, D., Kittaka, C., Getzewich, B., Kuehn, R., Omar, A., Powell, K., Trepte, C., and Hostetler, C.: The CALIPSO lidar cloud and aerosol discrimination: Version 2 algorithm and initial assessment of performance, J. Atmos. Ocean. Tech., 26, 1198–1213, https://doi.org/10.1175/2009JTECHA1229.1, 2009.
Ma, P.-L., Rasch, P. J., Wang, M., Wang, H., Ghan, S. J., Easter, R. C., GustafsonJr, W. I., Liu, X., Zhang, Y., and Ma, H.-Y.: How does increasing horizontal resolution in a global climate model improve the simulation of aerosol-cloud interactions?, Geophys. Res. Lett., 42, 5058–5065, https://doi.org/10.1002/2015GL064183, 2015.
Ma, X., Jia, H., Yu, F., and Quaas, J.: Opposite aerosol index-cloud droplet effective radius correlations over major industrial regions and their adjacent oceans, Geophys. Res. Lett., 45, 5771–5778, https://doi.org/10.1029/2018GL077562, 2018.
Marchant, B., Platnick, S., Meyer, K., Arnold, G. T., and Riedi, J.: MODIS Collection 6 shortwave-derived cloud phase classification algorithm and comparisons with CALIOP, Atmos. Meas. Tech., 9, 1587–1599, https://doi.org/10.5194/amt-9-1587-2016, 2016.
Matheson, M. A., Coakley Jr., J. A., and Tahnk, W. R.: Aerosol and cloud property from relationships for summer stratiform clouds in the northeastern Atlantic from advanced very high resolution radiometer observations, J. Geophys. Res., 110, D24204, https://doi.org/10.1029/2005JD006165, 2005.
McComiskey, A. and Feingold, G.: The scale problem in quantifying aerosol indirect effects, Atmos. Chem. Phys., 12, 1031–1049, https://doi.org/10.5194/acp-12-1031-2012, 2012.
McComiskey, A., Feingold, G., Frisch, A. S., Turner, D. D., Miller, M. A., Chiu, J. C., Min, Q., and Ogren, J. A.: Anassessment of aerosol-cloud interactions in marine stratus clouds based on surface remote sensing, J. Geophys. Res., 114, D09203, https://doi.org/10.1029/2008JD011006, 2009.
Meskhidze, N. and Nenes, A.: Effects of ocean ecosystem on marine aerosol-cloud interaction, Adv. Meteorol, https://doi.org/10.1155/2010/239808, 2010.
Michibata, T., Kawamoto, K., and Takemura, T.: The effects of aerosols on water cloud microphysics and macrophysics based on satellite-retrieved data over East Asia and the North Pacific, Atmos. Chem. Phys., 14, 11935–11948, https://doi.org/10.5194/acp-14-11935-2014, 2014.
Mohebalhojeh, M., Frederick, S., Riemer, N., and West, M.: A Metric for Quantifying Spatial Heterogeneity in Gridded Atmospheric Fields, Earth Space Sci., https://doi.org/10.22541/essoar.176805046.69348251/v1, 2026.
Murray-Watson, R. J. and Gryspeerdt, E.: Stability-dependent increases in liquid water with droplet number in the Arctic, Atmos. Chem. Phys., 22, 5743–5756, https://doi.org/10.5194/acp-22-5743-2022, 2022.
Platnick, S., Meyer, K. G., King, M. D., Wind, G., Amarasinghe, N., Marchant, B., Arnold, G. T., Zhang, Z., Hubanks, P. A., Ridgway, W. L., and Riedi, J.: MODIS Cloud optical properties: User guide for the Collection 6/6.1 level-2 MOD06/MYD06 product and associated level-3 datasets, v1.1, NASA, https://atmosphere-imager.gsfc.nasa.gov/sites/default/files/ModAtmo/MODISCloudOpticalPropertyUserGuideFinal_v1.1_1.pdf (last access: 7 May 2026), July 2018.
Proestakis, E., Amiridis, V., Marinou, E., Georgoulias, A. K., Solomos, S., Kazadzis, S., Chimot, J., Che, H., Alexandri, G., Binietoglou, I., Daskalopoulou, V., Kourtidis, K. A., de Leeuw, G., and van der A, R. J.: Nine-year spatial and temporal evolution of desert dust aerosols over South and East Asia as revealed by CALIOP, Atmos. Chem. Phys., 18, 1337–1362, https://doi.org/10.5194/acp-18-1337-2018, 2018.
Possner, A., Zubler, E. M., Lohmann, U., and Schär, C.: The resolution dependence of cloud effects and ship-induced aerosol-cloud interactions in marine stratocumulus, J. Geophys. Res.-Atmos., 121, 4810–4829, https://doi.org/10.1002/2015JD024685, 2016.
Pandey, S. K., Vinoj, V., and Panwar, A.: The short-term variability of aerosols and their impact on cloud properties and radiative effect over the Indo-Gangetic Plain, Atmos. Pollut. Res., 11, 630–638, https://doi.org/10.1016/j.apr.2019.12.017, 2020.
Platnick, S., Meyer, K. G., King, M. D., Wind, G., Amarasinghe, N., Marchant, B., Arnold, G. T., Zhang, Z., Hubanks, P. A., Holz, R. E., Yang, P., Ridgway, W. L., and Riedi, J.: The MODIS cloud optical and microphysical products: Collection 6 updates and examples from Terra and Aqua, IEEE T. Geosci. Remote Sens., 55, 502–525, https://doi.org/10.1109/TGRS.2016.2610522, 2017.
Quaas, J., Boucher, O., and Lohmann, U.: Constraining the total aerosol indirect effect in the LMDZ and ECHAM4 GCMs using MODIS satellite data, Atmos. Chem. Phys., 6, 947–955, https://doi.org/10.5194/acp-6-947-2006, 2006.
Quaas, J., Boucher, O., Bellouin, N., and Kinne, S.: Satellite-based estimate of the direct and indirect aerosol climate forcing, J. Geophys. Res., 113, D05204, https://doi.org/10.1029/2007JD008962, 2008.
Quaas, J., Ming, Y., Menon, S., Takemura, T., Wang, M., Penner, J. E., Gettelman, A., Lohmann, U., Bellouin, N., Boucher, O., Sayer, A. M., Thomas, G. E., McComiskey, A., Feingold, G., Hoose, C., Kristjánsson, J. E., Liu, X., Balkanski, Y., Donner, L. J., Ginoux, P. A., Stier, P., Grandey, B., Feichter, J., Sednev, I., Bauer, S. E., Koch, D., Grainger, R. G., Kirkevåg, A., Iversen, T., Seland, Ø., Easter, R., Ghan, S. J., Rasch, P. J., Morrison, H., Lamarque, J.-F., Iacono, M. J., Kinne, S., and Schulz, M.: Aerosol indirect effects – general circulation model intercomparison and evaluation with satellite data, Atmos. Chem. Phys., 9, 8697–8717, https://doi.org/10.5194/acp-9-8697-2009, 2009.
Quaas, J., Stevens, B., Stier, P., and Lohmann, U.: Interpreting the cloud cover – aerosol optical depth relationship found in satellite data using a general circulation model, Atmos. Chem. Phys., 10, 6129–6135, https://doi.org/10.5194/acp-10-6129-2010, 2010.
Rao, S. and Dey, S.: Consistent signal of aerosol indirect and semi-direct effect on water clouds in the oceanic regions adjacent to the Indian subcontinent, Atmos. Res., 232, 104677, https://doi.org/10.1016/j.atmosres.2019.104677, 2020.
Remer, L. A., Kaufman, Y. J., Tanre, D., Mattoo, S., Chu, D. A., Martins, J. V., Li, R. R., Ichoku, C., Levy, R. C., Kleidman, R. G., Eck, T. F., Vermote, E., and Holben, B. N.: The MODIS aerosol algorithm, products, and validation, J. Atmos. Sci., 62, 947–973, https://doi.org/10.1175/JAS3385.1, 2005.
Rosenfeld, D., Zhu, Y. N., Wang, M. H., Zheng, Y. T., Goren, T., and Yu, S. C.: Aerosol-driven droplet concentrations dominate coverage and water of oceanic low-level clouds, Science, 363, eaav0566, https://doi.org/10.1126/science.aav0566, 2019.
Sarna, K. and Russchenberg, H. W. J.: Ground-based remote sensing scheme for monitoring aerosol–cloud interactions, Atmos. Meas. Tech., 9, 1039–1050, https://doi.org/10.5194/amt-9-1039-2016, 2016.
Saponaro, G., Kolmonen, P., Sogacheva, L., Rodriguez, E., Virtanen, T., and de Leeuw, G.: Estimates of the aerosol indirect effect over the Baltic Sea region derived from 12 years of MODIS observations, Atmos. Chem. Phys., 17, 3133–3143, https://doi.org/10.5194/acp-17-3133-2017, 2017.
Stephens, G., Vane, D. G., Boain, R. J., Mace, G. G., Sassen, K., Wang, Z., Illingworth, A. J., O'Connor, E. J., Rossow, W. B., Durden, S. L., Miller, S. D., Austin, R. T., Benedetti, A., and Mitrescu, C.: The CloudSat Science Team: The CloudSat mission and the A-Train, B. Am. Meteor. Soc., 83, 1771–1790, https://doi.org/10.1175/BAMS-83-12-1771, 2002.
Sourdeval, O., C.-Labonnote, L., Baran, A. J., Mülmenstädt, J., and Brogniez, G.: A methodology for simultaneous retrieval of ice and liquid water cloud properties. Part 2: Near-global retrievals and evaluation against A-Train products, Q. J. Roy. Meteor. Soc., 142, 3063–3081, https://doi.org/10.1002/qj.2889, 2016.
Sundström, A.-M., Kolmonen, P., Sogacheva, L., and de Leeuw, D.: Aerosol retrievals over China with the AATSR dual view algorithm, Remote Sens. Environ., 116, 189–198, https://doi.org/10.1016/j.rse.2011.04.041, 2012.
Tang, J., Wang, P., Mickley, L. J., Xia, X., Liao, H., Yue, X., Sun, L., and Xia, J.: Positive relationship between liquid cloud droplet effective radius and aerosol optical depth over Eastern China from satellite data, Atmos. Environ., 84, 244–253, https://doi.org/10.1016/j.atmosenv.2013.08.024, 2014.
Tao, W. K., Chen, J. P., Li, Z., Wang, C. E., and Zhang, C. D.: Impact of aerosols on convective clouds and precipitation, Rev. Geophys., 50, RG2001, https://doi.org/10.1029/2011RG000369, 2012.
Twomey, S.: Pollution and the planetary albedo, Atmos. Environ., 41, 120–125, https://doi.org/10.1016/0004-6981(74)90004-3, 1974.
Twomey, S.: The influence of pollution on the shortwave albedo of clouds, J. Atmos. Sci., 34, 1149–1152, https://doi.org/10.1175/1520-0469(1977)034<1149:TIOPOT>2.0.CO;2, 1977.
Várnai, T. and Marshak, A.: MODIS observations of enhanced clear sky reflectance near clouds, Geophys. Res. Lett., 36, L06807, https://doi.org/10.1029/2008GL037089, 2009.
Wang, F., Guo, J., Zhang, J., Wu, Y., Zhang, X., Deng, M., and Li, X.: Satellite observed aerosol-induced variability in warm cloud properties under different meteorological conditions over eastern China, Atmos. Environ., 84, 122–132, https://doi.org/10.1016/j.atmosenv.2013.11.018, 2014.
Winker, D. M., Hunt, W. H., and McGill, M. J.: Initial performance assessment of CALIOP, Geophys. Res. Lett., 34, L19803, https://doi.org/10.1029/2007GL030135, 2007.
Winker, D. M., Vaughan, M. A., Omar, A., Hu, Y., Powell, K. A., Liu, Z. Y., Hunt, W. H., and Young, S. A.: Overview of the CALIPSO Mission and CALIOP Data Processing Algorithms, J. Atmos. Ocean. Tech., 26, 2310–2323, https://doi.org/10.1175/2009JTECHA1281.1, 2009.
Winker, D. M., Pelon, J., Coakley Jr., J. A., Ackerman, S. A., Charlson, R. J., Colarco, P. R., Flamant, P., Fu, Q., Hoff, R. M., Kittaka, C., Kubar, T. L., Le Treut, H., Mccormick, M. P., Mégie, G., Poole, L., Powell, K., Trepte, C., Vaughan, M. A., and Wielicki, B. A.: The CALIPSO Mission, B. Am. Meteor. Soc., 91, 1211–1230, https://doi.org/10.1175/2010BAMS3009.1, 2010.
Wang, F., Guo, J., Zhang, J., Huang, J., Min, M., Chen, T., Liu, H., Deng, M., and Li, X.: Multi-sensor quantification of aerosol-induced variability in warm clouds over eastern China, Atmos. Environ., 113, 1–9, https://doi.org/10.1016/j.atmosenv.2015.04.063, 2015.
Yuan, T., Li, Z., Zhang, R., and Fan, J.: Increase of cloud droplet size with aerosol optical depth: an observation and modeling study, J. Geophys. Res., 113, D04201, https://doi.org/10.1029/2007JD008632, 2008.
Zhang, L., Li, J., Li, J., Li, R., Zhang, W., Lei, M., Lv, Q., and Jian, B.: Studying the impacts of meteorological factors on distribution of cloud horizontal scales based on active satellite, J. Geophys. Res.-Atmos., 129, e2024JD041844, https://doi.org/10.1029/2024JD041844, 2024.
Zhang, Q., Meng, J., Quan, J., Gao, Y., Zhao, D., Chen, P., and He, H.: Impact of aerosol composition on cloud condensation nuclei activity, Atmos. Chem. Phys., 12, 3783–3790, https://doi.org/10.5194/acp-12-3783-2012, 2012.
Zhao, J., Ma, X., Quaas, J., and Yang, T.: How meteorological conditions influence aerosol-cloud interactions under different pollution regimes, Atmos. Chem. Phys., 25, 17701–17723, https://doi.org/10.5194/acp-25-17701-2025, 2025.
Zheng, B., Tong, D., Li, M., Liu, F., Hong, C., Geng, G., Li, H., Li, X., Peng, L., Qi, J., Yan, L., Zhang, Y., Zhao, H., Zheng, Y., He, K., and Zhang, Q.: Trends in China's anthropogenic emissions since 2010 as the consequence of clean air actions, Atmos. Chem. Phys., 18, 14095–14111, https://doi.org/10.5194/acp-18-14095-2018, 2018.
Zheng, X., Xi, B., Dong, X., Logan, T., Wang, Y., and Wu, P.: Investigation of aerosol–cloud interactions under different absorptive aerosol regimes using Atmospheric Radiation Measurement (ARM) southern Great Plains (SGP) ground-based measurements, Atmos. Chem. Phys., 20, 3483–3501, https://doi.org/10.5194/acp-20-3483-2020, 2020.
Zheng, X., Dong, X., Xi, B., Logan, T., and Wang, Y.: Distinctive aerosol–cloud–precipitation interactions in marine boundary layer clouds from the ACE-ENA and SOCRATES aircraft field campaigns, Atmos. Chem. Phys., 24, 10323–10347, https://doi.org/10.5194/acp-24-10323-2024, 2024.