the Creative Commons Attribution 4.0 License.
the Creative Commons Attribution 4.0 License.
Deciphering isoprene variability across dozen of Chinese and overseas cities using deep transfer learning
Song Liu
Xiaopu Lyu
Fumo Yang
Zongbo Shi
Xin Huang
Tengyu Liu
Hongli Wang
Mei Li
Jian Gao
Nan Chen
Guoliang Shi
Chenglei Pei
Chengxu Tong
Xinyi Liu
Li Zhou
Alex B. Guenther
Isoprene, the globally most abundant volatile organic compound, significantly impacts air quality. Determining isoprene concentration variations and their drivers is a persistent challenge. Here, we developed a robust machine learning framework to simulate isoprene concentrations, without requiring localized emission inventories and explicit chemistry. Temperature, radiation, and surface pressure were the primary drivers of short-term isoprene variations across Chinese cities. On climatic timescales, urban greenspace expansion and climate warming drove isoprene increases by 341 pptv in Hong Kong during 1990–2023, but traffic emission reductions in London counteracted the isoprene rise that climate warming would have otherwise caused (−755 pptv vs. +31 pptv). Driven by rising temperatures and isoprene levels, ozone would increase by up to 1.7-fold by 2100 under the high-emission scenario. However, ambitious reduction in nitrogen oxides would alleviate this growth to 1.2-fold. The study has the potential to inform air quality management in a warming climate.
- Article
(6377 KB) - Full-text XML
-
Supplement
(1104 KB) - BibTeX
- EndNote
-
An explainable deep transfer learning framework was developed to predict isoprene concentrations and their variations.
-
Different drivers accounted for historical trends of isoprene concentrations in Hong Kong and London from 1990 to 2023.
-
Reducing nitrogen oxides would alleviate ozone pollution driven by rising temperatures and isoprene levels in the warming climate.
Isoprene is the most abundant non-methane volatile organic compound (VOC) globally, with the total emissions reaching approximately 500 TgC per year, exceeding those of the total anthropogenic VOCs (Guenther et al., 2012; Huang et al., 2017). The high atmospheric reactivity makes it a key precursor for tropospheric ozone (O3) and secondary organic aerosol, both of which significantly impact air quality and climate (Paulot et al., 2012; Lin et al., 2013; Xi et al., 2025a). In particular, the effect is pronounced in urban environments due to the interactions between isoprene and anthropogenic emissions (Xu et al., 2015).
Terrestrial vegetation is the primary source of atmospheric isoprene, and the emissions are influenced by plant species, geographical locations, and environmental conditions (Guenther et al., 1994, 1993). Urban landscapes show remarkable diversity in isoprene production, exemplified by stark differences between tree species. While urban greenspace offers numerous benefits, it also emerges as a notable contributor to urban isoprene (Ma et al., 2022). The emissions are highly sensitive to meteorological conditions (Wang et al., 2024a). The combination of climate warming and urbanization lead to intensified urban heat, which in turn boosts isoprene emissions from greenspace (Li et al., 2024; Pfannerstill et al., 2024). In addition, studies have shown that a portion of urban isoprene may stem from motor vehicles, the contribution of which varies by location and season (Borbon et al., 2001). However, vehicle emissions of isoprene do not necessarily increase with growing vehicle population, due to stringent emission controls in many cities. This further complicates the task of accurately simulating the concentrations and trends of urban isoprene. While isoprene may also be emitted from other anthropogenic sources, such as petrochemical activities and coal combustion, the amounts are generally small compared to biogenic emissions, especially in warm seasons (Peron et al., 2024).
Modeling and measurement deficiencies remain a serious concern in isoprene research across multiple disciplines. For example, the Model of Emissions of Gases and Aerosols from Nature (MEGAN) estimates vegetation emissions based on theoretical relationships with meteorology and vegetation dynamics. This model significantly underestimates isoprene emissions from urban greenspace when it is driven by coarse resolution (e.g., >30 m) satellite-derived vegetation data (Ma et al., 2019, 2022). It is also difficult for current chemical transport models to accurately simulate isoprene concentrations, mainly resulting from the grid resolution and uncertainties in isoprene emissions, vertical dispersion rates and oxidation parameterization schemes (Arneth et al., 2011; Guenther et al., 2012). Local vegetation surveys and emission factor measurements can be made to improve model performance. However, the work is challenging and the outcomes often point out additional uncertainties (Seco et al., 2022; Wang et al., 2024b). While isoprene measurements have demonstrated reliability in atmospheric chemistry research, the temporal and spatial coverage remains suboptimal. Given these constraints, there are insufficient robust isoprene data available over climatic timescales (e.g., several decades) to reveal the drivers of long-term trends.
To confront this dilemma, we developed a generalized physics-informed neural network based on a residual Multi-Layer Perceptron with a transfer training strategy to reproduce/predict ambient isoprene concentrations. The model was trained by a comprehensive set of isoprene data observed at ten sites in China (a total of ∼ 65 000 hourly data) and validated by a total of ∼ 8500 hourly and daily data at six overseas sites (Table S1 in the Supplement). The model was verified for its ability to predict isoprene with limited sizes of observational data and understand intricate relationships between isoprene and influencing factors. The model was then used to predict future trends of isoprene and the resulting O3 variations in different climate scenarios. This study enhances our understanding of the responses of ambient isoprene concentrations to emissions and meteorology, and has the potential to inform urban planning and air quality policies in the warming climate.
2.1 Isoprene Data and Deep Learning Model
A total of over 72 000 hourly (and a small fraction of daily) data of isoprene concentrations in the daytime (06:00–20:00 local time) of warm seasons (May–October) were compiled from 16 sites worldwide. Around 88 % the data was from different parts of China, and the remainder was from North America, Amazonia, India, and the UK (see Table S1). To ensure comparability, we included only online measurements, excluding offline sampling and analysis methods. While inter-instrument bias might exist, the isoprene variability within each site was expected to be much larger than any plausible inter-instrument bias. Moreover, this will not influence the analysis of isoprene variations at individual sites.
The residual multi-layer perceptron architecture (ResMLP) was employed to approximate the complicated responses of isoprene concentrations to input features, which was coupled with a physics-informed neural network, thereby PINN-ResMLP. This approach integrated domain knowledge by enforcing monotonicity constraints between isoprene and its major sources (e.g., vegetation and traffic emissions), thus ensuring physically consistent predictions. These constraints were implemented directly in the model's loss function, which combined terms for data fitting, monotonicity regularization, and network structure penalties. As a fully data-driven model, ResMLP may learn patterns that are inconsistent with physical laws (Feng et al., 2025). Incorporating expert knowledge and physical constraints into the model can guide the learning processes (Zhu et al., 2024). In this study, we stipulated that isoprene concentrations were positively correlated with the biogenic and traffic emission sources. This relationship therefore can be expressed as:
where ISOP represents isoprene concentrations; VI is vegetation index derived from Leaf Area Index (LAI) and Normalized Difference Vegetation Index (NDVI) (see Sect. S1 in the Supplement); and BCtraffic is traffic emissions of black carbon. To satisfy this priori knowledge, we developed PINN-ResMLP to constrain the model. The optimization objective of PINN-ResMLP included data item loss (Ldata), physical inconsistency loss (Lmonotonicity), and additional structural loss (Lstructure). Meanwhile, the L2 norm of the network parameters, namely adding the sum of the squares of all network weights (parameters) to the loss function, could effectively regularize and prevent overfitting in PINN-ResMLP. Finally, the total function was formulated as:
where the α and β are trade-off parameters; N is the number of training samples; i represents a certain sample; ISOPobs and ISOPpred are observed and predicted isoprene concentrations, respectively; M is the number of layers in PINN-ResMLP.
Predictor variables were selected to capture key sources and sinks of isoprene, including VI (see Sect. S1), meteorological parameters (e.g., temperature, solar radiation), and black carbon emitted from traffic (BCtraffic) as a proxy for anthropogenic emissions. To ensure consistency among all variables, datasets with different spatial resolutions (e.g., 0.1 and 0.25°) were resampled to achieve a uniform resolution of 0.1° using bilinear interpolation. Full variable definitions and sources are provided in Table S2.
To address data scarcity at some sites, we implemented a supervised transfer learning strategy. The PINN-ResMLP was pre-trained on data-rich sites and fine-tuned with limited data from target sites (see Table S3). Three training strategies were adopted: (1) transfer learning (T), where models were pre-trained on data from other sites and fine-tuned on the target site; (2) no-transfer (NT), where models were trained solely on target site data; and (3) mixed training (MIX) using combined data from all sites. Model performance was evaluated using four-fold cross-validation (Table S3) and metrics including normalized mean absolute error (NMAE) and coefficient of determination (R2). Comparisons were made against standard machine learning algorithms, such as Random Forest (RF), extreme gradient boosting (XGB), and support vector machine (SVM). All algorithms were optimized using extensive grid search (see hyperparameters in Table S4). NMAE and R2 are calculated as follows:
where represents the mean value of ISOPobs.
Finally, the Shapley Additive Explanations (SHAP) approach (Lundberg et al., 2020) was used to quantify the contributions of input variables to model predictions. SHAP values allow us to assess the impact of each factor on isoprene concentrations. The calculation is defined as follows:
where K represents the set of all features, S⊆K{i} denotes a feature subset that excludes feature i, |S| is the size of subset S, f(S) is the model's prediction under feature subset S, and is the marginal contribution of feature i.
2.2 Attribution of Long-term Isoprene Trends and O3 Projections
The PINN-ResMLP model was also used to quantify the contributions of different factors to the long-term trends of isoprene concentrations at three sites in Hong Kong and London using a scenario-based approach. Using the historical data of meteorological parameters, VI and BCtraffic as the input of the PINN-ResMLPT model, we predicted the summertime (June to August) isoprene concentrations in Hong Kong and London for the period of 1990–2023 (base scenario). In order to reveal the impacts of the major drivers on the isoprene variations, we also predicted the isoprene concentrations by fixing the temperature, VI and BCtraffic as their averages over the above period one by one (controlled scenarios). The differences in the predicted isoprene (isoprenediff) between the base and controlled scenarios depicted the isoprene trends induced by the individual factors. The isoprenediff was then compared between different time periods, e.g., the first and last 17 years and the first, middle and last decades. Besides, the coefficient of variation (CV) was calculated for the predicted isoprene concentrations in all the scenarios over the period of 1990–2023. The CV differences between the base and controlled scenarios indicate how the changes in temperature, VI and traffic emissions (represented by BCtraffic) increased or decreased the variations in isoprene concentrations.
Additionally, future isoprene concentrations at the Hong Kong site were projected for 2030–2100 based on temperature changes under different climate scenarios developed by the Coupled Model Intercomparison Project Phase 6 (CMIP6), while keeping other influencing factors constant. Briefly, we used the temperature data from four Shared Socioeconomic Pathways (SSPs), including SSP126 (low forcing), SSP245 (intermediate forcing), SSP370 (medium-high forcing), and SSP585 (high forcing), and held the other influencing factors constant. The averages of outputs from four Coupled Model Intercomparison Project Phase 6 (CMIP6) models (ACCESS-CM2, CMCC-ESM2, MPI-ESM1-2-HR, and GFDL-ESM4) were adopted (Xu et al., 2024).
Using the future profiles of temperature and isoprene as constraints, we simulated O3 concentrations as a function of isoprene and temperature using a zero-dimensional box model under different NOx reduction scenarios. The Framework for 0-D Atmospheric Modeling (F0AM) incorporating Master Chemical Mechanism v3.3.1 was used to simulate O3 under different sets of temperatures and isoprene concentrations (Lyu et al., 2024). The model was constrained by the average diurnal profiles of air pollutants (excluding O3) and meteorological parameters observed in the summer of 2023 at the Hong Kong_TC site, except that the daytime average temperature changed from 22 to 38 °C in 2 °C intervals and the daytime average isoprene concentrations varied in the range of 0.15–1.8 ppbv in intervals of 0.15 ppbv. The O3 isopleths were depicted using the simulation results for 108 temperature-isoprene settings. Additionally, the above simulations were repeated in different scenarios of NOx reduction, i.e., 49.7 % and 82.6 % under the SSP370 and SSP126, respectively (Lou et al., 2023; Rogelj et al., 2018). It is worth noting that the diurnal profiles of other O3 precursors, such as VOCs and carbon monoxide, were kept unchanged throughout all the simulations. Meanwhile, our future projections are designed to isolate the chemical response of O3 to changes in temperature and isoprene and do not explicitly incorporate potential future changes in greenspace, urban morphology, or other anthropogenic emissions. Although these factors are expected to evolve under urban development and climate mitigation pathways, the present analysis focuses on quantifying the impacts of climate warming on isoprene emissions and the consequent O3 responses.
3.1 Simulating Isoprene Concentrations Using PINN-ResMLPT Model
The isoprene concentrations averaged over the respective observation periods varied significantly from 0.15 ppbv in Wuhan to 2.79 ppbv in New Delhi (Figs. 1 and S1 in the Supplement), due to the differences in sampling periods, climatic conditions, and vegetation type and density. We noticed that most cities have experienced an increase in greenspace in the last 20 years, and there existed significant differences in greenspace coverage and its recent trends between the cities (e.g., Hong Kong versus London). The high vegetation cover appeared to explain the elevated levels of isoprene in South China and Amazonia. Temperature also had a strong effect on isoprene concentrations, as indicated by the Pearson correlation coefficient (R) between hourly isoprene and temperature at individual sites, i.e., 0.41–0.72. The temperature and temperature variation were spatially non-uniform, implying its inconsistent roles in affecting biogenic isoprene emissions. Additionally, anthropogenic emissions might have made significant contributions to isoprene in New Delhi, given the high nocturnal levels and the peak in evening rush hours (Fig. S2). This was also mentioned in a previous study (Tripathi et al., 2022). The Weather Research and Forecasting model with Chemistry, which theoretically takes these factors into account, was used to simulate the isoprene concentrations. However, substantial divergences were noted between the simulated and observed values at hourly or even daily resolution (Fig. S3), demonstrating the challenge for chemical transport models in accurately simulating isoprene (Morichetti et al., 2022; Wang et al., 2024b).

Figure 1Geographical distribution of the isoprene sampling sites. (a–e) Locations of isoprene measurement sites in China (a), North America (b), Amazonia (c), United Kingdom (d), and India (e). The direction of arrows represents the trend of temperature from 1990 to 2023, and the size of the circle is proportional to isoprene concentration. (f) Trends of LAI (Leaf Area Index) and NDVI (Normalized Difference Vegetation Index) from 2001 to 2021 in major cities around the world.
We then examined the isoprene prediction ability of various machine learning algorithms with three training strategies: T, NT, and MIX (see Sect. 2.3). Overall, the model utilizing the NT training strategy exhibited higher fitting accuracy than the one employing the MIX training strategy (Fig. 2). This suggests that training with data from different sites might introduce additional noises, due to the differences in isoprene emission dynamics. Particularly, isoprene emissions are highly sensitive to local vegetation profiles. While the ResMLP model with the NT training strategy (ResMLPNT) performed moderately among all the algorithms, the performance was improved by incorporating the T strategy. Specifically, the ResMLPT outperformed the other algorithms at 8 out of 10 sites, with the decrease in NMAE of 1 %–5 % and increase in R2 of 0.01–0.07. The results indicated that the ResMLPT model effectively exploited the implicit prior knowledge from the pre-training data to guide isoprene prediction at the target sites. Importantly, the pre-trained parameters were fine-tuned using limited sizes of local data, which adapted the model to local isoprene emission dynamics without requiring region-specific vegetation profiles, such as vegetation types and corresponding emission factors. It is worth noting that the size of the retraining data at the validation sites was ∼ 30 % of all the data. Thus, the model's good performance at the validation sites demonstrated its utility in data-scarce regions. Furthermore, with the incorporation of PINN, the PINN-ResMLPT showed a better understanding of the real target-feature relationships with more interpretable prediction results. The model performance was further improved, as indicated by the highest R2 values across all the sites (Fig. 2).
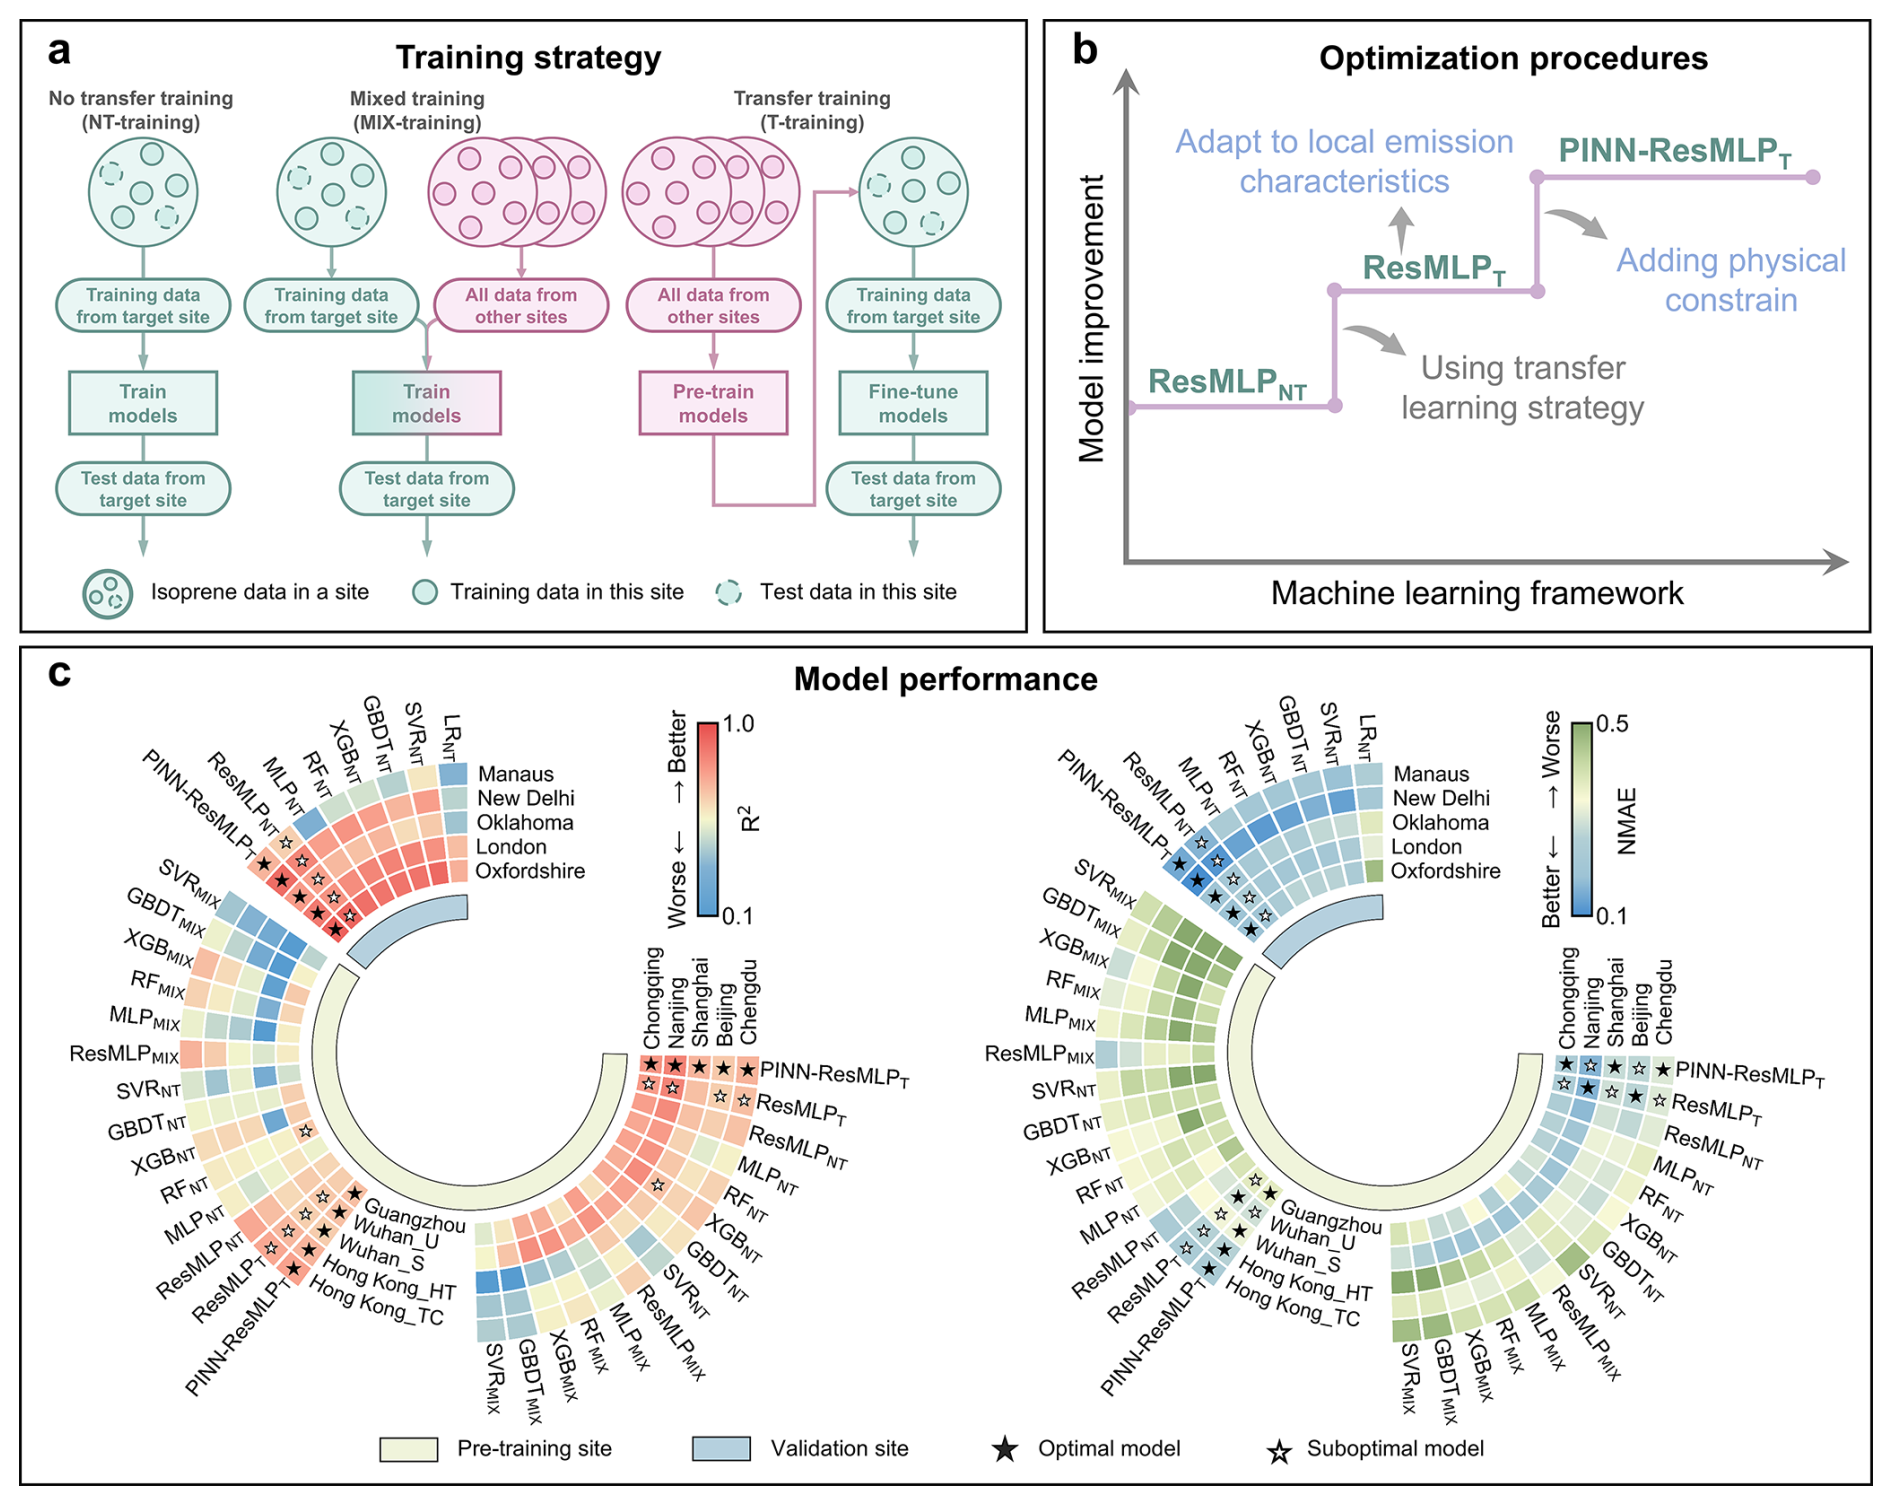
Figure 2Schematic of the machine learning framework for predicting isoprene concentration. (a) A sketch of the training strategy. (b) The improvement of the machine learning framework. (c) Comparisons of statistical performance across different algorithms in individual sites. RF, XGB, GBDT, SVM, and LR represent Random Forest, eXtreme Gradient Boosting, Gradient Boosting Decision Tree, Support Vector Machine, and Linear Regression, respectively.
Next, we also validated the PINN-ResMLPT model by applying it to predict isoprene concentrations at the overseas sites (Fig. 1). The model was pre-trained with the complete dataset from all the sites in China, which was further fine-tuned with 70 % of the data at the individual target sites and validated with the remaining data. Compared to the suboptimal model, the PINN-ResMLPT model significantly improved the prediction of isoprene, especially at New Delhi and Manaus, with the increase in R2 (decrease by NMAE) by 0.07 (25 %) and 0.08 (13 %), respectively (Fig. 2). This demonstrated the model's broad applicability. Moreover, the model outperforms many other methods in predicting isoprene. For instance, the root mean square error of the PINN-ResMLPT at Manaus was 0.17 ppbv, compared to 0.95 ppbv for the early attempt in Cross-track Infrared Sounder retrieval (Fu et al., 2019). This superior performance establishes the PINN-ResMLPT as our best choice. In fact, we would expect more accurate predictions if the model were pre-trained by a wider range of field measurement data from various regions.
3.2 Main Factors Influencing Urban Isoprene Concentrations
Further, a feature importance method based on the SHAP values was employed to explore the prediction results (Fig. 3). While we prefer to present it for individual sites, the feature importance of VI and BCtraffic was not calculated for the Chinese sites except a suburban site in Hong Kong (HK_TC), due to the low temporal resolutions of VI and BCtraffic data and the short isoprene observation periods. Here, we discuss the drivers of short-term (2–4 years) and long-term (over 10 years) isoprene concentration variations, separately.
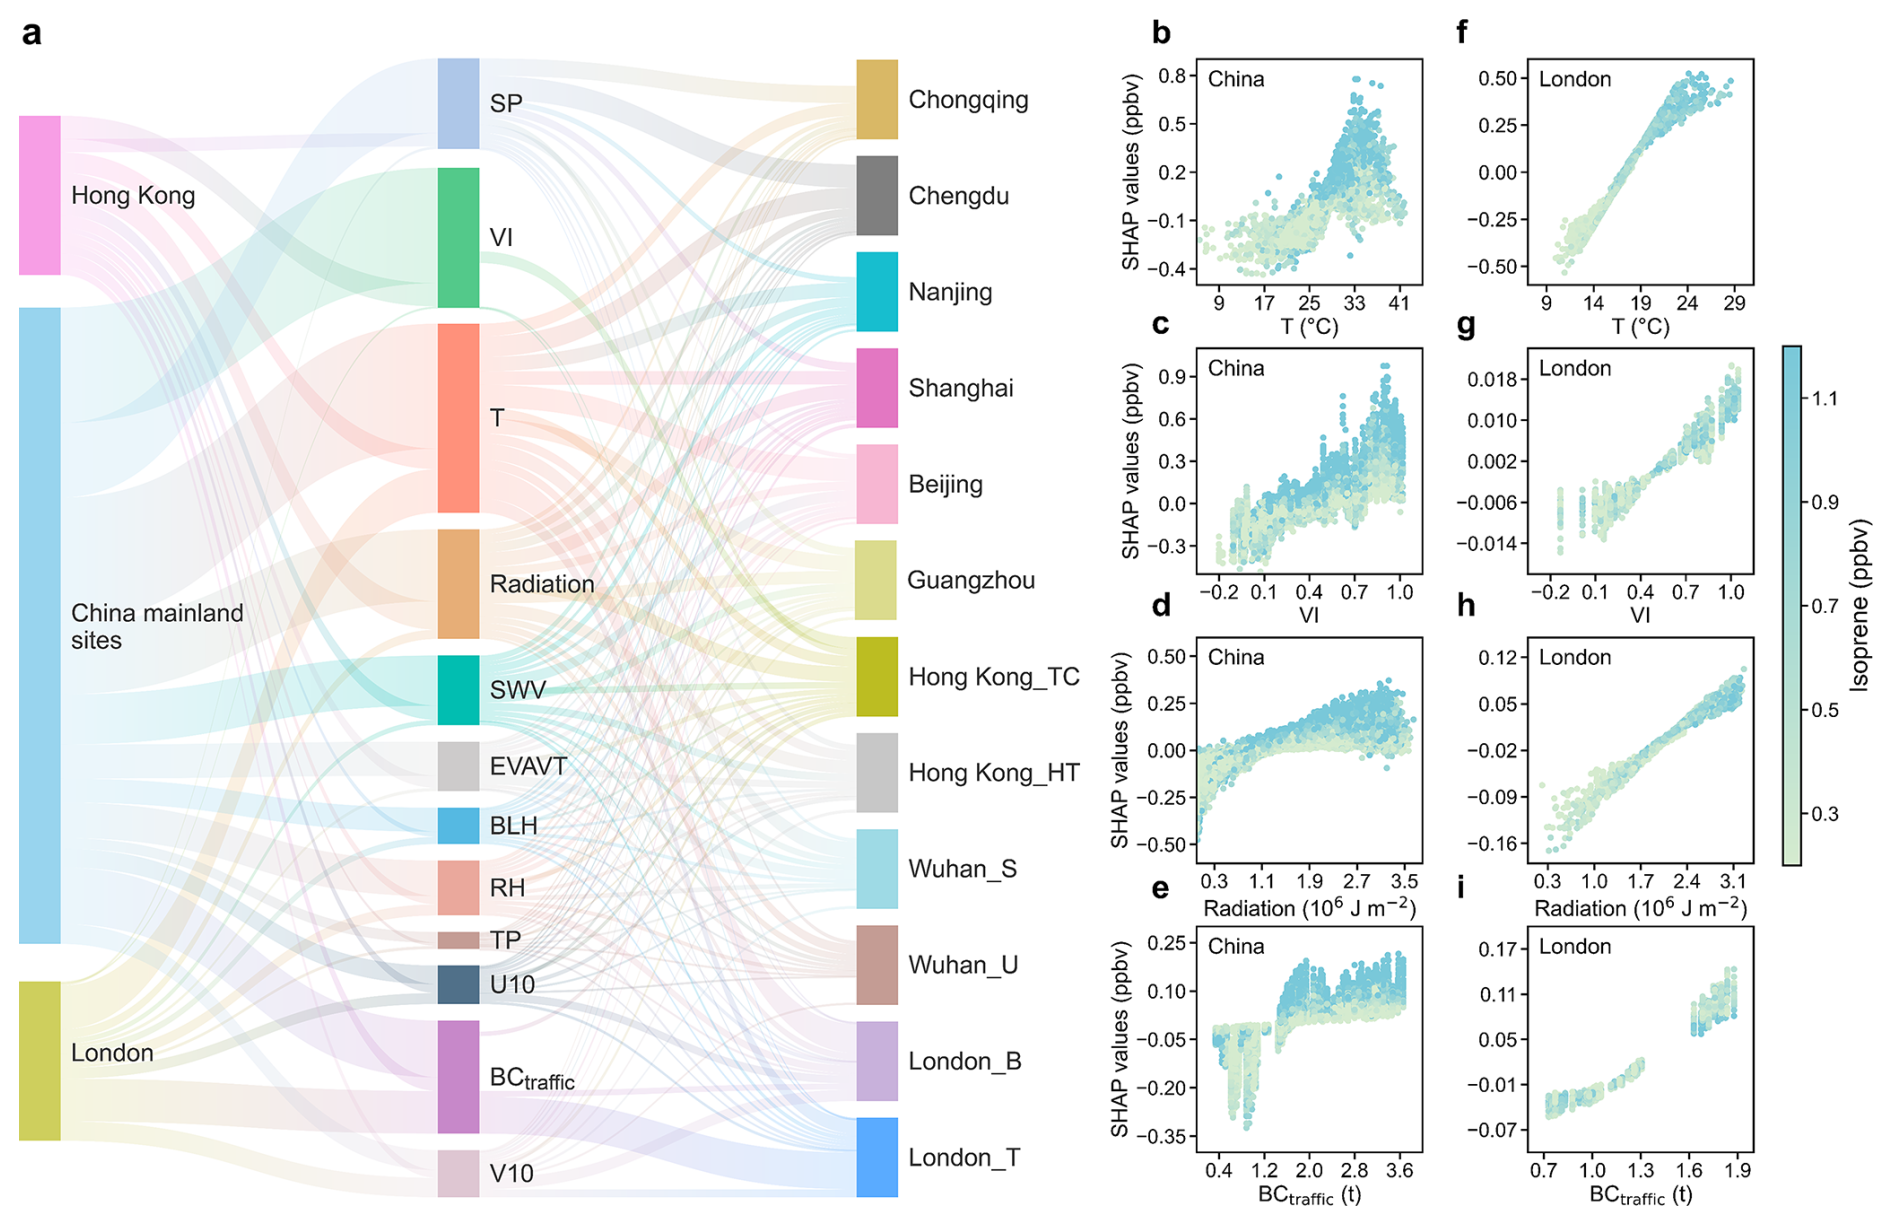
Figure 3Modeling explainable results at each site based on SHAP value. (a) Feature importance for isoprene concentrations at individual sites. (b–i) The SHAP dependence plots of major influencing variables averaged at the Chinese sites (b–e) and London sites (f–i).
With the VI and BCtraffic remaining relatively stable in the short term, the model indicated that temperature, radiation, surface pressure, and soil water vapor were the most significant drivers of short-term isoprene variations, and their average relative importance was 18.8 %, 11.9 %, 11.3 %, and 8.1 % across the all the Mainland China sites, respectively. In addition, evaporation from vegetation transpiration and relative humidity also played significant roles in affecting isoprene concentrations at the Wuhan suburban site and Beijing urban site, respectively. The model also effectively captured the target-feature relationships. In China, the predicted isoprene concentrations increased with temperature below ∼ 35 °C, above which a decline occurred at some sites. A typical example was the response in Chongqing with frequent occurrence of high temperature extremes (Fig. S4). High temperatures suppress vegetation emissions due to a reduction in enzyme activity and substrate availability while accelerating the photochemical oxidation loss of isoprene. A similar pattern was observed in the response of isoprene concentrations to radiation in China, especially at extremely high levels. Such nonlinear responses are critical to the parameterization of isoprene emissions in numerical models. Notably, recent studies have revealed substantial uncertainties in the MEGAN model's performance under extreme heat conditions (Wang et al., 2024a). In contrast, our data-driven machine learning approach effectively captures these complex, nonlinear relationships between isoprene concentrations and environmental predictors, offering a promising pathway to refine and optimize parameterization schemes in chemical transport models. In addition to the close relationships with temperature, solar radiation affects the hydroxyl radical concentrations and therefore can significantly increase chemical loss of isoprene. In contrast, these phenomena were not observed in London, because of lower temperatures and weaker solar radiations. Overall, our transfer learning model reasonably reflected the isoprene-meteorology relationships.
Further, the long-term isoprene observations in London and Hong Kong offer an opportunity to examine how the evolutions of VI and BCtraffic affected isoprene variations on a climatic scale. As two prominent international cities, London and Hong Kong are characterized by distinct climatic zones: London experiences a mid-latitude temperate maritime climate, whereas Hong Kong is influenced by a low-latitude subtropical monsoon climate. This climatic differentiation is reflected in their predominant vegetation types, with temperate deciduous trees being prevalent in London and evergreen broad-leaved trees dominating the landscape in Hong Kong. Furthermore, the trajectories of urbanization and air pollution management have evolved differently in each city, shaped by their unique environmental and socio-economic contexts. Here, we focus on the results at two London sites and a Hong Kong site, where long term data was available. Radiation, VI and temperature were the most predominant influencing factors at the suburban site in Hong Kong. In contrast, the relative importance of VI was low at the two London sites. Over the period of 2000–2021, Hong Kong has experienced a notable increase in NDVI (2.1 × 10⁻³ yr−1) and LAI (2.8 × 10⁻² yr−1), while the rate was much lower in London, i.e., 0.9 × 10⁻³ yr−1 for NDVI and 0.9 × 10⁻² yr−1 for LAI. Additionally, the significant difference in VI importance between Hong Kong and London might also be attributed to the different strength of vegetation emissions across latitudes (Guenther et al., 2006, 2012). Instead, BCtraffic (temperature) ranked the first at the traffic (suburban) site in London, followed by other meteorological factors (Fig. 3). While the meteorological impacts were not surprising, isoprene correlated well with the BCtraffic emissions and observed benzene at the London traffic site (Fig. S5), thereby the high relative importance of BCtraffic. This is consistent with the previous studies on traffic emissions of isoprene in London (Borbon et al., 2001; von Schneidemesser et al., 2011). As constrained using the PINN, the SHAP values for isoprene concentrations of VI and BCtraffic showed a monotonic increasing trend.
3.3 Factors Driving Long-term Trends of Isoprene
The model was also used to build the time series data of daytime isoprene concentrations at a daily resolution over a climatically relevant period (1990–2023) at the three sites with long-term but incomplete isoprene data. The comparison between the geographically distinctive London and Hong Kong offers a rare opportunity to examine the different drivers of isoprene trends. As shown in Fig. 4, the predicted isoprene concentrations were in good agreement with the observations, with the R2 of 0.68–0.83 and NMAE of 21 %–27 %. It's worth noting that the observational data was missing for 50 %–67 % of the dates at the three sites. This underscored the model's effectiveness in retrieving historical isoprene concentrations from limited observation data.

Figure 4Long-term trends of the summertime isoprene and the drivers. (a–c) Variations of isoprene concentrations (blue lines for simulated, blue dots for observed), temperature (T), urban greenspace (VI) and traffic emissions (BCtraffic) in Hong Kong (a) and London (b, c). The red dots and red line represent temperature and the fitted trend for the mean temperature, respectively. The bands represent 95 % confidence intervals. (d–f) Changes in isoprene concentrations caused by climate warming, urban greenspace and traffic emissions in Hong Kong (d) and London (e, f) during different periods.
Over the past 34 years, the isoprene concentrations at the Hong Kong site have shown an increasing trend with the rate of 18.1 pptv yr−1, as have the temperature and VI. In contrast, traffic emissions have been significantly reduced since 1998, due to the effective human interventions. The trend of the predicted isoprene correlated strongly with the SHAP values of VI (R=0.95) and moderately with that of temperature (R=0.63). By fixing the variables one by one, we determined the variations in factor contributions to isoprene concentrations, which were then compared between different time periods. It was found that urban greenspace emerged as the dominant factor impacting Hong Kong's isoprene levels, causing a rise in isoprene concentrations of 290 pptv between the last 17 years and the first 17 years. Meanwhile, the contribution of climate warming was 51 pptv, while the traffic contribution was minor. Moreover, without changes in urban greenspace, the coefficient of variation (CV) of annual average isoprene concentrations would decrease by 70.5 %, in comparison to the decrease of 12.0 % and 6.0 % in absence of changes in climate warming and traffic emissions, respectively. This reiterated the significant impacts of urban greenspace on the variations and trends of isoprene concentrations.
In contrast, the isoprene concentrations in London were lower in the last 17 years. Climate warming would have increased the isoprene concentrations by 31 pptv compared to those in the first 17 years at the traffic site, while the impact at the suburban site and the effects of urban greenspace at both sites were negligible. Interestingly, traffic emissions accounted for 87 and 755 pptv of isoprene reduction at the suburban site and the traffic site, respectively. This was likely attributed to stringent traffic emission controls, as indicated by the significant downward trend of BCtraffic. The effect was more pronounced during the first two thirds of the study period (1990–2011). Specifically, the traffic-related isoprene reduction was 85 pptv from the first (1990–2000) to the second decade (2001–2011) at the suburban site, in comparison to the 29 pptv between the second and the last decade (2012–2023). Actually, the observed isoprene concentration correlated moderately (R=0.60) with BCtraffic from 1990 to 2011 based on their annual averages. This suggests that traffic emission controls also affected isoprene concentrations even in non-urban areas. Despite the higher VI in London, the increasing rate (1.2 yr−1 at the suburban site and 0.7 yr−1 at the traffic site) was lower than that in Hong Kong (1.6 yr−1). Additionally, the weak effects of urban greenspace might be also due to the relatively low emission strengths of high-latitude vegetation (Guenther et al., 2006). Moreover, the impact of climate warming became evident in the last decade (2012–2023) at the suburban site in London and, together with urban greenspace, reversed the isoprene reduction that would otherwise have been achieved by traffic emission controls. This aligned with the accelerated temperature rise from 2011 onwards (Fig. S6), which was also reported elsewhere (Cao et al., 2021). From the perspective of variations in annual isoprene concentrations, the CV at the traffic site primarily resulted from changes in traffic emissions. At the suburban site, it would decrease by 32.4 % and 14.0 % if temperature and traffic emissions did not change.
Overall, our results demonstrate a tale of two cities: similarities and differences in drivers of long-term isoprene trends. Temperature-driven increases in isoprene concentrations were revealed in both cities, especially in the last decade, underscoring the universal impacts of climate warming on vegetation emissions. However, the disparities in green space changes and probably different biogenic isoprene emission strengths between the two cities led to the different effects of VI on isoprene variations. Additionally, the isoprene variations over the 34 years have been more influenced by traffic emissions in London, although both cities have implemented stringent vehicle emission controls. While the reasons remain to be explored, we did not identify any correlation between the observed isoprene and BCtraffic (or benzene) in Hong Kong, even at a traffic site (Fig. S5).
3.4 Future Projections for Isoprene and O3 in Hong Kong
A significant issue associated with increasing isoprene levels in a warming climate is the potential for elevated ground-level O3 pollution (Xi et al., 2025b; Wang et al., 2024c). We used the temperature from the latest CMIP6 multi-model ensemble forecasts to predict isoprene concentrations from 2030 to 2100 in Hong Kong under four IPCC's shared socio-economic pathway (SSP) scenarios, while the other factors were kept constant. As shown in Fig. 5a, the temperature is expected to increase by 0.71–3.60 °C from 2030 to 2100. The model indicated that the daytime average concentration of isoprene would increase by 87–530 pptv (15 %–87 %) by 2100 (Fig. 5b). The changes are on the same magnitude as the previous estimates that isoprene emissions will increase by 21 %–57 % by the end of this century relative to the 1990–2010 levels (Cao et al., 2021; Sanderson et al., 2003).

Figure 5Projected temperature, isoprene and O3-isoprene-temperature relationships under different climate scenarios. (a–b) Projections of the summertime daytime air temperature (a) and isoprene concentrations (b) during 2030–2100 in Hong Kong. The shaded areas represent the 25th to 75th percentile of the estimated isoprene concentration and temperature for each SSP. (c–f) Responses of simulated O3 concentrations to temperature and isoprene under abundant-NOx (c) and reduced-NOx (d–f) conditions. The squares represent the projected O3 concentrations at specific temperatures and isoprene levels, with error bars indicating the standard deviation of isoprene concentrations and temperatures.
Further, we simulated the O3-isoprene-temperature relationships in Hong Kong (as an example) using future temperatures and isoprene concentrations while fixing the other air pollutants and meteorological conditions at present levels. The simulated O3 increased markedly with the rise in temperature and isoprene concentrations (Fig. 5c–f). The O3 concentration would increase by up to 1.7 folds by 2100 under the SSP585 scenario of temperatures and isoprene. An increase in the combined risk of heat and O3 exposure could be expected. To explore the approach of alleviating the adverse impact of O3-isoprene-temperature synergy, we proposed additional scenarios by cutting anthropogenic NOx emissions. With the NOx reduction from the current to different SSPs levels, the O3 concentrations would increase and decrease under low and high isoprene-temperature conditions, respectively (Fig. 5d–f). This inconsistent variation is due to the evolution of O3 formation regime with the rising temperatures and isoprene. It is worth noting that more ambitious NOx reduction would result in greater O3 benefits. For example, O3 would decrease in a much wider range of temperature and isoprene when NOx is reduced under SSP126. The O3 growth by 2100 would be only 1.2 folds in the SSP585 scenario of temperatures and isoprene. Therefore, substantial reduction in anthropogenic NOx would effectively address the synergy between temperature, isoprene and O3.
As one of the most reactive and abundant VOC, isoprene plays a significant role in shaping urban air quality. We developed an explainable deep transfer learning framework to predict isoprene concentrations and elucidate the underlying drivers of their variability. Our model outperformed conventional approaches, effectively capturing the spatial heterogeneity of isoprene concentrations through localized fine-tuning. Leveraging this framework, we quantified the relative importance of factors influencing isoprene concentrations across numerous sites in China and internationally. The contrasting cases of Hong Kong and London highlight how isoprene dynamics were shaped by distinct local drivers, underscoring the need to tailor air quality management strategies to specific urban contexts. Despite the anticipated increase in biogenic emissions in a warming climate, our findings caution against reducing urban greenspace solely based on isoprene-related concerns. Instead, mitigating global warming emerges as a crucial strategy for managing isoprene's air quality impacts, as evidenced by the strong isoprene–temperature relationships observed. For O3 abatement, coordinated control of NOx emissions appears effective in reducing the contribution of isoprene to O3 formation. Moreover, the differing responses of isoprene to VI between Hong Kong and London suggest that informed tree species selection can serve as an alternative urban planning measure. Traffic emissions may also remain a significant source of urban isoprene in cities lacking stringent vehicle emission controls and should be addressed accordingly. Overall, this study provides novel insights into isoprene emissions and chemistry, air quality impacts, and practical mitigation strategies. Nonetheless, limitations persist, particularly regarding the comprehensive representation of emissions and chemical loss processes, which are discussed in Sect. S2.
Meteorology data for 1990–2023 at each site were obtained from the hourly ERA5 reanalysis dataset (Hersbach et al., 2023, https://doi.org/10.24381/cds.e2161bac). The CMIP6 model outputs can be accessed at https://pcmdi.llnl.gov/CMIP6/ (last access: 8 December 2025). The NDVI data from 1990–2022 are available at https://doi.org/10.3334/ORNLDAAC/2187 (Pinzon et al., 2023). The GLASS LAI V5 and V6 products are downloaded from https://www.glass.hku.hk/download.html (last access: 8 December 2025) and https://www.geodata.cn/main/ (last access: 8 December 2025), respectively.
The supplement related to this article is available online at https://doi.org/10.5194/acp-26-635-2026-supplement.
X.L. and N.W. conceived the study. S.L. developed the methodology. Data collection was performed by S.L., N.W., X.L., Z.S., X.H., T.L., H.W., M.L., J.G., N.C., G.S., Y.Z., C.P., Z.L., C.T., and X.L. Data analysis was conducted by S.L., X.L., and N.W. N.W. and X.L. led the investigation and supervision. Visualization was completed by S.L. and N.W. The original draft was written by S.L., N.W., and X.L. All authors, including F.Y., Z.S., X.H., and A.G., contributed to reviewing and editing the manuscript.
The contact author has declared that none of the authors has any competing interests.
Publisher's note: Copernicus Publications remains neutral with regard to jurisdictional claims made in the text, published maps, institutional affiliations, or any other geographical representation in this paper. The authors bear the ultimate responsibility for providing appropriate place names. Views expressed in the text are those of the authors and do not necessarily reflect the views of the publisher.
This work was supported by National Key Research and Development Program (grant no. 2023YFC3709304), Hong Kong Research Grants Council via the General Research Fund (grant nos. HKBU 15219621 and HKBU 15209223), National Natural Science Foundation of China (grant nos. 42575120 and 42577112), Public Policy Research Funding Scheme (grant no. 2023.A2.059.23C), the Youth Fund Project of the Sichuan Provincial Natural Science Foun dation (grant no. 24NSFSC2988), and the Fundamental Research Funds for the Central Universities (grant no. YJ202313).
This work was supported by National Key Research and Development Program (grant no. 2023YFC3709304), Hong Kong Research Grants Council via the General Research Fund (grant nos. HKBU 15219621 and HKBU 15209223), National Natural Science Foundation of China (grant nos. 42575120 and 42577112), Public Policy Research Funding Scheme (grant no. 2023.A2.059.23C), the Youth Fund Project of the Sichuan Provincial Natural Science Foundation (grant no. 24NSFSC2988), and the Fundamental Research Funds for the Central Universities (grant no. YJ202313).
This paper was edited by Quanfu He and reviewed by two anonymous referees.
Arneth, A., Schurgers, G., Lathiere, J., Duhl, T., Beerling, D. J., Hewitt, C. N., Martin, M., and Guenther, A.: Global terrestrial isoprene emission models: sensitivity to variability in climate and vegetation, Atmos. Chem. Phys., 11, 8037–8052, https://doi.org/10.5194/acp-11-8037-2011, 2011.
Borbon, A., Fontaine, H., Veillerot, M., Locoge, N., Galloo, J. C., and Guillermo, R.: An investigation into the traffic-related fraction of isoprene at an urban location, Atmos. Environ., 35, 3749–3760, https://doi.org/10.1016/S1352-2310(01)00170-4, 2001.
Cao, Y., Yue, X., Liao, H., Yang, Y., Zhu, J., Chen, L., Tian, C., Lei, Y., Zhou, H., and Ma, Y.: Ensemble projection of global isoprene emissions by the end of 21st century using CMIP6 models, Atmos. Environ., 267, 118766, https://doi.org/10.1016/j.atmosenv.2021.118766, 2021.
Feng, L. Y., Ma, D. Y., Xie, M., and Xi, M. Z.: Review on the Application of Remote Sensing Data and Machine Learning to the Estimation of Anthropogenic Heat Emissions, Remote Sens., 17, https://doi.org/10.3390/rs17020200, 2025.
Fu, D., Millet, D. B., Wells, K. C., Payne, V. H., Yu, S., Guenther, A., and Eldering, A.: Direct retrieval of isoprene from satellite-based infrared measurements, Nat. Commun., 10, 3811, https://doi.org/10.1038/s41467-019-11835-0, 2019.
Guenther, A., Zimmerman, P., and Wildermuth, M.: Natural volatile organic compound emission rate estimates for U.S. woodland landscapes, Atmos. Environ., 28, 1197–1210, https://doi.org/10.1016/1352-2310(94)90297-6, 1994.
Guenther, A., Karl, T., Harley, P., Wiedinmyer, C., Palmer, P. I., and Geron, C.: Estimates of global terrestrial isoprene emissions using MEGAN (Model of Emissions of Gases and Aerosols from Nature), Atmos. Chem. Phys., 6, 3181–3210, https://doi.org/10.5194/acp-6-3181-2006, 2006.
Guenther, A. B., Zimmerman, P. R., Harley, P. C., Monson, R. K., and Fall, R.: Isoprene and monoterpene emission rate variability: Model evaluations and sensitivity analyses, J. Geophys. Res.-Atmos., 98, 12609–12617, https://doi.org/10.1029/93JD00527, 1993.
Guenther, A. B., Jiang, X., Heald, C. L., Sakulyanontvittaya, T., Duhl, T., Emmons, L. K., and Wang, X.: The Model of Emissions of Gases and Aerosols from Nature version 2.1 (MEGAN2.1): an extended and updated framework for modeling biogenic emissions, Geosci. Model Dev., 5, 1471–1492, https://doi.org/10.5194/gmd-5-1471-2012, 2012.
Hersbach, H., Bell, B., Berrisford, P., Biavati, G., Horányi, A., Muñoz Sabater, J., Nicolas, J., Peubey, C., Radu, R., Rozum, I., and Schepers, D.: ERA5-Land hourly data from 1950 to present, European Centre for Medium-Range Weather Forecasts (ECMWF) [data set], https://doi.org/10.24381/cds.e2161bac, 2023.
Huang, G., Brook, R., Crippa, M., Janssens-Maenhout, G., Schieberle, C., Dore, C., Guizzardi, D., Muntean, M., Schaaf, E., and Friedrich, R.: Speciation of anthropogenic emissions of non-methane volatile organic compounds: a global gridded data set for 1970–2012, Atmos. Chem. Phys., 17, 7683–7701, https://doi.org/10.5194/acp-17-7683-2017, 2017.
Li, M., Huang, X., Yan, D., Lai, S., Zhang, Z., Zhu, L., Lu, Y., Jiang, X., Wang, N., Wang, T., Song, Y., and Ding, A.: Coping with the concurrent heatwaves and ozone extremes in China under a warming climate, Sci. Bull., https://doi.org/10.1016/j.scib.2024.05.034, 2024.
Lin, Y.-H., Zhang, H., Pye, H. O. T., Zhang, Z., Marth, W. J., Park, S., Arashiro, M., Cui, T., Budisulistiorini, S. H., Sexton, K. G., Vizuete, W., Xie, Y., Luecken, D. J., Piletic, I. R., Edney, E. O., Bartolotti, L. J., Gold, A., and Surratt, J. D.: Epoxide as a precursor to secondary organic aerosol formation from isoprene photooxidation in the presence of nitrogen oxides, Proc. Natl. Acad. Sci. U. S. A., 110, 6718–6723, https://doi.org/10.1073/pnas.1221150110, 2013.
Lou, S., Shrivastava, M., Ding, A., Easter, R. C., Fast, J. D., Rasch, P. J., Shen, H., Massey Simonich, S. L., Smith, S. J., Tao, S., and Zelenyuk, A.: Shift in Peaks of PAH-Associated Health Risks From East Asia to South Asia and Africa in the Future, Earth Future, 11, e2022EF003185, https://doi.org/10.1029/2022EF003185, 2023.
Lundberg, S. M., Erion, G., Chen, H., DeGrave, A., Prutkin, J. M., Nair, B., Katz, R., Himmelfarb, J., Bansal, N., and Lee, S.-I.: From local explanations to global understanding with explainable AI for trees, Nat. Mach. Intell., 2, 56–67, https://doi.org/10.1038/s42256-019-0138-9, 2020.
Lyu, X., Li, H., Lee, S.-C., Xiong, E., Guo, H., Wang, T., and de Gouw, J.: Significant Biogenic Source of Oxygenated Volatile Organic Compounds and the Impacts on Photochemistry at a Regional Background Site in South China, Environ. Sci. Technol., 58, 20081–20090, https://doi.org/10.1021/acs.est.4c05656, 2024.
Ma, M., Gao, Y., Wang, Y., Zhang, S., Leung, L. R., Liu, C., Wang, S., Zhao, B., Chang, X., Su, H., Zhang, T., Sheng, L., Yao, X., and Gao, H.: Substantial ozone enhancement over the North China Plain from increased biogenic emissions due to heat waves and land cover in summer 2017, Atmos. Chem. Phys., 19, 12195–12207, https://doi.org/10.5194/acp-19-12195-2019, 2019.
Ma, M., Gao, Y., Ding, A., Su, H., Liao, H., Wang, S., Wang, X., Zhao, B., Zhang, S., Fu, P., Guenther, A. B., Wang, M., Li, S., Chu, B., Yao, X., and Gao, H.: Development and Assessment of a High-Resolution Biogenic Emission Inventory from Urban Green Spaces in China, Environ. Sci. Technol., 56, 175–184, https://doi.org/10.1021/acs.est.1c06170, 2022.
Morichetti, M., Madronich, S., Passerini, G., Rizza, U., Mancinelli, E., Virgili, S., and Barth, M.: Comparison and evaluation of updates to WRF-Chem (v3.9) biogenic emissions using MEGAN, Geosci. Model Dev., 15, 6311–6339, https://doi.org/10.5194/gmd-15-6311-2022, 2022.
Paulot, F., Henze, D. K., and Wennberg, P. O.: Impact of the isoprene photochemical cascade on tropical ozone, Atmos. Chem. Phys., 12, 1307–1325, https://doi.org/10.5194/acp-12-1307-2012, 2012.
Peron, A., Graus, M., Striednig, M., Lamprecht, C., Wohlfahrt, G., and Karl, T.: Deciphering anthropogenic and biogenic contributions to selected non-methane volatile organic compound emissions in an urban area, Atmos. Chem. Phys., 24, 7063–7083, https://doi.org/10.5194/acp-24-7063-2024, 2024.
Pfannerstill, E. Y., Arata, C., Zhu, Q., Schulze, B. C., Ward, R., Woods, R., Harkins, C., Schwantes, R. H., Seinfeld, J. H., Bucholtz, A., Cohen, R. C., and Goldstein, A. H.: Temperature-dependent emissions dominate aerosol and ozone formation in Los Angeles, Science, 384, 1324–1329, https://doi.org/10.1126/science.adg8204, 2024.
Pinzon, J. E., Pak, E. W., Tucker, C. J., Bhatt, U. S., Frost, G. V., and Macander, M. J.: Global Vegetation Greenness (NDVI) from AVHRR GIMMS-3G+, 198-1-2022 (Version 1), ORNL Distributed Active Archive Center [data set], https://doi.org/10.3334/ORNLDAAC/2187, 2023.
Rogelj, J., Popp, A., Calvin, K. V., Luderer, G., Emmerling, J., Gernaat, D., Fujimori, S., Strefler, J., Hasegawa, T., Marangoni, G., Krey, V., Kriegler, E., Riahi, K., van Vuuren, D. P., Doelman, J., Drouet, L., Edmonds, J., Fricko, O., Harmsen, M., Havlík, P., Humpenöder, F., Stehfest, E., and Tavoni, M.: Scenarios towards limiting global mean temperature increase below 1.5 °C, Nat. Clim. Change, 8, 325–332, https://doi.org/10.1038/s41558-018-0091-3, 2018.
Sanderson, M. G., Jones, C. D., Collins, W. J., Johnson, C. E., and Derwent, R. G.: Effect of Climate Change on Isoprene Emissions and Surface Ozone Levels, Geophys. Res. Lett., 30, https://doi.org/10.1029/2003GL017642, 2003.
Seco, R., Holst, T., Davie-Martin, C. L., Simin, T., Guenther, A., Pirk, N., Rinne, J., and Rinnan, R.: Strong isoprene emission response to temperature in tundra vegetation, Proc. Natl. Acad. Sci. U. S. A., 119, e2118014119, https://doi.org/10.1073/pnas.2118014119, 2022.
Tripathi, N., Sahu, L. K., Wang, L., Vats, P., Soni, M., Kumar, P., Satish, R. V., Bhattu, D., Sahu, R., Patel, K., Rai, P., Kumar, V., Rastogi, N., Ojha, N., Tiwari, S., Ganguly, D., Slowik, J., Prévôt, A. S. H., and Tripathi, S. N.: Characteristics of VOC Composition at Urban and Suburban Sites of New Delhi, India in Winter, J. Geophys. Res.-Atmos., 127, e2021JD035342, https://doi.org/10.1029/2021JD035342, 2022.
von Schneidemesser, E., Monks, P. S., Gros, V., Gauduin, J., and Sanchez, O.: How important is biogenic isoprene in an urban environment? A study in London and Paris, Geophys. Res. Lett., 38, https://doi.org/10.1029/2011GL048647, 2011.
Wang, H., Nagalingam, S., Welch, A. M., Leong, C., Czimczik, C. I., and Guenther, A. B.: Heat waves may trigger unexpected surge in aerosol and ozone precursor emissions from sedges in urban landscapes, Proc. Natl. Acad. Sci. U. S. A., 121, e2412817121, https://doi.org/10.1073/pnas.2412817121, 2024a.
Wang, H., Welch, A. M., Nagalingam, S., Leong, C., Czimczik, C. I., Tang, J., Seco, R., Rinnan, R., Vettikkat, L., Schobesberger, S., Holst, T., Brijesh, S., Sheesley, R. J., Barsanti, K. C., and Guenther, A. B.: High temperature sensitivity of Arctic isoprene emissions explained by sedges, Nat. Commun., 15, 6144, https://doi.org/10.1038/s41467-024-49960-0, 2024b.
Wang, N., Wang, H., Huang, X., Chen, X., Zou, Y., Deng, T., Li, T., Lyu, X., and Yang, F.: Extreme weather exacerbates ozone pollution in the Pearl River Delta, China: role of natural processes, Atmos. Chem. Phys., 24, 1559–1570, https://doi.org/10.5194/acp-24-1559-2024, 2024c.
Xi, M., Luo, Y., Li, Y., Ma, D., Feng, L., Zhang, S., Chen, S., and Xie, M.: Comprehensive analysis of prevailing weather patterns and high-impact typhoon tracks to reveal where and how tropical cyclone affects regional ozone pollution in the Yangtze River Delta region, China, Atmos. Environ., 361, 121498, https://doi.org/10.1016/j.atmosenv.2025.121498, 2025a.
Xi, M., Xie, M., Gao, D., Ma, D., Luo, Y., Feng, L., Chen, S., and Zhang, S.: The impact of tropical cyclones on regional ozone pollution and its future trend in the Yangtze River Delta of China, Atmos. Chem. Phys., 25, 14573–14590, https://doi.org/10.5194/acp-25-14573-2025, 2025b.
Xu, L., Guo, H., Boyd, C. M., Klein, M., Bougiatioti, A., Cerully, K. M., Hite, J. R., Isaacman-VanWertz, G., Kreisberg, N. M., Knote, C., Olson, K., Koss, A., Goldstein, A. H., Hering, S. V., de Gouw, J., Baumann, K., Lee, S.-H., Nenes, A., Weber, R. J., and Ng, N. L.: Effects of anthropogenic emissions on aerosol formation from isoprene and monoterpenes in the southeastern United States, Proc. Natl. Acad. Sci., 112, 37–42, https://doi.org/10.1073/pnas.1417609112, 2015.
Xu, P., Li, G., Zheng, Y., Fung, J. C. H., Chen, A., Zeng, Z., Shen, H., Hu, M., Mao, J., Zheng, Y., Cui, X., Guo, Z., Chen, Y., Feng, L., He, S., Zhang, X., Lau, A. K. H., Tao, S., and Houlton, B. Z.: Fertilizer management for global ammonia emission reduction, Nature, 626, 792–798, https://doi.org/10.1038/s41586-024-07020-z, 2024.
Zhu, B., Ren, S., Weng, Q., and Si, F.: A physics-informed neural network that considers monotonic relationships for predicting NOx emissions from coal-fired boilers, Fuel, 364, 131026, https://doi.org/10.1016/j.fuel.2024.131026, 2024.