the Creative Commons Attribution 4.0 License.
the Creative Commons Attribution 4.0 License.
 | 11 May 2026
Variation characteristics of sporadic-E layer in East Asia based on long-term data
Hai-Sheng Zhao
Yang Liu
Zheng-Wen Xu
Jian Wu
Kun Xue
Huai-Yun Peng
Zong-Hua Ding
Sporadic E (Es) is a transient electron density enhancement structure that occurs at altitude of 90–140 km. With the increasing number of global ionosonde stations and the accumulation of long-term data, conducting research on the long-term variations of the Es layer using synchronized data from multiple stations over extended periods holds significant scientific importance. Eastern Asia is located in the peak region of the Far East Anomaly of the Es layer and possesses unique geographical advantages. In this study, we extensively investigated the characteristics of Es layer intensity, spatial distribution, diurnal variation, seasonal variation, and long-term variations in the Eastern Asian region using observation data spanning over 60 years from 21 ionosonde stations in China and Japan. It is found that the Es layer intensity in East Asia is much higher than the global average level, and the intensity center is located near the 30° N line, and weakens to low and high latitudes. At the same time, the intensity center of Es layer is not fixed, and the intensity center migrates with diurnal and seasonal variations. In East Asia, the long-term variation trend of Es layer intensity at different locations is different, but overall, it presents a long-term upward trend and has a negative feedback characteristic. The obtained research findings hold crucial scientific significance for exploring the formation mechanisms of the Es layer, analyzing the spatiotemporal distribution and long-term trends of Es layer intensity.
- Article
(10310 KB) - Full-text XML
- BibTeX
- EndNote


Sporadic E (Es) is a transient electron density enhancement structure that occurs at altitude of 90–140 km and can significantly affect the propagation of radio waves. The Es layer may occur during the day or at night, and its variations with latitude and time are pronounced. The Es layer is a special structure within the ionosphere, unlike the regular E layer that exhibits stable and regular morphological structures and trends. Instead, it is a transient and irregular strong ionization layer, with a height range of 90 to 140 km and a thickness ranging from a few hundred meters to 1 km (Danilov and Konstantinova, 2020; Pignalberi et al., 2014; Pietrella et al., 2014). Its horizontal scale varies from tens of kilometers to hundreds of kilometers, and it drifts at speeds ranging from 20 to 300 m s−1 (Maeda et al., 2016). The seasonal distribution of the Es layer in the ionosphere is uneven, with higher occurrence frequencies in summer months from May to August and lower frequencies in other months (Sivakandan et al., 2023; Jacobi and Arras, 2019; Haldoupis et al., 2007). The Es layer in the ionosphere exhibits significant diurnal variation, with higher occurrence frequencies during the day and lower frequencies during the night. The electron density in the Es layer of the ionosphere is exceptionally high, reaching up to 100 times the electron density of the regular E layer. Therefore, the Es layer in the ionosphere is capable of reflecting radio waves that would otherwise penetrate through to the F layer, resulting in the reflection and scattering of HF/VHF frequency radio waves. The maximum single-hop propagation distance can exceed 2000 km.
In the early 20th century, unexpected reflected signals received by instruments such as altimeters, television, and amplitude-modulated radios sparked great interest among researchers (Whitehead, 1970, 1989), leading to the beginning of studies on the Es layer of the ionosphere. Since the 1960s, scientists have gradually gained understanding of the Es layer and its related characteristics through observations and analysis using instruments such as ionospheric sounders (Whitehead, 1970, 1989; Reddy, 1968), incoherent scatter radars (Swartz et al., 1974; Ioannidis and Farley, 1972), sounding rockets (Yamamoto et al., 1998; Pfaff et al., 1998; Kelley et al., 1995; Smith, 1970; Seddon, 1962), coherent scatter radars, and other methods (Haldoupis and Schlegel, 1996; Haldoupis et al., 1997). They have established and continuously improved theories on the formation mechanism of the Es layer in the ionosphere, and have gradually acquired knowledge about its radio wave propagation characteristics. The wind shear theory is considered to be the primary mechanism for the formation of the mid-latitude Es layer (Axford, 1963; Didebulidze et al., 2015). Under the influence of the geomagnetic field, the horizontal wind generates vertical shear force on ions at the height of the ionospheric dynamo layer, compressing the ion constituents and forming a thin layer of high-density ionization, namely the Es layer. Tidal waves, planetary waves, and gravity waves affect the wind shear, causing metallic ions and molecular ions to move and converge, forming thin high-density plasma layers in mid-latitudes (Qiu et al., 2023; Haldoupis and Pancheva, 2006; Haldoupis et al., 2006; Axford et al., 1966; Helmboldt, 2016; Haldoupis et al., 2004, 2006; Davis and Lo, 2008; Tepley and Mathews, 1985; Macleod et al., 1975; Pignalberi et al., 2014; Pezzopane et al., 2015). Although the wind shear theory is currently the mainstream explanation for the formation of the Es layer, the theory itself is still not fully developed (Qiu et al., 2023), and there are still difficulties in explaining certain phenomena, such as the summer anomalies of the mid-latitude Es layer and the extremely uneven distribution of Es layer intensity globally.
The unpredictability and highly uneven spatial-temporal distribution of the Es layer have sparked great interest among researchers, initiating relentless studies for over half a century. In the 1950s, Smith (1957) proposed the concept of the “Far East Anomaly” based on statistical analysis of global vertical sounding records and research on VHF over-the-horizon propagation phenomena. The Far East Anomaly refers to the phenomenon where the occurrence rate and intensity of Es layers in the mid-latitude regions of the Far East are exceptionally high far exceeding those in other regions at the same latitude. Correspondingly, during the summer in the southern hemisphere, the Es layer in the South American region is also relatively strong with a higher occurrence rate, but it is not as prominent as the Far East Anomaly. With the development of satellite technology, the method of detecting the spatial distribution of the Es layer using satellite beacons has gradually matured. The distribution of the global Es layer has been obtained based on GPS radio occultation technique (Arras et al., 2009), which has greatly expanded the research methods for the Es layer and has epoch-making significance. Due to the scarcity of early ionosonde stations for the Es layer and insufficient data accumulation, early studies on the morphology of the Es layer could only provide a rough global distribution of the Es layer. The radio occultation observations also has its limitations, such as it cannot continuously observe the Es layer at fixed location compared to the ground-based observations. It can only estimate Es layer intensity through phase and amplitude variations, and its accuracy needs to be improved.
With the increasing number of global ionosonde stations and the accumulation of data over time, conducting long-term studies on the Es layer's characteristics using global ionosonde data is of significant scientific importance. Eastern Asia is located in the peak region of the Far East Anomaly, making it uniquely advantageous for research. In this study, utilizing over 60 years of Es layer observation data from 21 ionosonde stations in China and Japan (Zhao, 2024), we conducted in-depth research on the intensity characteristics, spatial distribution, diurnal variation, seasonal variation, and long-term variations of the Es layer in the Eastern Asian. The data analysis software on which this article is based are available in Zhao (2024). The research findings of this study are of great significance for exploring the formation mechanisms of the Es layer, analyzing the spatial-temporal distribution and long-term trends of Es layer intensity.
Ground-based radio vertical sounding of the ionosphere is one of the fundamental methods for ionospheric exploration and was the only effective means of investigation before the advent of rockets and artificial satellites. After years of development, the network of ionosonde stations in China has gradually covered a vast area of our country, spanning 30° in geomagnetic latitude and longitude. The longitude intervals are between 3 to 10°, while the latitude intervals range from 3 to 6°.
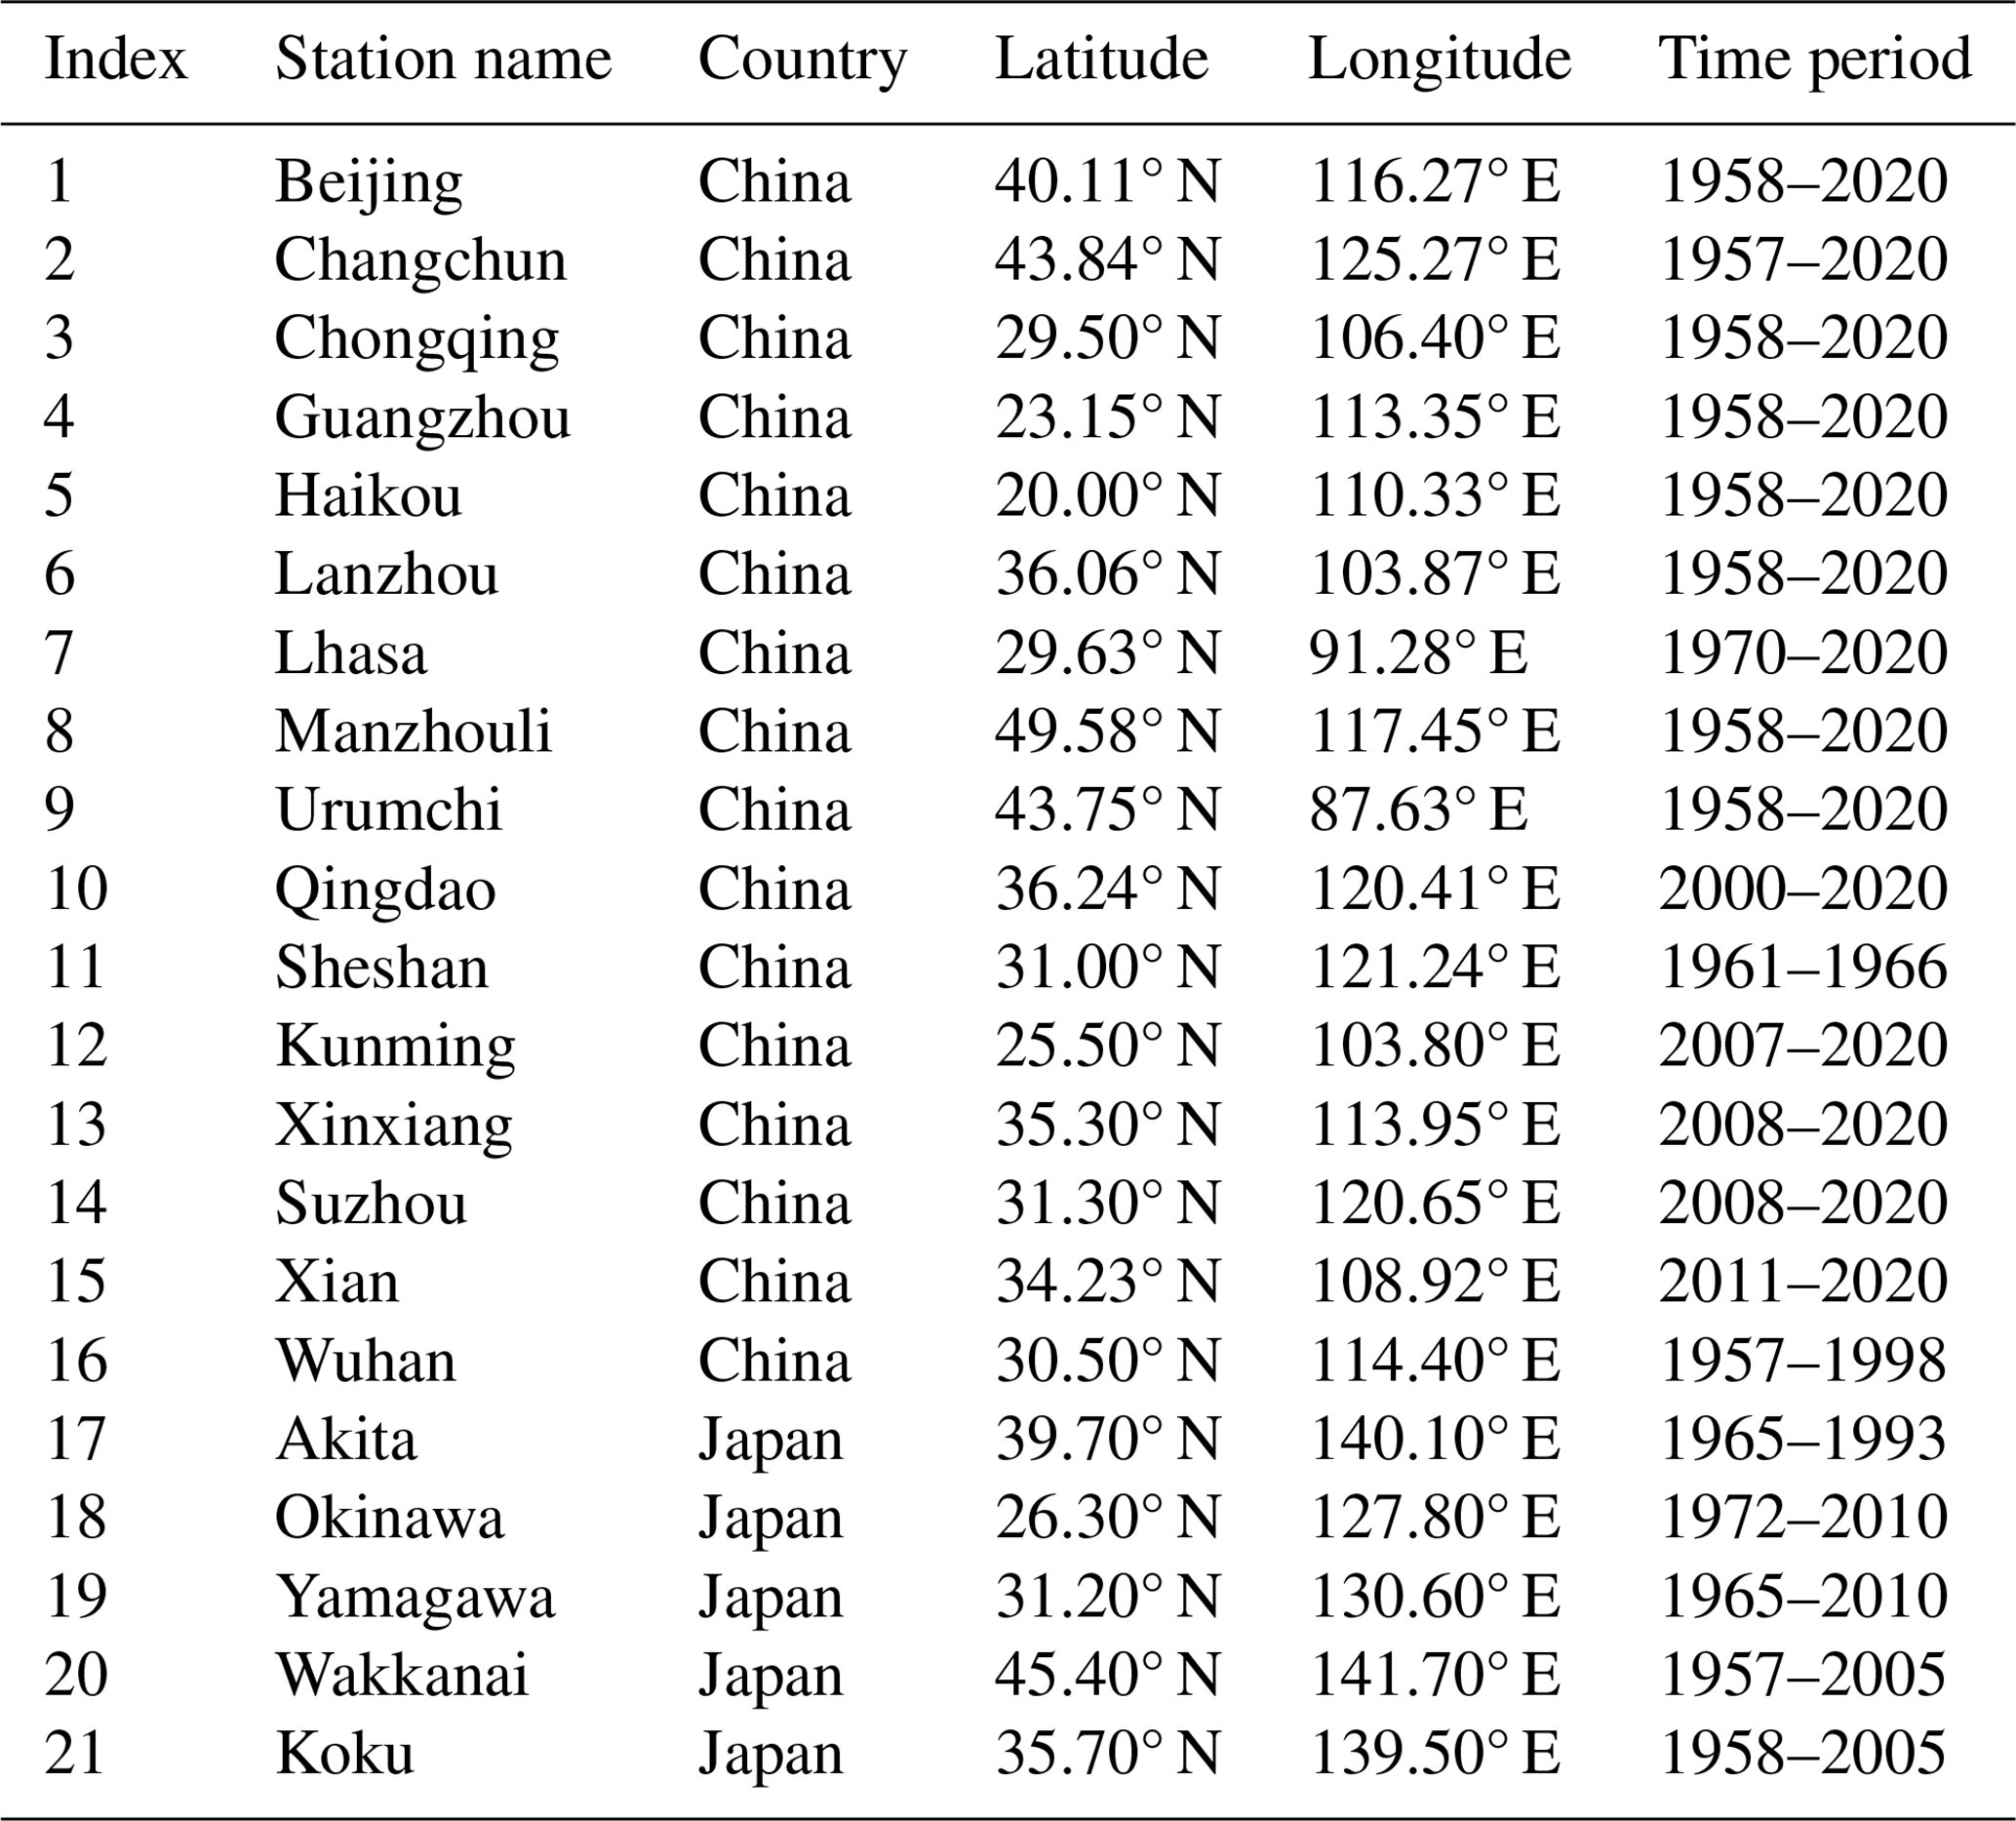
The Es data primarily comes from ionosonde stations in China, including Beijing, Changchun, Chongqing, Guangzhou, Hainan, Lhasa, Manzhouli, Urumqi, Wuhan, Xinxiang, Kunming, Qingdao, Suzhou, Sheshan, Xi'an, as well as surrounding areas in China. Additionally, data from the OKINAWA (Okinawa Island, Japan), YAMAGAWA (Yamagawa Prefecture, Japan), Koku, Akita, and Wakkanai ionosonde stations are also included, as shown in Fig. 1. The names, nationalities, coordinates, and data periods of each stations are list in Table 1.
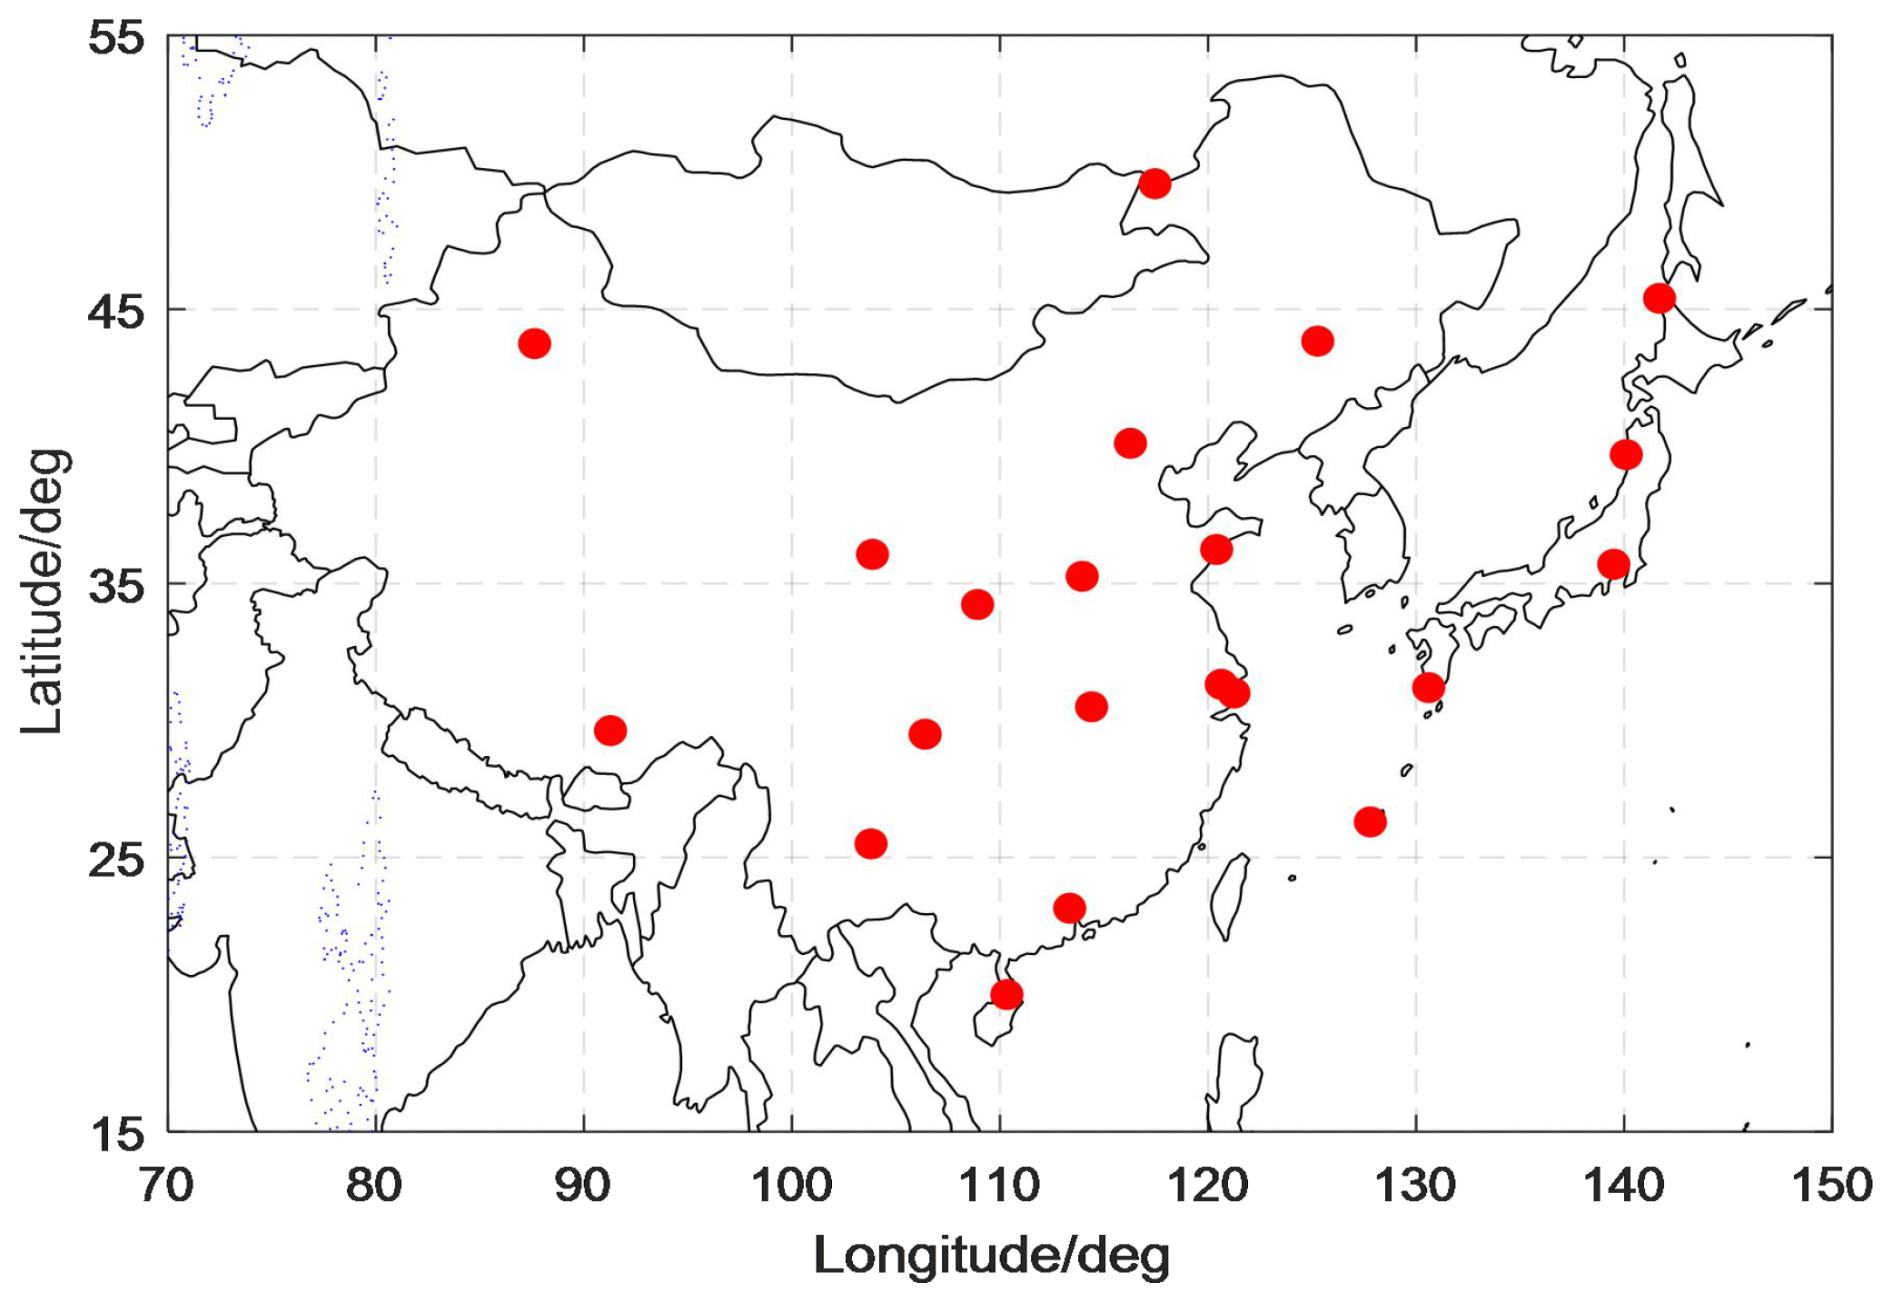
Figure 1Ionosonde stations in China and Japan.
It should be noted that all Chinese stations employ domestically produced CPA-4 ionosondes, while Japanese stations utilize American-made Digisonde digital ionosondes. The temporal resolution of the data used in this study is 1 h, with both Chinese and Japanese stations maintaining the same resolution. The data employed in this study were acquired through manual scaling accompanied by a rigorous quality control process. Concurrently, periodic calibration and verification of the observing instruments were performed during operation, ensuring the reliability and accuracy of the data. The method for selecting valid Es is as follows: the virtual height of the echo must fall within the range of 90–140 km, and the trace should exhibit a horizontally thin-layer structure (traces showing parabolic shapes are generally identified as regular E-layer echoes and thus excluded). During data processing, missing data are labeled as “NaN” and automatically excluded from statistical analyses.
The original data have a sampling interval of 1 h, yielding 24 foEs values per day. The total amount of raw data for one year is approximately 24 × 30 (days per month) × 12 (months). After processing, only the monthly median values are retained; thus, the total amount of processed data for one year is reduced to 24 × 12. This study adopts the monthly median as a statistical metric to analyze the long-term trend of the Es layer. This approach effectively mitigates the interference of random errors and enhances the robustness of the results. The measurement error of the critical frequency for a typical ionosonde is approximately 0.02 MHz. Based on the statistical properties of multiple independent measurements, the monthly median adopted in this study – derived from 24 daily observations over approximately 30 d (totaling ∼ 720 independent measurements) – reduces the random error to about 0.00074 MHz. Furthermore, considering the long-term observations spanning over 40 years at most stations, the random error is further compressed to approximately 0.0000336 MHz. In contrast, the long-term trend average absolute slope of the Es layer in East Asia obtained in this study is 0.00059, which is about 17.56 times the magnitude of the random error. Therefore, the derived long-term variation trend significantly exceeds the fluctuation range of random errors, rendering its uncertainty negligible.
The monthly median of the Es layer critical frequency (foEs) is an important parameter for assessing the Es layer intensity in a specific region. The foEs monthly median reflects the average level of the Es layer intensity in that region and possesses a high level of reliability. Figure 2 presents the variations of the monthly median foEs with local time and month for 20 stations in East Asia.
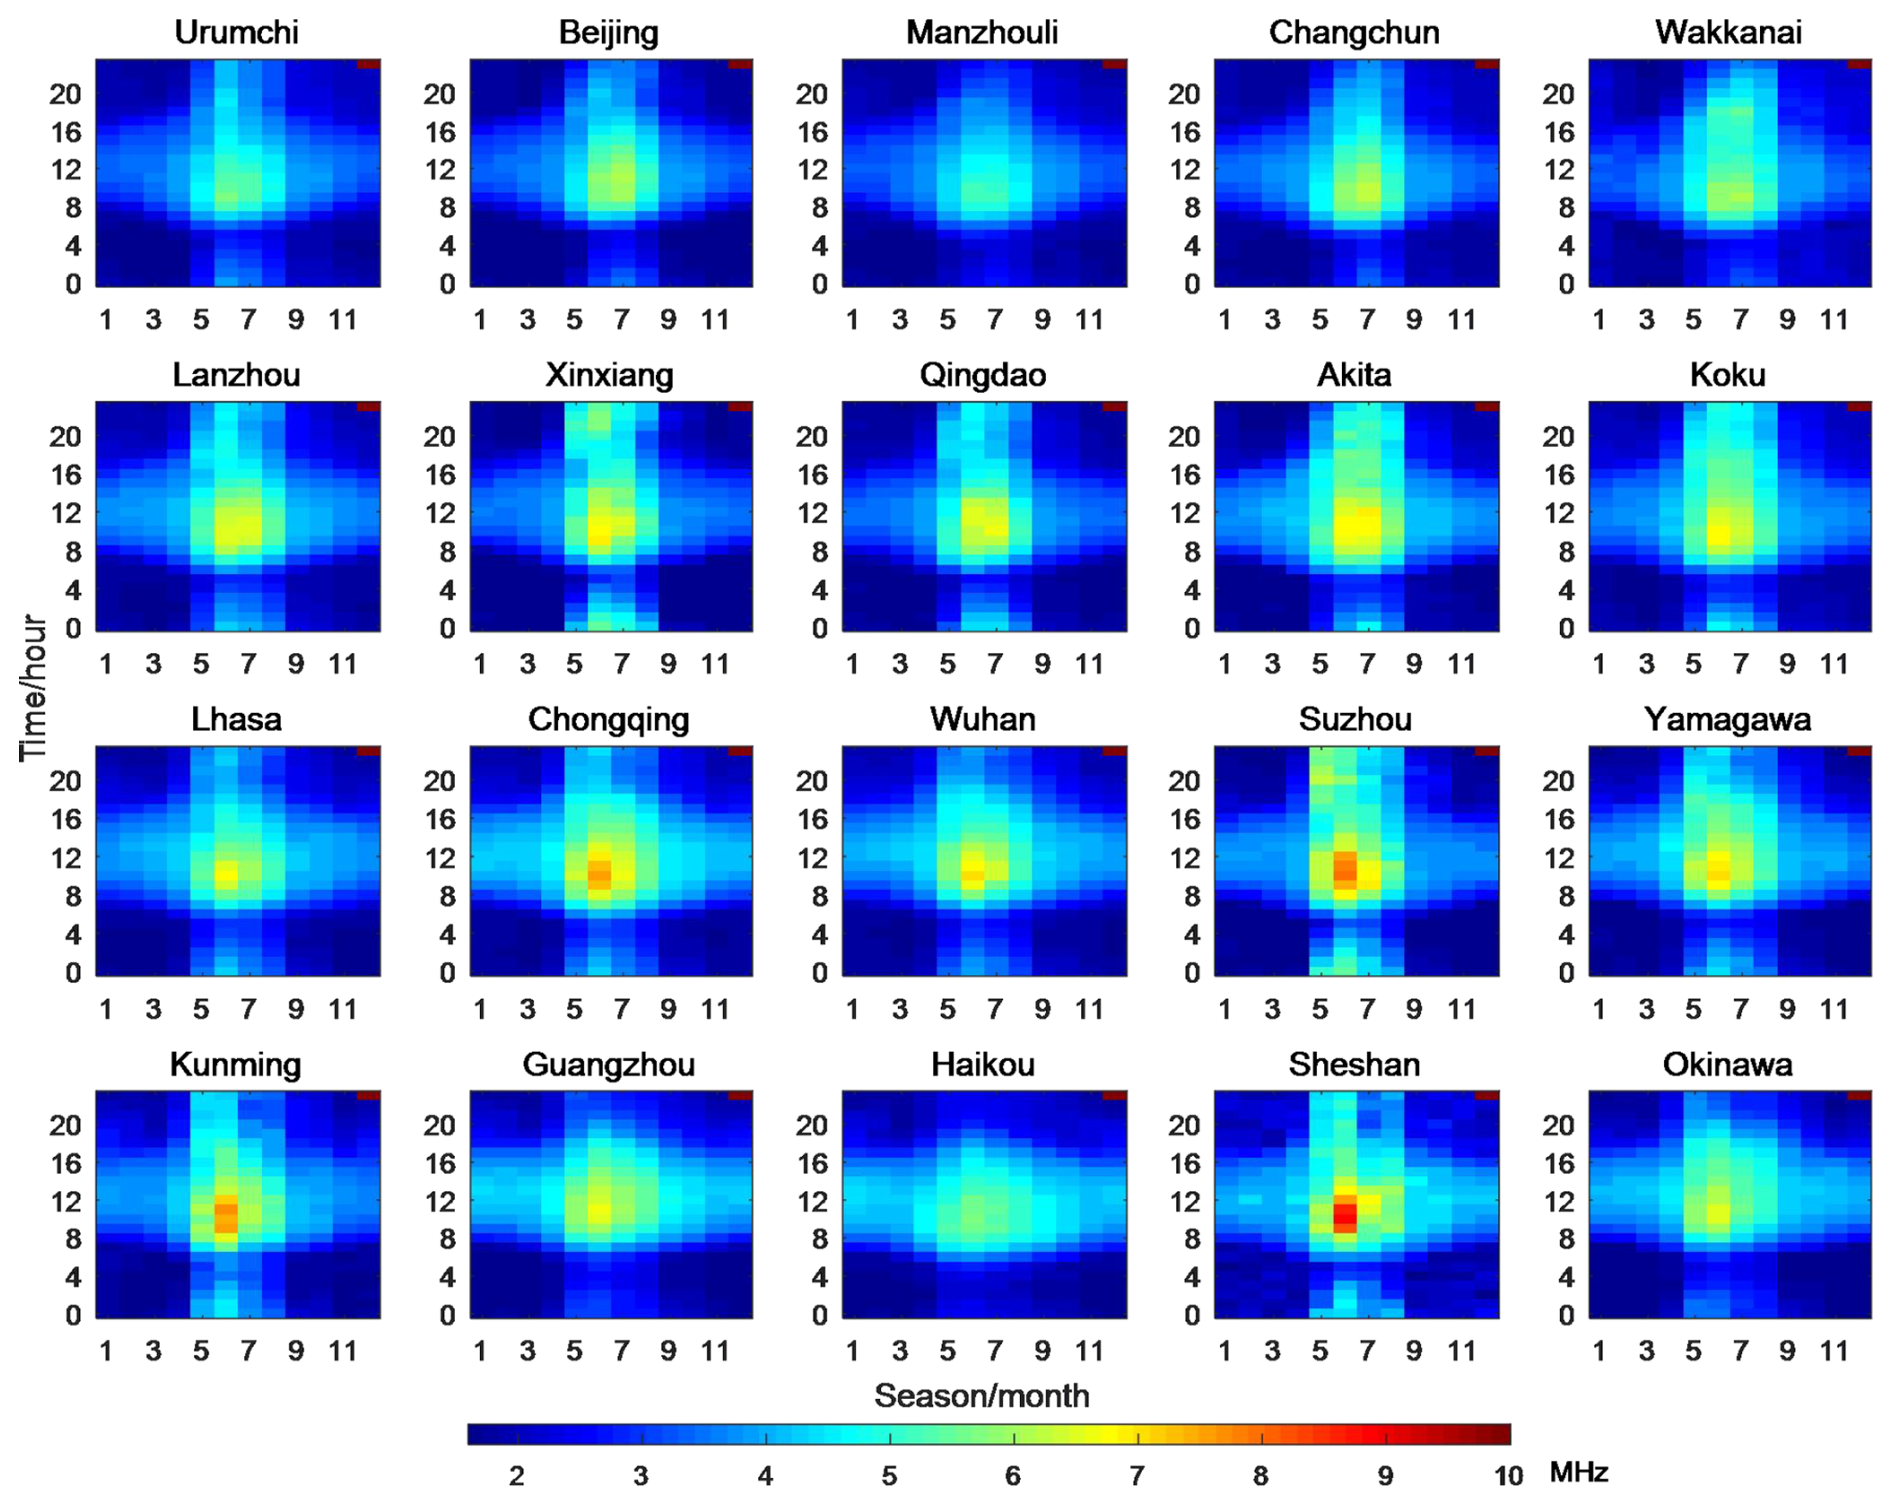
According to Fig. 2, the foEs layer intensity during the summer months (May to August) is significantly higher than in other seasons. The foEs layer intensity is also notably higher around local noon compared to other times of the day. Additionally, the Es layer intensity in East Asia exhibits a strong spatial non-uniformity. Generally, the distribution of Es layer intensity centers around the latitude of 30° N, decreasing towards lower and higher latitudes. The overall intensity is higher at lower latitudes compared to higher latitudes, and the intensity is slightly stronger in the eastern region compared to the western region. The maximum monthly medians of foEs for all stations are above 5 MHz, with some stations reaching even higher values exceeding 9 MHz, which is significantly higher than the global average level (Smith, 1970).
The spatial distribution of foEs is crucial for investigating the characteristics of the Es layer in a specific region. In this section, the distribution of the annual mean value of foEs in East Asia is given by the Kriging interpolation method (Gunst and Kitanidis, 1998; Matheron, 1963; Oliver and Webster, 1990) based on the annual mean value of foEs at each station (as shown in Fig. 3).
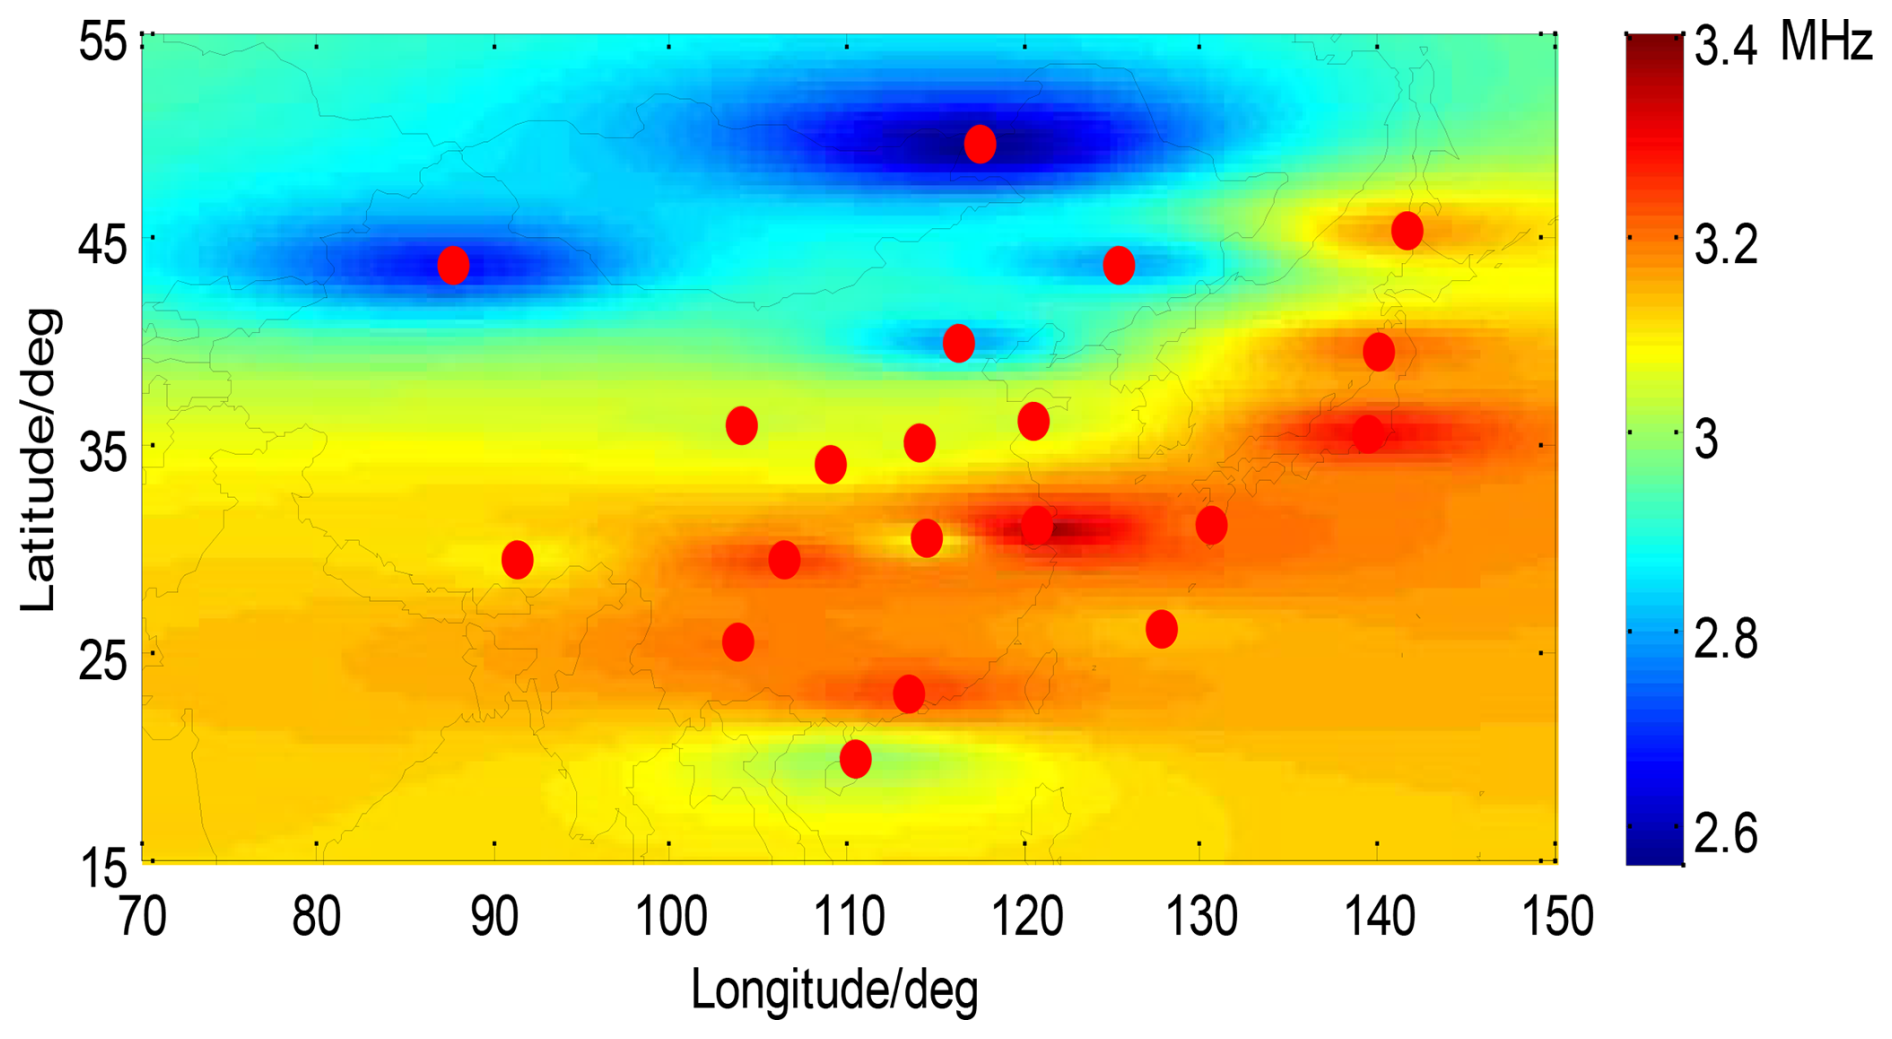
Figure 3The distribution of foEs average values in East Asia.
From Fig. 3, it is shown that the Es layer intensity in East Asia exhibits a zonal distribution along the latitude. The peak intensity of foEs occurs near 30° N. Over the years, there has been ongoing debate regarding the center of global Es layer intensity. Some researchers argue that the center of global Es layer intensity is near Wakkanai, Japan (Smith, 1970). However, Fig. 3 clearly shows that while the average Es layer intensity in the sea area near Wakkanai, Japan is relatively high, it is not the area with the highest intensity of Es layer. The actual center of Es layer intensity should be located near Suzhou, China. Rather than considering the Es layer intensity center as a single point, it is more appropriate to view it as a zonal region, with the center of this region lying along the 30° N line.
5.1 Diurnal variation characteristics
In order to further investigate the diurnal variation patterns of Es layer intensity in East Asia, the study presents the average variations of monthly median foEs values with time. Due to the large number of stations, five representative stations near 30° N, namely Lhasa, Chongqing, Wuhan, Suzhou, and Yamagawa, as well as six representative stations near 120° E, namely Manzhouli, Changchun, Qingdao, Suzhou, Guangzhou, and Haikou, were selected. The diurnal variation curves for each of these stations are provided in Fig. 4.
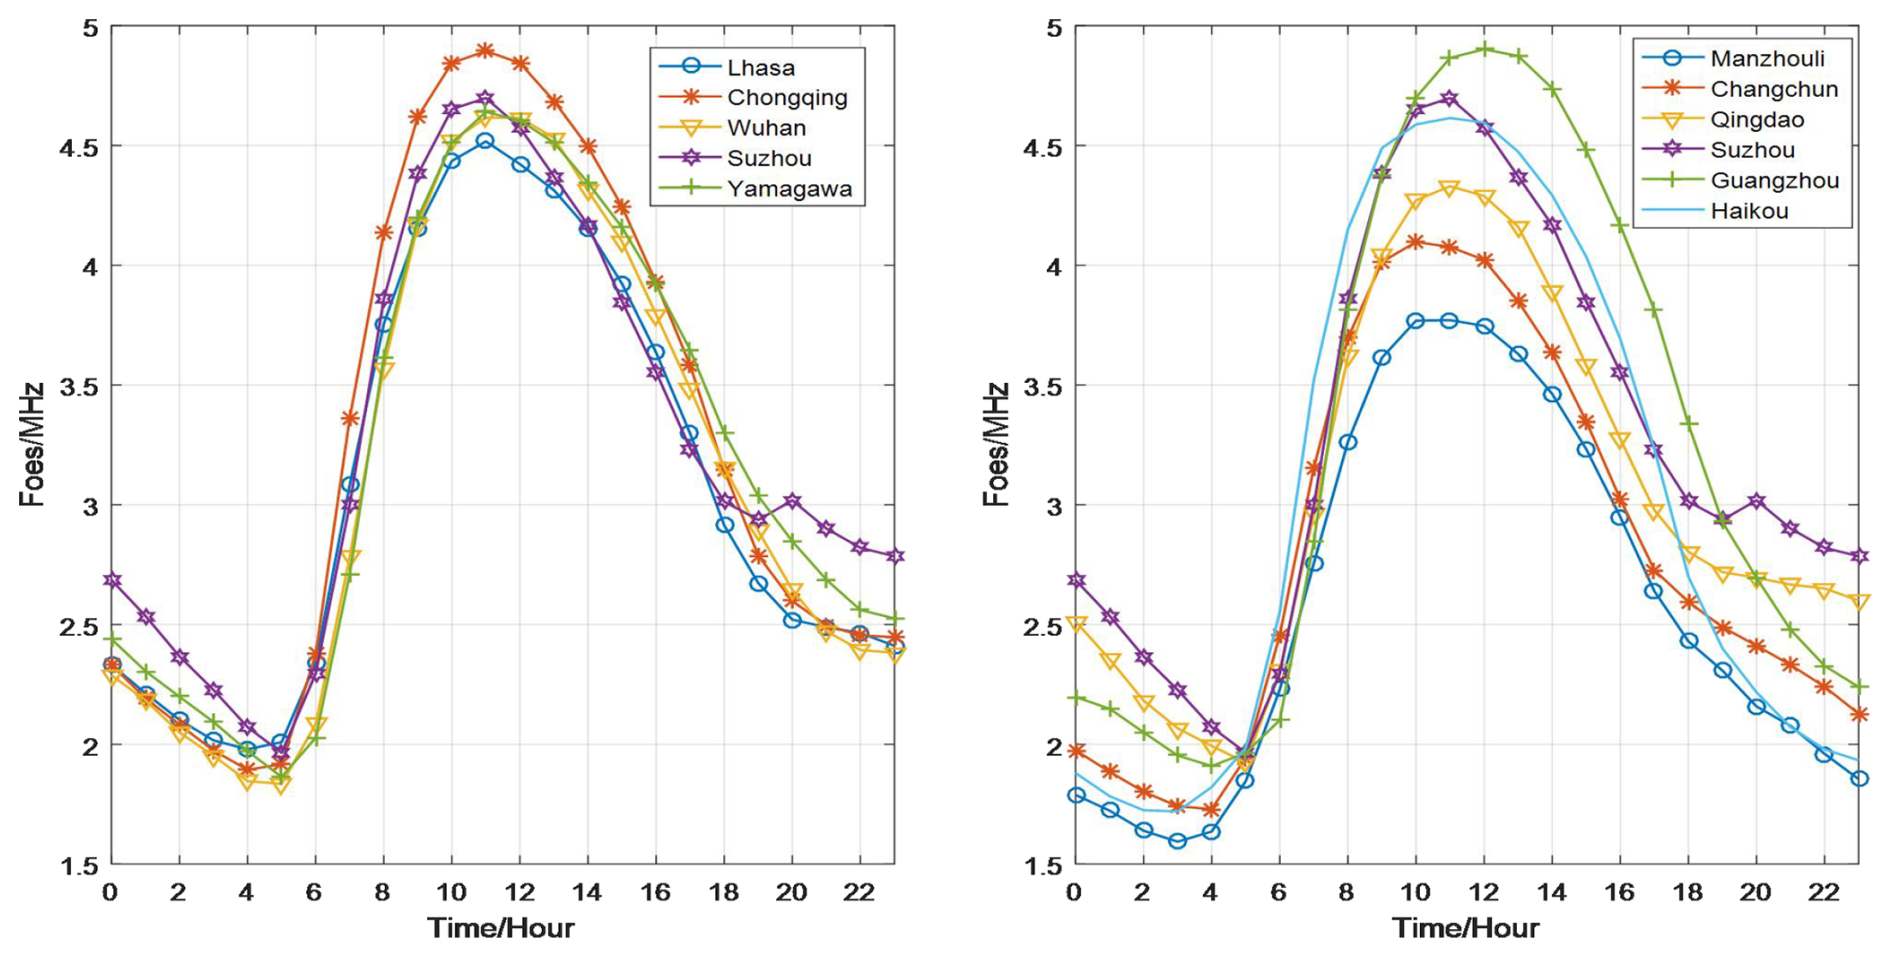
From Fig. 4, it is shown that the maximum values of foEs in East Asia generally occur around 10:00 am LT, while the minimum values typically occur around 05:00 am LT. At daytime, foEs values are significantly higher than during the nighttime.
To further investigate the diurnal variation characteristics of Es layer intensity in East Asia, Fig. 5 presents the spatial distribution characteristics of foEs monthly median values during daytime and nighttime. (Daytime is defined as 08:00 am to 05:00 pm LT, and nighttime is defined as 09:00 pm to 06:00 am LT the following day).
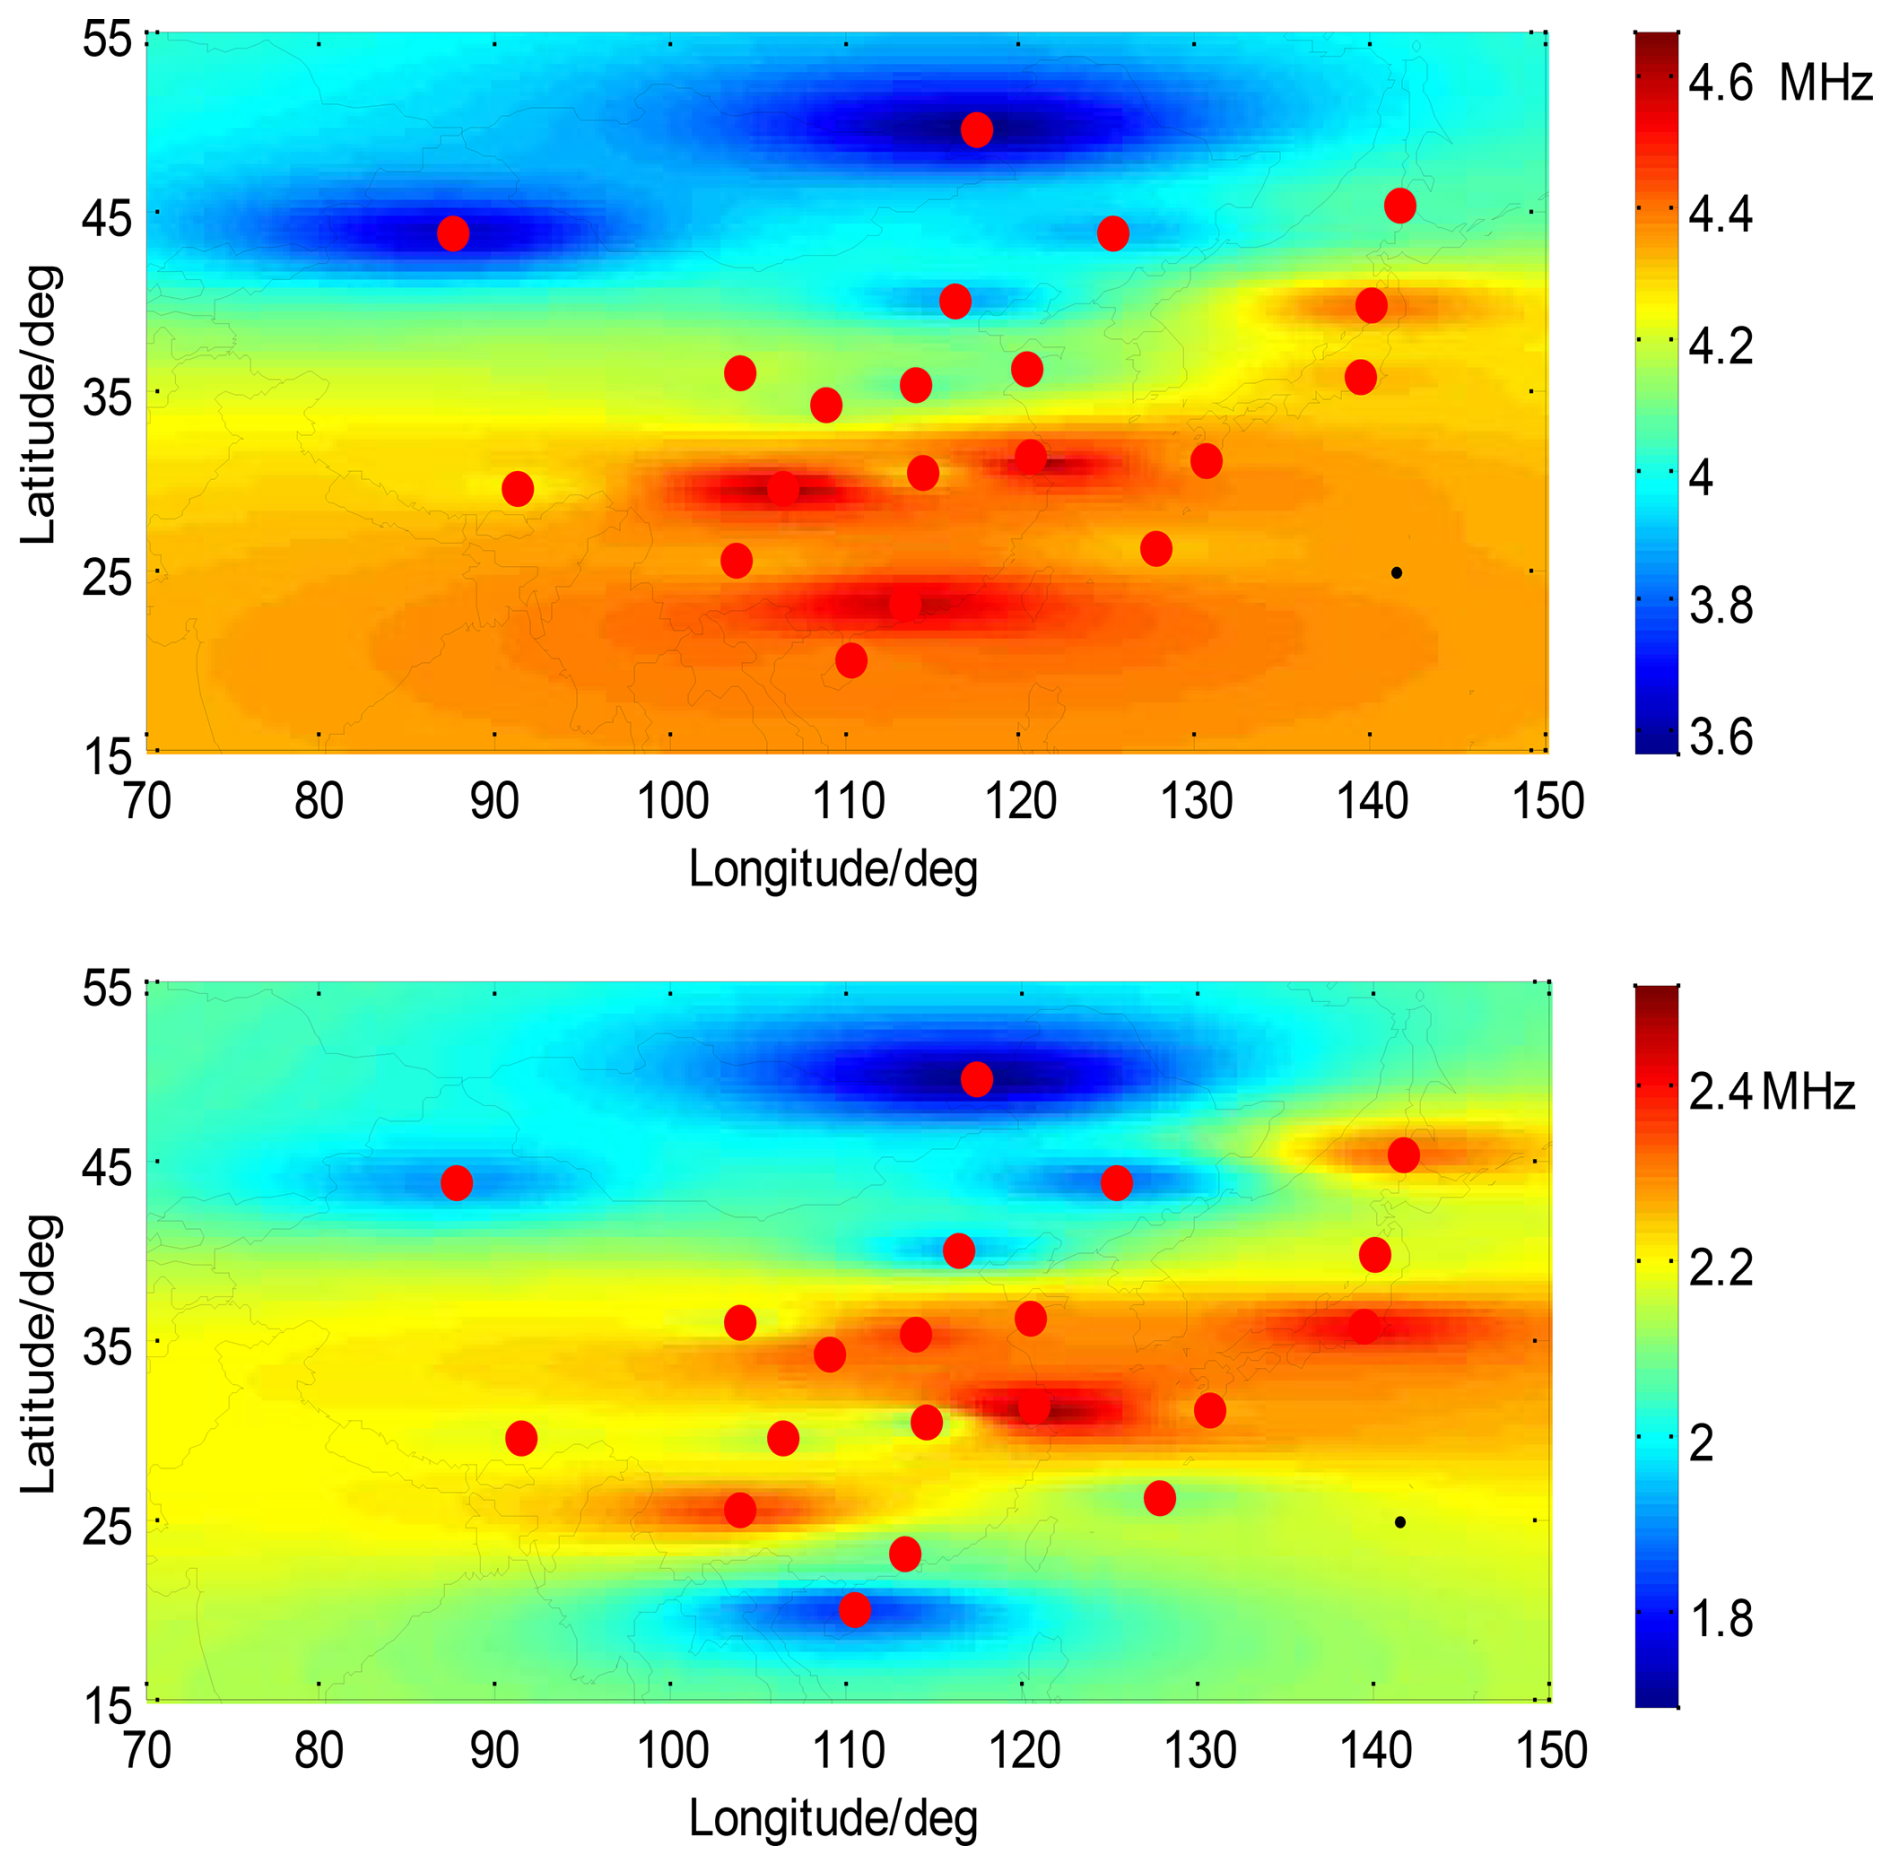
Figure 5The day and night comparison of foEs average values.
Figure 5 shows that at daytime, the center of Es layer intensity in East Asia is located in areas such as Chongqing, Guangzhou, and Suzhou in China. During the nighttime, the center of Es layer intensity migrates towards the northeast, with the strongest area appearing in regions such as Suzhou and Qingdao in China, as well as Koku and Yamagawa in Japan. The observed diurnal asymmetries in the intensity of the Es in East Asia may result from variations in the dominant controlling factors of foEs across different periods. During daytime, the electron density of the Es is primarily governed by solar radiation, showing significant latitudinal dependence. However, when solar radiation weakens at night, its controlling effect diminishes, allowing the influence of other factors such as tides and gravity waves to become more pronounced. This may be the cause of the diurnal inconsistency in the Es layer intensity center.
5.2 Seasonal variation characteristics
To further investigate the seasonal variation characteristics of the Es layer in East Asia, Fig. 6 presents the average variations of monthly median foEs values with seasons. The station selection is the same as in Sect. 5.1.
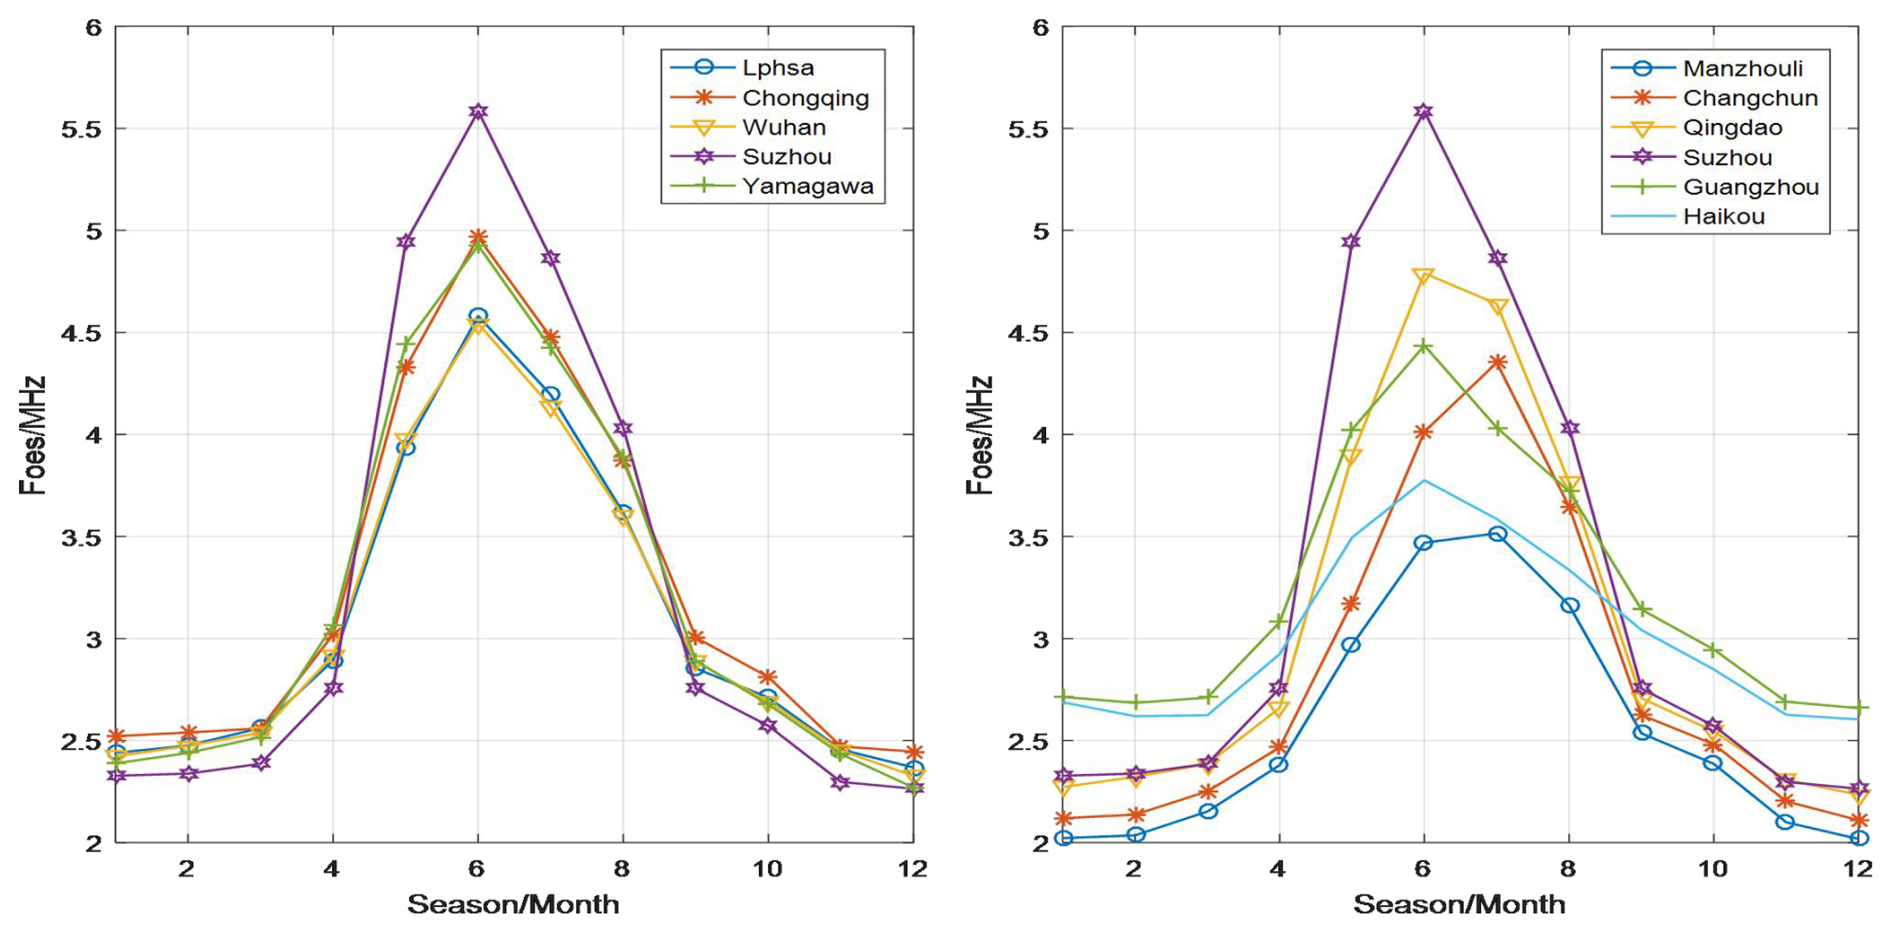
According to Fig. 6, the maximum values of foEs in East Asia generally occur in June, while the minimum values typically occur in December. The foEs values in summer are significantly higher than in winter.
To further investigate the seasonal variation characteristics of Es layer intensity in East Asia, Fig. 7 presents the spatial distribution characteristics of the average monthly median foEs values during summer and winter. (Summer is defined as May to August, and winter is defined as November to February of the following year).
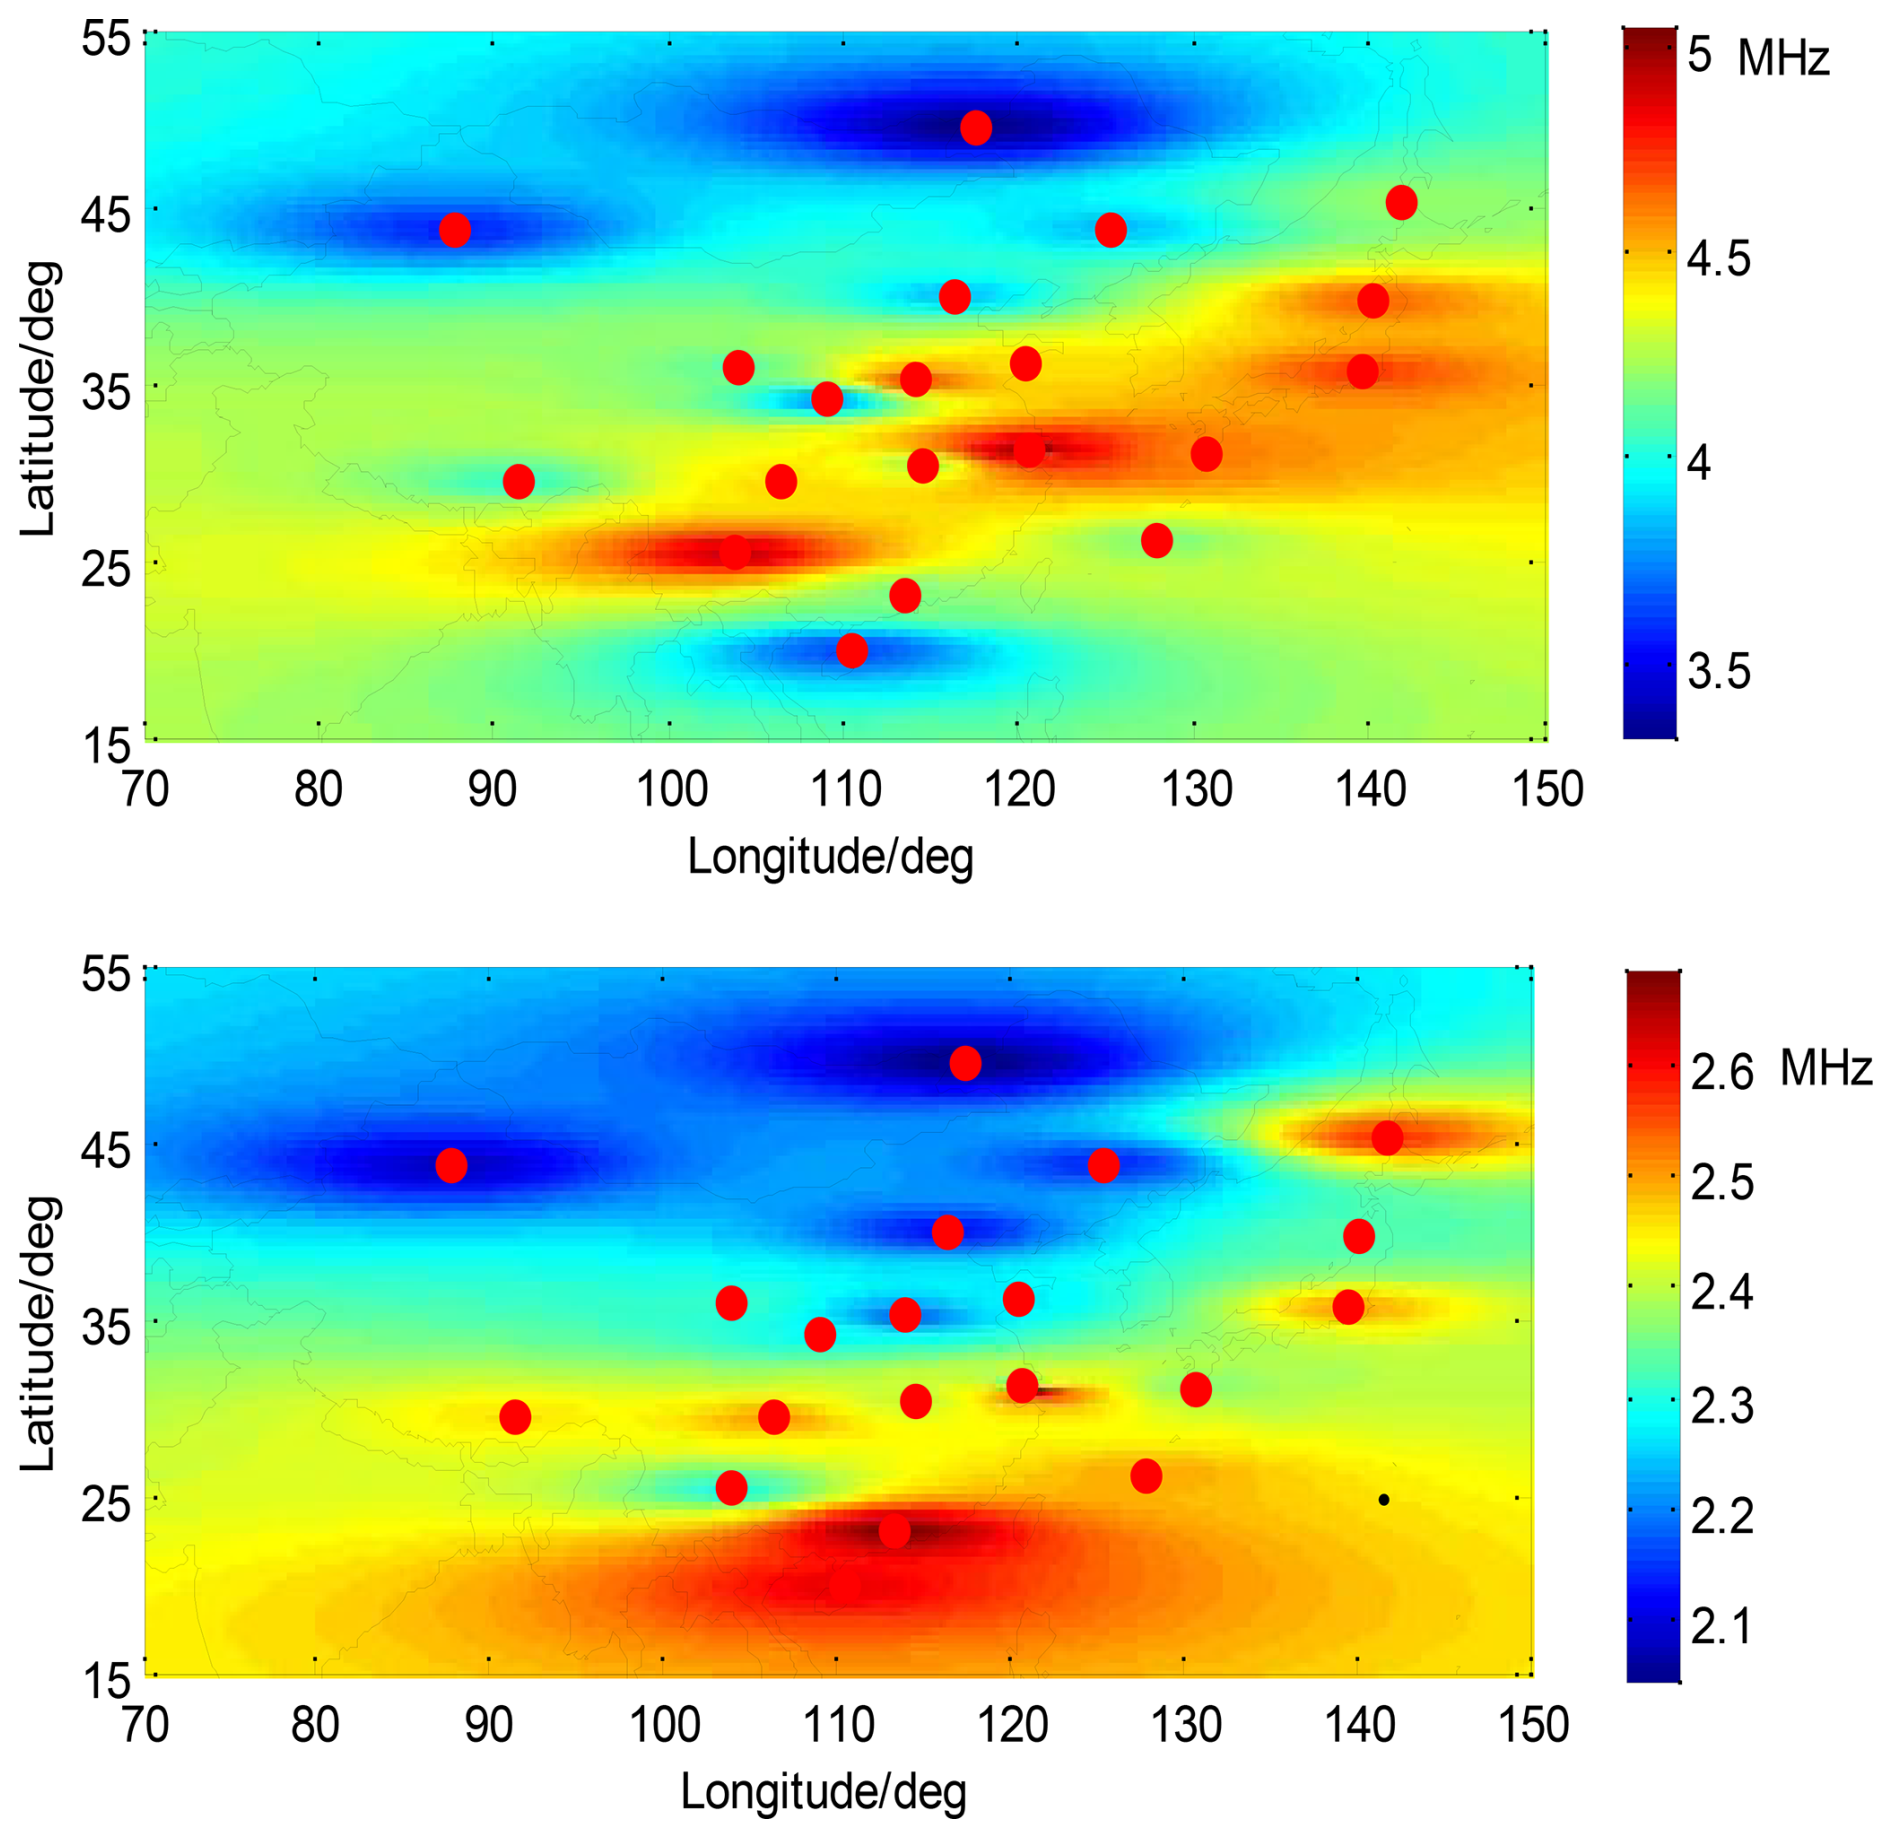
Figure 7The summer and winter comparison of foEs average values.
Figure 7 shows that during the summer in East Asia, the center of Es layer intensity is located near 30° N, exhibiting a zonal distribution. However, during the winter, the center of Es layer intensity migrates southward towards the Guangzhou and Haikou.
The proposal of the wind shear theory and the discovery of metallic ions provide a reasonable explanation for the formation process of the Es layer. Measurements of ion density and wind velocity through rocket experiments have confirmed the fundamental concept of wind shear compression. However, the occurrence of anomalous phenomena in the mid-latitude Es layer during summer poses a challenge to the wind shear theory. In order to address this issue, some scholars have conducted in-depth research by linking the occurrence rate of mid-latitude Es layer with planetary waves. They propose that planetary waves are also an important factor influencing the mid-latitude Es layer and suggest that the viewpoint of planetary waves can provide a reasonable explanation for the summer anomaly phenomenon. Furthermore, they indicate that planetary waves modulate tidal amplitudes, load information onto tides, and indirectly affect the Es layer through tides. They also predict that the modulation of tides by planetary waves is achieved through nonlinear interference (Haldoupis and Pancheva, 2002; Haldoupis et al., 2004; Pignalberi et al., 2014; Pezzopane et al., 2015).
From the analysis of the occurrence probability, intensity distribution, diurnal variation, and seasonal variation of the Es layer, we have observed a general pattern: the center of Es layer intensity seems to be chasing the center of high temperatures in the lower atmosphere. Regions with higher average temperatures tend to exhibit stronger Es layer intensity, whereas regions with lower temperatures tend to have weaker Es layer intensity. The strong correlation between Es layer intensity and lower atmospheric temperature may be attributed to the influence of temperature variations in the lower atmosphere (Zhao et al., 2024), which drive atmospheric motion and generate atmospheric waves. Additionally, more intense atmospheric waves are generated when the lower atmospheric temperature is higher. These waves gradually propagate from the lower atmosphere to the height of the Es layer, affecting the formation process of the Es layer. As a result, the Es layer intensity shows a high consistency with the surface atmospheric temperature. We will conduct targeted research to further investigate the correlation between Es layer intensity and surface temperature.
5.3 Solar cycle variation characteristics
The correlation between Es layer intensity and solar cycles has been a focal point of debate in the scientific community. Different scholars have drawn contradictory conclusions, including positive correlation, negative correlation, and no correlation, based on observations from different stations (Tan et al., 1985; Maksyutin and Sherstyukov, 2005; Closs, 1969; Zuo and Wan, 2002; Pezzopane et al. 2015). Currently, there are three main viewpoints. One viewpoint suggests that Es layer intensity is independent of solar activity, implying no significant influence. Another perspective proposes a weak positive correlation between Es layer intensity and solar activity, implying that variations in solar cycles may have a slight impact on Es layer intensity. In contrast, there is a third viewpoint suggesting a weak negative correlation between Es layer intensity and solar activity, indicating that higher solar activity could potentially lead to a decrease in Es layer intensity. In 1984, Baggaley conducted a statistical analysis of data from two stations in the southern hemisphere covering three solar activity cycles. The study concluded that solar activity and the Es layer were not correlated (Baggaley, 1984). However, the following year, Baggaley found that Es layer intensity increased with an increase in sunspot numbers (Baggaley, 1985).
To investigate the solar cycle variations in Es layer intensity in East Asia, Fig. 8 utilizes data from five different latitude observation stations: Manzhouli, Beijing, Chongqing, Guangzhou, and Haikou. The data used includes the monthly median foEs and sunspot numbers from 1998 to 2020, covering two complete solar cycles. This analysis aims to examine the correlation between Es layer intensity and solar activity in East Asia.
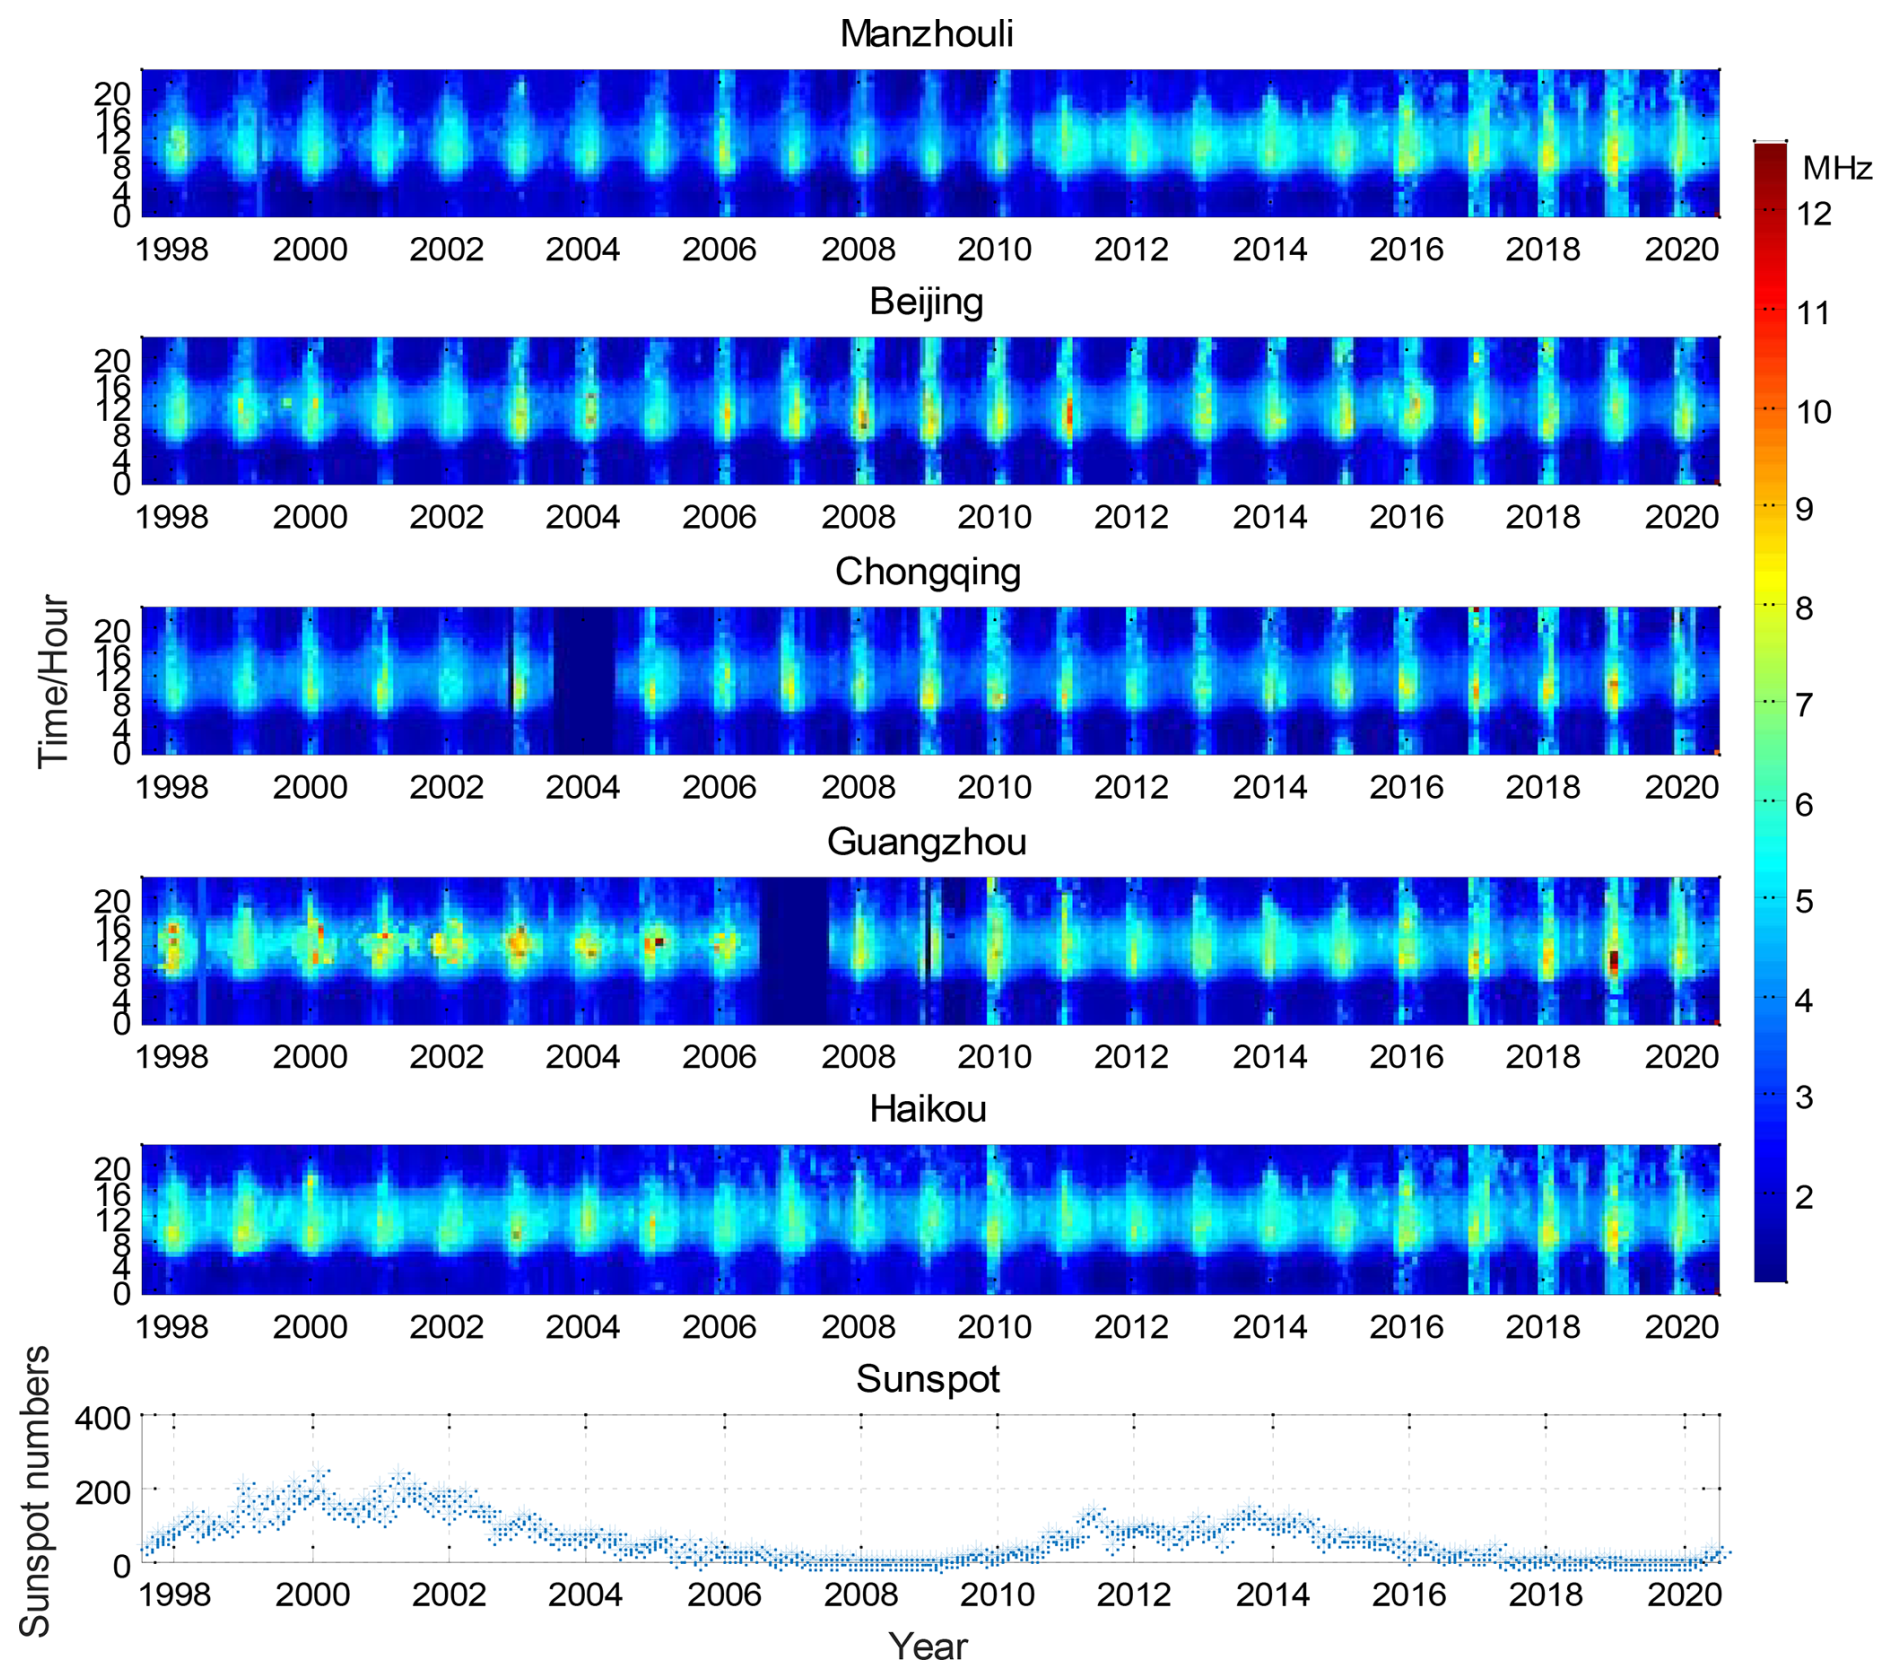
Figure 8 shows that during periods of low solar activity (e.g., 2006–2009 and 2017–2020), the overall foEs layer intensity is slightly higher compared to high solar activity periods (e.g., 1999–2002 and 2011–2014), indicating a weak negative correlation.
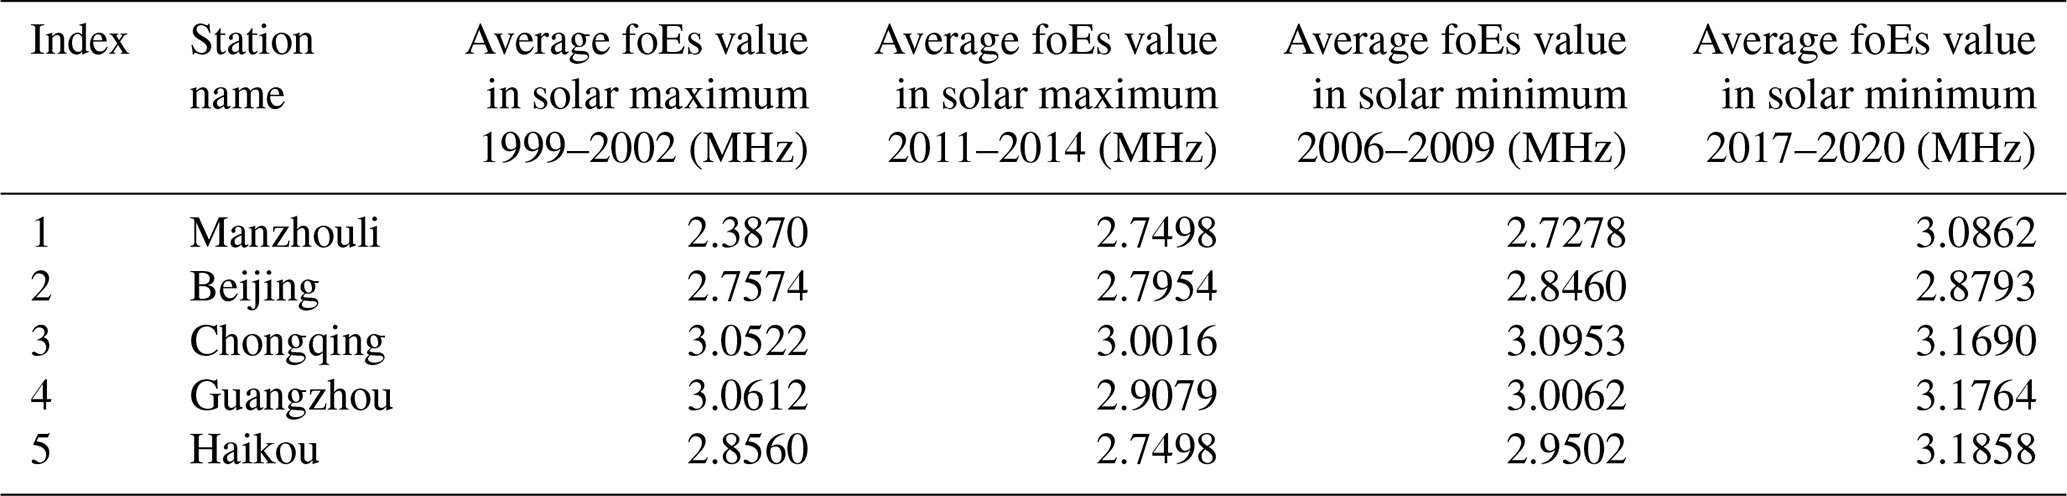
To conduct a quantitative comparison, we selected the years 1999–2002 and 2011–2014 as representative solar maximum periods (years of high solar activity), and 2006–2009 and 2017–2020 as solar minimum periods (years of low solar activity). We then compared the overall annual mean foEs values for these periods. The results show that the average foEs during solar minimum years is higher than during solar maximum years, with an increase of approximately 0.1–0.3 MHz. The foEs values for representative stations are listed in Table 2.
Table 2Comparison of the average foEs values between solar maximum years and solar minimum years.
In order to further investigate the correlation between Es layer intensity and solar activity cycles, the Pearson correlation coefficient was employed to calculate the correlation between daytime and nighttime monthly median foEs values and solar activity. The calculation formulas are as follows:
where X represents the Es layer critical frequency, and Y represents the monthly mean sunspot number. The correlation calculation results between the monthly median foEs and solar activity are presented in Table 3.
Table 3The correlation coefficient between Es layer intensity and solar activity.
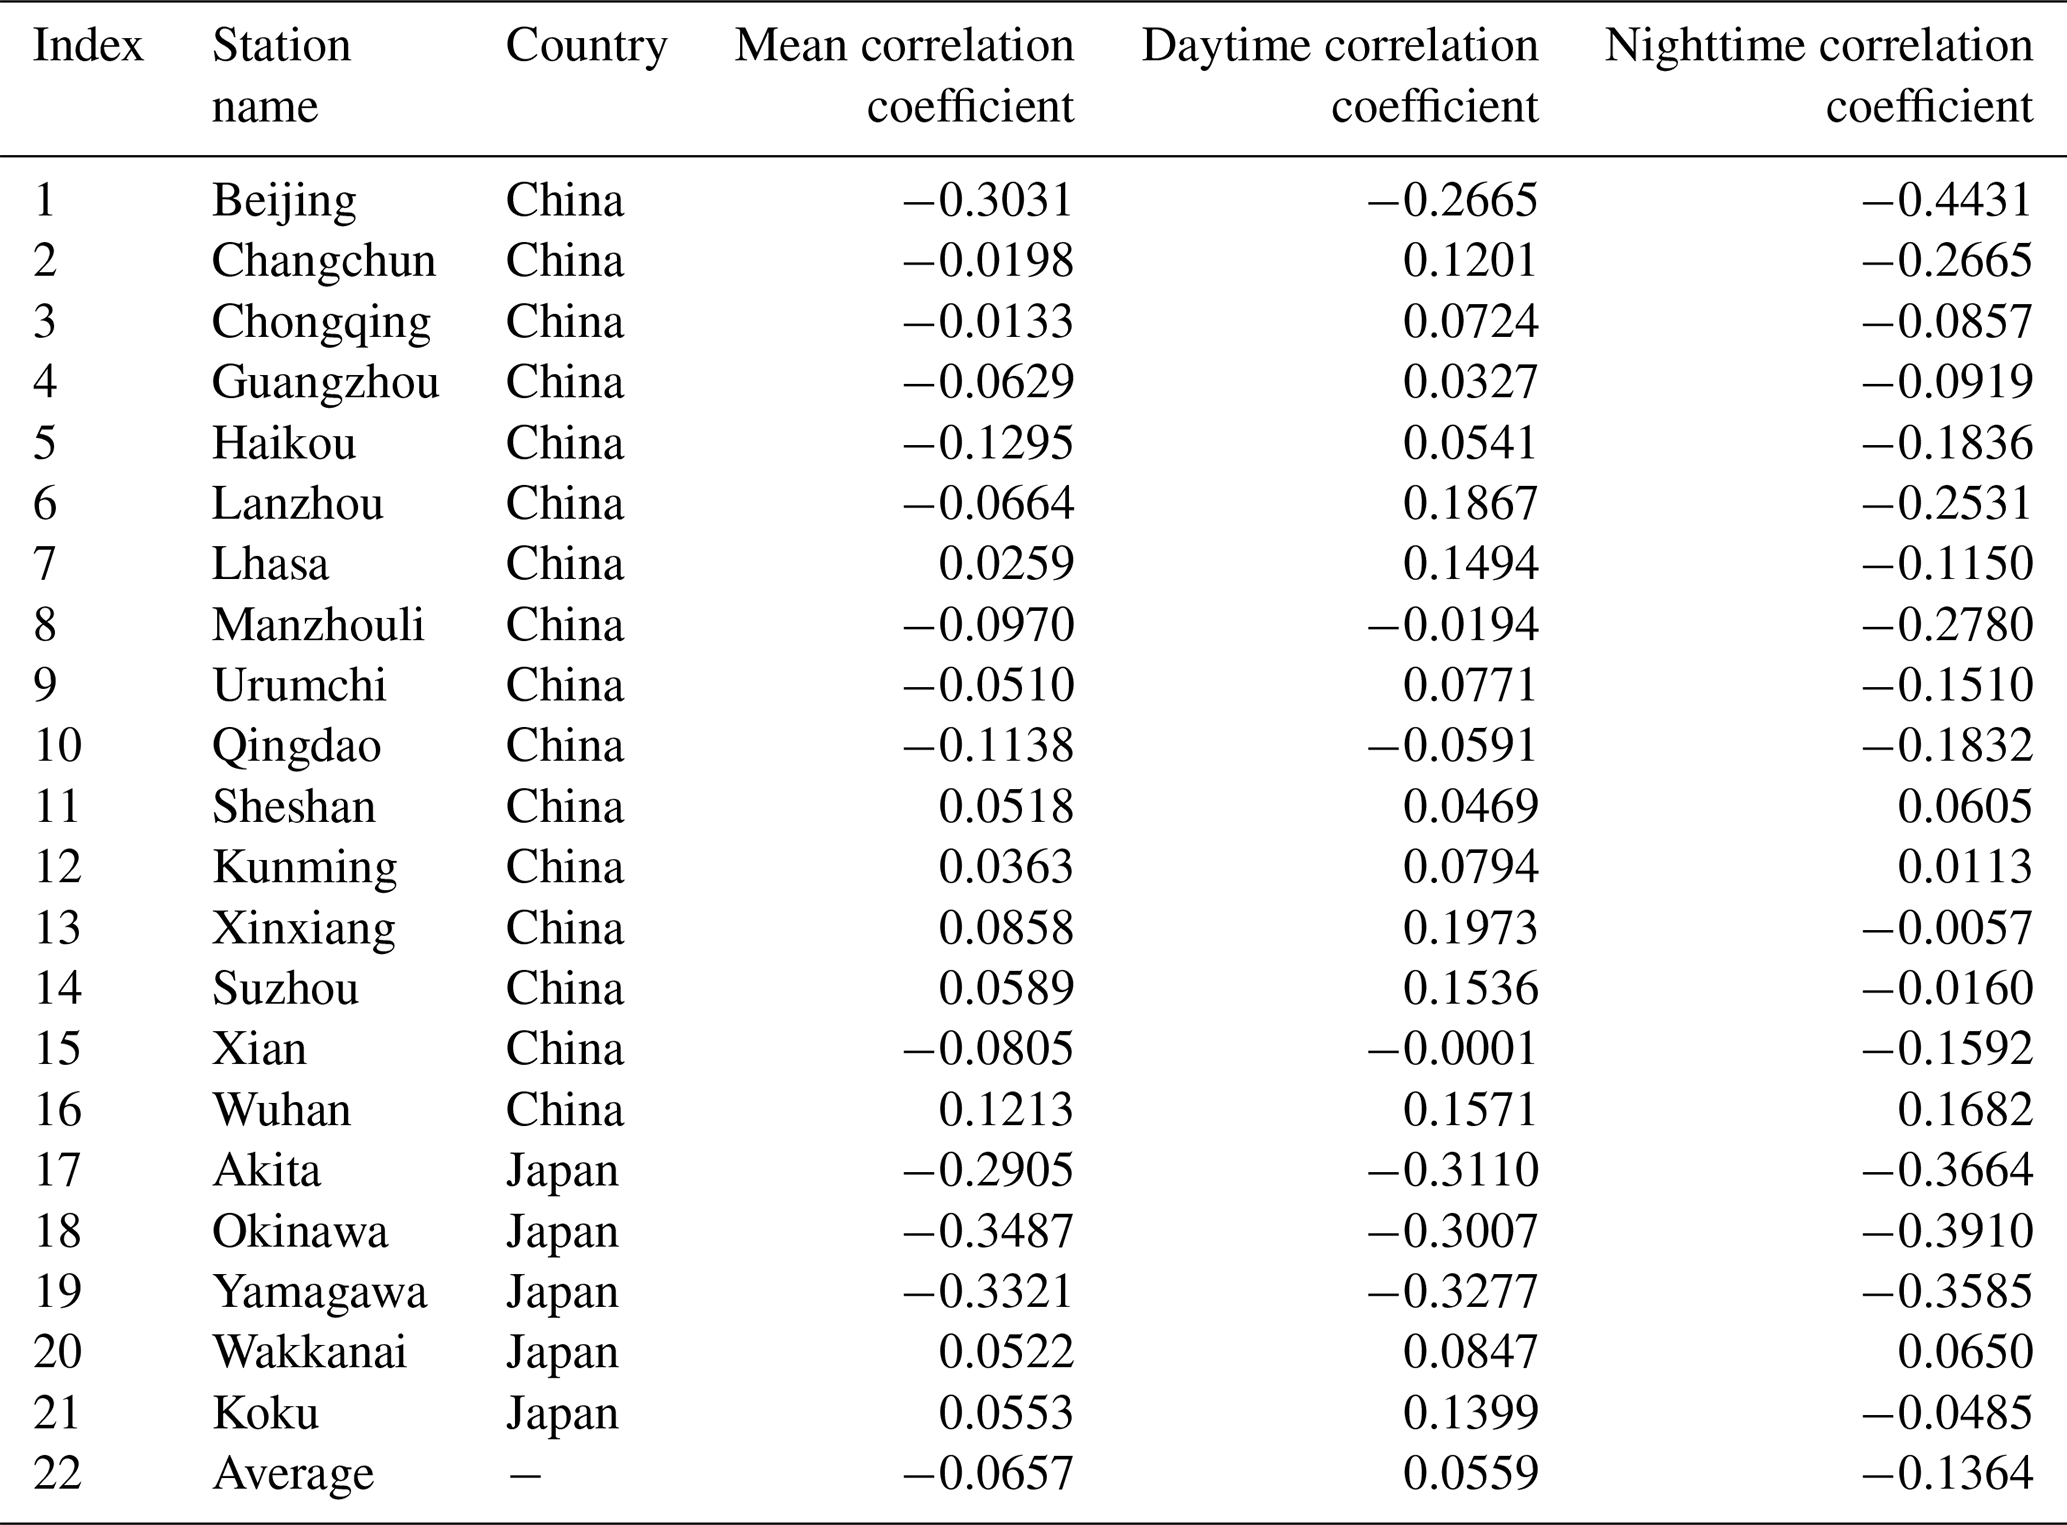
From Table 3, it is shown that there is an overall negative correlation between foEs in East Asia and sunspot numbers. At daytime, most of the stations exhibit a weak positive correlation between foEs and sunspot numbers. However, during the nighttime, almost all stations show a negative correlation between foEs and sunspot numbers.
To further analyze the correlations between weak/strong foEs and solar activity, Table 4 presents the calculated occurrence probabilities of weak Es (foEs < 3 MHz) and strong Es (foEs > 5 MHz) during solar maximum periods (1999–2002 and 2011–2014) and solar minimum periods (2006–2009 and 2017–2020).
Table 4Comparison of the occurrence probabilities of weak foEs and strong foEs during years of high and low solar activity.
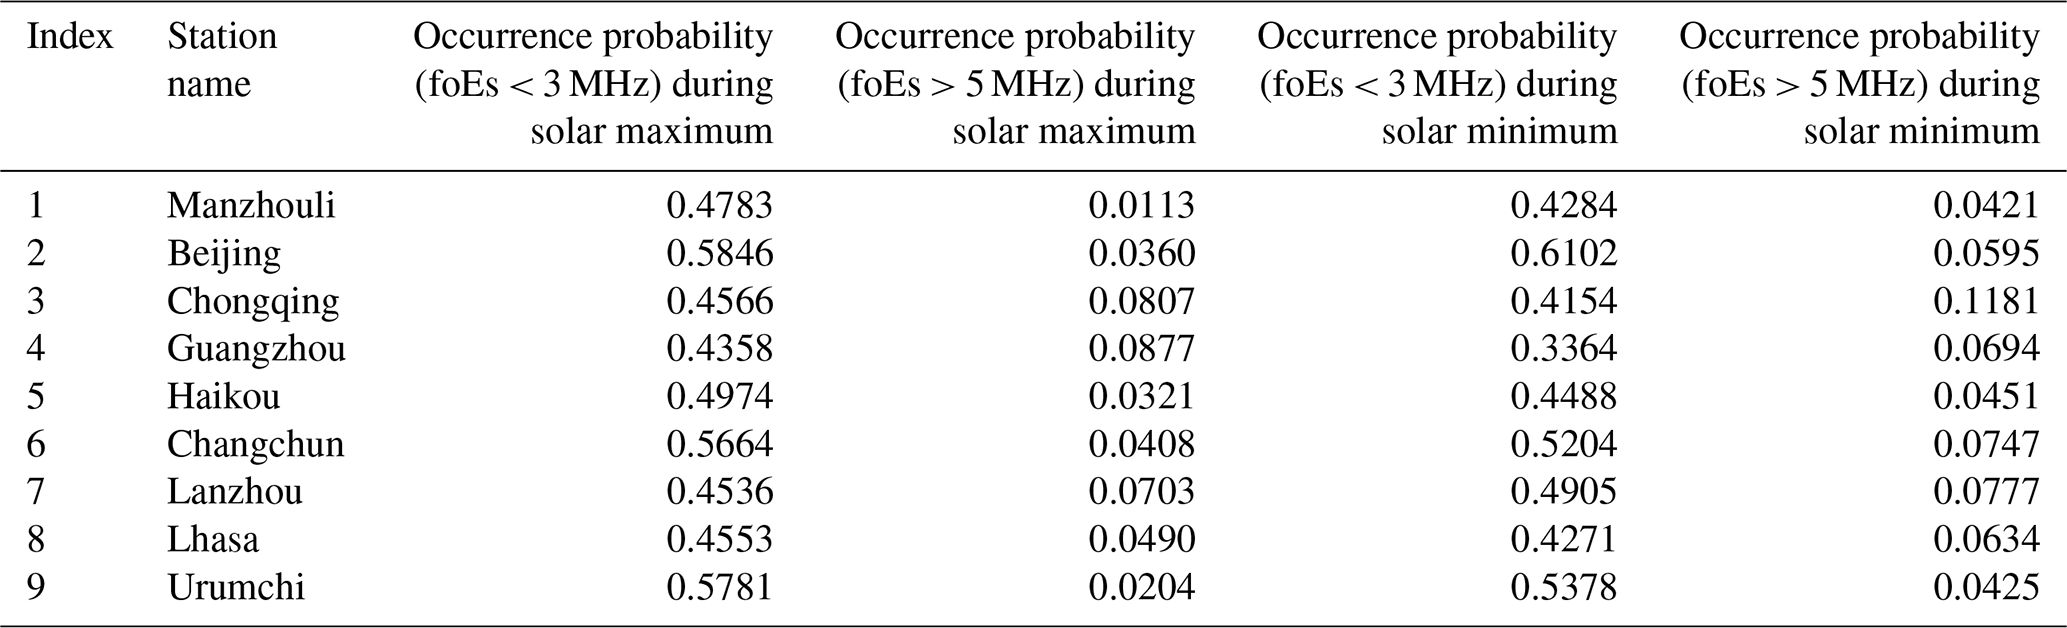
The results indicate that the occurrence rate of weak Es is slightly higher during solar maximum than during solar minimum, whereas the occurrence rate of strong Es is significantly higher during solar minimum compared to solar maximum. The occurrence rate of weak Es is slightly higher during solar maximum than during solar minimum, which is consistent with the findings of Tian et al. (2024).
5.4 Long-term variation characteristics
To investigate the long-term variation trends of Es layer intensity in East Asia, Fig. 9 illustrates the annual variations in monthly median foEs values at eight representative stations: Manzhouli, Changchun, Urumqi, Beijing, Lanzhou, Chongqing, Haikou, and Guangzhou. The red line is a linear fit of the monthly median foEs, its expression is:
where b represents the slope, and a represents the constant term.
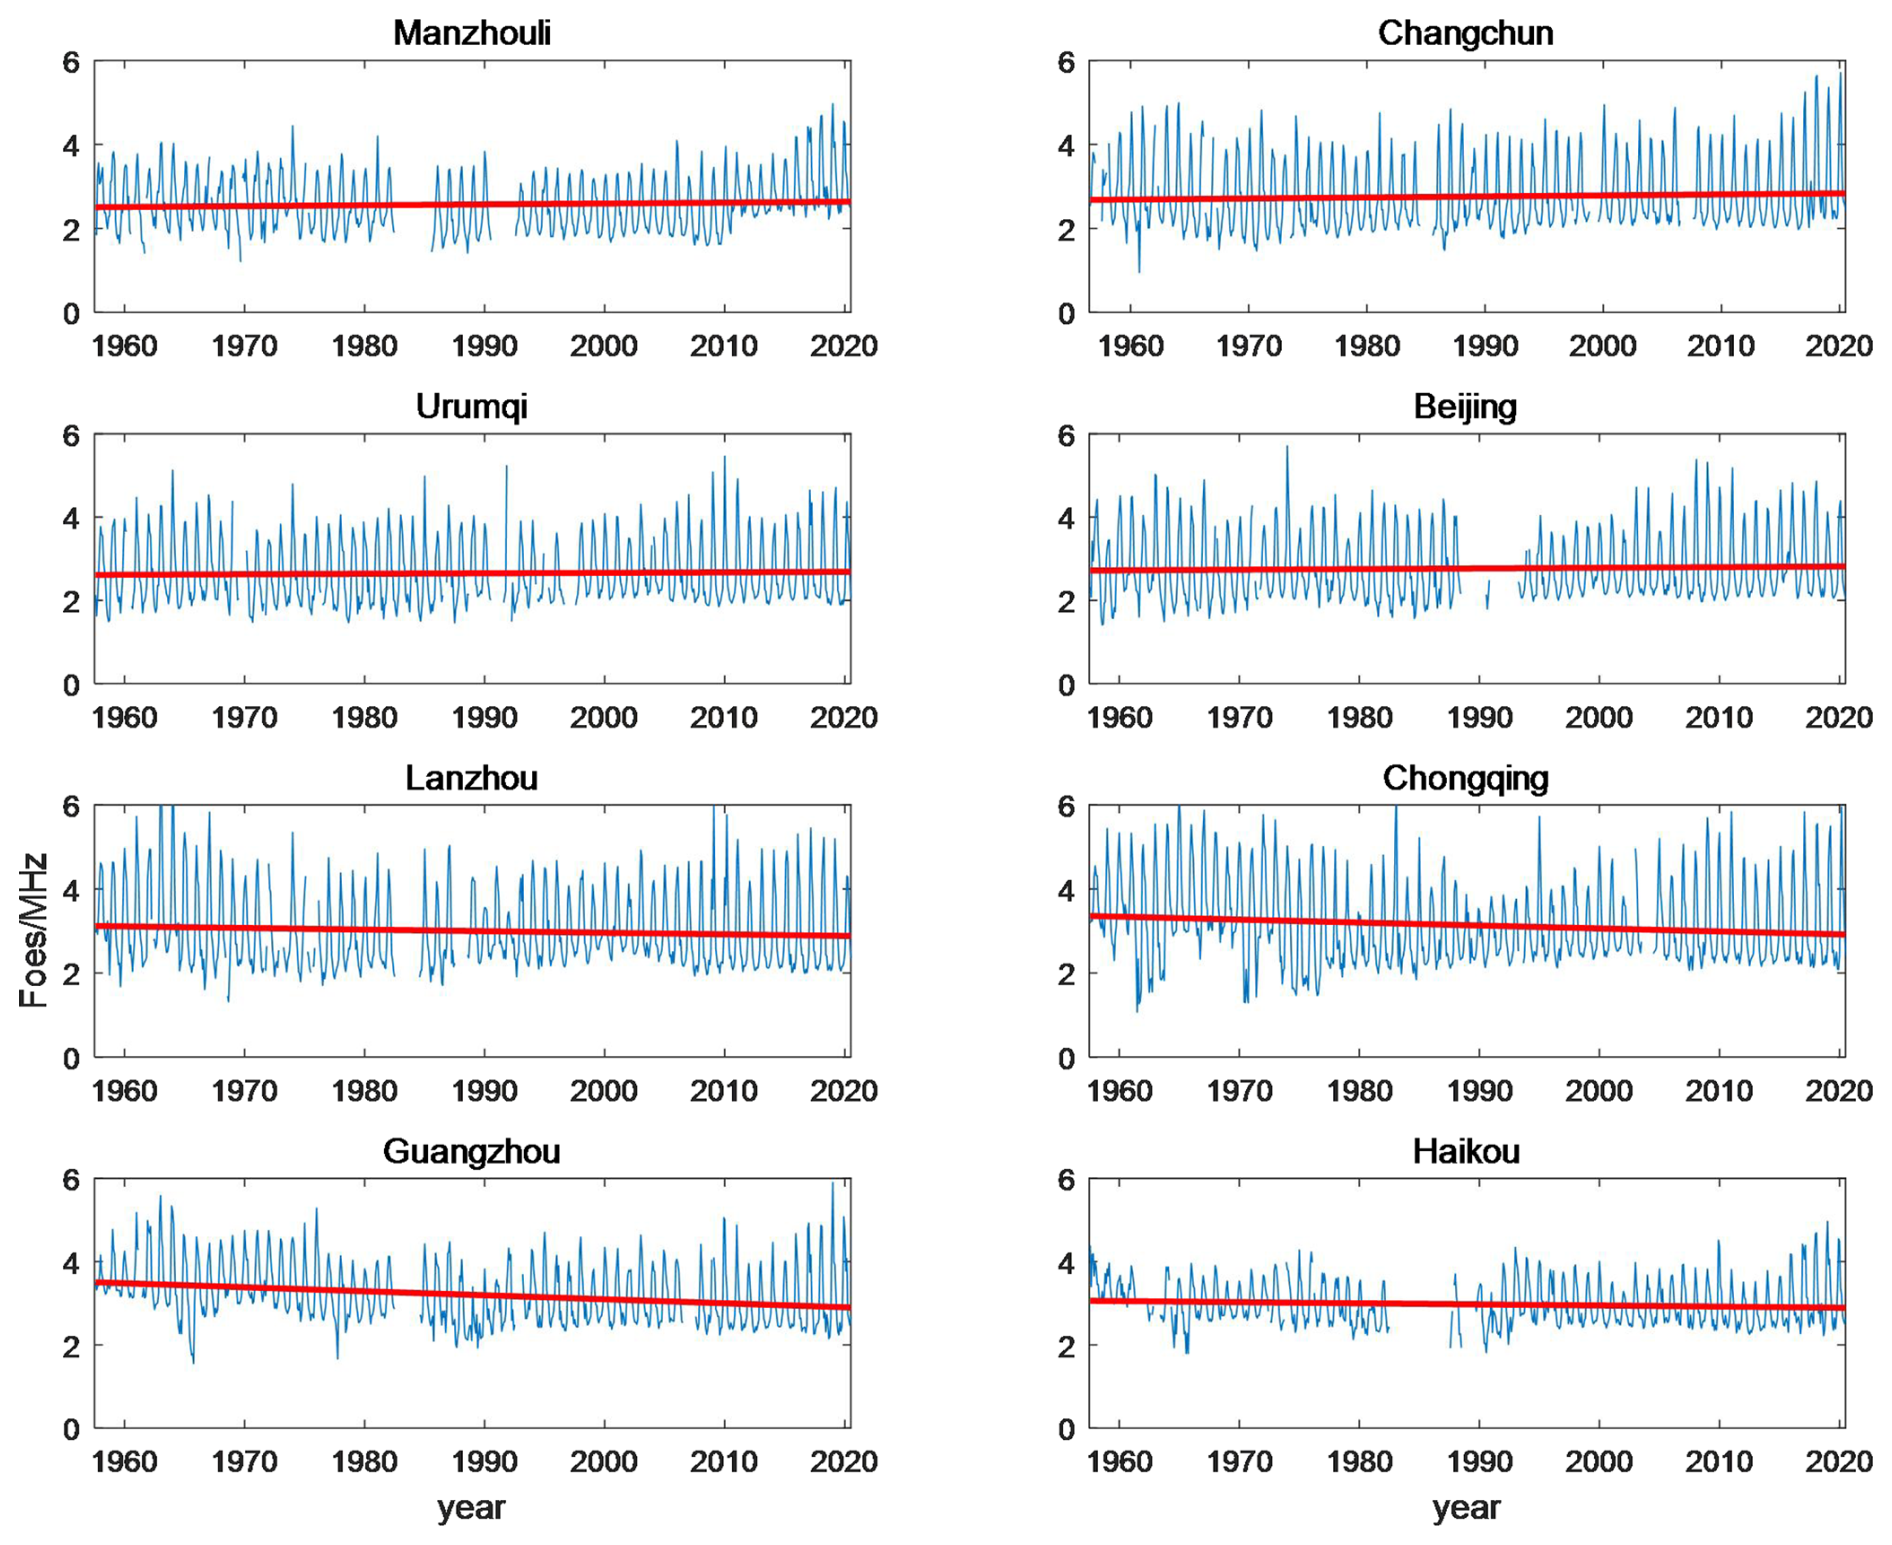
From Fig. 9, it is shown that among the eight stations: Manzhouli, Changchun, Urumqi, Beijing, Lanzhou, Chongqing, Haikou, and Guangzhou, the stations with higher overall Es layer intensity exhibit a decreasing trend in monthly median foEs values, while stations with lower Es layer intensity show an increasing trend. Specifically, the foEs values at Manzhouli, Changchun, Urumqi, Beijing, and Haikou demonstrate an upward trend, with respective positive slopes of 0.0002 ± 0.000027, 0.0002 ± 0.000027, 0.0001 ± 0.000027, 0.0001 ± 0.000027, and 0.0002 ± 0.000027. On the other hand, the Es layer at Lanzhou, Chongqing, and Guangzhou shows a downward trend, with respective negative slopes of −0.0003 ± 0.000027, −0.0006 ± 0.000027, and −0.0008 ± 0.000027. By applying the same methodology to study the long-term variation trends of foEs at 13 other stations (as shown in Table 5), it was found that the Es layer intensity exhibited a long-term decreasing trend at four stations, with negative slopes ranging from 0 to −0.0010, while it showed a long-term increasing trend at nine stations, with positive slopes ranging from 0 to 0.0025. Furthermore, the amplitude of Es layer intensity varies across different latitude stations, with the highest amplitude observed near the 30° latitude line, gradually decreasing towards lower and higher latitudes.
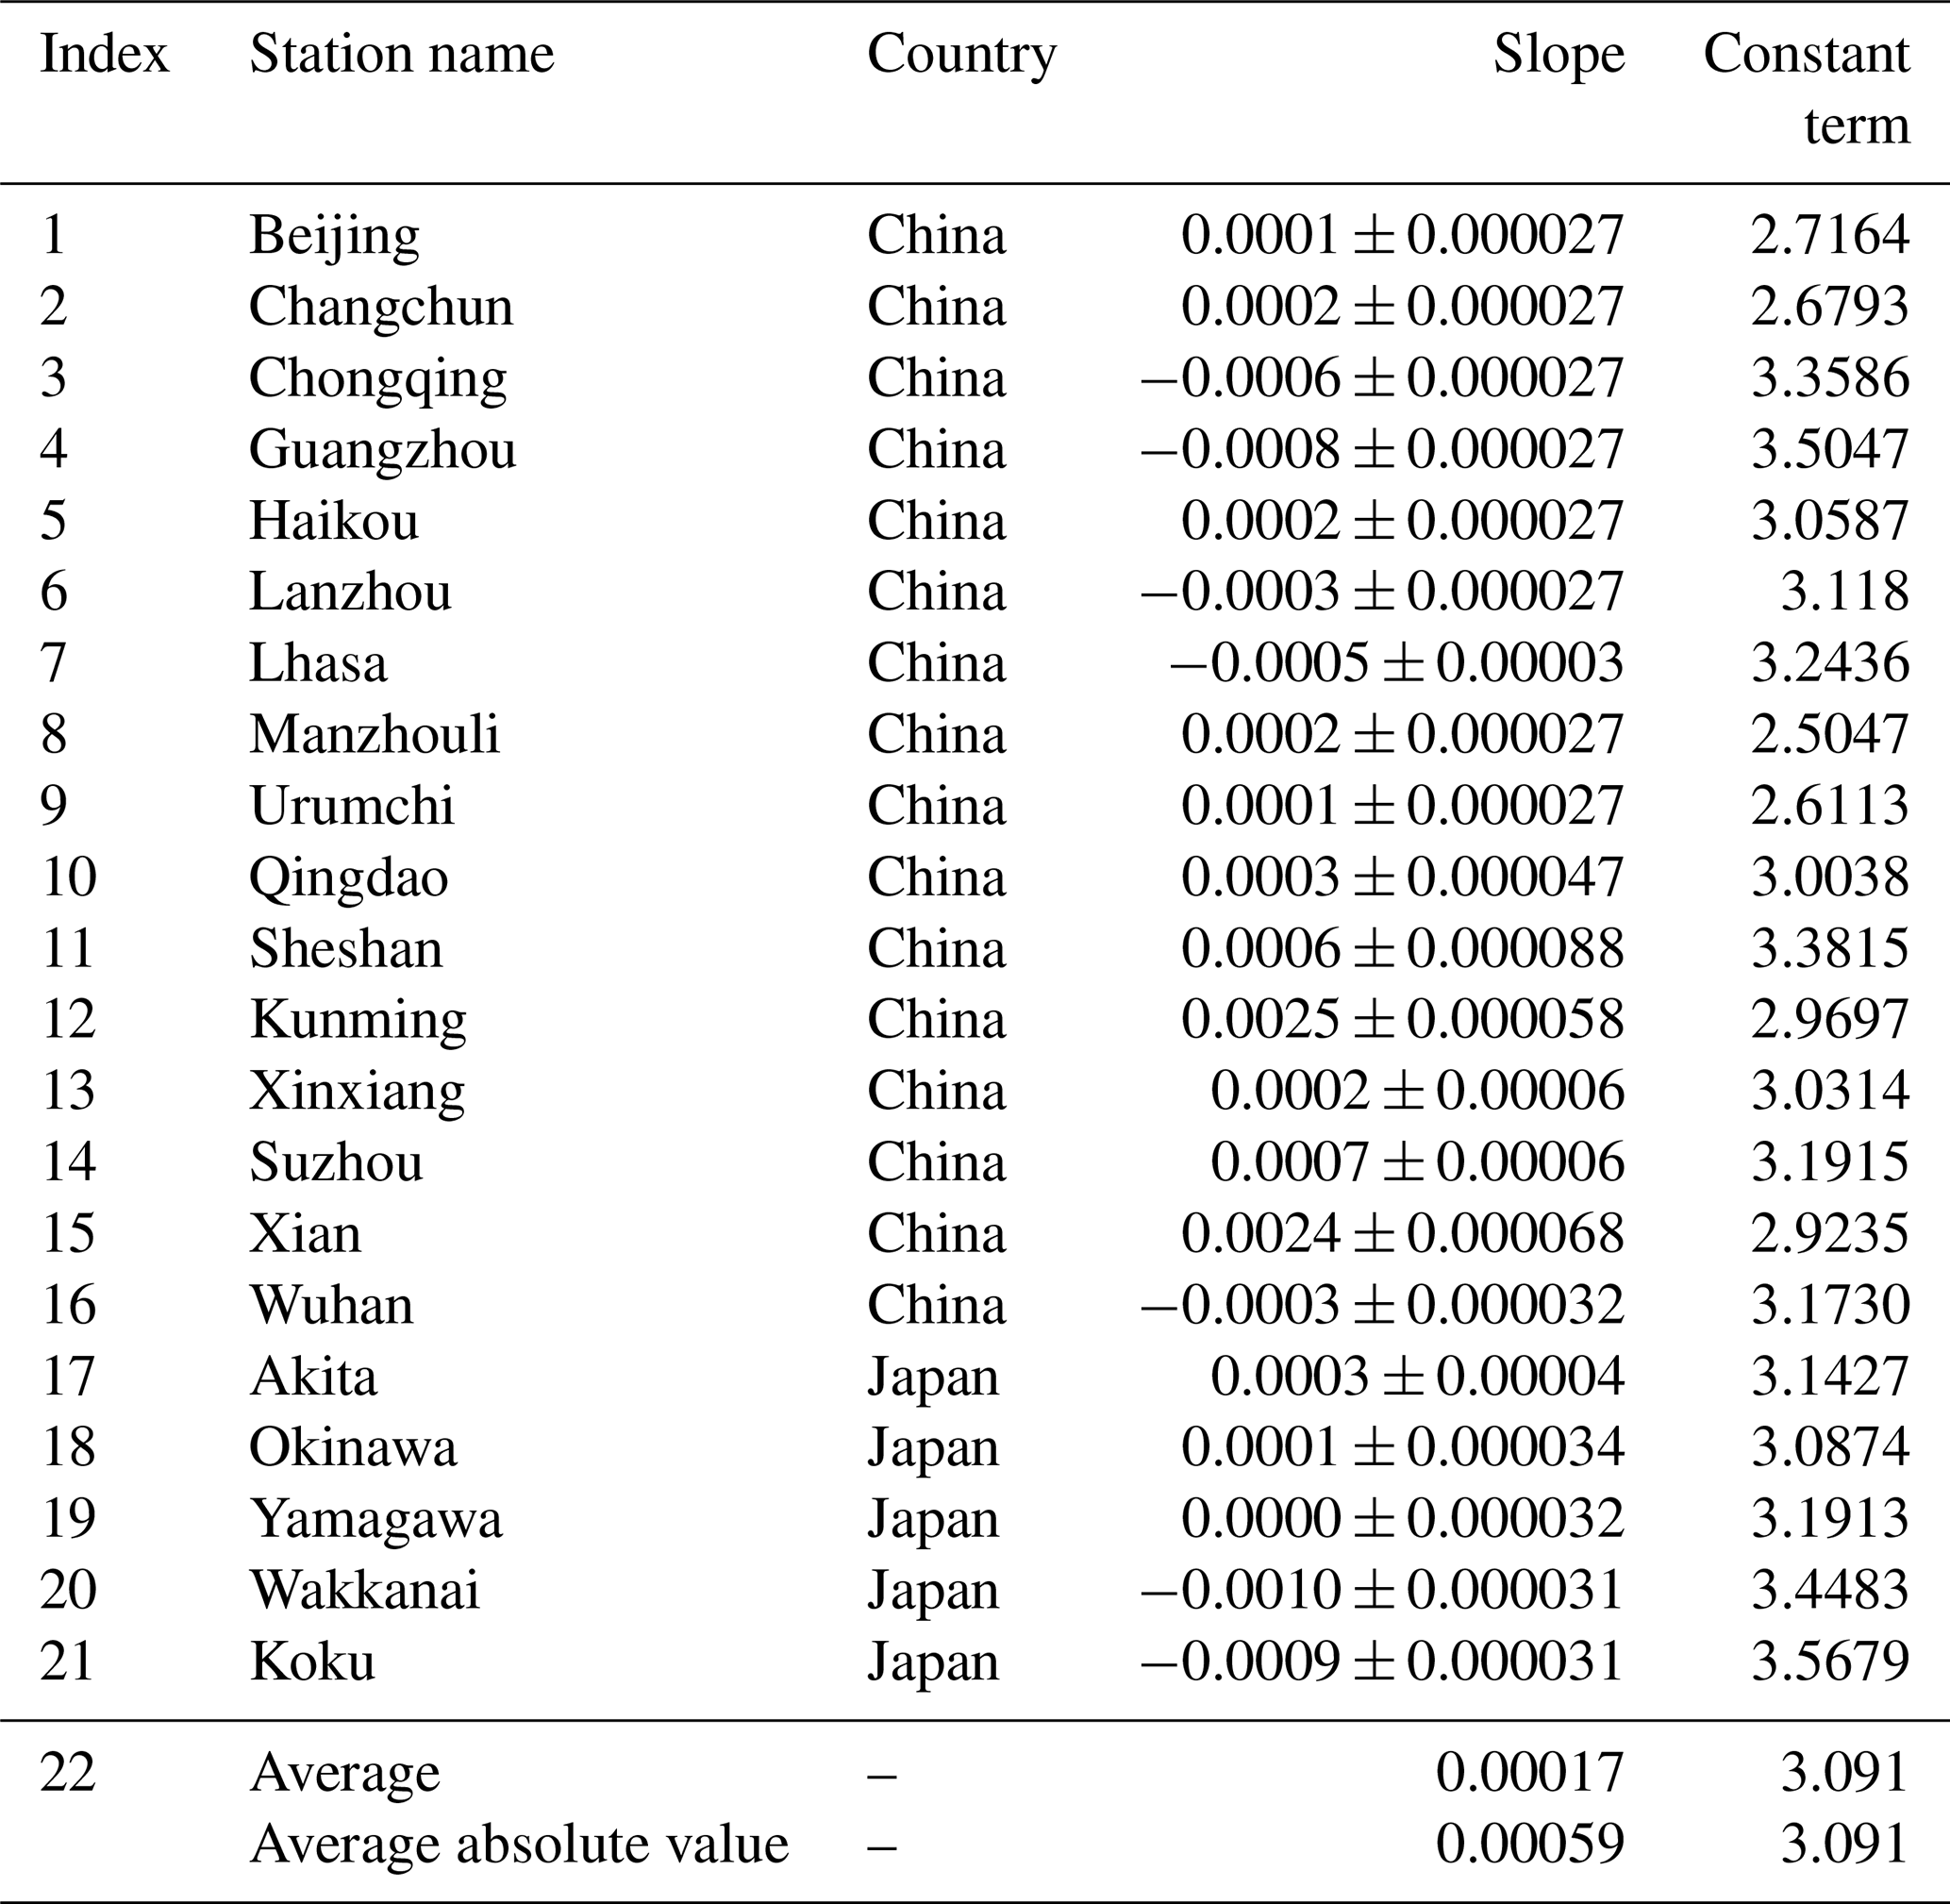
Analysis of the monthly median foEs values at 21 stations in East Asia reveals an overall long-term increasing trend in Es layer intensity, with an average positive slope of 0.00017. Stations with higher Es layer intensity generally exhibit a long-term decreasing trend, while stations with lower Es layer intensity tend to show a long-term increasing trend. This overall pattern indicates a negative feedback characteristic. In other words, from a long-term perspective, Es layer intensity at higher-latitude stations shows an overall upward trend, while that at lower-latitude stations tends to decrease. This pattern becomes particularly evident when only stations with data records exceeding 33 years are considered. The underlying reasons for the long-term variation trends in the Es layer could potentially be associated with long-term climate variations.
It should be specifically noted that although the fitted slope of the long-term trend of the Es layer in East Asia is small, the trend is statistically significant. Figure 9 illustrates the monthly variations. Based on the average absolute slope of 0.00059 listed in Table 5, the corresponding annual change rate is calculated to be 0.00708. Given that the average intensity of the Es layer is approximately 3 MHz, the corresponding relative variation rate is estimated to be about 0.23 % yr−1. This magnitude of variation is considered significant: according to the World Meteorological Organization (WMO) and the EU's Copernicus Climate Change Service (C3S), the global warming rate is approximately 0.02 °C yr−1; given a baseline global average temperature of 20 °C, this corresponds to a relative annual change rate of about 0.1 %. It is evident that the 0.23 % annual variation rate of the Es layer is comparable to that of global temperature changes, suggesting important indicative significance in ionospheric climatology.
This study utilizes over 60 years of Es layer observation data from 21 ionospheric vertical sounding stations in China and Japan to investigate in-depth the characteristics of Es layer intensity, spatial distribution, diurnal variation, seasonal variation, and long-term trends in East Asia. The study finds that the Es layer in East Asia generally follows the common variation patterns typical of mid-latitude regions, but also exhibits unique regional characteristics. Firstly, the intensity center of the Es layer in East Asia is not fixed, but migrates with diurnal and seasonal variations. Secondly, although the long-term variation trends of Es layer intensity differ among various locations in the region, the overall pattern is that areas with higher intensity tend to show a downward trend, while those with lower intensity tend to show an upward trend. The discovery of these new phenomena provides important reference for research on the formation mechanisms of the Es layer and the coupling processes between the atmosphere and the ionosphere.
Research indicates a strong positive correlation between the intensity of the Es layer in East Asia and surface air temperature, with a correlation coefficient as high as 0.82 (Zhao et al., 2024), suggesting a significant climate response relationship between the two. The surface temperature distribution is the fundamental driving factor of the lower atmosphere motion, and determines the motion state of the lower atmosphere. Then, the coupling mechanism between the lower atmosphere and the upper atmosphere affects the atmospheric motion at the height of the Es layer, and then correlates with the intensity of the Es layer (Zhao et al., 2024; Tang et al., 2025, 2026). Due to the significant difference in specific heat capacity between ocean and land in East Asia – where rocks and soil on land have a lower specific heat capacity, while seawater has a higher specific heat capacity – land areas experience faster heating and cooling processes compared to the ocean. Influenced by this thermal contrast, daytime surface temperatures on land are generally higher than those over the ocean at the same latitude, while nighttime temperatures are higher over the ocean than on land. Based on the correlation between Es layer intensity and surface temperature, the intensity center of the Es layer in this region exhibits a distinct diurnal spatial migration pattern: during the day, the intensity center is predominantly located over land areas around 30° N, while at night, it shifts northeastward to oceanic regions around 35° N. Influenced by variations in solar radiation intensity and the subtropical high-pressure system, the high-temperature center in East Asia exhibits significant latitudinal migration: during summer, it is primarily located around 30° N, while in winter, it shifts southward to lower-latitude regions. Correspondingly, the intensity center of the Es layer also displays a similar seasonal displacement pattern – concentrated around 30° N in summer and moving southward to the South China Sea region in winter. Overall, the intensity center of the Es layer in East Asia exhibits a tendency to follow the movement of the high-temperature center.
With the acceleration of global industrialization and the continuous increase in greenhouse gas emissions, global warming and extreme weather events are becoming increasingly frequent. The long-term evolution trend of the Es layer in East Asia may be linked to abnormal climatic changes in the region. In recent years, global warming has led to persistent abnormally high temperatures in summer in higher-latitude regions of East Asia, such as Northeast and Northwest China, where extreme heat events have increased significantly. At the same time, abnormally low temperatures have frequently occurred in winter in lower-latitude regions, exemplified by the historically rare widespread freezing rain disaster in southern China in 2008. Such regional climatic anomalies have exerted a noticeable impact on variations in Es layer intensity: in higher-latitude regions such as Manzhouli, Changchun, Urumchi, and Beijing, rising summer temperatures are accompanied by a long-term increasing trend in Es layer intensity, despite the overall relatively weak Es layer intensity in these areas. Meanwhile, in lower-latitude regions such as Chongqing, Guangzhou, Lhasa, and Wuhan, the phenomenon of abnormally low winter temperatures is closely associated with a weakening trend in Es layer intensity, even though these sites generally exhibit relatively strong average Es layer intensity. Overall, the long-term changes in the Es layer in East Asia exhibit a “negative feedback” spatial structure: regions with weaker Es layer intensity show an upward trend, while those with stronger intensity display a downward trend. This trend reveals a regionally adaptive adjustment response mechanism of the Es layer under the influence of the climate system, providing important observational evidence for further understanding the coupling between space weather and climate.
The research findings of this study are of significant importance for exploring the causes of the Es layer, analyzing the spatiotemporal distribution of Es layer intensity. The following research conclusions have been obtained:
-
In East Asia, the intensity of foEs during the summer months (May to August) is significantly higher than in other seasons. Additionally, the intensity is notably higher around local noon compared to other times of the day. Moreover, the Es layer intensity exhibits strong regional variations. In general, the maximum intensity of the Es layer is located near the 30° latitude in the northern Hemisphere, and weakens to lower and higher latitudes. The intensity tends to be higher in lower latitudes compared to higher latitudes, and the eastern region shows slightly higher intensity compared to the western region. The monthly average foEs values at all stations have a maximum value above 5 MHz, with certain stations reaching even above 9 MHz, which is much higher than the global average level.
-
At daytime in East Asia, the center of Es layer intensity is observed in the Chongqing, Guangzhou, and Suzhou areas of China. However, during the nighttime, the center of Es layer intensity migrates towards the northeast, with the strongest region located in areas such as Suzhou and Qingdao in China, as well as Koku and Yamagawa in Japan. The diurnal asymmetry of the Es layer center may be influenced by factors such as the distribution of land and sea, as well as climatic conditions.
-
During the summer in East Asia, the center of Es layer intensity is located near 30° N and exhibits a belt-like distribution. In the winter, the center of Es layer intensity migrates southward to the Guangzhou and Haikou.
-
In East Asia, the Es layer intensity in East Asia showed a negative correlation with the number of sunspots overall, with diurnal inconsistency, weak positive correlation during the day and negative correlation at night.
-
Based on the ionosonde data from 21 stations in East Asia, the long-term variation trend of Es layer intensity at different locations is different, but overall, it presents a long-term upward trend and has a negative feedback characteristic. The regions with higher average Es layer intensity showed a long-term downward trend, while the regions with lower average Es layer intensity showed a long-term upward trend.
The Es data over China and Japan can be available at: https://github.com/zhaohaisheng22s/-Sporadic-E-Over-East-Asia/commits/Es (last access: 1 May 2026; https://doi.org/10.5281/zenodo.10885736, Zhao, 2024).
HSZ, JF, YL and ZWX wrote the main manuscript text. KX and JW prepared Figs. 1–6. HYP and ZHD prepared Figs. 7–9. All authors reviewed the manuscript.
The contact author has declared that none of the authors has any competing interests.
Publisher's note: Copernicus Publications remains neutral with regard to jurisdictional claims made in the text, published maps, institutional affiliations, or any other geographical representation in this paper. The authors bear the ultimate responsibility for providing appropriate place names. Views expressed in the text are those of the authors and do not necessarily reflect the views of the publisher.
The Es layer data used in the article were all from the National Institute of Information and Communications Technology (NICT) in Japan. We would like to express our gratitude.
This research has been supported by the Defense Industrial Technology Development Program (grant no. A072401404).
This paper was edited by John Plane and reviewed by three anonymous referees.
Arras, C., Jacobi, C., and Wickert, J.: Semidiurnal tidal signature in sporadic E occurrence rates derived from GPS radio occultation measurements at higher midlatitudes, Ann. Geophys., 27, 2555–2563, https://doi.org/10.5194/angeo-27-2555-2009, 2009.
Axford, W. I.: The formation and vertical movement of dense ionized layers in the ionosphere, J. Geophys. Res., 68, 769, https://doi.org/10.1029/JZ068i003p00769, 1963.
Axford, W. I., Cunnold, D. M., and Gleeson, L. J.: Magnetic field changes in temperate zone sporadic-E layers, Planet. Space Sci., 14, 909–919, https://doi.org/10.1016/0032-0633(66)90096-1, 1966.
Baggaley, W. J.: Three solar cycles of daytime southern hemisphere Es activity, J. Atmos. Terr. Phys., 46, 207, https://doi.org/10.1016/0021-9169(84)90147-8, 1984.
Baggaley, W. J.: Changes in the frequency distribution of foEs and fbEs over two solar cycles, Planet. Space Sci., 33, 457, https://doi.org/10.1016/0032-0633(85)90089-3, 1985.
Closs, R. L.: Low latitude sporadic E associated with geomagnetic activity, J. Atmos. Terr. Phys., 31, 873–874, https://doi.org/10.1016/0021-9169(69)90169-X, 1969.
Danilov, A. D. and Konstantinova, A. V.: Long-term variations in the parameters of the middle and upper atmosphere and ionosphere (review), Geomagn. Aeron., 60, 397–420, https://doi.org/10.1134/S0016793220040040, 2020.
Davis, C. J. and Lo, K. H.: An enhancement of the ionospheric sporadic-E layer in response to negative polarity cloud-to-ground lightning, Geophys. Res. Lett., 35, https://doi.org/10.1029/2007GL031909, 2008.
Didebulidze, G. G., Dalakishvili, G., Lomidze, L., and Matiashvili, G.: Formation of sporadic-E (Es) layers under the influence of AGWs evolving in a horizontal shear flow, J. Atmos. Sol.-Terr. Phys., 136, 163–173, https://doi.org/10.1016/j.jastp.2015.09.012, 2015.
Gunst, R. F. and Kitanidis, P. K.: Introduction to Geostatistics: Applications in Hydrogeology, B. Am. Meteorol. Soc., 79, 1720–1722, http://www.jstor.org/stable/26361665 (last access: 28 April 2026), 1998.
Haldoupis, C. and Pancheva, D.: Planetary waves and midlatitude sporadic E layers: Strong experimental evidence for a close relationship, J. Geophys. Res., 107, https://doi.org/10.1029/2001JA000212, 2002.
Haldoupis, C. and Pancheva, D.: Terdiurnal tidelike variability in sporadic E layers, J. Geophys. Res., 111, https://doi.org/10.1029/2005JA011522, 2006.
Haldoupis, C. and Schlegel, K.: Characteristics of midlatitude coherent backscatter from the ionospheric E region obtained with Sporadic E Scatter experiment, J. Geophys. Res., 101, 13387–13397, https://doi.org/10.1029/96JA00758, 1996.
Haldoupis, C., Farley, D. T., and Schlegel, K.: Type-1 echoes from the mid-latitude E-Region ionosphere, Ann. Geophys., 15, 908–917, https://doi.org/10.1007/s00585-997-0908-2, 1997.
Haldoupis, C., Pancheva D., and Mitchell, N. J.: A study of tidal and planetary wave periodicities present in midlatitude sporadic E layers, J. Geophys. Res., 109, https://doi.org/10.1029/2003JA010253, 2004.
Haldoupis, C., Meek, C., Christakis, N., Pancheva, D., and Bourdillon, A.: Ionogram height-time-intensity observations of descending sporadic E layers at mid-latitude, J. Atmos. Sol. Terr. Phys., 68, 539, https://doi.org/10.1016/j.jastp.2005.03.020, 2006.
Haldoupis, C., Pancheva, D., Singer, W., Meek, C., and MacDougall, J.: An explanation for the seasonal dependence of midlatitude sporadic E layers. J. Geophys. Res., 112, 1–7, 2007.
Helmboldt, J.: A multi-platform investigation of midlatitude sporadic E and its ties to E–F coupling and meteor activity, Ann. Geophys., 34, 529–541, https://doi.org/10.5194/angeo-34-529-2016, 2016.
Ioannidis, G. and Farley, D. T.: Incoherent scatter observations at Arecibo using compressed pulses, Radio Sci., 7, 763, https://doi.org/10.1029/RS007i007p00763, 1972.
Jacobi, C. and Arras, C.: Tidal wind shear observed by meteor radar and comparison with sporadic E occurrence rates based on GPS radio occultation observations, Adv. Radio Sci., 17, 213–224, https://doi.org/10.5194/ars-17-213-2019, 2019.
Kelley, M. C., Riggin, D., Pfaff, R. F., Swartz,W. E., Providakes, J. F., and Huang, C. S.: Large amplitude quasi-periodic fluctuations associated with a mid-latitude sporadic E layer, J. Atmos. Terr. Phys., 57, 1165, https://doi.org/10.1016/0021-9169(94)00130-G, 1995.
Macleod, M. A., Keneshea,T. J., and Narcisi, R. S.: Numerical modeling of a metal ion sporadic E-layer, Radio Sci., 10, 371, https://doi.org/10.1029/RS010i003p00371, 1975.
Maeda, J., Suzuki, T., Furuya, M., and Heki, K.: Imaging the midlatitude sporadic E plasma patches with a coordinated observation of space borne In SAR and GPS total electron content, Geophys. Res. Lett., 165, 275–285, https://doi.org/10.1002/2015GL067585, 2016.
Maksyutin, S. V. and Sherstyukov, O. N.: Dependence of E-sporadic layer response on solar and geomagnetic activity variations from its ion composition, Adv. Space Res., 35, 1496–1499, https://doi.org/10.1016/j.asr.2005.05.062, 2005.
Matheron, G.: Principles of geostatistics, Econ. Geol., 58, 1246–1266, https://doi.org/10.2113/gsecongeo.58.8.1246, 1963.
Oliver, M. A. and Webster, R.: Kriging: a method of interpolation for geographical information systems, Int. J. Geogr. Inf. Syst., 4, 313–332, https://doi.org/10.1080/02693799008941549, 1990.
Pezzopane, M., Pignalberi, A., and Pietrella, M.: On the influence of solar activity on the mid-latitude sporadic E layer, J. Space Weather Spac., 5, A31, https://doi.org/10.1051/swsc/2015031, 2015.
Pfaff, R., Yamamoto, M., Marionni, P., Mori, H., and Fukao, S.: Electric field measurements above and within a sporadic-E layer, Geophys. Res. Lett., 25, 1769, https://doi.org/10.1029/98GL00935, 1998.
Pietrella, M., Pezzopane, M., and Bianchi, C.: A comparative sporadic-E layer study between two mid-latitude ionospheric stations, Advances in Space Research, 54, 150–160, https://doi.org/10.1016/j.asr.2014.03.019, 2014.
Pignalberi, A., Pezzopane, M., and Zuccheretti, E.: Sporadic E layer at mid-latitudes: average properties and influence of atmospheric tides, Ann. Geophys., 32, 1427–1440, https://doi.org/10.5194/angeo-32-1427-2014, 2014.
Qiu, L., Yamazaki, Y., Yu, T., Becker, E., Miyoshi, Y., Qi, Y., Siddiqui, T. A., Stolle, C., Feng, W., Plane, J. M. C., Liang, Y., and Liu, H.: Numerical Simulations of Metallic Ion Density Perturbations in Sporadic E Layers Caused by Gravity Waves, Earth Space Sci., 10, e2023EA003030, https://doi.org/10.1029/2023EA003030, 2023.
Reddy C. A.: Physical significance of the Es parameters fbEs, fEs, and foEs 2. Causes of partial reflections from Es, J. Geophys. Res., 73, 5627–5647, https://doi.org/10.1029/JA073i017p05627, 1968.
Seddon, J. C.: Sporadic E as observed with rockets, Ionospheric Sporadic, 78–88, https://doi.org/10.1016/B978-0-08-009744-2.50011-4, 1962.
Sivakandan, M., Mielich, J., Renkwitz, T., Chau, J. L., Jaen, J., and Laštovička, J.: Long-term variations and residual trends in the E, F, and sporadic E (Es) layer over Juliusruh, Europe, J. Geophys. Res., 128, e2022JA031097, https://doi.org/10.1029/2022JA031097, 2023.
Smith, E. K.: Worldwide occurrence of sporadic E, NBS Circular 582, U.S. Gort. Printing Office, Washington, D.C., https://doi.org/10.6028/NBS.CIRC.582, 1957.
Smith, L. G.: A sequence of rocket observations of night-time sporadic-E, J. Atmos. Terr. Phys., 32, 1247, https://doi.org/10.1016/0021-9169(70)90055-3, 1970.
Swartz, W. E., Ioannidis, G. A., Shen, J. S., Brice, N. M., and Rowe, J. F.: Two days in the life of the ionosphere over Arecibo, Radio Sci., 9, 769, https://doi.org/10.1029/RS009i008p00769, 1974.
Tan, Z., Huang, X., and Wang, S.: A preliminary investigation of ionospheric Es over Wuchang, China, J. Atmos. Terr. Phys., 47, 959, https://doi.org/10.1016/0021-9169(85)90073-X, 1985.
Tang, H., Zhao, H., Xue, K., Xu, Z., Xie, S., Feng, J., Yang, P., Li, N., Ding, Z., and Wu, J.: Variation Characteristics of the Ionospheric E Layer over the Tibetan Plateau and Surrounding Areas During a Full Solar Cycle, Remote Sens., 17, 3713, https://doi.org/10.3390/rs17223713, 2025.
Tang, H., Zhao, H., Xue, K., Yang, P., Xu, Z., Li, N., Xie, S., Feng, J., Wu, J., and Ding, Z.: Spatiotemporal Variation Characteristics of hE in the Tibetan Plateau and Its Surrounding Areas, J. Geophys. Res.-Space, 131, 4566–4577, https://doi.org/10.1029/2025JA034768, 2026.
Tepley, C. A. and Mathews, J. D.: An incoherent scatter radar measurement of the average ion mass and temperature of a night-time sporadic layer, J. Geophys. Res., 90, 3517, https://doi.org/10.1029/JA090iA04p03517, 1985.
Tian, P., Yu, B., Ye, H., Xue, X., Wu, J., and Chen, T.: Deep Learning Insights Into Ionospheric Sporadic E Irregularities Under Different Solar Activity Conditions, J. Geophys. Res., 129, e2024JH000279, https://doi.org/10.1029/2024JH000279, 2024.
Whitehead, J. D.: Production and prediction of sporadic E, Rev. Geophys. Space Phys., 8, 65, https://doi.org/10.1029/RG008i001p00065, 1970.
Whitehead, J. D.: Recent work on mid-latitude and equatorial sporadic E, J. Atmos. Terr. Phys., 51, 401, https://doi.org/10.1016/0021-9169(89)90122-0, 1989.
Yamamoto, M., Itsuki,T., Kishimoto, T., Tsunoda, R. T., Pfaff, R. F., and Fukao, S.: Comparison of E-region electric fields observed with a sounding roket and a Doppler radar in the SEEK campaign, Geophys. Res. Lett., 25, 1773, https://doi.org/10.1029/98GL01055, 1998.
Zhao, H. S.: zhaohaisheng22s/-Sporadic-E-Over-East-Asia, Zenodo [code], https://doi.org/10.5281/zenodo.10885736, 2024.
Zhao, H. S., Xu, Z. W., Xue, K., Wu, J., Liu, Y., Feng, J., Wang, C., Zheng, Y., and Li, N.: Probable Controls From the Lower Layers on Sporadic E Layer Over East Asia, J. Geophys. Res., 129, e2023JA032379, https://doi.org/10.1029/2023JA032379, 2024.
Zuo, X. M. and Wan, W. X.: The correlation between sporadic E–layers and solar activity, Chin. J. Geophys., 45, 803–809, https://doi.org/10.1002/cjg2.295, 2002.
- Abstract
- Introduction
- Ionosonde Station Network and Data Sources in China and Japan
- Characteristics of Es layer intensity in East Asia
- Spatial distribution characteristics of Es layer in East Asia
- Temporal distribution characteristics of Es layer in East Asia
- Discussion and Conclusions
- Code and data availability
- Author contributions
- Competing interests
- Disclaimer
- Acknowledgements
- Financial support
- Review statement
- References