the Creative Commons Attribution 4.0 License.
the Creative Commons Attribution 4.0 License.
 | 06 May 2026
Significance of microphysical processes for uncertainties in ensemble forecasts of summertime convection over central Europe
Christian Barthlott
Beata Czajka
Christoph Gebhardt
Corinna Hoose
Accurately forecasting summertime convection remains a challenge for convection-permitting ensemble prediction systems, which often show insufficient spread in precipitation forecasts. This study examines the role of microphysical uncertainties using the ICOsahedral Non-hydrostatic (ICON) model for 4 representative convective cases over central Europe. A 108-member cloud microphysics ensemble (MPHYS-ENS) was generated by perturbing cloud condensation nuclei (CCN) and ice-nucleating particle (INP) concentrations, graupel sedimentation velocity, and the cloud droplet size distribution. Microphysical perturbations alone produced substantial variability in convective intensity and location, despite identical initial and boundary conditions. Precipitation totals were highly sensitive to CCN and graupel sedimentation, with deviations of 17 %–33 % across cases, while the timing of convection onset was only weakly affected. Rapid domain-wide error growth indicated strong thermodynamic impacts even in cloud-free regions. Process diagnostics showed that water–ice and vapor–liquid phase changes dominate mean hydrometeor mass rates, while the most frequent processes involved evaporation. Cold-phase pathways consistently governed precipitation; higher CCN and INP concentrations enhanced this dominance, whereas faster graupel sedimentation weakened it. The ratio of cold- to warm-rain processes emerged as a potential diagnostic for identifying regimes in which increased aerosol loading enhances, rather than suppresses, precipitation. Comparison with operational ensembles highlighted the importance of ensemble size. The 108-member MPHYS-ENS generated the largest spread, while bootstrapped 20-member subsets approached operational ensemble system levels. This study demonstrates that cloud microphysics is a major source of forecast uncertainty in summertime convection and should be explicitly represented in ensemble design.
- Article
(11016 KB) - Full-text XML
- BibTeX
- EndNote


Predicting convective precipitation remains a significant challenge for numerical weather prediction (NWP) systems. A variety of factors contribute to the difficulty of accurately forecasting such events, including uncertainty in large-scale atmospheric patterns, errors in representing the current state of the atmosphere, and simplifications inherent in modeling key physical processes. To address these challenges, most operational forecasting agencies implement convection-permitting ensemble systems (e.g., Reinert et al., 2025; ECMWF, 2024). These systems attempt to capture uncertainties by varying initial conditions, lateral boundary conditions, and the representation of physical processes (e.g., Richard et al., 2011; Bouttier and Raynaud, 2018; Barthlott and Barrett, 2020, and references therein). Nevertheless, such ensemble approaches often lack sufficient spread (e.g., Bouttier et al., 2012; Raynaud and Bouttier, 2017), and developing effective strategies to represent the wide range of natural uncertainties remains a topic of ongoing research (Keil et al., 2019). Considering a whole summer season in central Europe, Matsunobu et al. (2024) found that the operational, convection-permitting ensemble prediction system at the German Weather Service (ICON-D2-EPS) is underdispersive in convective precipitation forecasts. The spatial spread of hourly precipitation was found to be insufficient to capture the inherent error adequately across all scales (up to 300 km) and forecast times (up to 24 h). This lack of spread becomes more pronounced in the weak synoptic forcing regime. To reduce the underdispersion of convective precipitation in convective-scale NWP models, further sources of uncertainty need to be identified. One candidate is cloud microphysics, as its nonlinear nature causes significant forecast uncertainties in both warm and cold clouds. Moreover, aerosol–cloud interactions are considered one of the most uncertain processes in forecasting deep moist convection (e.g., Tao et al., 2012; Altaratz et al., 2014; Fan et al., 2016). In addition, boundary-layer processes are also linked to aerosols, as cloud condensation nuclei (CCN) can influence the energy/radiation balance at ground level by affecting the number and size of cloud droplets and thus the optical depth of clouds (e.g., Barthlott et al., 2022a; Kulmala et al., 2023).
To investigate the role of microphysics on precipitation forecasts, many recent studies used different microphysical parameterization schemes (e.g., Luo et al., 2010; White et al., 2017; Bao et al., 2019; Jeworrek et al., 2019). For example, Chen et al. (2022) conducted microphysical perturbation experiments to investigate the sensitivity of model results to cloud microphysical parameterization and the feasibility of using a microphysical perturbation ensemble to forecast heavy rainfall due to summer-afternoon convection. Using nine different cloud microphysical parameterization schemes in the WRF model, and eleven variations in process treatments, an ensemble of 20 members for 10 summer-afternoon heavy-rain convection cases was created. These simulations revealed substantial disagreements in the location and amplitude of peak rainfall among the microphysics packages and single-scheme members. Chen et al. (2021) studied the ensemble spread generated by 4 microphysics schemes, each combined with the same initial condition perturbations for a mesoscale convective system in Taiwan. They find that although initial conditions determine the general distribution of precipitation systems, the intensity and location of convective cores are sensitive to the use of different microphysics schemes.
In this study, we follow a different approach by creating an ensemble by just perturbing microphysical parameters while using the same microphysics scheme. We aim to perturb warm- and cold-rain processes and therefore change the concentration of CCN, the shape parameter of the cloud droplet size distribution (CDSD), the concentration of ice nucleating particles (INPs), and the graupel sedimentation velocity. The first two have been shown to produce large model spread when combined with uncertainties of the soil moisture (Barthlott et al., 2022b) and initial and boundary condition uncertainties (Matsunobu et al., 2022). The inclusion of cold-rain processes is, in parts, motivated by results of idealized simulations of supercells (Wellmann et al., 2020). They found that the uncertainty in the fall velocities of graupel accounts for more than 65 % of the variance of all considered precipitation variables. Thompson et al. (2021) applied stochastic perturbations to similar parameters, with magnitudes chosen to be as realistic as possible. The impacts on hydrometeor distributions, precipitation characteristics, and solar and longwave radiation were evaluated for one winter and one summer case. Overall, the influence on upscale error growth was mainly associated with the triggering of atmospheric instabilities in convectively unstable regions and localized changes in precipitation characteristics, such as maximum hail size, were identified.
While individual perturbations of parameters have been conducted extensively in recent years, only a few have studied collective effects. In this study, we expand this line of investigation by simultaneous perturbations of warm- and cold-rain processes using a state-of-the-art operational numerical model. The combination of different sensitivities will help answer the question of whether and how different processes compensate or reinforce each other, and how great the variation in the different process pathways is. This study aims to identify critical microphysical uncertainties and investigate the potential of using microphysical perturbations in the generation of ensemble forecasts of deep moist convection over central Europe.
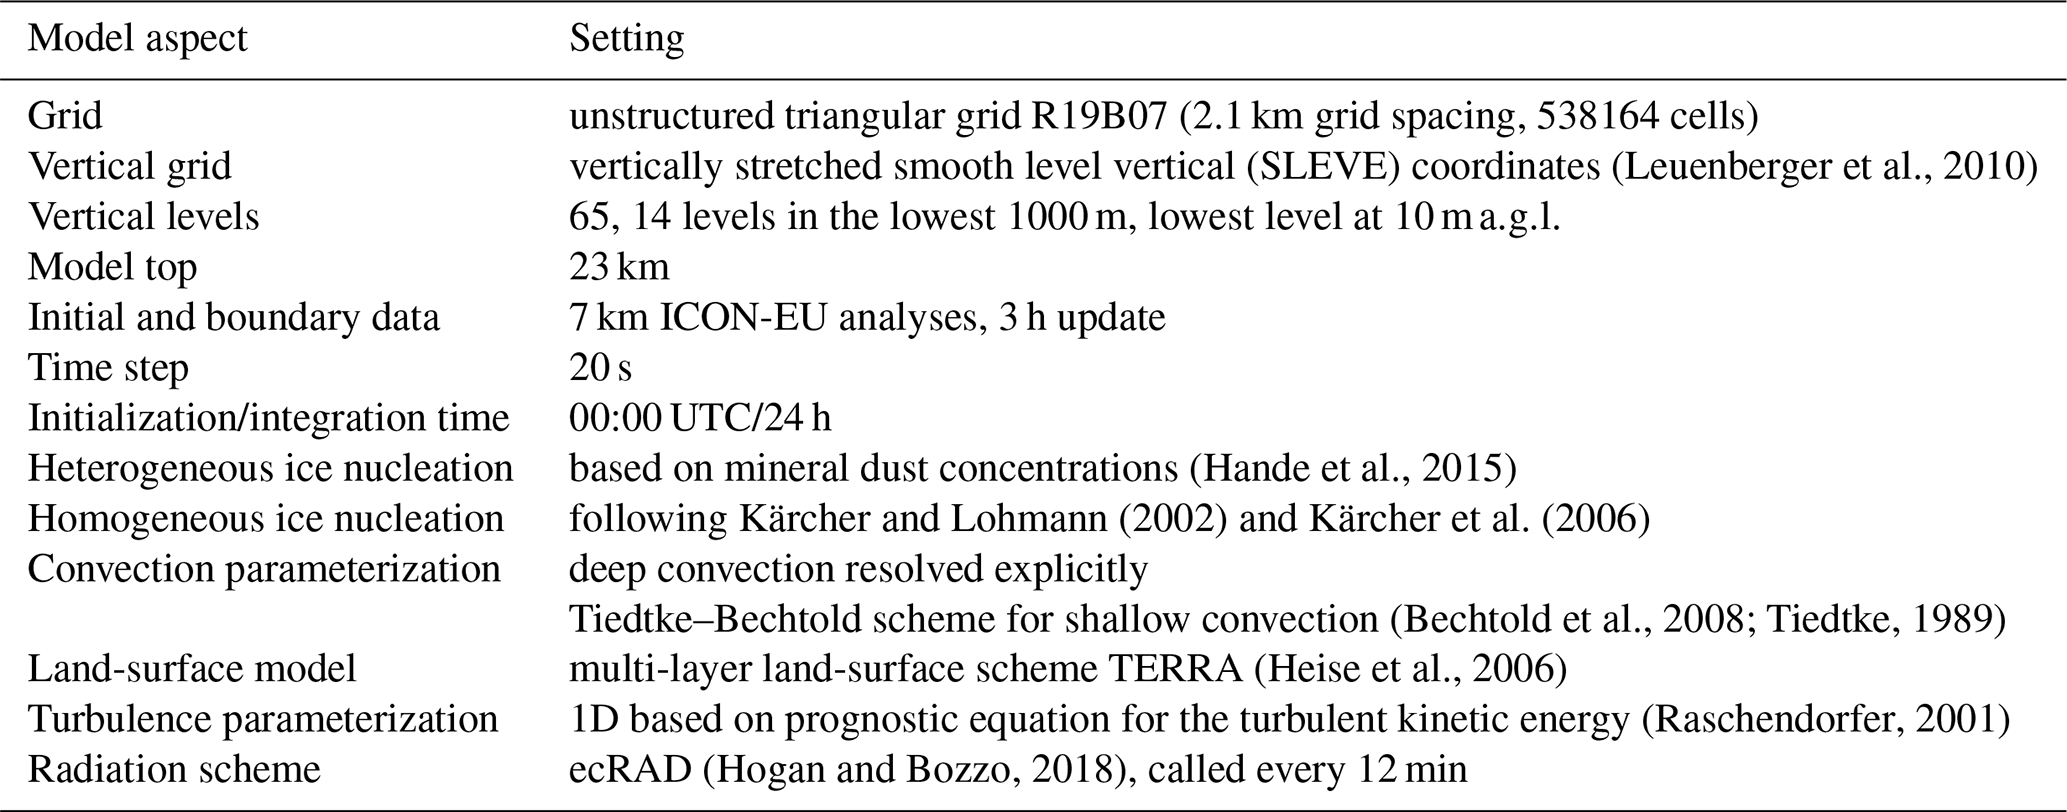
(Leuenberger et al., 2010)(Hande et al., 2015)Kärcher and Lohmann (2002)Kärcher et al. (2006)(Bechtold et al., 2008; Tiedtke, 1989)(Heise et al., 2006)(Raschendorfer, 2001)(Hogan and Bozzo, 2018)Table 1Model configuration for the ICON simulations, identical to Barthlott et al. (2022b).
2.1 Model description and simulations overview
The numerical simulations were conducted with version 2.6.6 of the ICOsahedral Non-hydrostatic (ICON) model. This fully compressible model employs an unstructured triangular grid with C-type staggering, derived from the successive refinement of a spherical icosahedron (Zängl et al., 2015). It supports both global and limited-area modes with grid-nesting capabilities. Since February 2021, the German Weather Service (DWD) has been using the convection-permitting ICON-D2 configuration, which features a horizontal grid spacing of 2.1 km, for operational forecasts over central Europe. The model domain (Fig. 1) and the horizontal and vertical resolutions used in this study align with those of the operational ICON-D2 setup. Instead of the operationally used single-moment scheme, we use a double-moment bulk microphysics scheme (Seifert and Beheng, 2006) to study aerosol effects on mixed-phase clouds and precipitation. This scheme predicts the mass and number concentrations of cloud water, rain water, ice, snow, graupel, and hail. It uses pre-calculated activation ratios stored in look-up tables (Segal and Khain, 2006) for the CCN activation of aerosol particles. To prevent generating very high ice number concentrations by CCN activation at low temperatures and immediate homogeneous freezing of the activated cloud droplets, CCN activation was restricted to temperatures above −38 °C as in Oertel et al. (2023). Additional model settings are detailed in Table 1.
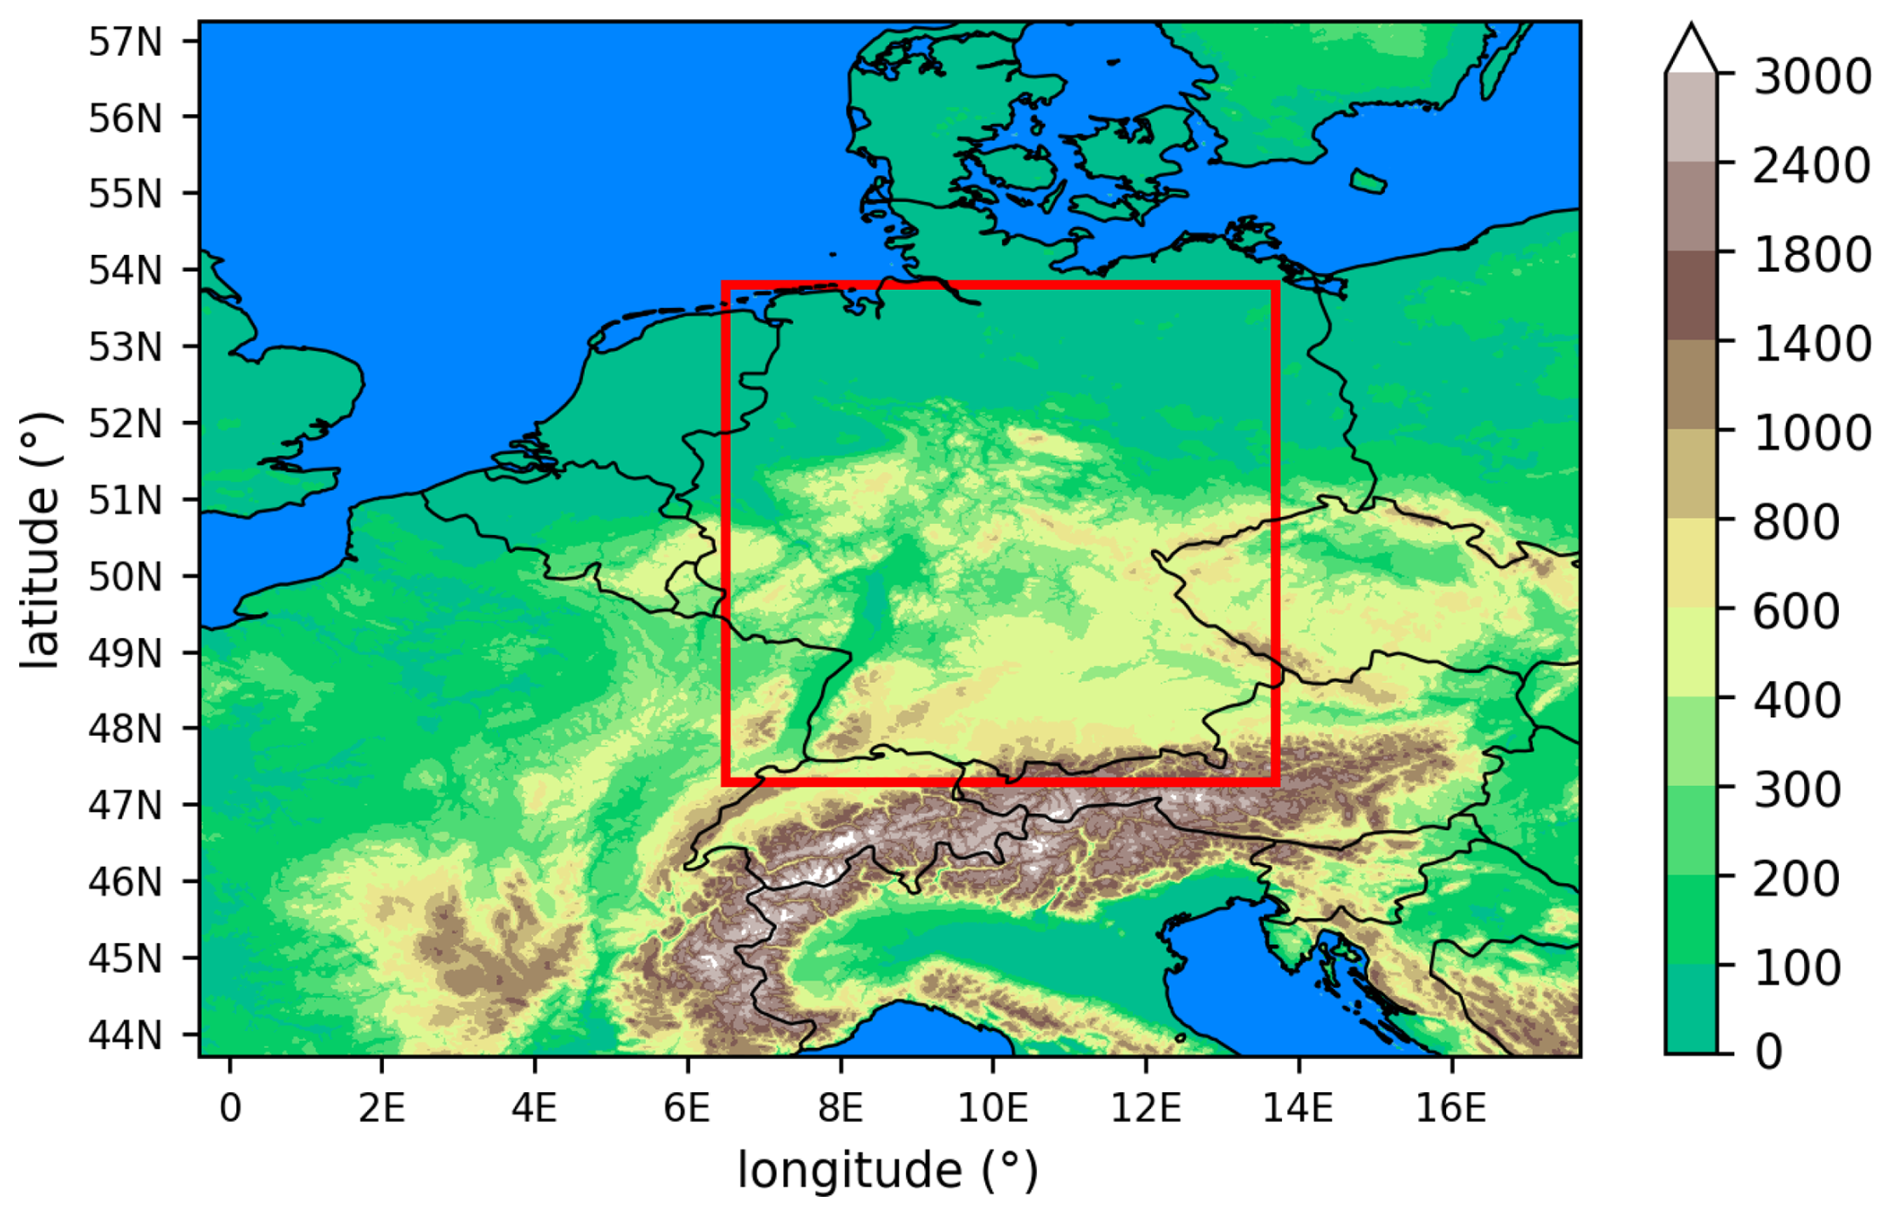
Figure 1ICON simulation domain and model orography in meters above sea level. The evaluation domain, represented by the red rectangle, encompasses the majority of Germany along with portions of neighboring countries.
2.2 Ensemble set up
In this study, we construct an ensemble entirely based on microphysical uncertainties, hereafter referred to as MPHYS-ENS. We do not consider initial and boundary condition uncertainties as all our simulations use the same initial and boundary data, i.e. 7 km ICON-EU analyses. The following four microphysical uncertainties are applied:
-
CCN uncertainty
To investigate the impact of different aerosol and CCN concentrations on precipitation, numerical simulations were conducted with 3 different number densities of condensation nuclei (NCN) representing low (NCN = 100 cm−3), high (NCN = 1700 cm−3), and very high concentrations (NCN = 3200 cm−3). Typical conditions in central Europe are represented by the high (i.e., continental) aerosol assumption (Hande et al., 2016). However, there is considerable uncertainty regarding aerosol number concentrations, as there are few in situ observations or routine measurements of aerosols in three-dimensional space (Thompson et al., 2021). As aerosols can be highly variable in central Europe (see e.g., Copernicus Atmosphere Monitoring Service (CAMS) forecasted aerosols), assuming different CCN concentrations seems to be a suitable perturbation parameter for the model. Furthermore, previous studies have demonstrated a relatively large impact of CCN on domain-averaged total precipitation amounts (e.g. Barthlott et al., 2022a, b), and it could even be crucial in determining whether a supercell storm forms in the model or not (Barthlott et al., 2024).
-
INP uncertainty
INP concentrations can vary across multiple orders of magnitude (Hoose and Möhler, 2012), and observations as well as simulations showed that ice nucleating particles (INPs) impact deep convective cloud properties (e.g. Fan et al., 2016; Han et al., 2023). Moreover, there are substantial uncertainties related to the poorly understood sources, concentration, seasonal cycles, and nature of INPs (Murray et al., 2021). In the ICON model, heterogeneous ice nucleation (including the immersion and deposition modes) is calculated as a function of the temperature-dependent and ice-supersaturation-dependent INP concentration. The INP concentration depends on the ambient temperature and fitting constants with different values for representing seasonally varying dust INP concentrations (Hande et al., 2015; Han et al., 2023). We use the summertime values for the reference run and scale the INP concentration by factors of 0.1 and 10. These factors are also used to scale the heterogeneous freezing of rain droplets.
-
Graupel sedimentation uncertainty
Numerous studies have investigated the influence of graupel terminal velocity on precipitation development. For instance, Tao et al. (2009) reported that reducing graupel fall speed lowered total precipitation and postponed its onset, while Li et al. (2022) observed that faster graupel descent enhanced the conversion of ice particles to rain, thereby increasing peak rainfall. A recent work by Yin et al. (2024) demonstrated that modified terminal graupel velocities and CCN concentrations more accurately captured the spatial distribution and temporal evolution of an extremely heavy precipitation event. The analysis showed that the modified scheme predicted stronger accretion rates of cloud droplets by rain and weaker autoconversion rates of cloud droplets, resulting in a high mixing ratio, low number concentration, and large mean mass diameter of raindrops.
In ICON, the fall velocities of precipitating hydrometeors are determined by empirical equations using the respective particle sizes. To include this type of uncertainty in our ensemble, we scale the fall velocity of graupel with factors of 0.3 and 1.7, respectively. This uncertainty range was used because a spread of about 70 % around the mean has been found in observations (Yuter et al., 2006; Knight and Heymsfield, 1983). The same range was also used by Wellmann et al. (2020) in idealized simulations of deep convective clouds. The fall velocity is important for the microphysics as it affects collision processes such as accretion and riming, and the time a sedimenting particle is exposed to melting and evaporation below the freezing level.
-
Shape parameter uncertainty
The fourth perturbation consists of different widths of the cloud droplet size distribution (CDSD). In the ICON model, the size distribution follows a generalized Gamma distribution, expressed as:
This distribution is influenced by the shape parameter ν and the dispersion parameter μ, which vary with particle mass x. Using the predicted mass and number densities, the intercept parameter A and slope (or scale) parameter λ can be determined (Seifert and Beheng, 2006). Several microphysical processes are directly dependent on the shape parameter (e.g., autoconversion, self-collection) or indirectly (e.g., melting, evaporation, accretion, riming, sedimentation), which can significantly affect the simulated precipitation totals (Barthlott et al., 2022a). The width of the CDSD is not precisely determined by observations, yet it plays a crucial role in accurately predicting condensation and evaporation rates (Igel and van den Heever, 2017). Previous observational studies have demonstrated a wide range of shape parameter values for distributions as a function of droplet diameter D, varying from 0 to 14, depending on cloud type and environmental conditions (e.g. Levin, 1958; Gossard, 1994; Miles et al., 2000; Martins and Silva Dias, 2009). The shape parameter ν′ for distributions as function of diameter f(D) can be calculated by (Khain et al., 2015). In the reference cloud particle class of the ICON model, both the shape and dispersion parameters are set to 1. In this study, we vary the shape parameter ν to values of 0, 1, 2, and 4, corresponding to the observational uncertainty of . To demonstrate the effect of the shape parameter on the width of the CDSD, Fig. 2 presents example size distributions as a function of particle diameter D for various shape parameters. It is evident that larger shape parameters narrow the size distribution and shift the peak to larger droplet sizes. A notable feature is that higher shape parameters result in fewer small and large droplets, leading to a smaller effective radius, which impacts the optical properties of clouds.
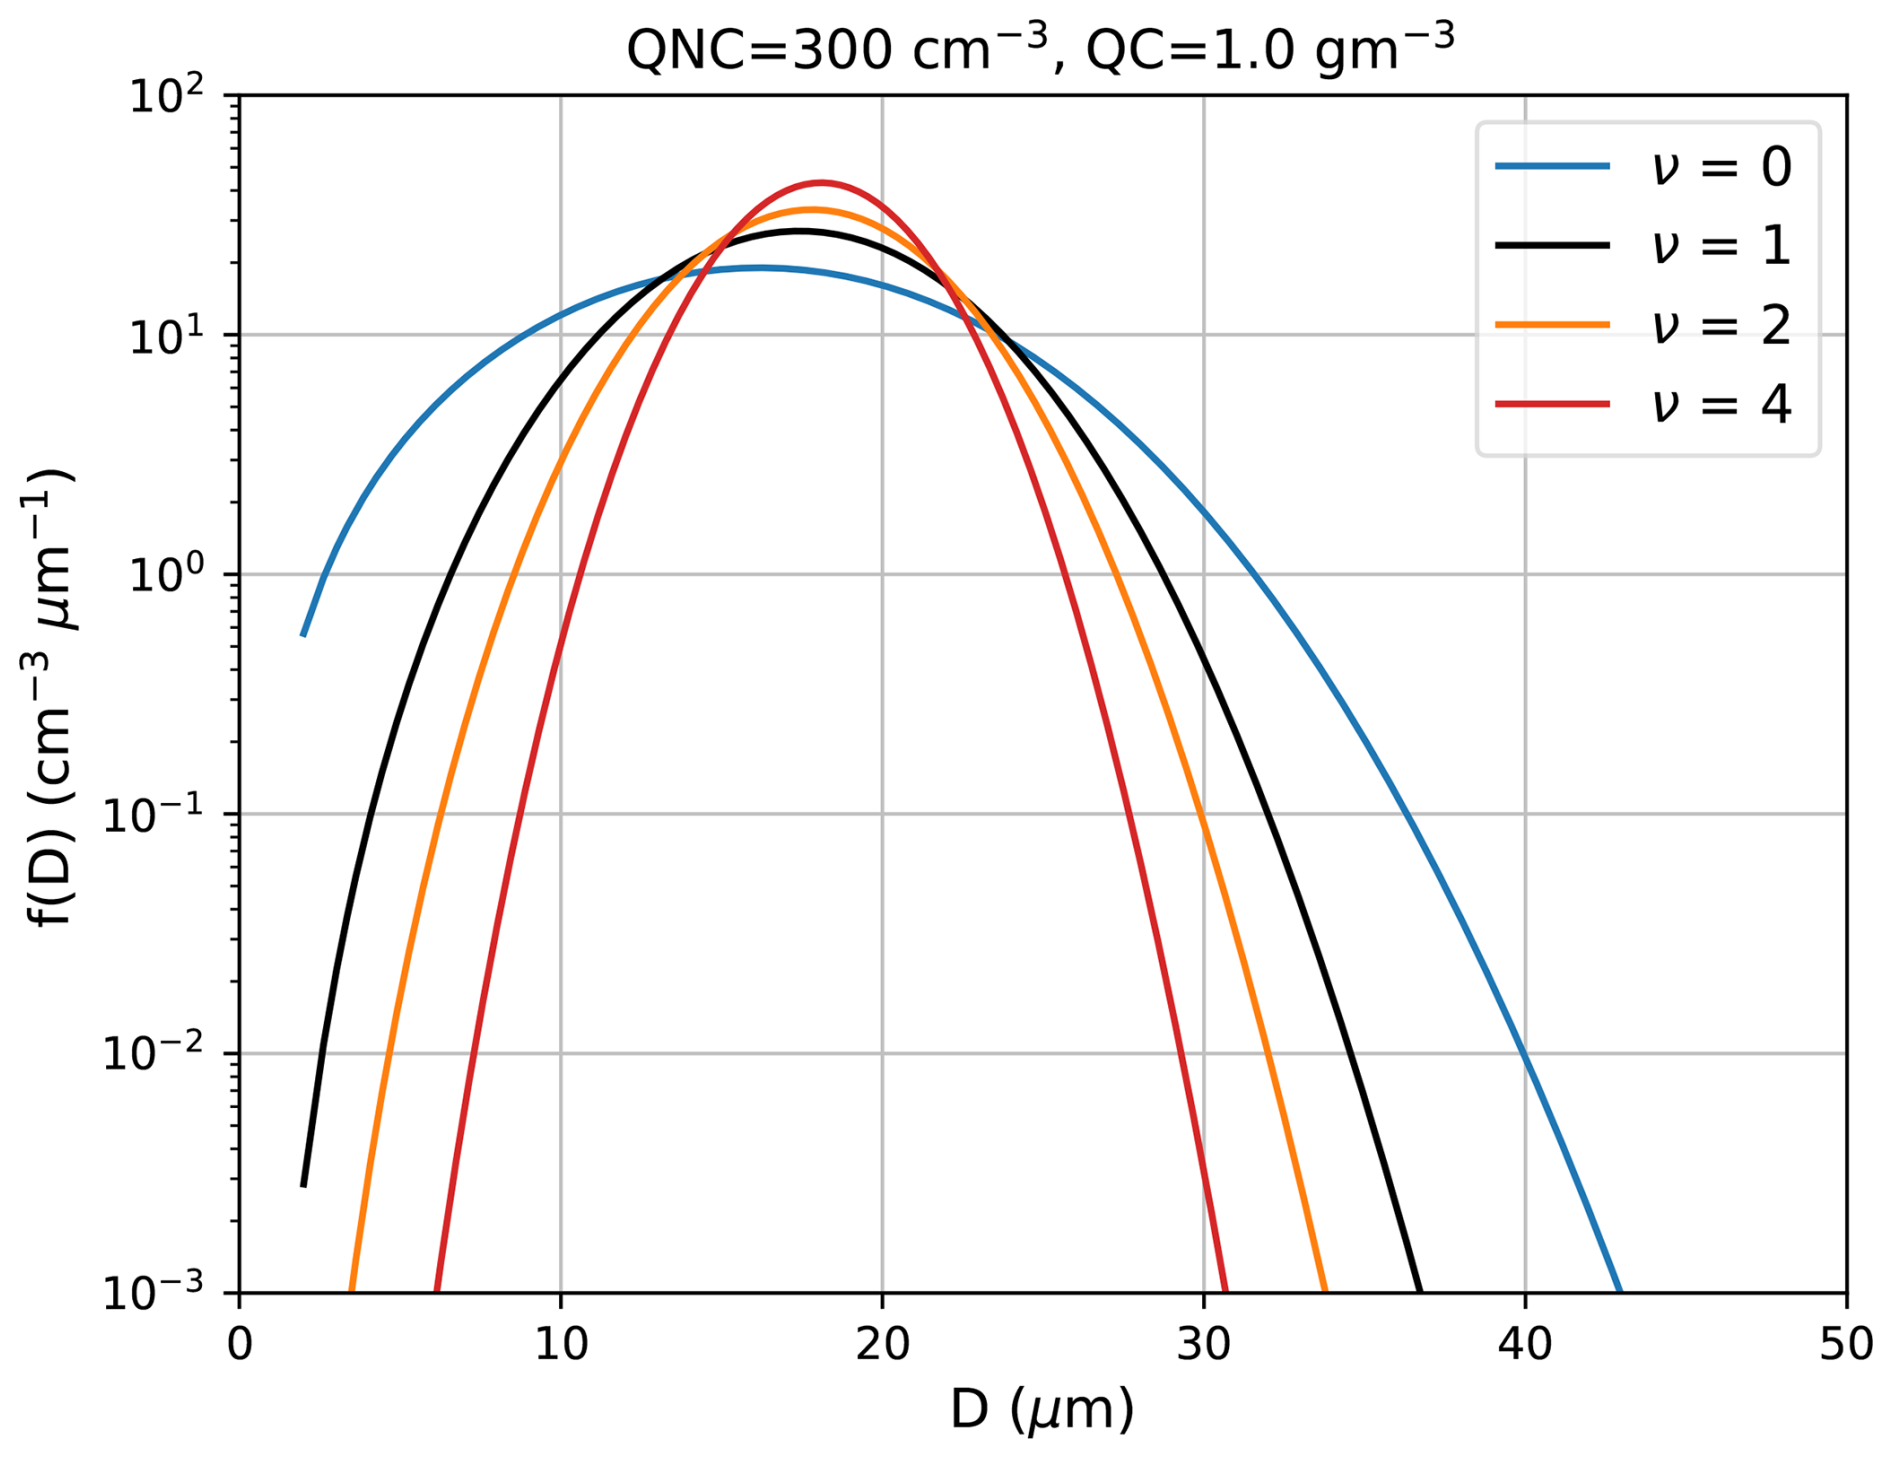
Figure 2Cloud droplet size distributions for different shape parameter values ν at fixed cloud water content and cloud droplet number concentration.
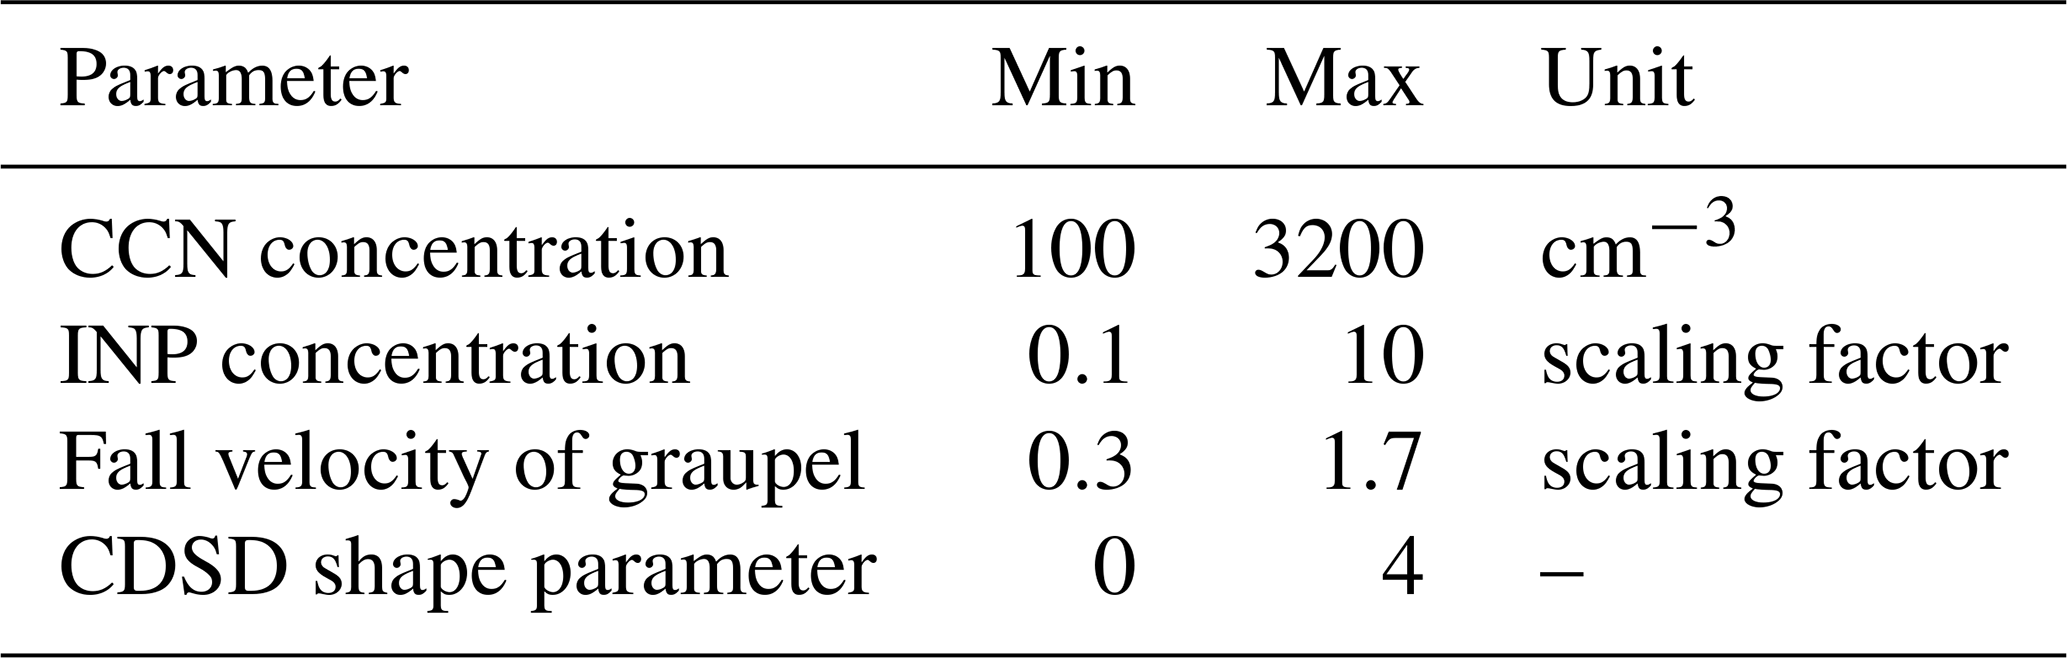
Table 2 summarizes the parameters and their uncertainty ranges that we apply for generating the microphysical ensemble. Using three different CCN concentrations, 3 INP concentrations, 3 scalings of the graupel sedimentation velocity, and 4 different shape parameter values, we end up with a large ensemble size of 108 members. The simultaneous perturbation of these parameters allows us to investigate whether and how they interact synergistically and what collective effects they have on simulated convection and convective-scale predictability.
Table 2Overview of uncertain input parameters and their ranges used for the microphysical 108-member ensemble.
2.3 Ensemble setup at DWD
Since February 2021, the convection-permitting ensemble prediction system ICON-D2-EPS (Reinert et al., 2025) has been used operationally at the DWD as successor of the COSMO-D2-EPS and thereby continuing the sequence of operational ensembles on the convective scale, which started in May 2012 with the COSMO-DE-EPS. Forecast variability in the global ICON-EPS and ICON-EU-EPS systems is achieved through 40-member initial condition (IC) perturbations, generated via ensemble data assimilation with a 3 h assimilation cycle. Currently, the operational ICON-D2-EPS consists of 20 members. Initial condition uncertainty is considered by selecting the first 20 members of the hourly Kilometer-Scale Ensemble Data Assimilation KENDA (Schraff et al., 2016), which is a Local Ensemble Transform Kalman Filter. In contrast, the perturbation of boundary conditions is implemented using forecast members of ICON-EU-EPS from the run 3 h before the ICON-D2-EPS initialization. Additionally, variability is introduced through ensemble physics perturbations, where a pre-defined fixed selection of tuning parameter perturbations is randomly assigned to each ensemble member at each new forecast start and remains consistent throughout the forecast lead time. In a statistical sense, considering many forecast starts, each of the affected parameters is perturbed in 50 % of the members in each forecast run. The physics perturbation comprises 19 parameters in total, which cover, e.g., the low-level wake drag constant, the critical Froude number in the subgrid-scale orography scheme, the entrainment parameter in the convection scheme, or a minimum vertical diffusion for heat, moisture, and momentum. However, these perturbations do not cover parameters and properties of the double-moment physics scheme, which is employed in MPHYS-ENS.
Summarizing, the operational set-up differs from MPHYS-ENS in the coverage of sources of forecast uncertainties, i.e., the ICON-D2-EPS has initial and boundary conditions perturbed, leading to forecast variability right from the forecast start, already without physics perturbations. However, the MPHYS-ENS covers more comprehensively the aspects of model error in microphysical processes by perturbing parameters of the double-moment microphysics, which are not available in ICON-D2-EPS. Moreover, MPHYS-ENS covers all combinations of its microphysics parameter perturbations in its 108 members. Apart from the perturbation approach, the MPHYS-ENS configuration at KIT (see Sect. 2.1) uses the same model domain and grid, the same time step, and mostly the same physical parameterizations. Whereas the operational configuration uses a tuned version of the convection scheme that bridges the gap between parameterized and resolved convection (so-called grayzone-tuned version), our configuration uses a scheme for shallow convection only (see Table 1). In addition, heterogeneous ice nucleation is parameterized operationally using the Phillips et al. (2008) scheme.
Even though there is already valuable information about the potential of MPHYS-ENS to quantify forecast uncertainty only by its perturbed microphysics in comparison to the operational ICON-D2-EPS, we would like to allow for a comparison focusing better on the significance of microphysical processes by using an EPS, which emphasizes the differences between MPHYS-ENS and ICON-D2-EPS mostly in the aspect of physics perturbations. For this purpose, we set up the ensemble ICON-D2-2MOM, which uses no initial and boundary condition perturbations but the double-moment microphysics like the MPHYS-ENS, and perturbs physics identical to the operational ICON-D2-EPS without perturbing the parameters of MPHYS-ENS. ICON-D2-2MOM has 20 members like ICON-D2-EPS and will be compared to the full 108 as well as 20-member subsets of MPHYS-ENS in Sect. 3.6.
Table 3 summarizes the ensemble strategies used for the investigated cases.
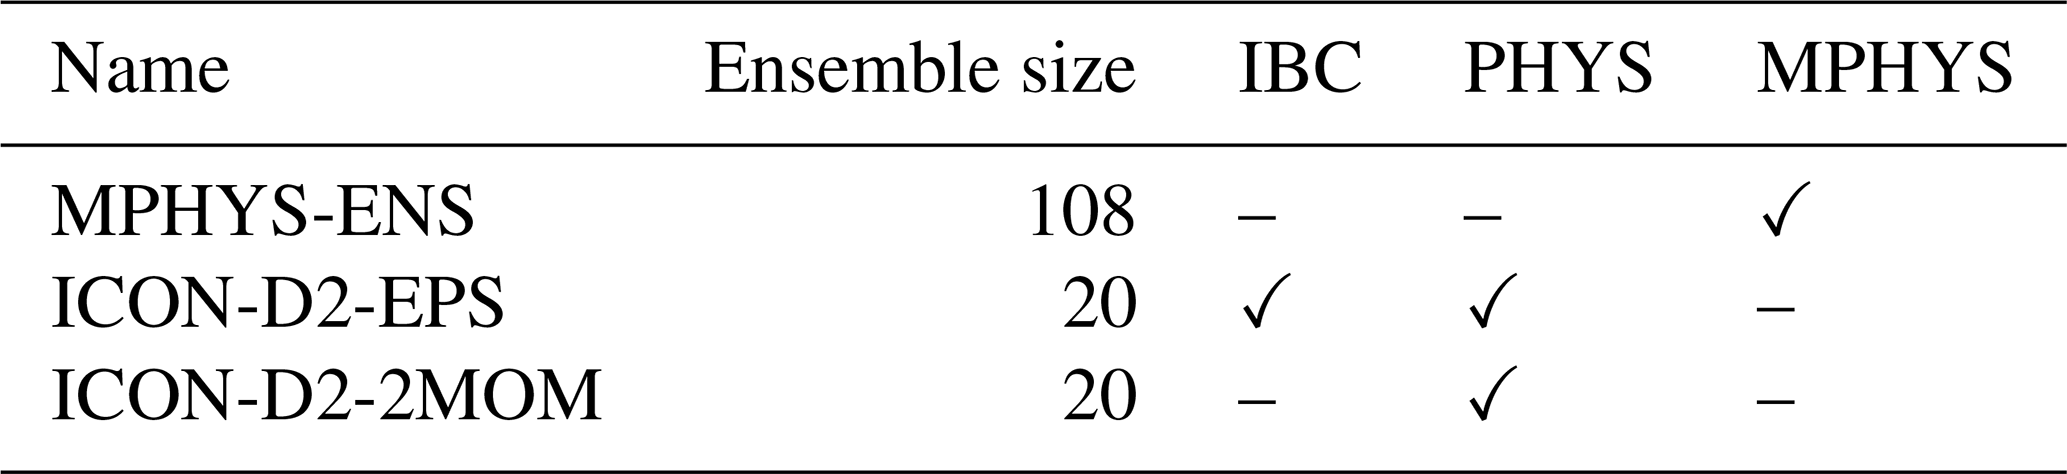
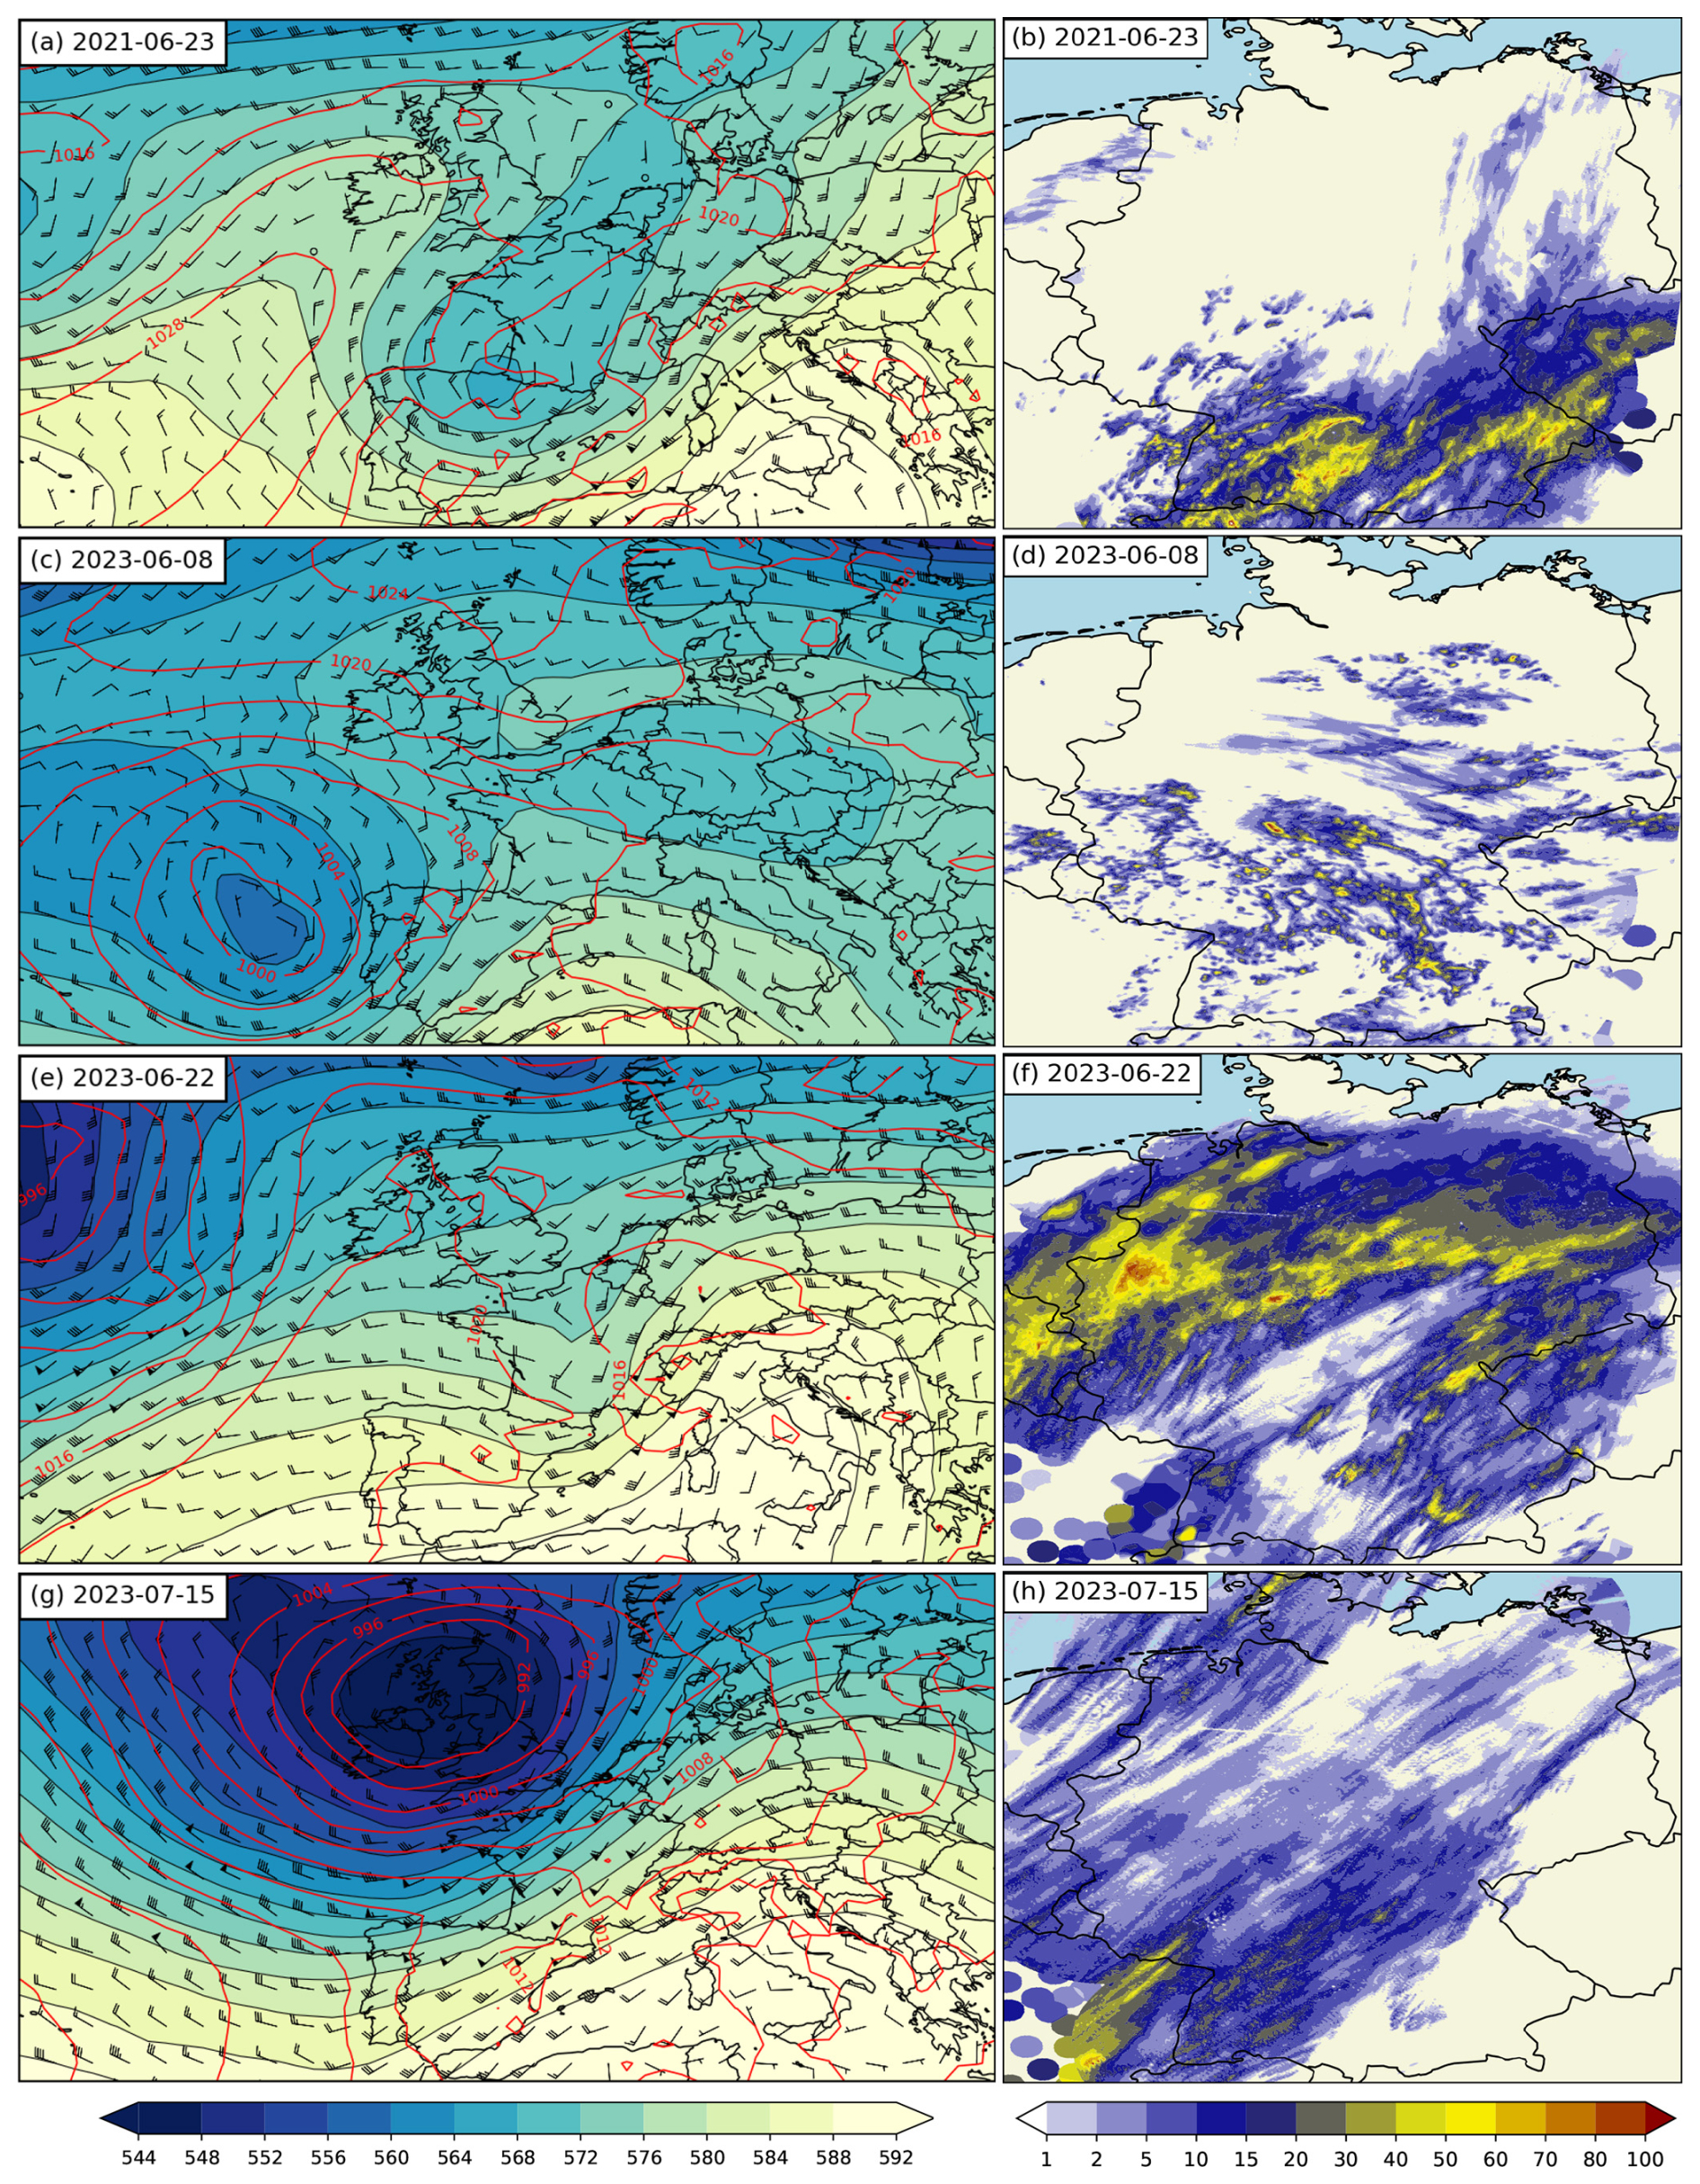
Figure 3(a, c, e, and g) Global Forecast System (GFS) analysis at 12:00 UTC on all days showing 500 hPa geopotential height (gpdm; shading), sea-level pressure (hPa, red contours), and 500 hPa wind barbs. (b, d, f,and h) Radar-derived 24 h precipitation amount in mm from RADOLAN (Radar Online Adjustment).
2.4 Analyzed cases
In this study, we investigate convective-scale predictability with numerical simulations of 4 d from the Swabian MOSES 2021 (Kunz et al., 2022) and 2023 (Handwerker et al., 2025) field campaigns. Both campaigns were dedicated to hydro-meteorological extremes, i.e., convective storms with strong winds, heavy rainfall, hail, and large-scale heat waves. The observation area was located in southwestern Germany and parts of neighboring countries where previous campaigns on deep convection above complex terrain took place (e.g. Groenemeijer et al., 2009; Richard et al., 2011). We simulate one day from 2021 (23 June) and 3 d from 2023: 8 June, 22 June, and 15 July. The 4 cases analyzed here represent a variety of convective scenarios in central Europe. They include single cells, multicells, supercells, and larger convective clusters in weather regimes with different strengths of synoptic forcing. We therefore believe that the case selection is representative of summertime convective situations in that area. Two of these cases (23 June 2021, 22 June 2023) were also examined with 1 km grid spacing under pseudo-global warming conditions by Lucas et al. (2025).
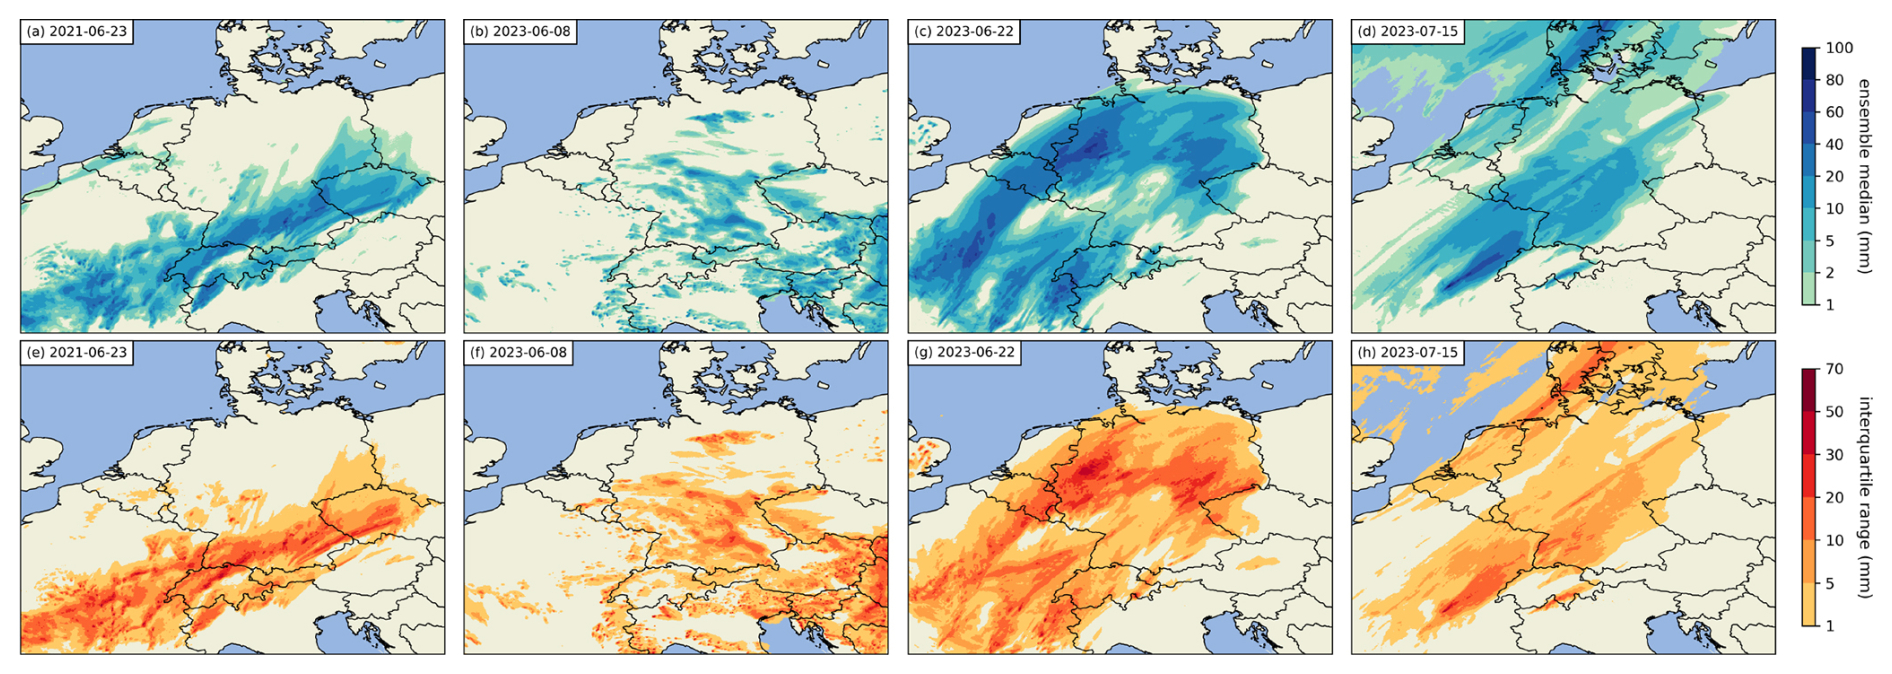
Figure 4Spatial distribution of 24 h precipitation forecasts from the 108-member ensemble over Central Europe. (a–d) show the ensemble median of daily accumulated precipitation, (e–h) the corresponding interquartile range IQR within the ensemble.
2.4.1 Case 1: 23 June 2021
On 23 June 2021, a weakening trough extended from southern Scandinavia to southern Spain (Fig. 3a). A shortwave trough moved along its eastern edge throughout the day, reaching Germany by early afternoon. This, combined with an increase in mean-layer convective available potential energy (CAPE) to about 950 J kg−1 over southwestern Germany around midday, triggered deep convection. The mid-tropospheric winds over Germany were moderately strong and predominantly from the southwest. At the surface, a large high-pressure system over the North Atlantic extended across western Europe to northern Germany. Observed precipitation is given by the precipitation analysis algorithm Radar Online Adjustment RADOLAN (Bartels, 2004), which combines weather radar data with hourly surface precipitation observations of about 1300 automated rain gauges to get quality-controlled, high-resolution (1 km) quantitative precipitation estimates. Deep convection was located mainly over southern Germany (Fig. 3b). A supercell storm was initiated over the southern Black Forest and passed directly over several observational sites (Barthlott et al., 2024).
2.4.2 Case 2: 8 June 2023
On this day, a low-pressure system was present west of the Iberian Peninsula (Fig. 3c). In a region of high surface pressure over central Europe, an upper tropospheric cold low resulted in large-scale forcing over Germany. Supported by heating from insolation and CAPE values around 1500 J kg−1 with only weak shear, single and multicells with locally heavy showers developed in large parts of Germany during the day (Fig. 3d).
2.4.3 Case 3: 22 June 2023
A severe thunderstorm situation was present on that day as a ridge extended from the western Mediterranean area towards eastern Europe (Fig. 3e). A well-defined short-wave trough was located over France. Strong diffluence and positive vorticity advection resulted in large-scale lifting at its leading edge. The air mass was extremely unstable with CAPE values ranging between 2000 and 3000 J kg−1. The strong 500 hPa winds up to 50 kn resulted in a strong shear, which led in combination with a warm and humid air mass (precipitable water ∼ 40 mm) to optimal conditions for severe convection. Large convective clusters and supercells developed mainly over northern Germany, but deep convection also developed over southern and southeastern Germany (Fig. 3f).
2.4.4 Case 4: 15 July 2023
On 15 June 2023, Germany was situated at the diffluent leading edge of a long-wave trough stretching from the British Isles towards the Bay of Biscay (Fig. 3g). The southwesterly flow brought warm and increasingly moist air towards central Europe. Showers were initiated in western and northern Germany due to large-scale lifting (Fig. 3h). In the afternoon and evening, widespread showers occurred associated with the passage of a cold front.
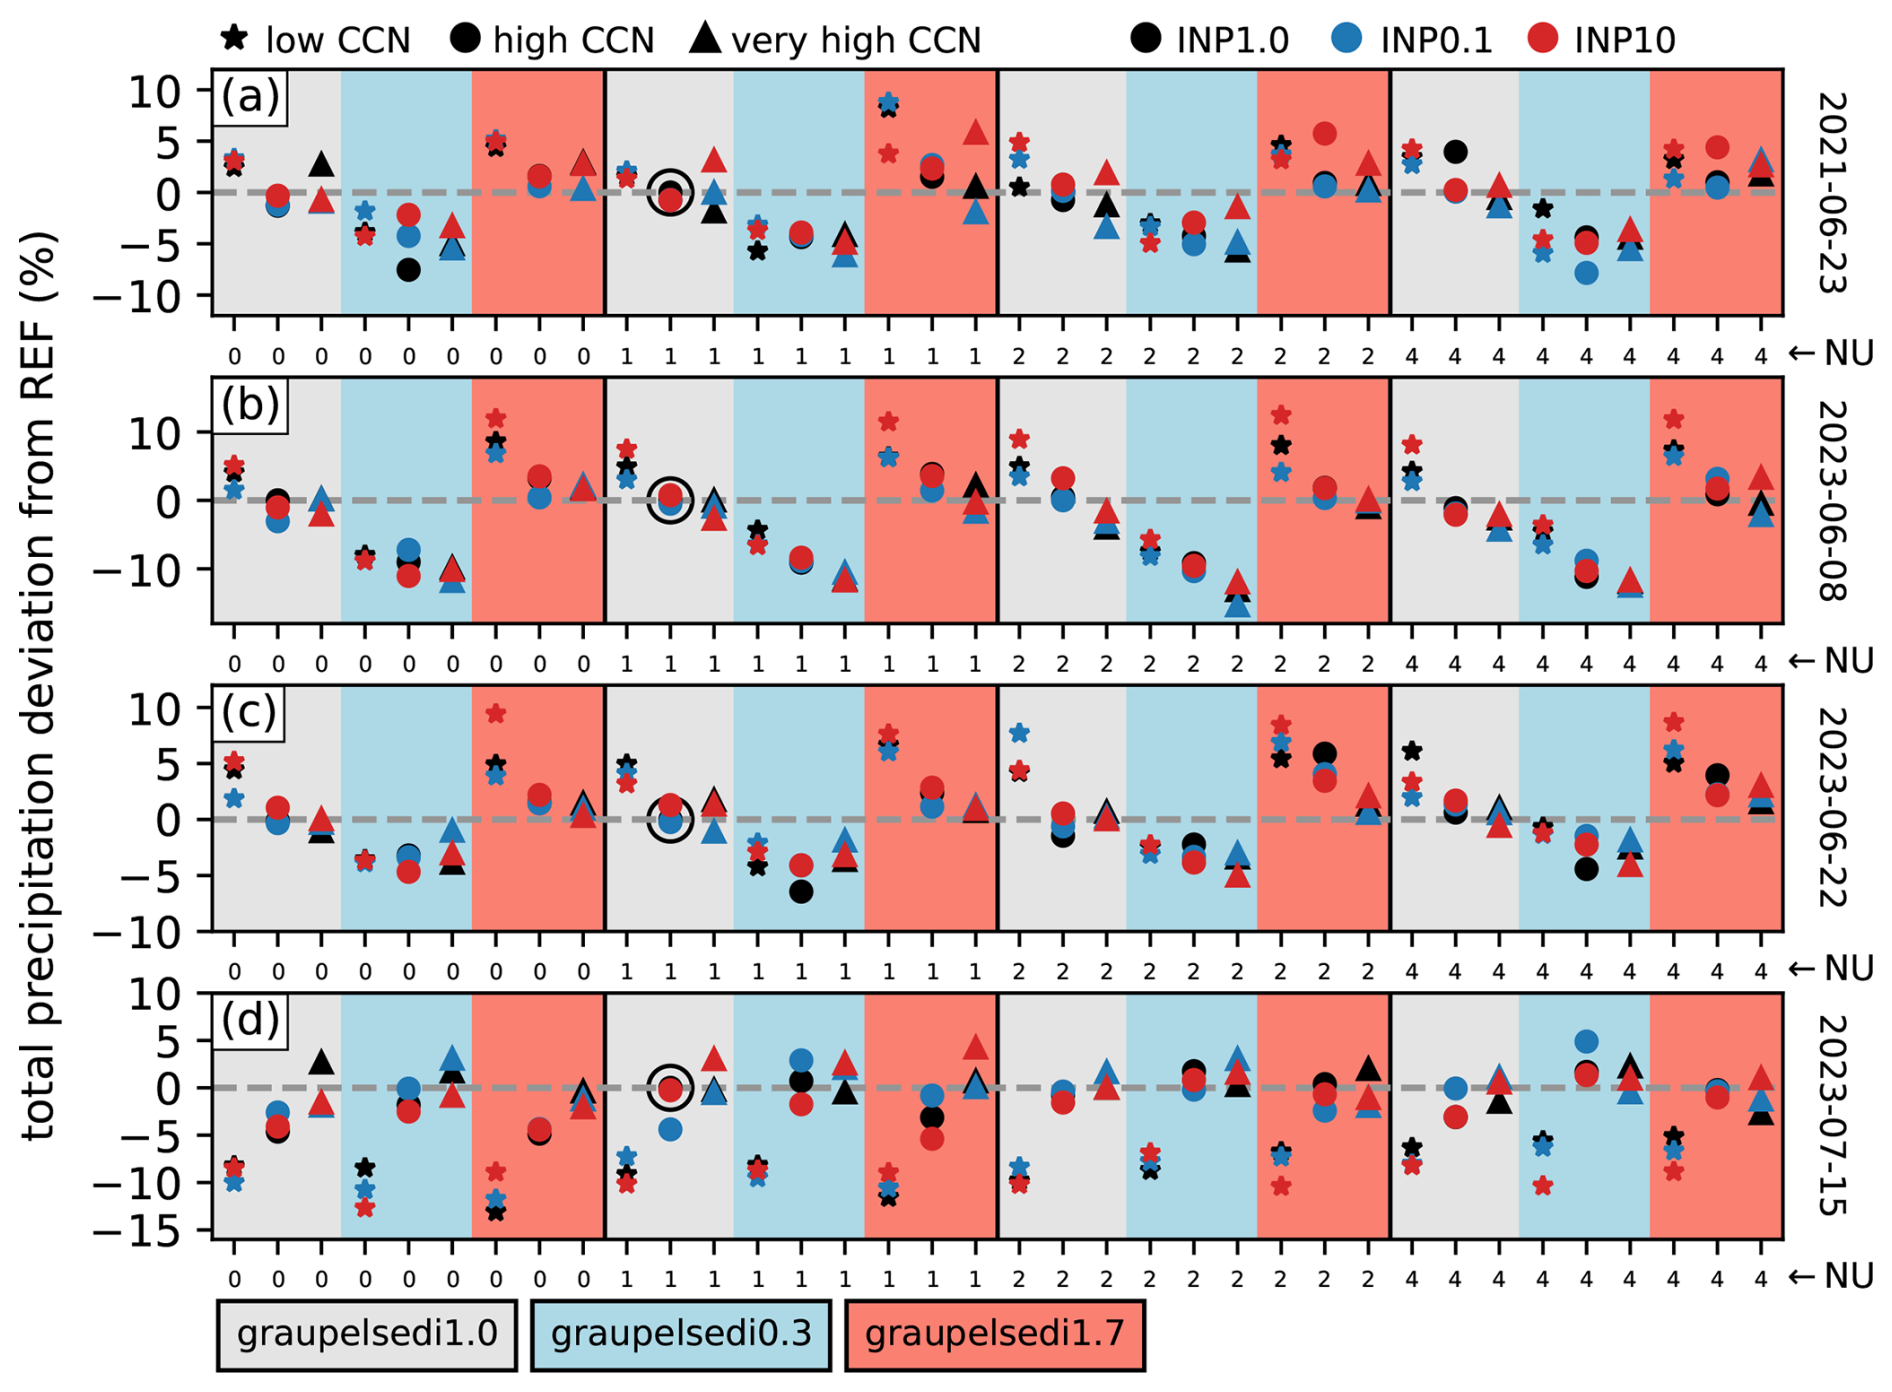
Figure 5Precipitation deviation from the respective reference run (marked with a black circle). Data points are arranged in 4 blocks with different shape parameter values (NU) from 0 to 4, each of which is divided into 3 blocks with reference (gray background), decreased (blue background), and increased (red background) graupel sedimentation. The points within each graupel sedimentation block indicate different CCN concentrations (marker type) and INP concentrations (marker colors).
3.1 Spatial precipitation variability
We start the analysis of the microphysical ensemble by investigating the spatial variability of 24 h accumulated precipitation amounts. Accumulated precipitation amounts exhibit a large spatial variability of the individual location and intensity of the convective cells (not shown). To assess this spatial variability quantitatively, we computed the median and the interquartile range (IQR, representing the spread between the 25th and 75th percentiles) of the ensemble for each analyzed day (Fig. 4). The characteristics of the different convective scenarios on these days are generally well simulated by the ICON model, i.e., the location of precipitation and sizes of convective areas generally agree with the observed precipitation (see radar-derived total precipitation in Fig. 3). The median panels indicate coherent precipitation patterns with very high values up to 100 mm for almost all cases, indicating the strong convective activity simulated by the model. The IQR maps in the lower row reveal a substantial spatial variability across the domain, highlighting regions of enhanced forecast uncertainty. High IQR values exceeding 30 mm in some locations indicate considerable disagreement among ensemble members. Regions of high IQR are, however, not located at topographic boundaries or regions with different land-use, which reflects the fact that surface heterogeneities do not control the spread in the microphysical ensemble. This spatial heterogeneity is particularly pronounced in cases 1–3, for which the synoptic-scale forcing was low to moderate. Case 4 with stronger synoptic-scale forcing and weaker rain intensities generally shows a smaller, but still large, ensemble spread. The large spread in the spatial precipitation distribution solely introduced by microphysical perturbations is remarkable and nicely exemplifies the heteroscedastic nature of precipitation forecasts, linking high values of mean precipitation to high forecast uncertainty and hence variability between ensemble members. All this underlines the importance of probabilistic forecasts in capturing the full range of possible precipitation outcomes and the importance of accounting for as many of the relevant sources of uncertainty in the ensemble generation, particularly during high-impact weather events.
3.2 Rain amounts and timing
To analyze how precipitation amounts respond to the perturbations introduced in this study, we calculated the total precipitation integrated over the evaluation domain shown in Fig. 1. The percentage deviations of each of the 108 ensemble members generally show large numbers of −15 % and +12 % (Fig. 5) compared to the corresponding reference run. When taking the respective minimum precipitation amount as a reference, the percentage increases to the maxima are considerable: We find a 18 %, 17 %, 33 %, and 21 % increase on cases 1–4, respectively. As already reported for other summertime convective events in previous studies (Barthlott et al., 2022a, b), we find a mostly negative aerosol effect (i.e., a monotonic decrease between low and very high CCN) on total precipitation amounts for the first 3 cases (Fig. 5a–c). For case 4 (15 July 2023), however, we find a mostly systematic positive aerosol effect on total precipitation amounts. The precipitation reduction with increasing CCN concentrations is most probably related to a reduced warm-rain process (autoconversion and accretion) for larger aerosol loads, where smaller droplet sizes result in a weaker collision–coalescence process. The increase for the last case could be due to either warm-phase (i.e., condensational or water-phase invigoration, e.g., Fan et al., 2018) or cold-phase invigoration (e.g., Rosenfeld et al., 2008). This will be investigated later on by the analysis of microphysical process rates. On days with a dominating negative aerosol effect, the largest precipitation amounts are simulated for low CCN concentration and increased graupel sedimentation. In contrast, the largest precipitation amounts for the day with a positive aerosol effect are simulated mostly for reduced graupel sedimentation and very high CCN concentration. Only for the reference shape parameter of 1, the maximum precipitation amount is simulated for increased graupel sedimentation for this case study. Possibly, the mixed-phase riming growth of ice hydrometeors is also impacted by aerosol-induced changes to the cloud droplet size distribution and the different assumptions of the shape parameter. The efficiency with which cloud droplets contribute to the riming growth of ice hydrometeors can be substantially reduced if the droplet size is reduced, consequently inhibiting ice growth (Lowenthal et al., 2011). The influence of a higher number of smaller cloud droplets on riming, either enhancing or hindering it, depends on both the droplet size and their concentration. In a high aerosol scenario, if the droplet sizes are not reduced substantially enough to offset the greater number of droplets contributing positively to the collection rate between ice hydrometeors and cloud droplets, then greater riming and ice production can result (e.g., Saleeby et al., 2025). At very high aerosol concentrations, however, a tipping point towards reduced riming may be reached (e.g. Barrett and Hoose, 2023). A higher graupel fall velocity is expected to enhance the riming growth of ice hydrometeors, affecting total precipitation either in solid or melted form. If the size of cloud droplets is reduced either by higher CCN concentrations or larger shape parameters, the increased riming growth due to higher graupel fall velocities may be overcompensated by the reduced riming efficiency associated with smaller cloud droplets. On the other hand, the increased fall velocity could also reduce the time during which riming can be active and thus reduce ice growth. In our study, the riming of graupel and hail with cloud droplets is two orders of magnitude higher than for snow and ice and therefore dominates the cloud-droplet riming growth of ice hydrometeors. For all cases, we find a systematic decrease in riming with increasing CCN concentrations. However, increasing the shape parameter usually leads to a systematic increase in riming: under clean conditions, riming increases by 14 %–28 %, while under polluted conditions, the increase is slightly lower, at between 7 %–15 %. The narrowing of the cloud droplet size distribution reduces the number of larger and smaller cloud droplets, but the higher occurrence of mid-sized cloud droplets (see Fig. 2) seems to compensate for the reduction at larger droplet sizes.
It is also evident from Fig. 5 that the CCN concentration and the graupel sedimentation impact the results most. To quantify that, we computed the mean total precipitation deviation for varying each uncertain parameter while keeping the other parameters constant (Fig. 6). The graupel sedimentation has the largest impact on precipitation changes, followed by the CCN concentration in the first three cases, whereas the CCN concentration dominates precipitation change on the last day on which the positive aerosol effect on total precipitation amount was simulated. The INP concentration has the smallest impact on precipitation totals for all cases. The shape parameter has a stronger impact on the results than the INP concentration in all cases. On the last day (15 July 2023), it is even the parameter with the second strongest influence.
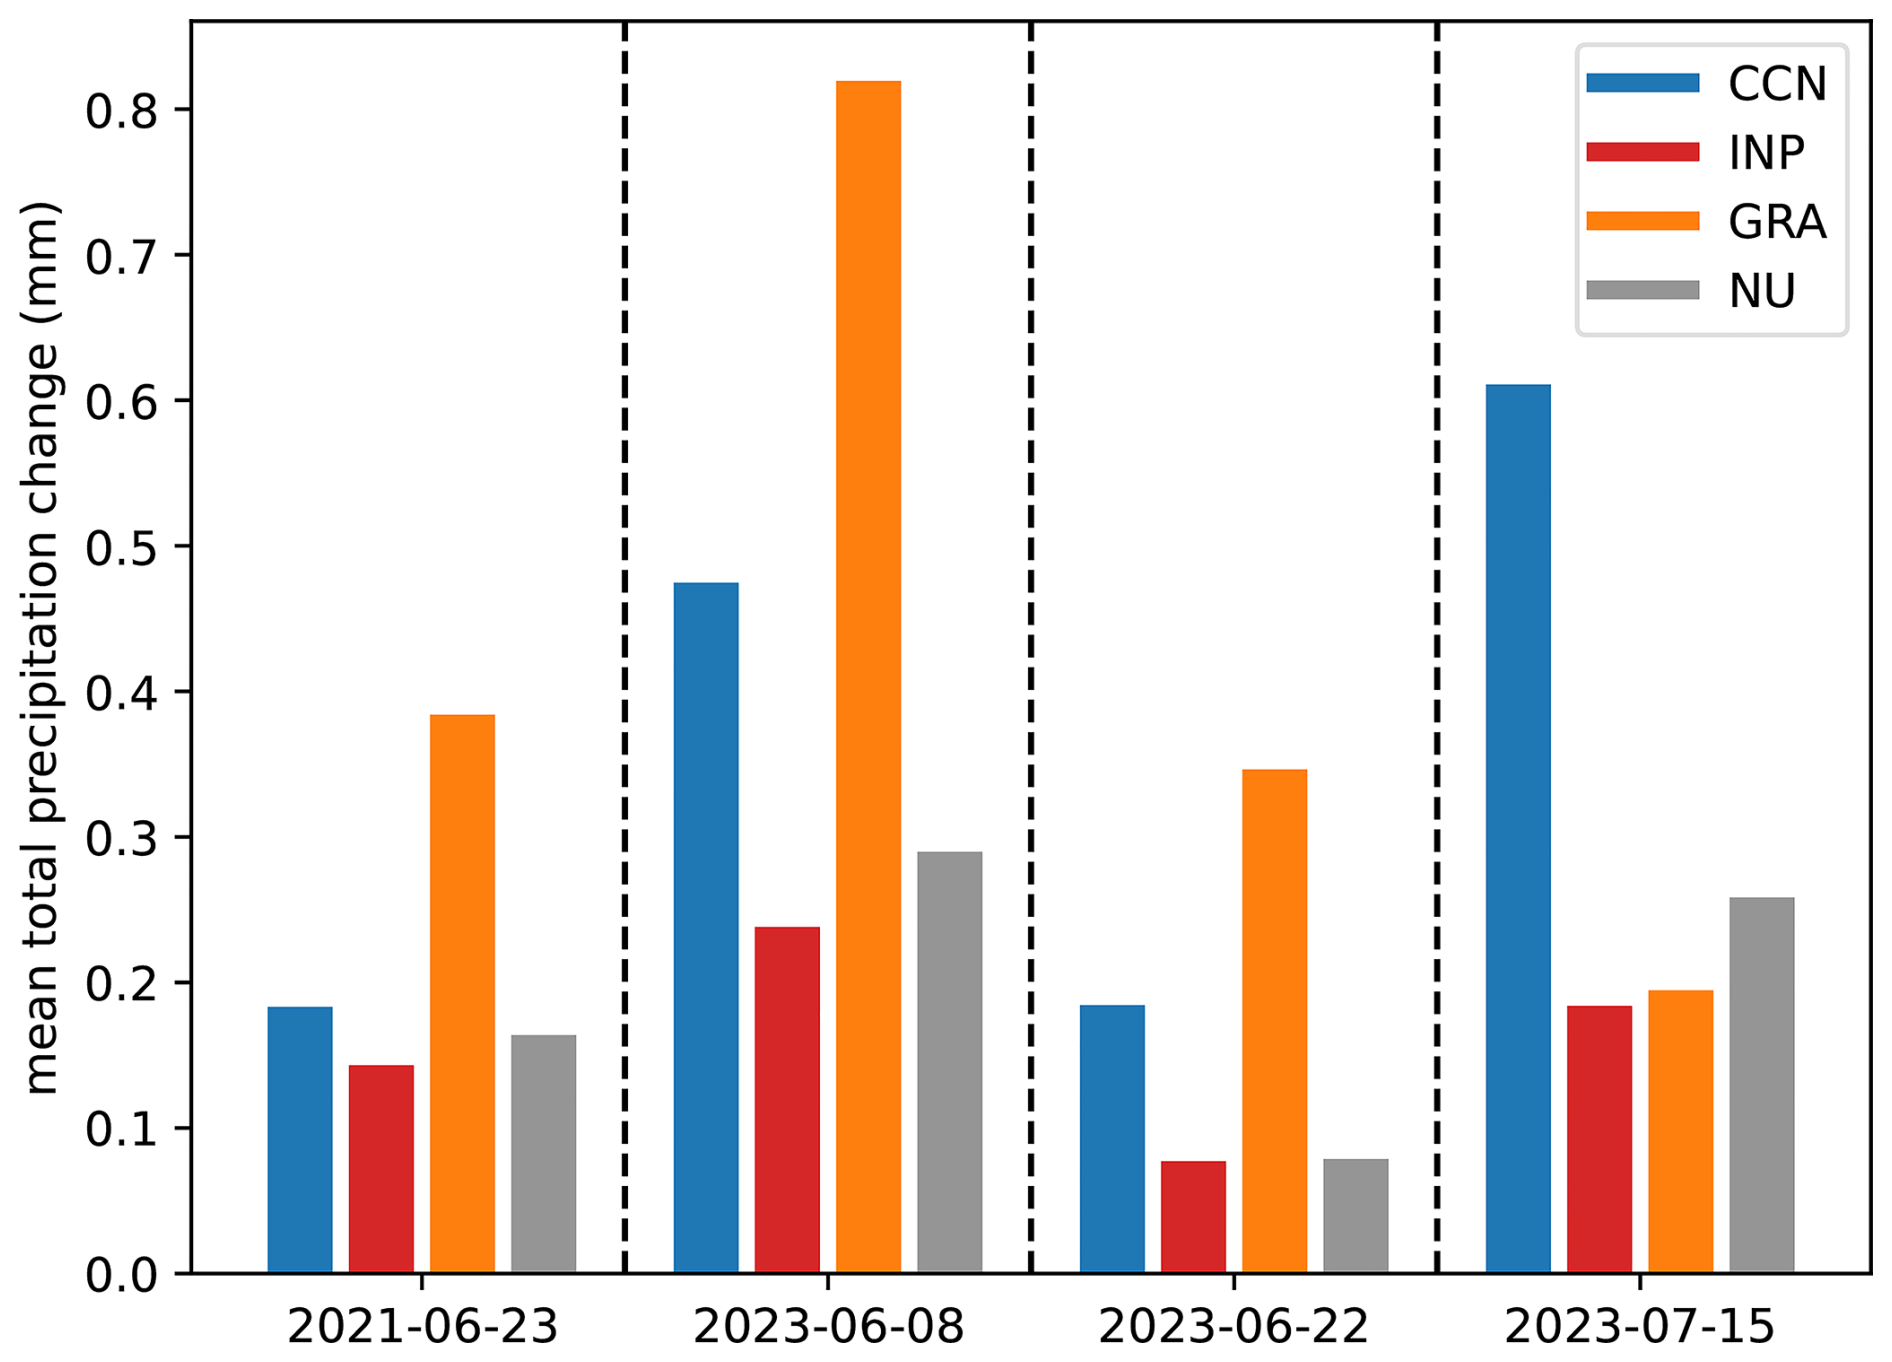
Figure 6Mean total precipitation deviation for all uncertainty parameters (CCN: CCN concentration, INP: INP concentration, GRA: graupel sedimentation, NU: shape parameter).
The analysis of aerosol effects on total precipitation amounts showed a mostly negative impact for cases 1–3, whereas a positive impact exists for case 4. Rain, on the other hand, shows an increase with increasing CCN concentration in 3 of the cases (not shown). Therefore, precipitation via the cold phase, like hail and graupel, must be considered for the prevailing negative aerosol effect on total precipitation. To further quantify this effect, we computed the relative contributions of rain, graupel, and hail (no snow on the ground) to the domain-averaged total precipitation amount for each of the 108 ensemble members. As expected, rain has the highest contribution, ranging from 87 % to 98 %. The maximum graupel contribution is almost identical for all days (2 %–3 %). For case 4 with a positive aerosol effect, the maximum contribution of hail to total precipitation is only 3 %, whereas it is much larger for the other cases (7 %, 9 %, 10 %). On average for the entire ensemble, hail contributes only 1.4 % to total precipitation on case 4, whereas the other days have contributions between 2.8 % and 4.8 %. We therefore hypothesize that the positive aerosol effect could be related to the relative role of cold-rain processes, which will be analyzed later in Sect. 3.5.
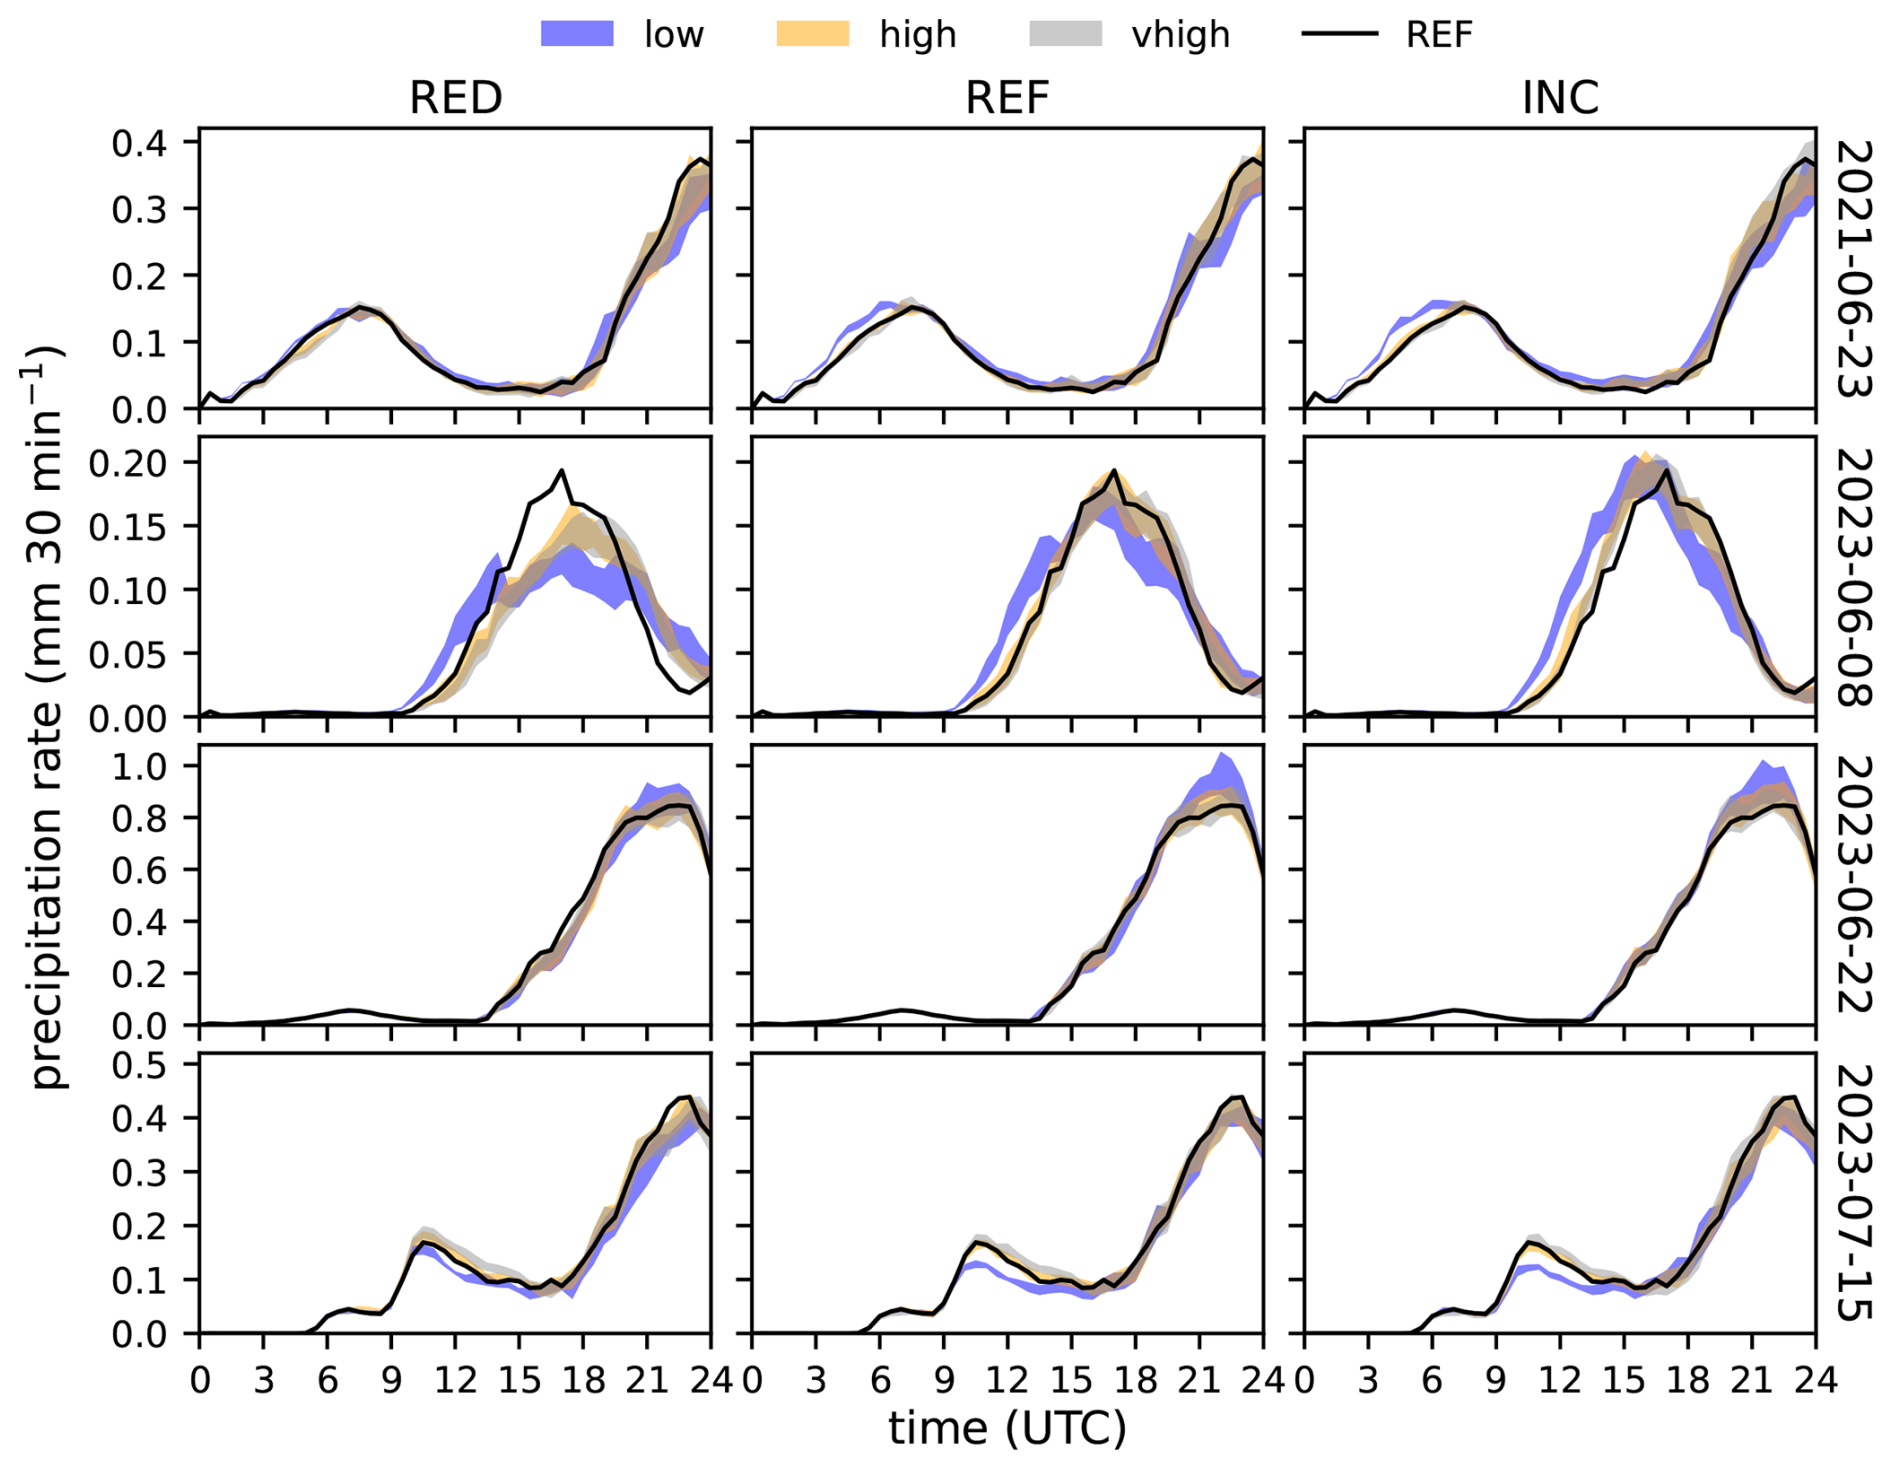
Figure 7Domain-averaged precipitation rates for reduced (left), reference (middle), and increased graupel sedimentation (right). The color-coded areas indicate the range between the minimum and maximum precipitation rate for all shape parameters and INP sensitivities within one CCN concentration. Different colors indicate the 3 different CCN concentrations. The black lines indicate the respective reference runs with reference graupel sedimentation and INP concentration, high CCN concentration, and a shape parameter of 1.
To investigate the reasons for the overall strong effects on precipitation totals, we now analyze the daily cycle of 30 min precipitation rates to assess whether the model simulates longer/shorter lifetimes and increased/reduced rain rates. Convection mostly starts simultaneously when averaging over the comparatively large evaluation domain (Fig. 7). Only for cases 1 and 2 do the runs with low CCN concentrations have a 30–60 min earlier onset of precipitation compared to the more polluted runs. The later onset can be explained by a weaker collision–coalescence process due to smaller droplet sizes in polluted conditions (lifetime effect; Albrecht, 1989). After convective precipitation has started, however, the rate at which precipitation then increases can differ. For example, on 8 June 2023, the runs assuming low CCN concentration have larger rain intensities than the runs with high and very high CCN concentration. This also holds for case 1 (23 June 2021), whereas the last two cases show similar increasing rain intensities after convection starts to form. Only case 3 shows the highest rain intensities for the runs with low CCN concentrations, all remaining cases have their maxima at high or very high CCN concentrations. This is particularly true in case 4, where the precipitation rates for a polluted atmosphere are always the highest. Cases 1 and 2 demonstrate the importance of analyzing a longer period for precipitation totals: Although the maximum rain intensities are simulated for high and very high CCN concentrations, the longer times with higher rain intensities before and after the respective maximum control the total precipitation amount as a negative aerosol effect on total precipitation mostly characterized these cases. The effect of different graupel sedimentation velocities is small for cases 1, 3, and 4. For case 2 (8 June 2023) with prevailing small and isolated showers with shorter lifetimes, however, there is a clear tendency for higher maximum rain intensities with increased INP concentrations. The higher the graupel sedimentation, the earlier the maximum rainfall intensities occur (RED at 17:30 UTC, REF at 17:00 UTC, INC between 15:30 and 16:30 UTC). In brief, these results indicate that the timing of convection initiation is, on average, not sensitive to the varied microphysical parameters in this study and that different total precipitation amounts are caused by varying rain intensities throughout the simulation period and/or the number of convective cells.
Except for case 2, the temporal evolution in Fig. 7 shows that the convective events are not yet complete and precipitation rates are still declining at the end of the 24 h integration period. To assess the effects of the incomplete simulation of the entire convective event during the night, we repeated all 108 simulations with a longer integration time of 30 h for case 1. We find that the precipitation characteristics (deviation of total precipitation from the reference run, integrated warm- and cold-rain processes) do not change. Thus, the findings regarding the sensitivity to the microphysical perturbations are considered to be robust and not influenced by the fact that the decaying stage of convective activity is not fully covered in all days when using an integration time of 24 h.
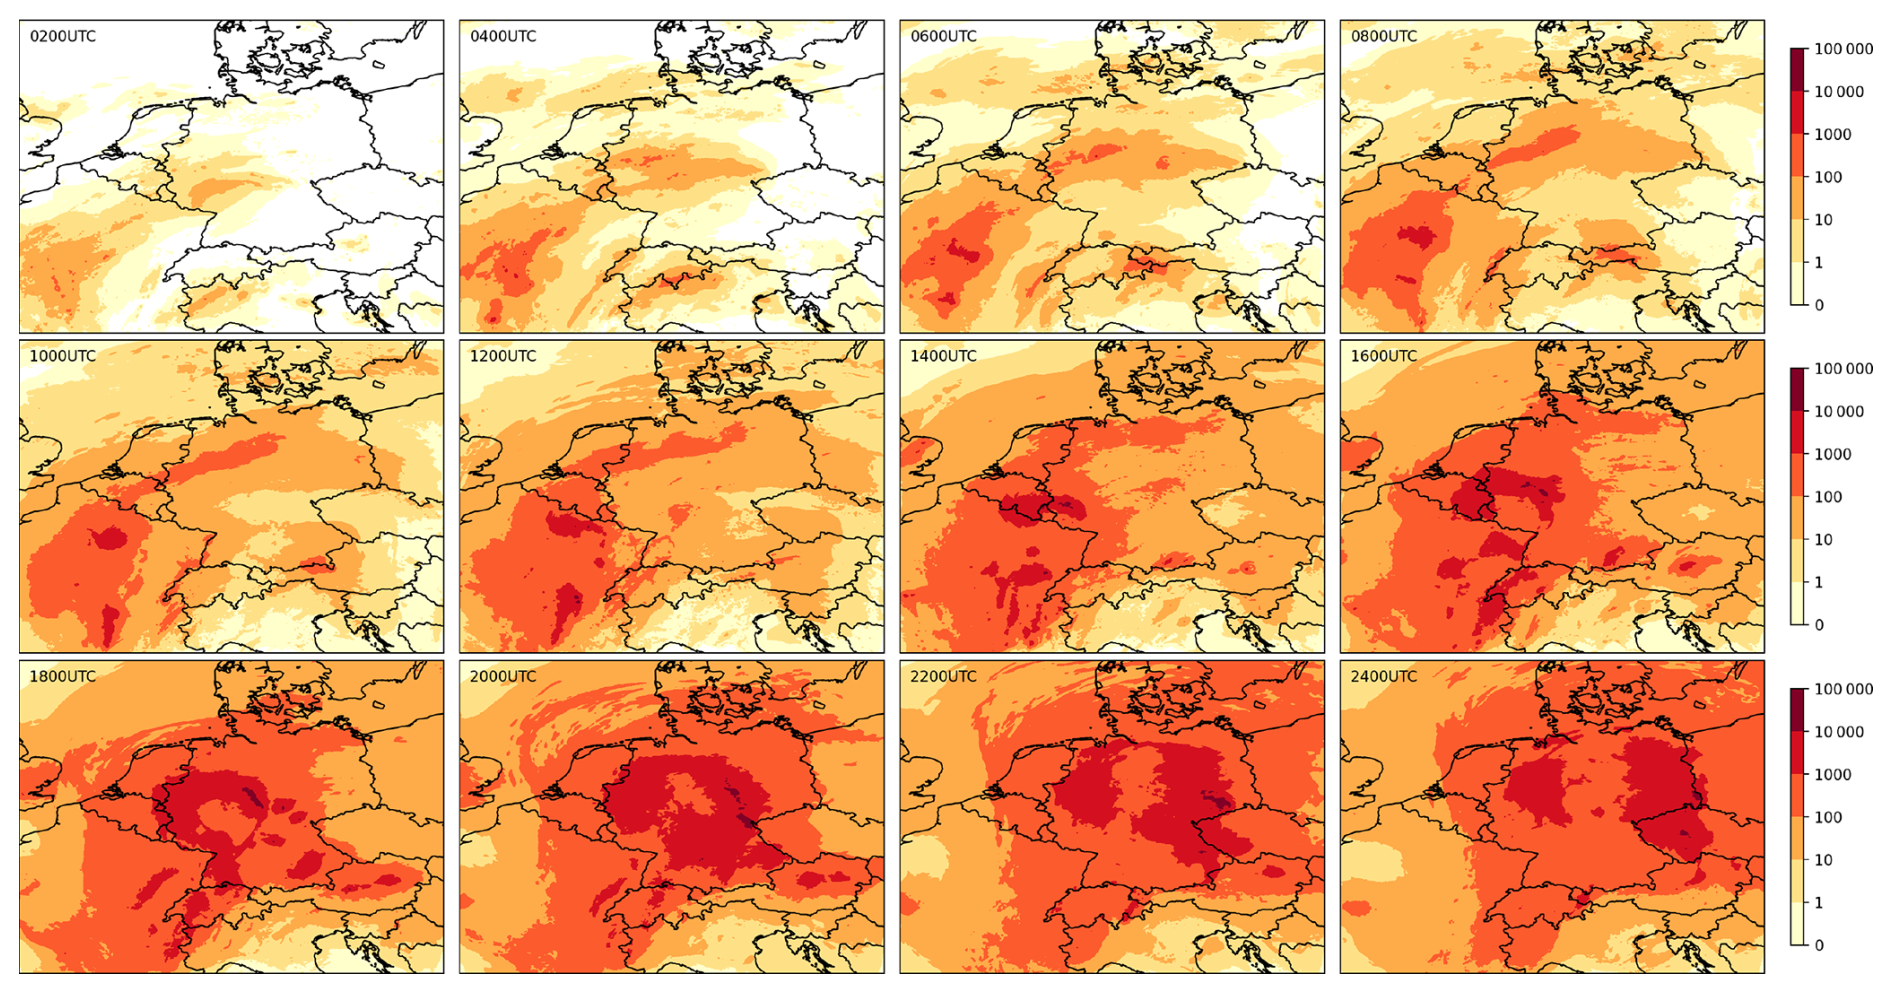
Figure 8Sequence of DTE in m2 s−2 integrated over all ensemble members and vertically averaged between 0 and 11 km agl for the case of 22 June 2023.
3.3 Tropospheric error growth
As a metric to quantify forecast error introduced by the microphysical perturbations used in our ensemble, we use the difference total energy (DTE; Zhang et al., 2003), which is defined as
with the wind components u and v, temperature T, the heat capacity of dry air cp, and a reference temperature Tr = 287 K. Δ denotes the difference between an ensemble member and the reference simulation, x is the 3D position vector, and t is time. At first, we analyze a sequence of DTE maps vertically averaged between 0 and 11 km and integrated over all ensemble members at 2 h intervals, illustrating the tropospheric error growth process over the 24 h simulation period for case 2 (22 June 2023) in Fig. 8. Initially, high DTE values are confined to localized areas with clouds, but they expand rapidly throughout the domain. By 06:00 UTC, a substantial portion of the model domain is already affected by significant errors, and by 09:00 UTC (not shown), elevated DTE values encompass the entire model domain. This illustrates the rapid and widespread growth of forecast uncertainties, highlighting the challenges in maintaining accurate predictions, even over relatively short periods. Understandably, the largest errors occur in areas with the highest rainfall totals and the greatest rainfall variability. The other cases investigated here behave similarly, but on two of the other days analyzed (not shown), the spread of forecast error, as measured by DTE, remains more localized during the early forecast hours and only begins to affect the entire model domain after approximately 12:00 UTC.
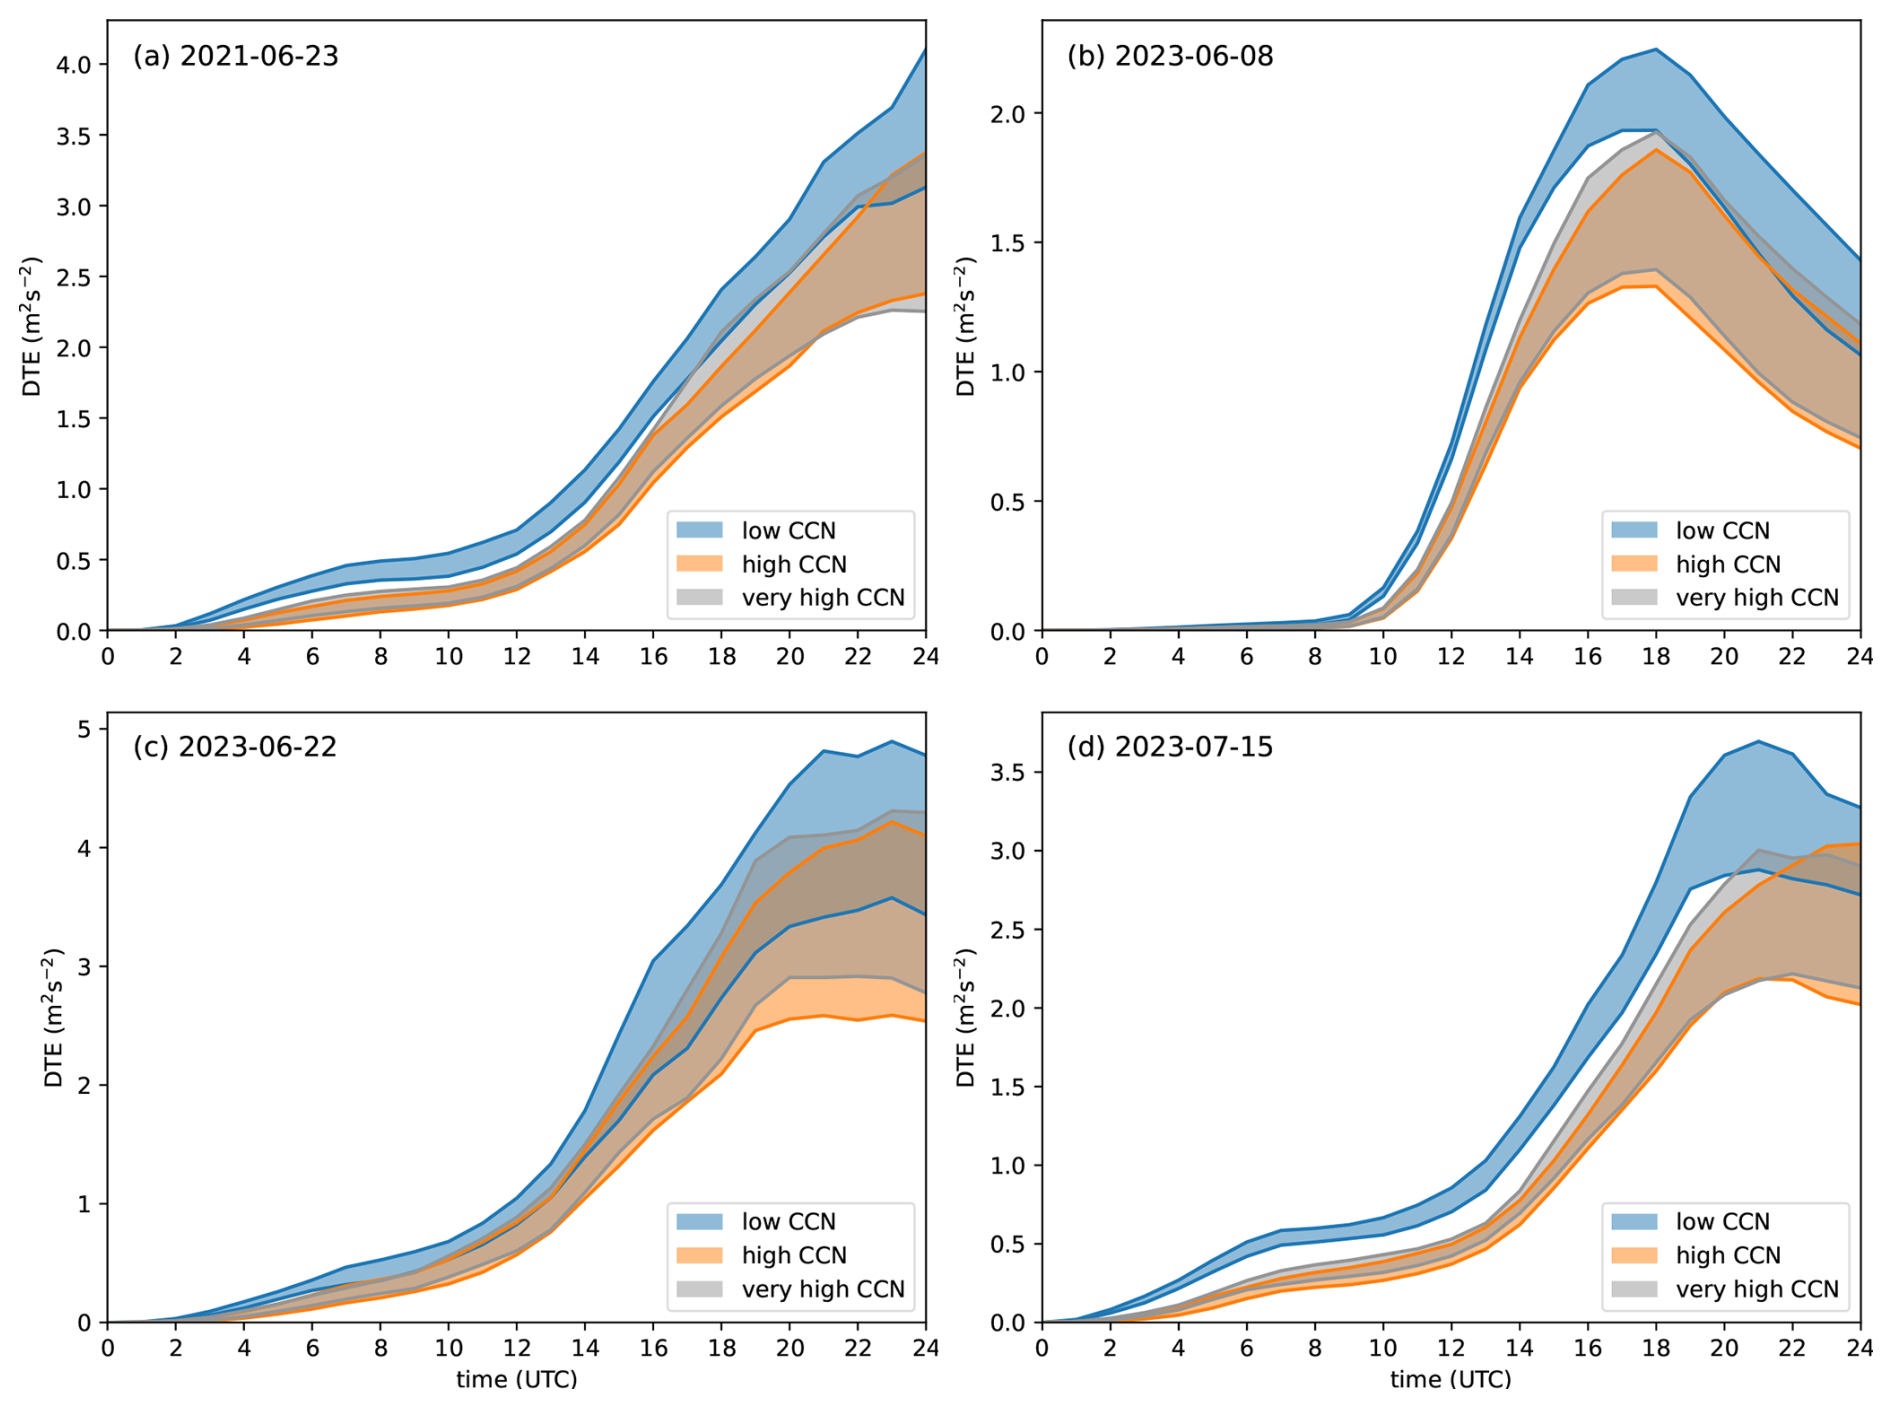
Figure 9Domain-averaged DTE (vertically averaged between 0 and 11 km agl) for deviations of individual ensemble members from the respective reference run grouped into the different CCN concentrations.
We also computed individual domain-averaged DTE values between every single member of the ensemble and the reference run. The time series plots in Fig. 9 illustrate the evolution of forecast error throughout the diurnal cycle for the 4 different case studies, with the ensemble members grouped by CCN regime (low, high, and very high) shown as shaded areas. A consistent pattern emerges across all 4 dates: simulations with low CCN concentrations produce the highest DTE values, indicating greater forecast uncertainty or divergence among ensemble members. In contrast, high and very high CCN concentrations lead to reduced DTE growth, suggesting a more constrained or predictable evolution of the atmospheric state. This implies that microphysical processes influenced by aerosol loading, particularly CCN, have a significant impact on predictability. The DTE increase exhibits a strong diurnal signal, with a rapid rise during the afternoon and early evening hours (approximately 12:00–18:00 UTC), followed by a plateau or slight decrease during the night. This pattern closely mirrors the daily cycle of convective precipitation (Fig. 7), underscoring the role of convective processes in amplifying forecast errors. As convective activity intensifies, the atmosphere becomes more sensitive to the microphysical uncertainties, particularly under low aerosol conditions, where cloud development is less suppressed for the first 3 cases. Interestingly, case 4 with the positive aerosol–precipitation feedback shows larger DTE values for low CCN concentrations, despite having the lowest rain rates. Overall, the results highlight the importance of aerosol-cloud interactions in ensemble predictability and suggest that lower CCN environments may enhance model divergence during convective regimes, particularly in the presence of strong diurnal forcing.
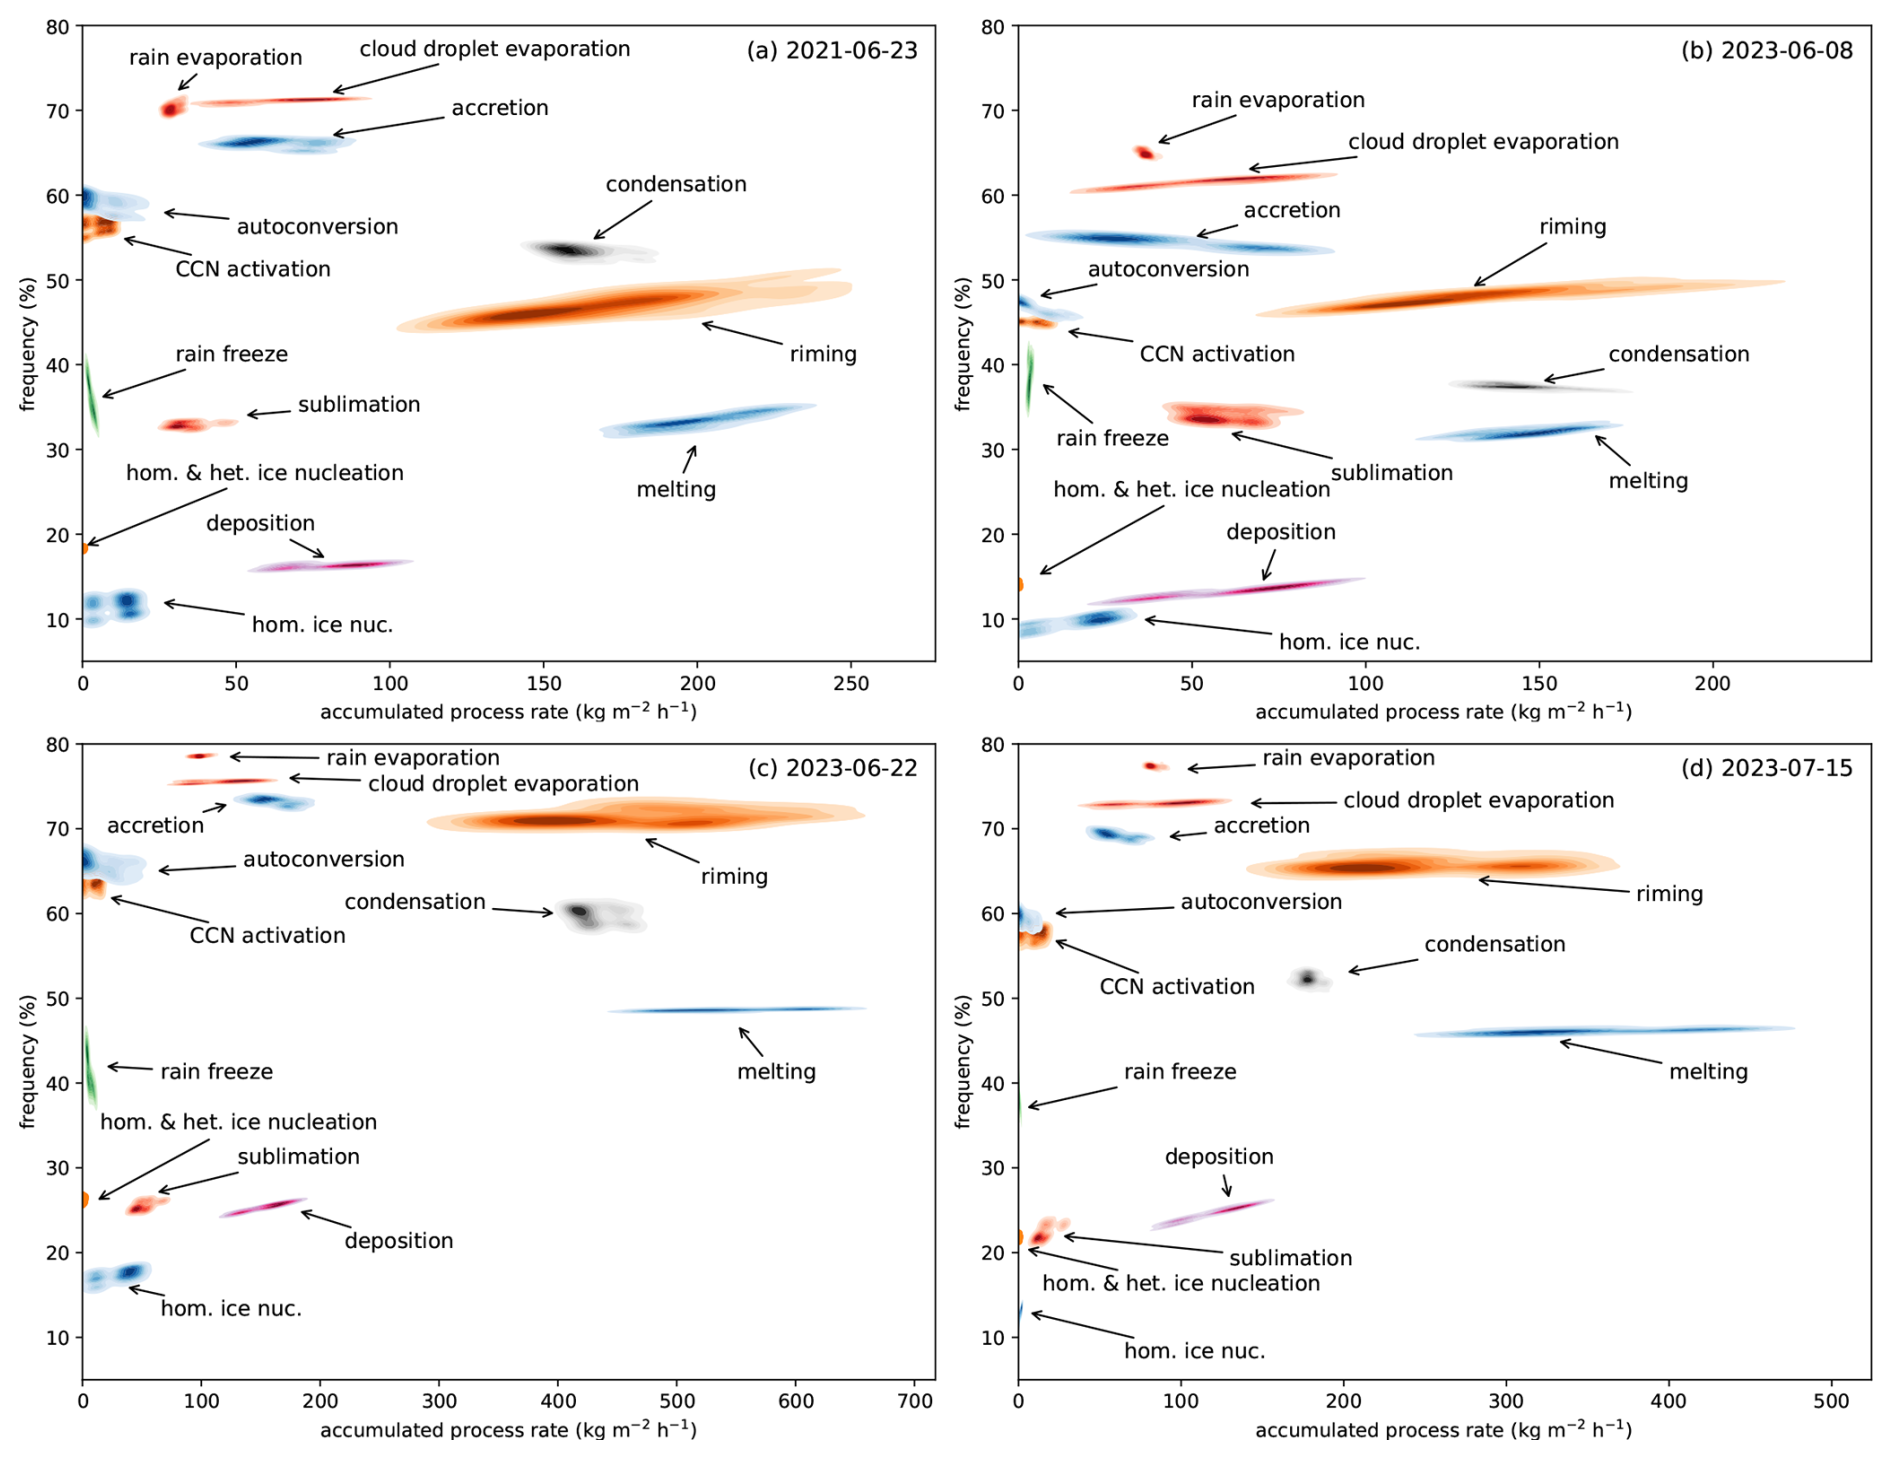
Figure 102D histograms of domain-averaged microphysical processes and their durations in relative frequencies of occurrence of all ensemble members. The darker the color shade, the higher the probability of the individual microphysical process.
3.4 Importance and spread of microphysical processes
To investigate the microphysical processes and their response to the perturbations applied in this study, we have expanded the model code to write out a variety of microphysical process rates. To understand which processes dominate and/or exhibit large variability in response to microphysical perturbations, we employ an approach inspired by Kiszler et al. (2024). For each of the analyzed processes, we computed the vertically-integrated process rates, accumulated over the full integration time of 24 h. Then a domain average was calculated for the evaluation domain given in Fig. 1. As a second metric, the percentage of occurrence (representing the total duration a process is larger than zero) is used. When displaying the percentage of occurrence against the domain value, a process is considered more relevant the closer it is positioned to the upper-right corner. In this study, we expand the single-model realizations of Arctic clouds from Kiszler et al. (2024) with a 2D histogram computed using all 108 ensemble members. Figure 10 presents these two-dimensional histograms of accumulated microphysical process rates against their percentage of occurrence for the 4 case study days, derived from the 108-member convection-permitting ensemble. Each panel corresponds to one day and reveals the distribution and variability of key microphysical processes within the simulated weather systems, expressed in relative frequencies of occurrence, so that their sum equals one. The absolute values of homogeneous and heterogeneous ice nucleation are very small compared to the other process rates. Therefore, every point of the histogram is displayed with the same color and symbol to be visible in the figure.
Across all panels, several processes consistently stand out due to their high mean rates and frequent occurrence, placing them toward the upper-right quadrant of the plots. Notably, condensation and riming emerge as the dominant processes, both in terms of total accumulated mean value and temporal occurrence. The melting of solid hydrometeors to rain droplets also reveals large mean values, indicating the importance of the cold-phase pathways. Their temporal duration, however, is somewhat smaller, ranging between 30 %–47 %. In contrast, processes such as homogeneous and heterogeneous ice nucleation, deposition, sublimation, and rain freeze appear with much lower durations and accumulated rates, clustering in the lower-left regions of the plots. Thus, they contribute less to the overall cloud water or ice budget. In all analyzed cases, the processes with the longest temporal durations are cloud and rain droplet evaporation. As all convective clouds originate from the liquid phase and ice processes only start after condensation and the warm-phase pathway, the high time coverage seems plausible. The percentage difference between the minimum and maximum mean value of rain evaporation (i.e., the left and right limits of the histogram on the abscissa) ranges only between 15 %–28 %. Cloud droplet evaporation, however, shows a much larger response to the microphysical perturbations than rain evaporation (73 %–200 %) with only small variations in their temporal duration. This large variation is mainly caused by the different CCN concentrations, as in polluted conditions, the cloud droplets are more numerous, but smaller in size and therefore more susceptible to evaporation (not shown). Processes like riming and melting also exhibit substantial horizontal elongation, indicating a high sensitivity of their accumulated rates to ensemble perturbations, whereas their temporal durations vary much less. The maximum percentage increase for total riming and melting are 122 % and 165 %, respectively. As for cloud evaporation, the total riming rates mainly depend on the CCN concentration, with a reduction in riming in more polluted conditions. The warm-rain processes autoconversion and accretion also show a large response to the microphysical perturbations: autoconversion varies over two orders of magnitude and accretion increases between 44 %–90 % with an extreme value of 340 %. CCN activation also reveals a change of one order of magnitude. They form 3 clusters depending on the 3 CCN concentrations, where the absolute values are very similar and only a small temporal variation is present, caused by the remaining perturbations (not shown). The freezing of rain is comparatively small in magnitude, but shows an interesting feature for at least 3 of the analyzed cases: The largest mean values occur with the lowest temporal durations. A closer look at this individual process shows that the larger mean values are simulated for more polluted conditions. Probably, the freezing of rain then happens faster and more efficiently than in clean conditions.
In brief, this analysis shows that phase changes involving water and ice (riming, melting) as well as phase changes involving the vapor phase (condensation) dominate the mean rates, whereas the most dominant processes in terms of their duration involve only a phase change from liquid to the vapor phase (cloud and rain droplet evaporation). Overall, the plots highlight which microphysical pathways dominate the cloud and precipitation development, and which are more uncertain or variable in response to ensemble perturbations. This provides insight into both the relative importance and predictability of different microphysical processes in convection-permitting forecasts.
3.5 Role of warm- and cold-rain processes
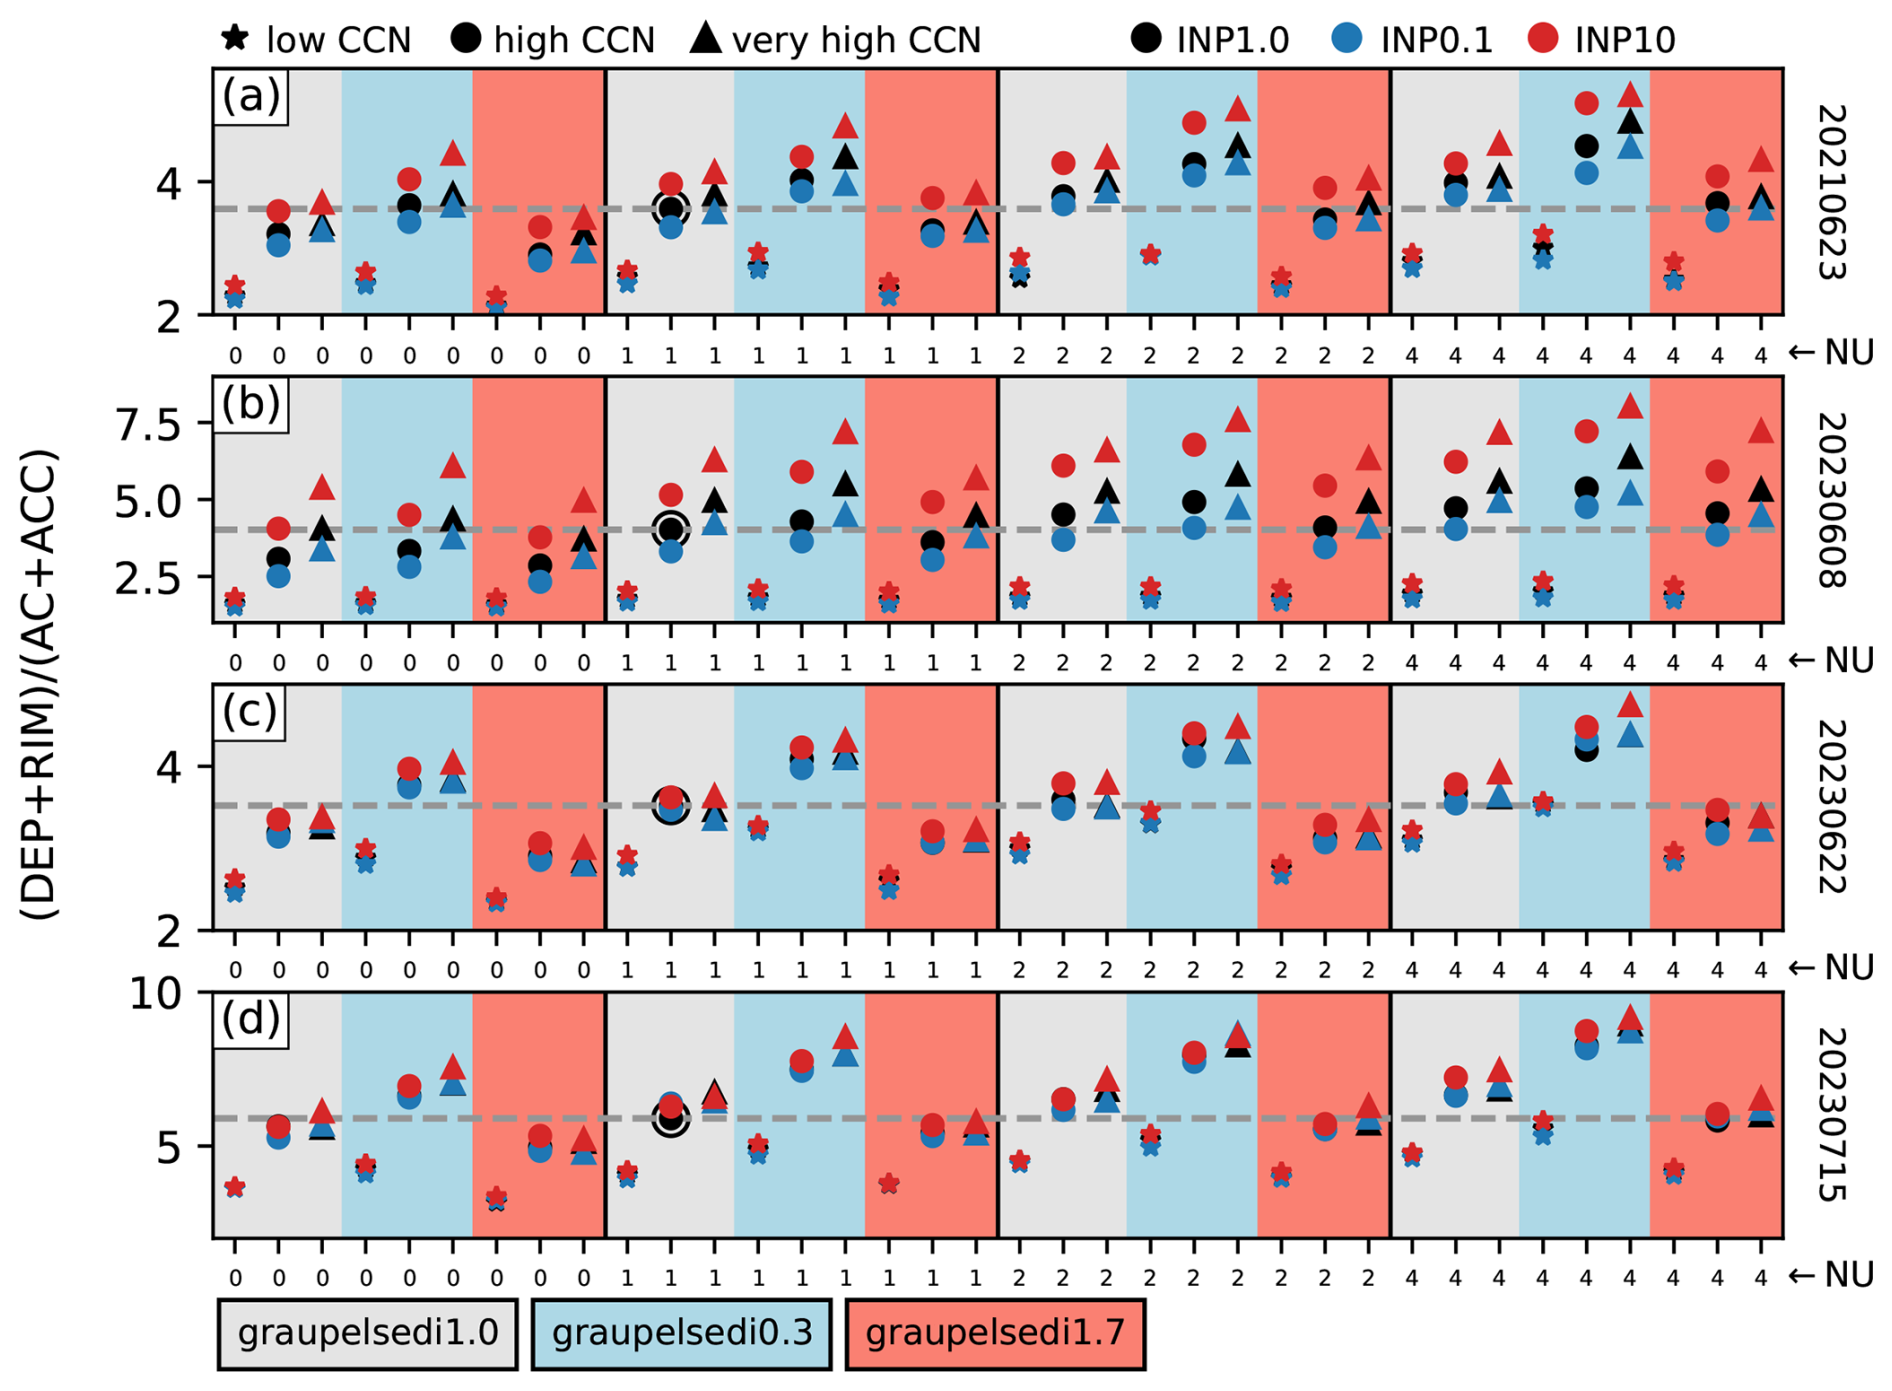
In addition to the absolute values and the duration of the individual process rates, it is also interesting to examine the relative role of warm-rain and cold-rain processes and if and how they depend on the microphysical perturbations applied in this study. Therefore, Fig. 11 presents the ratio of cold (vapor deposition and riming; DEP+RIM) to warm (autoconversion and accretion; AC + ACC) rain formation processes for the different sensitivity experiments using the same arrangement of data points as for the 24 h precipitation deviation in Fig. 5. Across all numerical experiments, this ratio consistently exceeds unity, indicating that precipitation formation is predominantly driven by cold-rain processes in the investigated convective cases. This finding is in agreement with previous studies of convective events simulated with the same model system (e.g. Barthlott et al., 2022b). Moreover, the sensitivity experiments reveal that increasing CCN or INP concentrations systematically enhances the dominance of cold-rain processes. Physically, higher CCN concentrations delay warm-rain initiation via suppressed autoconversion and reduced collision-coalescence efficiency. As a result, more cloud water is available to be lofted into the mixed-phase region, where it can participate in cold-rain processes. Similarly, higher INP concentrations promote earlier and more widespread ice formation, accelerating deposition growth and riming. Both mechanisms shift the microphysical balance toward the cold pathway. In contrast, increased graupel sedimentation velocity leads to a reduction in the cold-rain process dominance. This can be attributed to reduced riming rates (not shown): if graupel particles sediment more quickly, the residence time within the mixed-phase region of the cloud is reduced. This highlights the importance of sedimentation feedbacks in modulating the vertical distribution and efficiency of microphysical pathways. In all 3 graupel sedimentation regimes, enlarging the shape parameter does lead to an increased relative role of the processes via the ice phase. This can again be attributed to the reduced autoconversion and accretion processes by the narrowing of the cloud droplet size distribution. The mean ratios found in this study lie in a similar range to previous simulations using the same double-moment scheme (Baur et al., 2022). Despite the different aerosol effects on total precipitation amounts found for these 4 cases, the relative roles of the warm- and cold-rain processes behave similarly. We would like to point out that, instead of deposition and riming, melting could be used as a single cold-rain process to calculate the ratio of cold to warm-rain processes. The results are almost identical and exhibit the same systematic behavior (not shown).
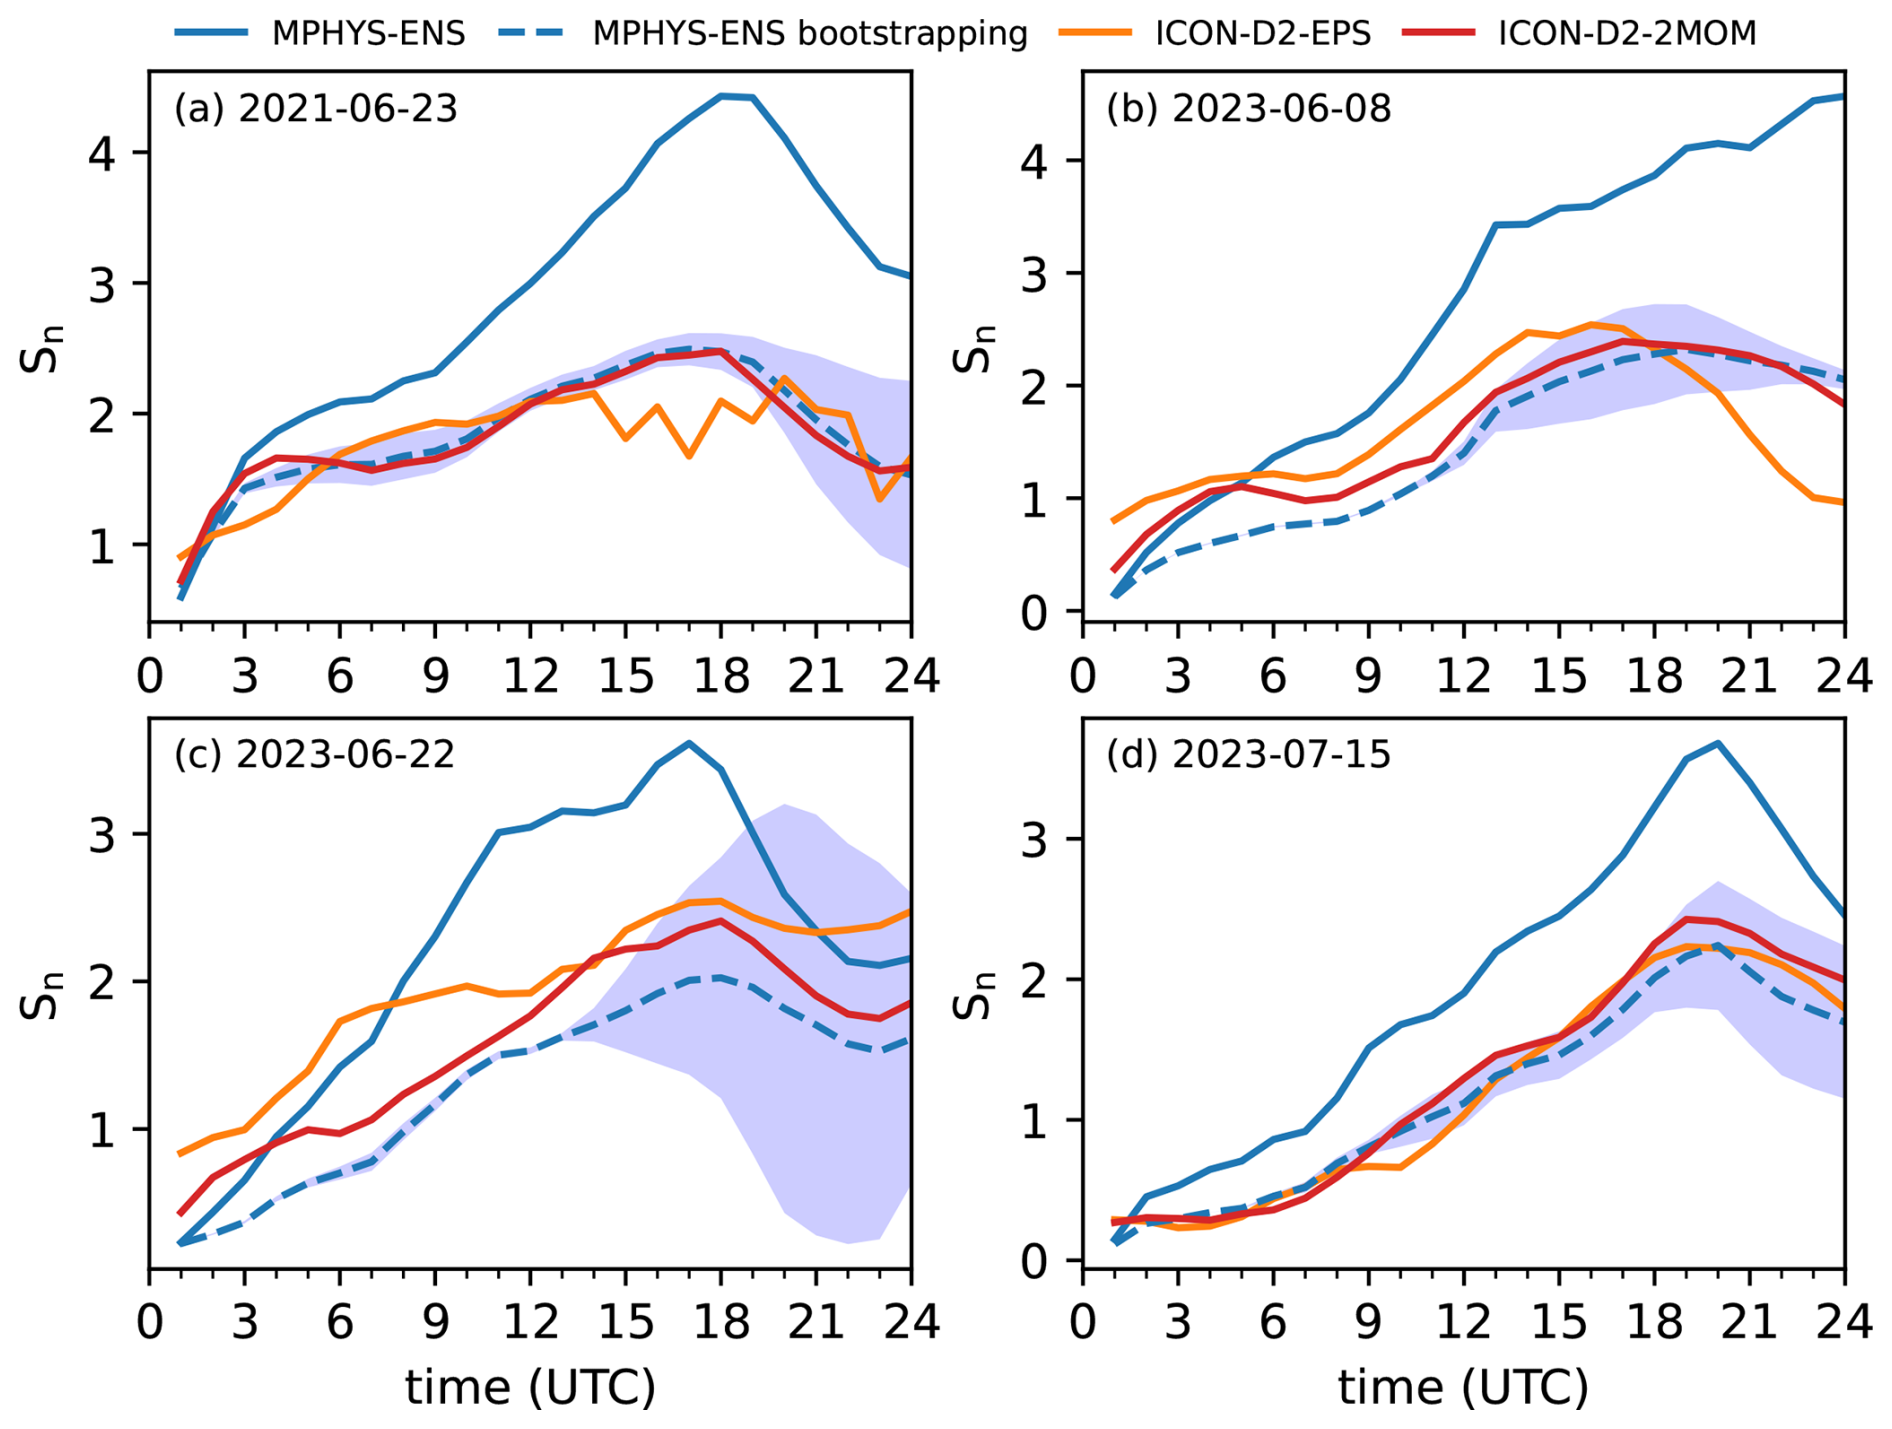
Figure 12Domain-averaged normalized ensemble spread Sn based on hourly precipitation amounts for the full microphysical ensemble (MPHYS-ENS), the bootstrapped microphysical ensemble (MPHYS-ENS bootstrapping), the operational single-moment microphysics ensemble (ICON-D2-EPS), and the ensemble using double-moment microphysics and operationally used physical perturbations (ICON-D2-2MOM).
Averaged across all 108 data points in the first 3 cases, the cold-to-warm process ratio is 3.5 (case 1), 3.8 (case 2), and 3.4 (case 3). However, the simulation of case 4 (15 July 2023, panel d) stands out with a significantly higher average ratio of 5.9. Notably, this is the only case in which total precipitation increases with increasing CCN concentrations – an effect contrary to the aerosol suppression found for the first 3 cases. The elevated ratio suggests that enhanced cold microphysical activity can, under certain conditions, compensate for or even outweigh the initial suppression of warm-rain processes, leading to a net increase in precipitation. An analysis of the individual contributing processes revealed that in all investigated cases, increasing CCN concentrations lead to a decrease in riming and an increase in deposition. However, in cases where the aerosol has a negative effect on precipitation, the riming decrease is larger than the deposition increase, leading to an overall reduction in the cold-rain processes. Since the warm-rain processes exhibit a greater decrease with increasing aerosol concentration than cold-rain processes, the relative role of cold-rain processes continues to increase. For case 4 with positive aerosol–precipitation feedback, the deposition increase outweighs the decrease in riming, resulting in an increase of cold-rain processes with increasing CCN concentration. Combined with a similar quantitative reduction of the warm-rain processes as in the other cases, the ratio of the cold-to-warm rain processes ends up with larger values, i.e., the relative role of the cold-rain processes in the precipitation formation becomes more important. This connection implies that the cold-to-warm process ratio could potentially serve as a useful diagnostic or threshold to identify regimes where increased aerosol loading leads to precipitation enhancement, rather than suppression. More cases with different environments and convection types need to be investigated to further test this hypothesis.
3.6 Ensemble spread
In an ensemble forecasting system, the spread among ensemble members is crucial for assessing the level of uncertainty in the prediction. To assess the ensemble spread, we calculated the domain-averaged normalized standard deviation Sn at each grid point as follows (see, e.g., Keil et al., 2019):
Here, Pi(x,y) represents the hourly precipitation for ensemble member i, is the ensemble mean hourly precipitation, and N is the total number of ensemble members. Normalizing the spread helps to eliminate variations caused by the diurnal cycle of precipitation. We compare the normalized spread of the microphysical ensemble with the normalized spread of the operational ICON-D2-EPS (Fig. 12). In addition, DWD conducted simulations using the same double-moment scheme with the operationally used physical perturbations, but without considering initial and boundary condition uncertainty (ICON-D2-2MOM). In all 4 cases, MPHYS-ENS produces the largest spread, with a pronounced afternoon increase coinciding with the increase in convective activity. This indicates that microphysical perturbations alone can generate substantial variability in convective development when sampled with a sufficiently large number of members. For two of the cases (8 and 22 June 2023), the spread of the operational ensemble is larger than the one from MPHYS in the first 5–7 h. This indicates the larger role of initial condition uncertainty in the first hours after model start, whereas the microphysical ensemble needs some time with cloud development to produce a higher spread. To get a fair intercomparison with the 20-member operational ensemble, we used a bootstrapping technique to randomly pick 20 members of the microphysical ensemble to calculate their normalized spread and repeated that procedure 100 times. When the ensemble size is reduced to 20 members, the bootstrapped subset still lies in a similar range to the operational ICON-D2-EPS for cases 1 and 4, but slightly underestimates the maximum spread for most of the time on cases 2 and 3, even though the temporal evolution remains similar. This loss of amplitude underlines the importance of ensemble size for representing the full range of uncertainty. However, the maximum ICON-D2-EPS spread always lies within the standard deviation of the bootstrapped subset. The ICON-D2-2MOM generally exhibits spread values comparable to or slightly above the 20-member subsample of MPHYS-ENS. This indicates that the microphysical uncertainties introduced in this study can produce a similar large spread as the operationally used physical perturbations in case a double-moment scheme is used. An important finding is the fact that for two of the 4 cases analyzed here, the largest spread in ensembles with 20 members can be gained without considering uncertainties in initial and boundary conditions. Only the two cases in June 2023 benefit from those uncertainties until around midday/early afternoon.
It is also of interest to evaluate the ensemble spread based only on the parameters that have the strongest influence on precipitation amounts. In most of the cases analyzed, these parameters are the CCN concentration and the graupel sedimentation velocity (see Sect. 3.2). Using these parameters, we additionally calculated the ensemble spread using reference values for INP concentrations and shape parameters (9 members) and also averaged over 12 sub-ensembles of 9 members each, in which CCN and GR are perturbed with constant combinations of INP concentrations and shape parameters. Although CCN and graupel sedimentation have the strongest influence on total precipitation amounts, the spread is mostly smaller than in the operational ICON-D2-EPS (not shown) due to the smaller ensemble size. It makes no difference whether only the reference values of INP and NU are used or whether the average of all combinations of constant INP and NU is taken. We therefore conclude that the high-impact parameters represented by a small subset contribute less to the overall spread than a combination with lower-impact parameters using a larger subset.
From a forecast quality perspective, these results imply that (i) large ensemble sizes are essential to avoid underrepresentation of microphysical uncertainty, (ii) randomly picked members produce a similar large spread than the operational 20-member ensemble, and (iii) perturbations in the initial and boundary conditions contribute little (if at all) to the spread of the ensemble, at least for periods with the strongest convective activity. Overall, the comparison highlights that both ensemble design (number of members) and the selection of uncertainty sources are critical for achieving reliable probabilistic forecasts in convective weather regimes.
The present study is based on four 24 h precipitation events. For such a small sample, proper probabilistic scores (e.g., continuous ranked probability score, rank histograms, reliability diagrams) do not allow a statistically robust comparison of MPHYS-ENS and the operational ICON-D2-EPS. Nevertheless, we have computed the Fractions-Skill-Score (FSS) of 24 h total precipitation amounts compared to radar-derived precipitation (not shown). Across all 4 d, the mean values for the selected precipitation thresholds and scales of the FSS is broadly similar between the two ensembles, indicating that MPHYS-ENS is capable of generating a level of skill comparable to that of the operational EPS. Nevertheless, marked day-to-day variability is evident. For the 8 June 2023 case, the scores are uniformly low, reflecting poor agreement with observations, whereas the 22 June 2023 case exhibits consistently higher FSS values, signalling substantially better performance. The 23 June 2021 and 15 July 2023 cases fall in between, with mixed regions of high and low skill. While the ensembles can achieve comparable FSS magnitudes, the skill is highly sensitive to the specific weather situation. Consequently, any quantitative assessment of relative performance would require a much larger sample of cases; the present four-day set primarily serves to demonstrate that the spread produced by MPHYS-ENS is of the same order as that of ICON-D2-EPS, showing the importance and the potential of taking into account microphysical parameterizations in the quantification of model uncertainty in a convective-scale EPS.
Accurately forecasting summertime convection remains a major challenge for convection-permitting NWP systems, as they often suffer from insufficient ensemble spread in convective precipitation forecasts. To address this, we investigated the impact of microphysical uncertainties on ensemble forecasts by conducting large ensemble simulations with the ICON model. A 108-member microphysics ensemble was generated by systematically perturbing 4 key microphysical parameters: cloud condensation nuclei concentration, ice-nucleating particle concentration, graupel sedimentation velocity, and the shape of the cloud droplet size distribution. These perturbations reflect major sources of uncertainty in warm- and cold-phase pathways. The main objectives of this study were (i) to quantify the ensemble spread that can be achieved by microphysical perturbations alone, (ii) to understand their individual and combined effects on microphysical processes and precipitation totals, and (iii) to evaluate the feasibility of using microphysical perturbation ensembles to forecast summertime convection. For comparison, we considered the operational ICON-D2-EPS (20 members), which perturbs initial and boundary conditions as well as physical parameterizations, and a 20-member ensemble with a double-moment microphysics scheme and physics perturbations but no initial/boundary condition perturbations (ICON-D2-2MOM). Four convective case studies from the Swabian MOSES 2021 and 2023 campaigns were analyzed, representing a variety of convective environments including single cells, multicells, supercells, and large convective clusters.
Our simulations revealed a large spread in the individual location and intensity of the convective cells solely introduced by microphysical perturbations in all of the analyzed cases. Although the same initial and boundary conditions were used in all ensemble members, the intensity and location of convective cores are sensitive to the use of different microphysical perturbations. This is most probably not only related to direct impacts on microphysical processes, but also to aerosol-induced modifications of the environmental conditions in which convection forms (e.g., Barthlott et al., 2024). The 24 h integrated precipitation amounts mostly decrease with increasing CCN concentration for cases 1–3, with the largest accumulations for low CCN concentrations and increased graupel sedimentation. However, in case 4, the opposite was found to be true: precipitation increases systematically with increasing CCN, and the largest totals are simulated mostly for reduced graupel sedimentation. Overall, the range of precipitation deviation from the respective minimum to the maximum was found to be very large and ranged between 17 %–33 %. We further find that the onset of convection is, on average, not strongly affected by the different microphysical parameters considered in this study. Instead, variations in total precipitation mainly result from differences in rain intensity during the simulation period and/or from differences in the number of convective cells. An important finding of this study is the rapid and widespread error growth illustrated by the difference total energy. Even after just a few hours of simulation, a substantial portion of the model domain is already impacted by the microphysical perturbations, illustrating thermodynamic impacts not only in cloudy areas but also in cloud-free regions. The analysis shows that perturbing microphysical parameters not only alters the intensity and location of convective cells but also generates a rapid error growth that quickly spreads into cloud-free parts of the domain. This behaviour reflects a non-local coupling between the convective core and its surrounding environment: thermodynamic feedbacks from microphysical uncertainties modify the large-scale temperature- and wind fields, which in turn degrade the forecast even where no clouds are present. Such propagation limits the convective-scale predictability of the system, because the forecast error cannot be confined to the immediate convective region but pervades the entire domain. Ensemble simulations that explicitly sample microphysical uncertainty demonstrate that this non-local error propagation can be a dominant source of spread. These findings underscore the need to treat microphysical uncertainty as a primary factor in assessing and extending convective-scale predictability limits.
The analysis of microphysical process rates within the ensemble demonstrates that phase transitions between water and ice (such as riming and melting) as well as those involving the vapor phase (condensation) largely govern the mean mass rates. In contrast, the processes with the longest durations are primarily associated with liquid-to-vapor transitions (evaporation of cloud and rain droplets). Moreover, substantial differences in mean rates (e.g., riming, melting, autoconversion, accretion) revealed a high sensitivity to the ensemble perturbations. Taken together, this illustrates which microphysical pathways are most influential in cloud and precipitation development, and which exhibit greater uncertainty or variability under the considered ensemble perturbations. This, in turn, provides valuable insights into both the relative significance and the predictability of various microphysical processes in convection-permitting forecasts.
We also find that precipitation formation is consistently dominated by cold-rain processes (deposition and riming), with the cold-to-warm process ratio exceeding unity in all cases. Higher CCN and INP concentrations systematically enhance this dominance, whereas faster graupel sedimentation reduces it. Case 4 stands out, as increased CCN concentrations lead to higher total precipitation due to enhanced deposition outweighing reduced riming. This suggests that the cold-to-warm process ratio may serve as a useful diagnostic for identifying regimes where aerosols enhance rather than suppress precipitation.
The comparison of the normalized ensemble spread to the operational ICON-D2-EPS and ICON-D2-2MOM showed that the normalized ensemble spread is highly sensitive to ensemble size. In all 4 cases, MPHYS-ENS produces the largest spread, with a pronounced afternoon increase linked to convection. This demonstrates that microphysical perturbations alone can generate substantial variability. A bootstrapped 20-member subset yields spreads comparable to ICON-D2-EPS, though with slightly lower maxima, emphasizing the importance of ensemble size (e.g., Dirkson and Buehner, 2025). This indicates that initial and boundary condition perturbations, together with physics perturbations, compensate to some degree for the smaller ensemble size. ICON-D2-2MOM produces spreads similar to and slightly larger than the 20-member MPHYS-ENS, indicating that microphysical uncertainties can rival operational perturbations when using a double-moment scheme. Overall, the results highlight that ensemble size and the choice of uncertainty sources are key for reliable probabilistic forecasts, with perturbations of microphysics being at least as important as initial and boundary condition perturbations during peak convective activity.
This study demonstrates that cloud microphysics is a major source of forecast uncertainty in summertime convection and should be explicitly represented in ensemble design. The big impact on quantitative precipitation forecasts and the large spread solely introduced by microphysical perturbations is remarkable and underlines the importance of probabilistic forecasts in capturing the full range of possible precipitation outcomes, particularly during high-impact weather events. However, large ensemble sizes are necessary to fully capture this variability, while neglecting microphysical uncertainty or reducing member numbers can lead to a smaller spread, possibly with underdispersion. Given the overall large impact of these uncertainties identified in this work, the combination with initial and boundary condition uncertainties should be pursued in future work. It remains to be clarified how such perturbations impact ensembles for weather regimes with stratiform precipitation.
The nature of the 4-D data generated in running the model experiments requires a large tape storage facility. These data are of the order of 200 TB (terabytes). The model data can be made available upon request from the authors. The data needed to replicate the figures can be found at https://doi.org/10.5281/zenodo.17379041 (Barthlott et al., 2025). Global Forecast System (GFS) data is available through https://www.ncei.noaa.gov/products/weather-climate-models/global-forecast (last access: 27 April 2026). An open-source version of ICON is available under a permissive open-source license (BSD-3C) at https://doi.org/10.35089/wdcc/iconrelease2025.04 (ICON partnership (MPI-M; DWD; DKRZ; KIT; C2SM), 2025).
CB and CH developed the project idea and designed the numerical experiments. CB and BC performed the numerical simulations at KIT, and CG at the DWD. CB conducted the analyses and wrote the paper, with contributions from all the co-authors.
The contact author has declared that none of the authors has any competing interests.
Publisher's note: Copernicus Publications remains neutral with regard to jurisdictional claims made in the text, published maps, institutional affiliations, or any other geographical representation in this paper. The authors bear the ultimate responsibility for providing appropriate place names. Views expressed in the text are those of the authors and do not necessarily reflect the views of the publisher.
The authors thank the German Weather Service (DWD) for providing the ICON model code, the initial and boundary data, and the RADOLAN data. The authors gratefully acknowledge the computing time provided on the high-performance computer HoreKa by the National High-Performance Computing Center at KIT (NHR@KIT). This center is jointly supported by the Federal Ministry of Education and Research and the Ministry of Science, Research and the Arts of Baden-Württemberg, as part of the National High-Performance Computing (NHR) joint funding program (https://www.nhr-verein.de/en/our-partners, last access: 27 April 2026). HoreKa is partly funded by the German Research Foundation (DFG). This work was performed with the help of the Large Scale Data Facility at the Karlsruhe Institute of Technology funded by the Ministry of Science, Research and the Arts Baden-Württemberg and by the Federal Ministry of Education and Research. The field campaigns Swabian MOSES 2021 and 2023 were supported by funding from the Helmholtz Association within the framework of MOSES. CH acknowledges the European Union's Horizon Europe project “CleanCloud” (grant agreement no. 101137639). “Grammarly” generative AI (https://app.grammarly.com, last access: 27 April 2026) was used for the whole article's grammar, spelling, and stylistic check.
The article processing charges for this open-access publication were covered by the Karlsruhe Institute of Technology (KIT).
This paper was edited by Yi Huang and reviewed by two anonymous referees.
Albrecht, B. A.: Aerosols, cloud microphysics, and fractional cloudiness, Science, 245, 1227–1230, https://doi.org/10.1126/science.245.4923.1227, 1989. a
Altaratz, O., Koren, I., Remer, L., and Hirsch, E.: Revie.: Cloud invigoration by aerosols—Coupling between microphysics and dynamics, Atmos. Res., 140–141, 38–60, https://doi.org/10.1016/j.atmosres.2014.01.009, 2014. a
Bao, J.-W., Michelson, S. A., and Grell, E. D.: Microphysical Process Comparison of Three Microphysics Parameterization Schemes in the WRF Model for an Idealized Squall-Line Case Study, Mon. Weather Rev., 147, 3093–3120, https://doi.org/10.1175/MWR-D-18-0249.1, 2019. a
Barrett, A. I. and Hoose, C.: Microphysical Pathways Active Within Thunderstorms and Their Sensitivity to CCN Concentration and Wind Shear, J. Geophys. Res.-Atmos., 128, e2022JD036965, https://doi.org/10.1029/2022JD036965, 2023. a
Bartels, H.: Projekt RADOLAN – Routineverfahren zur Online-Aneichung der Radarniederschlagsdaten mit Hilfe von automatischen Bodenniederschlagsstationen (Ombrometer), Deutscher Wetterdienst, Offenbach, Germany, https://www.dwd.de/DE/leistungen/radolan/radolan.html (last access: 27 April 2026), 111 pp., 2004. a
Barthlott, C. and Barrett, A. I.: Large impact of tiny model domain shifts for the Pentecost 2014 mesoscale convective system over Germany, Weather Clim. Dynam., 1, 207–224, https://doi.org/10.5194/wcd-1-207-2020, 2020. a
Barthlott, C., Zarboo, A., Matsunobu, T., and Keil, C.: Importance of aerosols and shape of the cloud droplet size distribution for convective clouds and precipitation, Atmos. Chem. Phys., 22, 2153–2172, https://doi.org/10.5194/acp-22-2153-2022, 2022a. a, b, c, d
Barthlott, C., Zarboo, A., Matsunobu, T., and Keil, C.: Impacts of combined microphysical and land-surface uncertainties on convective clouds and precipitation in different weather regimes, Atmos. Chem. Phys., 22, 10841–10860, https://doi.org/10.5194/acp-22-10841-2022, 2022b. a, b, c, d, e
Barthlott, C., Czajka, B., Kunz, M., Saathoff, H., Zhang, H., Böhmländer, A., Gasch, P., Handwerker, J., Kohler, M., Wilhelm, J., Wieser, A., and Hoose, C.: The impact of aerosols and model grid spacing on a supercell storm from Swabian MOSES 2021, Q. J. Roy. Meteor. Soc., 150, 2005–2027, https://doi.org/10.1002/qj.4687, 2024. a, b, c
Barthlott, C., Czajka, B., Gebhardt, C., and Hoose, C.: Dataset for manuscript “Significance of microphysical processes for uncertainties in ensemble forecasts of summertime convection over central Europe”, Zenodo [data set], https://doi.org/10.5281/zenodo.17379041, 2025. a
Baur, F., Keil, C., and Barthlott, C.: Combined effects of soil moisture and microphysical perturbations on convective clouds and precipitation for a locally forced case over Central Europe, Q. J. Roy. Meteor. Soc., 148, 2132–2146, https://doi.org/10.1002/qj.4295, 2022. a
Bechtold, P., Köhler, M., Jung, T., Doblas-Reyes, F., Leutbecher, M., Rodwell, M. J., Vitart, F., and Balsamo, G.: Advances in simulating atmospheric variability with the ECMWF mode.: From synoptic to decadal time-scales, Q. J. Roy. Meteor. Soc., 134, 1337–1351, https://doi.org/10.1002/qj.289, 2008. a
Bouttier, F. and Raynaud, L.: Clustering and selection of boundary conditions for limited area ensemble prediction, Q. J. Roy. Meteor. Soc., 144, 2381–2391, https://doi.org/10.1002/qj.3304, 2018. a
Bouttier, F., Vié, B., Nuissier, O., and Raynaud, L.: Impact of Stochastic Physics in a Convection-Permitting Ensemble, Mon. Weather Rev., 140, 3706–3721, https://doi.org/10.1175/MWR-D-12-00031.1, 2012. a
Chen, C.-H., Chung, K.-S., Yang, S.-C., Chen, L.-H., Lin, P.-L., and Torn, R. D.: Sensitivity of Forecast Uncertainty to Different Microphysics Schemes within a Convection-Allowing Ensemble during SoWMEX-IOP8, Mon. Weather Rev., 149, 4145–4166, https://doi.org/10.1175/MWR-D-20-0366.1, 2021. a
Chen, J.-P., Tsai, T.-C., Tzeng, M.-D., Liao, C.-S., Kuo, H.-C., and Hong, J.-S.: Microphysical Perturbation Experiments and Ensemble Forecasts on Summertime Heavy Rainfall over Northern Taiwan, Weather Forecast., 37, 1641–1659, https://doi.org/10.1175/WAF-D-22-0004.1, 2022. a
Dirkson, A. and Buehner, M.: The Effect of Ensemble Size on the Mean Squared Error and Spread–Error Relationship, Mon. Weather Rev., 153, 1219–1229, https://doi.org/10.1175/MWR-D-24-0189.1, 2025. a
ECMW.: IFS Documentation CY49R1 - Part V: Ensemble Prediction System, chap. 5, ECMWF, https://doi.org/10.21957/956d60ad81, 2024. a
Fan, J., Wand, Y., Rosenfeld, D., and Liu, X.: Review of Aerosol-Cloud Interactions: Mechanisms, Significance, and Challenges, J. Atmos. Sci., 73, 4221–4252, https://doi.org/10.1175/JAS-D-16-0037.1, 2016. a, b
Fan, J., Rosenfeld, D., Zhang, Y., Giangrande, S. E., Li, Z., Machado, L. A. T., Martin, S. T., Yang, Y., Wang, J., Artaxo, P., Barbosa, H. M. J., Braga, R. C., Comstock, J. M., Feng, Z., Gao, W., Gomes, H. B., Mei, F., Pöhlker, C., Pöhlker, M. L., Pöschl, U., and De Souza, R. A. F.: Substantial Convection and Precipitation Enhancements by Ultrafineaerosol Particles, Science, 359, 411–418, https://doi.org/10.1126/science.aan8461, 2018. a
Gossard, E. E.: Measurement of Cloud Droplet Size Spectra by Doppler Radar, J. Atmos. Ocean. Tech., 11, 712–726, https://doi.org/10.1175/1520-0426(1994)011<0712:MOCDSS>2.0.CO;2, 1994. a
Groenemeijer, P., Barthlott, C., Behrendt, A., Corsmeier, U., Handwerker, J., Kohler, M., Kottmeier, C., Mahlke, H., Pal, S., Radlach, M., Trentmann, J., Wieser, A., and Wulfmeyer, V.: Observations of kinematics and thermodynamic structure surrounding a convective storm cluster over a low mountain range, Mon. Weather Rev., 137, 585–602, https://doi.org/10.1175/2008MWR2562.1, 2009. a
Han, C., Hoose, C., Stengel, M., Coopman, Q., and Barrett, A.: Sensitivity of cloud-phase distribution to cloud microphysics and thermodynamics in simulated deep convective clouds and SEVIRI retrievals, Atmos. Chem. Phys., 23, 14077–14095, https://doi.org/10.5194/acp-23-14077-2023, 2023. a, b
Hande, L. B., Engler, C., Hoose, C., and Tegen, I.: Seasonal variability of Saharan desert dust and ice nucleating particles over Europe, Atmos. Chem. Phys., 15, 4389–4397, https://doi.org/10.5194/acp-15-4389-2015, 2015. a, b
Hande, L. B., Engler, C., Hoose, C., and Tegen, I.: Parameterizing cloud condensation nuclei concentrations during HOPE, Atmos. Chem. Phys., 16, 12059–12079, https://doi.org/10.5194/acp-16-12059-2016, 2016. a
Handwerker, J., Barthlott, C., Bauckholt, M., Geppert, G., Hühn, E., Nallasamy, N. D., Dick, G., Dietrich, P., Güntner, A., Keller, J., Kunz, M., Landmark, S., Mohannazadeh, M., Morsy, M., Najafi, H., Oertel, A., Rakovec, O., Reich, H., Reich, M., Samaniego, L., Schrön, M., Schütze, C., Steinert, T., Vorogushyn, S., Weber, U., and Wieser, A.: From initiation of convective storms to their impact – The concept of the Swabian MOSES 2023 campaign, Front. Earth Sci., 13, https://doi.org/10.3389/feart.2025.1555755, 2025. a
Heise, E., Ritter, B., and Schrodin, E.: Operational implementation of the multilayer soil model TERRA, Technical Report 9, Deutscher Wetterdienst, Offenbach, Germany, http://www.cosmo-model.org (last access: 27 April 2026), 19 pp.,2006. a
Hogan, R. J. and Bozzo, A.: A Flexible and Efficient Radiation Scheme for the ECMWF Model, J. Adv. Model. Earth Sy., 10, 1990–2008, https://doi.org/10.1029/2018MS001364, 2018. a
Hoose, C. and Möhler, O.: Heterogeneous ice nucleation on atmospheric aerosols: a review of results from laboratory experiments, Atmos. Chem. Phys., 12, 9817–9854, https://doi.org/10.5194/acp-12-9817-2012, 2012. a
ICON partnership (MPI-M; DWD; DKRZ; KIT; C2SM): ICON release 2025.04, World Data Center for Climate (WDCC) at DKRZ [code], https://doi.org/10.35089/wdcc/iconrelease2025.04, 2025. a
Igel, A. L. and van den Heever, S. C.: The role of the gamma function shape parameter in determining differences between condensation rates in bin and bulk microphysics schemes, Atmos. Chem. Phys., 17, 4599–4609, https://doi.org/10.5194/acp-17-4599-2017, 2017. a
Jeworrek, J., West, G., and Stull, R.: Evaluation of Cumulus and Microphysics Parameterizations in WRF across the Convective Gray Zone, Weather Forecast., 34, 1097–1115, https://doi.org/10.1175/WAF-D-18-0178.1, 2019. a
Kärcher, B. and Lohmann, U.: A parameterization of cirrus cloud formation: Homogeneous freezing of supercooled aerosols, J. Geophys. Res., 107, AAC 4-1–AAC 4–10, https://doi.org/10.1029/2001JD000470, 2002. a
Kärcher, B., Hendricks, J., and Lohmann, U.: Physically based parameterization of cirrus cloud formation for use in global atmospheric models, J. Geophys. Res., 111, https://doi.org/10.1029/2005JD006219, d01205, 2006. a
Keil, C., Baur, F., Bachmann, K., Rasp, S., Schneider, L., and Barthlott, C.: Relative contribution of soil moisture, boundary-layer and microphysical perturbations on convective predictability in different weather regimes, Q. J. Roy. Meteor. Soc., 145, 3102–3115, https://doi.org/10.1002/qj.3607, 2019. a, b
Khain, A. P., Beheng, K. D., Heymsfield, A., Korolev, A., Krichak, S. O., Levin, Z., Pinsky, M., Phillips, V., Prabhakaran, T., Teller, A., van den Heever, S. C., and Yano, J.-I.: Representation of microphysical processes in cloud-resolving model.: Spectral (bin) microphysics versus bulk parameterization, Rev. Geophys., 53, 247–322, https://doi.org/10.1002/2014RG000468, 2015. a
Kiszler, T., Ori, D., and Schemann, V.: Microphysical processes involving the vapour phase dominate in simulated low-level Arctic clouds, Atmos. Chem. Phys., 24, 10039–10053, https://doi.org/10.5194/acp-24-10039-2024, 2024. a, b
Knight, N. C. and Heymsfield, A. J.: Measurement and Interpretation of Hailstone Density and Terminal Velocity, J. Atmos. Sci., 40, 1510–1516, https://doi.org/10.1175/1520-0469(1983)040<1510:MAIOHD>2.0.CO;2, 1983. a
Kulmala, M., Kokkonen, T., Ezhova, E., Baklanov, A., Mahura, A., Mammarella, I., Bäck, J., Lappalainen, H. K., Tyuryakov, S., Kerminen, V. M., Zilitinkevich, S., and Petäjä, T.: Aerosols, Clusters, Greenhouse Gases, Trace Gases and Boundary-Layer Dynamic.: on Feedbacks and Interactions, Boundary-Lay. Meteorol., 186, 475–503, https://doi.org/10.1007/s10546-022-00769-8, 2023. a
Kunz, M., Abbas, S. S., Bauckholt, M., Böhmländer, A., Feuerle, T., Gasch, P., Glaser, C., Groß, J., Hajnsek, I., Handwerker, J., Hase, F., Khordakova, D., Knippertz, P., Kohler, M., Lange, D., Latt, M., Laube, J., Martin, L., Mauder, M., Möhler, O., Mohr, S., Reitter, R. W., Rettenmeier, A., Rolf, C., Saathoff, H., Schrön, M., Schütze, C., Spahr, S., Späth, F., Vogel, F., Völksch, I., Weber, U., Wieser, A., Wilhelm, J., Zhang, H., and Dietrich, P.: Swabian MOSES 202.: An interdisciplinary field campaign for investigating convective storms and their event chains, Front. Earth Sci., 10, :999593, https://doi.org/10.3389/feart.2022.999593, 2022. a
Leuenberger, D., Koller, M., Fuhrer, O., and Schär, C.: A Generalization of the SLEVE Vertical Coordinate, Mon. Weather Rev., 138, 3683–3689, https://doi.org/10.1175/2010MWR3307.1, 2010. a
Levin, M.: Functions to represent drop size distributions in cloud.: The optical density of clouds, Ser. Geofiz., 10, 698–702, 1958. a
Li, Y., Li, J., Ping, F., and Gao, Z.: Influence of the terminal velocity of graupel on the simulation of a convective system over Beijing, Atmos. Res., 274, 106181, https://doi.org/10.1016/j.atmosres.2022.106181, 2022. a
Lowenthal, D. H., Borys, R. D., Cotton, W., Saleeby, S., Cohn, S. A., and Brown, W. O.: The Altitude of Snow Growth by Riming and Vapor Deposition in Mixed-Phase Orographic Clouds, Atmos. Environ., 45, 519–522, https://doi.org/10.1016/j.atmosenv.2010.09.061, 2011. a
Lucas, L., Barthlott, C., Hoose, C., and Knippertz, P.: Aerosol effects on convective storms under pseudo-global warming conditions: insights from case studies in Germany, Atmos. Chem. Phys., 25, 18527–18548, https://doi.org/10.5194/acp-25-18527-2025, 2025. a
Luo, Y., Wang, Y., Wang, H., Zheng, Y., and Morrison, H.: Modeling convective-stratiform precipitation processes on a Mei-Yu front with the Weather Research and Forecasting mode: Comparison with observations and sensitivity to cloud microphysics parameterizations, J. Geophys. Res., 115, https://doi.org/10.1029/2010JD013873, 2010. a
Martins, J. A. and Silva Dias, M. A. F.: The impact of smoke from forest fires on the spectral dispersion of cloud droplet size distributions in the Amazonian region, Environ. Res. Lett., 4, 1–8, https://doi.org/10.1088/1748-9326/4/1/015002, 2009. a
Matsunobu, T., Keil, C., and Barthlott, C.: The impact of microphysical uncertainty conditional on initial and boundary condition uncertainty under varying synoptic control, Weather Clim. Dynam., 3, 1273–1289, https://doi.org/10.5194/wcd-3-1273-2022, 2022. a
Matsunobu, T., Puh, M., and Keil, C.: Flow- and Scale-dependent Spatial Predictability of Convective Precipitation Combining Different Model Uncertainty Representations, Q. J. Roy. Meteor. Soc., 150, 2364–2381, https://doi.org/10.1002/qj.4713, 2024. a
Miles, N. L., Verlinde, J., and Clothiaux, E. E.: Cloud Droplet Size Distributions in Low-Level Stratiform Clouds, J. Atmos. Sci., 57, 295–311, https://doi.org/10.1175/1520-0469(2000)057<0295:CDSDIL>2.0.CO;2, 2000. a
Murray, B. J., Carslaw, K. S., and Field, P. R.: Opinion: Cloud-phase climate feedback and the importance of ice-nucleating particles, Atmos. Chem. Phys., 21, 665–679, https://doi.org/10.5194/acp-21-665-2021, 2021. a
Oertel, A., Miltenberger, A. K., Grams, C. M., and Hoose, C.: Interaction of microphysics and dynamics in a warm conveyor belt simulated with the ICOsahedral Nonhydrostatic (ICON) model , Atmos. Chem. Phys., 23, 8553–8581, https://doi.org/10.5194/acp-23-8553-2023, 2023. a
Phillips, V. T. J., DeMott, P. J., and Andronache, C.: An empirical parameterization of heterogeneous ice nucleation for multiple chemical species of aerosol, J. Atmos. Sci., 65, 2757–2783, 2008. a
Raschendorfer, M.: The new turbulence parameterization of LM, COSMO Newsletter 1, 89–97, http://www.cosmo-model.org (last access: 27 April 2026), 115 pp., 2001. a
Raynaud, L. and Bouttier, F.: The impact of horizontal resolution and ensemble size for convective-scale probabilistic forecasts, Q. J. Roy. Meteor. Soc., 143, 3037–3047, https://doi.org/10.1002/qj.3159, 2017. a
Reinert, D., Prill, F., Frank, H., Denhard, M., Baldauf, M., Schraff, C., Gebhardt, C., Marsigli, C., Förstner, J., Zängl, G., Schlemmer, L., Blahak, U., and Welzbacher, C.: DWD Database Reference for the Global and Regional ICON and ICON-EPS Forecasting System, Deutscher Wetterdienst, Offenbach, Germany, https://www.dwd.de/DE/leistungen/nwv_icon_d2_modelldokumentation/nwv_icon_d2_modelldokumentation.html (last access: 27 April 2026), 186 pp., 2025. a, b
Richard, E., Chaboureau, J. P., Flamant, C., Champollion, C., Hagen, M., Schmidt, K., Kiemle, C., Corsmeier, U., Barthlott, C., and Di Girolamo, P.: Forecasting summer convection over the Black Fores.: a case study from the Convective and Orographically-induced Precipitation Study (COPS) experiment, Q. J. Roy. Meteor. Soc., 137 (S1), 101–117, https://doi.org/10.1002/qj.710, 2011. a, b
Rosenfeld, D., Lohmann, U., Raga, G., O'Dowd, C., Kulmala, M., Fuzzi, S., Reissell, A., and Andreae, M.: Flood or Drought: How Do Aerosols Affect Precipitation?, Science, 321, 1309–1313, https://doi.org/10.1126/science.1160606, 2008. a
Saleeby, S. M., van den Heever, S. C., Marinescu, P. J., Oue, M., Barrett, A. I., Barthlott, C., Cherian, R., Fan, J., Fridlind, A. M., Heikenfeld, M., Hoose, C., Matsui, T., Miltenberger, A. K., Quaas, J., Shpund, J., Stier, P., Vie, B., White, B. A., and Zhang, Y.: Model Intercomparison of the Impacts of Varying Cloud Droplet Nucleating Aerosols on the Lifecycle and Microphysics of Isolated Deep Convection, J. Atmos. Sci., 82, 2197–2217, https://doi.org/10.1175/JAS-D-24-0181.1, 2025. a
Schraff, C., Reich, H., Rhodin, A., Schomburg, A., Stephan, K., Periáñez, A., and Potthast, R.: Kilometre-scale ensemble data assimilation for the COSMO model (KENDA), Q. J. Roy. Meteor. Soc., 142, 1453–1472, https://doi.org/10.1002/qj.2748, 2016. a
Segal, Y. and Khain, A.: Dependence of droplet concentration on aerosol conditions in different cloud type.: application to droplet concentration parameterization of aerosol conditions, J. Geophys. Res., 111, D15240, https://doi.org/10.1029/2005JD006561, 2006. a
Seifert, A. and Beheng, K. D.: A two-moment cloud microphysics parameterization for mixed-phase clouds. Part 1: Model description, Meteorol. Atmos. Phys., 92, 67–82, https://doi.org/10.1007/s00703-005-0112-4, 2006. a, b
Tao, W.-K., Chen, J.-P., Li, Z., Wang, C., and Zhang, C.: Impact of aerosols on convective clouds and precipitation, Rev. Geophys., 50, RG2001, https://doi.org/10.1029/2011RG000369, 2012. a
Tao, Y., Qi, Y. B., and Hong, Y. C.: Numerical simulations of the influence of the graupel fall terminal velocity on cloud system and precipitation development, Acta Meteorol. Sin., 67, 370–381, https://doi.org/10.3321/j.issn:0577-6619.2009.03.003, 2009. a
Thompson, G., Berner, J., Frediani, M., Otkin, J. A., and Griffin, S. M.: A Stochastic Parameter Perturbation Method to Represent Uncertainty in a Microphysics Scheme, Mon. Weather Rev., 149, 1481–1497, https://doi.org/10.1175/MWR-D-20-0077.1, 2021. a, b
Tiedtke, M.: A comprehensive mass flux scheme for cumulus parameterization in large-scale models, Mon. Weather Rev., 117, 1779–1800, https://doi.org/10.1175/1520-0493(1989)117<1779:ACMFSF>2.0.CO;2, 1989. a
Wellmann, C., Barrett, A. I., Johnson, J. S., Kunz, M., Vogel, B., Carslaw, K. S., and Hoose, C.: Comparing the impact of environmental conditions and microphysics on the forecast uncertainty of deep convective clouds and hail, Atmos. Chem. Phys., 20, 2201–2219, https://doi.org/10.5194/acp-20-2201-2020, 2020. a, b
White, B., Gryspeerdt, E., Stier, P., Morrison, H., Thompson, G., and Kipling, Z.: Uncertainty from the choice of microphysics scheme in convection-permitting models significantly exceeds aerosol effects, Atmos. Chem. Phys., 17, 12145–12175, https://doi.org/10.5194/acp-17-12145-2017, 2017. a
Yin, L., Ping, F., Cheng, R., and Mao, J.: Modification of Microphysical Parameterization Schemes and Their Application in the Simulation of an Extremely Heavy Rainfall Event in Zhengzhou, J. Geophys. Res., 129, e2022JD038410, https://doi.org/10.1029/2022JD038410, 2024. a
Yuter, S. E., Kingsmill, D. E., Nance, L. B., and Löffler-Mang, M.: Observations of Precipitation Size and Fall Speed Characteristics within Coexisting Rain and Wet Snow, J. Appl. Meteorol. Clim., 45, 1450–1464, https://doi.org/10.1175/JAM2406.1, 2006. a
Zängl, G., Reinert, D., Rípodas, P., and Baldauf, M.: The ICON (ICOsahedral Non-hydrostatic) modelling framework of DWD and MPI-.: Description of the non-hydrostatic dynamical core, Q. J. Roy. Meteor. Soc., 141, 563–579, https://doi.org/10.1002/qj.2378, 2015. a
Zhang, F., Snyder, C., and Rotunno, R.: Effects of Moist Convection on Mesoscale Predictability, J. Atmos. Sci., 60, 1173–1185, https://doi.org/10.1175/1520-0469(2003)060<1173:EOMCOM>2.0.CO;2, 2003. a