the Creative Commons Attribution 4.0 License.
the Creative Commons Attribution 4.0 License.
 | 06 May 2026
Variability and trends of upper-tropospheric aerosols over the Asian summer monsoon region: an AeroCom multi-model study
Mian Chin
Jonathon S. Wright
Huisheng Bian
Qian Tan
Xiaohua Pan
Toshihiko Takemura
Hitoshi Matsui
Kostas Tsigaridis
Susanne Bauer
Paul Ginoux
Yiran Peng
Zengyuan Guo
Suvarna Fadnavis
Anton Laakso
John P. Burrows
Ghassan Taha
Jayanta Kar
Alexei Rozanov
Carlo Arosio
Landon Rieger
Adam Bourassa
Aerosols in the upper troposphere play an important role in Earth's radiative balance and atmospheric composition. Satellite observations show recurring enhancements of aerosol extinction coefficient (AEC) in the upper troposphere and near the tropopause over the Asian summer monsoon (ASM) anticyclone (ASMA) region during July–August. However, substantial uncertainties remain regarding the roles of ASM dynamics, climate variability, and surface emissions in shaping upper tropospheric aerosols, as well as global model performance in this region. We present results from an AeroCom-coordinated multi-model study addressing these issues with nine global models covering the period 2000–2018. Large inter-model spread is found in non-volcanic AEC over the ASMA region, with coefficients of variation of 64 %–86 %. Diagnostics using standardized tracers show that approximately half of this spread arises from differences in transport and wet removal processes, with discrepancies in wet scavenging contributing roughly eight times more to the inter-model variance than transport. The multi-model ensemble simulates a significant increase in non-volcanic AEC in ASMA over the two-decade period at ∼ 1.2 % yr−1, primarily driven by rising anthropogenic emissions in Asia. In contrast, interannual fluctuations are modulated by climate variability, represented by Multivariate ENSO Index. Comparison with satellite-retrieved AEC also reveals persistent model deficiencies, especially in representing volcanic aerosols. These findings highlight the importance of improving the aerosol wet scavenging schemes and provide a benchmark for future coordinated aerosol modeling and evaluation.
- Article
(16225 KB) - Full-text XML
-
Supplement
(1185 KB) - BibTeX
- EndNote


The upper troposphere is a crucial region of the Earth's atmosphere, acting as an efficient pathway for material originating in the lower troposphere to spread across hemispheric scales and even into the lower stratosphere. Although aerosol concentrations in the upper troposphere are generally much lower than in the boundary layer, their atmospheric lifetimes are longer, and their radiative and chemical influences can be disproportionately large (e.g., Boucher et al., 2013). One key role of upper tropospheric aerosols is serving as ice-nucleating particles that affect the formation and microphysical properties of cirrus clouds, which exert a net warming effect on the climate system by trapping outgoing longwave radiation (Kärcher and Lohmann, 2002; Kärcher, 2017). Aerosols also provide surfaces for heterogeneous chemical reactions leading to ozone destruction in the lower stratosphere (e.g., Solomon, 1999).
The Asian Summer Monsoon (ASM) exerts strong control on upper tropospheric composition. Deep convective heating during June-August drives a prominent upper-level anticyclonic circulation, known as the ASM anticyclone (ASMA), bounded by the subtropical westerly jet to the north and the tropical easterly jet to the south (e.g., Gettelman et al., 2004; Randel et al., 2010; Vogel et al., 2014; Legras and Bucci, 2020). Convective uplifting transports pollutants from the heavily polluted Asian boundary layer into the upper troposphere, where they accumulate within the ASMA (Randel and Park, 2006, Park et al., 2007; Santee et al., 2017). Dynamical instability of the ASMA frequently induces eddy shedding to the east and west, dispersing pollutants beyond the anticyclone boundary (e.g., Popovic and Plumb, 2001; Ungermann et al., 2016; Pan et al., 2016; Fadnavis et al., 2018; Wang et al., 2022). On larger scales, the vigorous ASM system interacts with the Walker and Hadley circulations and the stratospheric Brewer-Dobson circulation (Ploeger et al., 2017; Yan et al., 2019), extending its influence well beyond the monsoon region.
Satellite observations of carbon monoxide (CO) and other trace gases provide compelling evidence of monsoon-driven pollutant transport into the upper troposphere and tropopause region (Kar et al., 2004; Li et al., 2005; Jiang et al., 2007; Park et al., 2007, 2009; Randel et al., 2010; Pan et al., 2016; Santee et al., 2017; Liang et al., 2025; Wright et al., 2025). Although convective transport of aerosols by the ASM into the upper troposphere is generally considered to be less efficient because of strong wet scavenging in monsoon precipitation, observations from the space-borne Cloud-Aerosol Lidar with Orthogonal Polarization (CALIOP) instrument onboard the Cloud-Aerosol Lidar and Infrared Pathfinder Satellite Observations (CALIPSO) satellite reveal a recurrent enhancement of aerosol extinction near the Asian tropopause during July–August. This feature, known as the “Asian Tropopause Aerosol Layer” (ATAL), was first reported by Vernier et al. (2011, 2015) and has since been investigated using satellite, aircraft, and balloon observations as well as modeling studies (e.g., Yu et al., 2017; Vernier et al., 2018; Fadnavis et al., 2017, 2019; Ma et al., 2019; Hanumanthu et al., 2020; Mahnke et al., 2021; Pan et al., 2025). Figure 1 shows August 2010 CO concentrations at 100 hPa from the Microwave Limb Sounder (MLS) onboard the Aura satellite and the aerosol extinction coefficient (AEC) at 17 km from CALIOP, both exhibiting a pronounced “hot spot” in the ASMA region (indicated by the white rectangular box in Fig. 1). Recent studies using information from the NASA Modern-Era Reanalysis for Research and Applications version 2 (MERRA-2) system further reveals chimney-like transport structures over northern India and southwestern China that effectively ventilate surface pollutants into the upper troposphere and lower stratosphere (UTLS) (Lau et al., 2018; Gao et al., 2023). These studies have demonstrated the key role of ASM in shaping upper tropospheric composition.
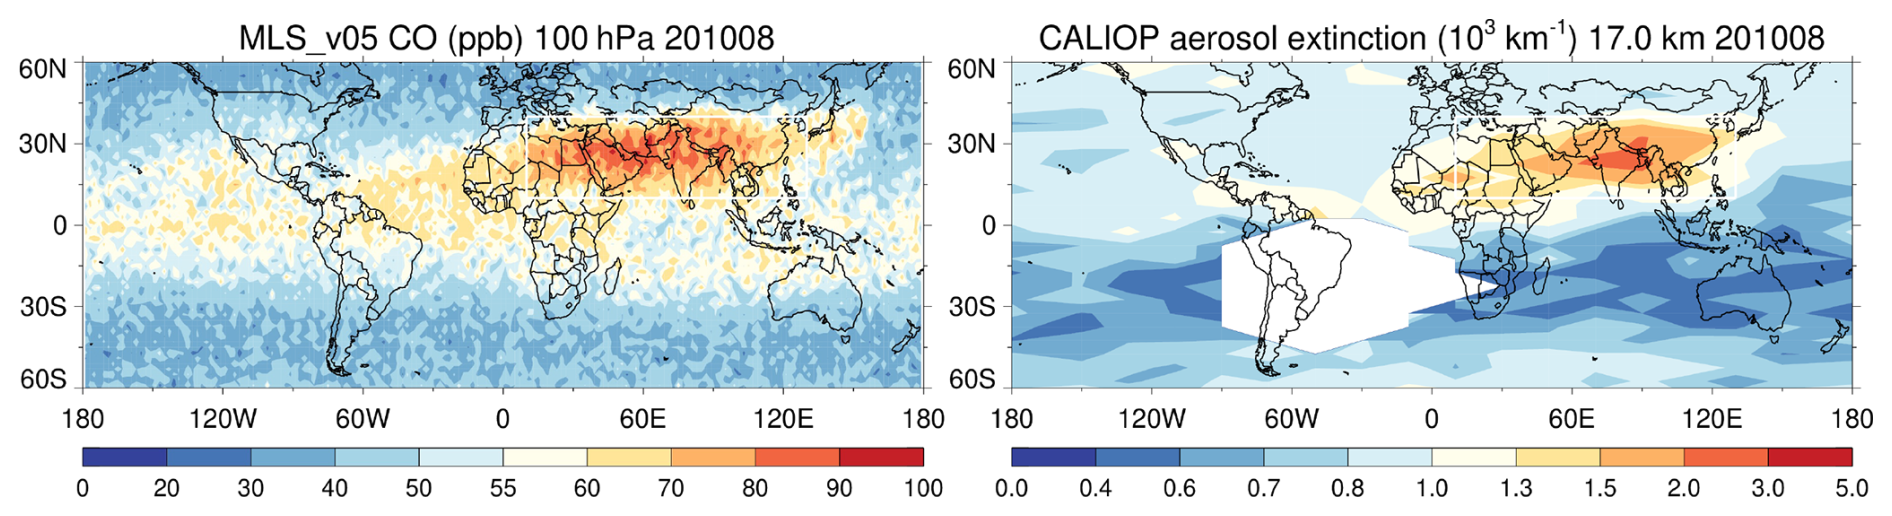
Figure 1Satellite data showing the August 2010 monthly composites of CO concentrations from Aura/MLS at 100 hPa (left; Aura MLS CO L2 V5) and aerosol extinction coefficient (AEC) from CALIOP at 17 km altitude (right; CALIOP L3 Stratospheric APRO V1.00). The white rectangular box denotes the nominal ASMA region (10–40° N, 10–130° E), modified from Santee et al. (2017).
Asia has the highest anthropogenic emissions of aerosols and precursor gases (e.g., Hoesly et al., 2018; Soulie et al., 2024), yet it remains uncertain how strongly upper tropospheric aerosol trends reflect surface emission changes. Additionally, interannual variability in upper tropospheric aerosol arises from a complex interplay among transport, wet scavenging, chemistry, and circulation variability, each of which may differ considerably across the models, and remains difficult to evaluate observationally. Additionally, the influence of climate variability on upper tropospheric aerosols over the ASM region is not fully understood.
To address these issues, an internationally coordinated modeling effort was initiated in the framework of the Aerosol Comparisons between Observations and Models (AeroCom), namely the UTLS model experiment, which is a part of the AeroCom Phase-III studies. AeroCom is an open international initiative involving more than 20 global modeling groups and numerous observational teams, aimed at evaluating aerosol processes across models, identifying sources of model-observation differences, and accessing a wide range of aerosol environmental impacts (https://aerocom.met.no/, last access: 27 April 2026). Since its inception in 2002, AeroCom has organized numerous multi-model experiments, targeting various topics including aerosol composition, chemical, physical, and optical properties, trends, radiative forcing, aerosol-cloud interaction, impacts on environment and climate, etc. (see https://aerocom.met.no/publications/, last access: 27 April 2026 for published results from previous AeroCom studies). AeroCom is also in alliance with another international initiative, the International Satellite Aerosol Science Network (a.k.a. AeroSat, https://aero-sat.org/, last access: 27 April 2026), since 2013 to foster a close collaboration between the global modelling and observation communities.
This study reports results from the AeroCom Phase-III UTLS model experiment to study the aerosol variability and trends in the upper troposphere with multiple global model simulations (https://aerocom.met.no/experiments/UTLS/, last access: 27 April 2026), a subject that had not been investigated in previous AeroCom studies. The UTLS experiment was also developed in cooperation with the IGAC/APARC Atmospheric Composition and the Asian Monsoon (ACAM) activity (https://www2.acom.ucar.edu/acam/, last access: 27 April 2026). In that context, our present study focuses on the upper tropospheric ASM region to (1) evaluate the model-simulated AEC from the participating models against available satellite observations; (2) diagnose inter-model differences in AEC and quantitatively attribute them to transport and removal processes; and (3) assess two-decadal (2000–2018) trends and interannual variability of aerosols and examine their relationships with anthropogenic emissions, transport, removal, and climate variability.
The model experiment setup and satellite AEC datasets are described in Sect. 2. Results are presented in Sect. 3, including model-observation comparisons, process attribution using diagnostic tracers, and assessments of aerosol trends and variability. Outstanding issues and broader implications are discussed in Sect. 4, followed by conclusions in Sect. 5.
2.1 Description of the UTLS model simulation requirements
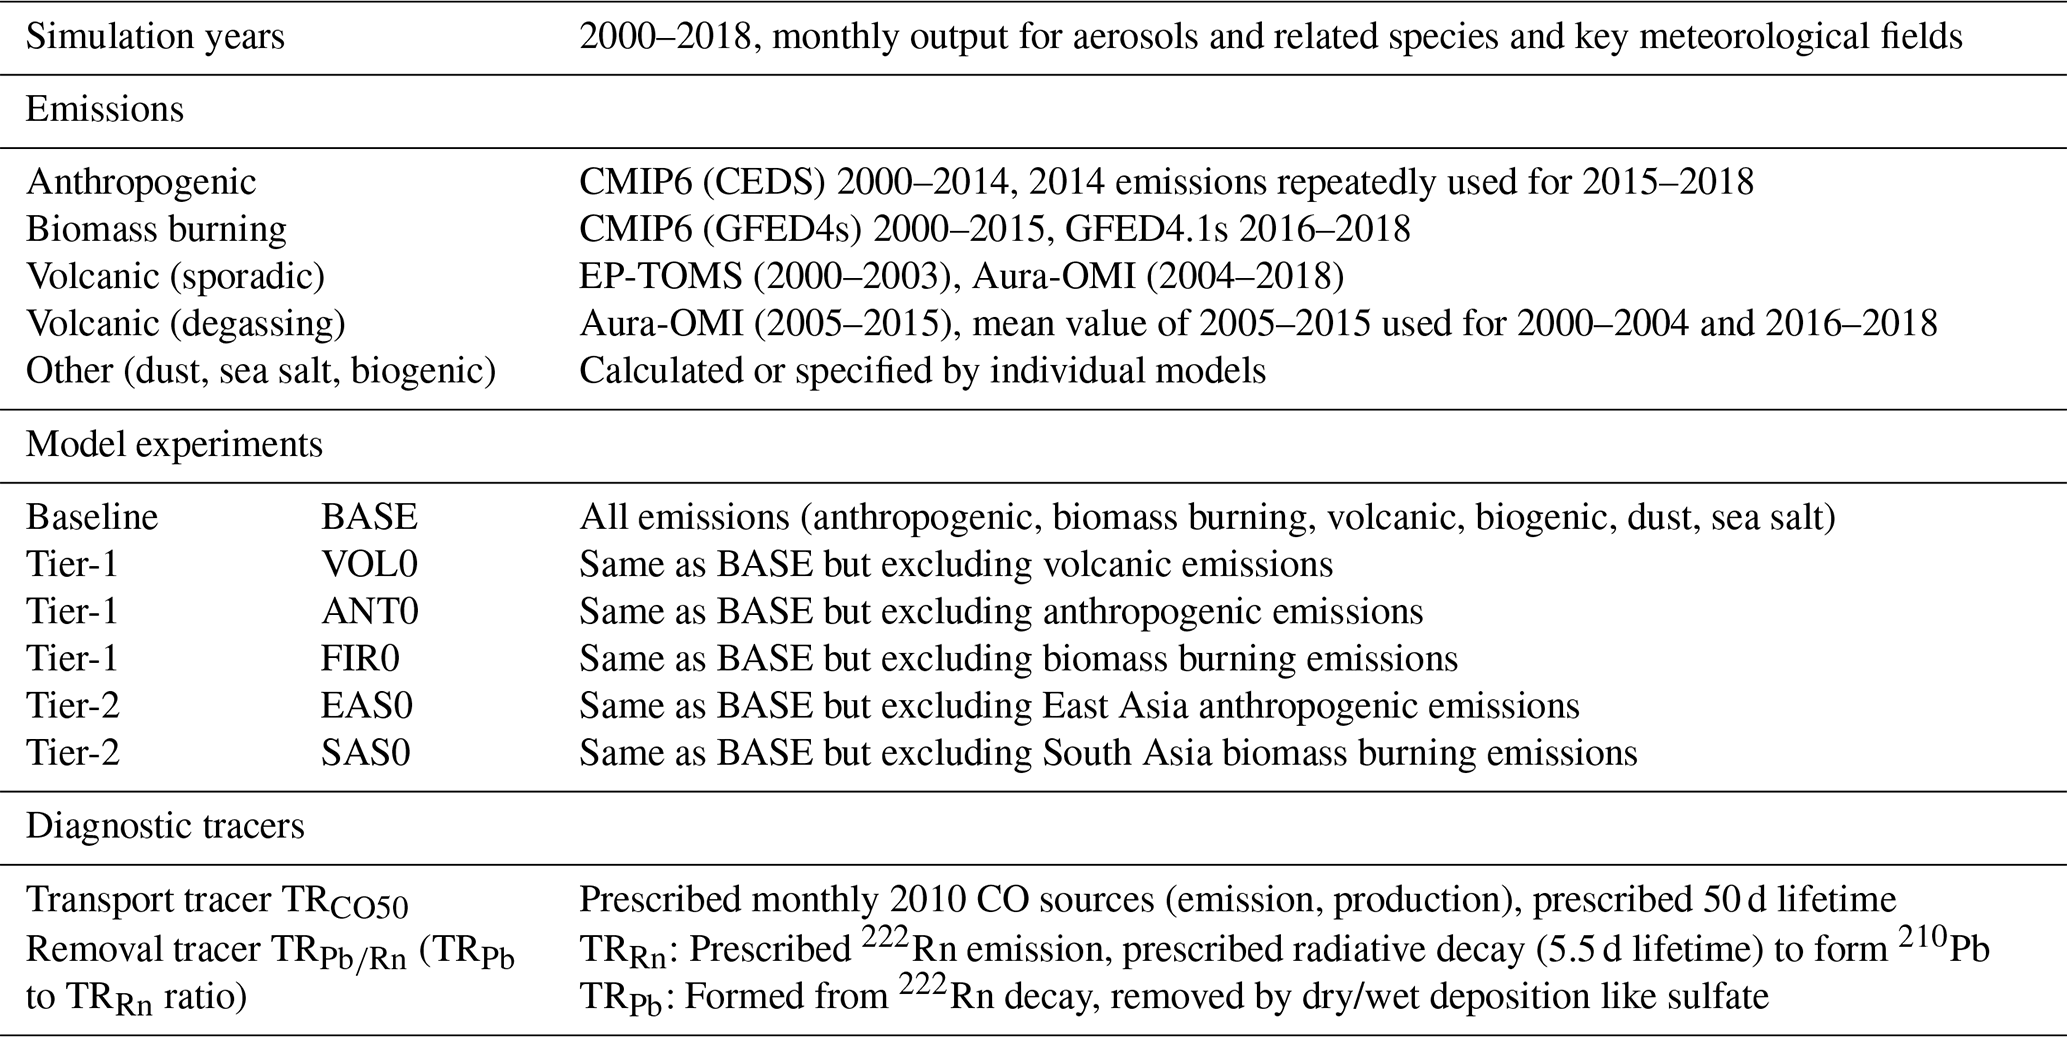
The AeroCom UTLS model experiment (summarized in Table 1) consists of global simulations spanning a 19-year period (2000–2018). To facilitate inter-model comparability, all participating models used the same prescribed anthropogenic, biomass burning, and volcanic sources. In contrast, natural emissions of dust, sea salt, and biogenic species were either specified or calculated within each model to reflect meteorology-dependent variations.
Emissions from anthropogenic and biomass burning sources are taken from the datasets prepared for the Coupled Model Intercomparison Project phase 6 (CMIP6). Specifically, anthropogenic emissions for 2000–2014 are from the Community Emission Data System (CEDS; Hoesly et al., 2018), with 2014 emissions repeated for 2015–2018 due to the lack of later CMIP6 estimates. Biomass burning emission for 2000–2015 are based on the Global Fire Emission Dataset version 4s (GFED4s) (van Marle et al., 2017; van der Werf et al., 2017), with the 2016–2018 period supplemented by GFED4.1s (van der Werf et al., 2017) to ensure temporal continuity. Emitted species include primary aerosols (black carbon, BC; organic carbon, OC) and gas-phase precursors of secondary aerosols (sulfur dioxide, SO2; nitrogen oxides, NOx; ammonia, NH3; volatile organic compounds, VOC).
Volcanic SO2 emissions and injection height for sporadic eruptions are derived from satellite observations – Total Ozone Mapping Spectrometer (EP-TOMS) on Earth Probe for 2000–2003 and Ozone Monitoring Instrument (OMI) on Aura for 2004–2018 (Carn et al., 2015, 2017; Carn, 2025). The two datasets are considered consistent for long-term records of sporadic eruptions, as OMI was designed to continue the TOMS data record (Thomas and Watson, 2010), although OMI offers superior detection of small-scale degassing due to higher spatial and spectral resolution. Continuous volcanic degassing emissions follow OMI-based estimates for 2005–2015, with the 2005–2015 climatological means of each volcano applied outside of that range.
The model experiment includes a baseline simulation (BASE) that incorporates all emissions, and two tiers of sensitivity experiments. Tier-1 experiments exclude volcanic (VOL0), anthropogenic (ANT0), or biomass burning (FIR0) emissions to quantify source specific impacts, whereas Tier-2 experiments assess regional sensitivities by removing anthropogenic emissions in East Asia (EAS0) or South Asia (SAS0). In this study, we focus on BASE and VOL0 simulations to target aerosols originating from tropospheric, non-volcanic sources.
Participating modelling groups also implement a suite of standardized tracers to diagnose inter-model and interannual variability in transport and removal processes. Large-scale transport is evaluated using a CO-like tracer, TRCO50, with prescribed monthly CO anthropogenic and biomass burning emissions from 2010 CMIP6 dataset and specified secondary CO production sources from methane and non-methane VOC oxidations (see Sect. S1 in the Supplement). The same annual cycle is repeated each year during 2000–2018. A uniform 50 d atmospheric lifetime is applied as the sole sink for TRCO50. Because the source and sink terms are identical across all models and all simulation years, any spatiotemporal differences in the simulated TRCO50 distributions can be attributed exclusively to model-dependent transport processes and underlying meteorology.
Aerosol removal processes are tracked by a pair of lead (210Pb) and radon (222Rn) tracers, referred here as TRPb and TRRn, respectively. TRRn is emitted from land surfaces (Zhang et al., 2021, 2011) and decays with a 5.5 d lifetime to form TRPb, which attaches to fine-mode aerosols and is removed via dry and wet depositions (Balkanski et al., 1993; Liu et al., 2001). In this experiment, TRPb removal follows the treatment of sulfate aerosol in each individual model. We use the TRPb to TRRn ratio, denoted as TR, to diagnose removal efficiency, because it isolates the removal from the variability of the precursor distributions; lower TR values indicate more efficient aerosol removal and shorter atmospheric residence times.
2.2 Participating model configurations
Nine modeling groups from the United States, Japan, China, and India/Finland contributed global simulations to the AeroCom UTLS model experiment (Table 2), though not all models ran the full experiment suite. Models vary in horizontal resolution (0.56 to 2.5°) and vertical resolution (30 to 72 layers).
Table 2Participating models in AeroCom UTLS model experiment.
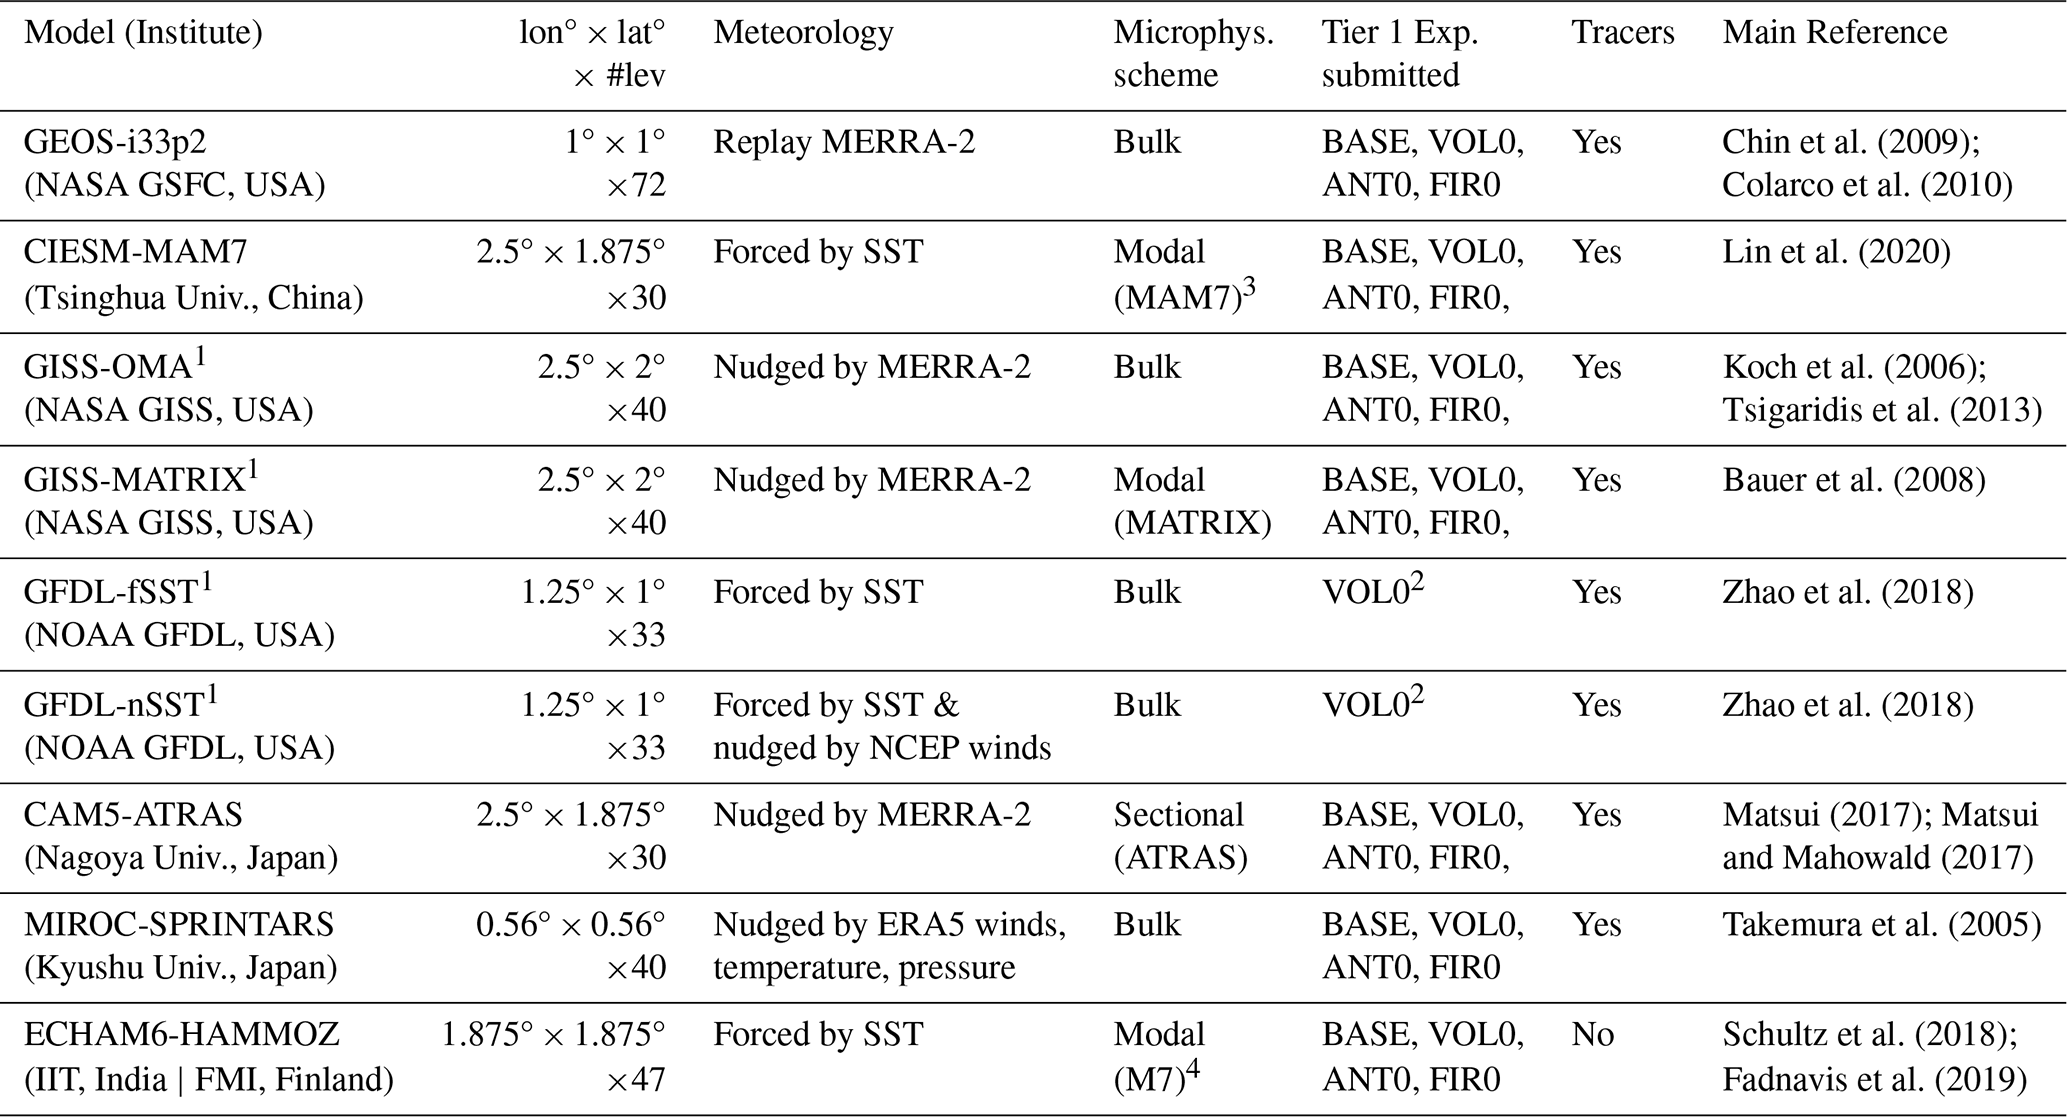
1 Complete model names: GISS-ModelE2p1p1-OMA, GISS-ModelE2p1p1-MATRIX, GFDL-AM4-fSST, GFDL-AM4-nSST. 2 Because the GFDL BASE simulations do not include volcanic emissions, its BASE output is designated as VOL0. 3 Liu et al. (2012). 4 Vignati et al. (2004).
The experimental ensemble represents two distinct approaches to meteorological forcing: Reanalysis-forced and General Circulation Model (GCM)-driven. While three models (CIESM-MAM7, GFDL-fSST, and ECHAM6-HAMMOZ) are free-running GCMs forced by observed sea surface temperatures (SST), the majority of the models (six) are driven by reanalysis-based meteorology, including MERRA-2 (used by GEOS-i33p2, CISS-OMA, GISS-MATRIX, CAM5-ATRAS), National Center for Environmental Prediction (NCEP) (used by GFDL-nSST), and ECMWF Atmospheric Reanalysis Version 5 (ERA5) (used by MIROC-SPRINTARS).
Aerosol microphysics schemes also differ. Five models use bulk aerosol schemes simulating mass concentrations with fixed size bins and considering particle growth as a function of ambient relative humidity, whereas four models employ more advanced microphysical schemes (either modal or sectional) for treatment of aerosol mixing states and particle size distributions.
Additionally, only GEOS-i33p2 accounts for the stratospheric background sulfate aerosol produced from carbonyl sulfide (OCS) oxidation, which is an important stratospheric aerosol source but is omitted in other models.
2.3 Satellite aerosol extinction data in the UTLS
Aerosol extinction vertical profiles in the UTLS are available from both active (lidar) and the limb-scatter satellite instruments. For evaluating BASE model simulations, we use the Level-3 (L3) monthly gridded AEC products from the space-borne lidar CALIOP (Kar et al., 2019) and from three limb-scatter instruments: the Optical Spectrograph and InfraRed Imaging System (OSIRIS) on the Odin satellite (Bourassa et al., 2012; Rieger et al., 2015, 2019), the Scanning Imaging Absorption Spectrometer for Atmospheric Chartography (SCIAMACHY) on the Envisat satellite (Burrows et al., 1995; Bovensmann et al., 1999; Malinina et al., 2018; Noël et al., 2020), and the Ozone Mapper and Profiler Suite Limb Profiler (OMPS LP) on the Suomi-NPP satellite (Taha et al., 2021). Table 3 lists brief information about these products.
Table 3Satellite products of aerosol extinction coefficient profiles in the UTLS.
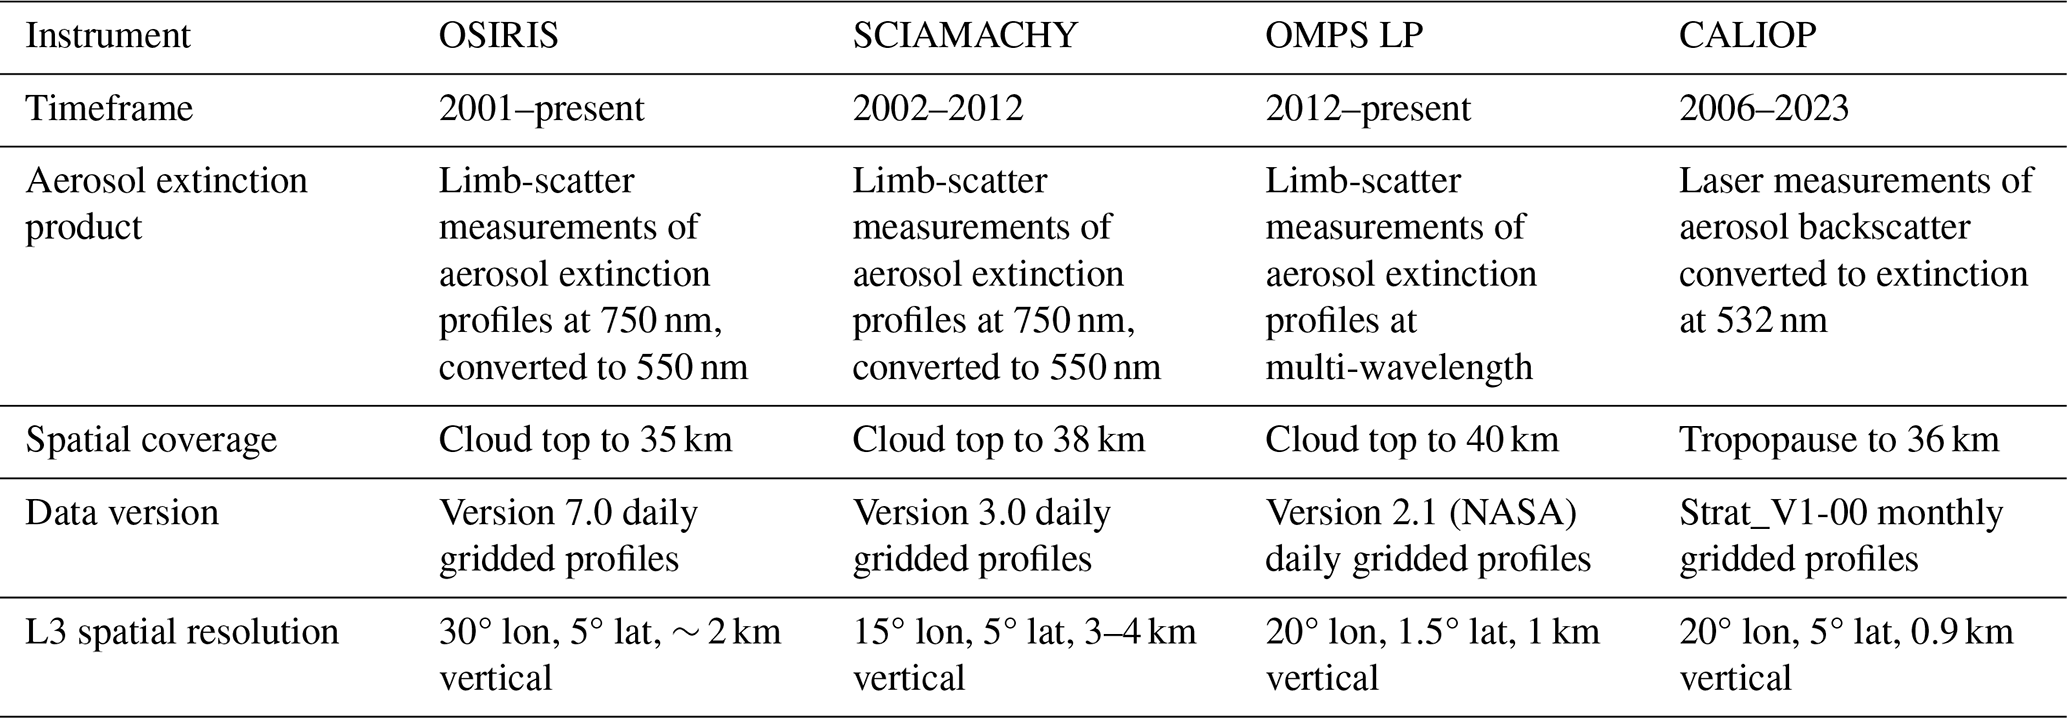
Among the satellite products, OSIRIS provides the longest temporal overlap (2001–2018) with the study period, followed by CALIOP (mid 2006–2018), SCIAMACHY (2002–2012), and OMPS LP (2012–2018). AEC products from the limb-scatter instruments at 750 nm are converted to 550 nm by multiplying a factor of 2.0 (based on typical Ångström Exponent of 2.2) while AEC from CALIOP is used at its native wavelength of 532 nm. Noted, retrievals of AEC in the upper troposphere and near the tropopause are especially challenging due to the frequent co-existence of aerosols and cirrus clouds, which limits the reliability and representativeness of aerosols retrieved from the measured signals (e.g., Kremser et al., 2016; Langille et al., 2025).
3.1 Comparisons of AEC between observations and models in the UTLS ASMA region
We compare the time series of monthly mean AEC at 550 nm (2002–2018) from the model BASE simulations with four satellite products in the ASMA region (10–40° N, 10–130° E, indicated in Fig. 1). Comparisons are performed at altitudes near the tropopause (∼ 100 hPa or 16.5 km, Fig. 2) and in the lower stratosphere (∼ 70 hPa or 19.5 km, Fig. 3). At altitudes below the tropopause, satellite retrievals are subject to larger uncertainties with little L3 data available over the ASMA region because of increased cloud presence that makes aerosol retrievals more difficult. Considering that the L3 satellite data represent the monthly composite of all available measurements falling within a particular month in the locations bounded by the spatial grids while the model results are monthly means of spatially and temporally continuous simulations without coverage gaps, the comparisons shown in Fig. 2 and 3 should be considered in a broad sense, such as magnitudes, seasonal cycles, and interannual variations, rather than absolute numerical agreement.
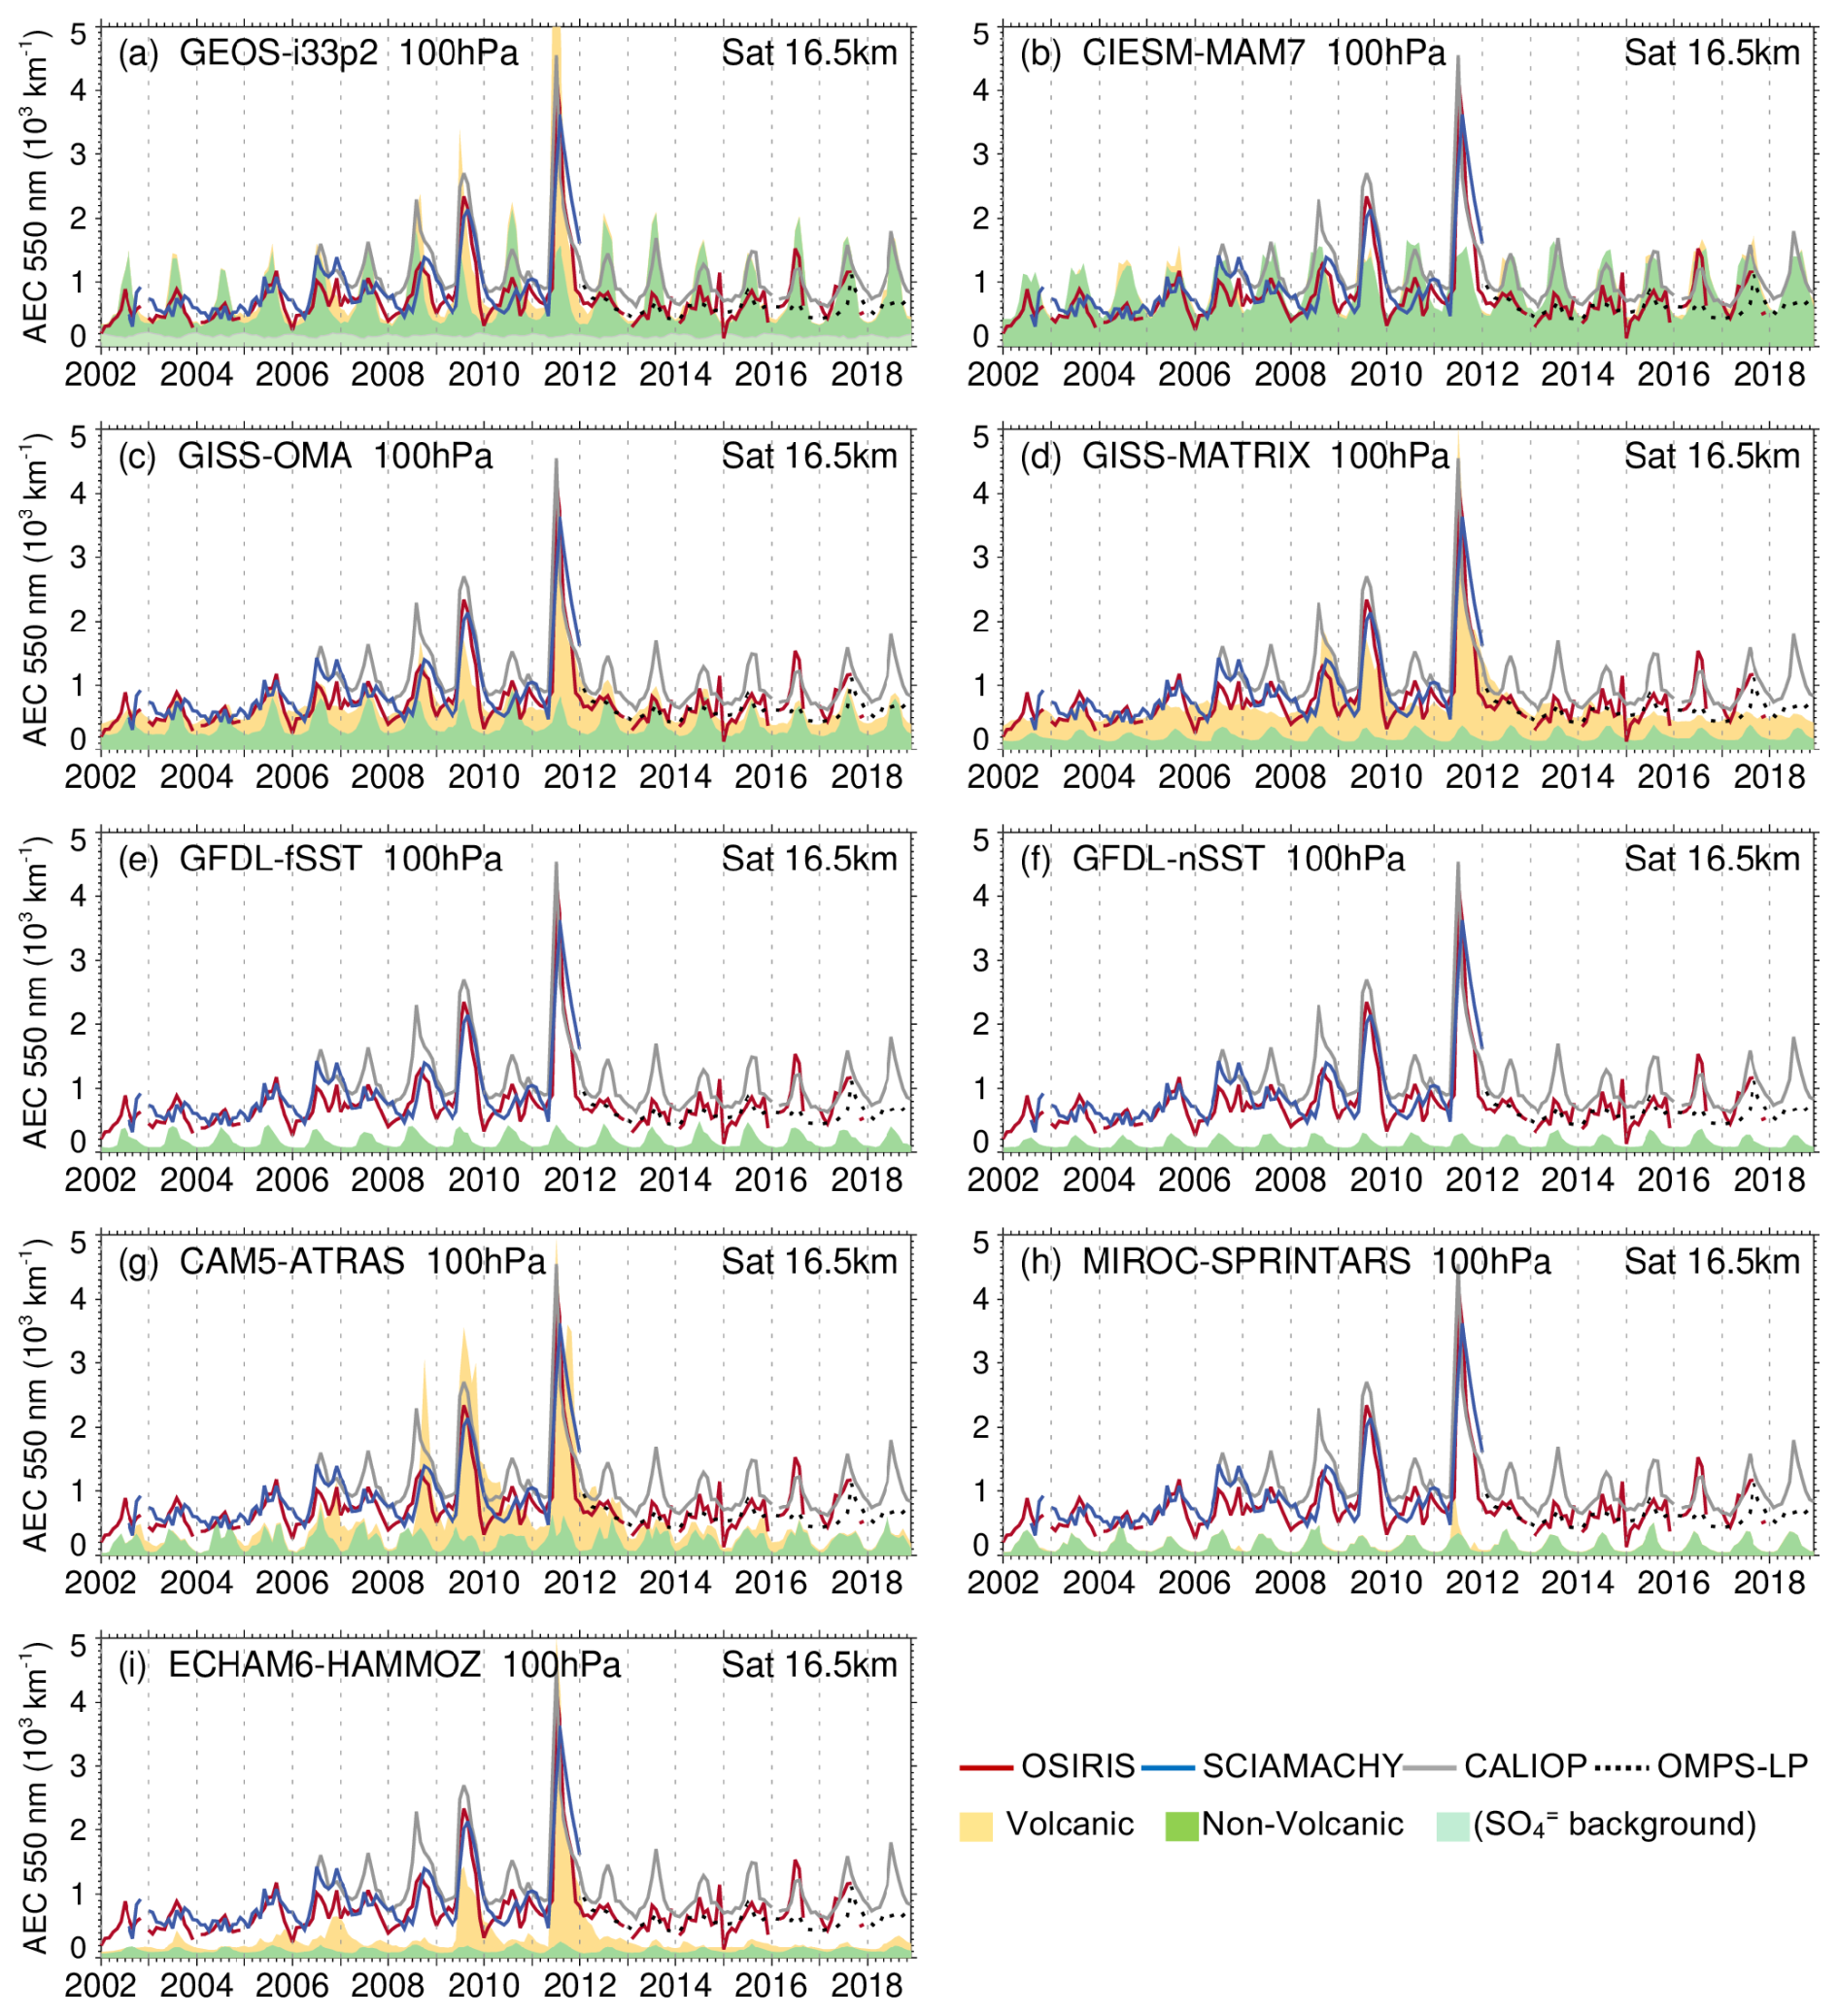
Figure 2Comparisons of monthly AEC (2002–2018) near the tropopause over the ASMA region from nine participating models' BASE simulations at 100 hPa (color-shading) against four satellite products at 16.5 km altitude (lines). Model-simulated non-volcanic and volcanic AEC are shown in green and yellow shadings, respectively. In GEOS-i33p2 model (a), light green shading indicates the contribution of background sulfate aerosol formed by OCS oxidation (not included in other models). Note that the GFDL models (e, f) do not include volcanic emissions in their BASE simulations.
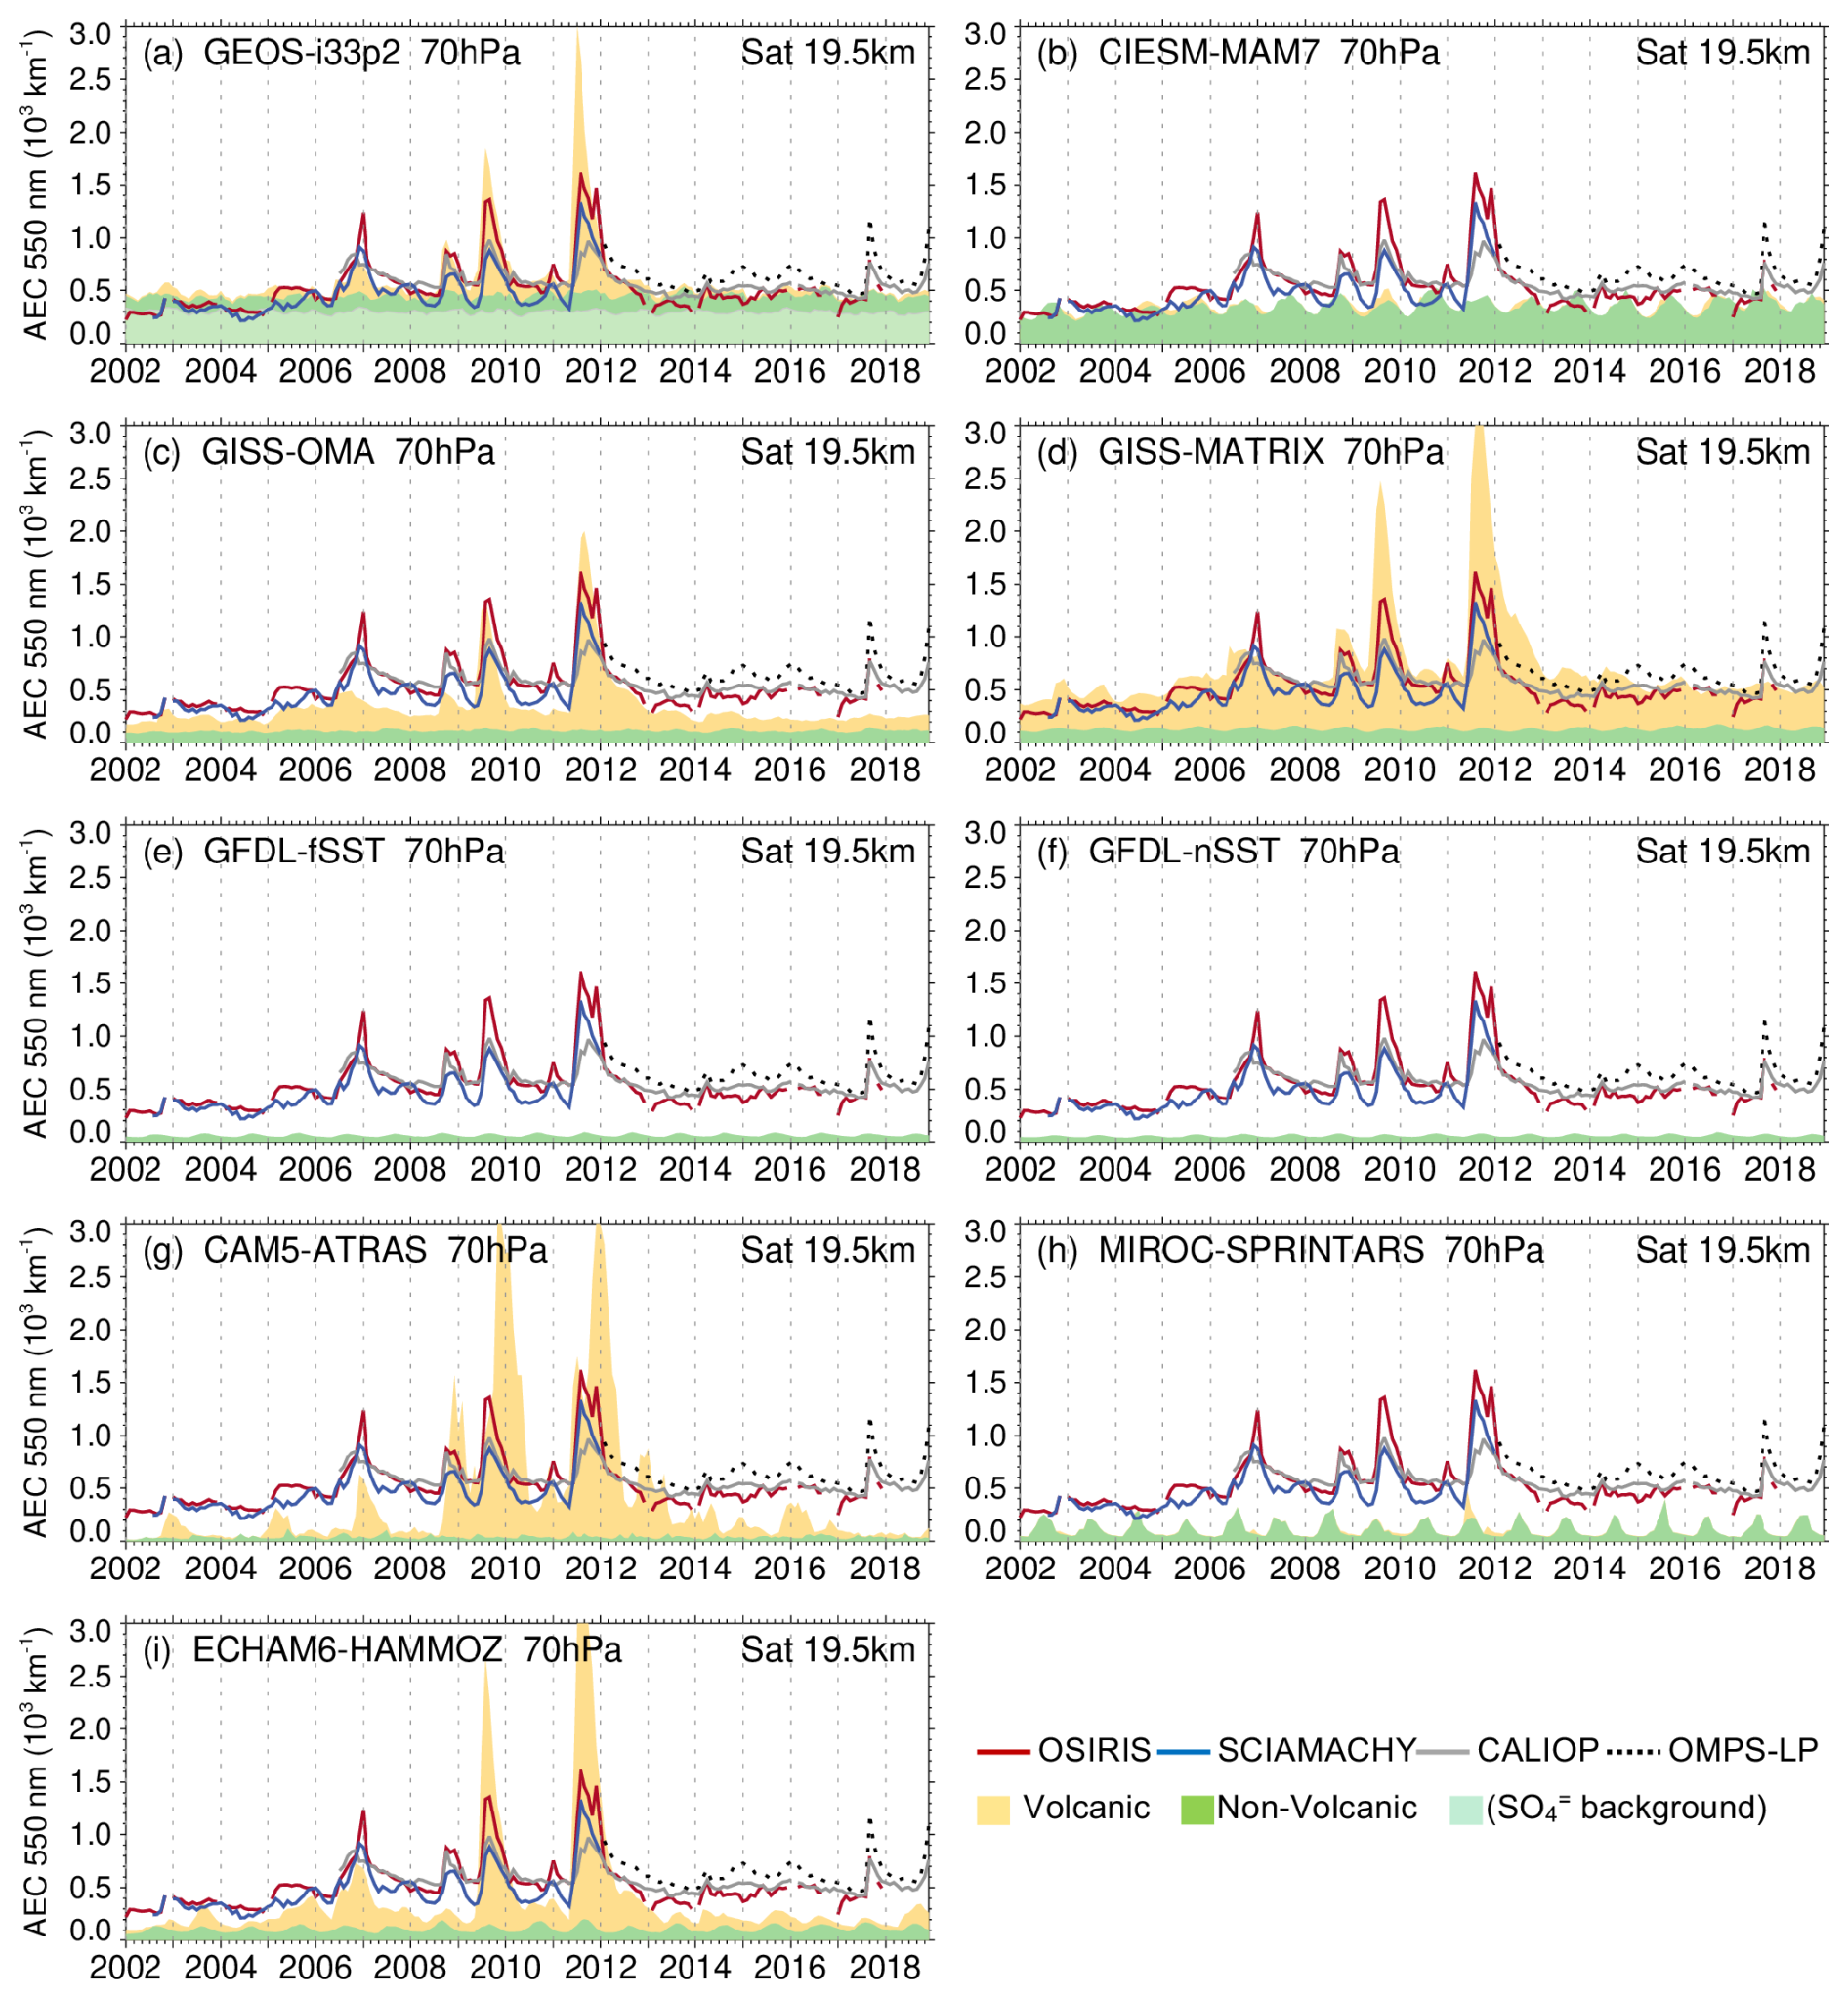
The Tier-1 experiments allow separation of model-simulated aerosols into volcanic (yellow shading in Figs. 2 and 3) and non-volcanic (green shading) aerosols, where non-volcanic aerosols include anthropogenic, biomass burning, and other natural aerosols. Several features emerge from Figs. 2 and 3. First, model-simulated non-volcanic aerosols exhibit clear seasonal cycles, especially at 100 hPa, with maxima in boreal summer and minima in winter. This behavior reflects ASM-driven convective transport, though the magnitude of aerosols reaching the tropopause and lower stratosphere varies considerably across models. The largest non-volcanic AEC values occur in CIESM-MAM7 (panel b) and the smallest in GFDL (panels e and f) in general.
Second, sporadic volcanic eruptions, such as Sarychev Peak in the Kuril Islands of Russia in 2009 and Nabro in the Southern Red Sea Region of Eritrea in 2011, produce large perturbations in AEC, leading to significant year-to-year variability. Despite using identical prescribed volcanic SO2 emissions (Sect. 2.1), models produce markedly different volcanic AEC contributions, likely driven by differences in the implementation of volcanic plume injection heights, sulfate formation rates, and aerosol microphysical and/or optical properties. For example, volcanic influences are negligible in CIESM-MAM7 (panel b) and MIROC-SPRINTARS (panel h) even during years with large volcanic eruptions, while in GISS-MATRIX (panel d) volcanic aerosols accounts for more than half of total AEC even in the years without much volcanic eruptions.
Third, the GEOS-i33p2 (panel a) simulations suggest that background sulfate aerosol from OCS oxidation contributes substantially to stratospheric AEC, accounting for 70 %–80 % of non-volcanic AEC at 70 hPa (Fig. 3), although this source has a minor contribution (about 10 %) at 100 hPa (Fig. 2). Such source is not included in other models.
Lastly, differences also exist among the satellite AEC products, with CALIOP (grey line) generally showing higher AEC than the limb-scatter instrument retrievals near the tropopause (Fig. 2), although the inter-satellite variability is much smaller than the inter-model spread.
To mitigate the large uncertainties associated with model-specific treatment of volcanic and background aerosols, which are less relevant to ASM-driven processes, we focus the remainder of the analysis on model simulations of non-volcanic aerosols from VOL0 experiment at 150 hPa representing upper tropospheric conditions most affected by the monsoon dynamics.
3.2 Model-simulated non-volcanic aerosols in the upper troposphere
We begin by analyzing model results for August 2012 as a representative case to illustrate the inter-model spread. Monthly mean non-volcanic AEC at 550 nm in August 2012, based on models' VOL0 simulations, are shown in Fig. 4 for horizontal distributions at 150 hPa and in Fig. 5 for longitude-pressure vertical cross-section in the 10–40° N latitudinal band.
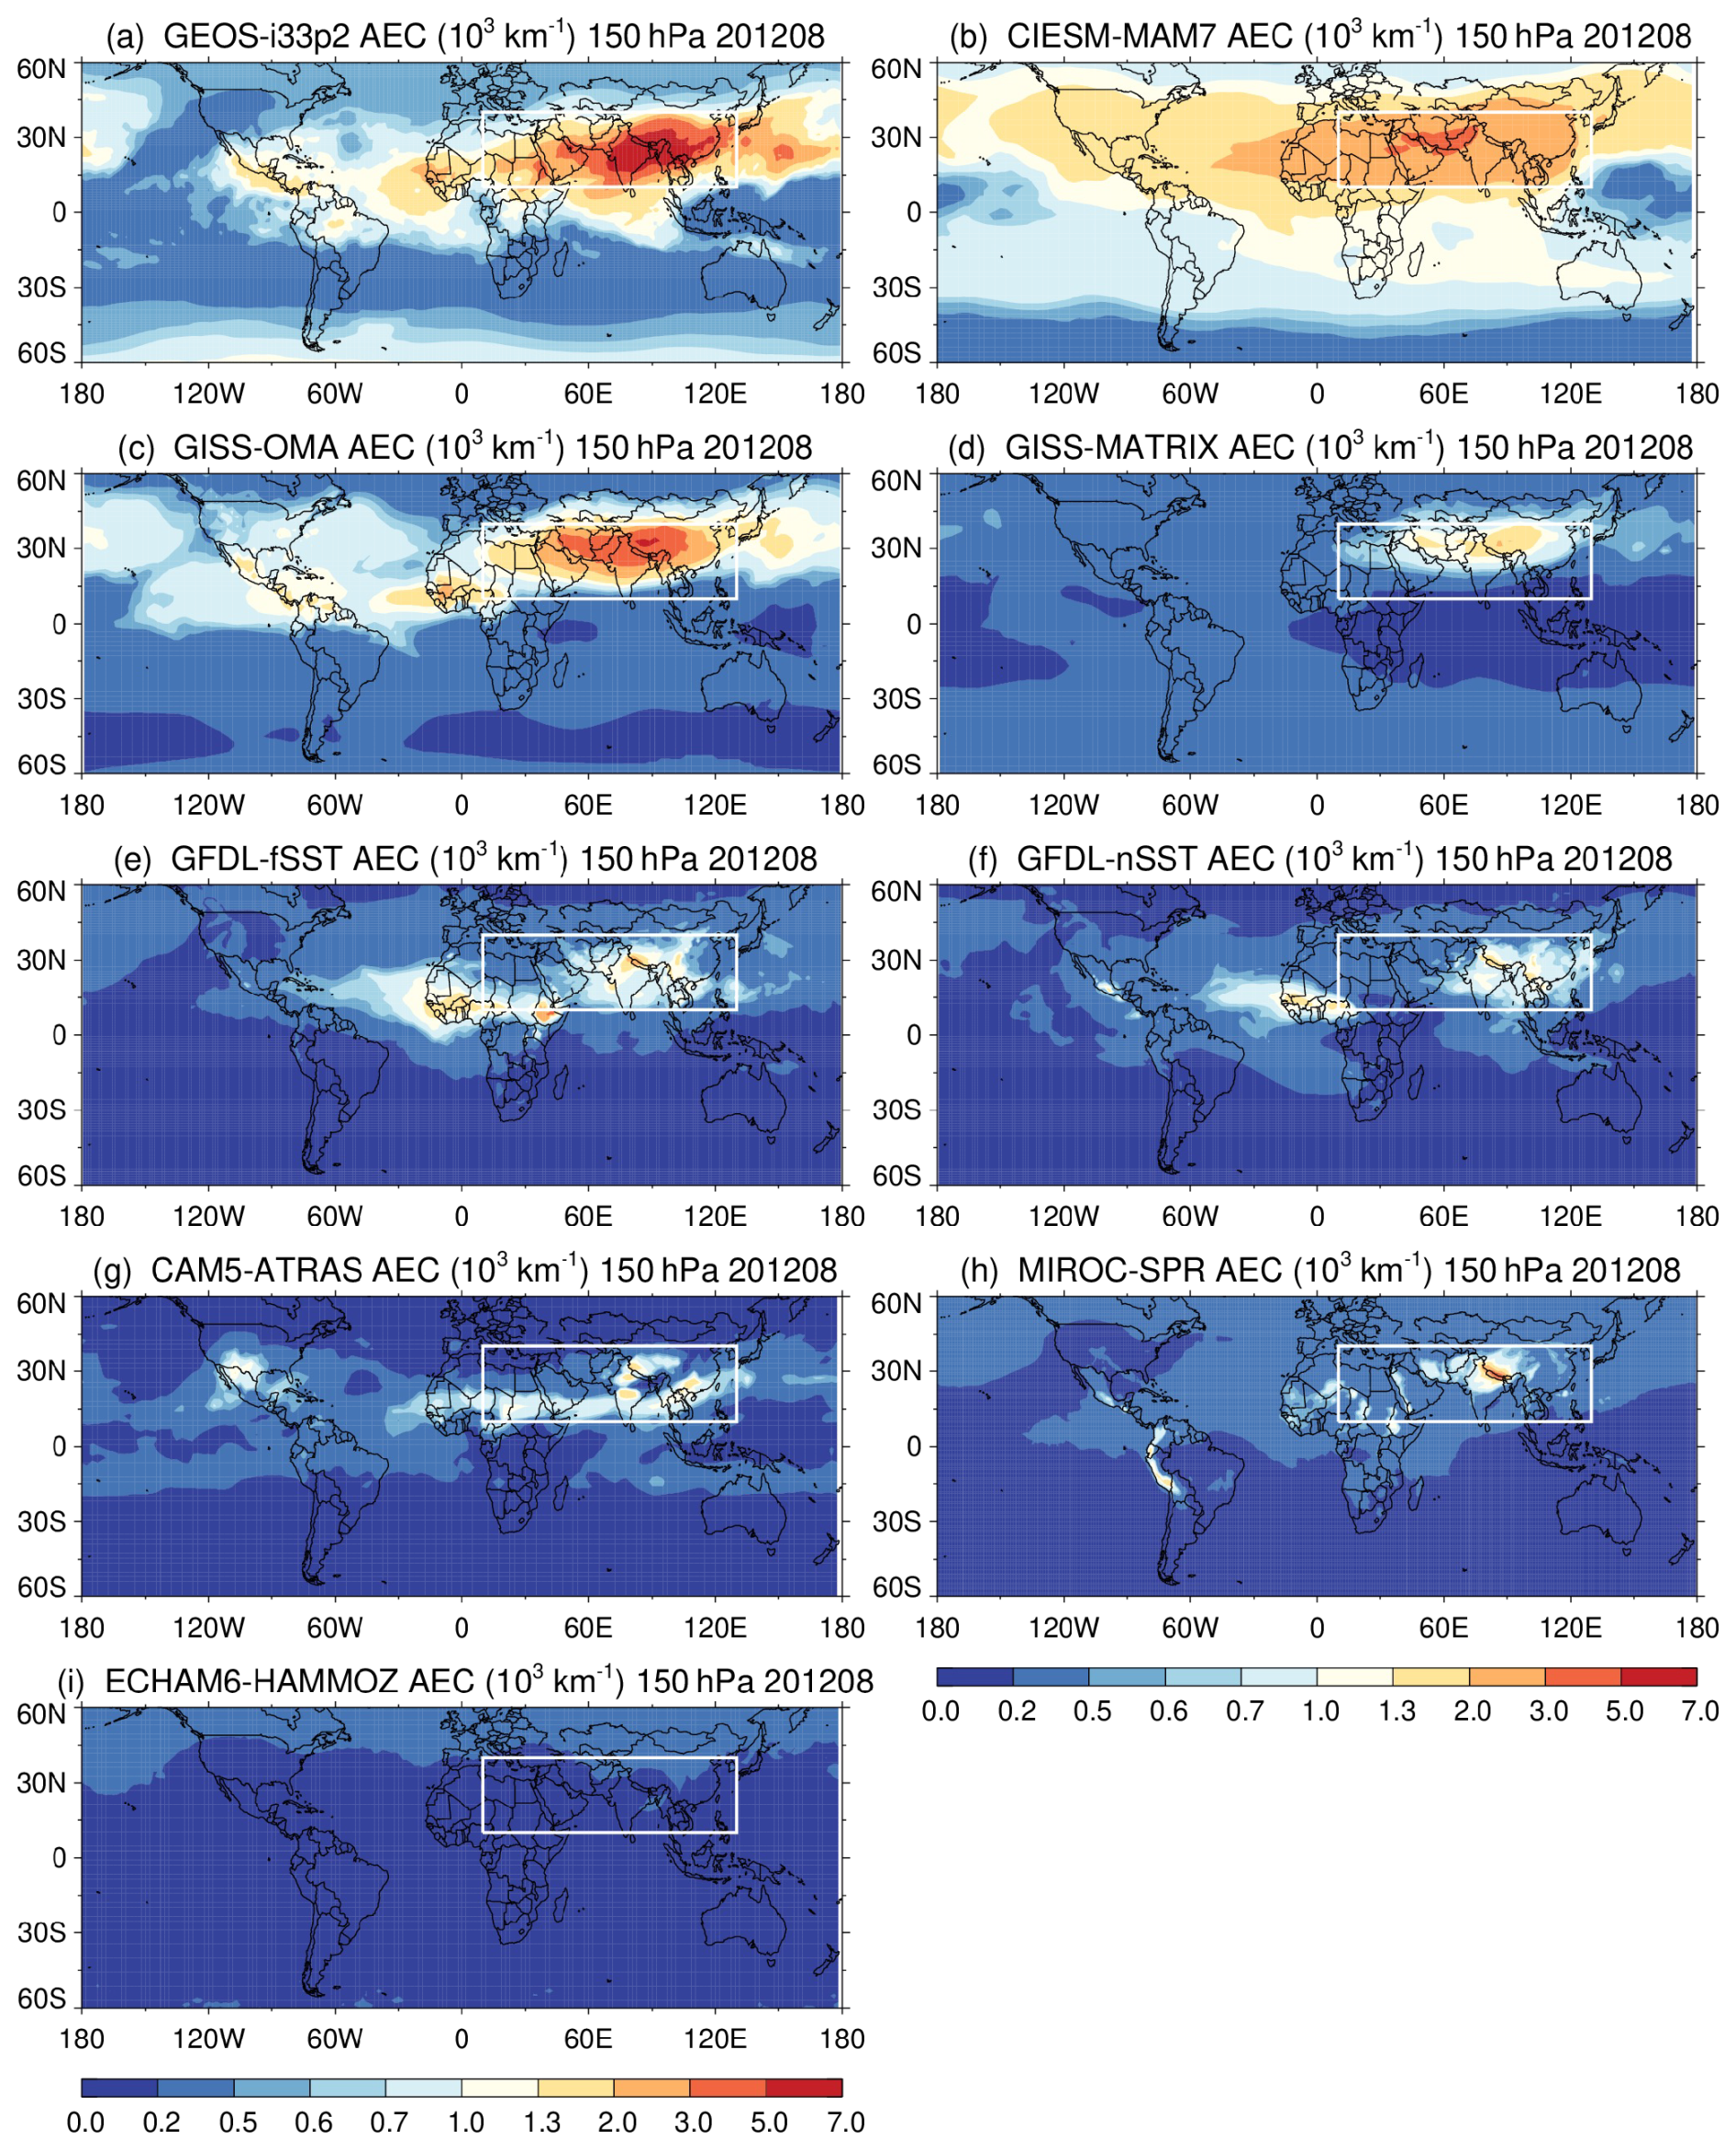
Figure 4Model-simulated non-volcanic AEC at 150 hPa in August 2012 from the VOL0 experiment. The rectangular box marks the nominal ASMA region.
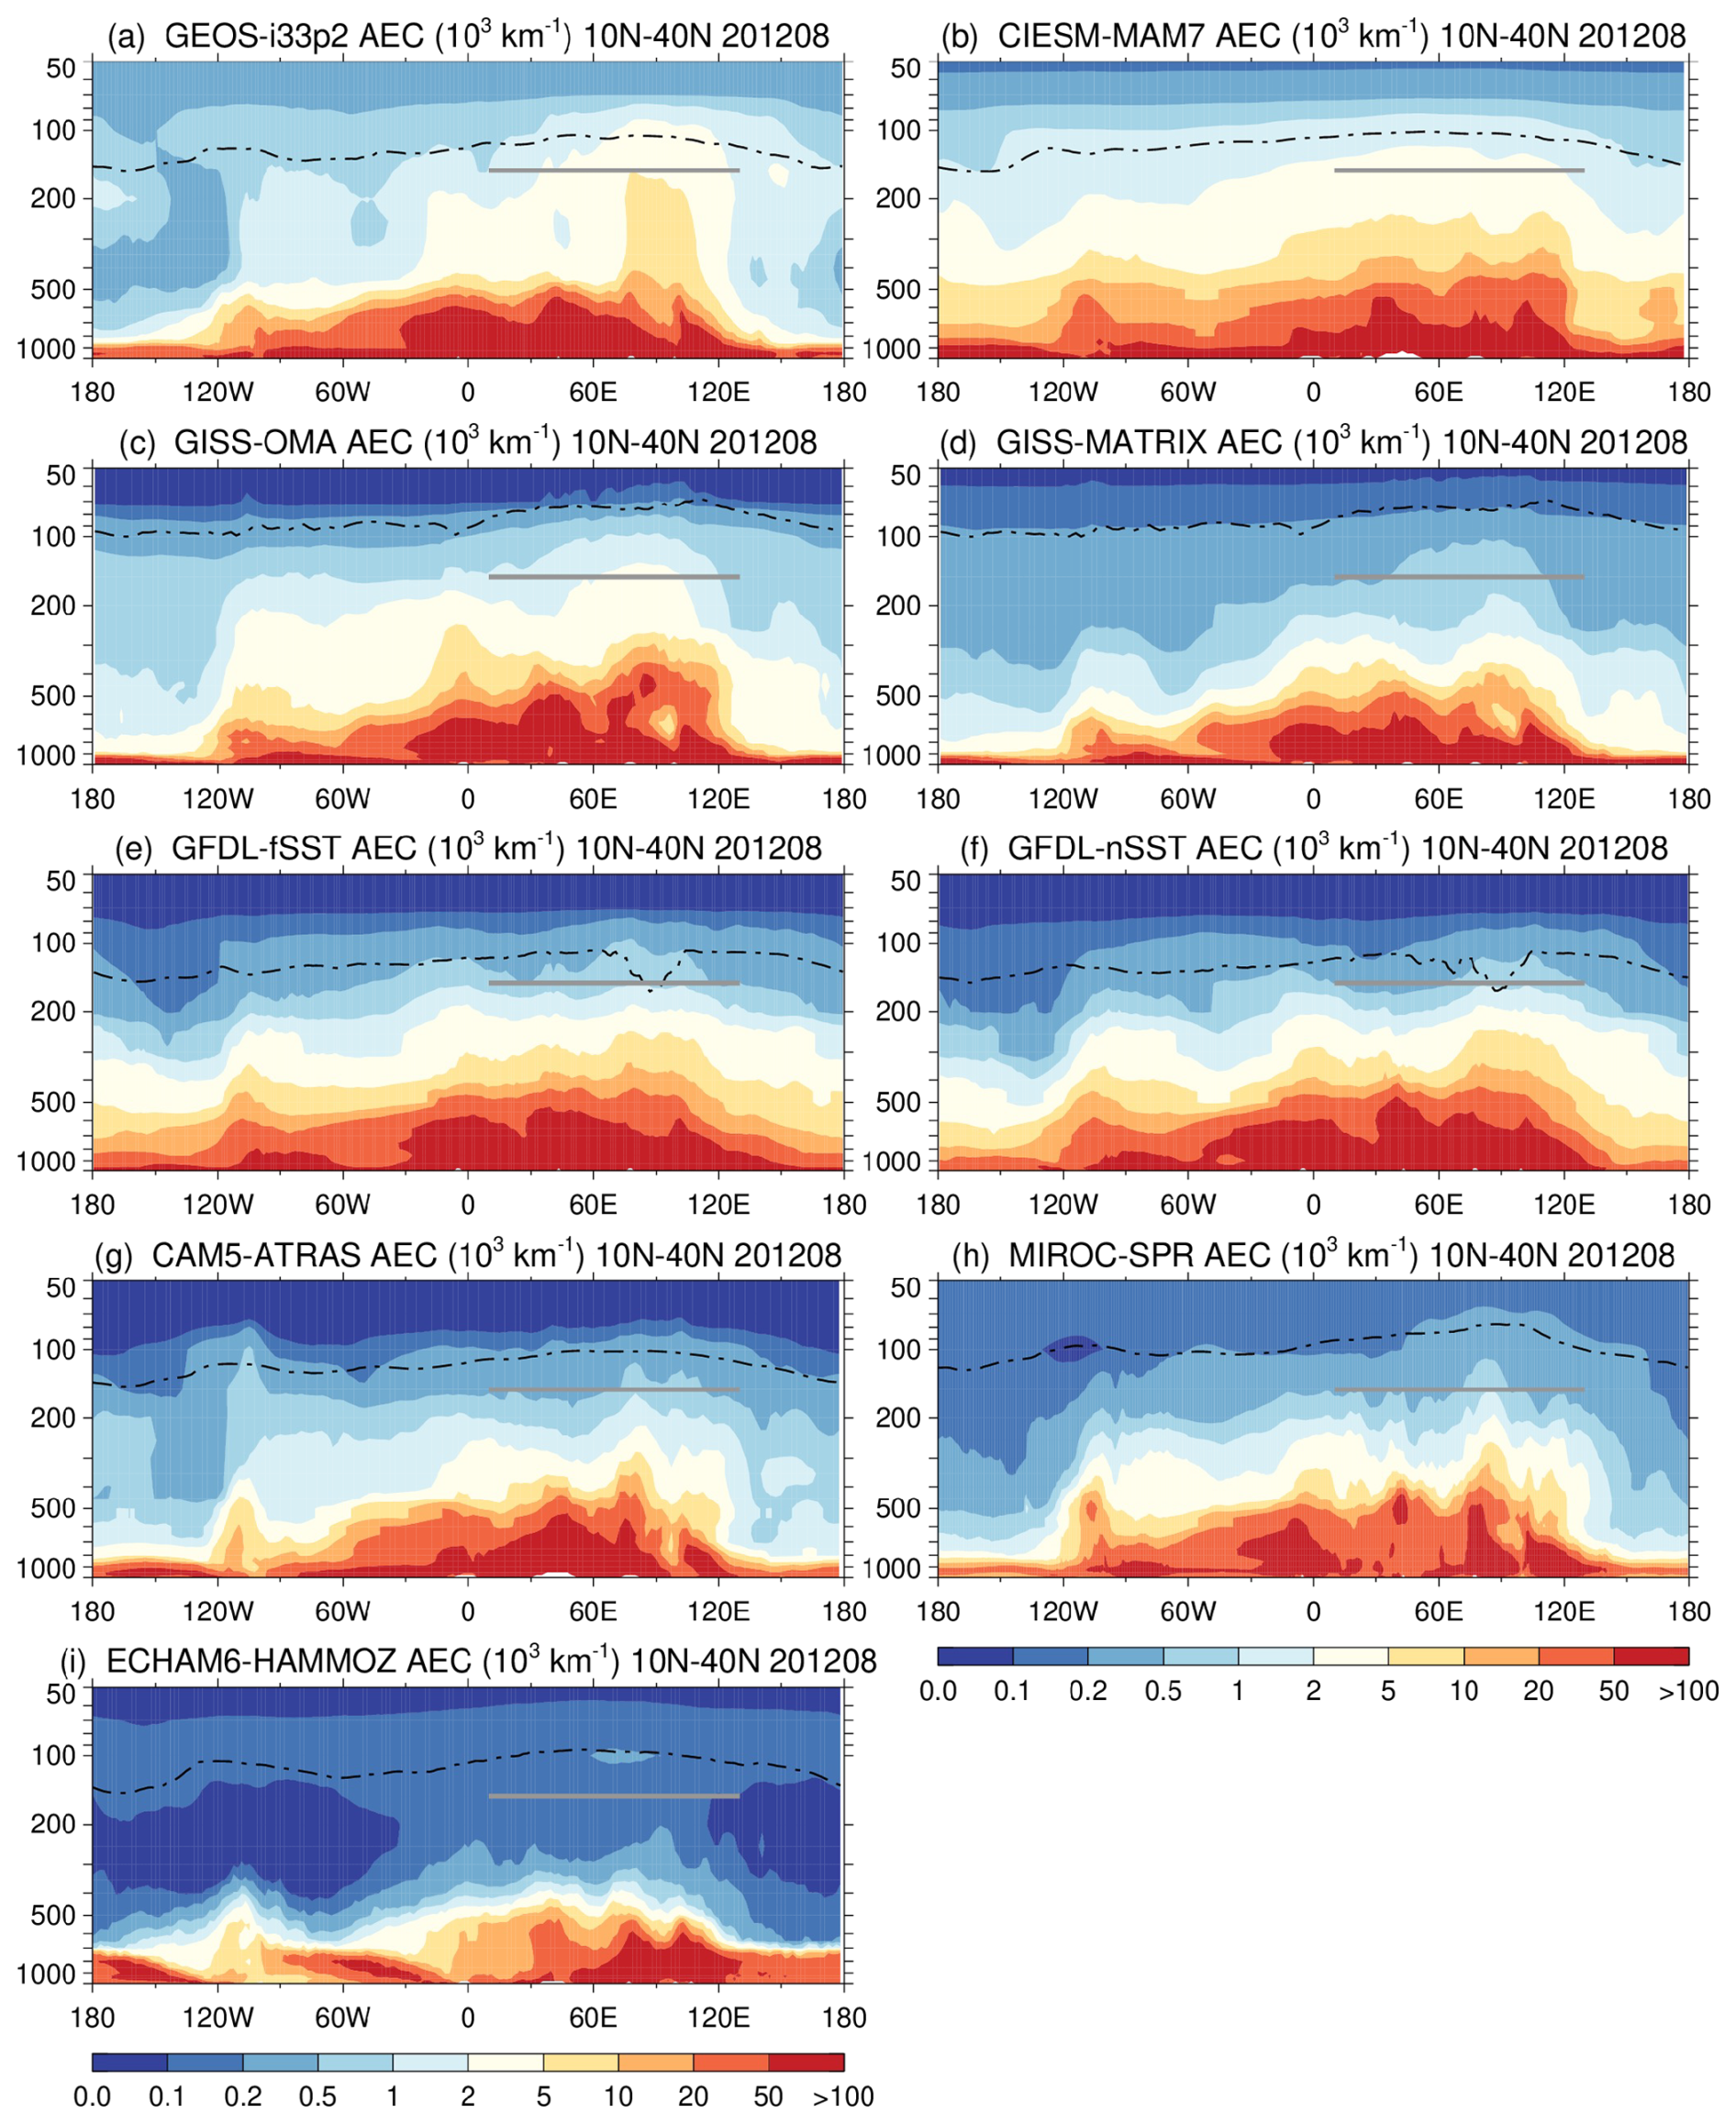
Figure 5The longitude-pressure cross-sections of model-simulated non-volcanic AEC averaged over 10–40° N latitude band in August 2012. The dash-dotted line denotes the tropopause height from each model, and the grey solid line marks the longitudinal range of the ASMA region at 150 hPa.
Most models produce the ASMA AEC “hot spot” at 150 hPa (Fig. 4, enclosed rectangular box), but the magnitude varies dramatically. The mean AEC values in the ASMA region among models differ by a factor of more than 20 between the highest (GEOS-i33p2, 2.84 × 10³ km−1) and the lowest (ECHM6-HAMMOZ, 0.13 × 10³ km−1). Vertical cross-sections of AEC (Fig. 5) show sharp vertical gradient between the surface and the UTLS in all models, but they disagree on how deeply aerosols are lofted: GEOS-i33p2 (Fig. 5a) produces the strongest vertical intrusion into the UTLS, while ECHAM6-HAMMOZ (Fig. 5i) shows the sharpest decrease with altitude, with minimal free tropospheric aerosol.
Model-simulated non-volcanic AEC averaged over the ASMA region at 150 hPa for August 2012 are summarized in Table 4. Results cluster into three groups: group A includes GEOS-i33p2 (a), CIESM-MAM7 (b), and GISS-OMA (c) with simulated AEC values above 1.5 × 10³ km−1; group B includes GISS-MATRIX (d), GFDL-fSST (e), GFDL-nSST (f), CAM5-ATRAS (g), and MIROC-SPRINTARS (h) with simulated AEC values around 0.5–0.7 × 10³ km−1; group C includes ECHAM6-HAMMOZ (i) with a much lower AEC value at 0.13 × 10³ km−1. ECHAM6-HAMMOZ also exhibits a unique horizontal distribution at 150 hPa with no evident maximum over the ASM (see Fig. 4). We further calculate the coefficient of variation (CV) of mean AEC in the ASMA region among the models, defined as the ratio between the inter-model standard deviation (SD) and multi-model mean (expressed as percentage), to provide a measure of the degree of inter-model spread. Previous studies have also referred to this metric as model “diversity” (Textor et al., 2006). We exclude the ECHAM6-HAMMOZ model from this calculation because it does not provide the standardized transport and removal tracer simulations that are necessary for diagnosing processes relevant to AEC (see Sect. 3.3 and 3.4). The multi-model mean AEC in the ASMA region from the eight models is 1.22 × 10³ km−1 with a standard deviation of 0.96 × 10³ km−1, leading to a large CV value of 79 %. These results highlight major unresolved differences in aerosol processes across models.
Table 4Model-simulated non-volcanic AEC, TRCO50, and TR averaged over the ASMA region at 150 hPa for August 2012. Multi model means, standard deviations, and coefficients of variation (CV) are provided, excluding ECHAM6 HAMMOZ due to missing tracer output.
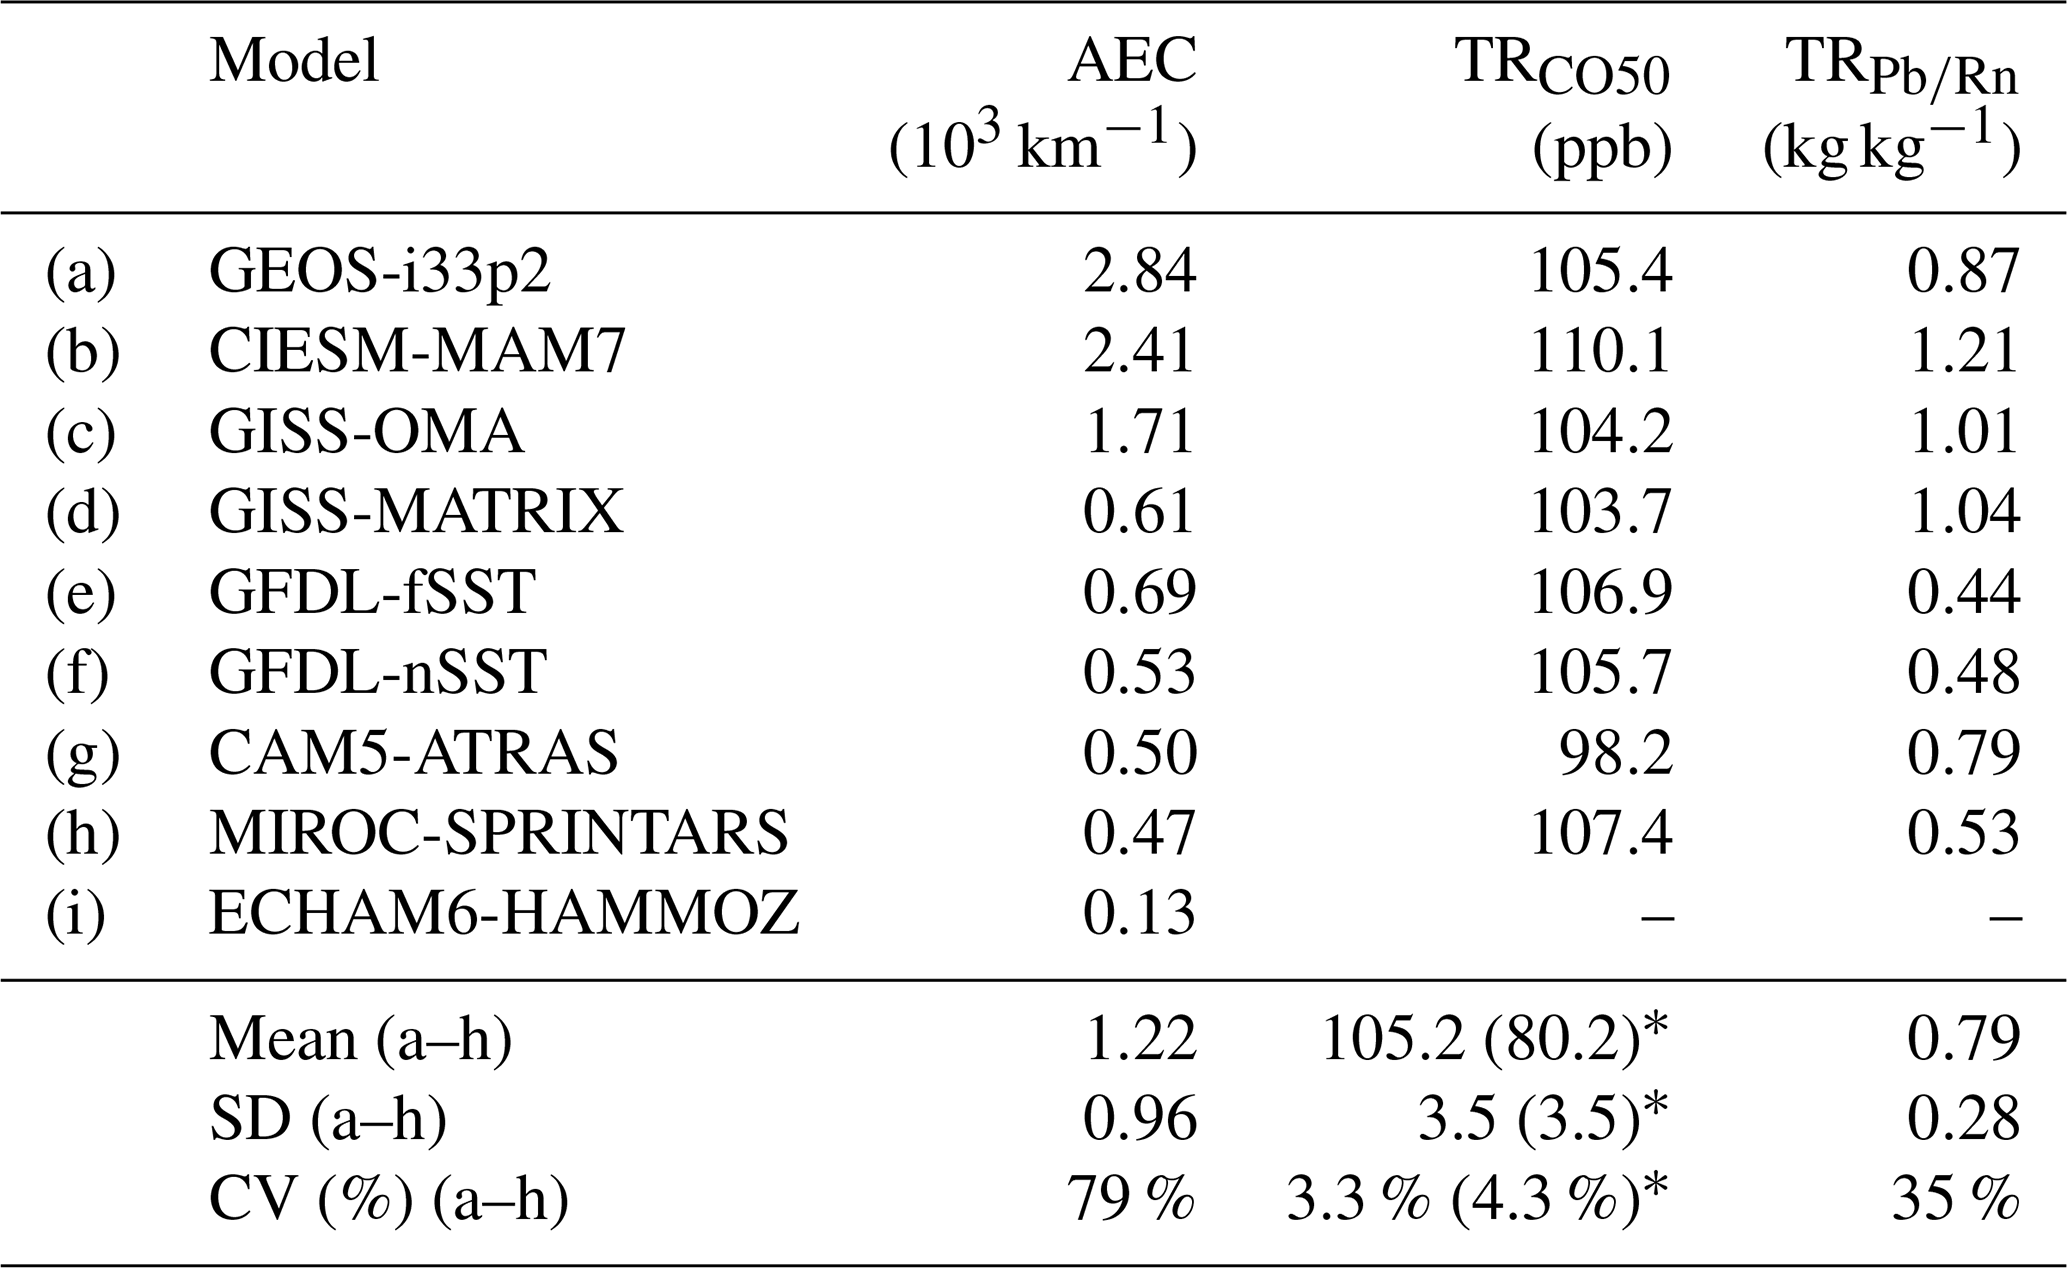
* Numbers in parenthesis are calculated with 25 ppb background TRCO50 excluded.
Several major factors contribute to the large differences in model-simulated AEC in the ASMA region despite all models using the same prescribed surface emissions. These factors include the processes related to convective transport of aerosols and precursor gases from the planetary boundary layer to the upper troposphere, removal of aerosols by wet scavenging, chemical production of secondary aerosols from their precursor gases during transport, and aerosol mass extinction efficiency (a function of aerosol chemical composition, particle size distribution, particle density, and hygroscopic growth, any of which may differ among models). In the following section, we diagnose inter-model differences in two of the most important processes contributing to model diversity, namely the convective transport (diagnosed using the pollutant transport tracer TRCO50) and the wet removal (diagnosed with the aerosol removal tracer TR.
3.3 Inter-model differences in transport and removal process of aerosols
3.3.1 Diagnosing inter-model differences in transport process
Horizontal distributions of model-simulated transport tracer TRCO50 at 150 hPa for August 2012 are shown in Fig. 6. All models display similar features of highest concentration in the ASMA core region and patterns to the west and east of ASMA. In contrast to the large inter-model differences in non-volcanic AEC distributions presented in Fig. 4, TRCO50 concentrations from the models are much more similar. This similarity reflects identically prescribed emission and loss rates, the relatively long lifetime (50 d), and significant global “background” concentration from prescribed methane oxidation (about 25 ppb globally) implemented in all models.
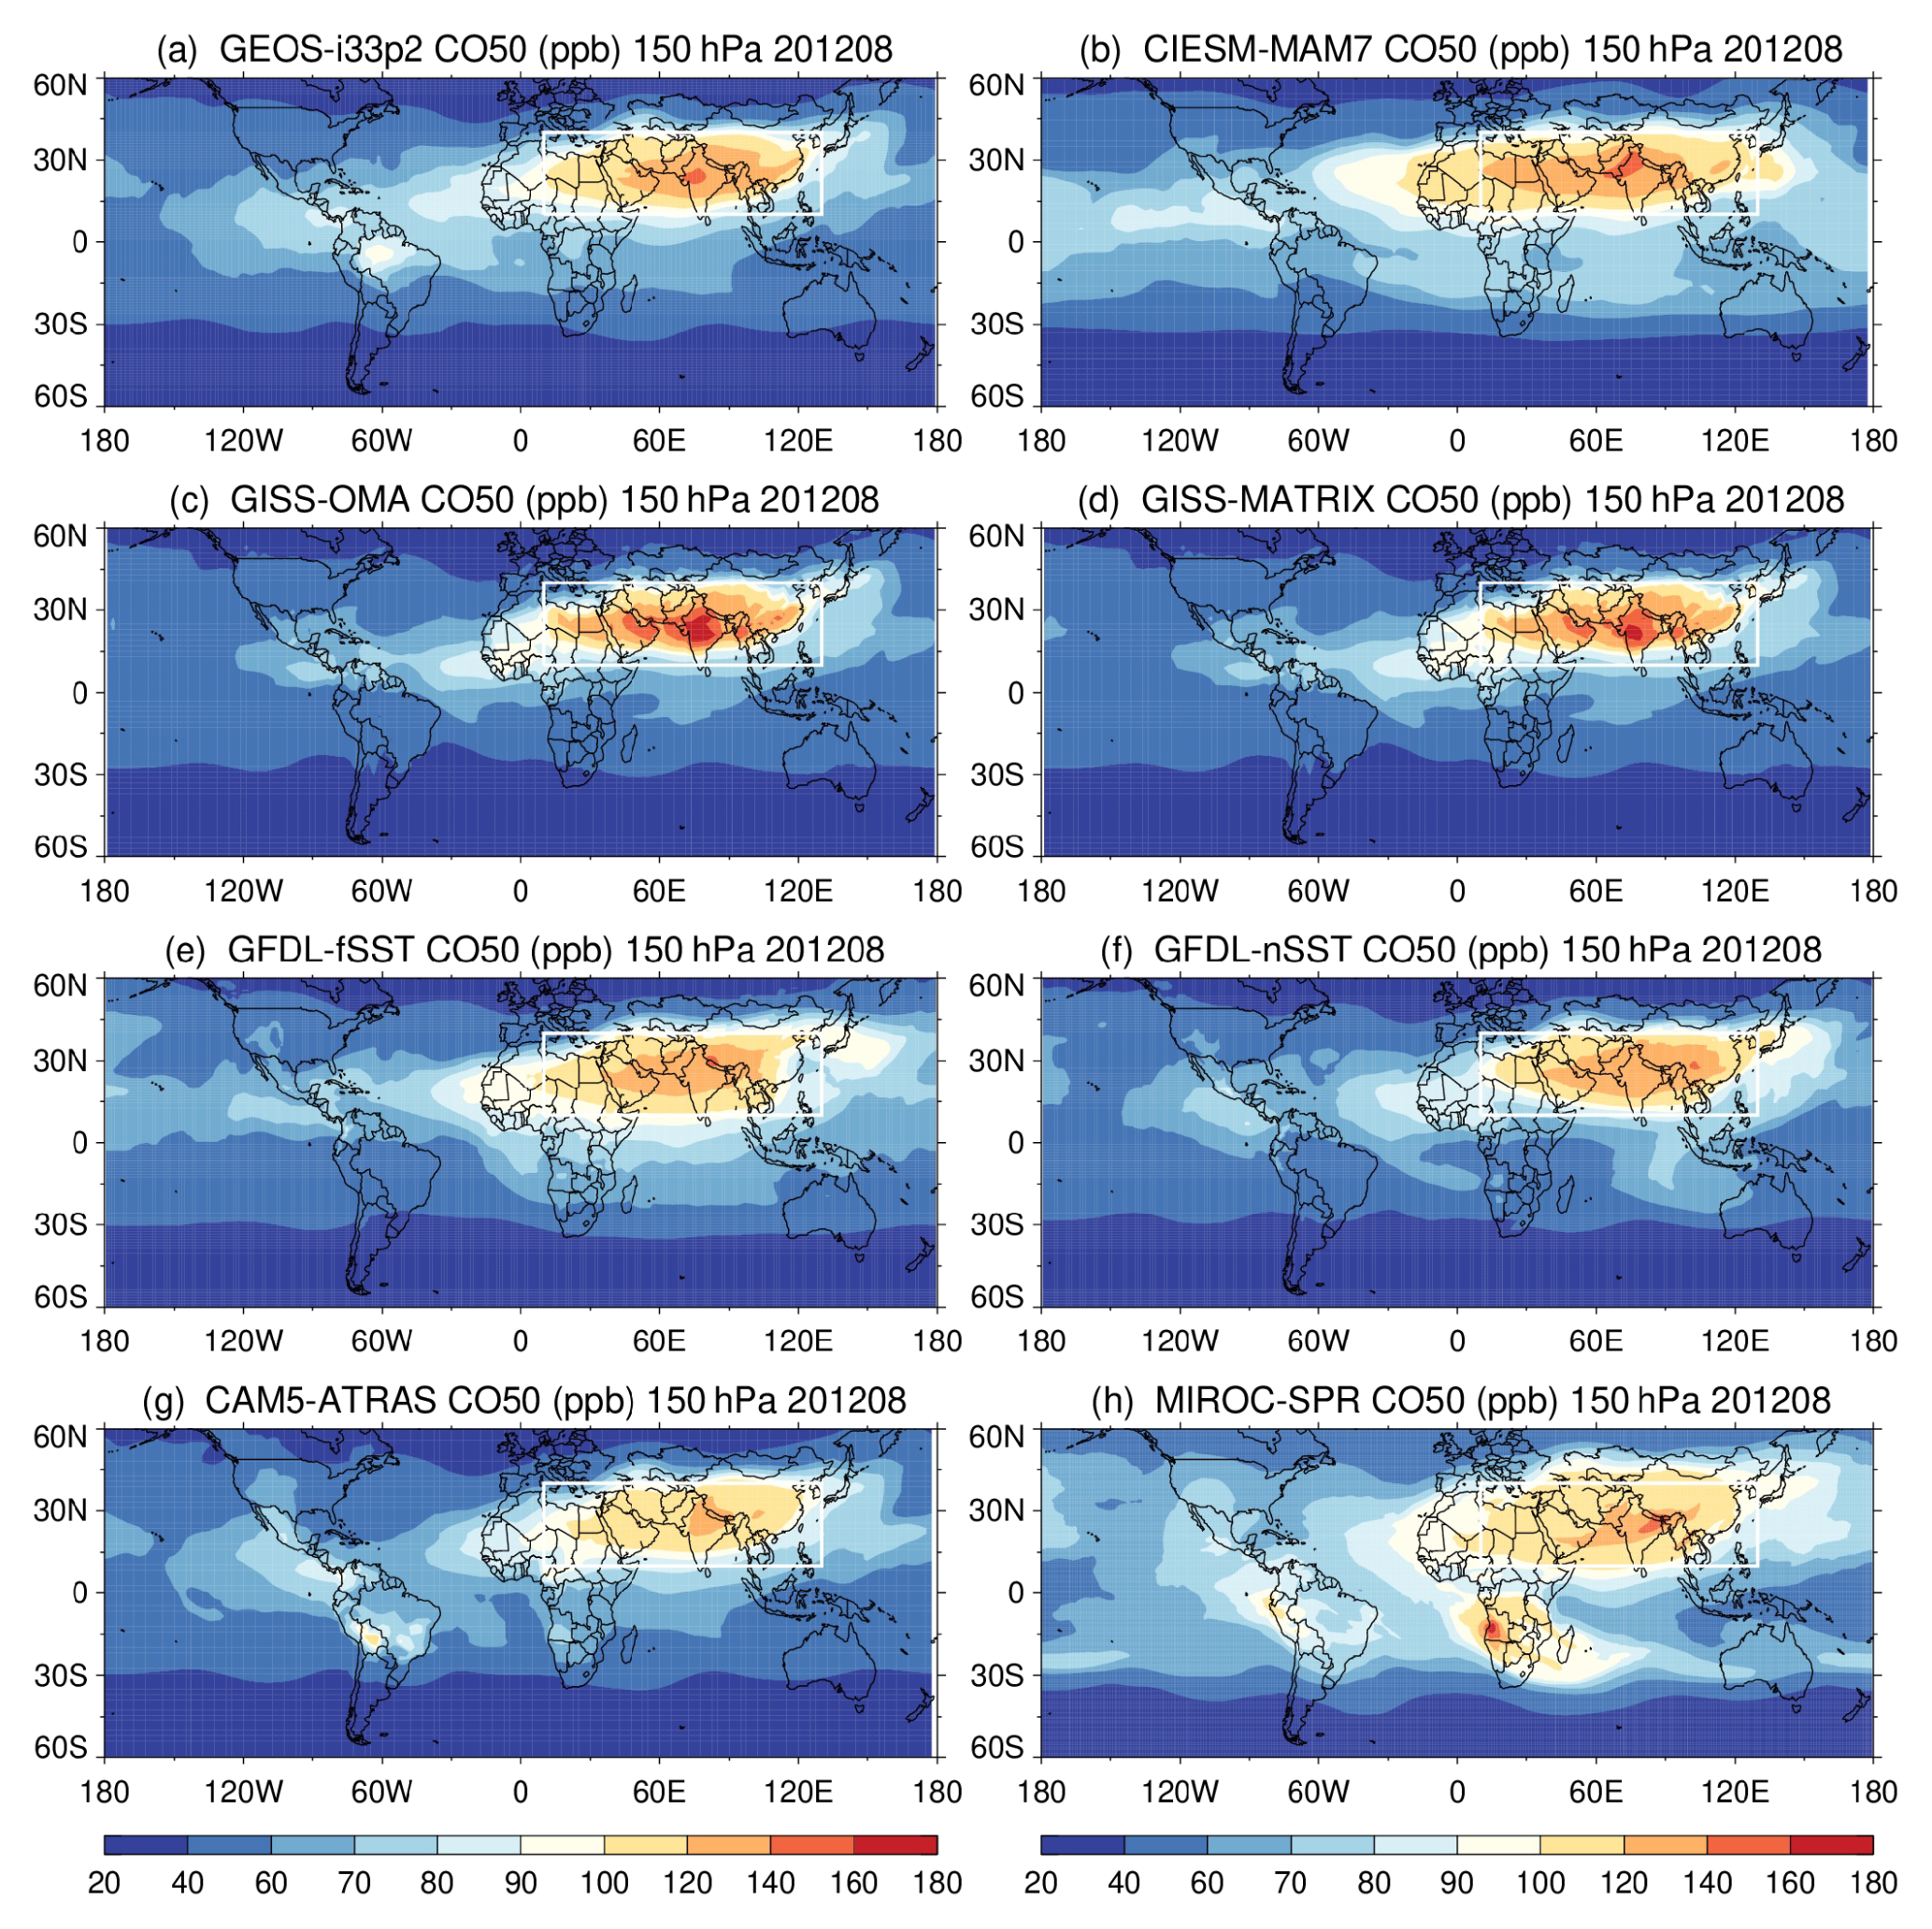
Figure 6Same as Fig. 4 but for the transport tracer TRCO50 at 150 hPa. (The relatively high TRCO50 concentrations over southern Africa in MIROC-SPRINTARS (h) is caused by an implementation issue of biomass burning source.)
Figure 7 shows the model-simulated pressure-longitude vertical distributions of TRCO50 averaged over the 10–40° N latitude band for August 2012. All models clearly exhibit two major pollutant convective transport pathways over the ASM domain, one located at ∼ 70–90° E over India and another at ∼ 100–120° E over China. Convective transport of TRCO50 is also seen at locations west of 50° E over Middle East/eastern Africa region, but this stem does not reach the upper troposphere except in CIESM-MAM7 (Fig. 7b). Another convection branch appears in the North American monsoon region in all models with much lower TRCO50 concentrations, owing to lower anthropogenic emissions there. In the middle to upper troposphere (500–120 hPa), TRCO50 spreads both westward and eastward, reflecting large-scale upper-level divergence (e.g., Park et al., 2007) aided by transient eddy-shedding events (e.g., Pan et al., 2016; Honomichl and Pan, 2020).
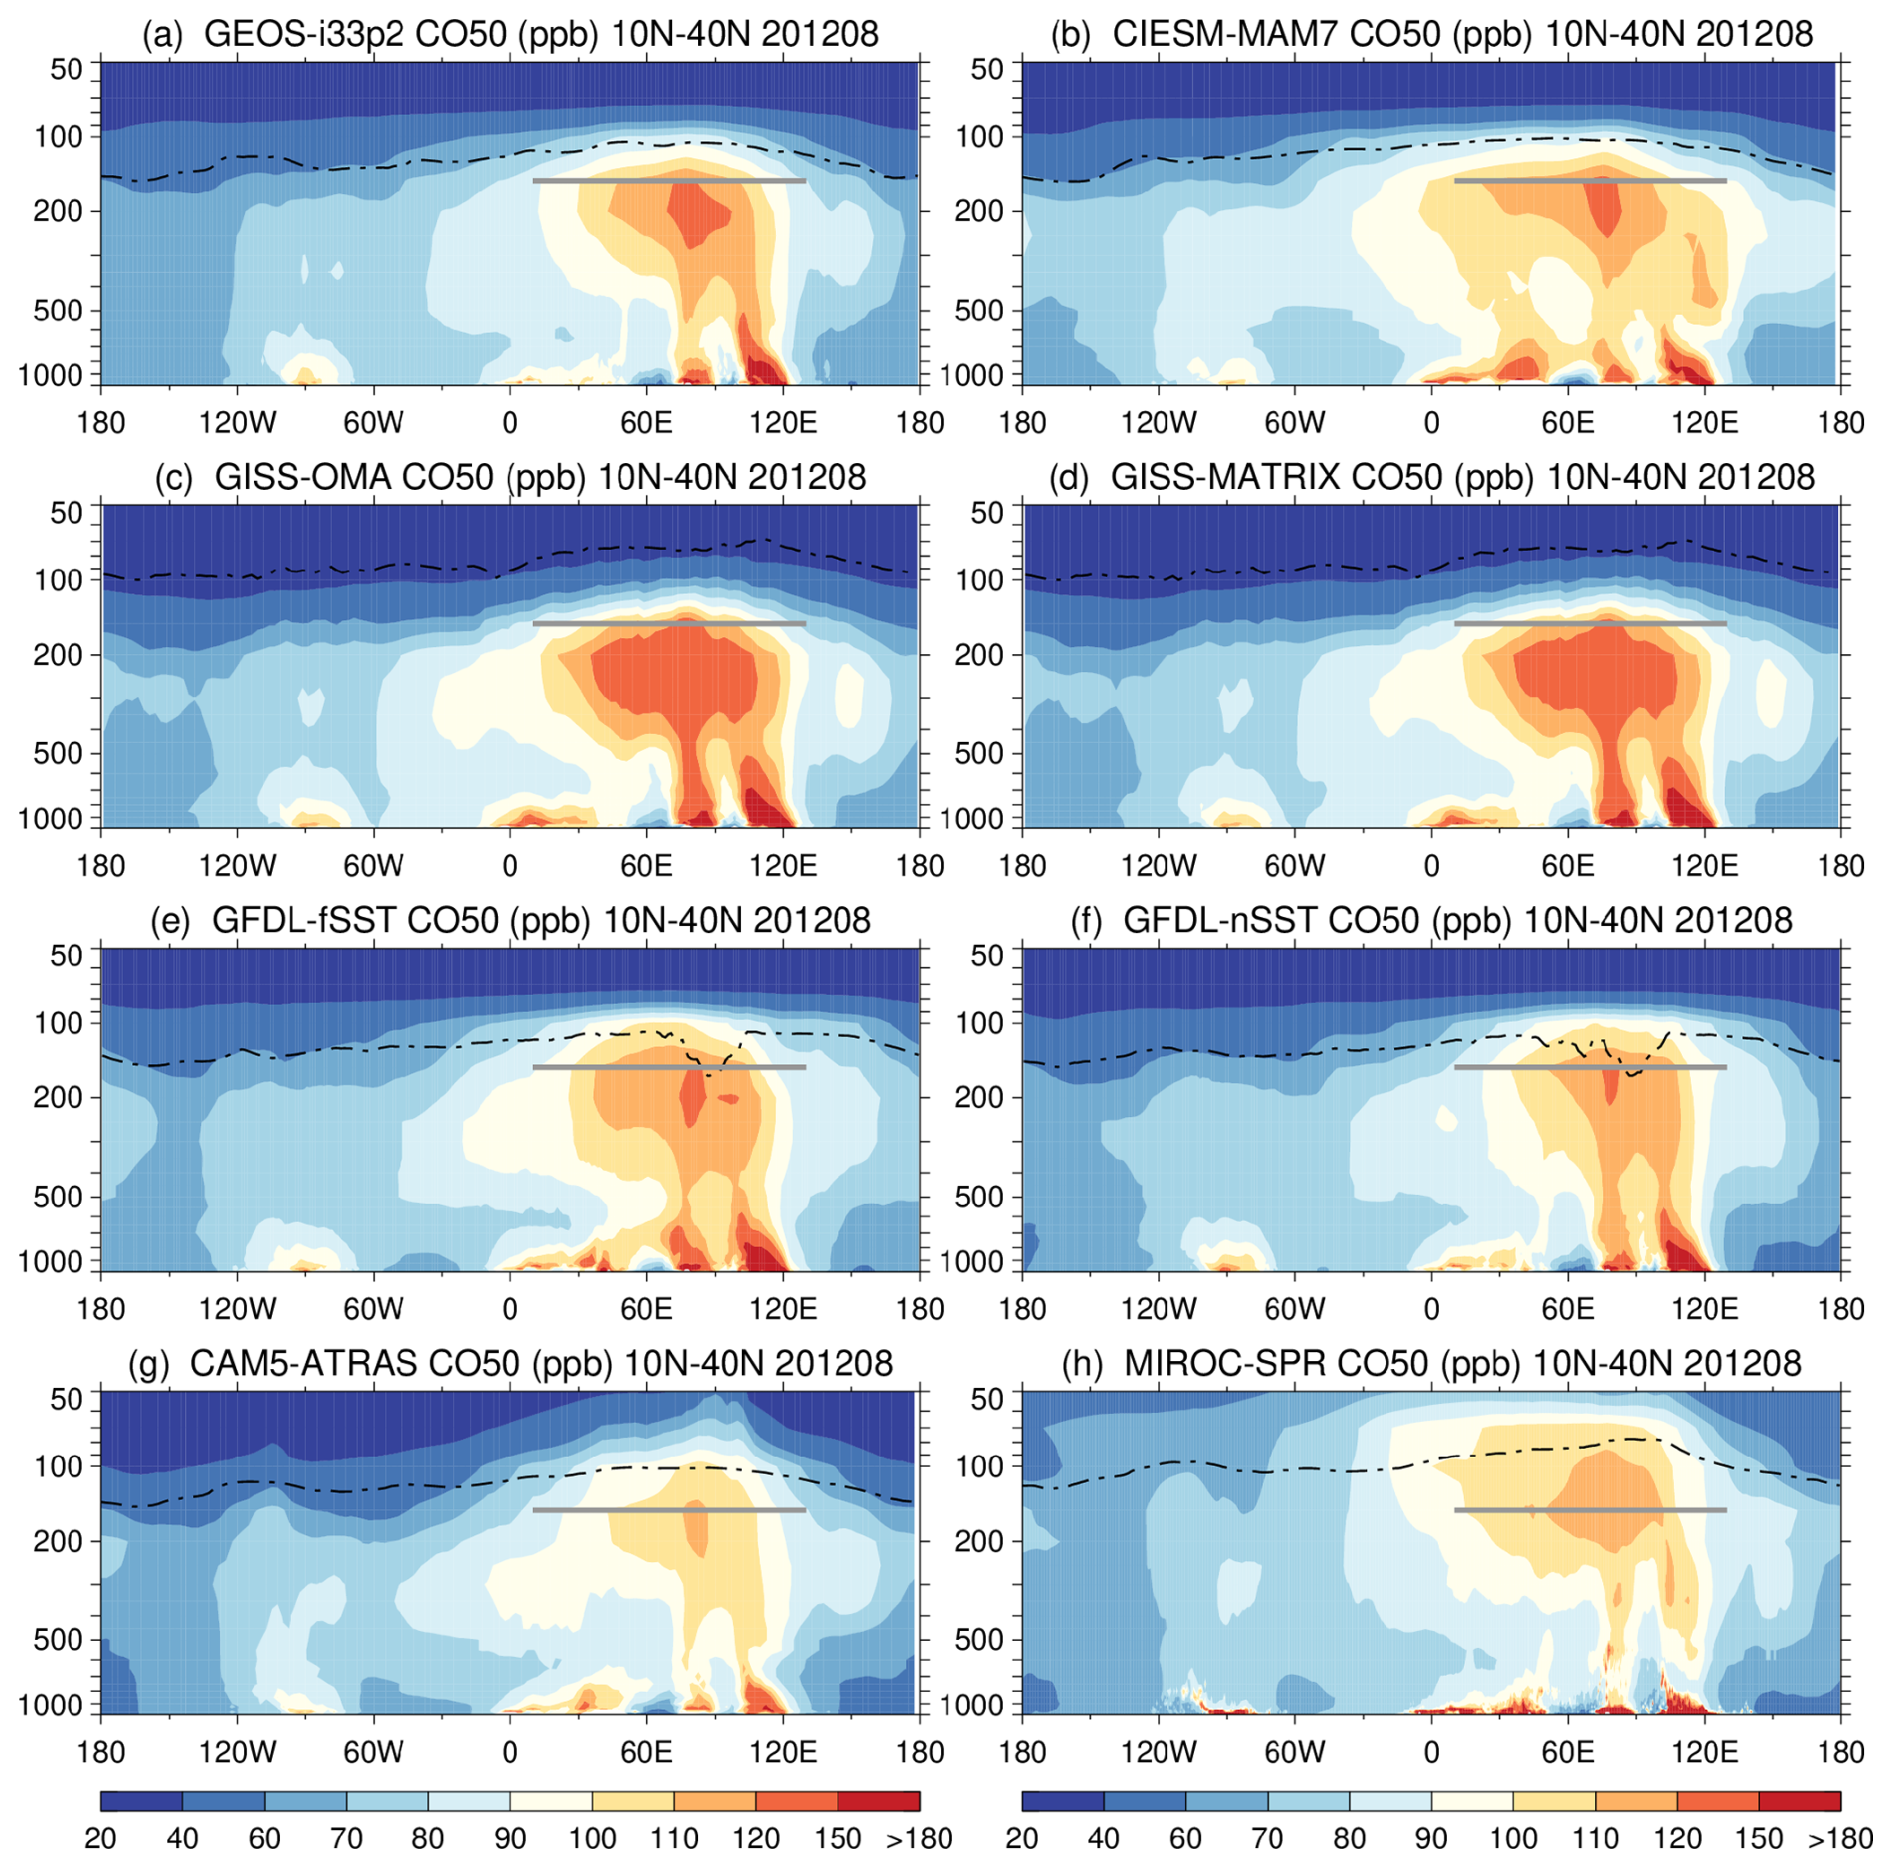
Generally, the TRCO50 vertical pattern over the ASM region exhibits a characteristic “two-stem mushroom” shape. This pattern differs markedly from the AEC vertical cross-sections shown in Fig. 5, mainly because aerosols have much shorter lifetime (a few days), a greater variety of sources and compositions (e.g., pollution, smoke, dust, sea salt), and additional loss processes through gravitational settling, dry deposition, and wet scavenging. These differences tend to confine aerosols, especially the coarse aerosol particles such as dust and sea salt, more tightly to their sources in the lower atmosphere.
Despite broad similarities in the transport features, the vertical extent and magnitude of TRCO50 over monsoon Asia still differs substantially across models. For example, CAM5-ATRAS (Fig. 7g) and MIROC-SPRINTARS (panel h) lift TRCO50 more efficiently to the lower stratosphere with considerable concentrations above the tropopause, while TRCO50 is largely confined below the tropopause in other model simulations. The highest TRCO50 concentrations in the upper tropospheric (300 hPa – tropopause) ASMA region produced by the two GISS model simulations (150–200 ppb, Fig. 7c–d) are 67 % higher than the lowest concentrations reported by CAM5-ATRAS and MIROC-SPRINTARS (90–120 ppb, Fig. 7g–h). Yet, the mean TRCO50 concentrations at 150 hPa within the ASMA region are remarkably consistent across the models, with a multi-model mean TRCO50 concentration of 105.2 ppb and a standard deviation of 3.5 ppb, leading to a CV of 3.3 % (Table 4). Removing the invariant background TRCO50 (25 ppb) modestly increases CV to 4.3 %. These low CV values indicate that large-scale transport differences cannot explain the much larger AEC spread (79 %) in the same region.
3.3.2 Diagnosing inter-model differences in wet removal process
We next use TR, i.e. the ratio of TRPb to TRRn, to diagnose the impact of the variability of wet scavenging efficiency on the inter-model differences in AEC. A smaller TR indicates a higher aerosol removal efficiency, leading to a lower aerosol amount in the upper troposphere.
Figure 8 shows the longitude-pressure vertical cross-sections of TR averaged over the 10–40° N latitude band. The two GFDL simulations (panels e and f) produce the lowest TR values in the vertical domain in Fig. 8, indicating the most efficient removal of aerosols. Similar results are also shown over the North American summer monsoon region and in the middle to the upper troposphere (200–400 hPa) for the entire 10–40° N band. Conversely, CIESM-MAM7 (panel b) shows the highest TR, implying weaker scavenging of aerosols. In the stratosphere, since TRPb experiences no wet removal while being continuously produced by the decay of TRRn, the TR values should be much larger, as confirmed by most model simulations. However, TR in CAM5-ATRAS (panel g) and MIROC-SPRINTARS (panel h) in the lower stratosphere remains low, similar to the tropospheric level, which might be associated with much deeper monsoon convection extending into the altitudes regarded as the lower stratosphere (e.g., TRCO50 patterns in Fig. 7g and h), leading to the removal of TRPb similar to the behavior in the upper troposphere.
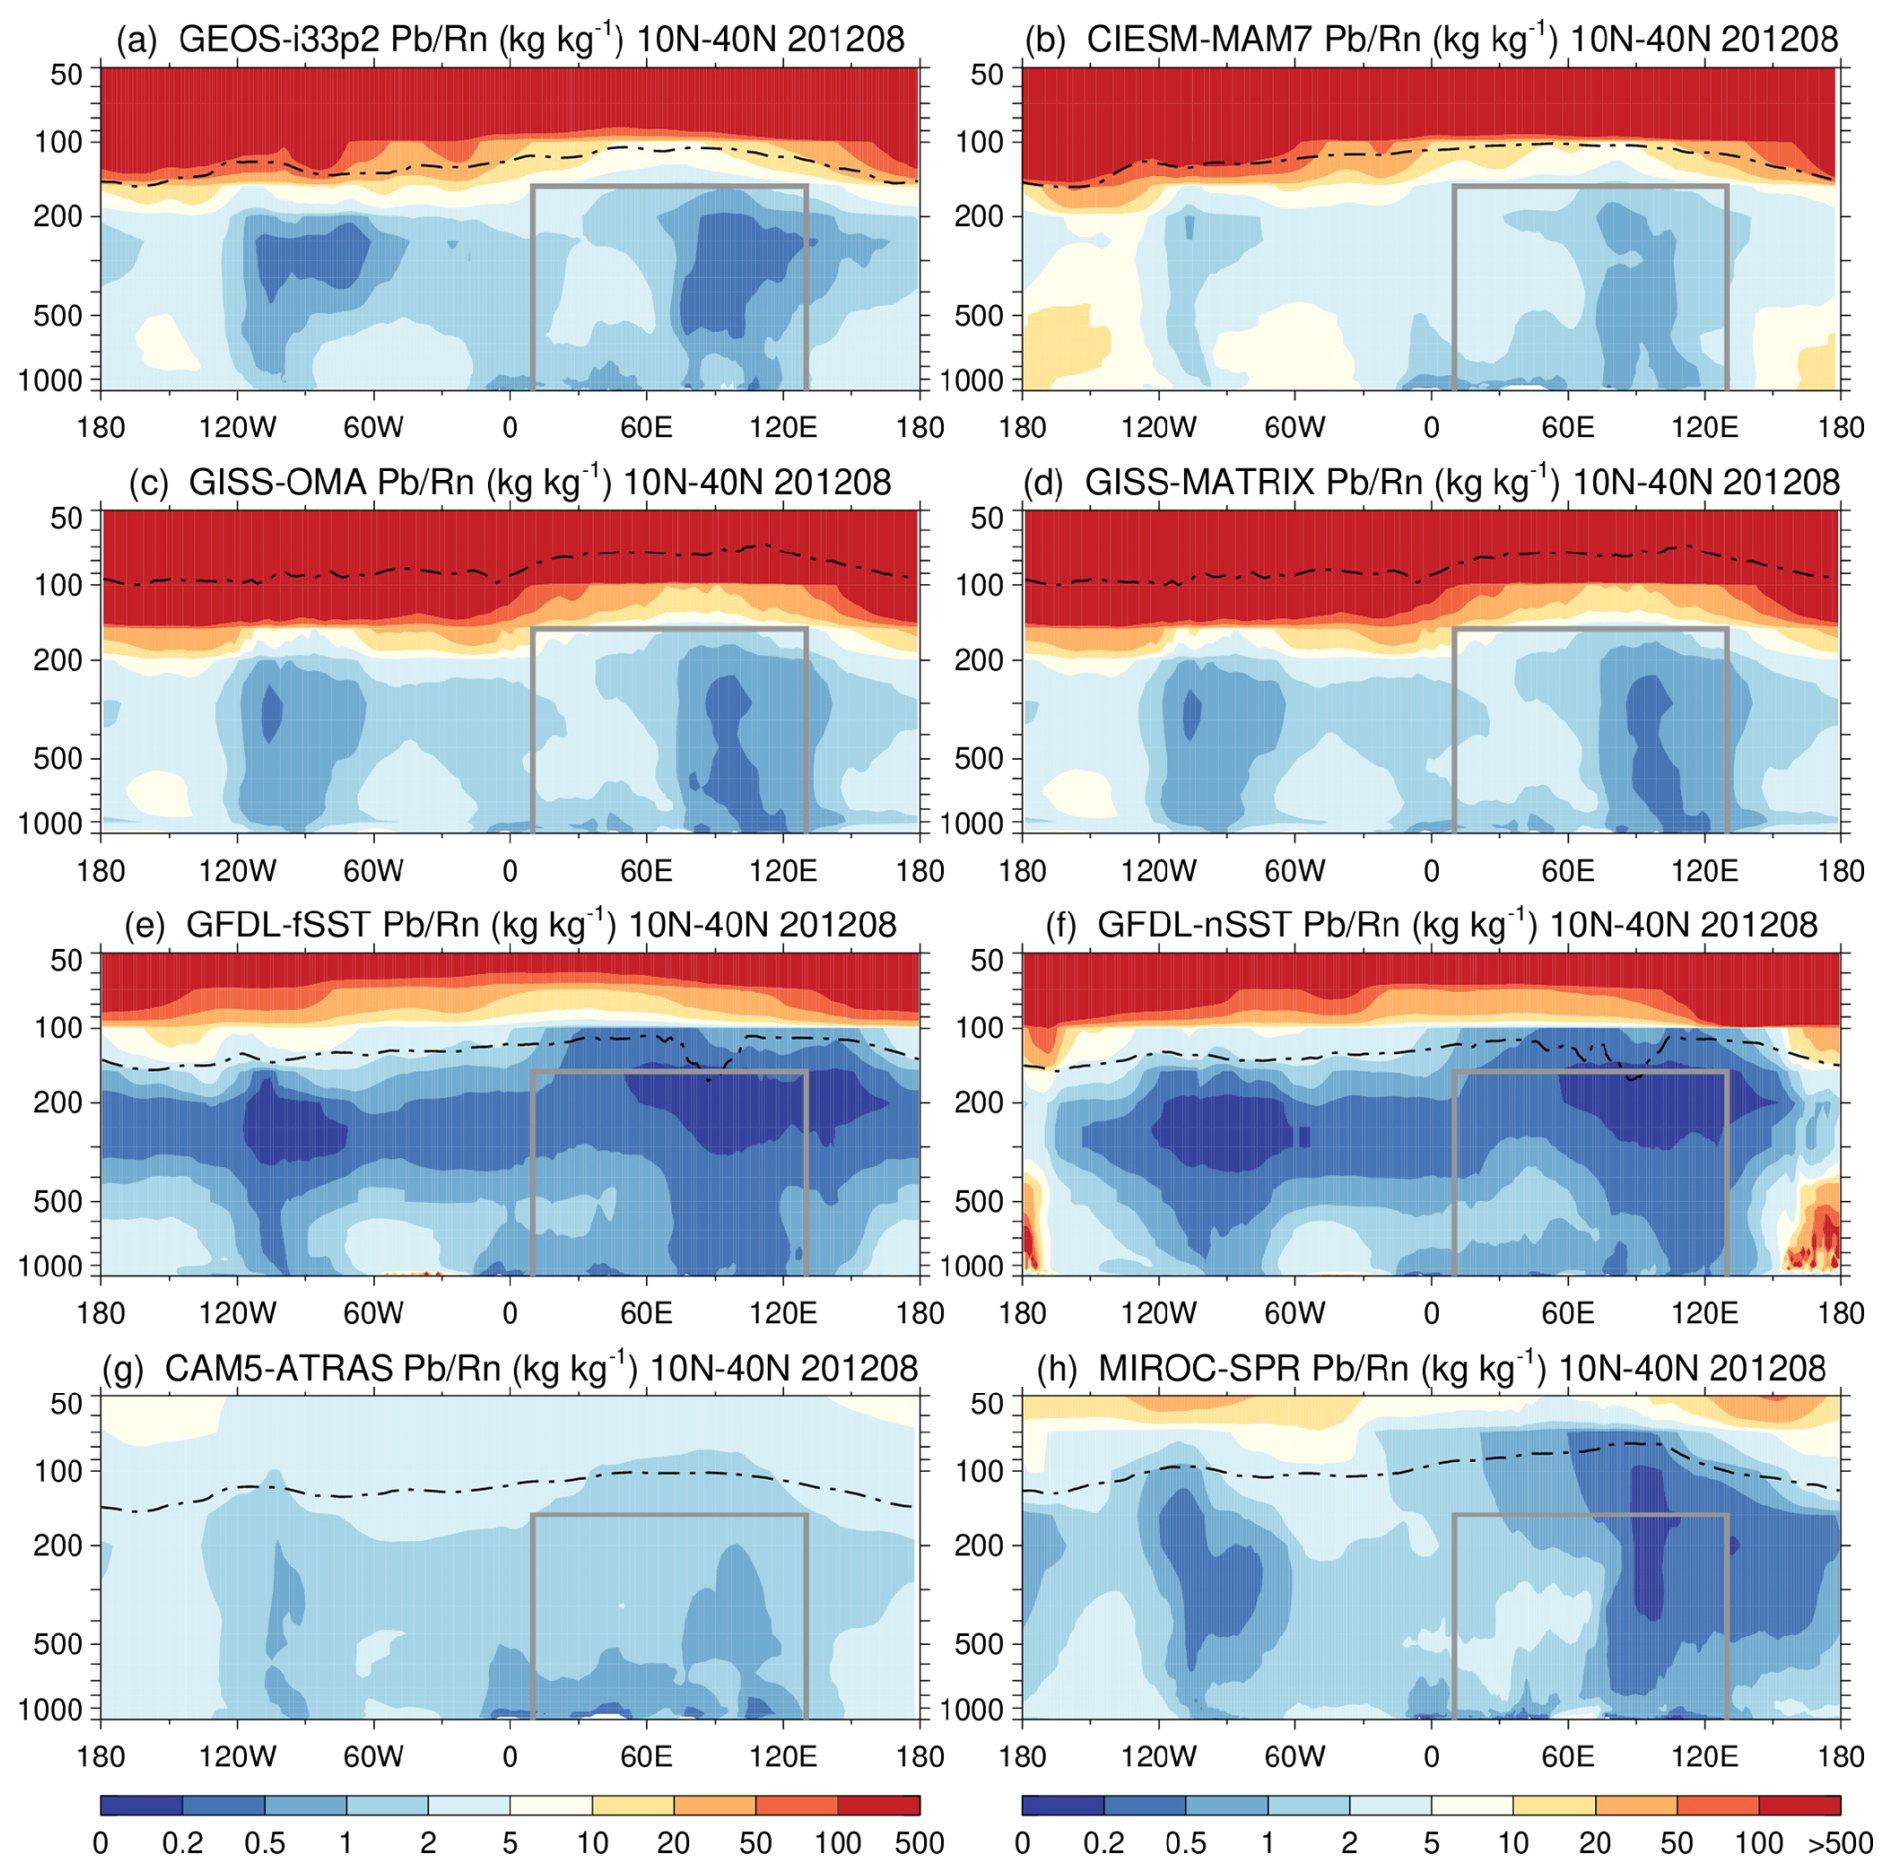
Figure 8Same as Fig. 5 but for the removal tracer TR. The grey box indicates the vertical range used to compute the column integrated, pressure weighted mean TR values over the ASMA region (see text for explanation).
To link the inter-model variability in AEC at 150 hPa ASMA region with removal processes in the atmospheric column below, we compute the column-integrated, pressure-weighted mean TR from surface to 150 hPa as an approximate indicator of the removal efficiency. Values of mean TR over the ASMA column (indicated by the grey box in Fig. 8) from individual models are listed in Table 4. The model spread in this metric (CV = 35 %) is much larger than that of TRCO50, suggesting that wet scavenging contributes far more strongly to the inter-model differences in AEC in the 150 hPa ASMA region.
3.3.3 Combined effect of transport and removal on inter-model differences in AEC
Another way to present the effects of transport and wet scavenging processes on aerosol amount in the ASMA region is to examine correlations between model simulations of AEC and individual or combined tracers, as shown in Fig. 9. The linear correlation coefficient (R) between AEC and TRCO50 is 0.37 and that between AEC and TR is 0.62. With two tracers together, R from the multivariable regression increases to 0.71, suggesting that differences in transport and the wet removal processes can explain 50 % (R2= 0.505) of the inter-model differences in AEC over ASMA region.
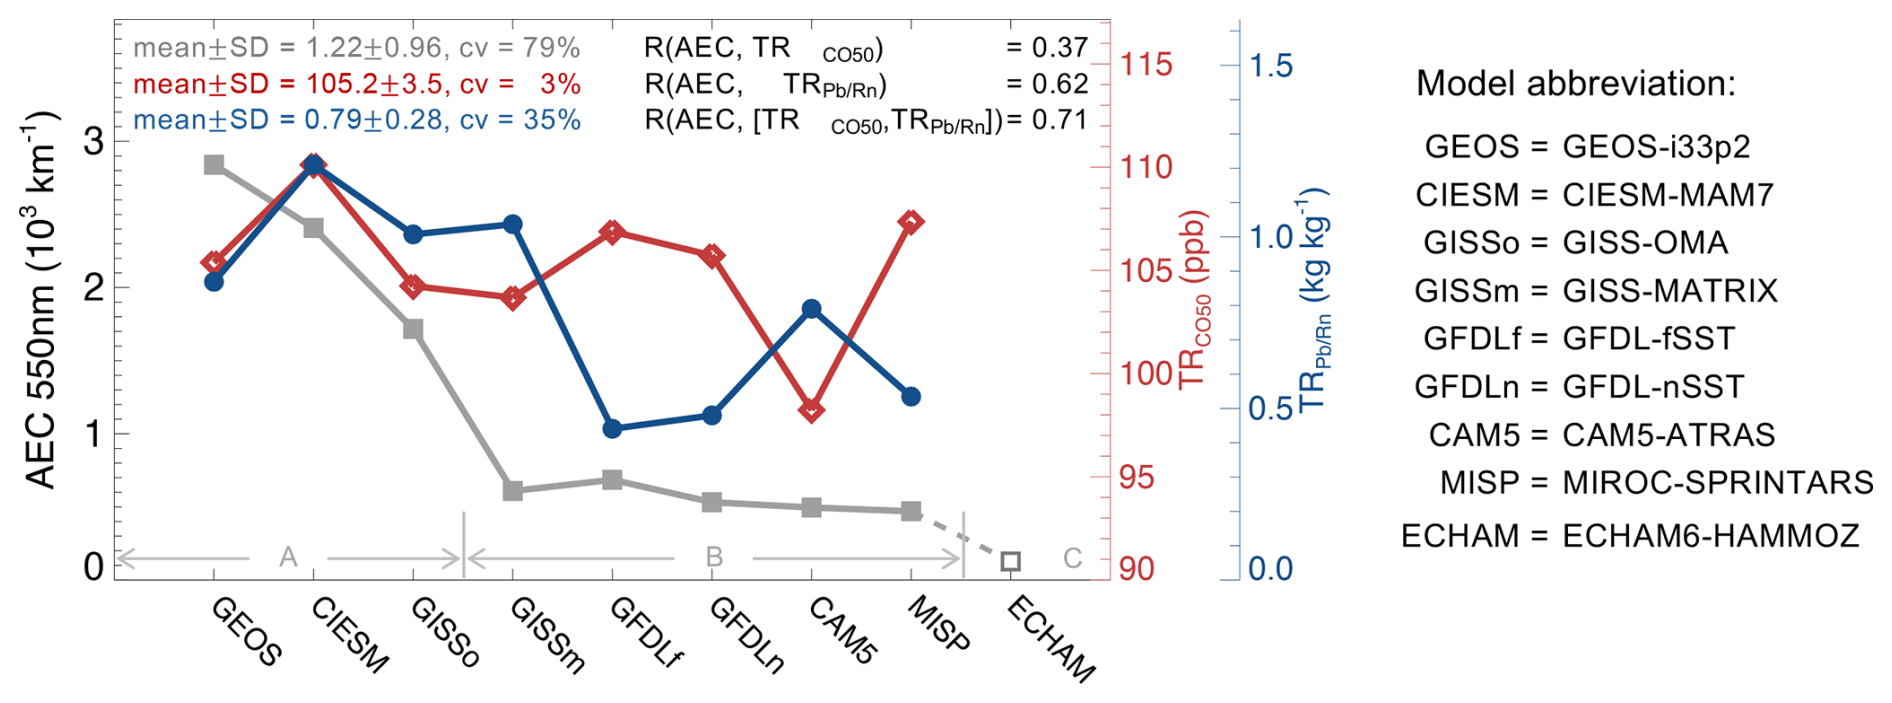
Figure 9Model-simulated mean values of AEC (grey), TRCO50 (red), and TR (blue) in the 150 hPa ASM region for August 2012. The correlation coefficients between AEC and TRCO50, between AEC and each tracer, and the combined multivariable regression, are shown in the upper right. The ECHAM6-HAMMOZ model is excluded due to missing tracer output. Models in group A, B, and C are indicated on the bottom of the panel.
The three models in group A (GEOS-i33p2, CIESM-MAM7, and GISS-OMA, see Sect. 3.2), which simulate higher values of AEC in the ASMA region (grey line in Fig. 9), exhibit both relatively strong transport (higher TRCO50, red line) and weaker removal efficiencies (higher TR, blue line) compared to most models in group B (except GISS-MATRIX). The group B models (except GISS-MATRIX) show either suppressed convective transport (CAM5-ATRAS) or much stronger removal (GFDL-fSST, GFDL-nSST, and MIROC-SPRINTARS) as possible explanations for producing lower AEC compared to group A.
Figure 9 also illustrates the impacts of different aerosol microphysics schemes and meteorological forcing on model-simulated AEC, using results from two GISS and two GFDL model configurations. As detailed in Table 2, GISS-OMA and GISS-MATRIX share the same meteorological forcing (MERRA-2) but differ in aerosol microphysics schemes: GISS-OMA uses a bulk scheme assuming external mixtures of aerosol species, while GISS-MATRIX utilizes a modal microphysics scheme that tracks both aerosol mass and number concentrations and explicitly simulates the aerosol mixing state (Bauer et al., 2022). Consequently, both models yield similar TRCO50 and TR values, as these are primarily meteorology driven. However, GISS-MATRIX produces nearly three times lower AEC than GISS-OMA, a discrepancy arising largely from their different representations of aerosols microphysical properties and associated processes, and TR may not be suitable representing the aerosol removal for GISS-MATRIX. Meanwhile, the pair of the GFDL models adopts the same bulk aerosol scheme but differs in meteorological forcing: GFDL-fSST uses meteorology generated by the underlying GCM forced by SST, whereas GFDL-nSST incorporates additional “nudging” toward NCEP reanalysis (Table 2). Although their overall results are comparable, AEC from GFDL-nSST is 22 % lower than GFDL-fSST, affected by higher wet scavenging efficiency (9 % higher TR) and slightly lower transport efficiency (2 % lower TRCO50) in the nudged configuration.
The analysis for August 2012 presented in Sect. 3.2 and 3.3 is consistent across all years in 2000–2018 (see Table S2). Using the CV as a matrix to measure inter-model differences, its August values for AEC in ASMA region at 150 hPa vary between 64 % and 86 % during the 19-year study period (mean = 77%), while those for TRCO50 range between 2.5 % and 7.7 % (mean = 4.4 %) and those for TR between 34 % and 38 % (mean = 36 %). Together, the inter-model differences in transport and wet removal can explain 44 %–61 % (mean = 52 %) of the model diversity in AEC in the upper tropospheric ASMA region.
Other processes treated in each model, such as chemical formation of secondary aerosols (sulfate, nitrate, secondary organic aerosol), gravitational settling, particle size, and mass extinction efficiencies for aerosol species/sizes, should also contribute to the differences in AEC. However, these contributions cannot be quantified with available model outputs.
3.4 Two-decadal trend and interannual variability of non-volcanic aerosols in the upper tropospheric ASMA region
3.4.1 Trends
We use the multi-model ensemble means for each August from 2000 to 2018 at 150 hPa to represent the ensemble trend and interannual variability of non-volcanic aerosols in the upper tropospheric ASMA region. Figure 10 shows this time series (Fig. 10a) together with the corresponding ensemble means of convective transport tracer TRCO50 at 150 hPa (Fig. 10b) and of aerosol removal tracer TR averaged from the surface to 150 hPa (Fig. 10c). (Values of the multi-model means for each year are listed in Table S2.) For further context, changes in annual anthropogenic emissions of primary BC and OC and the secondary aerosol precursor gases of SO2, NOx, and NH3 over Asia (5–50° N latitude, 65–130° E longitude) are also included (Fig. 10d), expressed as the percentage departure from the 19-year mean of each species. We then use the Mann–Kendall (MK) method (Mann, 1945; Kendall, 1975), which is a commonly used non-parametric test, to statistically assess if there is a monotonic upward or downward trend over time, regardless of whether the trend is linear. Typically, the trend is considered statistically significant if the p-value from the MK test is less than 0.05. The magnitude of the trend is represented by the Sen's slope, which is the median rate of change per year. The statistical numbers of the p-value and magnitude of change for each variable are listed on individual panels in Fig. 10.
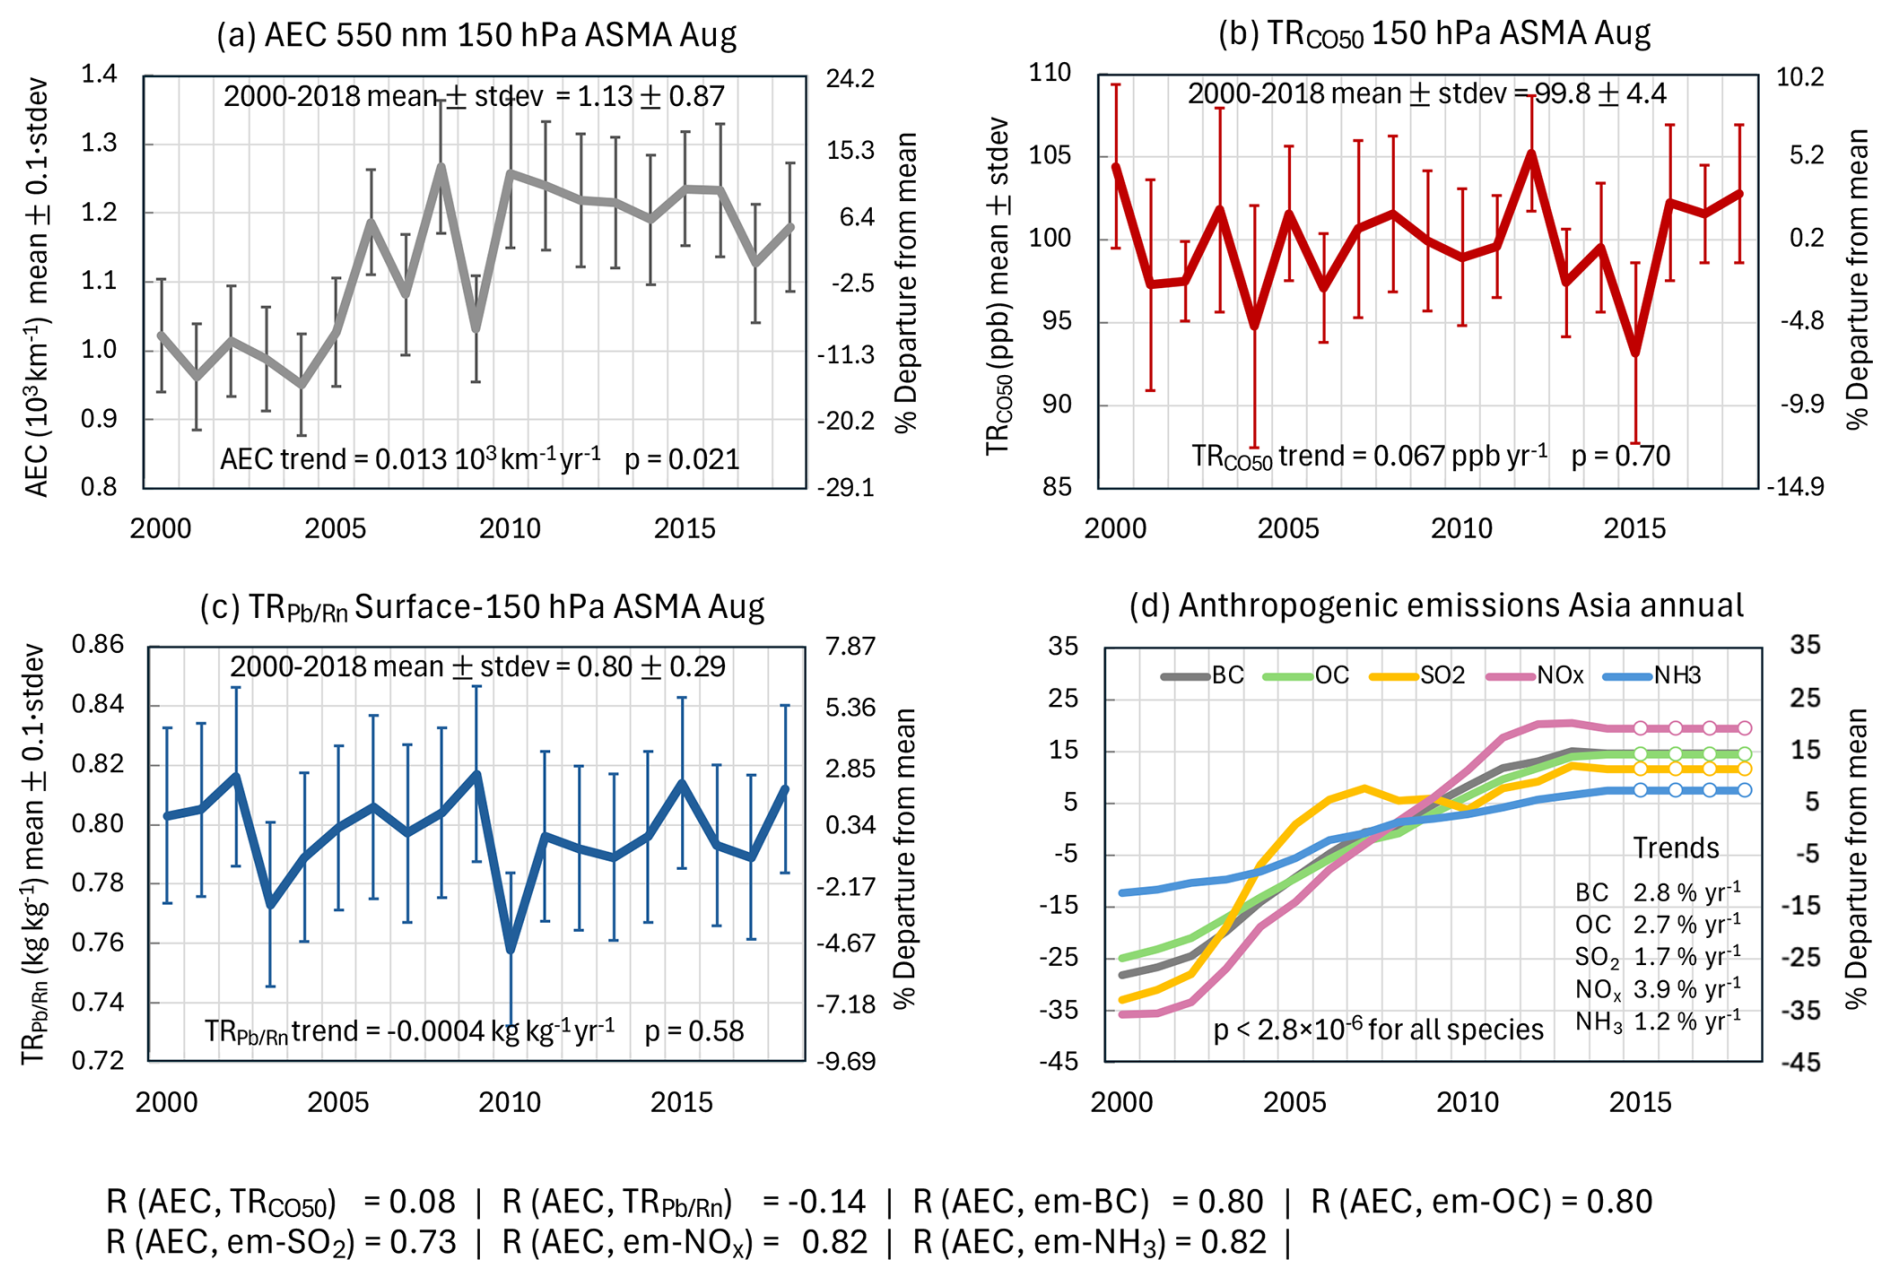
Figure 10(a–c, left y axis) Multi-model (excluding ECHAM6-HAMMOZ) means of AEC at 150 hPa, TRCO50 at 150 hPa, and TR averaged between surface and 150 hPa, respectively, for the ASMA region in August 2000–2018. Vertical lines shown model standard deviations for a given year (divided by 10 in panels a and c for clarity) (right y axis) percentage departure from each variable's 19-year mean. (d) Annual CMIP6 anthropogenic emissions of primary aerosols and secondary aerosol precursor gases over Asia (5–50° N, 65–130° E) relative to each species' 19-year mean. Anthropogenic emissions from 2015 to 2018 are kept the same as that in 2014 (shown as white circles). Mann–Kendall trend statistics (Sen's slope and p-value) appear at the bottom of each panel; correlation coefficients between AEC and all other variables are listed in the lower text box below the panels.
The multi-model ensemble mean of AEC in the ASMA region at 150 hPa (Fig. 10a) displays a statistically significant increasing trend from 2000 to 2018 (p= 0.021 from MK test), with a Sen's slope of 0.013 × 10³ km−1 yr−1, equivalent to about 1.2 % yr−1. This increasing AEC trend is in contrast with the cases of convective transport tracer TRCO50 (Fig. 10b) and the removal tracer TR (Fig. 10c), neither of which shows any statistically significant trend (higher p-values). These results indicate that the variabilities in transport and removal processes over the two decades do not contribute to the overall long-term increase in AEC within the ASMA region. On the other hand, the AEC trend is consistent with the increasing trends of anthropogenic emissions of primary aerosols and aerosol precursors in Asia (Fig. 10d), all of which show statistically significant increasing trends between 1.2 % and 3.9 % per year (p-values less than 2.8 × 10⁻⁶ for all species in Fig. 10d). This consistency can be confirmed in the linear relationship between AEC and other variables (listed at the bottom of Fig. 10): AEC does not correlate with either the transport or wet removal tracers (R= 0.08 and −0.14, respectively) but it correlates significantly with the surface anthropogenic emissions of all aerosol-related species (R= 0.73–0.82).
As described in Sect. 2.1, the model simulations for 2015–2018 used CMIP6 anthropogenic emissions in 2014, due to the lack of emission estimates after 2014. To examine the effects of using the constant anthropogenic emissions for the last 4 years in model-estimated trends, we calculate p-values and Sen's slopes with the MK method by removing the 2015–2018 simulations. The resultant statistics remains similar for all variables, e.g., p-value for AEC increases slightly to 0.023 and, as expected, the trend increases to 0.018 × 10³ km−1 yr−1. At the same time, changes of correlation coefficients between AEC and anthropogenic emissions in Asia are within ±0.01, and AEC still does not correlate with the transport and removal tracers. These results indicate that the increase in non-volcanic AEC in the ASM upper troposphere in recent decades has been determined primarily by the growth of anthropogenic emissions in Asia, and the future changes of such trend, either increase or decrease, can be projected with the forecast of future anthropogenic emissions.
3.4.2 Interannual variability
We further examine the interannual variabilities of upper tropospheric AEC, TRCO50, and TR in the ASMA region using multi-model ensemble means with the linear trend of AEC removed from the time series. To examine how the interannual variabilities are related to large-scale climate or monsoon variabilities, we correlate the time series of detrended AEC, TRCO50, and TR with the Multivariate El Niño/Southern Oscillation (ENSO) Index version 2 (MEI.v2) and two Asian summer monsoon indices, the East Asian Summer Monsoon Index (EASMI) and the South Asian Summer Monsoon Index (SASMI). Table 5 provides brief descriptions of these indices.
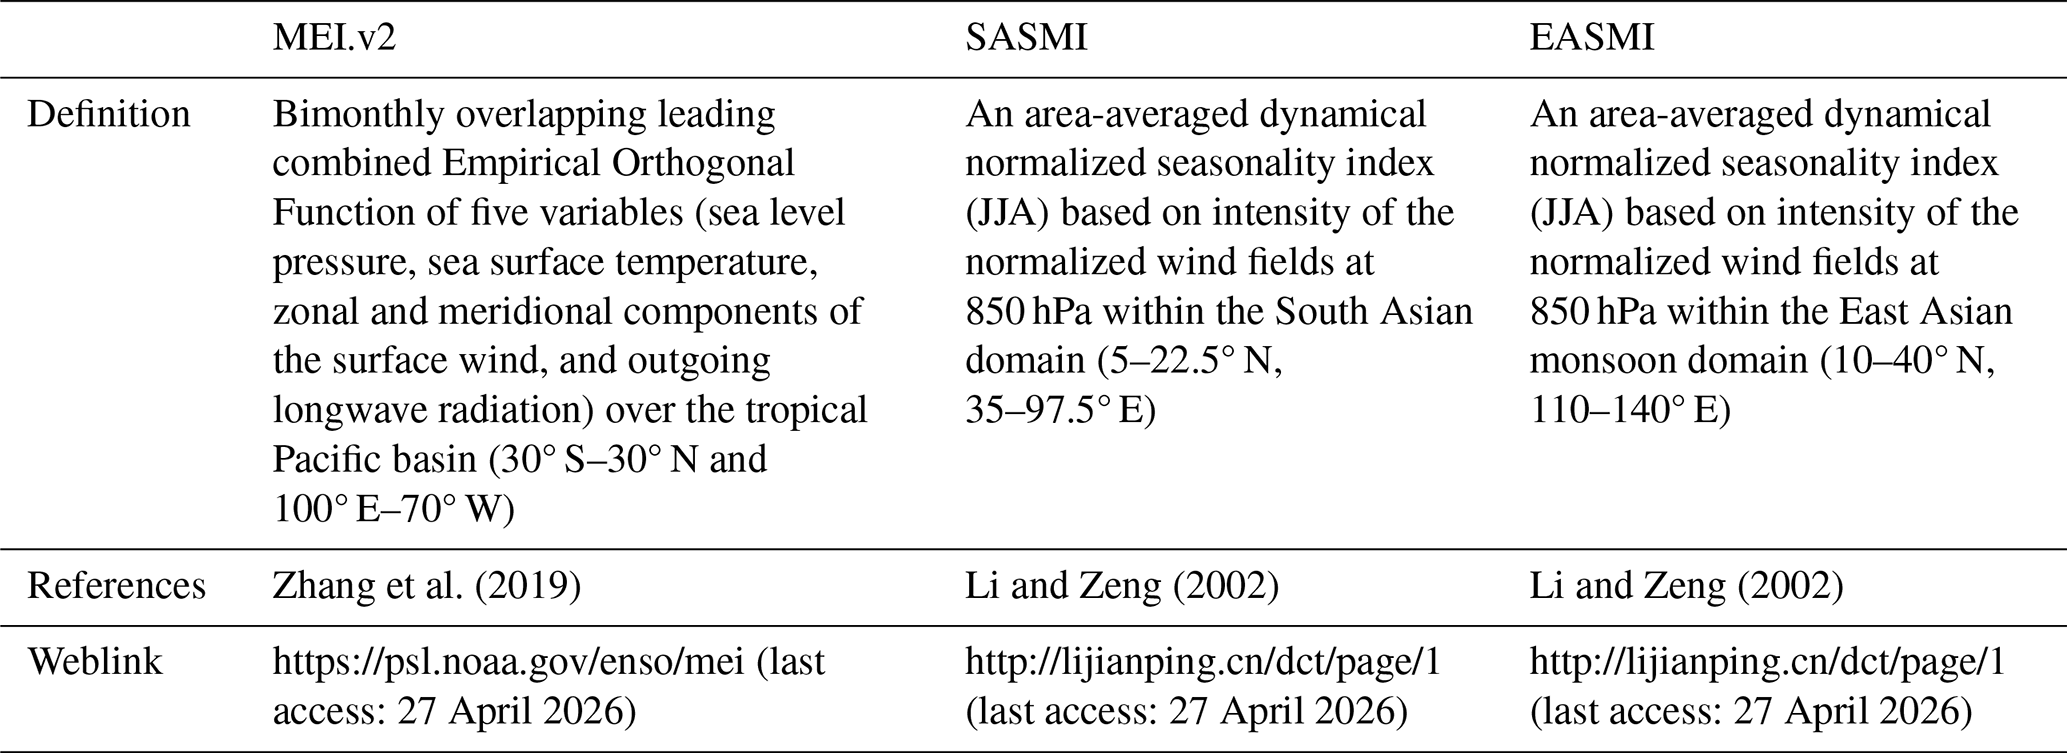
As shown in Fig. 11, the detrended AEC, TRCO50, and TR exhibit moderate correlations with MEI.v2, with both AEC and TRCO50 negatively correlated (R= −0.41 and −0.42, respectively) but TR positively correlated with MEI.v2 (R= 0.68). These relationships imply that during years with negative MEI.v2 (La Niña conditions), convective transport tends to be more efficient while wet removal tends to be less efficient over the ASM region, leading to higher AEC values in the upper troposphere compared to years with positive MEI.v2 (El Niño conditions). By contrast, variations in AEC and the two tracers in the ASMA regions show low correlations with the two wind-based Asian summer monsoon indices, SASMI and EASMI (R= −0.16 and −0.29, respectively; Figures not shown).
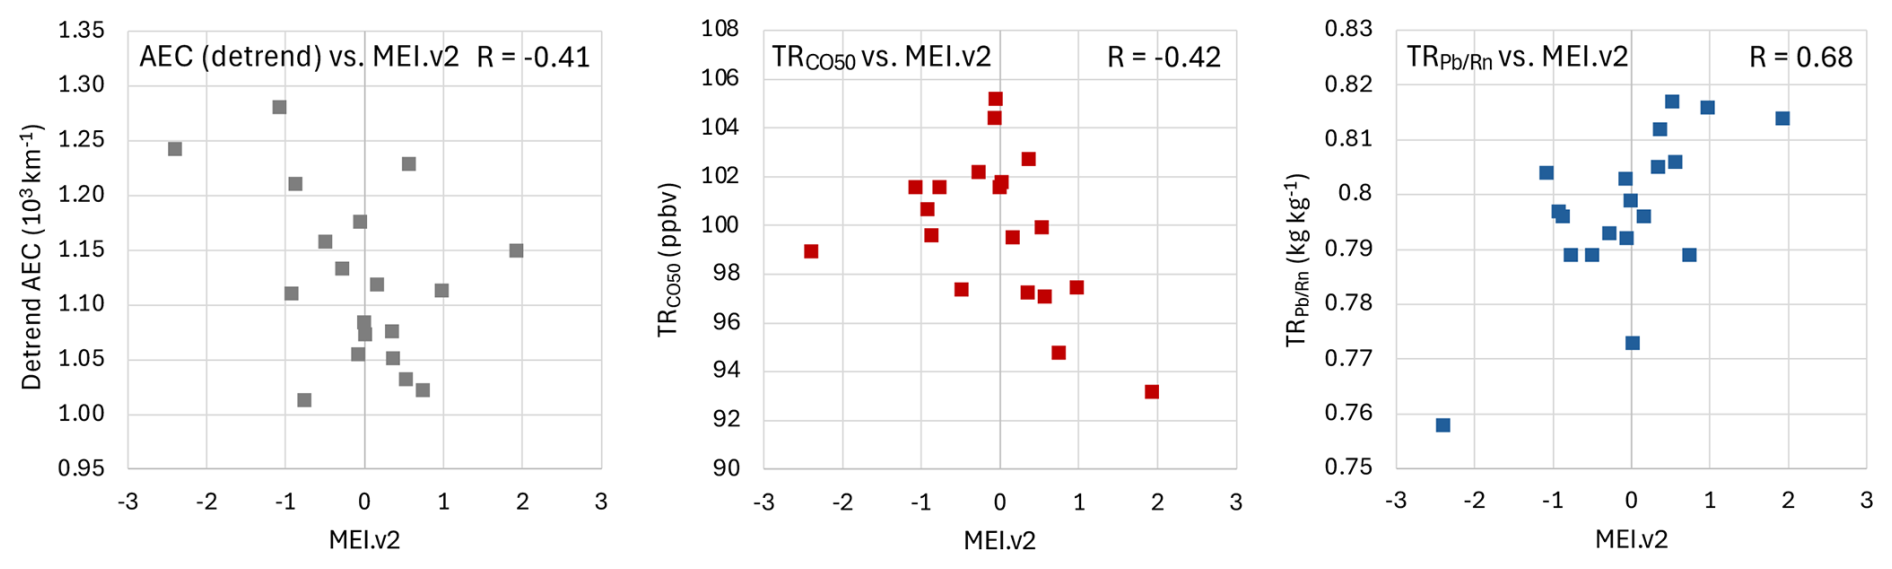
Figure 11Scatter plots showing correlations between MEI.v2 and the detrended Augst values of AEC (left), TRCO50 (middle), and TR (right) in the ASMA region for 2000–2018.
The multi-model ensemble results presented in this section suggest that the non-volcanic AEC trend in the upper tropospheric ASMA region corresponds to anthropogenic emission trends in Asia, while interannual variability in AEC appears to be linked to climate variability represented by MEI.v2.
In this section, we discuss several modeling and evaluation issues encountered in the preceding analysis of UTLS aerosols, with the aim of identifying approaches to improve future coordinated efforts.
4.1 Inter-model differences in AEC
The multi-model simulations of non-volcanic AEC in the summertime upper troposphere ASMA region exhibit substantial diversity, with an inter-model CV across the eight models ranging from 64 % to 84 % evaluated for August during 2000–2018. Diagnostic results from the common transport (TRCO50) and removal (TR) tracers indicate that difference in wet removal processes is more responsible than transport for the inter-model spread in AEC, and transport and removal together can explain 50 % of the AEC divergence across models. Other factors, such as secondary aerosol formation, microphysics schemes, size distributions, and optical property assumptions, should also contribute to the AEC variance, a full quantification of these effects would require additional targeted model outputs or common tracers.
Furthermore, significant discrepancies in model-simulated volcanic AEC from the BASE experiment (Figs. 2–3) highlight persistent challenges in representing volcanic aerosols in the models, despite all models using identical prescribed volcanic SO2 inputs. These discrepancies suggest large differences in implementing plume injection heights, sulfate aerosol formation pathways through SO2 oxidation, and microphysical treatments of volcanic aerosols. Obviously, considerable effort is needed in the modeling community to improve volcanic aerosol simulation capabilities, which is essential for broader climate and composition applications. Finally, the inclusion of background sulfate aerosol from OCS oxidation is necessary for an accurate representation of stratospheric aerosol loading, especially during volcanically quiescent periods (Chin and Davis, 1995; Brühl et al., 2012; Gurganus et al., 2025). The absence of this component in most participating models limits a comprehensive assessment of aerosol composition, variability, and trends in the stratosphere.
The large model diversity in AEC may hamper the robustness of the two-decadal multi-model ensemble AEC trend in the upper tropospheric ASMA region presented in Fig. 10. While differentially weighting models based on observational agreement (e.g., Brunner et al., 2019) could potentially refine the multi-model ensemble means by excluding outliers, our focus on the tropospheric-originating, non-volcanic aerosols that are not directly observable, thus making an unweighted ensemble approach more reasonable for this study.
4.2 Diagnostic tracers for model processes
The inclusion of standardized transport and removal tracers in this experiment provide valuable information on the characteristics of advection, convection, and aerosol removal efficiency, allowing a more quantitative diagnosis of inter-model differences than has been possible in many prior aerosol intercomparison efforts. Still, several caveats apply when interpreting the results. For TRCO50, a key advantage is the co-location of CO sources with many fine mode aerosol and precursor emissions, coupled with abundant observational constraints from satellites and in situ measurements. However, because TRCO50 has a longer atmospheric lifetime (50 d) than aerosols (a few days) and includes a uniform background TRCO50 source from methane oxidation (25 ppb in this study), its inter-model spread is expected to be much smaller than that found for aerosols. In addition, this tracer is not suitable for tracking aerosols emitted from deserts, oceans, or other places that have entirely different source locations as CO.
For the removal tracer, we choose to use the ratio of TRPb to TRRn, i.e. TR, instead of absolute concentration of TRPb because TR provides a robust diagnostic of wet removal efficiency by normalizing TRPb against its precursor TRRn, thereby reducing sensitivity to model-specific TRRn transport. Since TRRn is not subject to deposition, it acts as a steady reference frame such that the value of TR primarily reflects the integrated history of removal processes experienced by aerosol-attached TRPb.
Broadly, two primary factors govern the simulated transport and removal processes: the representation of parameterized physical processes (e.g., convective transport, wet scavenging) and the dynamic meteorological fields (e.g., winds, precipitation) driving these processes. The current experimental design does not allow separation of the inter-model differences arising from model parameterizations versus meteorology; rather, it diagnoses their compounded effects. Future model experiments, such as prescribing a unified meteorological forcing across all participating models, would better differentiate the variance associated with large-scale atmospheric flow from that stemming from sub-grid scale parameterizations. Previous work has shown that even with identical meteorological forcing, inter-model differences in parameterized convection can substantially alter the transport characteristics (Orbe et al., 2017). Adopting similar “constrained-meteorology” framework in future AeroCom experiments would allow more in-depth diagnostics and lead to improvements of parameterizations among models.
Lastly, as we discussed earlier, additional diagnostics tools for secondary aerosol production and aerosol microphysical properties (particle size, mass extinction efficiency, hygroscopic properties, etc.) are needed to further assess the inter-model differences in aerosol fields.
4.3 Tropopause height
Figures 5, 7, and 8 have revealed substantial inter-model variability in tropopause height during August, with differences of several tens of hPa. For instance, the GISS models consistently show the highest tropopause altitudes, whereas the GFDL models sharply drop the tropopause to lower altitudes over the ASM core (∼ 90° E). These disparities reflect differences in underlying meteorology as well as variations in tropopause diagnosis methods across modeling groups. Tropopause height is typically identified using several distinct criteria including thermal definition based on the temperature lapse rate (World Meteorological Organization, 1957), dynamical definition using specific potential vorticity thresholds (e.g., Hoinka, 1998), and composition-based definition derived from the sharpness of vertical gradients in trace gases such as ozone or water vapor (e.g., Shepherd, 2002). In the current study, we are unable to resolve these inter-model differences by imposing a unified definition or recalculating a coherent tropopause for each model (e.g., Pisoft et al., 2021) from the model outputs.
Notably, the tropopause height is a diagnostic quantity that does not influence the prognostic physical processes evaluated here. The inter-model spread in August mean tropopause height does not appear to correlate with the AEC differences in the upper troposphere, confirming that the large variability in ASMA aerosol loading is primarily driven by internal physical processes rather than differences in the geometrical definition of the tropopause boundary. However, the vertical placement of tropopause has directly impact on stratosphere-related quantitative assessments including stratosphere-troposphere exchange, composition in the lower stratosphere, and integrated stratospheric column quantities such as stratospheric aerosol optical depth (e.g., Millán et al., 2024). Consequently, users engaged in those studies must exercise caution, as the perceived “stratospheric” or “tropospheric” character of a species is highly sensitive to the tropopause altitude.
4.4 Evaluation of model-simulated UTLS aerosols with satellite data
The shortage of vertically resolved observable metrics remains a major limitation for constraining the model-simulated aerosols and related processes. Satellite aerosol vertical profile datasets are available primarily from lidars or limb-scatter instruments that provide aerosol extinction or backscatter coefficients. As mentioned in Sect. 3.1, retrievals targeting the upper troposphere and tropopause region are subject to significant uncertainties, largely due to the technical challenge in separating aerosols from ice clouds. On the other hand, in-situ aircraft measurements offer critical complementary datasets, providing higher precision aerosol characterization. Data collected in and around ASMA region, such as the StratoClim campaign in summer 2017 over the Indo-Gangetic Plain and Himalayan foothills (Appel et al., 2022; Mahnke et al., 2021) and the ACCLIP mission in summer 2022 over the western North Pacific (Pan et al., 2025), are particularly valuable for evaluating model simulations of aerosols composition, size distribution, and chemical precursors in this regions. However, the high accuracy of aircraft data is inherently balanced against limited spatial and temporal coverage. Bridging the gap between global model simulations and diverse observational datasets requires coordinated efforts to integrate in-situ and satellite data with harmonized frameworks for model evaluation. Strengthening such coordination will be crucial for improving UTLS aerosol representation in future model generations.
This study analyzes upper tropospheric aerosols associated with ASM dynamics using the AeroCom Phase III UTLS multi model experiment for the period 2000–2018. Despite the use of identical prescribed anthropogenic, biomass burning, and volcanic emissions across participating models, large discrepancies emerge in simulated aerosol extinction (AEC) in the UTLS. Because inconsistent volcanic aerosol treatments lead to irreconcilable differences across models, our assessment focuses on non-volcanic aerosols that are predominantly influenced by ASM processes. The principal conclusions are given below.
Significant inter-model differences exist in upper troposphere non-volcanic AEC over the ASMA region. A case study for August 2012 reveals large AEC disparities exceeding a factor of 20 between models. Using two standardizes diagnostic tracers, we attribute a substantial fraction of this diversity to specific physical processes of transport (diagnosed with TRCO50) and wet removal (diagnosed with TR). All models show the “two-stem mushroom” vertical structure of TRCO50 associated with strong ASM convective uplift and subsequent anticyclonic re-distribution, the inter-model variability in TRCO50 is remarkably small in the upper tropospheric ASMA region (CV = 3 %–4 %), far lower than the variability in AEC (CV = 79 %). In contrast, TR exhibits much larger inter-model variability (CV = 35 %), indicating that differences in wet scavenging play a significantly greater role than transport processes in making the inter-model AEC spread. This behavior is consistent across all years from 2000 to 2018 in August (AEC CV = 64 %–86 %; TRCO50 CV = 2 %–8 %; TR CV = 34 %–38 %). Taken together, differences in transport and wet removal explain about half of the inter-model variance in non-volcanic AEC over the ASMA region in the upper troposphere.
Using multi-model ensemble means at 150 hPa over the ASMA region, we find a statistically significant increase trend in non-volcanic AEC during 2000–2018 (0.013 × 10³ km−1 yr−1 or 1.2 % yr−1; p= 0.02). This trend aligns closely with rising Asian anthropogenic emissions of primary aerosols and precursor gases (1.2 %–3.9 % yr−1; R= 0.73–0.82) rather than shifts in transport or removal processes. On interannual timescales, variations in detrended AEC and diagnostic tracers are modulated by climate variability represented by MEI.v2 index. While AEC and TRCO50 are moderately negatively correlated with MEI.v2 (R= −0.41 and −0.42, respectively), TR shows a positive correlation with MEI.v2 (R= +0.68). These relationships suggest that AEC in the upper tropospheric ASM region tends to be higher during La Niña (negative MEI.v2) due to stronger uplift and weaker wet removal, with the opposite occurring during El Niño.
The present study yields several key recommendations:
-
Strengthen observational constraints for upper tropospheric aerosols. Satellite retrievals of AEC remain challenged by the difficulties in separating relatively weak aerosol signals from the frequent presence of ice clouds in the upper troposphere. To reduce these uncertainties, a more robust integration of vertically resolved satellite observations with targeted aircraft campaigns is essential to develop benchmark evaluation framework for constraining the aerosol processes and properties represented in global models.
-
Expand standardized diagnostic tracers for process attribution. The transport and removal tracers used in this experiment are proven highly effective for isolating the drivers of inter-model divergence. We recommend a wider adoption of these standardized tracers to evaluate inter-model and/or interannual variability and to evaluate improvements across successive model versions. Furthermore, developing standardized diagnostics tools for chemical transformation and aerosol microphysical properties is highly valuable to move toward for more comprehensive analyses.
-
Advance UTLS aerosol simulation capabilities in global models. The substantial inter-model spread identified in this study highlights a critical need for focused development in the modeling community. Priorities should include improving the representation of volcanic aerosol evolution and inclusion of stratospheric background sulfate aerosol from OCS oxidation. Addressing these gaps is fundamental to our understanding of aerosol burdens and climate forcing in the UTLS.
The datasets used in this work are publicly accessible.
Emission datasets:
-
CMIP6 anthropogenic emission: https://esgf-node.llnl.gov/search/input4mips/ (last access: 27 April 2026).
-
CMIP6 biomass burning emission: https://doi.org/10.3334/ORNLDAAC/1293 (Randerson et al., 2017).
-
GFED4.1s biomass burning emission: available at https://www.geo.vu.nl/~gwerf/GFED/GFED4/ (last access: 27 April 2026).
-
Eruptive volcanic SO2 emission: https://disc.gsfc.nasa.gov/datasets?keywords=MSVOLSO2&page=1 (last access: 27 April 2026).
-
Degassing volcanic SO2 emissions: https://www.nature.com/articles/srep44095#supplementary-information/ (last access: 27 April 2026).
-
Radon-222 monthly emission (used for TRRn and TRPb): https://portal.nccs.nasa.gov/datashare/gocart/aerocom3/tracers/ (last access: 27 April 2026).
-
CO monthly sources (used for TRCO50): https://portal.nccs.nasa.gov/datashare/gocart/aerocom3/tracers/ (last access: 27 April 2026).
AeroCom Phase-III UTLS model experiment output:
-
Output from participating models are archived in the AeroCom repository hosted by the Norwegian Institute of Meteorology. They can be accessed following the procedure described at https://aerocom.met.no/FAQ/data_access/retrieve_data/ (last access: 27 April 2026).
Satellite data:
-
SCIAMACHY aerosol extinction profile at the University of Bremen: https://www.iup.uni-bremen.de/DataRequest (last access: 27 April 2026).
-
OSIRIS aerosol extinction profile at the University Saskatchewan: https://research-groups.usask.ca/osiris (last access: 27 April 2026).
-
OMPS LP aerosol extinction profile at NASA GSFC: https://avdc.gsfc.nasa.gov/pub/tmp/OMPS_aer/aer_gridded (last access: 27 April 2026).
-
CALIPSO Lidar Level 3 Stratospheric Aerosol Profiles data: https://doi.org/10.5067/CALIOP/CALIPSO/LID_L3_ STRATOSPHERIC_APRO-STANDARD-V1-00 (NASA Langley Atmospheric Science Data Center DAAC, 2026).
The supplement related to this article is available online at https://doi.org/10.5194/acp-26-6035-2026-supplement.
MC conceived this project and designed the model experiment with contributions from HB and XP. Model simulations were performed by HB, SB, PG, ZG, SF, AL, HM, YP, KT, TT, and JSW contributed model simulations. JPB, GT, JK, LR, AR, AB, and CA provided the L3 satellite aerosol data. QT assisted with satellite CO data. MC carried out the analysis, wrote the initial draft, and finalized the manuscript with contributions and feedback from all coauthors. JSW provided detailed editing on the manuscript.
At least one of the (co-)authors is a member of the editorial board of Atmospheric Chemistry and Physics. The peer-review process was guided by an independent editor, and the authors also have no other competing interests to declare.
Publisher's note: Copernicus Publications remains neutral with regard to jurisdictional claims made in the text, published maps, institutional affiliations, or any other geographical representation in this paper. The authors bear the ultimate responsibility for providing appropriate place names. Views expressed in the text are those of the authors and do not necessarily reflect the views of the publisher.
We acknowledge the Norwegian Meteorological Institute AeroCom team (Michael Schulz, Anna Benedictow, Jan griesfeller) for supporting the AeroCom model experiment, providing AeroCom model repository, and facilitating data access. We thank the JPL MLS team for satellite CO data, Simon Carn for volcanic SO2 emission datasets, and CEDS and GFED teams for anthropogenic and biomass burning emission datasets. We thank Bo Zhang for providing 222Rn emission dataset. and acknowledge the IGAC/APARC ACAM community for collaboration.
Authors at GSFC (MC, HB, and XP) and GISS (KT, SB) acknowledge their respective organizations (the Atmospheric Chemistry and Dynamic (ACD) Laboratory and Global Modeling and Assimilation Office (GMAO) at GSFC and climate modeling at GISS, respectively) for model infrastructure, software resources, and IT support, as well as NASA High-end computing (HEC) facilities through the NASA Center for Climate Simulations (NCCS) for computational resources.
The University of Bremen group gratefully acknowledges the computing time granted by the Resource Allocation Board and provided for the supercomputers Lise and Emmy at NHR@ZIB and NHR@Göttingen as part of the NHR infrastructure. The SCIAMACHY data were processed using computing resources under project no. hbk00098.
We gratefully acknowledge the constructive comments and suggestions by two reviewers.
MC, HB, QT, and XP were supported by NASA Earth Science Programs of Aura ST, ACMAP, ISFM, and MAP. JSW, YP and ZG were supported by the National Natural Science Foundation of China (grant nos. 42275053, 42175096, and 42205085), the Open Fund for the Ministry of Education Key Laboratory for Earth System Modeling (2023), and the National Key Scientific and Technological Infrastructure project “Earth System Numerical Simulation Facility” (EarthLab). HM was supported by the Ministry of Education, Culture, Sports, Science, and Technology (MEXT) and the Japan Society for the Promotion of Science (JSPS) through KAKENHI Grants (grant nos. JP23K18519, JP23K24976, and JP26K03065), the MEXT Arctic Challenge for Sustainability II (ArCS II; grant no. JPMXD1420318865) and 3 (ArCS-3; grant no. JPMXD1720251001) Projects, and the Environment Research and Technology Development Fund 2-2301 (grant no. JPMEERF20232001) and 2-2602 (grant no. JPMEERF20262002) of the Environmental Restoration and Conservation Agency. KT and SB were supported by NASA Modeling, Analysis and Prediction program (MAP). TT was supported by the Environment Research and Technology Development Fund S-20 (grant no. JPMEERF21S12010) of the Environmental Restoration and Conservation Agency provided by the Ministry of Environment of Japan, and the NEC SX supercomputer system of the National Institute for Environmental Studies of Japan. JPB, AR and CA were funded in part by the State and University of Bremen, ESA (project CREST) and the German Research Foundation (DFG) Research Unit VolImpact (grant no. FOR 2820).
This paper was edited by Hailong Wang and reviewed by Daniele Visioni and one anonymous referee.
Appel, O., Köllner, F., Dragoneas, A., Hünig, A., Molleker, S., Schlager, H., Mahnke, C., Weigel, R., Port, M., Schulz, C., Drewnick, F., Vogel, B., Stroh, F., and Borrmann, S.: Chemical analysis of the Asian tropopause aerosol layer (ATAL) with emphasis on secondary aerosol particles using aircraft-based in situ aerosol mass spectrometry, Atmos. Chem. Phys., 22, 13607–13630, https://doi.org/10.5194/acp-22-13607-2022, 2022.
Balkanski, Y. J., Jacob, D., Gardner, G. M., Graustein, W. C., and Turekian, K. K.: Transport and residence times of tropospheric aerosols inferred from a global three-dimensional simulation of 210Pb, J. Geosphys. Res., 98, 20571–20586, https://doi.org/10.1029/93JD02456, 1993.
Bauer, S. E., Wright, D. L., Koch, D., Lewis, E. R., McGraw, R., Chang, L.-S., Schwartz, S. E., and Ruedy, R.: MATRIX (Multiconfiguration Aerosol TRacker of mIXing state): an aerosol microphysical module for global atmospheric models, Atmos. Chem. Phys., 8, 6003–6035, https://doi.org/10.5194/acp-8-6003-2008, 2008.
Bauer, S. E., Tsigaridis, K., Faluvegi, G., Nazarenko, L., Miller, R. L., Kelley, M., and Schmidt, G.: The turning point of the aerosol era, J. Adv. Model. Earth Sy., 14, e2022MS003070, https://doi.org/10.1029/2022MS003070, 2022.
Boucher, O., Randall, D., Artaxo, P., Bretherton, C., Feingold, G., Forster, P., Kerminen, V.-M., Kondo, Y., Liao, H., Lohmann, U., Rasch, P., (USA), Satheesh, S. K., Sherwood, S., Stevens, B., and Zhang, X.-Y.: Clouds and Aerosols, in: Climate Change 2013: The Physical Science Basis. Contribution of Working Group I to the Fifth Assessment Report of the Intergovernmental Panel on Climate Change, edited by: Stocker, T. F., Qin, D., Plattner, G.-K., Tignor, M., Allen, S. K., Boschung, J., Nauels, A., Xia, Y., Bex, V., and Midgley, P. M., Cambridge University Press, Cambridge, United Kingdom and New York, NY, USA, ISBN 978-1-107-66182-0, 2013.
Bourassa, A. E., Rieger, L. A., Lloyd, N. D., and Degenstein, D. A.: Odin-OSIRIS stratospheric aerosol data product and SAGE III intercomparison, Atmos. Chem. Phys., 12, 605–614, https://doi.org/10.5194/acp-12-605-2012, 2012.
Bovensmann, H., Burrows, J., Buchwitz, M., Frerick, J., Noël, S., Rozanov, V., Chance, K., and Goede, A.: SCIAMACHY: mission objectives and measurement modes, J. Atmos. Sci., 56, 127–150, https://doi.org/10.1175/1520-0469(1999)056<0127:SMOAMM>2.0.CO;2, 1999.
Brühl, C., Lelieveld, J., Crutzen, P. J., and Tost, H.: The role of carbonyl sulphide as a source of stratospheric sulphate aerosol and its impact on climate, Atmos. Chem. Phys., 12, 1239–1253, https://doi.org/10.5194/acp-12-1239-2012, 2012.
Brunner, L., Lorenz, R., Zumwald, M., and Knutti, R.: Quantifying uncertainty in European climate projections using combined performance-independence weighting, Environ. Res. Lett., 14, 124010, https://doi.org/10.1088/1748-9326/ab492f, 2019.
Burrows, J. P., Hölzle, E., Goede, A. P. H., Visser, H., and Fricke, W.: SCIAMACHY – Scanning Imaging Absorption Spectrometer for Atmospheric Chartography, Acta Astronaut., 35, 445–451, https://doi.org/10.1016/0094-5765(94)00278-T, 1995.
Carn, S.: Multi-Satellite Volcanic Sulfur Dioxide L4 Long-Term Global Database V4, Greenbelt, MD, USA, Goddard Earth Science Data and Information Services Center (GES DISC) [data set], https://doi.org/10.5067/MEASURES/SO2/DATA405, 2025.
Carn, S. A., Yang, K., Prata, A. J., and Krotkov, N. A.: Extending the long-term record of volcanic SO2 emissions with the Ozone Mapping and Profiler Suite nadir mapper, Geophys. Res. Lett., 42, 925–932, https://doi.org/10.1002/2014GL062437, 2015.
Carn, S. A., Fioletov, V. E., McLinden, C. A., Li, C., and Krotkov, N. A.: A decade of global volcanic SO2 emissions measured from space, Sci. Rep., https://doi,org/10.1038/srep44095, 2017.
Chin, M. and Davis, D. D.: A reanalysis of carbonyl sulfide as a source of stratospheric background sulfur aerosol, J. Geophys. Res., 100, 8993–9005, https://doi.org/10.1029/95JD00275, 1995.
Chin, M., Diehl, T., Dubovik, O., Eck, T. F., Holben, B. N., Sinyuk, A., and Streets, D. G.: Light absorption by pollution, dust, and biomass burning aerosols: a global model study and evaluation with AERONET measurements, Ann. Geophys., 27, 3439–3464, https://doi.org/10.5194/angeo-27-3439-2009, 2009.
Colarco, P., da Silva, A., Chin, M., and Diehl, T.: Online simulations of global aerosol distributions in the NASA GEOS-4 model and comparisons to satellite and ground-based aerosol optical depth, J. Geophys. Res.-Atmos., 115, D14207, https://doi.org/10.1029/2009JD012820, 2010.
Fadnavis, S., Kalita, G., Kumar, K. R., Gasparini, B., and Li, J.-L. F.: Potential impact of carbonaceous aerosol on the upper troposphere and lower stratosphere (UTLS) and precipitation during Asian summer monsoon in a global model simulation, Atmos. Chem. Phys., 17, 11637–11654, https://doi.org/10.5194/acp-17-11637-2017, 2017.
Fadnavis, S., Roy, C., Chattopadhyay, R., Sioris, C. E., Rap, A., Müller, R., Kumar, K. R., and Krishnan, R.: Transport of trace gases via eddy shedding from the Asian summer monsoon anticyclone and associated impacts on ozone heating rates, Atmos. Chem. Phys., 18, 11493–11506, https://doi.org/10.5194/acp-18-11493-2018, 2018.
Fadnavis, S., Müller, R., Kalita, G., Rowlinson, M., Rap, A., Li, J.-L. F., Gasparini, B., and Laakso, A.: The impact of recent changes in Asian anthropogenic emissions of SO2 on sulfate loading in the upper troposphere and lower stratosphere and the associated radiative changes, Atmos. Chem. Phys., 19, 9989–10008, https://doi.org/10.5194/acp-19-9989-2019, 2019.
Gao, J., Huang, Y., Peng, Y., and Wright, J. S.: Aerosol effects on clear-sky shortwave heating in the Asian monsoon tropopause layer, J. Geophys. Res.-Atmos., 128, e2022JD036956, https://doi.org/10.1029/2022JD036956, 2023.
Gettelman, A., Kinnison, D. E., Dunkerton, T. J., and Brasseur, G. P.: Impact of monsoon circulations on the upper troposphere and lower stratosphere, J. Geophys. Res., 109, D22101, https://https://doi.org/10.1029/2004JD004878, 2004.
Gurganus, C., Rollins, A., Waxman, E., Pan, L. L., Smith, W. P., Ueyama, R., Feng, W., Chipperfield, M. P., Atlas, E. L., Schwarz, J. P., DeLone, S., and Thornberry, S.: Highlighting the impact of anthropogenic OCS emissions on the stratospheric sulfur budget with in situ observations, J. Geophys. Res.-Atmos., 130, e2024JD042588, https://doi.org/10.1029/2024JD042588, 2025.
Hanumanthu, S., Vogel, B., Müller, R., Brunamonti, S., Fadnavis, S., Li, D., Ölsner, P., Naja, M., Singh, B. B., Kumar, K. R., Sonbawne, S., Jauhiainen, H., Vömel, H., Luo, B., Jorge, T., Wienhold, F. G., Dirkson, R., and Peter, T.: Strong day-to-day variability of the Asian Tropopause Aerosol Layer (ATAL) in August 2016 at the Himalayan foothills, Atmos. Chem. Phys., 20, 14273–14302, https://doi.org/10.5194/acp-20-14273-2020, 2020.
Hoesly, R. M., Smith, S. J., Feng, L., Klimont, Z., Janssens-Maenhout, G., Pitkanen, T., Seibert, J. J., Vu, L., Andres, R. J., Bolt, R. M., Bond, T. C., Dawidowski, L., Kholod, N., Kurokawa, J.-I., Li, M., Liu, L., Lu, Z., Moura, M. C. P., O'Rourke, P. R., and Zhang, Q.: Historical (1750–2014) anthropogenic emissions of reactive gases and aerosols from the Community Emissions Data System (CEDS), Geosci. Model Dev., 11, 369–408, https://doi.org/10.5194/gmd-11-369-2018, 2018.
Hoinka, K. P.: Statistics of the global tropopause pressure, Mon. Weather Rev., 126, 3303–3325, https://doi.org/10.1175/1520-0493(1998)126<3303:SOTGTP>2.0.CO;2, 1998.
Honomichl, S. B. and Pan, L. L.: Transport from the Asian summer monsoon anticyclone over the western Pacific, J. Geophys. Res.-Atmos., 125, e2019JD032094, https://doi.org/10.1029/2019JD032094, 2020.
Jiang, J. H., Livesey, N. J., Su, H., Neary, L., McConnell, J. C., and Richards, N. A. D.: Connecting surface emissions, convective uplifting, and long-range transport of carbon monoxide in the upper troposphere: New observations from the Aura Microwave Limb Sounder, Geophys. Res. Lett., 34, L18812, https://doi.org/10.1029/2007GL030638, 2007.
Kärcher, B.: Cirrus clouds and their response to anthropogenic activities, Curr. Clim. Change Rep., 3, 1–13, https://doi.org/10.1007/s40641-017-0060-3, 2017.
Kärcher, B. and Lohmann, U.: A parameterization of cirrus cloud formation: Homogeneous freezing of super cooled aerosols, J. Geophys. Res., 107, https://doi.10.1029.2001JD000470, 2002.
Kar, J., Bremer, H., Drummond, J. R., Rochon, Y. J., Jones, D. B. A., Nichitiu, F., Zou, J., Liu, J., Gille, J. C., Edwards, D. P., Deeter, M. N., Francis, G., Ziskin, D., and Warner, J.: Evidence of vertical transport of carbon monoxide from Measurements of Pollution in the Troposphere, Geophys. Res. Lett., 31, L23105, https://doi.org/10.1029/2004GL021128, 2004.
Kar, J., Lee, K.-P., Vaughan, M. A., Tackett, J. L., Trepte, C. R., Winker, D. M., Lucker, P. L., and Getzewich, B. J.: CALIPSO level 3 stratospheric aerosol profile product: version 1.00 algorithm description and initial assessment, Atmos. Meas. Tech., 12, 6173–6191, https://doi.org/10.5194/amt-12-6173-2019, 2019.
Kendall, M. G.: Rank Correlation Methods, 4th edn., Charles Griffin, London, ISBN 9780852641996, 1975.
Koch, D., Schmidt, G. A., and Field, C. V.: Sulfur, sea salt, and radionuclide aerosols in GISS ModelE, J. Geophys. Res.-Atmos., 111, D06206, https://doi.org/10.1029/2004JD005550, 2006.
Kremser, S., Thomason, L. W., von Hobe, M., Hermann, M., Deshler, T., Timmreck. C., Toohey, M., Stenke, A., Schwarz, J. P., Weigel, R., Fueglistaler, S., Prata, F. J., Vernier, J.-P., Schlager, H., Barnes, J. E., Antuña-Marrero, J.-C., Fairlie, D., Palm, M., Mahieu, E., Notholt, J., Rex, M., Bingen, C., Vanhellemont, F., Bourassa, A., Plane, J. M. C., Klocke, D., Carn, S. A., Clarisse, L., Trickl, T., Neely, R., James, A. E., Rieger, L., Wilson, J. C., and Meland, B.: Stratospheric aerosol – observations, processes, and impact on climate, Rev. Geophys., 54, 278–335, https://doi.org/10.1002/2015RG000511, 2016.
Langille, J., Rieger, L. A., Blanchard, Y., Blanchet, J.-P., Bourassa, A., Degenstein, D., Huang, Y., Strong, K., Walker, K., Zawada, D., Braun, S., Cole, J., Mariani, Z., Mclinden, C., Paquin-Ricard, D., Sioris, C., Qu, Z., Wolde, M., Wang, X., Al-Abadleh, A., Ariya, P., Beltrami, H., Chang, R., Fletcher, C. G., Goldblatt, C., Grenier, P., Gyakum, J., Kushner, P., Di Luca, A., MacDougall, A. H., O'Neill, N., Pausata, F. S. R., Sica, R., Tan, I., Thériault, J. M., Tegtmeier, S., Toohey, M., Ward, W., and Wiacek, A.: A high-latitude aerosols, water vapour and clouds mission: concept, scientific objectives and data products, B. Am. Meteorol. Soc., https://doi.org/10.1175/BAMS-D-23-0309.1, 2025.
Lau, W. K. M., Yuan, C., and Li, Z.: Origin, Maintenance and Variability of the Asian Tropopause Aerosol Layer (ATAL): The Roles of Monsoon Dynamics, Sci. Rep., 8, 3960, https://https://doi.org/10.1038/s41598-018-22267-z, 2018.
Legras, B. and Bucci, S.: Confinement of air in the Asian monsoon anticyclone and pathways of convective air to the stratosphere during the summer season, Atmos. Chem. Phys., 20, 11045–11064, https://doi.org/10.5194/acp-20-11045-2020, 2020.
Li, J. and Zeng, Q. C: A unified monsoon index, Geophys. Res. Lett., 29, 1274, https://doi.org/10.1029/2001GL013874, 2002.
Li, Q. B., Jiang, J. H., Wu, D. L., Read, W. G., Livesey, N. J., Waters, J. W., Zhang, Y., Wang, B., Filipiak, M. J., Davis, C. P., Turquety, S., Wu, S., Park, R. J., Yantosca, R. M., and Jacob, D. J.: Convective outflow of south Asian pollution: A global CTM simulation compared with EOS MLS observations, Geophys. Res. Lett., 32, L14826, https://doi.org/10.1029/2005GL022762, 2005.
Liang, Q., Newman, P. A., Fleming, E. L., Lait, L. R., Atlas, E., Pan, L., Kinnison, D., Western, L. M., Schauffler, S., Smith, K., Treadaway, V., Hendershot, R., Donnelly, S., Hendershot, R., Donnelly, S., and Lueb, R.: Asian summer monsoon anticyclone – the primary entryway for chlorinated very-short-lived substances to the stratosphere, Geophys. Res. Lett., 52, e2024GL110248, https://doi.org/10.1029/2024GL110248, 2025.
Lin, Y., Huang, X., Liang, Y., Qin, Y., Xu, S., Huang, W., Xu, F., Liu, L., Wang, Y., Peng, Y., Wang, L., Xue, W., Fu, H., Zhang, G. J., Wang, B., Li, R., Zhang, C., Lu, C., Chen, Y., Luo, Y., Bai, Y., Song, Z, Wang, M., Zhao, W., Zhang, F., Xu, J., Zhao, X., Lu, C., Chen, Y., Luo, Y., Hu, Y., Tang, Q., and Chen, D.: Community Integrated Earth System Model (CIESM): Description and Evaluation, J. Adv. Model. Earth Sy., 12, e2019MS002036, https://doi.org/10.1029/2019MS002036, 2020.
Liu, H., Jacob, D., Bey, I., and Yantosca, B. M.: Constraints from 210Pb and 7Be on wet deposition and transport in a global three-dimensional chemical tracer model driven by assimilated meteorological fields, J. Geophys. Res., 106, 12109–12128, https://doi.org/10.1029/2000JD900839, 2001.
Liu, X., Easter, R. C., Ghan, S. J., Zaveri, R., Rasch, P., Shi, X., Lamarque, J.-F., Gettelman, A., Morrison, H., Vitt, F., Conley, A., Park, S., Neale, R., Hannay, C., Ekman, A. M. L., Hess, P., Mahowald, N., Collins, W., Iacono, M. J., Bretherton, C. S., Flanner, M. G., and Mitchell, D.: Toward a minimal representation of aerosols in climate models: description and evaluation in the Community Atmosphere Model CAM5, Geosci. Model Dev., 5, 709–739, https://doi.org/10.5194/gmd-5-709-2012, 2012.
Ma, J., Brühl, C., He, Q., Steil, B., Karydis, V. A., Klingmüller, K., Tost, H., Chen, B., Jin, Y., Liu, N., Xu, X., Yan, P., Zhou, X., Abdelrahman, K., Pozzer, A., and Lelieveld, J.: Modeling the aerosol chemical composition of the tropopause over the Tibetan Plateau during the Asian summer monsoon , Atmos. Chem. Phys., 19, 11587–11612, https://doi.org/10.5194/acp-19-11587-2019, 2019.
Mahnke, C., Weigel, R., Cairo, F., Vernier, J.-P., Afchine, A., Krämer, M., Mitev, V., Matthey, R., Viciani, S., D'Amato, F., Ploeger, F., Deshler, T., and Borrmann, S.: The Asian tropopause aerosol layer within the 2017 monsoon anticyclone: microphysical properties derived from aircraft-borne in situ measurements, Atmos. Chem. Phys., 21, 15259–15282, https://doi.org/10.5194/acp-21-15259-2021, 2021.
Malinina, E., Rozanov, A., Vountas, M., and Burrows, J.: Stratospheric aerosol extinction coefficient, http://www.iup.uni-bremen.de/scia-arc/, last access: 31 May 2018.
Mann, H. B.: Non-parametric tests against trend, Econometrica, 13, 245–259, https://doi.org/10.2307/1907187, 1945.
Matsui, H.: Development of a global aerosol model using a two-dimensional sectional method: 1. Model design, J. Adv. Model. Earth Sy., 9, 1921–1947, https://doi.org/10.1002/2017MS000936, 2017.
Matsui, H. and Mahowald, N.: Development of a global aerosol model using a two-dimensional sectional method: 2. Evaluation and sensitivity simulations, J. Adv. Model. Earth Sy., 9, 1887–1920, https://doi.org/10.1002/2017MS000937, 2017.
Millán, L. F., Hoor, P., Hegglin, M. I., Manney, G. L., Boenisch, H., Jeffery, P., Kunkel, D., Petropavlovskikh, I., Ye, H., Leblanc, T., and Walker, K.: Exploring ozone variability in the upper troposphere and lower stratosphere using dynamical coordinates, Atmos. Chem. Phys., 24, 7927–7959, https://doi.org/10.5194/acp-24-7927-2024, 2024.
NASA Langley Atmospheric Science Data Center DAAC: CALIPSO Lidar Level 3 Stratospheric Aerosol Profiles Standard V1-00, NASA [data set], https://doi.org/10.5067/CALIOP/CALIPSO/LID_L3_STRATOS PHERIC_APRO-STANDARD-V1-00, 2026.
Noël, S., Bramstedt, K., Rozanov, A., Malinina, E., Bovensmann, H., and Burrows, J. P.: Stratospheric aerosol extinction profiles from SCIAMACHY solar occultation, Atmos. Meas. Tech., 13, 5643–5666, https://doi.org/10.5194/amt-13-5643-2020, 2020.
Orbe, C., Waugh, D. W., Wang, H., Kinnison, D. E., Lamarque, J.-F., and Times, S.: Tropospheric transport differences between models using the same large-scale meteorological fields, Geophys. Res. Lett., 44, 1068–1078, https://doi.org/10.1002/2016GL071339, 2017.
Pan, L. L., Honomichl, S. B., Kinnison, D. E., Abalos, M., Randel, W. J., Bergman, J. W., and Bian, J.: Transport of chemical tracers from the boundary layer to stratosphere associated with the dynamics of the Asian summer monsoon, J. Geophys. Res.-Atmos., 121, 14159–14174, https://doi.org/10.1002/2016JD025616, 2016.
Pan, L. L., Atlas, E. L., Newman, P. A., Thornberry, T., Jucks, K. W., Toon, O. B., Randel, W. J., Liang, Q., Kinnison, D. E., Ueyama, R., Bresch, J. F., Honomichl, S. B., Smith, W. P., Hornbrook, R. S., Ziemba, L., Fujiwara, M., Apel, E. C., Barucci, M., Bianchini, G., Brown, M., Bui, T. P., Campos, T., Chin, M., D'Amato, F., Dean-Day, J., Diskin, G., Franchin, A., Gurganus, C., Iraci, L. T., Kim, J., Koo, J.-H., Lait, L. R., Lesko, K., Podolske, J. R., Rollins, A., Sakai, T., Shiraishi, K., Treadaway, V., Viciani, S., and Waxman, E.: The Asian Summer Monsoon Chemical and Climate Impact Project (ACCLIP): An Overview, J. Geophys. Res.-Atmos., 130, e2025JD044417, https://doi.org/10.1029/2025JD044417, 2025.
Park, M., Randel, W. J., Gettelman, A., Massie, S. T., and Jiang, J. H.: Transport above the Asian summer monsoon anticyclone inferred from Aura Microwave Limb Sounder tracers, J. Geophys. Res., 112, D16309, https://doi.org/10.1029/2006jd008294, 2007.
Park, M., Randel, W. J., Emmons, L. K., and Livesey, N. J.: Transport pathways of carbon monoxide in the Asian summer monsoon diagnosed from Model of Ozone and Related Tracers (MOZART), J. Geophys. Res., 114, D08303, https://https://doi.org/10.1029/2008JD010621, 2009.
Pisoft, P., Sacha, P., Polvani, L. M., Añel, J. A., De La Torre, L., Eichinger, R., Foelsche, U., Huszar, P., Jacobi, C., Karlicky, J., Kushar, A., Miksovsky, J., Zak, M., and Rieder, H. E.: Stratospheric contraction caused by increasing greenhouse gases, Environ. Res. Lett., 16, 064038, https://doi.org/10.1088/1748-9326/abfe2b, 2021.
Ploeger, F., Konopka, P., Walker, K., and Riese, M.: Quantifying pollution transport from the Asian monsoon anticyclone into the lower stratosphere, Atmos. Chem. Phys., 17, 7055–7066, https://doi.org/10.5194/acp-17-7055-2017, 2017.
Popovic, J. M. and Plumb, R. A.: Eddy shedding from the upper-tropospheric Asian monsoon anticyclone, J. Atmos. Sci., 58, 93–104, https://doi.org/10.1175/1520-0469(2001)058<0093:ESFTUT>2.0.CO;2, 2001.
Randel, W. J. and Park, M.: Deep convective influence on the Asian summer monsoon anticyclone and associated tracer variability observed with Atmospheric Infrared Sounder (AIRS), J. Geosphys. Res.-Atmos., 111, D12314, https://https://doi.org/10.1029/2005JD006490, 2006.
Randel, W. J., Park, M., Emmons, L., Kinnison, D., Bernath, P., Walker, K. A., Boone, C., and Pumphrey, H.: Asian Monsoon Transport of Pollution to the Stratosphere, Science, 328, 611–613, https://doi.org/10.1126/science.1182274, 2010.
Randerson, J. T., van der Werf, G. R., Giglio, L., Collatz, G. J., and Kasibhatla, P. S.: Global Fire Emissions Database, Version 4.1 (GFEDv4), ORNL DAAC [data set], https://doi.org/10.3334/ORNLDAAC/1293, 2017.
Rieger, L. A., Bourassa, A. E., and Degenstein, D. A.: Merging the OSIRIS and SAGE II stratospheric aerosol records, J. Geophys. Res.-Atmos., 120, https://https://doi.org/10.1002/2015JD023133, 2015.
Rieger, L. A., Zawada, D. J., Bourassa, A. E., and Degenstein, D. A.: A multiwavelength retrieval approach for improved OSIRIS aerosol extinction retrievals, J. Geophys. Res.-Atmos., 124, 7286–7307, https://doi.org/10.1029/2018JD029897, 2019.
Santee, M. L., Manney, G. L., Livesey, N. J., Schwartz, M. J., Neu, J. L., and Read, W. G.: A comprehensive overview of the climatological composition of the Asian summer monsoon anticyclone based on 10 years of Aura Microwave Limb Sounder measurements, J. Geophys. Res.-Atmos., 122, 5491–5514, https://doi.org/10.1002/2016JD026408, 2017.
Schultz, M. G., Stadtler, S., Schröder, S., Taraborrelli, D., Franco, B., Krefting, J., Henrot, A., Ferrachat, S., Lohmann, U., Neubauer, D., Siegenthaler-Le Drian, C., Wahl, S., Kokkola, H., Kühn, T., Rast, S., Schmidt, H., Stier, P., Kinnison, D., Tyndall, G. S., Orlando, J. J., and Wespes, C.: The chemistry–climate model ECHAM6.3-HAM2.3-MOZ1.0, Geosci. Model Dev., 11, 1695–1723, https://doi.org/10.5194/gmd-11-1695-2018, 2018.
Shepherd, T. G.: Issues of stratosphere-troposphere coupling, J. Meteorol. Soc. Jpn., 80, 769–792, https://doi.org/10.2151/jmsj.80.769, 2002.
Solomon, S.: Stratospheric ozone depletion: A review of concepts and history, Rev. Geophys., 37, 275–316, https://doi.org/10.1029/1999RG900008, 1999.
Soulie, A., Granier, C., Darras, S., Zilbermann, N., Doumbia, T., Guevara, M., Jalkanen, J.-P., Keita, S., Liousse, C., Crippa, M., Guizzardi, D., Hoesly, R., and Smith, S. J.: Global anthropogenic emissions (CAMS-GLOB-ANT) for the Copernicus Atmosphere Monitoring Service simulations of air quality forecasts and reanalyses, Earth Syst. Sci. Data, 16, 2261–2279, https://doi.org/10.5194/essd-16-2261-2024, 2024.
Taha, G., Loughman, R., Zhu, T., Thomason, L., Kar, J., Rieger, L., and Bourassa, A.: OMPS LP Version 2.0 multi-wavelength aerosol extinction coefficient retrieval algorithm, Atmos. Meas. Tech., 14, 1015–1036, https://doi.org/10.5194/amt-14-1015-2021, 2021.
Takemura, T., Nozawa, T., Emori, S., Nakajima, T. Y., and Nakajima, T.: Simulation of climate response to aerosol direct and indirect effects with aerosol transport-radiation model, J. Geophys. Res.-Atmos., 110, D02202, https://doi.org/10.1029/2004JD005029, 2005.
Textor, C., Schulz, M., Guibert, S., Kinne, S., Balkanski, Y., Bauer, S., Berntsen, T., Berglen, T., Boucher, O., Chin, M., Dentener, F., Diehl, T., Easter, R., Feichter, H., Fillmore, D., Ghan, S., Ginoux, P., Gong, S., Grini, A., Hendricks, J., Horowitz, L., Huang, P., Isaksen, I., Iversen, I., Kloster, S., Koch, D., Kirkevåg, A., Kristjansson, J. E., Krol, M., Lauer, A., Lamarque, J. F., Liu, X., Montanaro, V., Myhre, G., Penner, J., Pitari, G., Reddy, S., Seland, Ø., Stier, P., Takemura, T., and Tie, X.: Analysis and quantification of the diversities of aerosol life cycles within AeroCom, Atmos. Chem. Phys., 6, 1777–1813, https://doi.org/10.5194/acp-6-1777-2006, 2006.
Thomas, H. E. and Watson, I. M.: Observations of volcanic emissions from space: current and future perspectives, Nat. Hazards, 54, 323–354, https://doi.org/10.1007/s11069-009-9471-3, 2010.
Tsigaridis, K., Koch, D., and Menon, S.: Uncertainties and importance of sea spray composition on aerosol direct and indirect effects, J. Geophys. Res.-Atmos., 118, 220–235, https://doi.org/10.1029/2012JD018165, 2013.
Ungermann, J., Ern, M., Kaufmann, M., Müller, R., Spang, R., Ploeger, F., Vogel, B., and Riese, M.: Observations of PAN and its confinement in the Asian summer monsoon anticyclone in high spatial resolution, Atmos. Chem. Phys., 16, 8389–8403, https://doi.org/10.5194/acp-16-8389-2016, 2016.
van der Werf, G. R., Randerson, J. T., Giglio, L., van Leeuwen, T. T., Chen, Y., Rogers, B. M., Mu, M., van Marle, M. J. E., Morton, D. C., Collatz, G. J., Yokelson, R. J., and Kasibhatla, P. S.: Global fire emissions estimates during 1997–2016, Earth Syst. Sci. Data, 9, 697–720, https://doi.org/10.5194/essd-9-697-2017, 2017.
van Marle, M. J. E., Kloster, S., Magi, B. I., Marlon, J. R., Daniau, A.-L., Field, R. D., Arneth, A., Forrest, M., Hantson, S., Kehrwald, N. M., Knorr, W., Lasslop, G., Li, F., Mangeon, S., Yue, C., Kaiser, J. W., and van der Werf, G. R.: Historic global biomass burning emissions for CMIP6 (BB4CMIP) based on merging satellite observations with proxies and fire models (1750–2015), Geosci. Model Dev., 10, 3329–3357, https://doi.org/10.5194/gmd-10-3329-2017, 2017.
Vernier, J.-P., Thomason, L. W., and Kar, J.: CALIPSO detection of an Asian tropopause aerosol layer, Geophys. Res. Lett., 38, L07804, https://doi.org/10.1029/2010GL046614, 2011.
Vernier, J.-P., Fairlie, T. D. Natarajan, M. Wienhold, F. G., Bian, J., Martinsson, B. G., Crumeyrolle, S., Thomason, L. W., and Bedka K. M.: Increase in upper tropospheric and lower stratospheric aerosol levels and its potential connection with Asian pollution, J. Geophys. Res.-Atmos., 120, 1608–1619, https://doi.org/10.1002/2014JD022372, 2015.
Vernier, J.-P., Fairlie, T. D., Deshler, T., Ratnam, M. V., Gadhavi, H., Kumar, B. S., Natarajan, M., Pandit, A. K., Raj, S. T. A., Kumar, H., Jayaraman, A., Singh, A. K., Rastogi, N., Sinha, R. P. R., Kumar, S., Tiwari, S., Wegner, T., Baker, N., Vignelles, D., Stenchikov, G., Shevchenko, I., Smith, J., Bedka, K., Kesarkar, A., Singh,V., Bhate, J., Ravikiran, V., Rao, M. D., Ravindrababu, S., Patel, A., Vernier, H., Wienhold, F. G., Liu, H., Knepp, T. N., Thomason, L., Crawford, J., Ziemba, L., Moore, J., Curmeyrolle, S., Williamson, M., Berthet, G., Jégou, F., and Renard, J.-B.: BATAL: The balloon measurement campaigns of the Asian tropopause aerosol layer, B. Am. Meteorol. Soc., 99, 955–973, https://doi.org/10.1175/bams-d-17-0014.1, 2018.
Vignati, E., Wilson, J., and Stier, P.: M7: An efficient size-resolved aerosol microphysics module for large-scale aerosol transport models, J. Geophys. Res.-Atmos., 109, D22202, https://doi.org/10.1029/2003JD004485, 2004.
Vogel, B., Günther, G., Müller, R., Grooß, J.-U., Hoor, P., Krämer, M., Müller, S., Zahn, A., and Riese, M.: Fast transport from Southeast Asia boundary layer sources to northern Europe: rapid uplift in typhoons and eastward eddy shedding of the Asian monsoon anticyclone, Atmos. Chem. Phys., 14, 12745–12762, https://doi.org/10.5194/acp-14-12745-2014, 2014.
Wang, X., Randel, W., Pan, L., Wu, Y., and Zhang, P.: Transient behavior of the Asian summer monsoon anticyclone associated with eastward eddy shedding, J. Geophys. Res.-Atmos., 127, e2021JD036090, https://doi.org/10.1029/2021JD036090, 2022.
World Meteorological Organization: Meteorology – A three-dimensional science: Second session of the Commission for Aerology, WMO Bulletin, vol. IV, 134–138, https://www.scribd.com/document/601621440/1957-WMO-bulletin-vi-4 (last access: 29 April 2026), 1957.
Wright, J. S., Zhang, S., Chen, J., Davis, S. M., Konopka, P., Lu, M., Yan, X., and Zhang, G. J.: Evaluating reanalysis representations of climatological trace gas distributions in the Asian monsoon tropopause layer, Atmos. Chem. Phys., 25, 9617–9643, https://doi.org/10.5194/acp-25-9617-2025, 2025.
Yan, X., Konopka, P., Ploeger, F., Podglajen, A., Wright, J. S., Müller, R., and Riese, M.: The efficiency of transport into the stratosphere via the Asian and North American summer monsoon circulations, Atmos. Chem. Phys., 19, 15629–15649, https://doi.org/10.5194/acp-19-15629-2019, 2019.
Yu, P., Rosenlof, K. H., Liu, S., Telg, H., Thornberry, T. D., Rollins, A. W., Portmann, R. W., Bai, Z., Ray, E. A., Duan, Y., Pan, L. L., Toon, O. B., Bian, J., and Gao, R.-S.: Efficient transport of tropospheric aerosol into the stratosphere via the Asian summer monsoon anticyclone, P. Natl. Acad. Sci. USA, 114, 6972–6977, https://doi.org/10.1073/pnas.1701170114, 2017.
Zhang, B., Liu, H., Crawford, J. H., Chen, G., Fairlie, T. D., Chambers, S., Kang, C.-H., Williams, A. G., Zhang, K., Considine, D. B., Sulprizio, M. P., and Yantosca, R. M.: Simulation of radon-222 with the GEOS-Chem global model: emissions, seasonality, and convective transport, Atmos. Chem. Phys., 21, 1861–1887, https://doi.org/10.5194/acp-21-1861-2021, 2021.
Zhang, K., Feichter, J., Kazil, J., Wan, H., Zhuo, W., Griffiths, A. D., Sartorius, H., Zahorowski, W., Ramonet, M., Schmidt, M., Yver, C., Neubert, R. E. M., and Brunke, E.-G.: Radon activity in the lower troposphere and its impact on ionization rate: a global estimate using different radon emissions, Atmos. Chem. Phys., 11, 7817–7838, https://doi.org/10.5194/acp-11-7817-2011, 2011.
Zhang, T., Hoell, A., Perlwitz, J., Eischeid, J., Murray, D., Hoerling, M., and Hamill, T.: Towards Probabilistic Multivariate ENSO Monitoring, Geophys. Res. Lett., 46, https://doi.org/10.1029/2019GL083946, 2019.
Zhao, M., Golaz, J.-C., Held, I. M., Guo, H., Balaji, V., Benson, R., Chen, J.-H., Chen, X., Donner, L. J., Dunne, J. P., Dunne, K., Durachta, J., Fan, S.-M., Freidenreich, S. M., Garner, S. T., Ginoux, P., Harris, L. M., Horowitz, L. W., Krasting, J. P., Langenhorst, A. R., Liang, Z., Lin, P., Lin, S.-J., Malyshev, S. L., Mason, E., Milly, P. C. D., Ming, Y., Naik, V., Paulot, F., Paynter, D., Phillipps, P., Radhakrishnan, A., Ramaswamy, V., Robinson, T., Schwarzkopf, D., Seman, C. J., Shevliakova, E., Shen, Z., Shin, H., Silvers, L. G., Wilson, J. R., Winton, M., Wittenberg, A. T., Wyman, B., and Xiang B.: The GFDL global atmosphere and land model AM4.0/LM4.0: 2. Model description, sensitivity studies, and tuning strategies, J. Adv. Model. Earth Sy., 10, 735–769, https://doi.org/10.1002/2017MS001209, 2018.