the Creative Commons Attribution 4.0 License.
the Creative Commons Attribution 4.0 License.
 | 28 Apr 2026
Long-term mercury isotope evidence for a shift toward background-dominated urban atmospheric mercury in North China under sustained emission controls
Chao Zhang
Xiaomiao Mu
Songjing Li
Zhao Wang
Xinguang Li
Muhammad Asif Sherliyat
Xiaojian Wang
Yi Liu
Wang Zheng
Jiubin Chen
Evaluating the effectiveness of the Minamata Convention requires a clear understanding of how emission controls reshape atmospheric mercury (Hg) budgets. Here, we present a multi-year investigation of gaseous elemental Hg (GEM) concentrations and isotope compositions in urban Tianjin, China, spanning three distinct periods: a pre-control phase (2018), the COVID-19 lockdown (2021–2022), and a post-pandemic phase under strengthened controls (2024–2025). By integrating long-term monitoring with isotope-based source apportionment, we capture changes in Hg sources and processes that are not evident from concentration data alone. Mean GEM concentrations declined sharply from pre-control levels (∼4.6 ng m−3) to regional background values (∼1.5 ng m−3) during the COVID-19 lockdown, with no rebound following the resumption of socioeconomic activities. This sustained decline was accompanied by a pronounced isotopic transition, from negative δ202Hg and near-zero Δ199Hg and Δ200Hg values characteristic of primary anthropogenic emissions to near-zero to positive δ202Hg and negative Δ199Hg and Δ200Hg values indicative of the regionally well-mixed background Hg pool. Comparisons with other cities in China and South Asia further demonstrate that effective emission controls drive convergence toward background-like GEM concentrations and isotopic signatures. Isotopic mixing models indicate that the collapse of primary anthropogenic emissions accounted for nearly all of the observed concentration decline since the 2020s. Together, our results reveal a fundamental regime shift in urban atmospheric Hg cycling from local primary emission-dominated to background-dominated conditions modulated by secondary surface processes.
- Article
(3891 KB) - Full-text XML
-
Supplement
(896 KB) - BibTeX
- EndNote


Mercury (Hg) is a globally distributed toxic pollutant that poses long-lasting risks to both ecosystems and human health (AMAP/UNEP, 2019). Once released into the environment, Hg can persist for decades, travel long distances through the atmosphere, and accumulate in food webs (Blanchfield et al., 2022; Driscoll et al., 2013). Because of these properties, atmospheric Hg plays a central role in connecting local emissions to regional and even global impacts. Among the different forms of atmospheric Hg, gaseous elemental Hg (GEM) dominates, accounting for >90 % of total atmospheric Hg. GEM has an atmospheric lifetime of several months, allowing it to circulate across continents and hemispheres before being removed by deposition (Gustin et al., 2015). In the atmosphere, GEM is removed either directly through dry deposition or indirectly after oxidation to divalent Hg(II) species, which are deposited as gaseous oxidized Hg (GOM) and particulate-bound Hg (PBM) via wet and dry processes (Horowitz et al., 2017). Upon deposition, Hg can be converted into methylmercury (MeHg) or recycled back into the atmosphere as GEM, thereby sustaining long-term ecological risks. These characteristics make GEM a sensitive indicator of both emission changes and environmental processing. Recognizing the global threat posed by Hg, the Minamata Convention on Mercury entered into force in 2017, marking the first legally binding international agreement to reduce anthropogenic Hg emissions. A key requirement of the Convention is the establishment of long-term atmospheric Hg monitoring to evaluate the effectiveness of emission control policies (AMAP/UNEP, 2019). However, linking policy-driven emission reductions to changes in atmospheric Hg remains challenging, particularly in urban environments where multiple sources and processes interact.
Human activities associated with urbanization and industrialization have profoundly reshaped the global Hg cycle. Since the mid-15th century, anthropogenic emissions, including coal combustion, non-ferrous metal production, and artisanal small-scale gold mining, have progressively surpassed natural emissions as the dominant contributor to environmental Hg loading (Lamborg et al., 2014; Outridge et al., 2018; Streets et al., 2019; Geyman et al., 2025). China, as one of the world's largest emitters of atmospheric Hg, has contributed approximately one-quarter to one-third of global anthropogenic Hg emissions in recent decades, exerting a strong influence on the global Hg budget (AMAP/UNEP, 2019). From the early 2010s, however, China has implemented some of the world's most aggressive air pollution control policies, including large-scale transitions from coal to cleaner energy and widespread upgrades to industrial emission control technologies. These measures have led to substantial reductions in conventional air pollutants such as particulate matter, SOx, and NOx (Zheng et al., 2018; Zhang et al., 2021; Wen et al., 2024). Bottom-up inventories suggest that anthropogenic Hg emissions in China have stabilized and begun to decline since then after decades of growth (Wu et al., 2016; Liu et al., 2019; Zhang et al., 2023; Cui et al., 2025). In parallel, observational studies report pronounced decreases in atmospheric Hg concentrations at background, rural, and urban sites across China (Tang et al., 2018, 2024; Qin et al., 2020; Wu et al., 2020, 2023; Feng et al., 2024). Despite these encouraging trends, a critical inconsistency remains. The rapid decline in observed atmospheric Hg concentrations appears larger than what would be expected based on the more modest emission reductions estimated by inventories (Feng et al., 2024; Feinberg et al., 2024; Sun et al., 2025). This discrepancy raises fundamental questions: do declining atmospheric Hg concentrations closely reflect structural changes in emission sources, or are other processes, such as changes in atmospheric chemistry, transport, or surface–atmosphere exchange, playing an increasingly important role? Addressing these questions requires tools that go beyond concentration measurements alone.
Stable Hg isotopes provide a powerful tool for disentangling Hg sources and processes. Different physical and chemical processes impart distinct isotopic signatures on Hg, allowing its sources and atmospheric history to be traced (Blum et al., 2014). Most Hg-related processes cause mass-dependent fractionation (MDF, denoted as δ202Hg) (Blum et al., 2014). In contrast, photochemical reactions such as photoreduction of Hg(II) and photodegradation of MeHg can generate mass-independent fractionation (MIF) of odd-numbered isotopes (Δ199Hg or Δ201Hg) through magnetic isotope effect (Blum and Bergquist, 2007; Rose et al., 2015; Zheng and Hintelmann, 2009). Additionally, the nuclear volume effect causes small yet significant odd-MIF during non-photochemical processes such as the volatilization of liquid Hg(0) and the oxidation of gaseous Hg(0) (Bergquist and Blum, 2009; Estrade et al., 2009; Sun et al., 2022; Wiederhold et al., 2010; Zheng and Hintelmann, 2010). Significant even-numbered isotope MIF (Δ200Hg or Δ204Hg), commonly observed in atmospheric samples, is thought to originate from photochemical redox reactions in the upper atmosphere (Cai and Chen, 2016; Chen et al., 2012; Fu et al., 2021b; Sun et al., 2022). By combining these isotopic signals, recent studies have demonstrated that GEM isotopes can effectively distinguish between primary anthropogenic emissions, regionally well-mixed background air, and secondary re-emissions from environmental surfaces (Fu et al., 2021a; Tate et al., 2023; Gačnik et al., 2025). Therefore, the long-term and cross-region records of GEM concentrations and isotope compositions are expected to yield key insights into the spatiotemporal changes of atmospheric Hg sources, thereby providing information on the impact of anthropogenic activities and other factors on regional Hg budgets.
Cities are both major emission sources and long-term reservoirs of Hg, where legacy Hg accumulated in soils and built surfaces can be re-emitted back to the atmosphere, especially under sunlight (Zhu et al., 2022). As primary emissions decline, these secondary sources may become increasingly important, yet their role has not yet been quantified. Tianjin, a megacity in the Beijing–Tianjin–Hebei (BTH) economic zone, provides an ideal setting to examine how emission controls reshape urban Hg cycling. Historically, Tianjin was characterized by intensive industrial activity, heavy coal use, and elevated Hg emissions (Zhang et al., 2022, 2023). Over the past decade, however, the city has undergone rapid energy restructuring, including large-scale coal-to-gas conversion and the implementation of ultra-low-emission technologies in industry (Li et al., 2019). These transformations make Tianjin a compelling case for evaluating whether and how urban Hg budgets respond to sustained emission controls.
In this study, we present a long-term investigation of GEM concentrations and isotope compositions in urban Tianjin spanning three contrasting periods: (1) a pre-control phase before major emission reductions (2018), (2) a period of sharply reduced human activity during the COVID-19 lockdown (2021–2022), and (3) a post-pandemic phase characterized by resumed socioeconomic activity under strengthened emission controls (2024–2025). To better understand these changes and place them in a broader regional context, we additionally measured GEM concentrations and isotope compositions at a suburban site in Tianjin and other urban sites in China and South Asia, which differ markedly in industrial structures, energy use, and environmental conditions. Our specific objectives are to: (1) quantify the long-term evolution of GEM sources in urban Tianjin using combined concentrations and isotopic evidence; (2) assess how changes in emission structures and regional background conditions influence atmospheric GEM by comparing Tianjin with other cities; and (3) identify the emerging role of secondary, legacy Hg re-emissions in a low-emission urban environment. By integrating long-term monitoring with Hg isotope analysis, this work provides new insights into how emission control policies reshape urban Hg budgets. More broadly, it demonstrates the value of isotopic approaches for evaluating the effectiveness of the Minamata Convention and highlights legacy Hg reservoirs as an emerging constraint on future progress in Hg pollution control.
2.1 Study area
The long-term GEM samples were collected in an urban area of Tianjin (TJ-Nankai, Fig. 1), the second-largest city in northern China, during three distinct periods representing contrasting emission and activity regimes: (1) Phase I (2018), before large-scale implementation of the “coal-to-gas” transition and before the COVID-19 pandemic; (2) Phase II (2021–2022), during the COVID-19 lockdown, when industrial activity and traffic were substantially reduced; and (3) Phase III (2024–2025), the post-pandemic period, characterized by resumed socioeconomic activity under strengthened emission controls. The sampling site was located on the rooftop of Building No. 19 at Tianjin University (39.11° N, 117.16° E), ∼21 m a.g.l. (above ground level). This site is representative of typical urban conditions and has served as a long-term urban observation platform for multiple studies, including measurements of urban PM2.5 and airborne microbial communities (Zhang et al., 2022; Dong et al., 2024; Jin et al., 2025). To examine intra-city variability, a suburban site in the Binhai district of Tianjin (TJ-Binhai; 38.91° N, 117.69° E) was additionally sampled during Phase III. To place the Tianjin observations within a broader spatial and emission-context framework, short-term GEM sampling during Phase III was also conducted at urban sites in Tangshan (39.42° N, 118.89° E, a major steel-production center), Chengde (41.94° N, 117.77° E, a mountainous city with relatively low industrial intensity), and Jingzhou (29.82° N, 113.45° E, a city situated within a subtropical wetland and agricultural basin) of China, as well as in Karachi, Pakistan (24.92° N, 67.13° E), a densely populated South Asian megacity with limited emission controls. All these sampling sites were situated on building rooftops at heights exceeding 10 m above ground level to minimize direct surface interference.
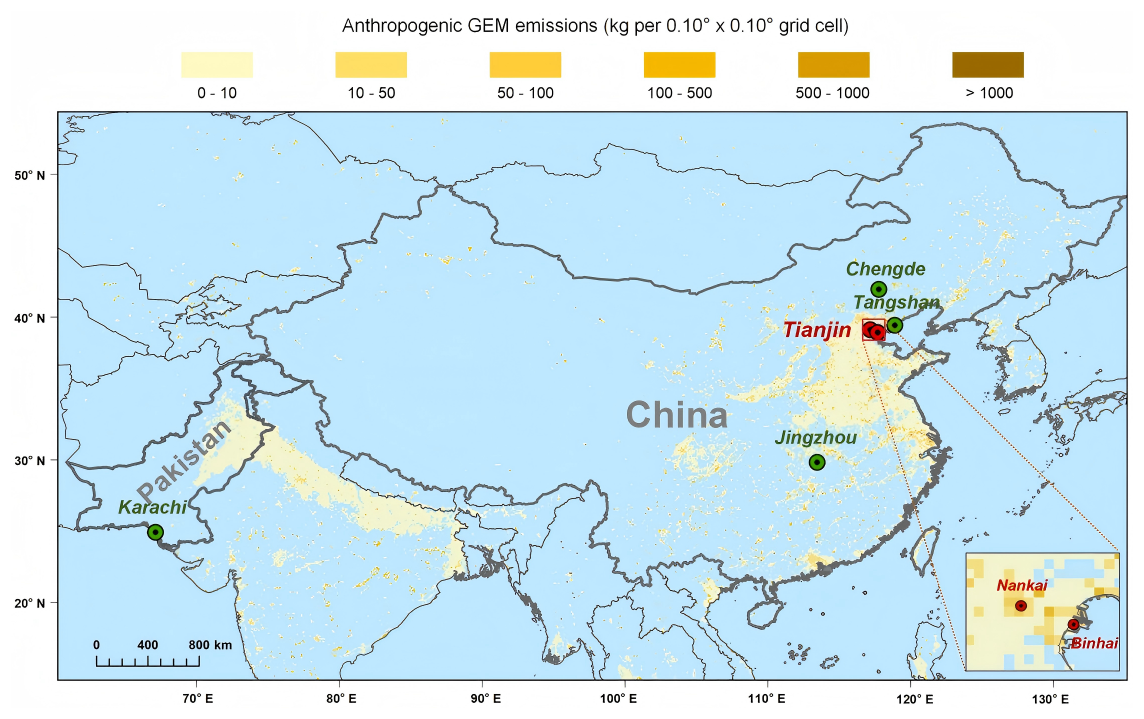
Figure 1Locations of GEM sampling sites. Continuous sampling was conducted in an urban area (Nankai) of Tianjin, complemented by short-term sampling in a suburban area (Binhai) of Tianjin and in urban areas of other Chinese cities (Tangshan, Chengde, and Jingzhou) and Karachi, Pakistan. Also shown are gridded anthropogenic GEM emissions in 2021 (Muntean et al., 2024).
2.2 Sampling methods and periods
Atmospheric gaseous Hg was collected using two complementary approaches: active pump-trap sampling and passive air sampling, enabling both high temporal resolution and long-term spatial coverage. The active sampling was performed using an established pump–trap system equipped with chlorine-impregnated activated carbon (CLC) traps (Fu et al., 2014; Sun et al., 2023, 2025). Air was drawn through the traps at ambient flow rates of 4.0–5.5 L min−1, with particulate matter removed upstream using a 47 mm quartz fiber filter housed in a Teflon filter pack. Breakthrough tests confirmed that Hg loss during sampling was negligible (<2 % of collected Hg; n=12). Because PBM was removed and GOM typically accounted for <5 % of atmospheric gaseous Hg (Fu et al., 2015), the collected gaseous Hg is hereafter referred to as GEM (Zhang and Sun, 2026). The passive sampling was performed using the MerPAS (Tekran) sampler, which collects GEM by molecular diffusion onto a carbon sorbent (HGR-AC, Calgon Carbon Corporation), while excluding other Hg species using diffusion barrier filters (McLagan et al., 2016). These samplers collect atmospheric gaseous Hg without the need for electricity, making them particularly suitable for extended deployments. At Tianjin (TJ-Nankai and TJ-Binhai), active sampling campaigns were conducted in November 2018 (Phase I, ∼1 d duration per sample), from October 2021 to September 2022 (Phase II, 1–3 d duration per sample), and from December 2024 to January 2025 (Phase III, with separate day (07:00–18:00 LT)-night (18:00–07:00 LT) samples) at TJ-Nankai, but only from December 2024 to January 2025 (Phase III, ∼1 d duration per sample) at TJ-Binhai (Tables S5–S7). To facilitate long-term monitoring and inter-city comparisons, paired MerPAS samplers were deployed at all study sites. For the long-term monitoring at TJ-Nankai, individual passive samples were deployed for 40–53 d in Phase II and 29–56 d in Phase III, yielding total monitoring periods of 192 and 343 d, respectively (Tables S2 and S3). The sampling durations ranged from 31 to 53 d for short-term inter-city surveys during January 2025 to March 2025. It should be noted that Phase II does not fully cover the winter heating season due to sampling constraints during the COVID-19 lockdown. Therefore, the phase-based analysis should be interpreted as a comparison of emission regimes rather than a seasonally balanced assessment. The activated carbon adsorbent blanks and blanks during storage, transport, and processing were evaluated, which accounted for <4 % of the total Hg mass in collected samples (see details in Sect. S1 in the Supplement).
2.3 Mercury concentrations measurement and preconcentration
Total Hg concentrations in CLC traps and MerPAS sorbents were determined using a DMA-80 evo atomic absorption spectrometer. Before Hg isotope analysis, samples were processed using a modified combustion-trapping method based on DMA, with Hg preconcentrated in a trapping solution containing 40 % HNO3:HCl (2:1, ) and 1 % () BrCl (Sun et al., 2025). Hg concentrations in trapping solutions were quantified using a Tekran 2600 cold vapor atomic fluorescence spectrometer (CV-AFS). Analytical uncertainty was assessed using certified reference materials (CRMs), with measured concentrations within ±8 % of certified values. Replicate analyses (n≥2) showed relative standard deviations < 5 %, and procedural blanks accounted for <3 % of sample Hg. Mean recovery rates were 95 %–99 % for procedural CRMs (Table S1 in the Supplement) and 96±4 % (mean ± 1 SD) for samples (Tables S4–S7). Additional methodological details are provided in Sects. S2 and S3.
2.4 Mercury isotope analysis
Prior to isotope analysis, trapping solutions were treated with hydroxylamine hydrochloride (NH2OH•HCl) to eliminate residual BrCl, diluted with ultrapure water to reduce the acidity to <10 %, and adjusted to Hg concentrations of 0.3–1 ng mL−1. Hg isotope measurements were conducted using a Nu Plasma 3D multi-collector inductively coupled plasma mass spectrometer (MC-ICP-MS) at Tianjin University, following established protocols (Sun et al., 2023, 2025). Briefly, Hg(0) vapor was generated by reduction of trapping solutions with SnCl2 in a custom gas–liquid separator and introduced into the plasma together with aerosolized NIST SRM 997 Tl as an internal standard. Instrumental mass bias was corrected using Tl isotope normalization combined with sample–standard bracketing against NIST SRM 3133. All Hg standards were matrix- and concentration-matched to samples within ±10 %. Data were acquired over ∼10 min (3 blocks of 99 cycles, 6 s per cycle). Hg isotope ratios are reported in delta notations relative to NIST SRM 3133 (δxxxHg, ‰; xxx=199, 200, 201, 202, 204) (Blum and Bergquist, 2007):
where (xxxHg 198Hg)sample represents the measured isotope ratio of the sample, (xxxHg 198Hg)NIST SRM 3133 corresponds to the average isotope ratio of the bracketing Hg standard. MDF is expressed as δ202Hg. The MIF (ΔxxxHg, ‰; xxx=199, 200, 201, 204) is calculated as the difference between the measured δxxxHg value and the predicted δxxxHg value based on kinetic MDF laws.
The mass-dependent scaling factor xxxβ is 0.2520 for 199Hg, 0.5024 for 200Hg, 0.7520 for 201Hg, and 1.4930 for 204Hg. Internal analytical precision was typically ≤0.04 ‰ (1 SE) for the isotope ratio of Hg per measurement. Long-term instrumental stability was tracked with the secondary standard NIST SRM 8610 (UM-Almaden), which was analyzed every five samples and yielded Hg isotope values in agreement with previously reported values (Blum and Bergquist, 2007) (Table S1). Hg isotope values of procedural CRMs (GBW07310, GBW07405; Table S1) measured across analytical sessions also agreed with published values (Sun et al., 2023, 2025). The typical 2σ analytic uncertainties of samples are reported as the larger 2 SD values between NIST SRM 8610 and procedural CRMs, which are 0.08 ‰ for δ202Hg, 0.06 ‰ for Δ199Hg, 0.05 ‰ for Δ200Hg, and 0.05 ‰ for Δ201Hg.
2.5 GEM concentration calculation and MDF correction for passive sampling
For active pump-trap sampling, GEM concentration was calculated as the blank-corrected Hg mass collected on each CLC trap divided by the cumulative sampled air volume normalized to standard temperature and pressure (273.15 K and 101.325 kPa). For passive sampling, GEM concentration from each MerPAS sampler was calculated by dividing blank-corrected Hg mass (ng) by deployment duration (days) and sampling rate (SR, m3 d−1) (McLagan et al., 2016). Sampling rates were calculated using meteorological data, including temperature, wind speed, and atmospheric pressure from the Dark Sky database (https://darksky.net/forecast/39.1236,117.1981/si12/en, last access: 20 December 2025), accounting for diffusion-controlled sampling variability. The passive air sampler MerPAS is known to introduce systematic MDF influenced mainly by meteorological conditions (Szponar et al., 2020). To correct for this effect, calibration experiments were conducted across four periods during 2021–2022 with varying temperatures and wind speeds. These yielded a mean MDF correction factor of 1.42 ‰ ± 0.33 ‰ (mean ± 1 SD, n=8) (Fig. S2), which was comparable to that determined by Szponar et al. (2020) and was applied to all MerPAS-derived δ202Hg values.
2.6 Source apportionment and air-mass origin analysis
To quantify the relative contributions of different GEM sources, a ternary isotope mixing model was employed:
This approach leverages the complementary diagnostic power of odd-MIF (Δ199Hg) and even-MIF (Δ200Hg) to resolve the relative contributions of three dominant GEM sources: primary anthropogenic emissions (ant), tropospheric background air (bg), and secondary urban surface (legacy) re-emissions (sur). Primary anthropogenic emissions are characterized by negative δ202Hg ( ‰, mean ± 1 SD) and near-zero Δ199Hg (0.02±0.08 ‰, mean ± 1 SD) and Δ200Hg (0.02±0.02 ‰, mean ± 1 SD) (Wu et al., 2023), representing the combined isotopic signatures of anthropogenic emissions in China. In contrast, tropospheric background GEM exhibits relatively positive δ202Hg (0.50±0.16 ‰, mean ±1 SD) and negative Δ199Hg ( ‰, mean ± 1 SD) and Δ200Hg ( ‰, mean ± 1 SD) (Tang et al., 2024), indicative of Hg residing in the free troposphere that has undergone extensive mixing of different sources and multiple redox cycles. The urban surface re-emissions represent GEM released through the reduction of previously deposited Hg(II) on urban surfaces, which is characterized by distinctly low δ202Hg ( ‰, mean ± 1 SD), intermediate negative Δ199Hg values ( ‰, mean ± 1 SD) and near-zero Δ200Hg (0.02±0.01 ‰, mean ± 1 SD), according to observations on urban soil re-emissions (Zhu et al., 2022). Given Tianjin's proximity to the Bohai Sea, seawater re-emissions are also expected to contribute to surface Hg fluxes. Recent field measurements report δ202Hg, Δ199Hg, and Δ200Hg values (mean ± 1 SD) of ‰, ‰ and 0.02±0.02 ‰, respectively, for marine re-emissions (Fu et al., 2026). These values closely overlap with those reported for urban soil re-emissions (Zhu et al., 2022). As a result, marine and urban soil surface re-emissions are combined into a single surface re-emission endmember, with its Hg isotope values represented by those of urban soil re-emissions (Zhu et al., 2022). Uncertainties in source contributions were evaluated using a Monte Carlo simulation approach (n=50 000), in which uncertainties associated with Δ199Hg and Δ200Hg values for both samples and endmembers were propagated.
Air-mass origins and transport pathways were assessed using 120 h backward trajectories calculated at 500 m a.gl. using the TrajStat model, driven by GDAS meteorological data (Wang et al., 2009). Trajectories were generated at 6 h intervals, allowing assessment of temporal variability in GEM source regions (Fig. S3).
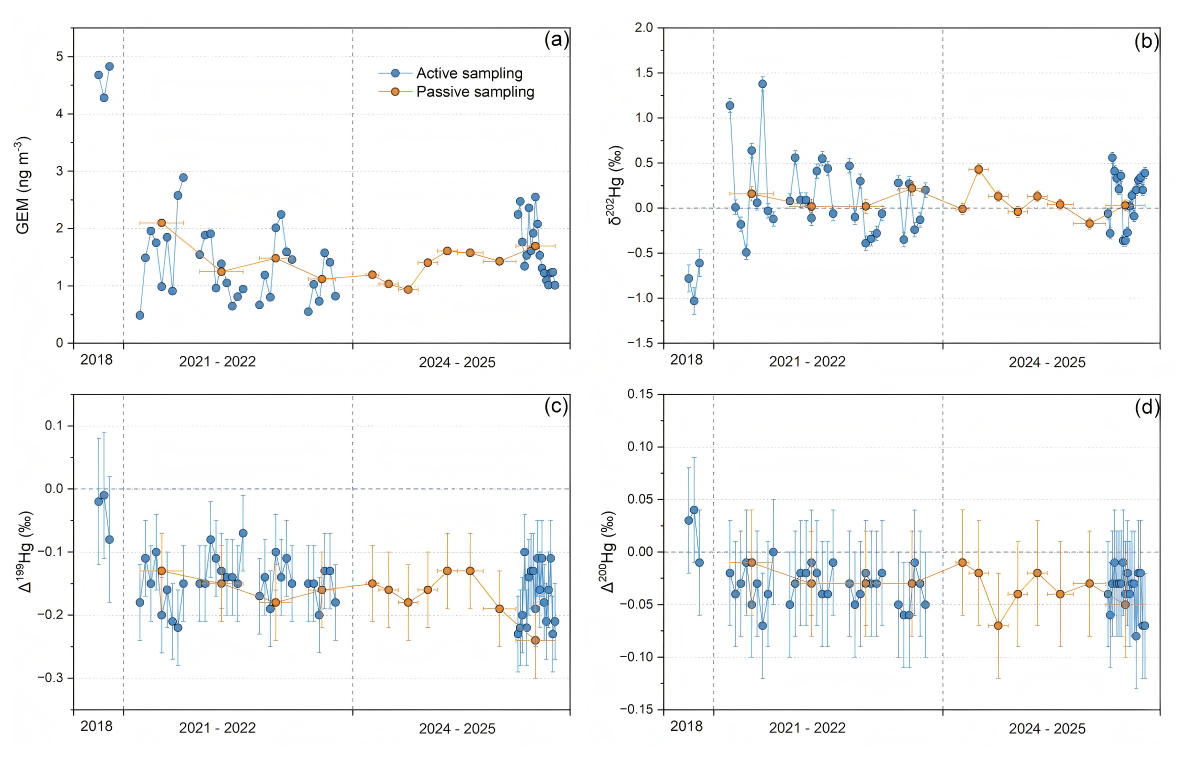
Figure 2Temporal variability in GEM concentration and isotopic composition at the urban Tianjin site (TJ-Nankai). (a–d) Time series of GEM concentration, δ202Hg, Δ199Hg, and Δ200Hg, respectively, across three sampling periods (2018, 2021–2022, and 2024–2025). The error bars on the x axis for passive sampling represent the sampling durations, while the error bars on the y axis represent the 2σ analytical uncertainties. GEM concentrations and isotope values between active and passive sampling show no statistically significant differences during their overlapping periods (independent-samples t test: GEM concentration, p=0.98; δ202Hg, p=0.61; Δ199Hg, p=0.20; Δ200Hg, p=0.95). No significant monotonic trends were detected for GEM concentration (p=0.80), δ202Hg (p=0.90), Δ199Hg (p=0.20) and Δ200Hg (p=0.37) within the combined Phase II–III time series, according to the Mann–Kendall trend analysis.
3.1 Long-term phase trends of GEM concentrations and isotopic compositions in urban Tianjin
Long-term observations at the urban Tianjin site (TJ-Nankai), spanning three sampling periods (Phase I: November 2018, Phase II: October 2021 to September 2022, and Phase III: February 2024 to January 2025), reveal a pronounced shift in dominant atmospheric Hg sources and controls, marked by coherent and systematic changes in both GEM concentrations and isotopic compositions. Given the temporally uneven sampling and the inclusion of both active and multi-week integrated passive observations, this study mainly focused on between-phase differences in GEM concentrations and isotope compositions. In the following, data is reported as mean ± 1 SD uncertainty for each category of samples, unless otherwise indicated.
GEM concentrations declined sharply from Phase I to Phase II and remained low thereafter (Fig. 2a). During Phase I, prior to the implementation of stringent emission controls, mean GEM concentrations reached 4.59±0.29 ng m−3 (n=3), substantially exceeding the Northern Hemisphere background (∼1.5 ng m−3) (Sprovieri et al., 2016) and values reported for China remote cities such as Nyingchi on the Tibetan Plateau (1.08±0.58 ng m−3) in the same year (Yu et al., 2022) (Fig. S1 in the Supplement). Concentrations in Tianjin were also notably higher than those measured contemporaneously in other major cities of the Beijing–Tianjin–Hebei (BTH) region, including Beijing (2.37±0.68 ng m−3) and Shijiazhuang (2.64±1.04 ng m−3) (Fu et al., 2021a) (Fig. S1). These elevated atmospheric Hg concentrations are consistent with strong local and regional emissions driven by coal combustion and intensive industrial activity in northern China prior to large-scale emission reductions (Cui et al., 2025).
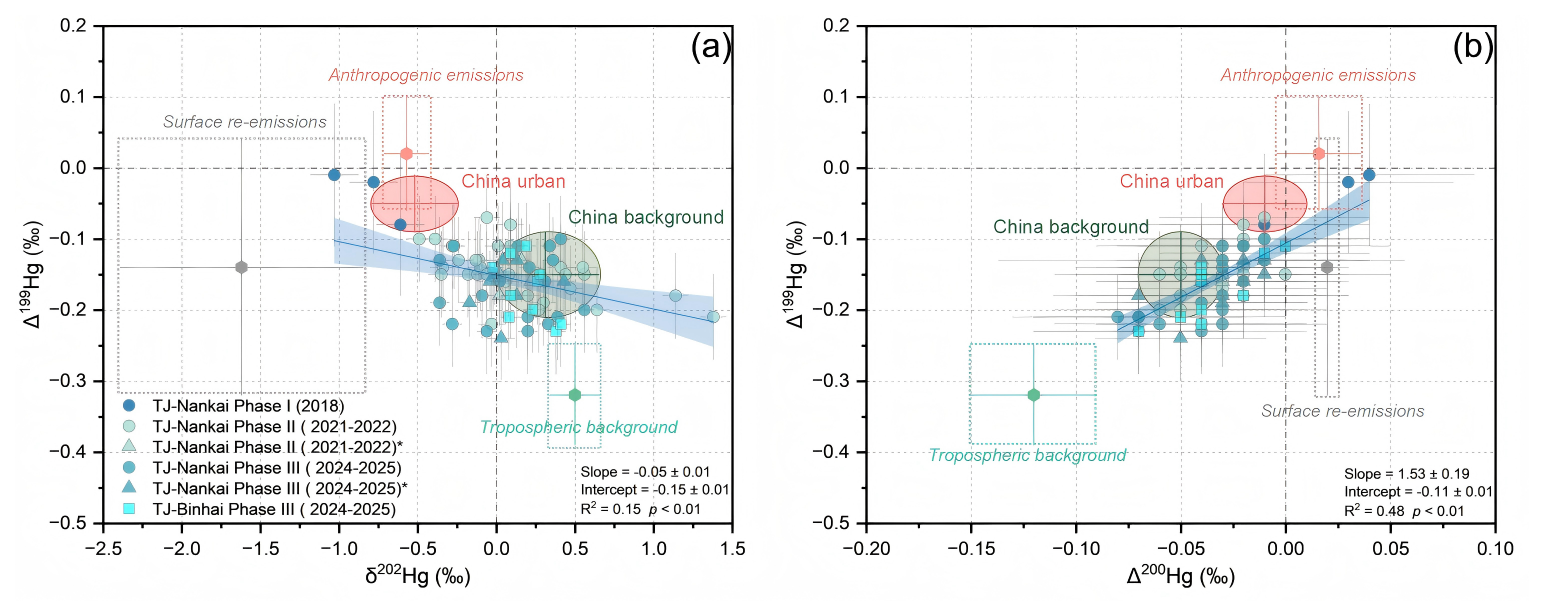
Figure 3Phase variations of Hg isotopic compositions in Tianjin. (a) δ202Hg versus Δ199Hg, (b) Δ200Hg versus Δ199Hg of GEM in the TJ-Nankai (urban) and TJ-Binhai (suburban) sites. The corrected δ202Hg values for passive MerPAS samples are marked with an asterisk (δ202Hg*). Error bars of individual GEM samples indicate the 2σ analytical uncertainty. Light red, grey, and green rectangles represent the mean ± 1 SD ranges of the estimated end-member isotopic compositions: anthropogenic GEM emissions (Wu et al., 2023), surface GEM re-emissions (Zhu et al., 2022; Fu et al., 2026), and tropospheric background GEM (Tang et al., 2024). Deep red and green ellipses represent the mean ± 1 SD ranges of the compiled China urban and regional background GEM isotopic compositions (Zhang and Sun, 2026).
In contrast, Phase II, corresponding to the COVID-19 lockdown period, was characterized by a dramatic reduction in GEM concentrations to 1.46±0.82 ng m−3 (n=35), comparable to values reported at regional background sites in China, such as the Mt. Waliguan monitoring station (1.59±0.45 ng m−3) during 2020–2021 (Fig. S1) (Tang et al., 2024), reflecting suppressed anthropogenic activity. By Phase III, following the resumption of economic activity but under strengthened emission controls, GEM concentrations showed only a slight increase to 1.56±0.47 ng m−3 (n=26). Relative to Phase I, GEM concentrations declined by ∼68 % in Phase II and ∼66 % in Phase III, with no statistically significant difference between Phases II and III (independent-samples t test, p=0.59). The absence of a post-pandemic rebound indicates that the decline in urban GEM is not a transient effect of reduced activity, but rather reflects a sustained weakening of anthropogenic Hg emissions, aligning with broader regional trends observed elsewhere in China (Cui et al., 2025; Feng et al., 2024; Sun et al., 2025). This interpretation is further supported by the corresponding-period decreases in conventional combustion-related air pollutants (e.g., PM2.5 and SO2) provided in Table S9.
Mercury isotopic compositions provide independent and process-level evidence for this transition. During Phase I, GEM exhibited distinctly negative δ202Hg values ( ‰) and near-zero MIF values ( ‰; ‰) (Fig. 2b–d). Such values largely overlap the range commonly observed in China urban GEM that is mainly influenced by primary anthropogenic sources such as coal combustion and metal smelting ( ‰; ‰; ‰, n=16 sites) (Zhang and Sun, 2026) (Fig. 3). This consistency suggests that, despite the limited sample size, Phase I captured a representative anthropogenic urban GEM signature rather than an isolated anomaly. In Phase II, δ202Hg shifted abruptly toward positive values (0.13±0.40 ‰), while MIF values ( ‰, ‰) became systematically more negative (Fig. 3). These isotopic characteristics closely resemble those of the regional background GEM in China ( ‰; ‰; ‰, n=15 sites), which reflects extensive atmospheric mixing and repeated redox cycling (Zhang and Sun, 2026). The background-like isotopic signature persisted into Phase III, with mean δ202Hg, Δ199Hg, and Δ200Hg of 0.10±0.26 ‰, ‰, and ‰, respectively (Fig. 3). During 2016 to 2018, comparable isotopic compositions have been observed at urban sites in North America ( ‰, ‰, ‰; n=9 sites) (Tate et al., 2023), where declining Hg concentrations (1.37±0.17 ng m−3) and a convergence toward background-like isotopic signatures have been linked to strengthened emission controls. Hg isotopic compositions were broadly similar between Phases II and III, with no significant differences in δ202Hg (independent-samples t test, p=0.75) or Δ200Hg (independent-samples t test, p=0.35), although Δ199Hg differed significantly (independent-samples t test, p=0.04). Nevertheless, both Phase II and Phase III differed significantly (independent-samples t test, all p<0.01) from Phase I in δ202Hg, Δ199Hg, and Δ200Hg. Phase II did not include most of the winter heating season. Therefore, the phase-based interpretation should be viewed as a comparison among emission regimes rather than a fully balanced seasonal comparison.
3.2 Intra-city gradients and the emergence of background-dominated conditions
To further disentangle local and regional controls on GEM concentrations and isotope compositions, simultaneous measurements were conducted at the urban TJ-Nankai site and the suburban TJ-Binhai site during Phase III (December 2024 to January 2025). These paired observations reveal subtle but informative intra-city spatial gradients. GEM concentrations were slightly higher at the TJ-Nankai site (1.59±0.45 ng m−3, n=18) than at the TJ-Binhai (1.37±0.19 ng m−3, n=10), accompanied by ∼0.3 ‰ more negative δ202Hg at the urban site ( ‰ versus 0.20±0.14 ‰) (Fig. 3). These differences indicate the superposition of weak local urban primary emissions of lower δ202Hg values onto a regionally background air mass (Zhang and Sun, 2026). The limited contribution of local urban primary Hg emissions is also corroborated by the nearly identical MIF values between the two sites (Δ199Hg: TJ-Nankai: ‰, TJ-Binhai: ‰; Δ200Hg: TJ-Nankai: ‰, TJ-Binhai: ‰). Backward-trajectory analysis shows comparable air-mass origins for both sites (Fig. S3), supporting the interpretation that the observed intra-city spatial GEM gradient arises from local mixing rather than differences in regional transport. Together, the concentration and isotope data demonstrate that Tianjin has transitioned from a primary emission-dominated urban environment to one increasingly governed by regionally well-mixed background GEM.
3.3 Diurnal variability and the role of urban legacy Hg re-emissions
In addition to the source control, environmental factors may exert a strong influence on near-surface GEM through surface–atmosphere exchange and atmospheric redox reactions. To assess these effects, we examined diurnal variations in GEM concentrations and isotopic compositions at TJ-Nankai during Phase III under background-dominated conditions. GEM concentrations showed little diurnal contrast, with nearly identical values during daytime (1.65±0.53 ng m−3, n=9; 07:00–18:00 LT) and nighttime (1.64±0.47 ng m−3, n=9; 18:00–07:00 LT). This contrasts with the typical urban near-surface GEM pattern, in which nighttime accumulation occurs under a shallow boundary layer and daytime dilution occurs as the boundary layer deepens (Koenig et al., 2023; Belelie et al., 2025). The muted diurnal signal suggests the presence of compensating daytime sources.
Isotopic data provide key insight into these compensating processes. Daytime GEM exhibited lower δ202Hg values (0.09±0.31 ‰) and higher Δ199Hg ( ‰) than nighttime GEM ( ‰; ‰). Although the differences are not statistically significant, their paired direction is consistent with the addition of Hg with lower δ202Hg and higher Δ199Hg during daytime, pointing to enhanced GEM re-emissions of previously deposited Hg(II) on urban surfaces and/or increased local primary emissions (Tang et al., 2024; Wu et al., 2023; Zhu et al., 2022) (Fig. 4).
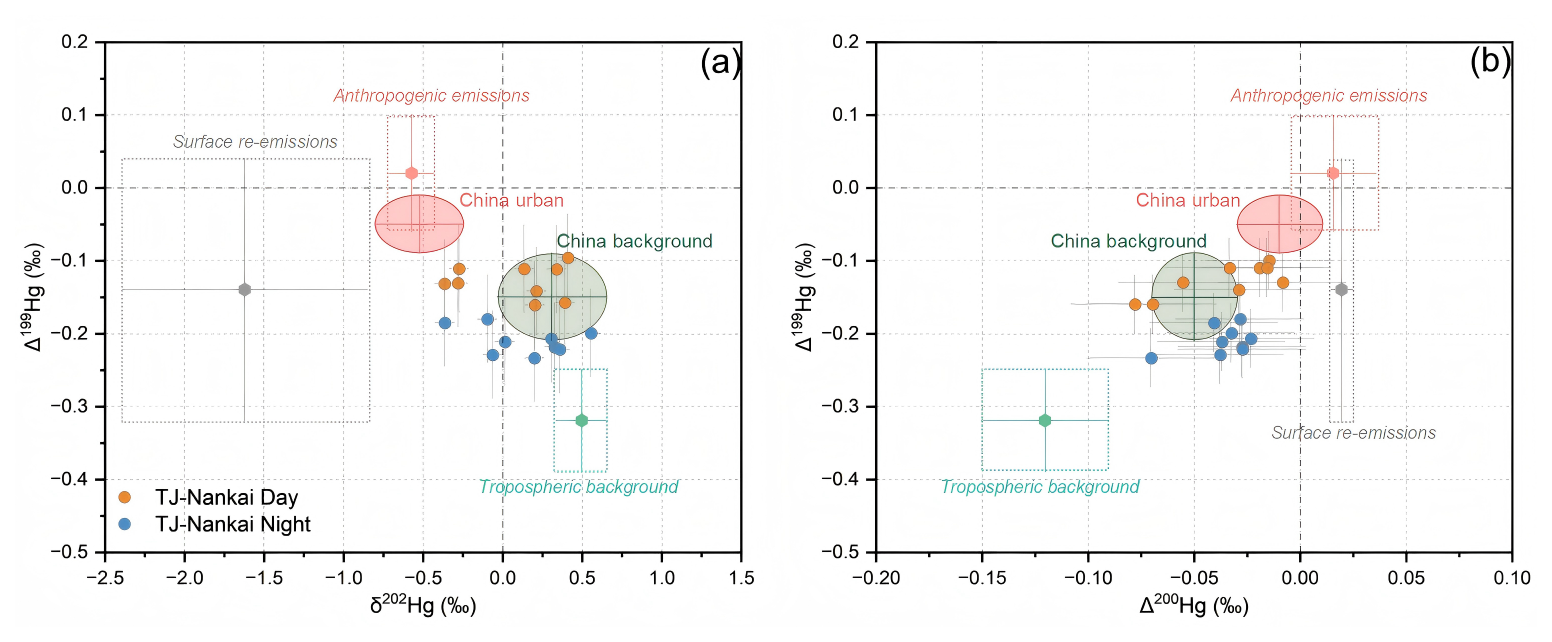
Figure 4Diurnal variations in GEM isotopic compositions. (a) δ202Hg versus Δ199Hg, (b) Δ200Hg versus Δ199Hg) of GEM in the TJ-Nankai (urban) site. Error bars of individual GEM samples indicate the 2σ analytical uncertainty. Light red, grey, and green rectangles represent the mean ± 1 SD ranges of the estimated end-member isotopic compositions: anthropogenic GEM emissions (Wu et al., 2023), surface GEM re-emissions (urban soil and marine re-emissions) (Zhu et al., 2022; Fu et al., 2026), and tropospheric background GEM (Tang et al., 2024). Deep red and green ellipses represent the mean ± 1 SD ranges of the compiled China urban and regional background GEM isotopic compositions (Zhang and Sun, 2026).
Urban soils and built surfaces store large amounts of legacy Hg accumulated during decades of higher primary emissions. Under solar radiation during daytime, this Hg can be photochemically reduced and re-emitted as GEM (Zhu et al., 2022, 2024; Sommar et al., 2025). Such surface re-emitted GEM is characterized by low δ202Hg and high Δ199Hg, aligning the slight isotopic shifts observed during the daytime. The observed isotopic shifts are also consistent with increased local primary emissions, which are also characterized by low δ202Hg and high Δ199Hg (Wu et al., 2023) (Fig. 4). In addition, atmospheric oxidation of GEM may induce similar isotope fractionation (Sun et al., 2016a) and therefore cannot be fully excluded as a contributing process. As the boundary layer expands during the day, photochemical re-emission of legacy Hg and enhanced local primary emissions may provide compensatory sources that replenish near-surface GEM. Therefore, in the low-emission era, diurnal GEM concentrations may underestimate the role of surface–atmosphere exchange, whereas isotopes remain sensitive to these secondary processes. Direct measurements of surface–atmosphere Hg exchange fluxes are needed to further evaluate this interpretation. Nevertheless, the nearly constant diurnal GEM concentrations and Δ200Hg values suggest that the net contributions from legacy Hg re-emission, local primary emissions, and oxidation-driven losses are relatively small. We thus conclude that variations in GEM concentrations and isotope compositions across different phases of urban Tianjin were mostly controlled by differences in source contributions rather than environmental factors.
3.4 Regional comparison: contrasting emission regimes across cities
Measurements conducted across multiple Chinese cities and in Karachi, Pakistan, during January to March 2025 reveal strong spatial contrasts in GEM concentrations and isotopic compositions (Fig. 5, Table S8). Among all sites, Karachi exhibited the highest GEM concentration of 5.92±0.16 ng m−3, three to four times higher than those observed across Chinese cities. In China, GEM concentrations were remarkably consistent in urban areas across industrial cities (Tangshan, 1.81±0.04 ng m−3; Tianjin, 1.81±0.06 ng m−3) and less industrialized cities (Chengde, 1.49±0.09 ng m−3; Jingzhou, 1.56±0.07 ng m−3), closely clustering around current Northern Hemisphere background levels (1.58±0.31 ng m−3) (Bencardino et al., 2024). This convergence suggests that, following years of emission controls, GEM concentrations across much of China have stabilized near background levels.
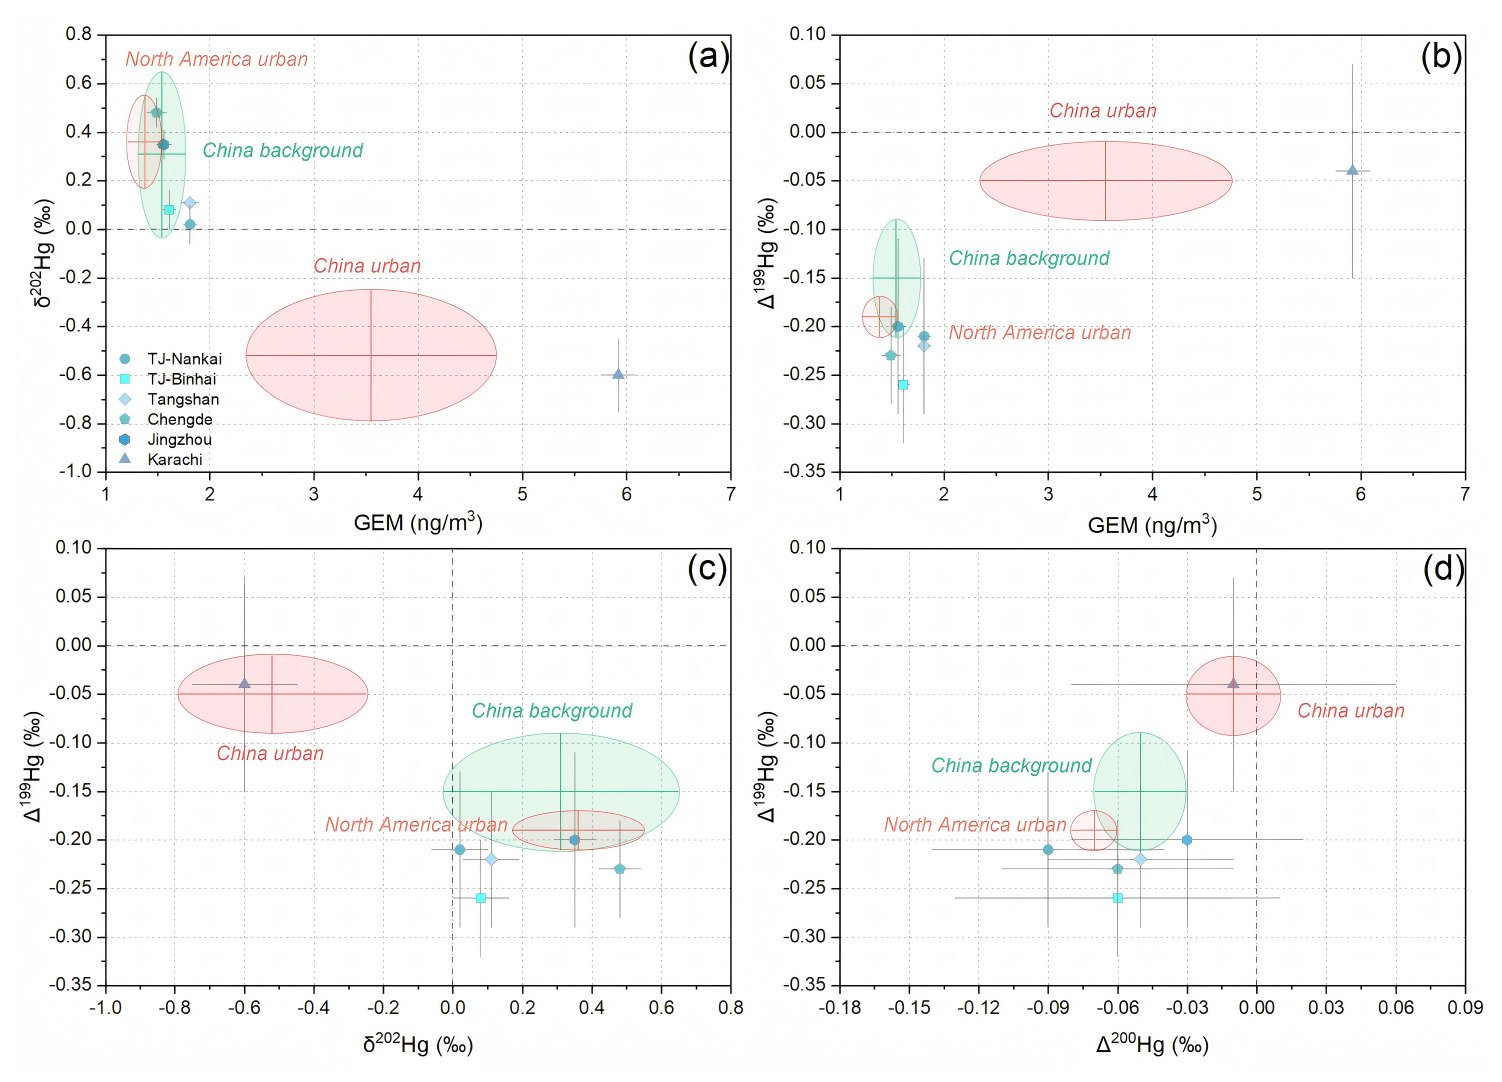
Figure 5Regional comparison of GEM concentrations and isotopic compositions. (a) Concentrations versus δ202Hg, (b) concentrations versus Δ199Hg, (c) δ202Hg versus Δ199Hg, (d) Δ200Hg versus Δ199Hg) of GEM across different sites. Error bars of individual GEM samples indicate the combined uncertainty calculated from the 2σ analytical uncertainty and the 2 SD of concurrently deployed paired MerPAS units. Deep red and green ellipses represent mean ± 1 SD ranges of compiled urban and regional background GEM isotopic compositions in China (Zhang and Sun, 2026). Light red ellipse represents the mean ± 1 SD range of the compiled urban GEM isotopic compositions in North America (Tate et al., 2023).
Isotopic signatures clearly distinguish these contrasting regimes. GEM in Karachi is characterized by strongly negative δ202Hg values ( ‰) and near-zero Δ199Hg ( ‰) and Δ200Hg ( ‰) (Fig. 5). Such isotopic signatures resemble those observed during Phase I of urban Tianjin (Fig. 2), indicative of dominant primary anthropogenic emissions with minimal atmospheric processing (Sun et al., 2016b; Wu et al., 2023). In contrast, all studied Chinese sites exhibited higher δ202Hg values (0.02±0.06 ‰ to 0.48±0.06 ‰) and consistently negative Δ199Hg ( ‰ to ‰) and Δ200Hg values ( ‰ to ‰), largely overlapping regional background signatures (Zhang and Sun, 2026). Even within China, subtle differences in δ202Hg emerge. Cities with lower industrial intensity such as Chengde (0.48±0.06 ‰) and Jingzhou (0.35±0.06 ‰) exhibited notably higher δ202Hg values, approaching those of tropospheric background GEM (Tang et al., 2024), whereas industrial cities such as Tianjin (0.02±0.06 ‰) and Tangshan (0.11±0.06 ‰) displayed slightly positive δ202Hg values, reflecting a superposition of China regional background GEM with isotopically lighter local primary emissions. Within Tianjin, the urban TJ-Nankai site ( ‰) exhibited slightly lower δ202Hg than the suburban TJ-Binhai site ( ‰), underscoring the minor influence of local urban emissions. Taken together, these spatial comparisons reinforce the conclusion that much of urban China has transitioned toward a background-dominated atmospheric Hg regime, where local primary emissions contribute marginally to GEM levels. The isotopic evidence further indicates that, in regions where emission controls are effective, differences in GEM concentrations alone are insufficient to distinguish sources; instead, Hg isotopes provide critical insight into the relative roles of background Hg pool and local primary emissions.
3.5 Source apportionment of long-term atmospheric GEM in urban Tianjin
To integrate the evidence from long-term trends, diurnal variability, and spatial comparisons, we employed a ternary isotope mixing model to quantitatively constrain the sources of GEM in urban Tianjin (Fig. 6). Both active pump-trap and passive MerPAS samples are used for source apportionment analysis to provide a full temporal coverage. Active and passive observations were not pooled by averaging; rather, they were treated as independent observations because they represent different sampling timescales, with active samples reflecting short-term conditions and passive MerPAS samples integrating atmospheric GEM over multiple weeks. The surface re-emissions endmember may include not only urban surface re-emissions but also nearby marine Hg0 re-emission, given the coastal setting of Tianjin. Accordingly, the post-2018 increase in the surface re-emissions term is best interpreted as an integrated signal of recycled Hg from natural and legacy surface reservoirs rather than as a purely urban-soil source. During Phase I (2018) (Fig. 6a), primary anthropogenic emissions clearly dominated the GEM budget (67.3±14.6 %), consistent with the elevated GEM concentrations (4.60±0.28 ng m−3) and the anthropogenic-like isotopic signatures observed during this phase, namely strongly negative δ202Hg values and near-zero MIF values (Sun et al., 2016b; Wu et al., 2023). In comparison, tropospheric background GEM contributed only a limited fraction (9.5±8.5 %), whereas surface re-emissions also made a non-negligible contribution (23.2±6.6 %). In Phase II (2021–2022) (Fig. 6b), coinciding with COVID-19-related activity restrictions, the contribution from primary anthropogenic emissions declined markedly (37.7±7.0 %). At the same time, the relative contributions of surface re-emissions (27.4±6.3 %) and tropospheric background GEM (34.9±10.7 %) increased, indicating a reduced influence of local primary emissions and a greater role of the regional Hg pool and recycled surface Hg. By Phase III (2024–2025) (Fig. 6c), the relative source contributions remained broadly similar to those in Phase II, suggesting that this lower-emission, background-influenced source structure persisted after the resumption of socioeconomic activity under strengthened emission controls.
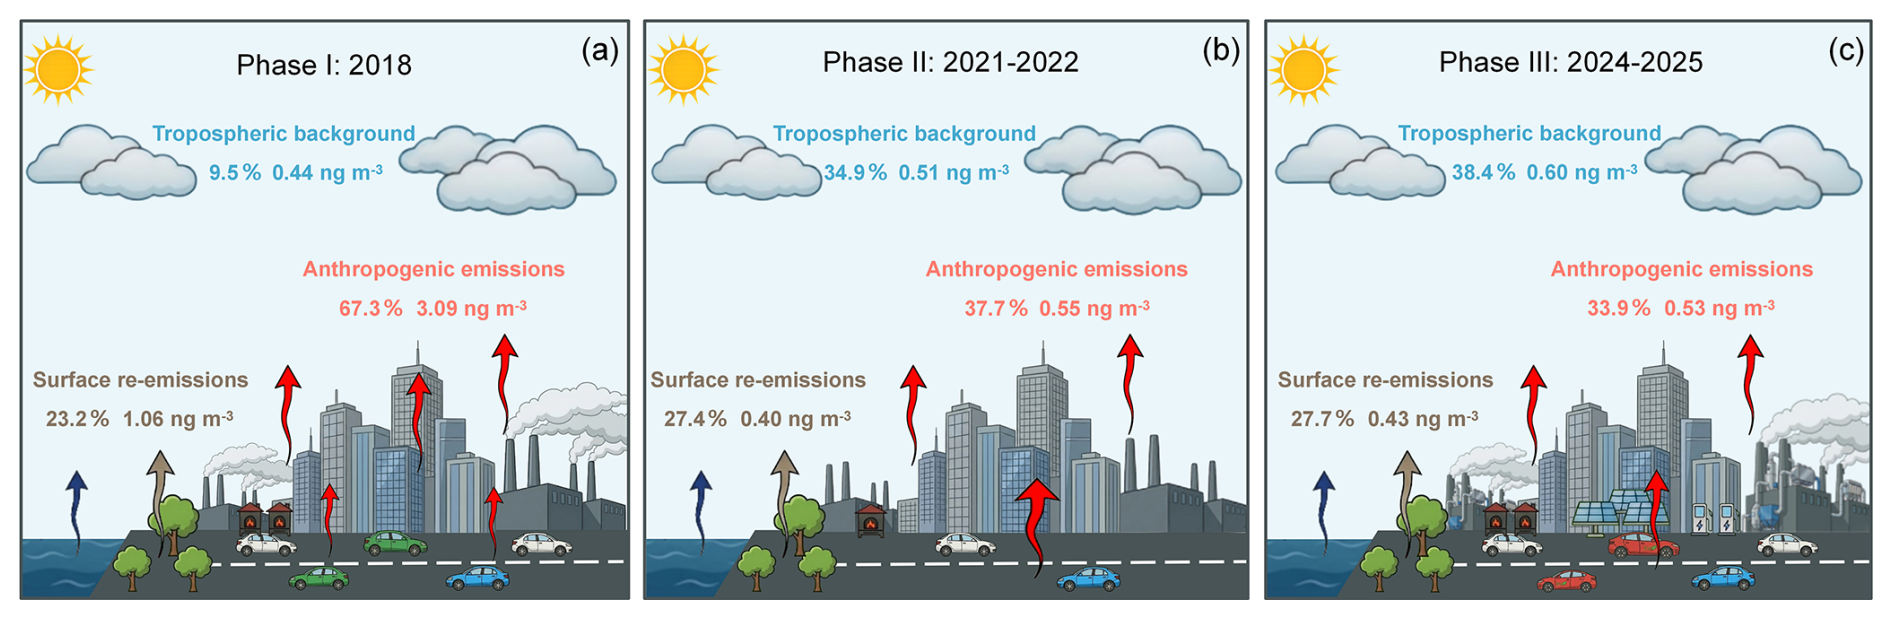
Figure 6Source contributions to GEM concentrations across three study phases in urban Tianjin. (a) Phase I (2018), (b) Phase II (2021–2022), and (c) Phase III (2024–2025) show the estimated relative and absolute contributions of primary anthropogenic emissions, surface re-emissions, and the tropospheric background GEM to near-surface GEM concentrations.
Notably, the marked increase in the relative contributions of tropospheric background GEM and surface re-emissions after 2018 mainly reflects the sharp decline in anthropogenic GEM, rather than substantial absolute increases in these two source terms (Fig. 6). In absolute terms, the contribution from tropospheric background GEM varied only modestly, from ∼0.44 ng m−3 in Phase I to ∼0.51 ng m−3 in Phase II and ∼0.60 ng m−3 in Phase III. In contrast, the absolute contribution from surface re-emissions decreased from ∼1.06 ng m−3 in Phase I to ∼0.40 ng m−3 in Phase II and then remained broadly stable at ∼0.43 ng m−3 in Phase III. The anthropogenic contribution, however, declined sharply from ∼3.09 ng m−3 in Phase I to ∼0.55 ng m−3 in Phase II and ∼0.53 ng m−3 in Phase III. This pronounced reduction in anthropogenic Hg contribution matches the observed GEM concentration decrease from ∼4.6 ng m−3 in Phase I to ∼1.5 ng m−3 in Phases II and III. Together, these results indicate that the recent reduction in urban atmospheric GEM was driven primarily by the suppression of anthropogenic emissions, rather than by major changes in the absolute contributions of tropospheric background GEM or surface re-emissions (Feng et al., 2024; Feinberg et al., 2024; Sun et al., 2025).
Source apportionment of diurnal GEM provides quantitative support for the differing daytime and nighttime source structure inferred above. Surface re-emissions contributed substantially during both daytime and nighttime, but their relative contribution was slightly lower during daytime (25.4±6.4 %) than at nighttime (29.6±5.8 %) (Fig. S4). In contrast, anthropogenic contributions exhibited a clearer diurnal contrast, with higher daytime contributions (37.1±11.4 %) than nighttime contributions (30.6±6.7 %), consistent with stronger daytime urban activity such as traffic and residential emissions. Tropospheric background GEM made comparable contributions during daytime and nighttime, although its relative contribution was slightly higher at nighttime (39.9±9.1 %) than during daytime (37.5±17.0 %). Together, these results suggest that nighttime GEM more closely reflects regional background conditions, whereas daytime GEM is influenced more strongly by local anthropogenic activity. The diurnal source-apportionment results thus support the interpretation that short-term Hg dynamics in urban Tianjin reflect changing contributions from background GEM, surface re-emissions, and local anthropogenic sources, rather than a simple daytime enhancement of surface re-emissions alone.
Based on three-phase observations spanning 2018–2025, this study documents a clear and persistent transformation of the urban atmospheric Hg regime in Tianjin. GEM concentrations declined sharply from pre-control levels to near-background values and remained low even after the resumption of socioeconomic activities. The absence of a post-pandemic rebound demonstrates that recent reductions in urban GEM are not temporary artifacts of reduced activity, but instead reflect sustained structural changes in anthropogenic Hg emissions driven by long-term policy interventions and energy transitions. Hg isotopes provide decisive, process-level corroboration of this regime shift. The transition from strongly negative δ202Hg values with near-zero MIF values to near-zero or positive δ202Hg accompanied by persistently negative MIF values marks a fundamental change in source dominance. These isotopic signatures indicate a diminishing imprint of local primary emissions and an increasing influence of a regionally well-mixed background GEM pool. Concentration and isotope trends together demonstrate that urban Tianjin has shifted from a local emission-controlled to a background-dominated environment. Importantly, isotopic evidence also reveals processes that are largely invisible to concentration measurements alone. Despite minimal diurnal variation in GEM concentrations, paired day–night isotopic offsets point to a weak but discernible daytime input of isotopically light and odd-isotope enriched GEM, consistent with photoreductive re-emission of legacy Hg stored in urban surfaces. Spatial comparisons further reinforce this emerging picture. Across multiple Chinese cities, GEM concentrations have converged toward regional background levels, while isotopic compositions reveal subtle but systematic differences associated with local primary emissions. In contrast, Karachi, Pakistan exhibits both elevated GEM concentrations and isotopic signatures characteristic of strong primary anthropogenic sources, highlighting the stark contrast between regions with and without effective emission controls. The source apportionment results quantitatively integrate these findings. While the relative contributions of tropospheric background GEM and urban surface re-emissions increased substantially after 2018, their absolute contributions to near-surface GEM concentrations remained relatively stable. In contrast, the collapse of primary anthropogenic emissions accounted for the vast majority of the observed concentration decline. This result confirms that recent decreases in urban atmospheric Hg are primarily driven by successful suppression of anthropogenic sources.
From a broader perspective, this study highlights a new challenge for Hg management in the post-emission-control era. As cities transition toward background-dominated Hg regimes, legacy Hg reservoirs may act as persistent secondary sources that slow further improvement. Evaluating the effectiveness of the Minamata Convention therefore requires not only tracking emission reductions, but also understanding how historical Hg stored in urban environments continues to cycle through the atmosphere (Wang et al., 2019; Sonke et al., 2023). Overall, our results demonstrate that Hg stable isotopes provide a powerful and indispensable tool for diagnosing urban Hg cycling under rapidly changing emission regimes. Future efforts should focus on (i) coordinated, high-resolution measurements of GEM, GOM, and PBM alongside boundary-layer and radiative constraints to disentangle dilution, redox chemistry, and surface re-emission processes, and (ii) direct quantification of urban legacy Hg reservoirs and fluxes with improved isotopic end-member constraints. Such advances are critical for achieving a more complete process-level understanding of urban Hg cycling and for guiding effective long-term strategies to reduce Hg exposure in a low-emission future.
All the datasets used in this study can be found in the Supplement.
The supplement related to this article is available online at https://doi.org/10.5194/acp-26-5747-2026-supplement.
RS and CZ designed the entire study and the experiments. CZ, XM, SL, ZW, XL, SA and XW executed experiments. CZ and XM analyzed the data. CZ and RS wrote the draft manuscript. YL, WZ and JC contributed to the discussion and revision of the manuscript.
The contact author has declared that none of the authors has any competing interests.
Publisher's note: Copernicus Publications remains neutral with regard to jurisdictional claims made in the text, published maps, institutional affiliations, or any other geographical representation in this paper. The authors bear the ultimate responsibility for providing appropriate place names. Views expressed in the text are those of the authors and do not necessarily reflect the views of the publisher.
We thank Pengfei Li from the School of Earth System Science, Tianjin University, for his assistance with MC-ICP-MS measurements.
This research has been supported by the National Natural Science Foundation of China (grant nos. 42373011 and 42421003) and the Science Fund for Distinguished Young Scholars of Tianjin Municipality (grant no. 23JCJQJC00280).
This paper was edited by Aurélien Dommergue and reviewed by three anonymous referees.
AMAP/UNEP: Technical Background Report to the Global Mercury Assessment 2018, Arctic Monitoring and Assessment Programme, Oslo, Norway/UN Environment Programme, Chemicals and Health Branch, Geneva, Switzerland, https://www.amap.no/documents/doc/technical-background-report-for-the-global-mercury-assessment (last access: 2 July 2024), 2019.
Belelie, M. D., Moiloa, B., Moatshe, A., Ayob, N., Burger, R. P., and Piketh, S. J.: Assessment of multi-year mercury concentration measurements over the south african highveld: a case study of 2016–2023 selected dataset, Atmos. Environ., 355, 121261, https://doi.org/10.1016/j.atmosenv.2025.121261, 2025.
Bencardino, M., D'Amore, F., Angot, H., Angiuli, L., Bertrand, Y., Cairns, W., Diéguez, M. C., Dommergue, A., Ebinghaus, R., Esposito, G., Komínková, K., Labuschagne, C., Mannarino, V., Martin, L., Martino, M., Neves, L. M., Mashyanov, N., Magand, O., Nelson, P., Norstrom, C., Read, K., Sholupov, S., Skov, H., Tassone, A., Vítková, G., Cinnirella, S., Sprovieri, F., and Pirrone, N.: Patterns and trends of atmospheric mercury in the GMOS network: insights based on a decade of measurements, Environ. Pollut., 363, 125104, https://doi.org/10.1016/j.envpol.2024.125104, 2024.
Bergquist, B. A. and Blum, J. D.: The odds and evens of mercury isotopes: Applications of mass-dependent and mass-independent isotope fractionation, Elements, 5, 353–357, https://doi.org/10.2113/gselements.5.6.353, 2009.
Blanchfield, P. J., Rudd, J. W. M., Hrenchuk, L. E., Amyot, M., Babiarz, C. L., Beaty, K. G., Bodaly, R. A. D., Branfireun, B. A., Gilmour, C. C., Graydon, J. A., Hall, B. D., Harris, R. C., Heyes, A., Hintelmann, H., Hurley, J. P., Kelly, C. A., Krabbenhoft, D. P., Lindberg, S. E., Mason, R. P., Paterson, M. J., Podemski, C. L., Sandilands, K. A., Southworth, G. R., St Louis, V. L., Tate, L. S., and Tate, M. T.: Experimental evidence for recovery of Mercury-contaminated fish populations, Nature, 601, 74–78, https://doi.org/10.1038/s41586-021-04222-7, 2022.
Blum, J. D. and Bergquist, B. A.: Reporting of variations in the natural isotopic composition of Mercury, Anal. Bioanal. Chem., 388, 353–359, https://doi.org/10.1007/s00216-007-1236-9, 2007.
Blum, J. D., Sherman, L. S., and Johnson, M. W.: Mercury isotopes in Earth and environmental sciences, Annu. Rev. Earth Planet. Sci., 42, 249–269, https://doi.org/10.1146/annurev-earth-050212-124107, 2014.
Cai, H. and Chen, J.: Mass-independent fractionation of even mercury isotopes, Sci. Bull., 61, 116–124, https://doi.org/10.1007/s11434-015-0968-8, 2016.
Chen, J., Hintelmann, H., Feng, X., and Dimock, B.: Unusual fractionation of both odd and even mercury isotopes in precipitation from peterborough, ON, Canada, Geochim. Cosmochim. Ac., 90, 33–46, https://doi.org/10.1016/j.gca.2012.05.005, 2012.
Cui, Y., Wu, Q., Wang, S., Liu, K., Li, S., Shi, Z., Ouyang, D., Li, Z., Chen, Q., Lü, C., Xie, F., Tang, Y., Wang, Y., and Hao, J.: Integrating point sources to map anthropogenic atmospheric mercury emissions in China, 1978–2021, Earth Syst. Sci. Data, 17, 3315–3328, https://doi.org/10.5194/essd-17-3315-2025, 2025.
Dong, Z., Pavuluri, C. M., Li, P., Xu, Z., Deng, J., Zhao, X., Zhao, X., Fu, P., and Liu, C.-Q.: Measurement report: optical characterization, seasonality, and sources of brown carbon in fine aerosols from Tianjin, north China: year-round observations, Atmos. Chem. Phys., 24, 5887–5905, https://doi.org/10.5194/acp-24-5887-2024, 2024.
Driscoll, C. T., Mason, R. P., Chan, H. M., Jacob, D. J., and Pirrone, N.: Mercury as a global pollutant: sources, pathways, and effects, Environ. Sci. Technol., 47, 4967–4983, https://doi.org/10.1021/es305071v, 2013.
Estrade, N., Carignan, J., Sonke, J. E., and Donard, O. F. X.: Mercury isotope fractionation during liquid–vapor evaporation experiments, Geochim. Cosmochim. Ac., 73, 2693–2711, https://doi.org/10.1016/j.gca.2009.01.024, 2009.
Feinberg, A., Selin, N. E., Braban, C. F., Chang, K.-L., Custódio, D., Jaffe, D. A., Kyllönen, K., Landis, M. S., Leeson, S. R., Luke, W., Molepo, K. M., Murovec, M., Nerentorp Mastromonaco, M. G., Aspmo Pfaffhuber, K., Rüdiger, J., Sheu, G.-R., and St. Louis, V. L.: Unexpected anthropogenic emission decreases explain recent atmospheric mercury concentration declines, P. Natl. Acad. Sci. USA, 121, e2401950121, https://doi.org/10.1073/pnas.2401950121, 2024.
Feng, X., Fu, X., Zhang, H., Wang, X., Jia, L., Zhang, L., Lin, C.-J., Huang, J.-H., Liu, K., and Wang, S.: Combating air pollution significantly reduced air mercury concentrations in China, Natl. Sci. Rev., 11, nwae264, https://doi.org/10.1093/nsr/nwae264, 2024.
Fu, X., Heimbürger, L.-E., and Sonke, J. E.: Collection of atmospheric gaseous mercury for stable isotope analysis using iodine- and chlorine-impregnated activated carbon traps, J. Anal. Atom. Spectrom., 29, 841, https://doi.org/10.1039/c3ja50356a, 2014.
Fu, X., Liu, C., Zhang, H., Xu, Y., Zhang, H., Li, J., Lyu, X., Zhang, G., Guo, H., Wang, X., Zhang, L., and Feng, X.: Isotopic compositions of atmospheric total gaseous mercury in 10 chinese cities and implications for land surface emissions, Atmos. Chem. Phys., 21, 6721–6734, https://doi.org/10.5194/acp-21-6721-2021, 2021a.
Fu, X., Jiskra, M., Yang, X., Marusczak, N., Enrico, M., Chmeleff, J., Heimbürger-Boavida, L.-E., Gheusi, F., and Sonke, J. E.: Mass-independent fractionation of even and odd mercury isotopes during atmospheric mercury redox reactions, Environ. Sci. Technol., 55, 10164–10174, https://doi.org/10.1021/acs.est.1c02568, 2021b.
Fu, X., Zhang, H., Tang, K., Sommar, J., Huang, J.-H., Song, Z., Zhang, Y., Driscoll, C. T., and Feng, X.: Atmospherically deposited elemental mercury drives evasion of Mercury from the ocean and freshwaters, Natl. Sci. Rev., 13, nwaf590, https://doi.org/10.1093/nsr/nwaf590, 2026.
Fu, X. W., Zhang, H., Yu, B., Wang, X., Lin, C.-J., and Feng, X. B.: Observations of atmospheric mercury in China: a critical review, Atmos. Chem. Phys., 15, 9455–9476, https://doi.org/10.5194/acp-15-9455-2015, 2015.
Gačnik, J., Živković, I., and Horvat, M.: Mercury isotopes in the atmosphere: synthesis, perspectives and analytical considerations, TrAC, Trends Anal. Chem., 189, 118257, https://doi.org/10.1016/j.trac.2025.118257, 2025.
Geyman, B. M., Streets, D. G., Olson, C. I., Thackray, C. P., Olson, C. L., Schaefer, K., Krabbenhoft, D. P., and Sunderland, E. M.: Cumulative anthropogenic impacts of past and future emissions and releases on the global mercury cycle, Environ. Sci. Technol., 59, 8578–8590, https://doi.org/10.1021/acs.est.4c13434, 2025.
Gustin, M. S., Amos, H. M., Huang, J., Miller, M. B., and Heidecorn, K.: Measuring and modeling mercury in the atmosphere: a critical review, Atmos. Chem. Phys., 15, 5697–5713, https://doi.org/10.5194/acp-15-5697-2015, 2015.
Horowitz, H. M., Jacob, D. J., Zhang, Y., Dibble, T. S., Slemr, F., Amos, H. M., Schmidt, J. A., Corbitt, E. S., Marais, E. A., and Sunderland, E. M.: A new mechanism for atmospheric mercury redox chemistry: implications for the global mercury budget, Atmos. Chem. Phys., 17, 6353–6371, https://doi.org/10.5194/acp-17-6353-2017, 2017.
Jin, R., Hu, W., Duan, P., Sheng, M., Liu, D., Huang, Z., Niu, M., Wu, L., Deng, J., and Fu, P.: Exometabolomic exploration of culturable airborne microorganisms from an urban atmosphere, Atmos. Chem. Phys., 25, 1805–1829, https://doi.org/10.5194/acp-25-1805-2025, 2025.
Koenig, A. M., Magand, O., Verreyken, B., Brioude, J., Amelynck, C., Schoon, N., Colomb, A., Ferreira Araujo, B., Ramonet, M., Sha, M. K., Cammas, J.-P., Sonke, J. E., and Dommergue, A.: Mercury in the free troposphere and bidirectional atmosphere–vegetation exchanges – insights from maïdo mountain observatory in the southern hemisphere tropics, Atmos. Chem. Phys., 23, 1309–1328, https://doi.org/10.5194/acp-23-1309-2023, 2023.
Lamborg, C. H., Hammerschmidt, C. R., Bowman, K. L., Swarr, G. J., Munson, K. M., Ohnemus, D. C., Lam, P. J., Heimbürger, L.-E., Rijkenberg, M. J. A., and Saito, M. A.: A global ocean inventory of anthropogenic mercury based on water column measurements, Nature, 512, 65–68, https://doi.org/10.1038/nature13563, 2014.
Li, J., Wei, W., Zhen, W., Guo, Y., and Chen, B.: How green transition of energy system impacts china's mercury emissions, Earth's Future, 7, 1407–1416, https://doi.org/10.1029/2019EF001269, 2019.
Liu, K., Wu, Q., Wang, L., Wang, S., Liu, T., Ding, D., Tang, Y., Li, G., Tian, H., Duan, L., Wang, X., Fu, X., Feng, X., and Hao, J.: Measure-specific effectiveness of air pollution control on China's atmospheric mercury concentration and deposition during 2013–2017, Environ. Sci. Technol., 53, 8938–8946, https://doi.org/10.1021/acs.est.9b02428, 2019.
McLagan, D. S., Mitchell, C. P. J., Huang, H., Lei, Y. D., Cole, A. S., Steffen, A., Hung, H., and Wania, F.: A high-precision passive air sampler for gaseous mercury, Environ. Sci. Technol. Lett., 3, 24–29, https://doi.org/10.1021/acs.estlett.5b00319, 2016.
Muntean, M., Crippa, M., Guizzardi, D., Pagani, F., Becker, W., Banja, M., Schaaf, E., and Simonati, A.: EDGAR v8.1 Global Mercury Emissions, European Commission, JRC – Joint Research Centre [data set], https://doi.org/10.2905/83b507d7-5218-4dc5-95f9-0ec36f073204, 2024.
Outridge, P. M., Mason, R. P., Wang, F., Guerrero, S., and Heimbürger-Boavida, L. E.: Updated global and oceanic mercury budgets for the united nations global mercury assessment 2018, Environ. Sci. Technol., 52, acs.est.8b01246, https://doi.org/10.1021/acs.est.8b01246, 2018.
Qin, X., Zhang, L., Wang, G., Wang, X., Fu, Q., Xu, J., Li, H., Chen, J., Zhao, Q., Lin, Y., Huo, J., Wang, F., Huang, K., and Deng, C.: Assessing contributions of natural surface and anthropogenic emissions to atmospheric mercury in a fast-developing region of eastern China from 2015 to 2018, Atmos. Chem. Phys., 20, 10985–10996, https://doi.org/10.5194/acp-20-10985-2020, 2020.
Rose, C. H., Ghosh, S., Blum, J. D., and Bergquist, B. A.: Effects of ultraviolet radiation on Mercury isotope fractionation during photo-reduction for inorganic and organic mercury species, Chem. Geol., 405, 102–111, https://doi.org/10.1016/j.chemgeo.2015.02.025, 2015.
Sommar, J. O., Shi, X., Tang, X., Sun, G., Lin, C.-J., and Feng, X.: Atmospheric mercury: recent advances in theoretical, computational, experimental, observational, and isotopic understanding to decipher its redox transformations in the upper and lower atmosphere and interactions with Earth surface reservoirs, Atmos. Chem. Phys., 25, 12233–12334, https://doi.org/10.5194/acp-25-12233-2025, 2025.
Sonke, J. E., Angot, H., Zhang, Y., Poulain, A., Björn, E., and Schartup, A.: Global change effects on biogeochemical mercury cycling, Ambio, 52, 853–876, https://doi.org/10.1007/s13280-023-01855-y, 2023.
Sprovieri, F., Pirrone, N., Bencardino, M., D'Amore, F., Carbone, F., Cinnirella, S., Mannarino, V., Landis, M., Ebinghaus, R., Weigelt, A., Brunke, E.-G., Labuschagne, C., Martin, L., Munthe, J., Wängberg, I., Artaxo, P., Morais, F., de Melo Jorge Barbosa, H., Brito, J., Cairns, W., Barbante, C., del Carmen Diéguez, M., Garcia, P. E., Dommergue, A., Angot, H., Magand, O., Skov, H., Horvat, M., Kotnik, J., Read, K. A., Neves, L. M., Gawlik, B. M., Sena, F., Mashyanov, N., Obolkin, V., Wip, D., Feng, X. B., Zhang, H., Fu, X., Ramachandran, R., Cossa, D., Knoery, J., Marusczak, N., Nerentorp, M., and Norstrom, C.: Atmospheric mercury concentrations observed at ground-based monitoring sites globally distributed in the framework of the GMOS network, Atmos. Chem. Phys., 16, 11915–11935, https://doi.org/10.5194/acp-16-11915-2016, 2016.
Streets, D. G., Horowitz, H. M., Lu, Z., Levin, L., Thackray, C. P., and Sunderland, E. M.: Global and regional trends in Mercury emissions and concentrations, 2010–2015, Atmos. Environ., 201, 417–427, https://doi.org/10.1016/j.atmosenv.2018.12.031, 2019.
Sun, G., Sommar, J., Feng, X., Lin, C.-J., Ge, M., Wang, W., Yin, R., Fu, X., and Shang, L.: Mass-dependent and -independent fractionation of Mercury isotope during gas-phase oxidation of elemental mercury vapor by atomic Cl and Br, Environ. Sci. Technol., 50, 9232–9241, https://doi.org/10.1021/acs.est.6b01668, 2016a.
Sun, G., Feng, X., Yin, R., Wang, F., Lin, C.-J., Li, K., and Sommar, J. O.: Dissociation of mercuric oxides drives anomalous isotope fractionation during net photo-oxidation of Mercury vapor in air, Environ. Sci. Technol., 56, 13428–13438, https://doi.org/10.1021/acs.est.2c02722, 2022.
Sun, R., Streets, D. G., Horowitz, H. M., Amos, H. M., Liu, G., Perrot, V., Toutain, J.-P., Hintelmann, H., Sunderland, E. M., and Sonke, J. E.: Historical (1850–2010) mercury stable isotope inventory from anthropogenic sources to the atmosphere, Elem. Sci. Anth., 4, 91, https://doi.org/10.12952/journal.elementa.000091, 2016b.
Sun, R., Cao, F., Dai, S., Shan, B., Qi, C., Xu, Z., Li, P., Liu, Y., Zheng, W., and Chen, J.: Atmospheric mercury isotope shifts in response to Mercury emissions from underground coal fires, Environ. Sci. Technol., 57, 8638–8649, https://doi.org/10.1021/acs.est.2c08637, 2023.
Sun, R., Zhang, R., Yang, Y., Liu, Y., Zheng, W., Zhang, Q., Lin, H., Tong, Y., Zhang, Y., Schauer, J., Wang, X., and Chen, J.: Four decades of atmospheric mercury records at mt. Everest reveals significant reduction in anthropogenic mercury emissions over the past decade, ACS ES&T Air, 2, 824–836, https://doi.org/10.1021/acsestair.4c00296, 2025.
Szponar, N., McLagan, D. S., Kaplan, R. J., Mitchell, C. P. J., Wania, F., Steffen, A., Stupple, G. W., Monaci, F., and Bergquist, B. A.: Isotopic characterization of atmospheric gaseous elemental mercury by passive air sampling, Environ. Sci. Technol., 54, 10533–10543, https://doi.org/10.1021/acs.est.0c02251, 2020.
Tang, K., Yin, X., Zhang, H., Fu, X., Zhang, H., Zhang, L., Zhang, Q., Chen, P., Jia, L., De Foy, B., Kang, S., and Feng, X.: Transport of exogenous anthropogenic atmospheric mercury to the Tibetan Plateau identified using mercury stable isotopes, J. Geophys. Res.-Atmos., 129, e2024JD041684, https://doi.org/10.1029/2024JD041684, 2024.
Tang, Y., Wang, S., Wu, Q., Liu, K., Wang, L., Li, S., Gao, W., Zhang, L., Zheng, H., Li, Z., and Hao, J.: Recent decrease trend of atmospheric mercury concentrations in east China: the influence of anthropogenic emissions, Atmos. Chem. Phys., 18, 8279–8291, https://doi.org/10.5194/acp-18-8279-2018, 2018.
Tate, M. T., Janssen, S. E., Lepak, R. F., Flucke, L., and Krabbenhoft, D. P.: National-scale assessment of total gaseous mercury isotopes across the United States, J. Geophys. Res.-Atmos., 128, e2022JD038276, https://doi.org/10.1029/2022JD038276, 2023.
Wang, F., Outridge, P. M., Feng, X., Meng, B., Heimbürger-Boavida, L.-E., and Mason, R. P.: How closely do mercury trends in fish and other aquatic wildlife track those in the atmosphere? – implications for evaluating the effectiveness of the minamata convention, Sci. Total Environ., 674, 58–70, https://doi.org/10.1016/j.scitotenv.2019.04.101, 2019.
Wang, Y. Q., Zhang, X. Y., and Draxler, R. R.: TrajStat: GIS-based software that uses various trajectory statistical analysis methods to identify potential sources from long-term air pollution measurement data, Environ. Model. Softw., 24, 938–939, https://doi.org/10.1016/j.envsoft.2009.01.004, 2009.
Wen, Z., Ma, X., Xu, W., Si, R., Liu, L., Ma, M., Zhao, Y., Tang, A., Zhang, Y., Wang, K., Zhang, Y., Shen, J., Zhang, L., Zhao, Y., Zhang, F., Goulding, K., and Liu, X.: Combined short-term and long-term emission controls improve air quality sustainably in China, Nat. Commun., 15, 5169, https://doi.org/10.1038/s41467-024-49539-9, 2024.
Wiederhold, J. G., Cramer, C. J., Daniel, K., Infante, I., Bourdon, B., and Kretzschmar, R.: Equilibrium mercury isotope fractionation between dissolved hg(II) species and thiol-bound hg, Environ. Sci. Technol., 44, 4191–4197, https://doi.org/10.1021/es100205t, 2010.
Wu, Q., Wang, S., Li, G., Liang, S., Lin, C.-J., Wang, Y., Cai, S., Liu, K., and Hao, J.: Temporal trend and spatial distribution of speciated atmospheric mercury emissions in China during 1978–2014, Environ. Sci. Technol., 50, 13428–13435, https://doi.org/10.1021/acs.est.6b04308, 2016.
Wu, Q., Tang, Y., Wang, S., Li, L., Deng, K., Tang, G., Liu, K., Ding, D., and Zhang, H.: Developing a statistical model to explain the observed decline of atmospheric mercury, Atmos. Environ., 243, 117868, https://doi.org/10.1016/j.atmosenv.2020.117868, 2020.
Wu, X., Fu, X., Zhang, H., Tang, K., Wang, X., Zhang, H., Deng, Q., Zhang, L., Liu, K., Wu, Q., Wang, S., and Feng, X.: Changes in atmospheric gaseous elemental mercury concentrations and isotopic compositions at Mt. Changbai during 2015–2021 and Mt. Ailao during 2017–2021 in China, J. Geophys. Res.-Atmos., 128, e2022JD037749, https://doi.org/10.1029/2022JD037749, 2023.
Yu, B., Yang, L., Liu, H., Xiao, C., Bu, D., Zhang, Q., Fu, J., Zhang, Q., Cong, Z., Liang, Y., Hu, L., Yin, Y., Shi, J., and Jiang, G.: Tracing the transboundary transport of Mercury to the Tibetan Plateau using atmospheric mercury isotopes, Environ. Sci. Technol., 56, 1568–1577, https://doi.org/10.1021/acs.est.1c05816, 2022.
Zhang, C. and Sun, R.: Atmospheric mercury stable isotopes: advances in Mercury cycle tracing and projections of future trends, Earth Sci. Rev., 272, 105348, https://doi.org/10.1016/j.earscirev.2025.105348, 2026.
Zhang, K., Zheng, W., Sun, R., He, S., Shuai, W., Fan, X., Yuan, S., Fu, P., Deng, J., Li, X., Wang, S., and Chen, J.: Stable isotopes reveal photoreduction of particle-bound mercury driven by water-soluble organic carbon during severe haze, Environ. Sci. Technol., 56, 10619–10628, https://doi.org/10.1021/acs.est.2c01933, 2022.
Zhang, Y., Shindell, D., Seltzer, K., Shen, L., Lamarque, J.-F., Zhang, Q., Zheng, B., Xing, J., Jiang, Z., and Zhang, L.: Impacts of emission changes in China from 2010 to 2017 on domestic and intercontinental air quality and health effect, Atmos. Chem. Phys., 21, 16051–16065, https://doi.org/10.5194/acp-21-16051-2021, 2021.
Zhang, Y., Zhang, L., Cao, S., Liu, X., Jin, J., and Zhao, Y.: Improved anthropogenic mercury emission inventories for China from 1980 to 2020: toward more accurate effectiveness evaluation for the minamata convention, Environ. Sci. Technol., 57, 8660–8670, https://doi.org/10.1021/acs.est.3c01065, 2023.
Zheng, B., Tong, D., Li, M., Liu, F., Hong, C., Geng, G., Li, H., Li, X., Peng, L., Qi, J., Yan, L., Zhang, Y., Zhao, H., Zheng, Y., He, K., and Zhang, Q.: Trends in China's anthropogenic emissions since 2010 as the consequence of clean air actions, Atmos. Chem. Phys., 18, 14095–14111, https://doi.org/10.5194/acp-18-14095-2018, 2018.
Zheng, W. and Hintelmann, H.: Mercury isotope fractionation during photoreduction in natural water is controlled by its Hg DOC ratio, Geochim. Cosmochim. Ac., 73, 6704–6715, https://doi.org/10.1016/j.gca.2009.08.016, 2009.
Zheng, W. and Hintelmann, H.: Nuclear field shift effect in isotope fractionation of Mercury during abiotic reduction in the absence of light, J. Phys. Chem. A, 114, 4238–4245, https://doi.org/10.1021/jp910353y, 2010.
Zhu, W., Fu, X., Zhang, H., Liu, C., Skyllberg, U., Sommar, J., Yu, B., and Feng, X.: Mercury isotope fractionation during the exchange of Hg0 between the atmosphere and land surfaces: implications for Hg0 exchange processes and controls, Environ. Sci. Technol., 56, 1445–1457, https://doi.org/10.1021/acs.est.1c05602, 2022.
Zhu, W., Li, Z., Li, P., Sommar, J., Fu, X., Feng, X., Yu, B., Zhang, W., Reis, A. T., and Pereira, E.: Legacy mercury re-emission and subsurface migration at contaminated sites constrained by Hg isotopes and chemical speciation, Environ. Sci. Technol., 58, 5336–5346, https://doi.org/10.1021/acs.est.3c07276, 2024.