the Creative Commons Attribution 4.0 License.
the Creative Commons Attribution 4.0 License.
 | 23 Apr 2026
The diurnal cycle and temperature dependence of crystal shapes in ice clouds from satellite lidar polarized measurements
Hélène Chepfer
Christelle Barthe
John Yorks
The shape of crystals in ice clouds influences many aspects of the cloud lifecycle and radiative impact, yet they are extremely variable and hard to categorize. In this paper, we apply a recent crystal shape classification methodology to 33 months of spaceborne lidar measurements. We take advantage of their non-sun-synchronous nature to document the diurnal variability of the repartition of shapes inside clouds. We find that in mid-level clouds the repartition of shapes is dominated by bullets (in particular at higher altitudes) and horizontally-oriented columns, in agreement with previous results. Shape dependence on latitude is generally symmetric around the equator. We document the repartition of shapes with temperature, and show that the proportion of simple shapes (2D plates and columns) decreases at colder temperatures, while the proportion of complex shapes (Droxtals and Voronois) increases, becoming dominant below −60 °C. Finally, we document the diurnal cycle of the repartition of shapes according to temperature and latitude. We find there are more 2D plates and columns in the daytime repartition, while more complex shapes are more likely in the nighttime repartition. 3D bullets are frequent in the shape repartition and follow a unique behavior: at cold temperatures they are more frequent in the daytime repartition but at warmer temperatures more frequent in the nighttime repartition. The amplitude of diurnal cycles generally strengthens at colder temperatures. These results provide new constraints for the representation of ice cloud microphysics in atmospheric and climate models.
- Article
(2395 KB) - Full-text XML
-
Supplement
(2746 KB) - BibTeX
- EndNote


Clouds in the upper part of the troposphere are largely made of ice particles, which can adopt an infinite variety of size and shape combinations (van Diedenhoven, 2018; Magee et al., 2021; Cairo et al., 2023). The microphysical properties of a given cloud are closely linked to its capacity for water vapor uptake and formation speed, its radiative impact and optical signature, and eventually its sedimentation and dissipation process (Gettelman et al., 2024). Particle shapes thus influence the life cycle of ice clouds. The difficulty in creating appropriate categories of crystal shapes in ice clouds makes their representation in atmospheric regional models complex, leading to significant uncertainties and errors when simulating the lifecycle of ice clouds and estimating their impact on other atmospheric processes (Taufour et al., 2024). If we want to properly account for the role of ice clouds in short-term atmospheric processes key to weather and extreme events prediction, it is essential to better understand how ice crystal properties are spatially distributed throughout the globe, and which external atmospheric parameters influence them (Krämer et al., 2016). One area that has received little attention so far is whether the microphysical properties of ice clouds follow a diurnal cycle.
Recent advances in the simulation of the optical signature of ice particles have enabled the development of a particle type classification methodology, based on polarized lidar measurements (Okamoto et al., 2019). Sato and Okamoto (2023) applied this methodology successfully to several years of observations from the Cloud-Aerosol Lidar and Infrared Pathfinder Satellite Observations (CALIPSO) spaceborne lidar (Winker et al., 2009), leading to maps of the relative concentrations in ice clouds of specific particle types. Here we apply this methodology on optically thin clouds (mainly ice) detected in measurements from the CATS lidar (Cloud-Aerosol Transport System, Yorks et al., 2016), to document how the repartition of particle types in ice clouds vary diurnally with the local time of observation, latitude, and temperature. Our objective is to better understand whether the repartition of crystal shapes in ice clouds changes throughout the diurnal cycle.
After introducing the CATS dataset (Sect. 2.1) and the cloud detection and particle type classification methods (Sect. 2.2), we compare in Sect. 3.1 our results with those obtained from CALIPSO data by Sato and Okamoto (2023). We then describe the temperature dependence of the particle type partitioning (Sect. 3.2) and its diurnal cycle (Sect. 3.3). We conclude in Sect. 4.
2.1 Backscatter data from the CATS spaceborne lidar
The CATS spaceborne lidar was operated from the International Space Station (ISS) between February 2015 and October 2017, leading to ∼33 months of measurements of vertical profiles of attenuated backscatter. Over the complete period, most months were sampled 3 times, while months between November and February were sampled only twice: when considering the entire CATS dataset, results might be slightly dominated by the March–October period. Although initially equipped with 355 nm (UV), 532 nm (visible) and 1064 nm (IR) channels, eventually the near-totality of CATS measurements (31 months) were performed at 1064 nm only. Laser performance and data acquisition were optimized for that wavelength, leading to high-quality measurements of attenuated backscatter coefficients (Pauly et al., 2019). Unlike CALIPSO, which as part of the sun-synchronous A-Train always took measurements at the same local time (01:30 am/pm until 2018), ISS-based CATS samples were made at variable local times, giving access to the statistical diurnal variation of observed cloud properties over months or seasons (Noel et al., 2018; Chepfer et al., 2019). CATS detections of ice clouds made at 01:30 am/pm LT are very consistent with those based on CALIPSO (Sellitto et al., 2020). The ISS orbital inclination constrains CATS measurements zonally between 55° S and 55° N.
The results presented here are based on the CATS Level 1B data product (v3.00). From its variables, we have used the Total Attenuated Backscatter (TAB) and the Perpendicular Attenuated Backscatter (PAB) at 1064 nm. As recommended in the CATS Data Release Notes (https://cats.gsfc.nasa.gov/media/docs/CATS_Release_Notes7.pdf, last access: 20 April 2026) we avoided granules with suspect depolarization ratios (identified with Depol_Quality_Flag>0). We have in addition from the same product used profiles of synthetic molecular backscatter at 1064 nm, and meteorological data like profiles of pressure and temperature. The latter come from the MERRA-2 reanalysis (Gelaro et al., 2017) on a 0.5°×0.625° lat–long grid, extracted along the CATS surface footprint, and were provided on their own horizontal grid (on average every 70 km). For the present paper we interpolated these profiles on the horizontal grid used for CATS backscatter measurements.
To obtain the local time of observation for a CATS profile, its UTC time was offset considering the measurement longitude at the time of observation.
2.2 Cloud detection and ice crystal shape classification
To the best of our ability, we performed the data averaging as in Yoshida et al. (2010), cloud detection as in Hagihara et al. (2010), and crystal shape classification as in Sato and Okamoto (2023), with small adaptations to the CATS configuration which are described hereafter.
Our first step was to average the CATS vertical profiles of TAB on the spatial grid designed for the CALIPSO Kyushu University (CALIPSO-KU) cloud product – 1 km horizontally, and 240 m vertically (Yoshida et al., 2010; Cesana et al., 2016). Although CATS and CALIPSO cloud products are mainly based on measurements at, respectively, 1064 and 532 nm, at these respective wavelengths their signal to noise ratios (SNR) at the same spatial resolutions are similar, which leads to very similar ice cloud detections in the Tropics (Sellitto et al., 2020). Given this similitude in SNR, the CALIPSO-KU averaging scheme, which provides a good basis for ice crystal shape classification in CALIPSO data, should be equally appropriate when applied on CATS data. CATS L1B profiles are distant of ∼350 m horizontally and contain points distant of 60 m vertically, thus we averaged 3 profiles horizontally and 4 points vertically. Figure 1a shows an example of the averaging scheme applied to a sample CATS overpass that features a large amount of optically thin and high clouds.
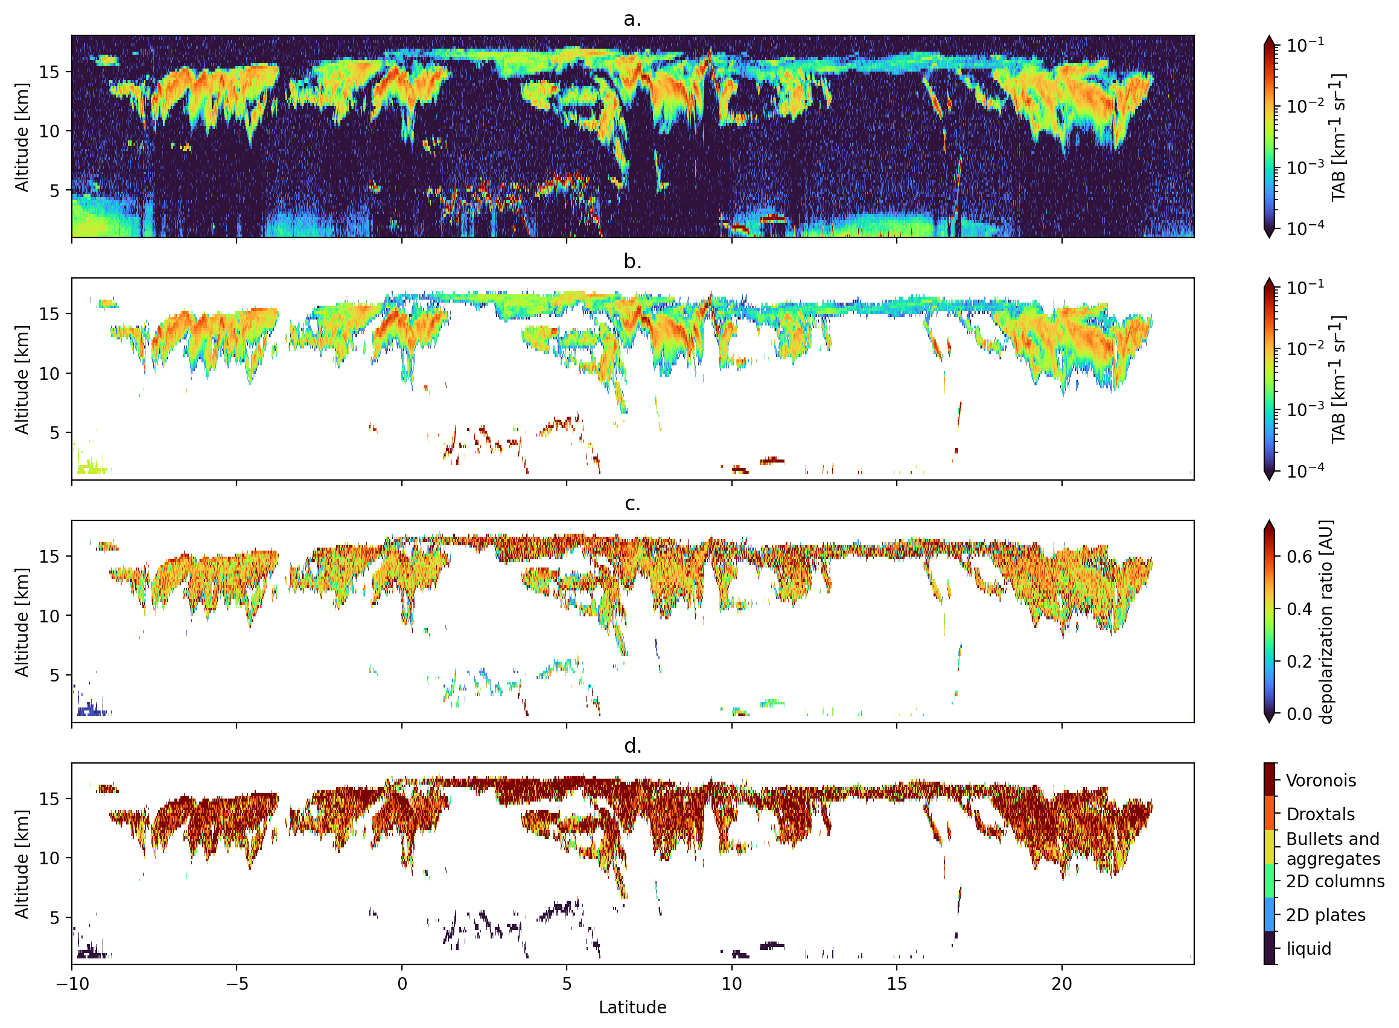
Figure 1(a) TAB measurements obtained at 1064 nm by the CATS lidar averaged on the CALIPSO-KU spatial grid, (b) results of cloud detection after applying a signal threshold and spatial consistency test, (c) depolarization ratio and (d) shape index during a subset of the 2015-08-25T01-07-03T01-23–30 UTC CATS-ISS overpass on top of central America in nighttime conditions (no sunlight).
Second, we applied to the averaged TAB profiles the cloud detection methodology described in Hagihara et al. (2010). This two-part detection scheme begins by identifying when the tropospheric TAB gets larger than a threshold including the backscattered signal from molecules, a possible contribution by aerosols at low altitudes, and instrumental noise derived from close measurements made in an elevated, supposedly clear-sky area (19–20 km above sea level (a.s.l.)). This detection method was designed for CALIPSO measurements at 532 nm. At CATS 1064 nm the observed molecular backscattering signal is much weaker, which means its contribution to the threshold detection level will be mostly negligible (as tests confirmed). Following Hagihara et al. (2010), in regions warmer than −5 °C or below 5 km a.s.l. we increased the detection threshold significantly, to exclude from the detection aerosols that might be present at low altitudes. The final detection threshold varies according to altitude and the noise levels of individual profiles, and at low altitudes in nighttime conditions falls in the 10−3–10−2 range similar to the one used in Hagihara et al. (2010). False detections were cleared up by a spatial consistency test considering a 9×9 bins window (9 km horizontally × 2.16 km vertically). This process leads to a spatially consistent cloud mask with a limited number of false detections (Fig. 1b). In daytime conditions, sunlight significantly increases the instrumental noise, leading to a rise in the signal threshold and a loss of detection sensitivity, leading to fewer detections of optically thin cloud layers. While the resulting cloud still appears accurate (Fig. S1 in the Supplement), statistics show that applying the less sensitive daytime detection threshold to all illumination conditions would lead to a decrease in 30 % of the total number of cloud detections. This means that the cloud properties discussed hereafter are during nighttime conditions more representative of optically thin clouds than during daytime, and vice versa.
Third, we identified liquid and ice clouds based on temperature and the x parameter. This parameter quantifies within a given profile the change in TAB between two consecutive 240 m altitude levels inside a cloud layer, and can be considered a simple proxy for cloud extinction. Ice clouds, whose extinction is significantly weaker than liquid clouds, were identified by x < 0.5 (as in Yoshida et al., 2010) and temperatures colder than −5 °C. A consequence is that ice clouds which are 240 m thick or thinner will not be part of the final database: only ice clouds 480 m thick or thicker will be considered. Clouds with larger xor temperatures above −5 °C were flagged as liquid.
Finally, we computed profiles of volume depolarization ratio, usually defined as (Fig. 1c), with β⊥ and β∥ the perpendicular and parallel components of the cloud backscatter. As extinction applies to both parameters in equal measure, the depolarization ratio can be equally obtained by the ratio of TAB and PAB measurements (Sect. 2.1). Within ice clouds, to each value of δ we attributed a dominant crystal shape according to the classification scheme described in Sato and Okamoto (2023). While lidar backscatter is an integral product of the particle size distribution and the particle mean backscattering cross-section, in the depolarization ratio the size distribution effects cancel out, leaving just the depolarization effect. Classifications are thus independent of particle size distribution. In addition to the liquid composition already identified, this scheme adds five representative ice particle types: plates, columns, bullets (representing 3D aggregates and including bullet rosettes and 3D columns), droxtals (Yang et al., 2003) and Voronois (Li et al., 2022). 2D plates and columns are considered horizontally-oriented (Noel and Sassen, 2005) following a Gaussian angular distribution (Okamoto et al., 2019), all other shapes are randomly oriented, including bullets (hence “3D”). Voronoi particles, conceived by Ishimoto et al. (2012), are model-generated fractal aggregates which follow a mass-dimensional power law consistent with composites from in situ observations (Heymsfield et al., 2010). Voronois are used in remote sensing applications for several satellite programs (Letu et al., 2016). Results of this classification for the sample overpass are shown in Fig. 1d.
By applying this methodology, we retrieved vertical profiles of crystal shape categories within ice clouds, along the ISS ground track. We considered all retrievals from similar months to generate monthly statistics (e.g., we combined retrievals from April 2015, April 2016 and April 2017 together). For a given month, cloud detections and particle shape retrievals were grouped according to bins of latitude (55° S–55° N every 10°), pressure (1000–680, 680–440, 440–100 hPa), temperature (−80 to −10 °C every 10 °C) and local time of observation (hourly bins).
In this section we present the repartition of particle shapes in cloud detections according to temperature, latitude, and local time. Summing the fractions of all shapes across each partitioning will equal unity. This metric was selected to make shape results independent of CATS sampling and of cloud amount or thickness, which all have their own strongly irregular dependency to latitude and temperature. Results should be interpreted as providing, given the presence of a cold and optically thin cloud, the probability that the particles within are of a given shape, and not as giving any information on the relative number concentration of particles.
3.1 Particle shape partitioning with latitude
In this section we document the repartition of particle shapes according to latitude and pressure (Fig. 2). To make these results as directly comparable to the CALIPSO-based equivalent results described in Sato and Okamoto (2023), we only considered CATS data measured at 01:00 local time ±1 h (so the diurnal sampling is similar to the CALIPSO one). For simplicity, since the distinction between warm and supercooled water categories (present in from Sato and Okamoto, 2023) is not our focus here, we combined them in a single “liquid” category.
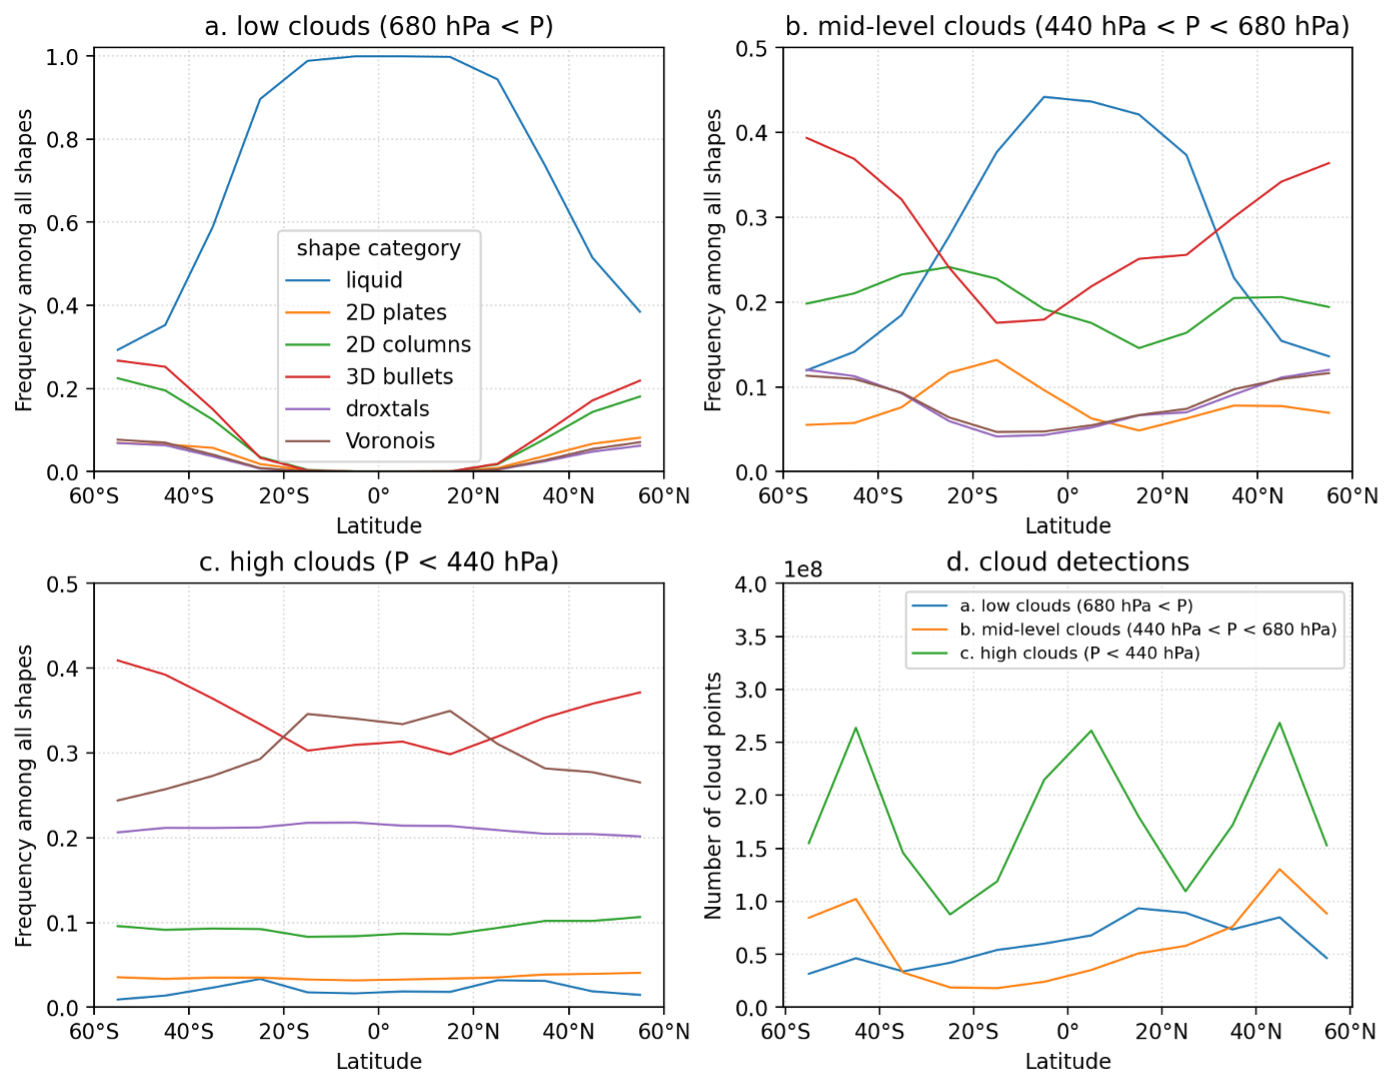
Figure 2Partitioning of particle shapes with latitude for (a) low-level clouds (pressure larger than 680 hPa), (b) mid-level clouds (pressure between 440 and 680 hPa), and high clouds (pressure weaker than 440 hPa) according to CATS data between March 2015 and October 2017. Months between November and March are less present in the data (see text). The sum of frequencies for all shapes at a given pressure level and latitude is unity. (d) Total count of cloud points in the three pressure ranges according to latitude.
Cloud amounts detected at low levels (blue in Fig. 2d) and mid-level (orange) are not symmetrical around the equator: instead, both cloud types are more numerous in the North Hemisphere, most likely in relation with the continent hemispherical imbalance. Due to the slight under-representation of the north hemisphere winter November–February period (Sect. 2.1) in the sampled dataset, the position of the Inter-Tropical Convergence Zone (ITCZ) will be biased to the North, which could have an impact on results. Deliberately ignoring retrievals between March and September 2016 (not shown), thus uniformizing the seasonal sampling, has however no impact on the asymmetry of low and mid-level cloud amounts, or on any of the following results. High-level clouds (green) are the most numerous and follow a symmetrical trimodal zonal distribution, with high cloud amounts near the equator (inside the ITCZ), but also at higher latitudes (45°) near the storm tracks (Shaw et al., 2016).
In low-level clouds (P>680 hPa), the repartition of particle shapes (Fig. 2a) appears strictly symmetric around the equator. Below ∼20° of latitude, particles in those clouds are almost exclusively liquid (blue). Solid particles appear near ∼20° and become a larger part of the shape mix at higher latitudes. Among solid particles, most frequent shapes are bullets (red), then 2D columns (green). These results are very consistent with CALIPSO-based ones in Sato and Okamoto (2023), as is the result that 2D plates, droxtals and Voronois are a minority. However, while those appear in roughly equal measures here, results based on CALIPSO data report almost no 2D plates and relatively more Voronoi shapes. The increase in 2D plates and decrease in Voronoi found in CATS data could possibly be related to larger noise in the CATS depolarization signal compared to CALIPSO.
Considering mid-level clouds (), liquid particles dominate the shape repartition in the 20° S–20° N region (blue in Fig. 2b). They are most present among shapes near the equator (45 % of shapes). At higher latitudes, the importance of liquid particles drops to ∼0.15 near 40° and ∼0.1 at 55°. The most frequent solid particle type is 3D bullets (red), and they dominate the shape repartition at latitudes higher than ∼30°. Within the Tropics, they appear less in the particle mix in the southern hemisphere, reaching a minimum frequency near ∼15° S. The next most frequent particle type is 2D column (green), with a frequency that remains relatively stable zonally (in the 0.15–0.25 range) and a slight maximum in the southern hemisphere (near ∼30° S). The three most frequent particle types (liquid, 3D bullets, 2D columns) are the same as those found in low-level clouds (Fig. 2c). 2D plates and columns are most present in the mix in the south hemisphere (15–25° S), where Voronois and droxtals are least present. All these results for mid-level clouds are very consistent with CALIPSO ones. The remaining particle types have comparable and small frequency ranges (0.05–0.12), but while CATS results suggest 2D plates are most frequent in the shape mix in the southern hemisphere near ∼20° S, where the fraction of droxtals and Voronois is minimal, CALIPSO results suggest a clear dominance of Voronois and Droxtals, and a minority of 2D plates. We currently have no explanation for this difference.
Finally, in high-level clouds (P<440 hPa) liquid particles (blue in Fig. 2c) are almost non-existent, which is not surprising. A slight increase in the frequency of liquid particles is found near both 30° S and 30° N, a feature also found in CALIPSO-based results (Sato and Okamoto, 2023) and related to the local minimum of ice cloud amount in the extratropics (green, Fig. 2d). CATS results report that Voronois (brown) dominate the shape repartition near the equator, with frequencies near 0.35 in the 20° S–20° N range, and that their relative importance drops as latitude increases. At latitudes higher than 20°, 3D bullets (red) dominate the shape mix with frequencies rising to 0.4 near 55° latitudes. This is in agreement with previous studies (e.g. Chepfer et al., 2001) which reported that polycrystals and hexagonal columns are the most frequent shapes globally. While Sato and Okamoto (2023) agree on the importance of Voronois and 3D bullets based on CALIPSO data, and on how their relative frequencies evolve with latitude, they report that bullet dominate at all latitudes, even near the equator. Therefore, compared to CALIPSO results, CATS-based results report fewer bullets and more Voronois among the shape mix near the equator, a finding for which we have no explanation at this time. CATS and CALIPSO results agree very well on the importance and latitude dependence of the remaining particle types: droxtals (purple) frequencies are near 0.2 around the equator and drop slightly at higher latitudes, 2D columns (green) are near 0.1 around the equator and increase slightly with latitude, and finally 2D plates are rare everywhere (less than 0.05).
CALIPSO results and ours suggest that Voronoi particles are among the most frequent in high ice clouds. While Lawson et al., 2019 found in presence of strong electrical fields particles visually similar to Voronoi shapes as described by Ishimoto et al. (2012), the majority of complex, irregular crystals documented in cirrus by in situ measurements bear little physical resemblance to Voronoi shapes (e.g., Woods et al., 2018 or Lawson et al., 2019). While Voronois do not appear to accurately represent the shape of most irregular ice particles found in natural tropical cirrus, they may still capture their scattering properties by virtue of their structural complexity, as previously argued for complex polyhedra (Macke, 1993; Mitchell et al., 1996). Voronois thus should be viewed as generic stand-ins for complex, irregular ice crystals.
To sum up, the CATS results shown here generally agree with the CALIPSO results reported in Sato and Okamoto (2023):
-
in low and mid-level clouds, apart from liquid particles which dominate the repartition in the Tropics, the most frequent particle shapes are 3D bullets and 2D columns;
-
high clouds feature mostly 3D bullets and Voronois (the second one being significantly more frequent in the 20° S–20° N band) followed by droxtals, and finally the other types far behind with little latitude dependence;
-
the distribution of particle types is roughly symmetric around the equator, except in mid-level clouds which feature significant asymmetries.
These results appear to be independent of CATS's seasonal or diurnal sampling. In the rest of the paper, we exclude cloud points identified as liquid to focus on ice particles exclusively. The following results have no CALIPSO equivalent that we are aware of at this time.
3.2 Particle type partitioning with temperature
In this section we document how particles are distributed among categories depending on the atmospheric temperature, in three zonal groups: South hemisphere midlatitudes (30–50° S), Tropics (30° S–30° N), and North Hemisphere midlatitudes (30–50° N). We considered separately results obtained with and without incoming sunlight (hereafter called daytime and nighttime results), according to the CATS granule classification.
In nighttime conditions (18:00–06:00 LT, Fig. 3), the partitioning of cloud particle categories according to temperature is very similar in the three zonal regions, and almost exactly the same at midlatitudes in both hemispheres. The fraction of 2D plates (blue) and columns (orange) also decreases with colder temperatures. Although 2D plates remain generally negligible at all temperatures, 2D columns are quite frequent at warm temperatures (∼ 20 % fractions) and remain noticeable even at −80 °C. The importance of 2D columns drops faster in the Tropics (Fig. 3b) compared to midlatitudes (Fig. 3a and c). 3D bullets (green) are present at all temperatures, and dominate the repartition at midlevel temperatures (−30 to −50 °C). At temperatures below −50 °C, they are more frequent in midlatitudes than in the Tropics. Droxtals (red) and Voronois (purple) become more frequent as temperatures get colder. Together, they make for more than half of particles at temperatures below −60 °C in midlatitudes, and below −50 °C in the Tropics.
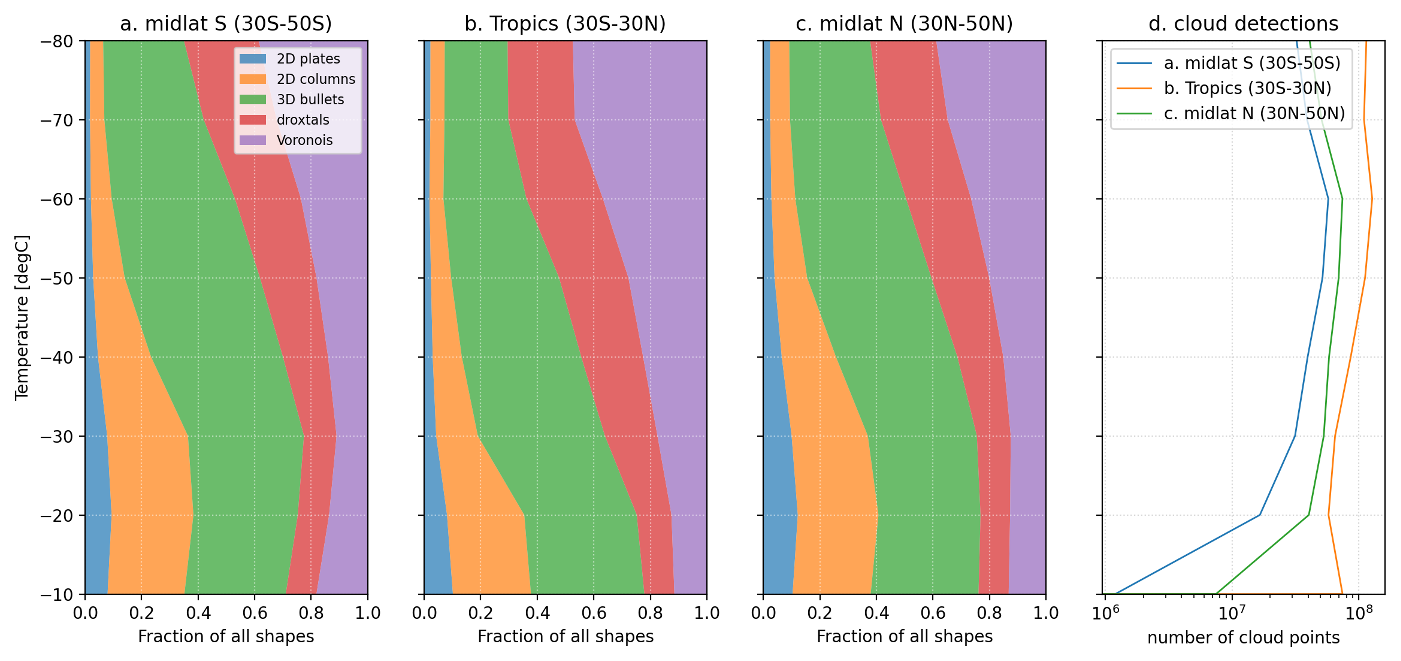
Figure 3Partitioning of cloud particle categories during nighttime (18:00–06:00 LT) in (a) south hemisphere midlatitudes, (b) tropics, and (c) north hemisphere midlatitudes according to temperature. At each temperature the sum of all fractions is unity. (d) Total count of cloud points in the three latitude bands according to temperature.
In daytime conditions (06:00–18:00 LT, Fig. S2), results are very similar. Notable differences include the fraction of 2D plates being generally larger (never exceeding 10 % though) and constant at all temperatures. In the Tropics, the partitioning of cloud particles appears very stable at temperatures colder than −40 °C, with only a limited increase in the frequency of Voronois at the expense of 3D bullets. This behavior is not found in midlatitudes, where results are consistent with those found in nighttime conditions. Day–night differences might be due to noisier depolarization ratio in the CATS daytime data.
3.3 Particle type partitioning with local time
So far, we have presented the variation in the repartition of particle shapes according to latitude (Sect. 3.1) and temperature (Sect. 3.2). Here we investigate how, in each latitude and temperature bin, the relative fraction of each shape changes along a day. From the relative fraction at each hour, we subtracted the daily average from each hourly fraction to compute the diurnal fraction anomaly (DFA) and document its cycle during the day. Figure 4 shows the DFA cycle in the Tropics (30° S–30° N) for each temperature range and particle type (DFA cycles in the North and South midlatitudes are shown in Figs. S3 and S4). In the majority of cases, DFAs feature at least one noticeable maximum, occurring either in daytime (08:00–16:00 LT) or nighttime (20:00–04:00 LT), and a noticeable minimum at the opposite point of the diurnal cycle. The difference between the minimum and the maximum of the DFA is its amplitude. The amplitude in general gets larger at colder temperatures, and flatter at warmer temperatures. In the rest of the section, we focus on this amplitude as an indicator of the diurnal fluctuations of the importance of a given particle shape in the overall mix.
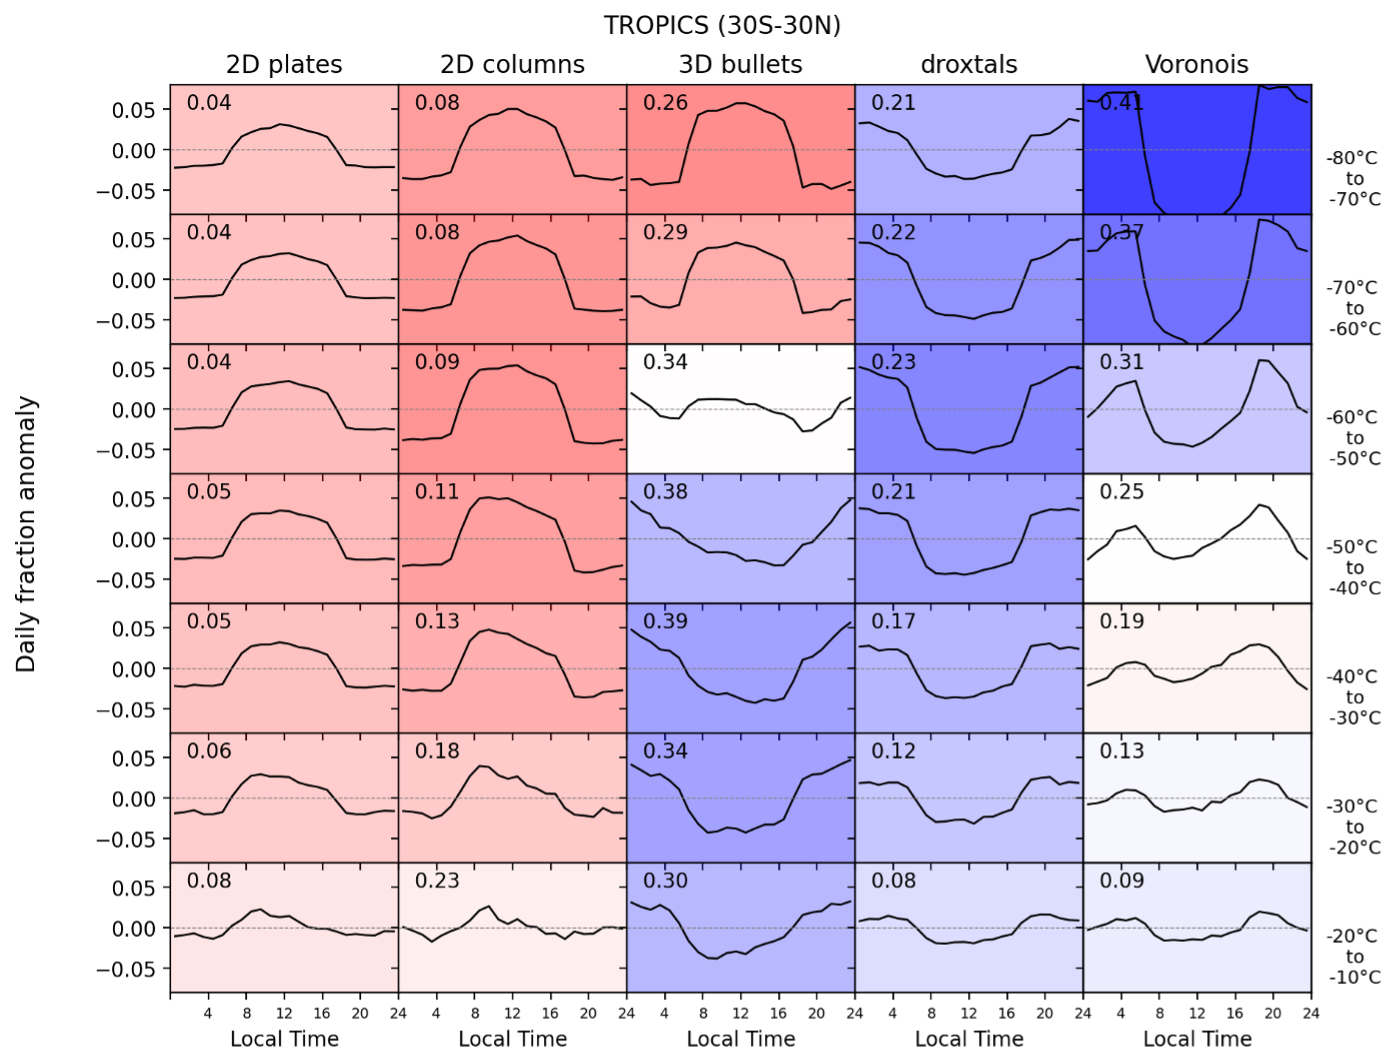
Figure 4Diurnal variation of the fraction anomaly in the Tropics (30° S–30° N) for each particle type (columns) and temperature range (rows). The subplot background color indicates whether the diurnal variation has a maximum during daytime (red) or nighttime (blue). The intensity of the color provides an indication of the nighttime vs. daytime diurnal amplitude. The variations shown here are relative to the daily averages of fractions, which are shown in Fig. 3 according to temperature (Sect. 3.2). As a reminder, for each temperature range and particle type, the daily average fraction is indicated in the top left (the sum of daily fractions is the unity in a given temperature range).
Figure 5 documents the amplitude of DFAs as a function of temperature in the three zonal regions considered so far. The DFA amplitude and the average fraction are not independent: large daily variations of fractions are in general associated with important average fractions.
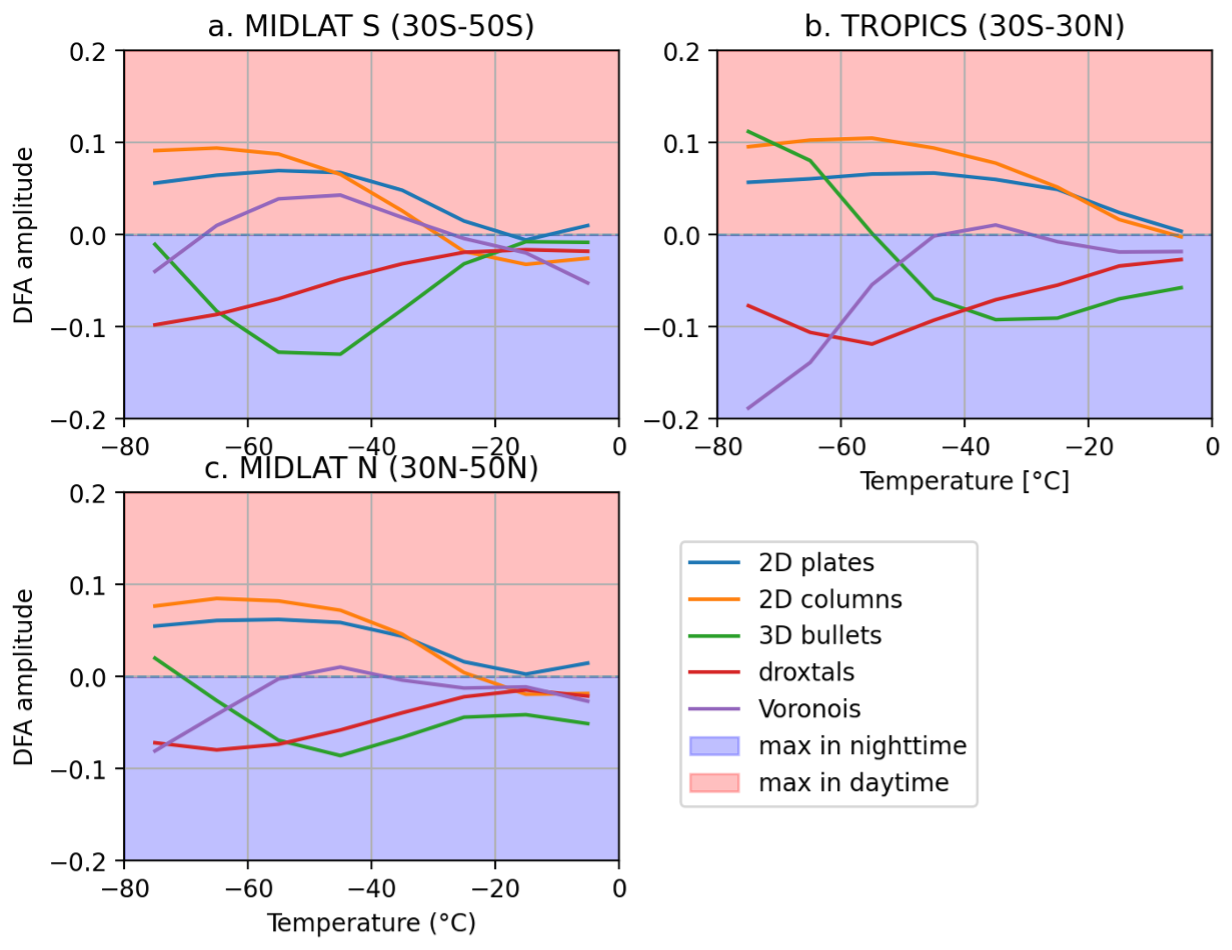
Figure 5Amplitude of the diurnal fraction anomaly (DFA) for each particle type, as a function of temperature, in (a) the South hemisphere midlatitudes, (b) the Tropics, and (c) the North hemisphere midlatitudes (right). The vertical axis is the difference between the minimum and maximum of daily cycles shown in Fig. 4. In areas shaded red, the daily maximum is reached during daytime. In areas shaded blue, the daily maximum is reached during nighttime. For instance, in South midlatitudes (a), at −80 °C, particle types that follow a strong diurnal cycle are 2D plates, 2D columns, and droxtals. These diurnal cycles make 2D plates and columns more frequent during the daytime, and droxtals during the nighttime.
The DFA of 2D plates (blue lines in Fig. 5) and 2D columns (orange) almost always feature a positive amplitude, meaning the fraction of these particles follows a daily cycle with a marked daytime maximum, whatever the temperature. The amplitude of the cycle is largest at cold temperatures and decreases as temperatures get warmer. At the warmest temperatures (−20 to 0 °C), the DFA amplitude of 2D plates reaches 0, meaning the daily cycle gets flat. The DFA amplitude of 2D columns gets slightly negative in midlatitudes (Fig. 5a and c): at warm temperatures their DFA maximum happens during nighttime.
The DFA of 3D bullets (green) also mostly shows a negative amplitude. In midlatitudes, this amplitude reaches furthest away from 0 in the −60 to −40 °C temperature range, and gets quite weak at warmest and coldest temperatures, especially in the South hemisphere (Fig. 5a) where the daily cycle completely disappears. By contrast, in the Tropics, at very cold temperatures, the amplitude gets markedly positive below −60 °C, meaning that in this temperature range the daily cycle reaches its maximum during daytime. 3D bullets are the only particle type that features a transition between a strong daytime maximum (e.g. in the Tropics near −80 °C) and a strong nighttime maximum (e.g. in the Tropics near −30 °C).
The DFA of Droxtals (red) always shows a negative amplitude, which gets closer to 0 at warmer temperatures. This means these particles reach their maximum presence during nighttime, with a strongest diurnal cycle at coldest temperatures.
Finally, the DFA amplitude of Voronois (purple) is generally weak, except when colder than −40 °C in the Tropics. In such conditions, Voronoi particles follow the strongest daily cycle of all particle types, with a strongly marked nighttime maximum. A feature not captured by Fig. 5 is the development for Voronoi particles in the Tropics at temperatures warmer than −40 °C of a more complex cycle (Fig. 4, right column), featuring over a daily period two maxima near 06:00 and 18:00 LT, and two minima near noon and midnight. The amplitude of this unusual, 12 h cycle is quite strong in the Tropics at mid-level temperatures, but gets weaker at warmer temperatures and is almost unnoticeable in midlatitudes (Figs. S3 and S4).
In Sect. 2.2 we mentioned that since, thanks to the absence of solar noise, nighttime measurements have a stronger signal-to-noise ratio, the cloud detection sensitivity is higher at nighttime. Hence, the nighttime dataset includes optically thinner clouds that are not be detectable in daytime. To evaluate the sensitivity of our results to cloud detection performance, we conducted the same analysis as in Sect. 2.2 of the sensitivity of results on detection performance by using a fixed cloud detection threshold. Results (Figs. S5–S7) show that the local time of daily maximum remains the same for all particle shapes in all temperature ranges. However, some daily cycles become more pronounced: most noticeably, at the warmest temperatures (−40 to −10 °C) 3D bullets become more prominent in the nighttime repartition, as do (in a smaller proportion) 2D columns. This happens in all latitude ranges. These changes imply the weak-signal nighttime clouds removed from the studied dataset using a fixed threshold were mostly identified as 3D bullets in variable-threshold detections at this temperature range. Also noticeable is the flattening, at temperatures colder than −30 °C, of the daily cycle for 2D plates. We interpret this change as meaning the weak-signal nighttime clouds removed from the dataset at these temperatures using a fixed detection threshold were lacking 2D plates in variable-threshold cloud detections. There is no significant change in the daily cycle of other particle types. In summary, this comparison suggests that the daily changes in the shape repartition documented in Figs. 4 and 5 are stable with the sensitivity to cloud detection, with the caveat that the retrieved daily amplitude could be under- or overestimated for the particle shapes and temperature ranges mentioned above.
Results from Sect. 3 can be discussed in light of current knowledge about how the cloud thermodynamical environment and processes affect the shape adopted by particles in optically thin clouds. Our results support the idea that temperature plays an important role in driving particle shape. The relationship between temperature and the levels of available ambient moisture (i.e. saturation) can either enable crystal growth or trigger sublimation (Kärcher et al., 2023), both affecting the variety of possible shapes particle can adopt. With colder temperatures we witness a decrease in the importance of pristine particles, in favor of more complex shapes. While 2D plates, columns and bullets make up to 75 % of particles near −10 °C, at coldest temperatures (−80 °C) clouds are almost entirely made of bullets, droxtals and Voronois (Fig. 3). These results are aligned with similar conclusions from observation-based studies which support the idea of increasing complexity with colder temperatures (Bailey and Hallett, 2009; van Diedenhoven, 2018; Okamoto et al., 2020). In situ observations (Baran et al., 2012) and optical retrievals (Forster and Mayer, 2022) have in addition provided evidence for the smallest crystals being found at the coldest temperatures (Baran et al., 2012). This is consistent with our finding droxtal shapes (which small particles can adopt) prominent in shape repartitions near −80 °C, but not with the equal prominence of complex Voronoi shapes in the same temperature range (Fig. 3).
Diurnal cycles of shape repartition (Sect. 3.3) are almost all centred at noon and midnight, which is consistent with the diurnal evolution of cloud amount obtained from satellite retrievals over ocean (Jiang et al., 2015) but not over land where cloudiness appears maximum in the late afternoon (Feofilov and Stubenrauch, 2019). The diurnal cycles found in Sect. 3.3 show that particles associated with warmer temperatures (2D plates and columns) are also more prominent in the daytime particle repartition, while more complex shapes (3D bullet, droxtals and Voronois) are more prominent in the nighttime repartition (Fig. 4). These results are consistent with the idea that the diurnal cycles of particle shape repartition shown in Fig. 4 are primarily a consequence of the diurnal changes in the temperature distribution driven by sunlight – in other words, given a fixed dependence of particle shape on temperature, warmer temperatures just happen to be more frequent during daytime.
In addition to temperature, other factors affect particle shape, for instance atmospheric dynamics: van Diedenhoven et al. (2014) found more plate-like particles on top of deep convective clouds based on retrievals from satellite measurements over the Tropics. These results are consistent with ours, which show an increase in the fraction of 2D plates in the daytime shape repartition – when convection is most active – compared to nighttime. Since convection is driven by solar heat, it is however difficult to distinguish the purely dynamical effects (with particle collision that can lead to aggregation, splintering or fragmentation, Qu et al., 2020) from those from temperature mentioned above. Moreover, we also find an increase in the fraction of other particle shapes during daytime (2D columns, for instance), for which to our knowledge there is no observational evidence. Daytime deep convection can also trigger atmospheric gravity waves, which lead, through homogeneous nucleation, to cirrus clouds with higher crystal number concentrations and ice water content (Atlas and Bretherton, 2023), and affect crystal sedimentation (Podglajen et al., 2018). Ice crystals grown in such conditions would be smaller overall, possibly favoring shapes closer to sphericity like droxtals, but there is to our knowledge no observational evidence for this.
In turn, diurnal differences in the repartition of crystal shapes have consequences for the cloud itself. For instance, the dominant shapes in ice crystals will have an impact on the cloud radiative impact (Järvinen et al., 2023), with shapes favoring horizontal orientation leading to higher albedos (Hirakata et al., 2014). Our result that shows daytime increase in the fraction of such particles (2D plates and columns) implies that, all other parameters being equal, the potential albedo effect of cirrus clouds will be strongest at noon local time. Increase in fraction of horizontally-oriented crystals could also enhance the cloud longwave effects (Stillwell et al., 2019). Horizontally-oriented particles and strongly non-spherical shapes, with slower sedimentation speed, would also take longer to reach subsaturated areas where they can sublimate, leading to longer cloud lifetimes (Jensen et al., 2008). Conversely, complex shapes like Voronois would lead to faster sedimentation speed and shorter cloud lifetimes.
It has long been hinted that measurements of depolarization ratio contain qualitative information on the shape of particles being probed (e.g. Sassen, 1977; Sassen and Campbell, 2001; Noel et al., 2004; Midzak et al., 2020). Okamoto et al. (2019) developed a framework to partition ice cloud particles into 6 categories with different optical signatures and microphysical features, which Sato and Okamoto (2023) applied to CALIPSO observations. Here we applied the framework on 33 months of data from the CATS spaceborne lidar. Statistics on the results have enabled documenting the evolution of this partitioning as a function of local time, latitude and temperature. After confirming that results from CATS were consistent with those from CALIPSO (Sect. 3.1), we showed how particle types in ice cloud transition from a dominance of simple plate-like and columnar particles at warm temperatures (−20 °C and up) to a dominance of more complex shapes (Voronois and droxtals) at coldest temperatures (−60 to −80 °C, Sect. 3.2). This temperature-dependent transition, which has been long suggested by global statistics of depolarization ratio (as in Sassen et al., 2012), appears zonally stable, meaning existing differences in cloud formation processes between the Tropics and midlatitudes only marginally impact the relationship between particle type and temperature. Finally, we documented the daily cycle of the partitioning between particle types in different temperature ranges and zonal regions (Sect. 3.3). Particles whose importance in the shape repartition changes significantly during the day include 2D columns and plates at cold temperatures (daytime maximum), 3D bullets and droxtals at warm temperatures (nighttime maximum), and Voronois at very cold temperatures (nighttime maximum). 3D bullets are the only particles found to have a strong presence in the shape repartition during daytime at coldest temperatures and a strong presence in nighttime at warmest temperatures. As far as we can tell, these results are seasonally stable.
Regarding the limitations of this study, we can start by mentioning the cloud detection scheme. First, this scheme is sensitive to solar illumination, meaning optically thinnest clouds are more numerous in the nighttime dataset. Removing those clouds from the considered dataset does not change our conclusions, and it seems unlikely that additional daytime optically thin clouds that a more sensitive detection could include would exhibit very different particle shapes. In any case, improving cloud detection sensitivity in daytime would be a useful development. Second, averaging and detection process prevents the inclusion of clouds vertically thinner than 2.16 km and horizontally smaller than 9 km. Thus, our results do not apply to e.g., very thin cirrus clouds near the tropopause, which are frequent (Martins et al., 2011; Lesigne et al., 2024) and could present unusual microphysical properties due to a formation process that involves small-scale atmospheric dynamics in subsaturated regions (Kärcher et al., 2024). Future work should include developing classification methodologies specifically suited to these clouds. It is also important to mention that since the classification relies on depolarization thresholds, our confidence in the results depends directly on the robustness of the depolarization ratio provided by CATS. Our experience with CATS data suggests that signal quality is at least comparable to CALIPSO's, but conducting a thorough evaluation of depolarization quality and uncertainties would improve confidence in the results presented here and help better understand their limitations.
Although the results of the present classification appear reasonable and consistent with our understanding of the geographical variability of ice crystal shapes, conclusions would be validated by finding ways to confirm results of the classification process. Future work, therefore, involves confronting such results with other information on particle microphysical properties, for instance from in situ retrievals from airborne or balloon probes. In particular, in situ imagery of Voronois and Droxtal particles, alongside lidar depolarization measurements, would help confirm the validity of the classification and make it more useful. Moreover, even when considering relatively thick ice clouds, it is not unreasonable to suppose that the type of particles within will depend on the processes leading to cloud formation, either convective or stratiform (Reverdy et al., 2012). Future work thus also involves confronting the retrieved particle types with macrophysical or morphological properties of clouds, for instance derived from collocated sun-synchronous satellite instruments (Bouniol et al., 2021). In any case, a primary concern should be to improve consistency between categories of particles based on distinct optical signatures and particle types being implemented in climate and mesoscale atmospheric models, so retrievals from measurements provide useful constraints to simulations (Xu et al., 2023). Finally, future work involves adapting the method presented here to measurements from other spaceborne lidar missions such as EarthCARE (Wehr et al., 2023) whose UV measurements are less affected by sunlight, or from upcoming missions, such as Luce or TOMCAT (Yorks et al., 2023). Combining retrievals from consecutive spaceborne lidar missions, by enabling long-term datasets of microphysical properties of ice clouds, could help identify changes related to anthropogenic climate change (Chepfer et al., 2018).
The CATS Level 1B products (https://doi.org/10.5067/ISS/CATS/L1B_N-M7.2-V3-00, NASA/LARC/SD/ASDC, 2019). For the current study they were analyzed through the AERIS/ICARE service at https://www.aeris-data.fr/icare/ (last access: 20 April 2026).
The supplement related to this article is available online at https://doi.org/10.5194/acp-26-5603-2026-supplement.
VN designed the study, created the figures and wrote the first draft. HC provided guidance on the use of spaceborne lidar datasets. CB provided expertise on cloud microphysics and atmospheric models. JY provided expertise on the analysis of CATS data. HC, CB and JY provided feedback on the manuscript.
The contact author has declared that none of the authors has any competing interests.
Publisher's note: Copernicus Publications remains neutral with regard to jurisdictional claims made in the text, published maps, institutional affiliations, or any other geographical representation in this paper. The authors bear the ultimate responsibility for providing appropriate place names. Views expressed in the text are those of the authors and do not necessarily reflect the views of the publisher.
This research has been supported by the Agence Nationale de la Recherche (ICCARE project (grant-no. ANR-21-CE01-0006)).
This paper was edited by Odran Sourdeval and reviewed by David Mitchell and one anonymous referee.
Atlas, R. and Bretherton, C. S.: Aircraft observations of gravity wave activity and turbulence in the tropical tropopause layer: prevalence, influence on cirrus clouds, and comparison with global storm-resolving models, Atmos. Chem. Phys., 23, 4009–4030, https://doi.org/10.5194/acp-23-4009-2023, 2023.
Bailey, M. P. and Hallett, J.: A Comprehensive Habit Diagram for Atmospheric Ice Crystals: Confirmation from the Laboratory, AIRS II, and Other Field Studies, J. Atmos. Sci., 66, 2888–2899, https://doi.org/10.1175/2009JAS2883.1, 2009.
Baran, A. J., Gayet, J.-F., and Shcherbakov, V.: On the interpretation of an unusual in-situ measured ice crystal scattering phase function, Atmos. Chem. Phys., 12, 9355–9364, https://doi.org/10.5194/acp-12-9355-2012, 2012.
Bouniol, D., Roca, R., Fiolleau, T., and Raberanto, P.: Life cycle resolved observation of radiative properties of mesoscale convective systems, J. Appl. Meteorol. Clim., https://doi.org/10.1175/JAMC-D-20-0244.1, 2021.
Cairo, F., Krämer, M., Afchine, A., Di Donfrancesco, G., Di Liberto, L., Khaykin, S., Lucaferri, L., Mitev, V., Port, M., Rolf, C., Snels, M., Spelten, N., Weigel, R., and Borrmann, S.: A comparative analysis of in situ measurements of high-altitude cirrus in the tropics, Atmos. Meas. Tech., 16, 4899–4925, https://doi.org/10.5194/amt-16-4899-2023, 2023.
Cesana, G., Chepfer, H., Winker, D., Getzewich, B., Cai, X., Jourdan, O., Mioche, G., Okamoto, H., Hagihara, Y., Noel, V., and Reverdy, M.: Using in situ airborne measurements to evaluate three cloud phase products derived from CALIPSO, J. Geophys. Res.-Atmos., 121, 5788–5808, https://doi.org/10.1002/2015JD024334, 2016.
Chepfer, H., Goloub, P., Riedi, J., De Haan, J. F., Hovenier, J. W., and Flamant, P. H.: Ice crystal shapes in cirrus clouds derived from POLDER/ADEOS-1, J. Geophys. Res., 106, 7955–7966, https://doi.org/10.1029/2000JD900285, 2001.
Chepfer, H., Noel, V., Chiriaco, M., Wielicki, B., Winker, D., Loeb, N., and Wood, R.: The Potential of a Multidecade Spaceborne Lidar Record to Constrain Cloud Feedback, J. Geophys. Res.-Atmos., 123, 5433–5454, https://doi.org/10.1002/2017JD027742, 2018.
Chepfer, H., Brogniez, H., and Noel, V.: Diurnal variations of cloud and relative humidity profiles across the tropics, Sci. Rep.-UK, 9, 16045, https://doi.org/10.1038/s41598-019-52437-6, 2019.
Feofilov, A. G. and Stubenrauch, C. J.: Diurnal variation of high-level clouds from the synergy of AIRS and IASI space-borne infrared sounders, Atmos. Chem. Phys., 19, 13957–13972, https://doi.org/10.5194/acp-19-13957-2019, 2019.
Forster, L. and Mayer, B.: Ice crystal characterization in cirrus clouds III: retrieval of ice crystal shape and roughness from observations of halo displays, Atmos. Chem. Phys., 22, 15179–15205, https://doi.org/10.5194/acp-22-15179-2022, 2022.
Gelaro, R., McCarty, W., Suárez, M. J., Todling, R., Molod, A., Takacs, L., Randles, C. A., Darmenov, A., Bosilovich, M. G., Reichle, R., Wargan, K., Coy, L., Cullather, R., Draper, C., Akella, S., Buchard, V., Conaty, A., Da Silva, A. M., Gu, W., Kim, G.-K., Koster, R., Lucchesi, R., Merkova, D., Nielsen, J. E., Partyka, G., Pawson, S., Putman, W., Rienecker, M., Schubert, S. D., Sienkiewicz, M., and Zhao, B.: The Modern-Era Retrospective Analysis for Research and Applications, Version 2 (MERRA-2), J. Climate, 30, 5419–5454, https://doi.org/10.1175/JCLI-D-16-0758.1, 2017.
Gettelman, A., Forbes, R., Marchand, R., Chen, C.-C., and Fielding, M.: The impact of cloud microphysics and ice nucleation on Southern Ocean clouds assessed with single-column modeling and instrument simulators, Geosci. Model Dev., 17, 8069–8092, https://doi.org/10.5194/gmd-17-8069-2024, 2024.
Hagihara, Y., Okamoto, H., and Yoshida, R.: Development of a combined CloudSat-CALIPSO cloud mask to show global cloud distribution, J. Geophys. Res., 115, 2009JD012344, https://doi.org/10.1029/2009JD012344, 2010.
Heymsfield, A. J., Schmitt, C., Bansemer, A., and Twohy, C. H.: Improved Representation of Ice Particle Masses Based on Observations in Natural Clouds, J. Atmos. Sci., 67, 3303–3318, https://doi.org/10.1175/2010JAS3507.1, 2010.
Hirakata, M., Okamoto, H., Hagihara, Y., Hayasaka, T., and Oki, R.: Comparison of Global and Seasonal Characteristics of Cloud Phase and Horizontal Ice Plates Derived from CALIPSO with MODIS and ECMWF, J. Atmos. Ocean. Tech., 31, 2114–2130, https://doi.org/10.1175/JTECH-D-13-00245.1, 2014.
Ishimoto, H., Masuda, K., Mano, Y., Orikasa, N., and Uchiyama, A.: Irregularly shaped ice aggregates in optical modeling of convectively generated ice clouds, J. Quant. Spectrosc. Ra., 113, 632–643, https://doi.org/10.1016/j.jqsrt.2012.01.017, 2012.
Järvinen, E., Van Diedenhoven, B., Magee, N., Neshyba, S., Schnaiter, M., Xu, G., Jourdan, O., Delene, D., Waitz, F., Lolli, S., and Kato, S.: Ice Crystal Complexity and Link to the Cirrus Cloud Radiative Effect, in: Geophysical Monograph Series, edited by: Sullivan, S. C. and Hoose, C., Wiley, 47–85, https://doi.org/10.1002/9781119700357.ch3, 2023.
Jensen, E. J., Pfister, L., Bui, T. V., Lawson, P., Baker, B., Mo, Q., Baumgardner, D., Weinstock, E. M., Smith, J. B., Moyer, E. J., Hanisco, T. F., Sayres, D. S., Clair, J. M. St., Alexander, M. J., Toon, O. B., and Smith, J. A.: Formation of large (≃100 µm) ice crystals near the tropical tropopause, Atmos. Chem. Phys., 8, 1621–1633, https://doi.org/10.5194/acp-8-1621-2008, 2008.
Jiang, J. H., Su, H., Zhai, C., Janice Shen, T., Wu, T., Zhang, J., Cole, J. N. S., Von Salzen, K., Donner, L. J., Seman, C., Del Genio, A., Nazarenko, L. S., Dufresne, J.-L., Watanabe, M., Morcrette, C., Koshiro, T., Kawai, H., Gettelman, A., Millán, L., Read, W. G., Livesey, N. J., Kasai, Y., and Shiotani, M.: Evaluating the Diurnal Cycle of Upper-Tropospheric Ice Clouds in Climate Models Using SMILES Observations, J. Atmos. Sci., 72, 1022–1044, https://doi.org/10.1175/JAS-D-14-0124.1, 2015.
Kärcher, B., Jensen, E. J., Pokrifka, G. F., and Harrington, J. Y.: Ice Supersaturation Variability in Cirrus Clouds: Role of Vertical Wind Speeds and Deposition Coefficients, J. Geophys. Res.-Atmos., 128, e2023JD039324, https://doi.org/10.1029/2023JD039324, 2023.
Kärcher, B., Hoffmann, F., Podglajen, A., Hertzog, A., Pluogonven, R., Atlas, R., Corcos, M., Grabowski, W. W., and Gasparini, B.: Effects of Turbulence on Upper-Tropospheric Ice Supersaturation, J. Atmos. Sci., 81, 1589–1604, https://doi.org/10.1175/JAS-D-23-0217.1, 2024.
Krämer, M., Rolf, C., Luebke, A., Afchine, A., Spelten, N., Costa, A., Meyer, J., Zöger, M., Smith, J., Herman, R. L., Buchholz, B., Ebert, V., Baumgardner, D., Borrmann, S., Klingebiel, M., and Avallone, L.: A microphysics guide to cirrus clouds – Part 1: Cirrus types, Atmos. Chem. Phys., 16, 3463–3483, https://doi.org/10.5194/acp-16-3463-2016, 2016.
Lawson, R. P., Woods, S., Jensen, E., Erfani, E., Gurganus, C., Gallagher, M., Connolly, P., Whiteway, J., Baran, A. J., May, P., Heymsfield, A., Schmitt, C. G., McFarquhar, G., Um, J., Protat, A., Bailey, M., Lance, S., Muehlbauer, A., Stith, J., Korolev, A., Toon, O. B., and Krämer, M.: A Review of Ice Particle Shapes in Cirrus formed In Situ and in Anvils, J. Geophys. Res.-Atmos., 124, 10049–10090, https://doi.org/10.1029/2018JD030122, 2019.
Lesigne, T., Ravetta, F., Podglajen, A., Mariage, V., and Pelon, J.: Extensive coverage of ultrathin tropical tropopause layer cirrus clouds revealed by balloon-borne lidar observations, Atmos. Chem. Phys., 24, 5935–5952, https://doi.org/10.5194/acp-24-5935-2024, 2024.
Letu, H., Ishimoto, H., Riedi, J., Nakajima, T. Y., C.-Labonnote, L., Baran, A. J., Nagao, T. M., and Sekiguchi, M.: Investigation of ice particle habits to be used for ice cloud remote sensing for the GCOM-C satellite mission, Atmos. Chem. Phys., 16, 12287–12303, https://doi.org/10.5194/acp-16-12287-2016, 2016.
Li, M., Letu, H., Peng, Y., Ishimoto, H., Lin, Y., Nakajima, T. Y., Baran, A. J., Guo, Z., Lei, Y., and Shi, J.: Investigation of ice cloud modeling capabilities for the irregularly shaped Voronoi ice scattering models in climate simulations, Atmos. Chem. Phys., 22, 4809–4825, https://doi.org/10.5194/acp-22-4809-2022, 2022.
Macke, A.: Scattering of light by polyhedral ice crystals, Appl. Optics, 32, 2780, https://doi.org/10.1364/AO.32.002780, 1993.
Magee, N., Boaggio, K., Staskiewicz, S., Lynn, A., Zhao, X., Tusay, N., Schuh, T., Bandamede, M., Bancroft, L., Connelly, D., Hurler, K., Miner, B., and Khoudary, E.: Captured cirrus ice particles in high definition, Atmos. Chem. Phys., 21, 7171–7185, https://doi.org/10.5194/acp-21-7171-2021, 2021.
Martins, E., Noel, V., and Chepfer, H.: Properties of cirrus and subvisible cirrus from nighttime Cloud-Aerosol Lidar with Orthogonal Polarization (CALIOP), related to atmospheric dynamics and water vapor, J. Geophys. Res., 116, D02208, https://doi.org/10.1029/2010JD014519, 2011.
Midzak, N., Yorks, J. E., Zhang, J., Van Diedenhoven, B., Woods, S., and McGill, M.: A Classification of Ice Crystal Habits Using Combined Lidar and Scanning Polarimeter Observations during the SEAC4RS Campaign, J. Atmos. Ocean. Tech., 37, 2185–2196, https://doi.org/10.1175/JTECH-D-20-0037.1, 2020.
Mitchell, D. L., Liu, Y., and Macke, A.: Modeling Cirrus Clouds. Part II: Treatment of Radiative Properties, J. Atmos. Sci., 53, 2967–2988, https://doi.org/10.1175/1520-0469(1996)053<2967:MCCPIT>2.0.CO;2, 1996.
NASA/LARC/SD/ASDC: CATS-ISS Level 1B Night Mode 7.2 Version 3-00, NASA Langley Atmospheric Science Data Center DAAC [data set], https://doi.org/10.5067/ISS/CATS/L1B_N-M7.2-V3-00, 2019.
Noel, V. and Sassen, K.: Study of Planar Ice Crystal Orientations in Ice Clouds from Scanning Polarization Lidar Observations, J. Appl. Meteorol., 44, 653–664, https://doi.org/10.1175/JAM2223.1, 2005.
Noel, V., Winker, D. M., McGill, M., and Lawson, P.: Classification of particle shapes from lidar depolarization ratio in convective ice clouds compared to in situ observations during CRYSTAL-FACE, J. Geophys. Res., 109, 2004JD004883, https://doi.org/10.1029/2004JD004883, 2004.
Noel, V., Chepfer, H., Chiriaco, M., and Yorks, J.: The diurnal cycle of cloud profiles over land and ocean between 51° S and 51° N, seen by the CATS spaceborne lidar from the International Space Station, Atmos. Chem. Phys., 18, 9457–9473, https://doi.org/10.5194/acp-18-9457-2018, 2018.
Okamoto, H., Sato, K., Borovoi, A., Ishimoto, H., Masuda, K., Konoshonkin, A., and Kustova, N.: Interpretation of lidar ratio and depolarization ratio of ice clouds using spaceborne high-spectral-resolution polarization lidar, Opt. Express, 27, 36587, https://doi.org/10.1364/OE.27.036587, 2019.
Okamoto, H., Sato, K., Borovoi, A., Ishimoto, H., Masuda, K., Konoshonkin, A., and Kustova, N.: Wavelength dependence of ice cloud backscatter properties for space-borne polarization lidar applications, Opt. Express, 28, 29178, https://doi.org/10.1364/OE.400510, 2020.
Pauly, R. M., Yorks, J. E., Hlavka, D. L., McGill, M. J., Amiridis, V., Palm, S. P., Rodier, S. D., Vaughan, M. A., Selmer, P. A., Kupchock, A. W., Baars, H., and Gialitaki, A.: Cloud-Aerosol Transport System (CATS) 1064 nm calibration and validation, Atmos. Meas. Tech., 12, 6241–6258, https://doi.org/10.5194/amt-12-6241-2019, 2019.
Podglajen, A., Plougonven, R., Hertzog, A., and Jensen, E.: Impact of gravity waves on the motion and distribution of atmospheric ice particles, Atmos. Chem. Phys., 18, 10799–10823, https://doi.org/10.5194/acp-18-10799-2018, 2018.
Qu, Y., Khain, A., Phillips, V., Ilotoviz, E., Shpund, J., Patade, S., and Chen, B.: The Role of Ice Splintering on Microphysics of Deep Convective Clouds Forming Under Different Aerosol Conditions: Simulations Using the Model With Spectral Bin Microphysics, J. Geophys. Res.-Atmos., 125, e2019JD031312, https://doi.org/10.1029/2019JD031312, 2020.
Reverdy, M., Noel, V., Chepfer, H., and Legras, B.: On the origin of subvisible cirrus clouds in the tropical upper troposphere, Atmos. Chem. Phys., 12, 12081–12101, https://doi.org/10.5194/acp-12-12081-2012, 2012.
Sassen, K.: Ice Crystal Habit Discrimination with the Optical Backscatter Depolarization Technique, J. Appl. Meteorol., 16, 425–431, https://doi.org/10.1175/1520-0450(1977)016<0425:ICHDWT>2.0.CO;2, 1977.
Sassen, K. and Campbell, J. R.: A Midlatitude Cirrus Cloud Climatology from the Facility for Atmospheric Remote Sensing. Part I: Macrophysical and Synoptic Properties, J. Atmos. Sci., 58, 481–496, https://doi.org/10.1175/1520-0469(2001)058<0481:AMCCCF>2.0.CO;2, 2001.
Sassen, K., Kayetha, V. K., and Zhu, J.: Ice cloud depolarization for nadir and off‐nadir CALIPSO measurements, Geophys. Res. Lett., 39, 2012GL053116, https://doi.org/10.1029/2012GL053116, 2012.
Sato, K. and Okamoto, H.: Global Analysis of Height-Resolved Ice Particle Categories From Spaceborne Lidar, Geophys. Res. Lett., 50, e2023GL105522, https://doi.org/10.1029/2023GL105522, 2023.
Sellitto, P., Bucci, S., and Legras, B.: Comparison of ISS–CATS and CALIPSO–CALIOP Characterization of High Clouds in the Tropics, Remote Sens.-Basel, 12, 3946, https://doi.org/10.3390/rs12233946, 2020.
Shaw, T. A., Baldwin, M., Barnes, E. A., Caballero, R., Garfinkel, C. I., Hwang, Y.-T., Li, C., O'Gorman, P. A., Rivière, G., Simpson, I. R., and Voigt, A.: Storm track processes and the opposing influences of climate change, Nat. Geosci., 9, 656–664, https://doi.org/10.1038/ngeo2783, 2016.
Stillwell, R. A., Neely, R. R., Thayer, J. P., Walden, V. P., Shupe, M. D., and Miller, N. B.: Radiative Influence of Horizontally Oriented Ice Crystals over Summit, Greenland, J. Geophys. Res.-Atmos., 124, 12141–12156, https://doi.org/10.1029/2018JD028963, 2019.
Taufour, M., Pinty, J.-P., Barthe, C., Vié, B., and Wang, C.: LIMA (v2.0): A full two-moment cloud microphysical scheme for the mesoscale non-hydrostatic model Meso-NH v5-6, Geosci. Model Dev., 17, 8773–8798, https://doi.org/10.5194/gmd-17-8773-2024, 2024.
van Diedenhoven, B.: Remote Sensing of Crystal Shapes in Ice Clouds, in: Springer Series in Light Scattering, edited by: Kokhanovsky, A., Springer International Publishing, Cham, 197–250, https://doi.org/10.1007/978-3-319-70808-9_5, 2018.
van Diedenhoven, B., Fridlind, A. M., Cairns, B., and Ackerman, A. S.: Variation of ice crystal size, shape, and asymmetry parameter in tops of tropical deep convective clouds, J. Geophys. Res.-Atmos., 119, 11809–11825, https://doi.org/10.1002/2014JD022385, 2014.
Wehr, T., Kubota, T., Tzeremes, G., Wallace, K., Nakatsuka, H., Ohno, Y., Koopman, R., Rusli, S., Kikuchi, M., Eisinger, M., Tanaka, T., Taga, M., Deghaye, P., Tomita, E., and Bernaerts, D.: The EarthCARE mission – science and system overview, Atmos. Meas. Tech., 16, 3581–3608, https://doi.org/10.5194/amt-16-3581-2023, 2023.
Winker, D. M., Vaughan, M. A., Omar, A., Hu, Y., Powell, K. A., Liu, Z., Hunt, W. H., and Young, S. A.: Overview of the CALIPSO Mission and CALIOP Data Processing Algorithms, J. Atmos. Ocean. Tech., 26, 2310–2323, https://doi.org/10.1175/2009JTECHA1281.1, 2009.
Woods, S., Lawson, R. P., Jensen, E., Bui, T. P., Thornberry, T., Rollins, A., Pfister, L., and Avery, M.: Microphysical Properties of Tropical Tropopause Layer Cirrus, J. Geophys. Res.-Atmos., 123, 6053–6069, https://doi.org/10.1029/2017JD028068, 2018.
Xu, G., Waitz, F., Wagner, S., Nehlert, F., Schnaiter, M., and Järvinen, E.: Toward Better Constrained Scattering Models for Natural Ice Crystals in the Visible Region, J. Geophys. Res.-Atmos., 128, e2022JD037604, https://doi.org/10.1029/2022JD037604, 2023.
Yang, P., Baum, B. A., Heymsfield, A. J., Hu, Y. X., Huang, H.-L., Tsay, S.-C., and Ackerman, S.: Single-scattering properties of droxtals, J. Quant. Spectrosc. Ra., 79–80, 1159–1169, https://doi.org/10.1016/S0022-4073(02)00347-3, 2003.
Yorks, J. E., McGill, M. J., Palm, S. P., Hlavka, D. L., Selmer, P. A., Nowottnick, E. P., Vaughan, M. A., Rodier, S. D., and Hart, W. D.: An overview of the CATS level 1 processing algorithms and data products, Geophys. Res. Lett., 43, 4632–4639, https://doi.org/10.1002/2016GL068006, 2016.
Yorks, J. E., Wang, J., McGill, M. J., Follette-Cook, M., Nowottnick, E. P., Reid, J. S., Colarco, P. R., Zhang, J., Kalashnikova, O., Yu, H., Marenco, F., Santanello, J. A., Weckwerth, T. M., Li, Z., Campbell, J. R., Yang, P., Diao, M., Noel, V., Meyer, K. G., Carr, J. L., Garay, M., Christian, K., Bennedetti, A., Ring, A. M., Crawford, A., Pavolonis, M. J., Aquila, V., Kim, J., and Kondragunta, S.: A SmallSat Concept to Resolve Diurnal and Vertical Variations of Aerosols, Clouds, and Boundary Layer Height, B. Am. Meteorol. Soc., 104, E815–E836, https://doi.org/10.1175/BAMS-D-21-0179.1, 2023.
Yoshida, R., Okamoto, H., Hagihara, Y., and Ishimoto, H.: Global analysis of cloud phase and ice crystal orientation from Cloud-Aerosol Lidar and Infrared Pathfinder Satellite Observation (CALIPSO) data using attenuated backscattering and depolarization ratio, J. Geophys. Res., 115, 2009JD012334, https://doi.org/10.1029/2009JD012334, 2010.