the Creative Commons Attribution 4.0 License.
the Creative Commons Attribution 4.0 License.
 | 23 Apr 2026
Impact of the Chinese Spring Festival on PM2.5 air quality in the Beijing-Tianjin-Hebei and surrounding region: a machine learning-based counterfactual modeling approach
Yuan Li
Wubin Zhu
Xuan Liu
Jiandong Shen
Renchang Yan
Yunshan Li
Jing Ding
Young Su Lee
Yufen Zhang
Acute short-term exposure to extremely high PM2.5 levels posed serious health risks. Human culture-based festival activities can significantly alter emission patterns, often leading to sharp yet understudied fluctuations in air quality. The Chinese Spring Festival (CSF), marked by large-scale family reunions and widespread use of fireworks, raises air pollution concerns. Commonly, this effect is quantified using receptor models or chemical transport models, but the relevant chemical component data and emission inventories are often lacking. This study presents a machine learning counterfactual approach to quantify PM2.5 changes associated with holiday activities. The results align well with traditional chemical composition-based estimates of fireworks contributions, highlighting the strong potential of using widely accessible routine monitoring data to quantify source contributions driven by specific interventions. Applied to 28 major cities in the Beijing-Tianjin-Hebei and surrounding region, one of the most polluted areas in China, the approach revealed an average PM2.5 reduction of 19.0 ± 17.5 µg m−3 during the full 2025 CSF holiday period. Despite this regional mean decrease, short-lived but extremely high PM2.5 peaks were observed in several cities during the peak fireworks window, with fireworks contributing ≥ 35 % of first-day severe PM2.5 deterioration and up to 89 % in the city of Baoding. This approach offers a robust tool for evaluating holiday emissions and guiding air quality interventions.
- Article
(3372 KB) - Full-text XML
-
Supplement
(2149 KB) - BibTeX
- EndNote


Fine particulate matter (PM2.5) pollution remains a major global environmental issue, adversely affecting visibility, air quality, human health, and climate change (Pui et al., 2014; Pye et al., 2021; Yang et al., 2020). Although annual mean PM2.5 concentrations in major economies such as the USA, Europe and China have significantly declined over the past decades (Li et al., 2023), severe air pollution events characterized by high PM2.5 concentrations still occur frequently in many regions especially during cold seasons in the Northern Hemisphere (Yin et al., 2019). These events pose a substantial short-term exposure risk to human health. In addition to the unfavorable meteorological conditions during autumn and winter lead to the accumulation of pollutants, aperiodic elevation of source emissions (e.g., natural dust storm, biomass burning, and wildfire) can also cause poor PM2.5 air quality. Understanding the causes and sources of short-term air pollution events is crucial for informing emergency mitigation policies aimed at protecting the public from high exposure risks.
Cultural events that associated with changes in economic activities and human social behavior patterns often shape air quality as well (Hua et al., 2021; Huang et al., 2024; Wei et al., 2022). Among which, the Chinese Spring Festival (CSF), the most significant traditional festival in Chinese culture, is featured by increased indoor family gatherings, reduced road traffic, and celebratory activities such as fireworks and firecrackers. During this period, a distinct “holiday effect” is observed in air quality variations, often marked by a decline in nitrogen oxide (NOx) levels and complex changes in PM2.5 concentrations (Li et al., 2021; Dai et al., 2021a; Wu et al., 2022). Severe air pollution has been widely observed across Chinese cities during Lunar New Year's Eve, due to the fireworks emissions (Dai et al., 2021a; Jiang et al., 2015; Lai and Brimblecombe, 2017, 2020). Reported data indicate that on the first day of the 2024 Lunar New Year, hourly PM2.5 concentrations exceeded 150 µg m−3 in over 250 cities across China (https://www.cenews.com.cn/media-article.html?aid=26801&mediaID=1732, last access: 31 March 2026). In 66 of these cities, concentrations surpassed 500 µg m−3, while in 10 cities they exceeded 1000 µg m−3. Such extremely high PM2.5 levels raised serious concerns about the short-term health risks associated with acute exposure. Traditionally, identifying and apportioning festival-related sources of PM2.5 (e.g., fireworks emissions) has primarily relied on aerosol chemical composition data for receptor modeling or emission inventory data for chemical transport models (Gao et al., 2018; Tian et al., 2014; Zhou et al., 2022). However, such data are often lacking in many cities, where there is an urgent need to evaluate such a holiday effect. Dai et al. (2021a) estimated changes in the emission strengths of air pollutants during the CSF holiday period in major Chinese cities by decoupling meteorological influences from their ambient concentrations, but our understanding of air quality changes attributable to the CSF – especially regarding shifts in emission strengths – remains inadequate due to the absence of effective evaluation approaches.
Machine learning (ML) has been popular for inferring causal-effect relations from observational data across many fields (Han et al., 2022; Leist et al., 2022; Prosperi et al., 2020). In this work, we develop an ML-based counterfactual modeling framework that is causally informed but not intended to identify strict causal effects, and that quantifies changes in PM2.5 air quality and emission strength associated with short-term interventions such as the CSF under a business-as-usual (BAU) scenario (Fig. 1). The approach involves training ML models on data excluding the intervention period to simulate air quality under a counterfactual BAU emissions scenario, thereby isolating the impact of short-term interventions. We first employed an ML-based regression model to predict the counterfactual, unobservable PM2.5 levels under the assumption that the CSF did not occur. Both factual and counterfactual PM2.5 levels were then re-predicted under average meteorological conditions during the study period to adjust for time-varying meteorological fluctuations, thereby revealing changes in emission strength. Differences between the real observations and the modeled counterfactual levels were attributed to the impact of the CSF holiday. Using in-situ measurement data from Hangzhou, China, the ML modeled CSF holiday effect was validated against PM2.5 source contributions estimated via dispersion normalized positive matrix factorization (DN-PMF) based on continuous online measurements of PM2.5 chemical composition. The validated approach was then applied to quantify the changes in both PM2.5 emission strength and ambient air quality attributable to the CSF in a key region of Northern China (Beijing-Tianjin and the surrounding 26 major cities), which experienced severe air pollution in past decade as well as the 2025 holiday period. Our study aims to provide a simple and efficient evaluation framework that is broadly applicable for assessing air quality intervention policies.
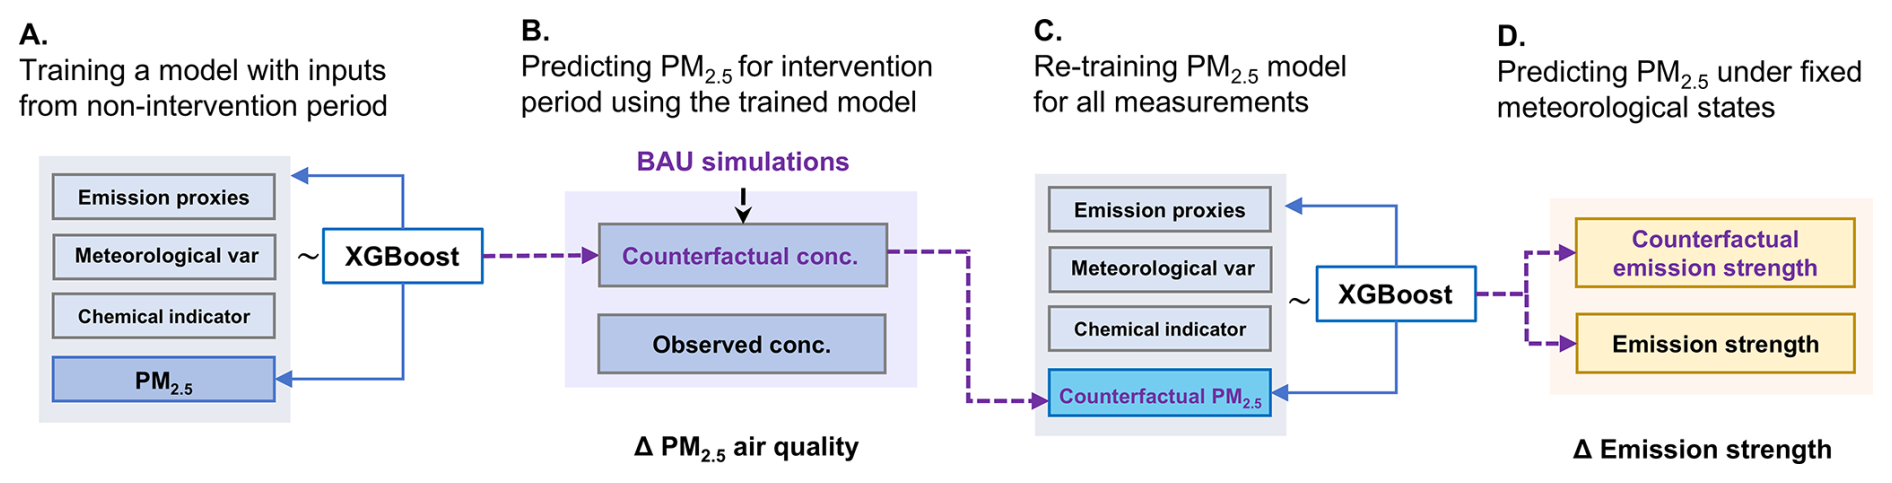
Figure 1The flowchart includes four major steps: (A) PM2.5 air quality modeling based on the non-intervention period, (B) counterfactual prediction of PM2.5 concentrations for the intervention period using the pre-trained model, (C) re-training PM2.5 air quality model for all measurements using factual and counterfactual PM2.5 data, and (D) predicting PM2.5 under fixed meteorological conditions. Differences between observed PM2.5 and modeled counterfactual levels are the holiday-attributable air quality changes. Correspondingly, differences between meteorology-fixed PM2.5 for factual and counterfactual scenarios are the holiday-attributable emission changes.
2.1 Data sources
The PM2.5 chemical composition data were obtained from the Wolongqiao Automatic Particulate Matter Monitoring Station in Hangzhou, Zhejiang Province, located within the Hangzhou Flower Nursery (30.2456° N, 120.1269° E) in the Xihu District downtown area. The dataset covers the period from 20 December 2023 to 20 February 2024, and includes measurements of carbonaceous components (organic carbon, OC, and elemental carbon, EC), water-soluble ions (NO, SO, NH, Mg2+), and trace elements (Fe, K, Cl, Ca, Zn, Pb, Mn, Si, Cu, As, Cr, V, Ba, Ni). The analytical instruments/methods, method detection limits (MDLs), and uncertainty (error fractions) for these PM2.5 chemical species used as PMF inputs are summarized in Table S1 in the Supplement. Organic carbon (OC) comprises both primary organic carbon (POC), directly emitted from emission sources, and secondary organic carbon (SOC), formed through atmospheric reactions of gaseous precursors. Following the methodology described by Dai et al. (2018), we applied the minimum ratio method to separate OC into POC and SOC. However, because primary emission characteristics may change during the Spring Festival, SOC estimated using the minimum ratio (EC-tracer) approach may carry higher uncertainty. We therefore examined the period dependence of ()min by calculating the 10th-percentile ratio separately for the periods before and after Lunar New Year's Eve (pre-eve: 3.10; post-eve: 3.13; full period: 3.10). The deduced EC-tracer-based SOC is included as an input variable in the PMF analysis to help represent the secondary organic component. Nevertheless, potential non-stationarity of primary emissions during the Spring Festival may introduce additional uncertainty, and related results are interpreted with caution.
Hourly air pollutant data were collected from the China National Environmental Monitoring Center (CNEMC) data sharing platform (available at https://quotsoft.net/air/, last access: 31 March 2026) for Hangzhou, using the average PM2.5 concentration from ground-based observations at all national monitoring stations in Hangzhou. This study focuses on the “2 + 26” cities designated by the Chinese government for intensive air pollution control, including Beijing, Tianjin, and 26 major cities in the surrounding provinces of Hebei, Henan, Shandong, and Shanxi. Thus, hourly PM2.5 concentrations were also downloaded for the “2 + 26” cities.
The meteorological data for each of the studied cities, as shown in Table S2, were obtained from the ERA5 dataset, the fifth-generation global climate atmospheric reanalysis product provided by the European Centre for Medium-Range Weather Forecasts (ECMWF). Based on the Hybrid Single-Particle Lagrangian Integrated Trajectory Model (HYSPLIT), 72 h backward air mass trajectory analysis was conducted at 100 m a.g.l. (Hou et al., 2022). This analysis classified high-altitude air masses into six trajectory clusters, representing distinct regional pollutant origins, with trajectory lengths indicating transport distances (i.e., the spatial range of external pollutant contributions to the local area). These regional transport variables, together with local meteorological conditions, atmospheric photochemical oxidants (Ox, NO2+ O3), and temporal predictors, were subsequently incorporated into the statistical modeling of ambient air pollutant concentrations. More details are provided in Sect. S1, where preprocessing of the downloaded ERA5 meteorological variables is described, and in Sect. S2, where the representativeness of the ERA5 meteorological data is evaluated.
2.2 ML-Based counterfactual PM2.5 air quality predictions for the CSF under BAU emission scenario
To predict the ambient PM2.5 concentrations during the overnight pollution period (from 9–10 February 2024) without the influence of the CSF-related emission changes, we first employed the XGBoost algorithm, chosen for its superior fitting accuracy, to train on data from non-pollution periods (i.e., periods without interventions) in the original dataset. The trained PM2.5 model was then used to predict the counterfactual PM2.5 concentrations during the pollution period with inputs of observed meteorological and temporal variables, simulating an air quality under BAU emission scenario (Han et al., 2022). The differences between observed PM2.5 concentrations and predicted counterfactual PM2.5 levels during pollution periods represent the `holiday effect' on air quality (Fig. 1). When the entire CSF period is defined as the intervention period, the overall impact of the Spring Festival on air pollution can also be assessed accordingly. The modeling incorporated temporal variables (Unix time for linear trends, day of the year for annual and seasonal cycles, day of the week for weekly patterns, hour of the day for diurnal variations, and lunar calendar day for festival-related emissions, as suggested by existing literature (e.g., Dai et al., 2021a, 2023), meteorological parameters (wind speed/direction, temperature, relative humidity, surface pressure, mixing layer height, total cloud cover, solar radiation, precipitation), chemical variables, and backward air mass trajectories with lengths to quantify regional transport influences – all of which align with the variables required for subsequent meteorological normalization. In the XGBoost modeling process, 80 % of the data was allocated for training and 20 % for testing. Model hyperparameters were optimized using Bayesian optimization (Optuna, version 4.5.0), with a 5-fold cross-validation strategy on the training set. The detailed model configuration and settings are provided in Sect. S3, where the corresponding learning curve analysis (Fig. S1), the ML model predictive uncertainty (Fig. S2), and the SHAP summary plots (Fig. S3) are also discussed. The code and data used for this study are available in Zenodo (Li, 2026; see also the Code and data availability section).
It is important to note that the CSF constitutes a composite intervention that involves multiple simultaneous behavioral and emission changes. These include fireworks emissions, reductions in traffic activity, and adjustments in industrial or construction operations. Because of this complexity, the key identification assumptions required for strict causal inference cannot be fully validated in this setting. Examples include the assumptions of conditional independence, adequate covariate overlap between treated and untreated periods, and the absence of confounding between the intervention and the covariates. In particular, calendar-related variables such as the lunar-day index are inherently tied to the intervention and therefore cannot be treated as independent adjustment covariates. Given these considerations, the proposed framework is not intended to provide a structural causal estimate. Instead, we adopt a causally informed counterfactual modeling perspective that focuses on estimating the deviation of observed PM2.5 from a machine-learning-based BAU scenario. This framing maintains conceptual consistency with the data-generating process and allows the analysis to remain rigorous without overstating causal claims.
2.3 ML-Based meteorology-fixed PM2.5 prediction technique
Changes in air pollutant emission strengths can be estimated by decoupling the meteorological variability from observed air pollutant time series (Ding et al., 2023), which can be achieved by a ML-based meteorological normalization technique (Dai et al., 2023; Grange et al., 2018; Shi et al., 2021; Vu et al., 2019). The method assumes that the ambient PM2.5 concentration Xi(t) in city i is a function of both the emission intensity Ei(t) and meteorological conditions Mi(t) [including local meteorology, regional transport meteorology, and chemistry]:
where εi(t) is the residual term. A tree-based random forest algorithm was commonly employed to train the model using observational data. Time-related variables were selected to capture periodic variations in emissions and atmospheric processes. The selected time-related variables include Unix time (seconds since 1 January 1970, 00:00:00 UTC), day of the year, day of the week, hour of the day, and lunar calendar day to incorporate the influence of traditional festivals on emission patterns. Meteorological parameters such as wind speed, wind direction, temperature, relative humidity, surface pressure, mixing layer height, total cloud cover, surface net solar radiation, and precipitation were also included. Additionally, backward air mass trajectories and their lengths were added to indicate potential regional transport influences. The model f, describing the relationship between PM2.5 concentration, emissions, and meteorological conditions, is expressed as:
To smooth the meteorologically-induced “noise” in observations, the PM2.5 concentration contributed at time t was adjusted by selecting N sets of consistent meteorological variables from the training dataset and reconstructing a new explanatory dataset (replacing the original meteorological variables). The model f was then applied to predict the pollutant concentration under these N consistent meteorological conditions, and the arithmetic mean of these predictions was taken as the adjusted concentration Xi(t)adj under fixed meteorological conditions, as demonstrated in Dai et al. (2026):
We applied meteorology-fixed prediction technique to adjust both the observed PM2.5 concentrations and the predicted counterfactual PM2.5 concentrations during the CSF. Differences between the normalized real observed and counterfactual PM2.5 are attributed to holiday-related emission strength changes.
2.4 DN-PMF modelling of festival-related source contributions
Based on the principle of chemical mass balance, PMF extracts factors by identifying the covariance (co-variation) of multiple linearly additive observed component variables over time (Dai et al., 2020; Paatero and Tapper, 1994). The measured mass concentration Xij (µg m−3) of the jth chemical species in the ith receptor sample can be expressed as:
Where fkj (µg µg−1) represents the mass fraction of the jth species in the kth source (constrained to non-negative values), gik (µg m−3) is the contribution concentration of the kth source to the ith receptor sample (also non-negative), p is the number of source categories, and eij is the residual between the measured and modeled mass concentrations for the ijth sample. The input components include POC, SOC, EC, NO, SO, NH, K+, Cl−, Si, Ca, Cr, Mn, Fe, Ni, Cu, Zn, As, and Pb. Uncertainties associated with the input data were set following the approach of previous work (Brown et al., 2015; Dai et al., 2020). The Dispersion Normalized PMF (DN-PMF) was utilized to reduce the impacts of meteorological dispersion on the source emissions induced covariance (Dai et al., 2020, 2021b; Yang et al., 2022). The chemical component monitoring data and their uncertainty matrices are normalized to the average ventilation coefficient (VC, as a measure of atmospheric dispersion capacity) over the study period, effectively deconvolving “noise” caused by meteorological dispersion. The dispersion normalized concentration CVC, i for the ith sample is given by:
where MLHi is the mixing layer height at the time of the ith sample, and ui is the ground-level wind speed at that time.
3.1 Source apportionment results of PM2.5 for the 2024 CSF haze episode in Hangzhou, China
DN-PMF analysis was applied to the PM2.5 chemical composition dataset collected in Hangzhou from 20 December 2023 to 20 February 2024. An optimal nine-factor solution was obtained, with small, normally distributed residuals, demonstrating good model performance (Table S3). The robustness of this solution was further validated through bootstrap diagnostics across solutions with six to ten factors. Specifically, the nine-factor solution exhibited the highest bootstrap mapping stability (96 %–100 %) and no unmapped factors, confirming it as the most stable and interpretable among all tested solutions. Based on diagnostic tracers, chemical profiles, and temporal signatures, the resolved factors were interpreted as coal combustion, fireworks, secondary organic aerosols, biomass burning, fugitive dust, vehicle emissions, industrial sources, secondary nitrate, and secondary sulfate. The factor profiles are shown in Fig. S4. Factor 1 (Coal combustion) is characterized by elevated concentrations of As and Pb, two well-established tracers of coal combustion. EC and OC also contribute moderately, whereas sulfate is present only in minor amounts. This is expected because most atmospheric SO originates from secondary formation and is therefore assigned predominantly to the secondary sulfate factor rather than the primary coal combustion factor. Factor 2 (Fireworks) shows very high concentrations of K+ and Cu. K+ is a canonical tracer of pyrotechnic materials, and the marked enrichments of Cu exhibits sharp peaks during New Year's Eve, closely matching the temporal pattern of firework discharges (Wang et al., 2007, 2024). This strong chemical signature, together with its event-driven temporal behavior, confirms the identification of this factor as fireworks. Factor 3 (Secondary organic aerosols) is strongly dominated by SOC, with more than 80 % of the receptor's total SOC apportioned to this factor, and shows negligible contributions from primary tracers such as EC or metals. The chemical characteristics and the absence of primary emission markers indicate that this factor represents secondary organic aerosol formation. Factor 4 (Biomass burning) exhibits an overall low mass contribution from EC and POC. Its only clear diagnostic features are the elevated K+ and Cl− levels, with 63.5 % of the receptor-site Cl− attributed to this factor. Several metal species, including Fe, Pb, Cr, Ni, Cu, and Zn, also appear at low concentrations. Although the chemical signature is weak and partially mixed, the combined presence of enriched K+ and substantial Cl− still supports the interpretation of this factor as a diluted biomass burning source during the winter period. Factor 5 (Fugitive dust) presents high Ca, Si, and moderate Fe, typical of crustal and mineral dust materials. The abundance of Ca reflects contributions from road dust and resuspended soil particles, confirming its attribution to fugitive dust. Factor 6 (Vehicle emissions) exhibits strong EC and notable Fe and Zn, the latter two being associated with brake wear and tire abrasion (Viana et al., 2008). Moderate OC further supports its assignment to traffic-related emissions. Factor 7 (Industrial sources) is enriched in transition metals including Cr, Mn, Ni, Cu, Zn, and Pb. These elements are characteristic of metallurgical and manufacturing activities, supporting its interpretation as industrial emissions. Factor 8 (Secondary nitrate) is dominated by NO together with NH, clearly indicating the formation of secondary inorganic nitrate. Factor 9 (Secondary sulfate) shows extremely high contributions of SO and NH. The dominance of sulfate, formed through oxidation of SO2 in the atmosphere, identifies this factor as secondary sulfate. DISP uncertainty diagnostics for the nine-factor solution showed narrow confidence intervals and no evidence of factor swapping, confirming the overall stability and robustness of the DN-PMF results. Moreover, the enrichment of specific tracer elements does not necessarily correspond directly to the mass contribution of a given source factor. Within the PMF modeling, tracer species primarily serve as indicators for source identification, whereas factor-resolved mass contributions reflect the overall mixture of chemical species associated with each source profile. In addition, atmospheric particles are often internally mixed, and tracer elements from fireworks emissions may coexist with secondary species such as sulfate or nitrate. Consequently, the enhancement of specific tracer elements should be interpreted primarily as evidence of source influence rather than as a direct proxy for the quantitative mass contribution of that source.
3.2 Changes in air quality and source-specific PM2.5 over the 2024 CSF haze episode in Hangzhou
During the haze episode, spanning approximately from 19:00 on 9 February to 19:00 on 10 February, both observed and meteorologically-adjusted PM2.5 in Hangzhou increased sharply, with observed levels peaking at 394 µg m−3 and meteorologically normalized values reaching a maximum of 123 µg m−3 (Fig. S5). Concurrently, SO2 levels also exhibited a sudden rise. In contrast, NO2 and CO showed a rapid increase at the onset of the event, followed by a sharp decline. Rather than interpreting these gas-phase patterns as direct evidence of fireworks-related chemical species, we highlight that gas tracers and PM tracers often respond to different source processes and atmospheric lifetimes (Li et al., 2025). The pronounced decrease in NO2 and CO more likely reflects the substantial weakening of traffic and combustion-related emissions during the holiday period, rather than the formation of nitrate-rich particles from fireworks. In parallel, O3 concentrations dropped abruptly and then rebounded, suggesting an O3 titration effect driven by freshly emitted NO. This behavior further supports the notion that the gaseous species reflect rapid changes in atmospheric chemistry and emission conditions, rather than serving as direct compositional indicators of the fireworks plume. Accordingly, we use NO2 mainly as an independent corroboration of reduced traffic emissions, while the identification of fireworks contributions relies primarily on the PM2.5 chemical fingerprints and the counterfactual analysis. In terms of meteorological conditions, the pollution evolution was accompanied by unfavorable meteorological conditions for dispersion over the night (low VC, see Fig. S5). Figure 2a, b shows the compositional changes in PM2.5 during the holiday period. A clear shift in source contributions is observed. The concentrations and proportions of secondary inorganic aerosols, including NO (−9.7 µg m−3, −24.6 %) and NH (−4.7 µg m−3, −12 %), decreased markedly relative to the pre-holiday period (5 to 8 February 2024), likely due to reduced industrial and vehicular emissions. In contrast, the concentrations and proportions of fireworks tracers such as K+ (+15 µg m−3, +13.6 %), Cl− (+5.1 µg m−3, +4 %), Ba (+1.6 µg m−3, +1.5 %) and Cu (+0.5 µg m−3, +0.5 %) increased substantially. These enhancements indicate that intensive fireworks and firecracker use became a major contributor to PM2.5, leading to a pronounced change in its chemical profile during the celebration period.
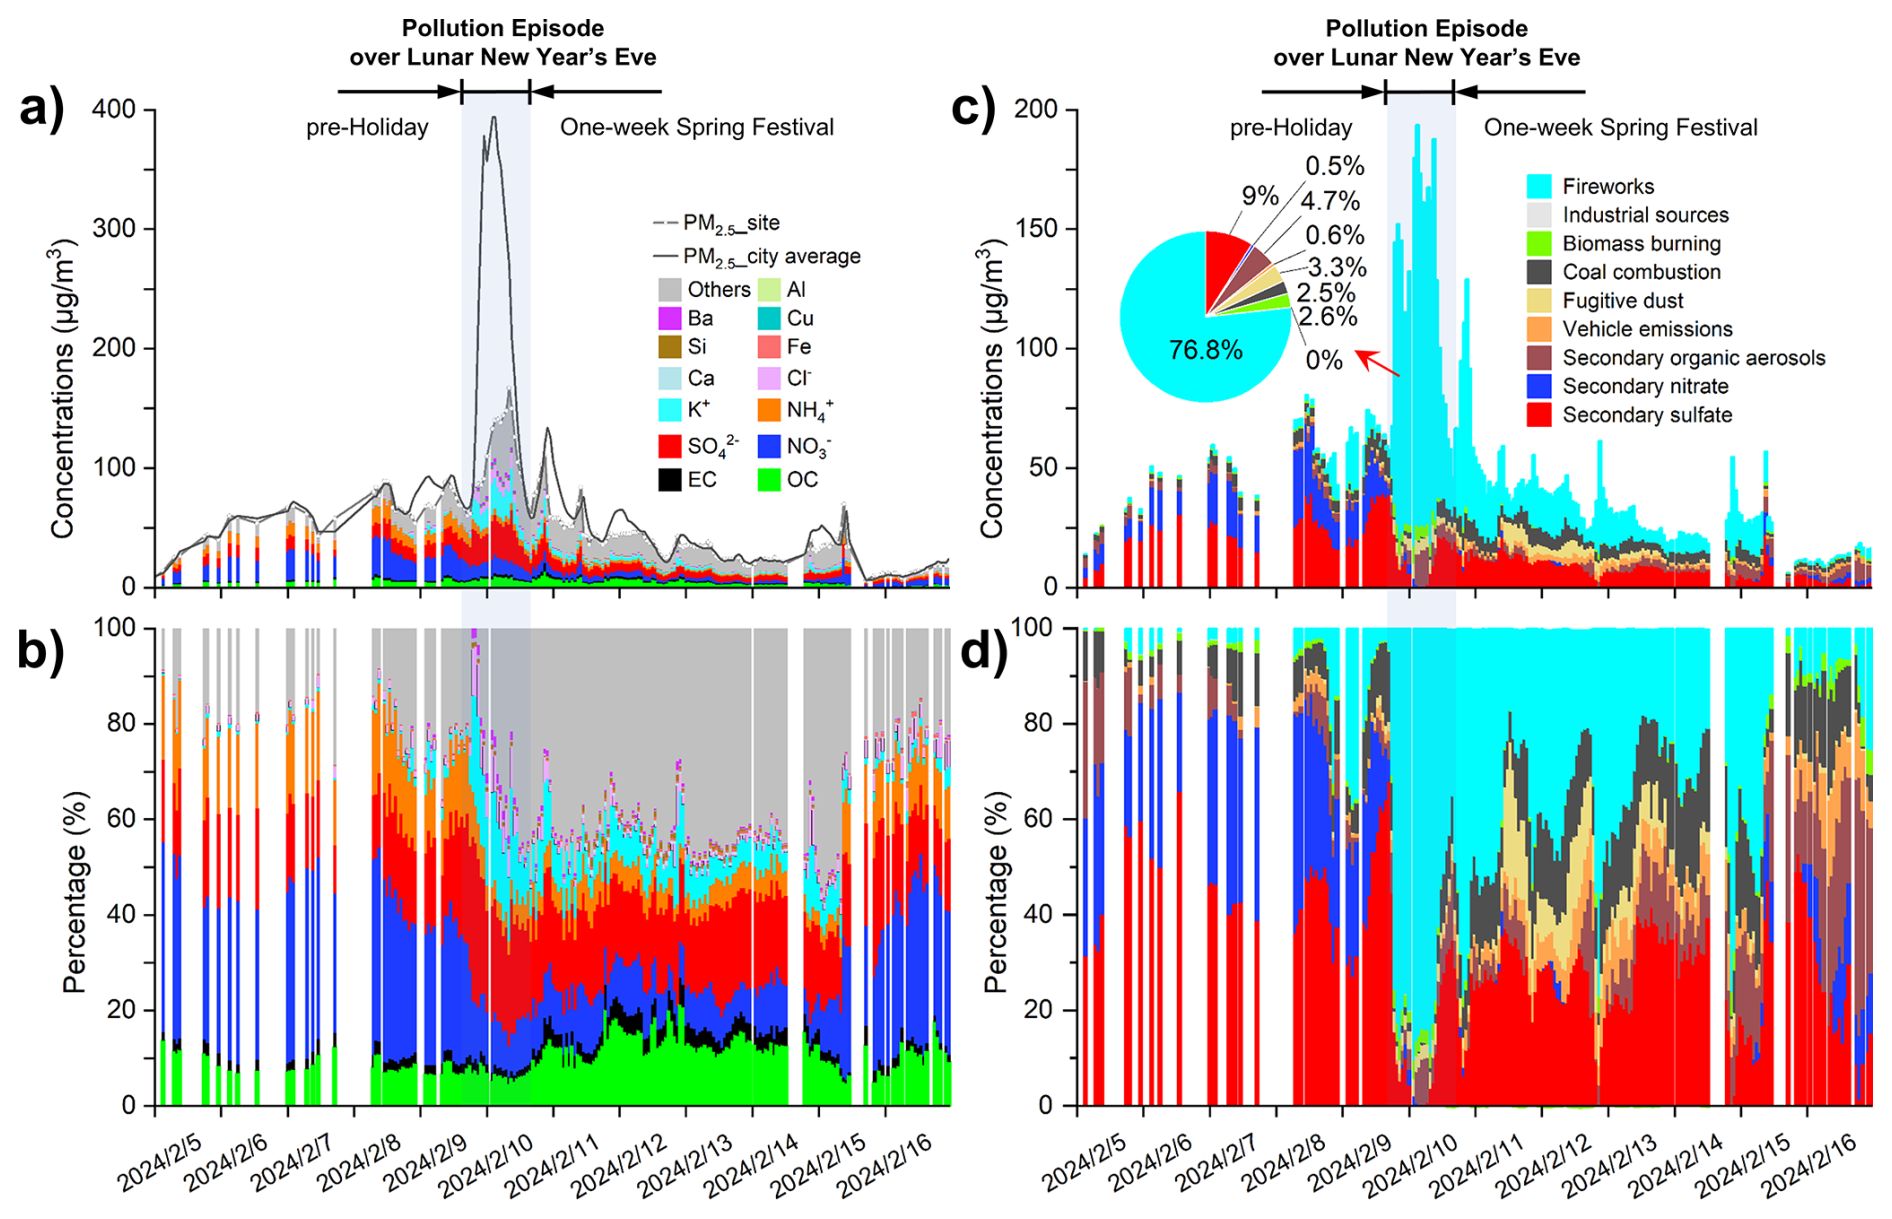
Figure 2Changes in PM2.5 chemical components and source contributions throughout the CSF period. (a) Temporal variations of mass concentrations of PM2.5 chemical components. (b) Mass fractions of PM2.5 chemical components. Temporal variations of the nine PM2.5 sources concentrations resolved by DN-PMF (c) and their contribution proportions (d).
To further substantiate our hypothesis, we conducted an analysis of elemental ratios. During the New Year's Eve haze episode, the ratio exhibited an abrupt, order-of-magnitude increase, with peak values nearing 13 – more than 60 times higher than the background level (∼ 0.2 from 21 January to 8 February 2024; Fig. S6). This sharp deviation from the baseline provides strong evidence for the introduction of a distinct aerosol population characterized by high potassium and low elemental carbon content (“K-rich, EC-poor”). Similarly, the ratio showed a pronounced shift, forming a relatively stable low-value plateau during the event (average ∼ 10, coefficient of variation ∼ 16 %). In contrast, the background period was marked by highly irregular and strongly fluctuating ratios (Fig. S7). This transition from chaotic to stable behavior suggests the emergence of a strong, independent source with a comparatively uniform K–Ba composition. Before the fireworks episode, the fluctuating ratios were accompanied by consistently low Ba concentrations (average 0.01 µg m−3) and moderate contributions from the biomass burning factor, as identified by the PMF analysis presented later (0.74 µg m−3, 1.6 % of PM2.5), indicating that the variability was likely influenced by mixed combustion sources (e.g., biomass burning or residential combustion) rather than fireworks emissions. Consistently, chloride concentrations and the fireworks factor remained low before the event but increased sharply during the fireworks episode, reinforcing the distinction between the pre-holiday variability and the characteristic fireworks signature. This pattern may also be related to a geographical shift in emissions under the influence of the Spring Festival holiday-related activities, when increased rural residential combustion can influence urban air quality through regional transport, as discussed by Li et al. (2025). Taken together, the elemental ratio patterns provide compelling evidence that concentrated firework emissions on New Year's Eve were a substantial contributor to this pollution episode.
Figure 2c, d present the source contributions of the nine factors resolved by DN-PMF and show their temporal variations before, during, and after the New Year's Eve haze episode. The pollution episode over the New Year's Eve was exclusively driven by the sudden increase of the fireworks emissions featuring relatively high K+, Cl−, Ba, Al and SO, which are major components of black powder in the form of KClO3 or KNO3, basic fireworks material of magnalium alloy (95 % Al and 5 % Mg) and oxidizers such as Barium compounds (Ba(NO3)2 and BaClO3) (Dai et al., 2020; Joshi et al., 2019). The maximum concentration of fireworks emissions reached up to 167 µg m−3 at midnight on New Year's Eve, accounting for 42 % of the observed PM2.5 by mass. In addition to fireworks emissions, holiday-related source changes also encompass a significant reduction in vehicle emissions (−63 %) due to decreased traffic flow, alongside a substantial increase in dust pollution (+4215 %) from concentrated firework activities, compared to pre-holiday levels (5 to 8 February 2024). Furthermore, halted industrial production and the shutdown of construction sites, which had already begun near a week prior to the holiday, also reflect changes in emission sources driven by the holiday activities.
Specifically, during the haze period on New Year's Eve 2024 in Hangzhou, the average contributions of PM2.5 from nine distinct sources were analyzed, as illustrated in the pie chart in Fig. 2. The primary sources of PM2.5, ranked by their contribution percentages, are as follows: fireworks (76.8 %), secondary sulfate (9 %), secondary organic aerosols (4.7 %), fugitive dust (3.3 %), biomass burning (2.6 %), coal combustion (2.5 %), vehicle emissions (0.6 %), secondary nitrate (0.5 %), and industrial sources (0.01 %). Compared to the period before New Year's Eve, the contribution of the primary PM2.5 sources during the haze event on New Year's Eve experienced significant changes. The primary source accounted for approximately 85.7 % of the total PM2.5, dominating the composition. In contrast, the average proportion of secondary particulate matter was 14.3 %, which was notably lower than that observed before New Year's Eve. During the haze period on New Year's Eve, the concentrated emissions from fireworks led to a dramatic increase in their contribution, with the average concentration of fireworks-related sources surging more than tenfold compared to the same period on the previous day (from 19:00 on the 8th to 19:00 on the 9th). Particularly, fireworks emissions began to rise rapidly starting at 19:00 on the 9th, becoming the dominant emission source on New Year's Eve. They reached their peak concentration of 167.2 µg m−3 at 03:00 on the 10th, accounting for 88.4 % of the reconstructed PM2.5 (sum of speciated components) at that time. The average concentration of fugitive dust during the haze period on New Year's Eve also increased more than fivefold compared to the same period on the previous day, reaching a peak of 7.2 µg m−3 at 09:00 on the 10th. This significant rise may be attributed to the strong air currents generated by the ignition of fireworks, which disturbed ground-level dust and particulate matter, causing them to become re-suspended in the air and leading to a notable increase in fugitive dust concentrations. Due to reduced traffic and decreased industrial activities during the Spring Festival holiday on New Year's Eve, as well as the shutdown of local factories, emissions from motor vehicles and industrial sources experienced a rapid decline compared to the period before New Year's Eve. During the haze event on New Year's Eve, the average concentrations of vehicle emissions were only 0.3 µg m−3, representing an average reduction of 73 % compared with the same period on the previous day. The industrial source contribution was even lower, remaining nearly zero throughout the event. Similarly, the concentration of secondary sulfate decreased significantly during the haze event, whereas secondary organic aerosols increased. Secondary nitrate almost completely disappeared during the event. The average changes relative to the same period on the previous day were −62 %, approximately −100 %, and +161 %, respectively.
3.3 CSF-related changes in PM2.5 and emission strength in Hangzhou, China
The XGBoost model trained to predict PM2.5 concentrations during non-pollution periods (PM2.5,pre) achieved a coefficient of determination (R2) of 0.96, a root-mean-square error (RMSE) of 7.1 µg m−3, and a mean absolute error (MAE) of 5.1 µg m−3, indicating its strong predictive performance. Excellent agreement between PM2.5,pre and the observed PM2.5 concentrations (R2= 0.98; Fig. 3a, d) demonstrates the strong generalization ability of the model, thereby strengthening confidence in the modeled counterfactual PM2.5 under the business-as-usual (BAU) scenario during the haze period. During the pollution episode, the difference between PM2.5,obs and PM2.5,pre reflects the changes in PM2.5 air quality driven by the holiday effect, such as the emergence of fireworks and crackers emissions and the reduction in industrial and vehicle emissions. Under the combined influence of these holiday-related sources change, the average PM2.5 air quality in Hangzhou increased by approximately 138 µg m−3 (174 %), compared to the BAU scenario. The worsening air quality on the first day of the Lunar New Year was caused by both the overnight unfavorable meteorology (shallower boundary layer and smaller dilution room) and changed festival-related emissions especially the firework emissions.
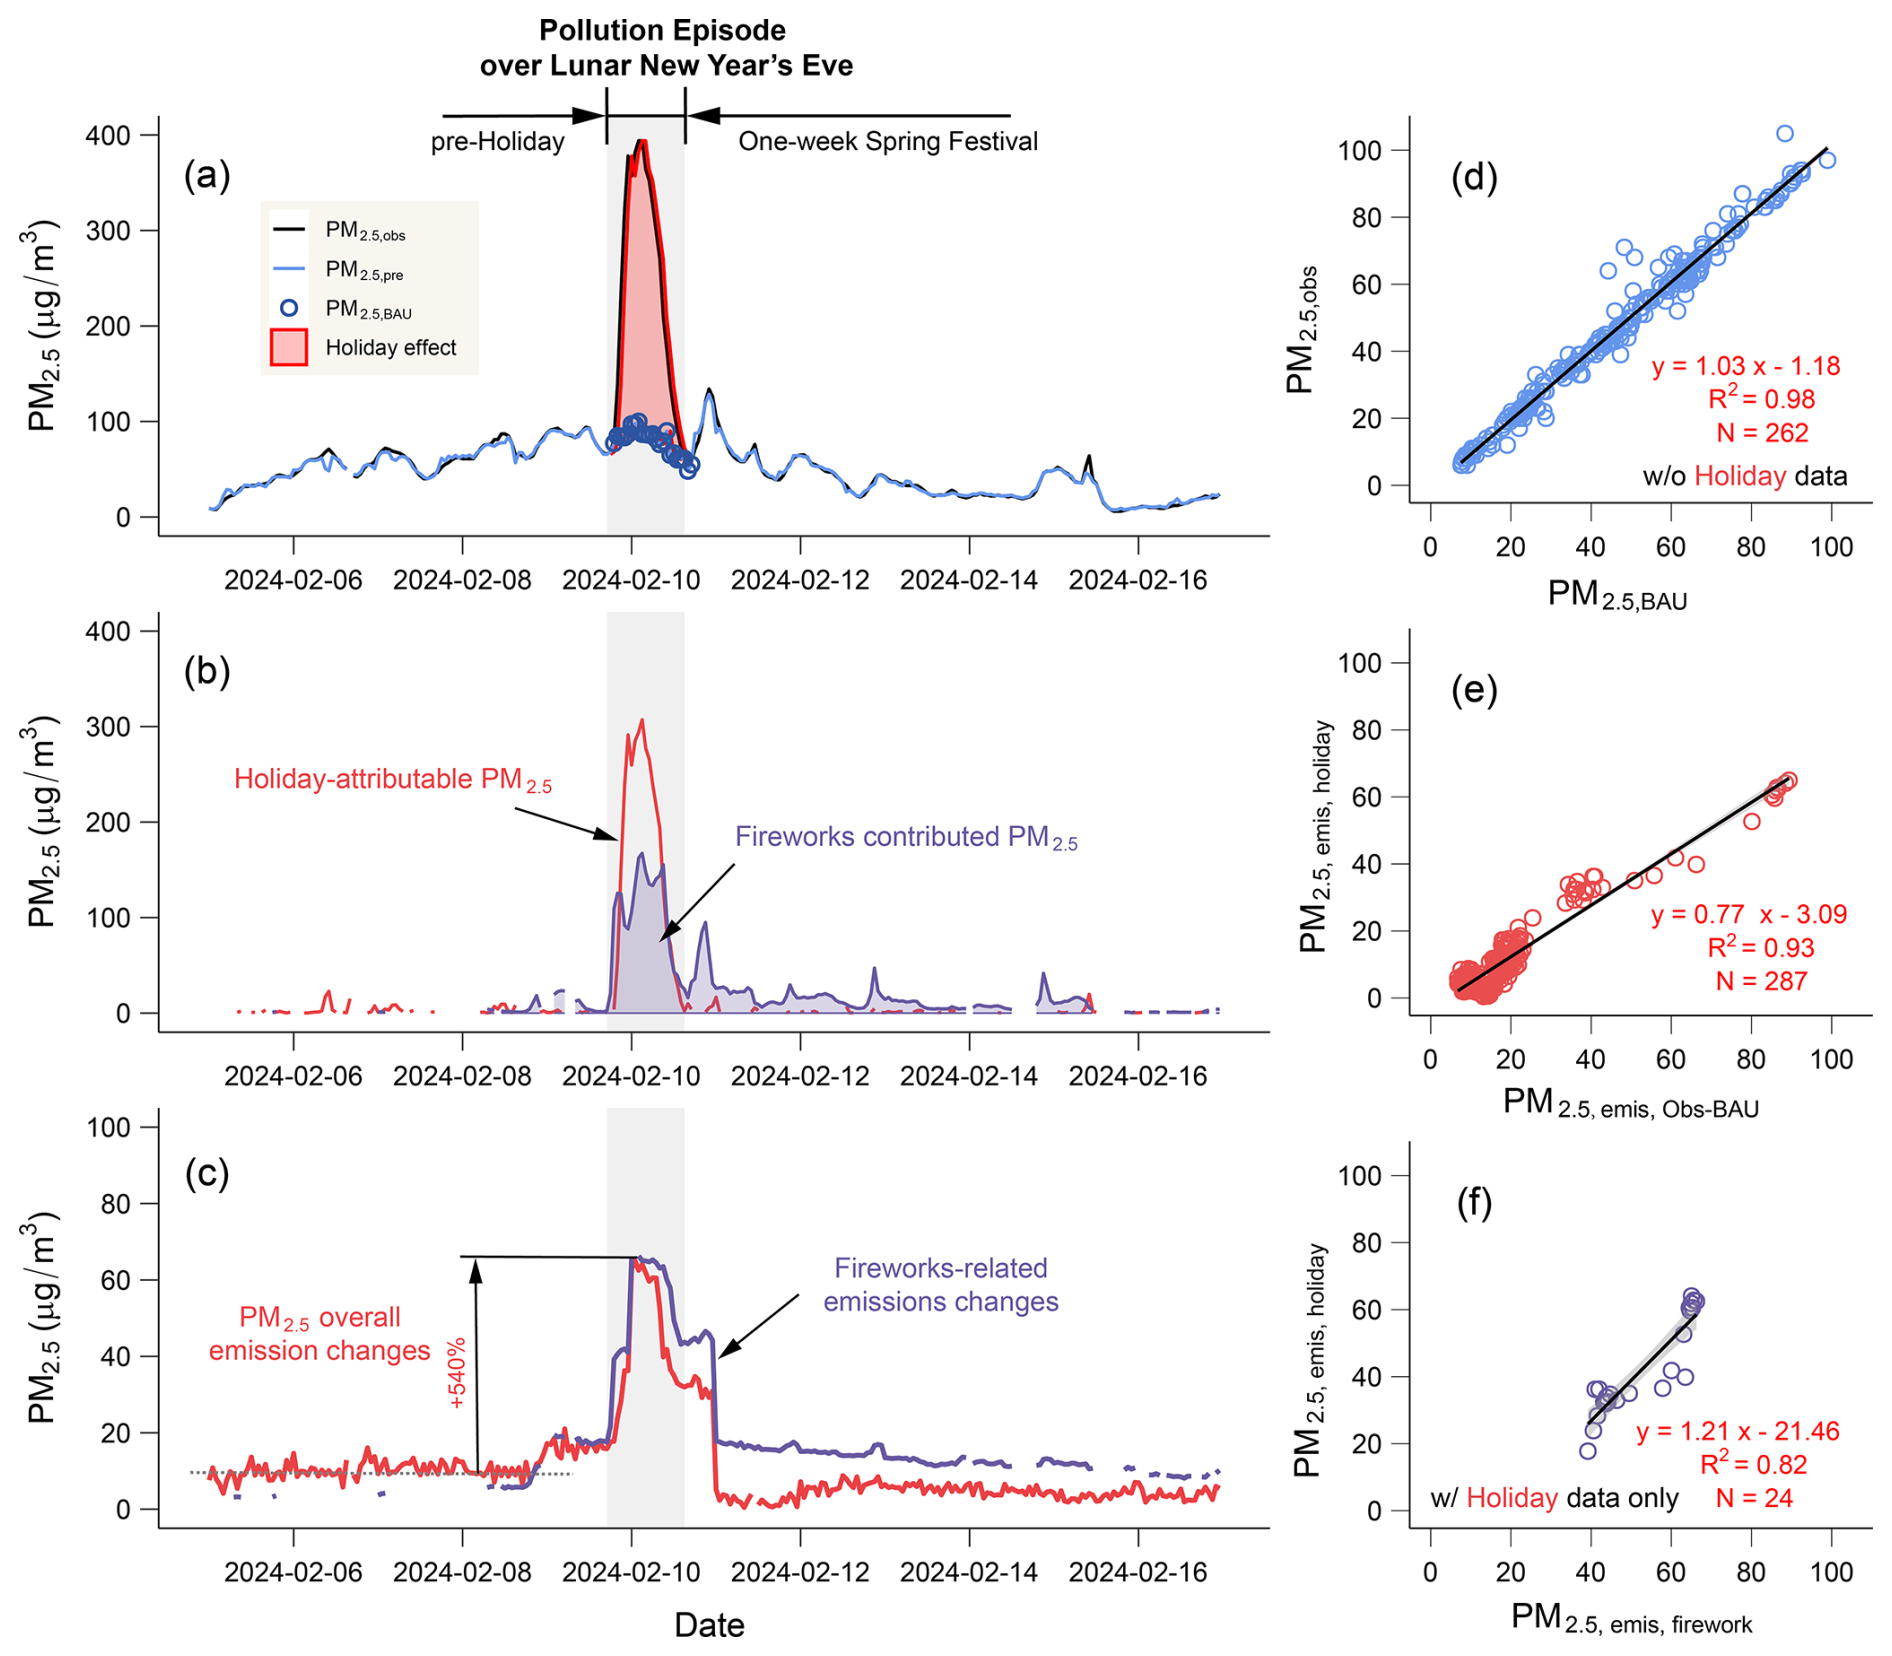
Figure 3Changes in PM2.5 air quality and its emission strengths in Hangzhou around the 2024 New Year's Eve pollution period. (a) Temporal comparison of observed PM2.5 (PM2.5,obs) with counterfactual predicted PM2.5 concentrations (PM2.5,BAU). (b) Temporal comparison of firework-related source contributions resolved by DN-PMF with the holiday-attributable PM2.5 air quality changes estimated using the ML approach. (c) Temporal comparison between the meteorologically normalized holiday-attributable PM2.5 and fireworks-related PM2.5. (d) Scatter plot for the PM2.5,obs and the XGBoost model predicted PM2.5 concentrations (PM2.5,BAU) for non-pollution periods. (e) Correlation between the differences in meteorologically normalized PM2.5,obs and PM2.5,BAU (PM2.5,emis,obs-BAU) and meteorologically normalized PM2.5 for holiday-attributable part (PM). (f) Scatter plot for the meteorologically normalized holiday-attributable PM2.5 and fireworks-related PM2.5. Note: the PM2.5 concentration data were averaged from 14 national monitoring sites within Hangzhou, while the chemical composition data were measured at a single site.
The meteorological normalization random forest model demonstrated high predictive accuracy (R2= 0.95), thus can be also to normalize the meteorologically-induced variations in PM2.5 air quality so as to reliably reflect its emission strength changes. The holiday-driven emission strengths change can be estimated via two methods: (1) meteorologically normalization of the differences in PM2.5 between the real observed concentrations and the predicted BAU concentrations (PM); (2) differences between the meteorologically normalized PM2.5 for the real observed concentrations and the predicted BAU concentrations (PM), with each set being normalized individually. Time series of the normalized PM2.5 agree with each other well (R2= 0.93, Fig. 3e), suggesting the reliability of tracking the holiday-attributable emissions using both methods following the same meteorological normalization technique. By calculating the differences between PM2.5,emis,obs-BAU (i.e., PM2.5,MN minus PM), the random forest models used in the meteorological normalization process for both scenarios achieved similar R2 of approximately 0.95. These models effectively captured time series variations and produced reliable meteorologically normalized pollutant concentrations. A comparison of the time series changes in PM2.5,MN and PM (Fig. S8) revealed that the average increase in PM2.5 emission strength attributable to the “holiday effect” during the pollution period was approximately 74 % (43 µg m−3 in an averaged meteorological condition).
3.4 Validating CSF-attributable haze PM2.5 changes using source-specific data
To validate the robustness of the ML estimated CSF holiday-attributable changes in air quality and emission strength, we compare the time series of PM2.5 contributed by fireworks emissions, as resolved by DN-PMF, with the holiday-attributable PM2.5 data estimated via ML model (Fig. 3). The ML modeled holiday-attributable PM2.5 concentrations are overall larger than the DN-PMF-resolved fireworks contributed PM2.5 during the New Year's Eve haze event. The primary reason for this discrepancy likely lies in the difference in data representativeness between the two models: one reflects a city-averaged scale, while the other is based on data from a single, albeit representative, urban site. As demonstrated by the observational data, there is an approximate 1.1-fold linear relationship between the city-averaged PM2.5 concentration and the PM2.5 data from the Wolongqiao site (Fig. S9), meaning the city-averaged concentration is slightly larger than the site's PM2.5 data. Other potential contributing factors include the complicated real-world source changes, the disproportionately strong amplification effect due to the highly unfavorable dilution conditions at midnight (e.g., extremely low VC, as shown in Fig. S1), and the inherent uncertainties associated with both methodological approaches. The fireworks emission also contributed to an increase in dust emissions. While note that the results show a high degree of temporal alignment in PM2.5 air quality (Fig. 3b), suggesting that the predominant role of fireworks emissions in driving holiday haze. From the perspective of emission strength changes (Fig. 3c), the “holiday effect” led to a maximum increase of 540 % in total PM2.5 emission strength during the Lunar New Year's Eve haze period compared with the pre-holiday period. Concurrently, the meteorologically normalized PM2.5 from fireworks rose by more than 540 %, exceeding the citywide average emission increment. This indicates that the surge in fireworks emissions partially offset the reductions in industrial and vehicular emission strengths during the holiday period. The meteorologically normalized fireworks-specific PM2.5 explained 82 % of the overall change in PM2.5 emission strength during the holiday haze episode (Fig. 3f), with a positive slope of 1.2. These results suggest that, during the haze period, the holiday-related change in air quality was largely driven by shifts in festival emissions. After accounting for meteorological effects, the elevated PM2.5 concentrations during the holiday were predominantly attributable to firework-related source emissions. Furthermore, considering the previously established 1.1-fold linear relationship between the citywide average and site-level PM2.5 concentrations, the actual citywide firework emission strength is expected to be higher than the purple segment shown in Fig. 3c.
Here we acknowledge that due to the unavailability of multi-site chemical speciation data in Hangzhou, this study relies solely on speciation data from the Wolongqiao urban station. We contend that the data from this single site is sufficient and representative for validating the city-wide fireworks signal for two primary reasons. First, fireworks emissions during the CSF are not localized point sources but occur nearly simultaneously as an area-wide activity across the city. The resultant pollution plume, characterized by a sharp, synchronous peak in city-level PM2.5 (averaged from 14 sites), is a regional atmospheric phenomenon. Second, the Wolongqiao site's PM2.5 observations demonstrate a strong positive correlation with the city-wide average (e.g., R2 = 0.78, N= 1213). This high consistency confirms that the site's temporal PM2.5 variation capture the pollution trends across Hangzhou, especially during the winter haze and Spring Festival season (Fig. S9). Additionally, the chemical fingerprint (e.g., distinct peaks in K, Ba, and the ratio) measured by the Wolongqiao site aligns perfectly with the timing of this regional PM2.5 peak identified by our machine learning model. This strong temporal consistency and physicochemical coherence provide compelling evidence that both methods are detecting the same city-scale pollution event, thereby supporting the representativeness of the single-site chemical data for this specific analysis. Nevertheless, we acknowledge that fireworks-related tracers (e.g., K, Ba, and Cl−) may exhibit spatial heterogeneity due to localized burning activities. Future studies with a more extensive chemical monitoring network would be beneficial to further confirm these findings and capture potential finer-scale spatial heterogeneity.
3.5 Attribution of PM2.5 and emission changes to the 2025 Spring Festival in the “2 + 26” cities of northern China
Based on the validated approach, we quantified the impact of the CSF “holiday effect” on PM2.5 air quality and its emission strength in the Beijing-Tianjin-Hebei and surrounding “2 + 26” cities in 2025. Here we defined CSF as dates between New Year's Day to the Lantern Festival (the fifteenth day of the lunar new year). In the counterfactual prediction of PM2.5 air quality, the XGBoost models for the “2 + 26” cities achieved R2 of 0.88 ± 0.03 and RMSE of 17.7 ± 2 µg m−3. The random forest meteorological normalization models for the actual observed PM2.5 concentrations in the “2 + 26” cities yielded R2 of 0.89 ± 0.02 and RMSE of 19.0 ± 2 µg m−3, while the meteorological normalization models for the counterfactual predicted PM2.5 concentrations achieved R2 of 0.93 ± 0.02 and RMSE of 13.5 ± 1.3 µg m−3. All models demonstrated strong data-fitting accuracy and robust generalization ability.
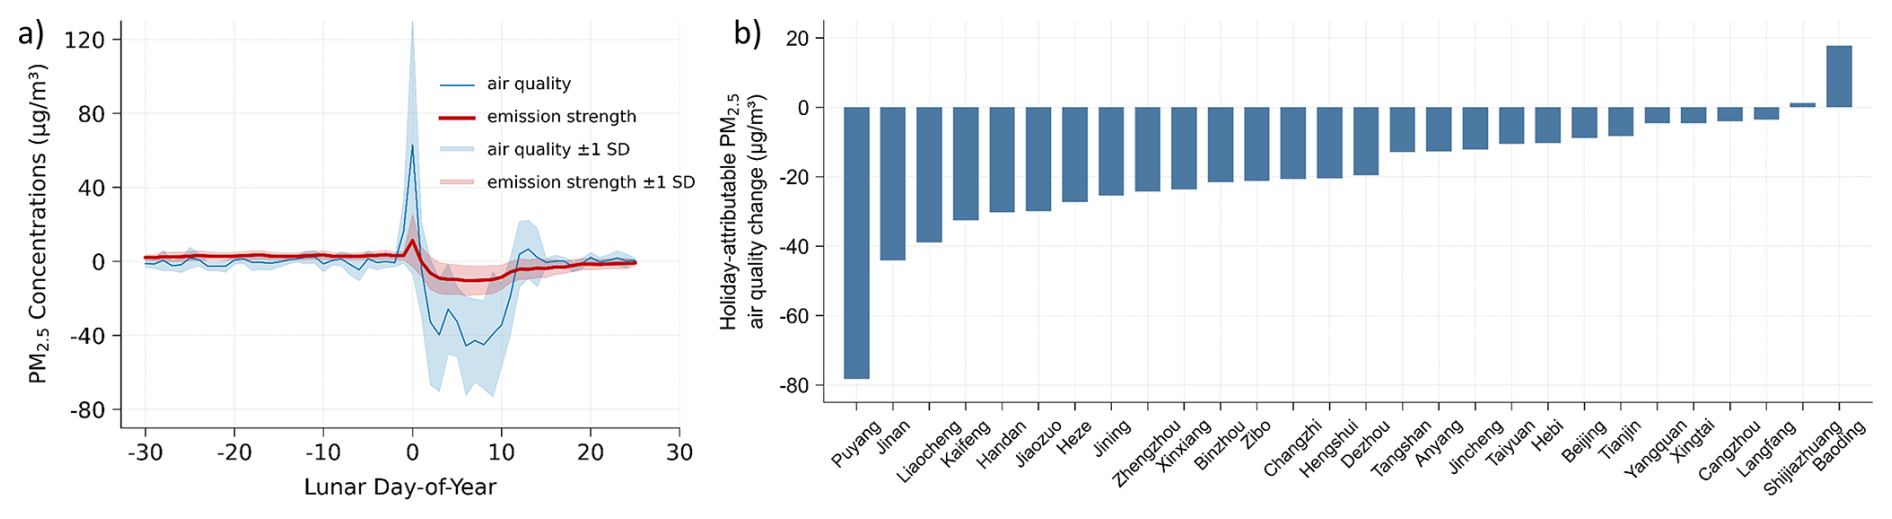
Figure 4Impact of the 2025 CSF on PM2.5 in the “2 + 26” cities. (a) Dynamic change of regionally averaged PM2.5 concentrations and emission strengths during the CSF period. Shaded areas denote ± 1 standard error intervals. (b) CSF-attributable changes in PM2.5 concentrations across the “2 + 26” cities, ranked by magnitude.
Figure 4 illustrates the impact of the 2025 CSF on PM2.5 levels in the “2 + 26” cities. In Fig. 4a, the regionally averaged PM2.5 emissions and air quality exhibit a sharp increase at the beginning of the Lunar New Year, primarily due to the intensive use of fireworks and firecrackers during New Year's Eve celebrations, followed by a marked decline next day throughout the holiday period. This decline is attributed to reduced traffic, the suspension of construction activities, and decreased emissions from small-scale industries. Such phenomena were nearly consistently observed across all 28 cities. In Fig. 4b, a preliminary analysis was conducted to evaluate the average impact of the 2025 CSF holiday effect on PM2.5 air quality. The vast majority of the studied cities showed notable improvements in PM2.5 air quality during the nearly two weeks festival period compared to the BAU counterfactual scenario, with an average reduction of approximately 19 µg m−3, equivalent to a decrease of about 6 µg m−3 (7 %) in PM2.5 emission strength (in averaged meteorological condition). Among them, Puyang experienced the most significant improvement, with an average decrease of about 78.3 µg m−3 in PM2.5 concentration during the holiday. PM2.5 emission strength in Puyang dropped immediately after the onset of the CSF, likely due to the absence of fireworks emissions. Similar patterns were observed in Baoding, Cangzhou, and Taiyuan (Fig. S10). In contrast, even after the start of the Spring Festival, emission levels in Changzhi remained high. Baoding experienced the most severe deterioration in PM2.5 air quality, following by Shijiazhuang. Cities located in the central part of the “2 + 26” region showed the least improvement in air quality, which is likely attributable to increased emissions from fireworks.
The poorest air quality during the Chinese Spring Festival was observed on the first day of the Lunar New Year, coinciding with substantial midnight fireworks set off to celebrate the occasion. To quantify the contribution of firework-related emissions to the PM2.5 elevation on the first day, the increases in PM2.5 concentration relative to the counterfactual level was calculated as the lower bound of the fireworks contribution, assumption that emissions from other sources remained unchanged. In practice, pronounced reductions in other primary pollutants were observed on Chinese New Year's Eve. NO2 concentrations decreased from 32.8 µg m−3 (the average during the week preceding New Year's Eve) to 12.2 µg m−3 on New Year's Eve, corresponding to a 62.7 % reduction. Similarly, CO levels declined from 0.90 to 0.50 mg m−3, representing a 44.2 % decrease (Figs. S11 and S12). These substantial decreases in traffic- and combustion-related indicators indicate a markedly weakened background emission environment. Consequently, the fireworks contribution estimated by the counterfactual analysis should be regarded as a conservative lower bound, and is therefore likely underestimated. As shown in Fig. 5, cities experiencing severe PM2.5 pollution on the first day generally exhibited higher contributions from firework sources, indicating that the intensive firework displays during New Year's Eve were a significant, and in some cities dominant, contributor to the first day haze event. On average, firework emissions accounted for at least 35 % of the PM2.5 concentrations across the 28 cities, with Baoding reaching a maximum of 89.2 %. Though the short-term, intensive firework emissions may offset some of the reductions achieved in other sectors, we believe that the results are reliable and can reasonably reflect the lowest contribution of firework emissions to the deterioration of PM2.5 air quality on the first day.
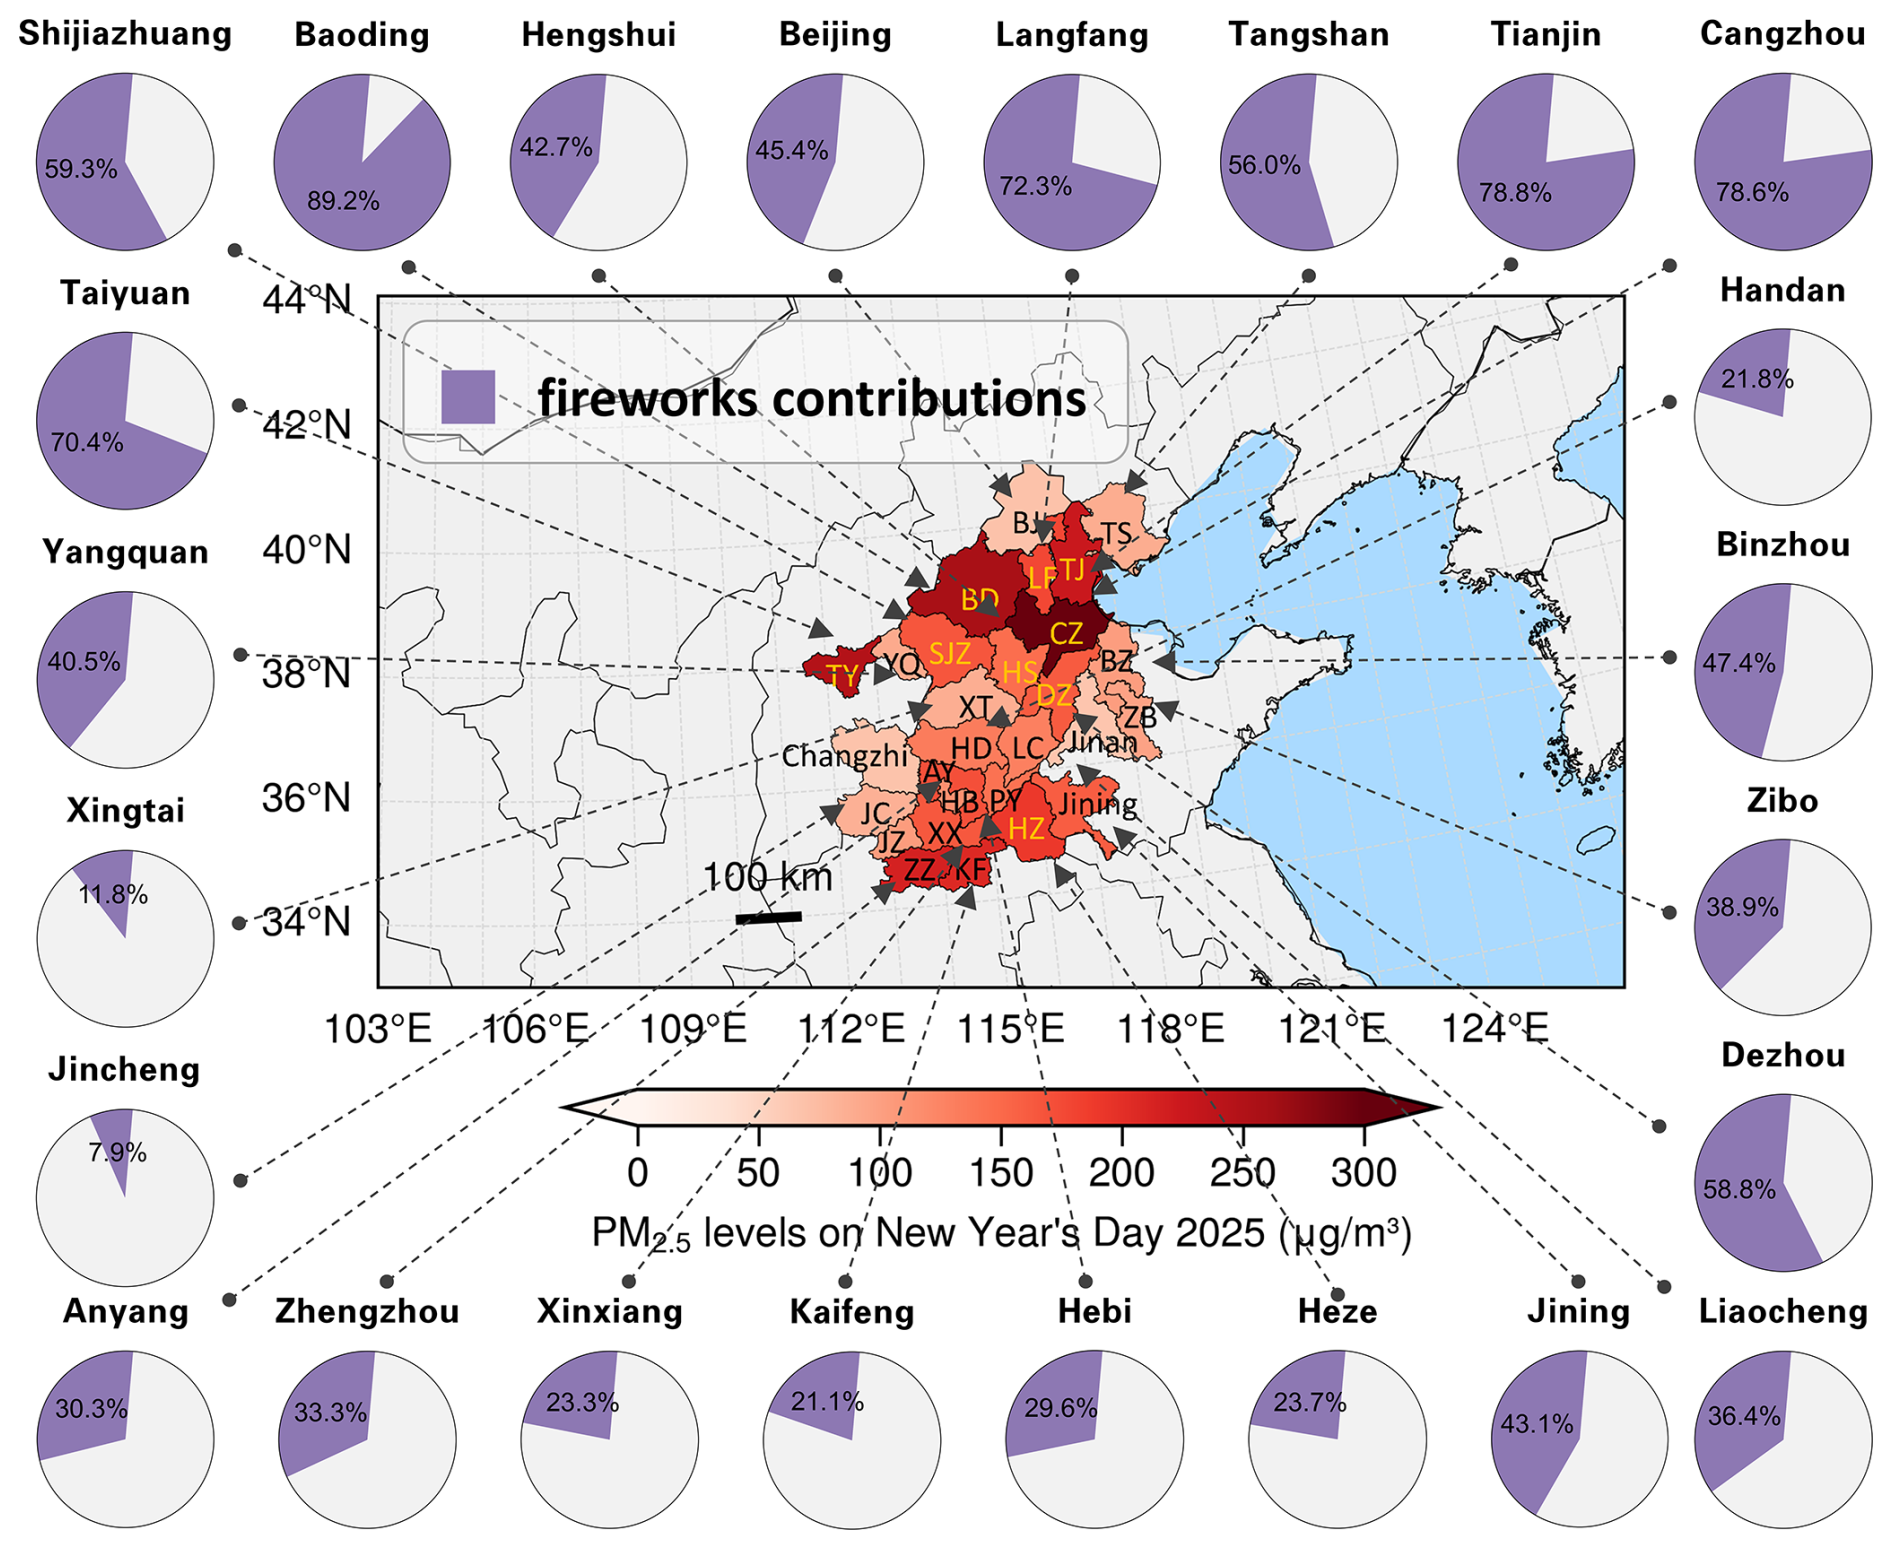
Figure 5Holiday-related fireworks contributions to deteriorating PM2.5 air quality on the first day of the 2025 Lunar New Year in the “2 + 26” cities. Pie charts illustrate the city-level positive contributions of fireworks emissions to PM2.5 concentrations in 24 cities where air quality worsened, and the accompanying map presents the spatial distribution of observed PM2.5 concentrations across the region. The base maps are sourced from the Standard Map Service of the Ministry of Natural Resources of China (GS(2019)1719), providing official and authoritative geographic data. For more information, visit http://bzdt.ch.mnr.gov.cn (last access: 31 March 2026).
Previous studies have demonstrated that a persistent and substantial regional background pollution level exists across the “2 + 26” cities (e.g., Tiwari et al., 2025). Consistent with this established understanding, the present analysis indicates that the haze episode observed on Chinese New Year's Eve was an acute pollution event occurring on top of this regional background. Counterfactual results suggest that this episode was primarily driven by widespread and nearly synchronous local firework emissions during the holiday period. These short-lived but intense emissions were superimposed on the prevailing background pollution, leading to a rapid deterioration in air quality on the first day.
Notably, the estimated firework contributions exhibit pronounced inter-city variability, ranging from less than 10 % to more than 80 %. This variability may be primarily controlled by differences in the prevailing background PM2.5 levels across cities. Because the contribution is defined relative to the total PM2.5 concentration, comparable firework emission intensities can result in substantially different relative contributions depending on the background pollution baseline. In cities with relatively lower regional background PM2.5 concentrations, short-lived but intense firework emissions during New Year's Eve can dominate the observed PM2.5 enhancement, leading to very high relative contributions. In contrast, in cities characterized by persistently elevated background pollution, firework emissions contribute a smaller fraction when superimposed on an already high baseline. In addition, population redistribution during the Spring Festival, characterized by large-scale return migration from urban centers to surrounding towns and rural areas, may enhance the intensity and spatial extent of firework burning. Although firework prohibition policies are implemented at the regional scale, their effectiveness may be limited in rural areas and urban-rural fringe zones, where enforcement intensity and public compliance can differ from those in urban cores. Meteorological conditions, such as boundary layer height and atmospheric dispersion capacity during the holiday period, may further modulate pollutant accumulation and thus the apparent contribution of firework emissions across cities.
A new machine learning-based counterfactual prediction approach was proposed to effectively estimate PM2.5 concentrations in the absence of Spring Festival holiday, enables us to quantify the impact of the “Spring Festival effect” on PM2.5 air quality. By incorporating meteorological normalization technique, we further linked these air quality changes to variations in emission strength. The approach was applied to Beijing, Tianjin, and surrounding 26 major cities in northern China. Results demonstrate the significant contribution of holiday-related firework emissions to the elevated PM2.5 levels on the first day of the 2025 lunar new year in most studied cities, with average contribution over 35 %. While precisely quantifying the contribution of firework emissions remains challenging, this methodology provides valuable insights into the impact of traditional Chinese festivals celebrations, such as the Spring Festival, on ambient air quality and emission strength, as well as the extent to which festive activities contribute to haze events. It also offers a promising approach for broader application in short-term air quality interventions in addition to festival-related activities.
All code and data necessary for replication, including observed and meteorologically normalized air quality data, are available at Zenodo: https://doi.org/10.5281/zenodo.19338129 (Li, 2026).
The supplement related to this article is available online at https://doi.org/10.5194/acp-26-5553-2026-supplement.
Conceptualization – QD; Data curation and analysis – JS, RY, YL, XL, WZ, YL; Software – YL; Visualization – YL, QD; Validation – YL, WZ; Writing of original draft – YL; Review and editing of draft – QD, JD, YSL, YZ, YF; Funding acquisition and Supervision – QD, YF.
The contact author has declared that none of the authors has any competing interests.
Publisher's note: Copernicus Publications remains neutral with regard to jurisdictional claims made in the text, published maps, institutional affiliations, or any other geographical representation in this paper. The authors bear the ultimate responsibility for providing appropriate place names. Views expressed in the text are those of the authors and do not necessarily reflect the views of the publisher.
We thank colleagues from the Hangzhou Ecological Environment Monitoring Center for providing data support. We are grateful to the support from the robotic AI-Scientist platform of Chinese Academy of Sciences.
This work was financially supported by the National Natural Science Foundation of China (grant no. 42577117), the Young Scientific and Technological Talents Program of Tianjin (grant no. QN20230350), the Tianjin Natural Science Foundation Project (grant no. S25YBJ077), and the Fundamental Research Funds for the Central Universities (grant no. 63251196).
This paper was edited by Jason Cohen and reviewed by three anonymous referees.
Brown, S. G., Eberly, S., Paatero, P., and Norris, G. A.: Methods for estimating uncertainty in PMF solutions: Examples with ambient air and water quality data and guidance on reporting PMF results, Sci. Total Environ., 518, 626-635, https://doi.org/10.1016/j.scitotenv.2015.01.022, 2015.
Dai, Q., Bi, X., Liu, B., Li, L., Ding, J., Song, W., Bi, S., Schulze, B. C., Song, C., and Wu, J.: Chemical nature of PM2.5 and PM10 in Xi'an, China: Insights into primary emissions and secondary particle formation, Environ. Pollut., 240, 155–166, https://doi.org/10.1016/j.envpol.2018.04.111, 2018.
Dai, Q., Liu, B., Bi, X., Wu, J., Liang, D., Zhang, Y., Feng, Y., and Hopke, P. K.: Dispersion normalized PMF provides insights into the significant changes in source contributions to PM2.5 after the COVID-19 outbreak, Environ. Sci. Technol., 54, 9917–9927, https://doi.org/10.1021/acs.est.0c02776, 2020.
Dai, Q., Hou, L., Liu, B., Zhang, Y., Song, C., Shi, Z., Hopke, P. K., and Feng, Y.: Spring Festival and COVID-19 lockdown: disentangling PM sources in major Chinese cities, Geophys. Res. Lett., 48, https://doi.org/10.1029/2021GL093403, 2021a.
Dai, Q., Ding, J., Song, C., Liu, B., Bi, X., Wu, J., Zhang, Y., Feng, Y., and Hopke, P. K.: Changes in source contributions to particle number concentrations after the COVID-19 outbreak: Insights from a dispersion normalized PMF, Sci. Total Environ., 759, 143548, https://doi.org/10.1016/j.scitotenv.2020.143548, 2021b.
Dai, Q., Dai, T., Hou, L., Li, L., Bi, X., Zhang, Y., and Feng, Y.: Quantifying the impacts of emissions and meteorology on the interannual variations of air pollutants in major Chinese cities from 2015 to 2021, Sci. China Earth Sci., 66, 1725–1737, https://doi.org/10.1007/s11430-022-1128-1, 2023.
Dai, Q., Zhang, Y., Bi, X., and Feng, Y.: A Double Machine Learning Approach for Policy Evaluation Using Meteorologically Fixed Air Pollutant Time Series as an Emission Proxy, ACS ES&T Air, https://doi.org/10.1021/acsestair.5c00501, 2026.
Ding, J., Dai, Q., Fan, W., Lu, M., Zhang, Y., Han, S., and Feng, Y.: Impacts of meteorology and precursor emission change on O3 variation in Tianjin, China from 2015 to 2021, J. Environ. Sci., 126, 506–516, https://doi.org/10.1016/j.jes.2022.03.010, 2023.
Gao, J., Wang, K., Wang, Y., Liu, S., Zhu, C., Hao, J., Liu, H., Hua, S., and Tian, H.: Temporal-spatial characteristics and source apportionment of PM2.5 as well as its associated chemical species in the Beijing-Tianjin-Hebei region of China, Environ. Pollut., 233, 714–724, https://doi.org/10.1016/j.envpol.2017.10.123, 2018.
Grange, S. K., Carslaw, D. C., Lewis, A. C., Boleti, E., and Hueglin, C.: Random forest meteorological normalisation models for Swiss PM10 trend analysis, Atmos. Chem. Phys., 18, 6223–6239, https://doi.org/10.5194/acp-18-6223-2018, 2018.
Han, B., Yao, T., Li, G., Song, Y., Zhang, Y., Dai, Q., and Yu, J.: Marginal reduction in surface NO2 attributable to airport shutdown: A machine learning regression-based approach, Environ. Res., 214, 114117, https://doi.org/10.1016/j.envres.2022.114117, 2022.
Hou, L., Dai, Q., Song, C., Liu, B., Guo, F., Dai, T., Li, L., Liu, B., Bi, X., and Zhang, Y.: Revealing drivers of haze pollution by explainable machine learning, Environ. Sci. Tech. Let., 9, 112-119, https://doi.org/10.1021/acs.estlett.1c00865, 2022.
Hua, J., Zhang, Y., de Foy, B., Mei, X., Shang, J., and Feng, C.: Competing PM2.5 and NO2 holiday effects in the Beijing area vary locally due to differences in residential coal burning and traffic patterns, Sci. Total Environ., 750, 141575, https://doi.org/10.1016/j.scitotenv.2020.141575, 2021.
Huang, X., Ge, Y., Yang, T., Song, Z., Yu, S., Li, Q., Wang, X., Wang, Y., Wang, X., and Su, J.: Relaxation of spring festival firework regulations leads to a deterioration in air quality, Environ. Sci. Technol., 58, 10185–10194, https://doi.org/10.1021/acs.est.4c00920, 2024.
Jiang, Q., Sun, Y. L., Wang, Z., and Yin, Y.: Aerosol composition and sources during the Chinese Spring Festival: fireworks, secondary aerosol, and holiday effects, Atmos. Chem. Phys., 15, 6023–6034, https://doi.org/10.5194/acp-15-6023-2015, 2015.
Joshi, M., Nakhwa, A., Khandare, P., Khan, A., and Sapra, B.: Simultaneous measurements of mass, chemical compositional and number characteristics of aerosol particles emitted during fireworks, Atmos. Environ., 217, 116925, https://doi.org/10.1016/j.atmosenv.2019.116925, 2019.
Lai, Y. and Brimblecombe, P.: Regulatory effects on particulate pollution in the early hours of Chinese New Year, 2015, Environ. Monit. Assess., 189, 1–14, https://doi.org/10.1007/s10661-017-6167-0, 2017.
Lai, Y. and Brimblecombe, P.: Changes in air pollution and attitude to fireworks in Beijing, Atmos. Environ., 231, 117549, https://doi.org/10.1016/j.atmosenv.2020.117549, 2020.
Leist, A. K., Klee, M., Kim, J. H., Rehkopf, D. H., Bordas, S. P., Muniz-Terrera, G., and Wade, S.: Mapping of machine learning approaches for description, prediction, and causal inference in the social and health sciences, Sci. Adv., 8, eabk1942, https://doi.org/10.1126/sciadv.abk1942, 2022.
Li, C., van Donkelaar, A., Hammer, M. S., McDuffie, E. E., Burnett, R. T., Spadaro, J. V., Chatterjee, D., Cohen, A. J., Apte, J. S., and Southerland, V. A.: Reversal of trends in global fine particulate matter air pollution, Nat. Commun., 14, 5349, https://doi.org/10.1038/s41467-023-41086-z, 2023.
Li, D., Wu, Q., Wang, H., Xiao, H., Xu, Q., Wang, L., Feng, J., Yang, X., Cheng, H., and Wang, L.: The Spring Festival Effect: The change in NO2 column concentration in China caused by the migration of human activities, Atmos. Pollut. Res., 12, 101232, https://doi.org/10.1016/j.apr.2021.101232, 2021.
Li, X., Cohen, J. B., Tiwari, P., Wu, L., Wang, S., He, Q., Yang, H., and Qin, K.: Space-based inversion reveals underestimated carbon monoxide emissions over Shanxi, Commun. Earth Environ., 6, 357, https://doi.org/10.1038/s43247-025-02301-5 , 2025.
Li, Y.: Machine Learning-based Intervention Evaluation of Chinese Spring Festival Fireworks, Zenodo [data set], https://doi.org/10.5281/zenodo.19338129, 2026.
Paatero, P. and Tapper, U.: Positive matrix factorization: A non-negative factor model with optimal utilization of error estimates of data values, Environmetrics, 5, 111–126, https://doi.org/10.1002/env.3170050203, 1994.
Prosperi, M., Guo, Y., Sperrin, M., Koopman, J. S., Min, J. S., He, X., Rich, S., Wang, M., Buchan, I. E., and Bian, J.: Causal inference and counterfactual prediction in machine learning for actionable healthcare, Nat. Mach. Intell., 2, 369–375, https://doi.org/10.1038/s42256-020-0197-y, 2020.
Pui, D. Y., Chen, S.-C., and Zuo, Z.: PM2.5 in China: Measurements, sources, visibility and health effects, and mitigation, Particuology, 13, 1–26, https://doi.org/10.1016/j.partic.2013.11.001, 2014.
Pye, H. O., Ward-Caviness, C. K., Murphy, B. N., Appel, K. W., and Seltzer, K. M.: Secondary organic aerosol association with cardiorespiratory disease mortality in the United States, Nat. Commun., 12, 7215, https://doi.org/10.1038/s41467-021-27484-1, 2021.
Shi, Z., Song, C., Liu, B., Lu, G., Xu, J., Van Vu, T., Elliott, R. J., Li, W., Bloss, W. J., and Harrison, R. M.: Abrupt but smaller than expected changes in surface air quality attributable to COVID-19 lockdowns, Sci. Adv., 7, eabd6696, https://doi.org/10.1126/sciadv.abd6696, 2021.
Tian, Y. Z., Wang, J., Peng, X., Shi, G. L., and Feng, Y. C.: Estimation of the direct and indirect impacts of fireworks on the physicochemical characteristics of atmospheric PM10 and PM2.5, Atmos. Chem. Phys., 14, 9469–9479, https://doi.org/10.5194/acp-14-9469-2014, 2014.
Tiwari, P., Cohen, J. B., Lu, L., Wang, S., Li, X., Guan, L., Liu, Z., Li, Z., and Qin, K.: Multi-platform observations and constraints reveal overlooked urban sources of black carbon in Xuzhou and Dhaka, Commun. Earth Environ., 6, 38, https://doi.org/10.1038/s43247-025-02012-x, 2025.
Viana, M., Kuhlbusch, T. A., Querol, X., Alastuey, A., Harrison, R. M., Hopke, P. K., Winiwarter, W., Vallius, M., Szidat, S., and Prévôt, A. S.: Source apportionment of particulate matter in Europe: a review of methods and results, J. Aerosol Sci., 39, 827–849, https://doi.org/10.1016/j.jaerosci.2008.05.007, 2008.
Vu, T. V., Shi, Z., Cheng, J., Zhang, Q., He, K., Wang, S., and Harrison, R. M.: Assessing the impact of clean air action on air quality trends in Beijing using a machine learning technique, Atmos. Chem. Phys., 19, 11303–11314, https://doi.org/10.5194/acp-19-11303-2019, 2019.
Wang, W., Zhou, H., Gao, Y., Shao, L., Zhou, X., Li, X., Wei, D., Xing, J., and Lyu, R.: Chemical composition and morphology of PM2.5 in a rural valley during Chinese New Year's Eve: Impact of firework/firecracker display, Atmos. Environ., 318, 120225, https://doi.org/10.1016/j.atmosenv.2023.120225, 2024.
Wang, Y., Zhuang, G., Xu, C., and An, Z.: The air pollution caused by the burning of fireworks during the lantern festival in Beijing, Atmos. Environ., 41, 417–431, https://doi.org/10.1016/j.atmosenv.2006.07.043, 2007.
Wei, P., Xie, S., Huang, L., Liu, L., Tang, Y., Zhang, Y., Wu, H., Xue, Z., and Ren, D.: Spatial interpolation of PM2.5 concentrations during holidays in south-central China considering multiple factors, Atmos. Pollut. Res., 13, 101480, https://doi.org/10.1016/j.apr.2022.101480, 2022.
Wu, G., Tian, W., Zhang, L., and Yang, H.: The Chinese spring festival impact on air quality in China: A critical review, Int. J. Env. Res. Pub. He., 19, 9074, https://doi.org/10.3390/ijerph19159074, 2022.
Yang, J., Zhou, M., Li, M., Yin, P., Hu, J., Zhang, C., Wang, H., Liu, Q., and Wang, B.: Fine particulate matter constituents and cause-specific mortality in China: a nationwide modelling study, Environ. Int., 143, 105927, https://doi.org/10.1016/j.envint.2020.105927, 2020.
Yang, T., Liu, B., Yang, Y., Dai, Q., Zhang, Y., Feng, Y., and Hopke, P. K.: Improved positive matrix factorization for source apportionment of volatile organic compounds in vehicular emissions during the Spring Festival in Tianjin, China, Environ. Pollut., 303, 119122, https://doi.org/10.1016/j.envint.2021.106979, 2022.
Yin, X., Sun, Z., Miao, S., Yan, Q., Wang, Z., Shi, G., Li, Z., and Xu, W.: Analysis of abrupt changes in the PM2.5 concentration in Beijing during the conversion period from the summer to winter half-year in 2006–2015, Atmos. Environ., 200, 319–328, https://doi.org/10.1016/j.atmosenv.2018.11.057, 2019.
Zhou, W., Xu, W., Wang, Q., Li, Y., Lei, L., Yang, Y., Zhang, Z., Fu, P., Wang, Z., and Sun, Y.: Machine learning elucidates the impact of short-term emission changes on air pollution in Beijing, Atmos. Environ., 283, 119192, https://doi.org/10.1016/j.atmosenv.2022.119192, 2022.