the Creative Commons Attribution 4.0 License.
the Creative Commons Attribution 4.0 License.
Multi-decadal ozone air quality and the role of temperature in Switzerland during summertime
Clara M. Nussbaumer
Colette L. Heald
Amanda M. Häne
Christoph Hüglin
Tropospheric ozone (O3) is a greenhouse gas and air pollutant. Despite efforts to control O3 precursor emissions, O3 levels frequently exceed the Swiss air quality standards. We present multi-decadal summertime measurements of O3 and its precursors across Switzerland from 12 NABEL (Nationales Beobachtungsnetz für Luftfremdstoffe) stations, which are representative of traffic, (sub)urban, rural and background conditions. Average O3 levels have decreased at rural and background sites, remained constant at (sub)urban sites and increased under traffic conditions over the past two decades. Traffic, (sub)urban and rural sites exhibited a pronounced weekend effect at the beginning of the century, which has weakened over time and only persists under traffic conditions today, suggesting that O3 formation is becoming more NOx-sensitive. O3 exhibits a strong dependence on temperature (), which has weakened uniformly at all site types over time. At polluted sites, this effect could be associated with the decreasing influence of titration. While reductions of precursor levels have shifted the probability of O3 exceedances to higher temperatures, O3 is still frequently exceeded on hot summer days and the number of days exceeding 30 °C has tripled since 2000. Ozone formation has been suppressed due to the titration by NO in many locations in the past but is dominated by NOx-sensitive O3 chemistry in background, rural, and (sub)urban environments today. Ozone titration remains dominant under traffic conditions, where O3 levels are currently increasing with NOx and will likely increase for several years before emissions reductions will become effective.
- Article
(3657 KB) - Full-text XML
-
Supplement
(2597 KB) - BibTeX
- EndNote
Tropospheric ozone (O3) adversely impacts climate and human health as a greenhouse gas and air pollutant. In urban areas, it contributes to poor air quality increasing the risk of cardiovascular and respiratory diseases, and associated premature mortality (Nuvolone et al., 2018). A recent study by Wang et al. (2025b) estimated that approximately 94 % of the global population is chronically exposed to unhealthy levels of O3 resulting in approximately 1.4 million premature deaths annually. In the European Union, 70 000 deaths were attributed to O3 exposure in 2022 as reported by the European Environmental Agency (2024). In light of these impacts, governmental air quality standards are implemented with the objective of improving public health. In Switzerland, this standard is set to a 1 h average of 120 µg m−3 (∼ 60 ppbv) by the Swiss Ordinance of 16 December 1985 on Air Pollution Control (Luftreinhalte-Verordnung), which must not be exceeded more than once per year (Schweizerischer Bundesrat, 1985).
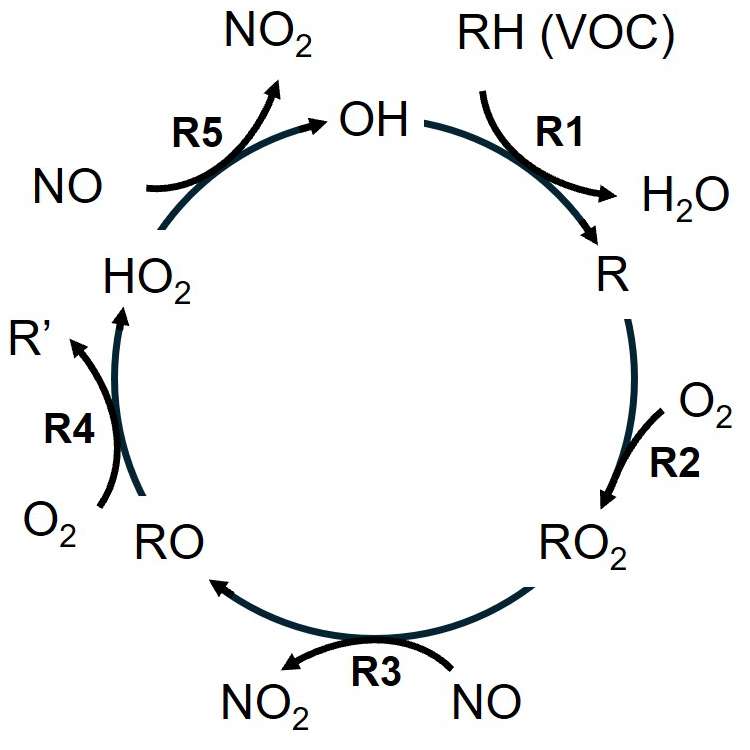
O3 is not emitted directly from a source but is photochemically formed from its precursors, which are nitrogen oxides (NOx) and volatile organic compounds (VOCs). NOx represents nitric oxide (NO) and nitrogen dioxide (NO2) and is mainly emitted as NO from high-temperature processes, including combustion in vehicles, industrial activities and lightning, as well as NOx from soils (Denman et al., 2007; Huang et al., 2017; Nault et al., 2017; Weng et al., 2020). VOCs are gaseous carbon-containing molecules of diverse origin, e.g., combustion, fuel evaporation, household and personal care products or vegetation (Guenther et al., 2012; Sindelarova et al., 2014; McDonald et al., 2018; McDuffie et al., 2020). NOx and VOCs form O3 in the presence of sunlight. This catalytic O3 formation cycle, as shown in Fig. 1, is initiated by the oxidation of VOCs (here displayed as RH) by OH (Reaction R1), which produces peroxy radicals RO2 in the presence of molecular oxygen O2 (Reaction R2). RO2 reacts with NO to form NO2 and alkoxy radicals RO (Reaction R3), which further produce HO2 with O2 (Reaction R4). HO2 oxidizes NO to NO2 and at the same time regenerates the OH radical (Reaction R5). NO2 subsequently forms NO and O3 in the presence of sunlight via Reactions (R6a) and (R6b) (Crutzen, 1988; Seinfeld and Pandis, 2016). In turn, NO and O3 form NO2 via Reaction (R7). NO2 and O3 interconvert on a time scale of minutes.
Close to NO emissions sources, for example in proximity to roads, O3 is rapidly titrated to NO2 via Reaction (R7). Therefore, NO2 and O3 are often considered as their sum: odd oxygen (Ox). Net O3 production only occurs when NO2 is generated from the reaction of nitric oxide with peroxy radicals (RO2 or HO2) rather than O3 as the latter is only a recycling mechanism. Various termination reactions of the catalytic cycle in Fig. 1 make O3 formation non-linear. These are mainly radical recombination, such as the self-reaction of the peroxy radical, as well as the reaction of NO2 with OH forming nitric acid (HNO3). As a consequence, O3 can either increase or decrease in response to precursor changes. For low NOx environments, increasing NOx leads to an acceleration of the catalytic O3 formation cycle and O3 production increases. This is referred to as NOx-sensitive O3 formation chemistry. For high NOx in contrast, enhancements in NOx lead to decreases in O3 production due to the formation of nitric acid, which lowers the availability of OH radicals catalyzing the O3 formation cycle. In this chemical environment, increases in VOCs lead to O3 production enhancements and the chemistry is referred to as VOC-sensitive. The crossover between NOx- and VOC-sensitive chemistry is described as a transitional regime (Pusede et al., 2015). While in theory O3 formation peaks in this transition (given a large local, homogeneous air mass), depending on the spatial resolution and the meteorological conditions maximum O3 production can also occur in air masses characterized as NOx- or VOC-sensitive. Several studies have reported this observation in the U.S. and China (Mazzuca et al., 2016; Tan et al., 2018; Guo et al., 2021; Stockwell et al., 2025). Various parameters, including ambient NOx levels, VOC reactivity, temperature and photolysis rates, can additionally impact the number of O3 molecules produced per NOx, which is referred to as the ozone production efficiency (OPE) (Kleinman et al., 2002; Chace et al., 2025).
The non-linear formation chemistry of O3 makes its control in urban environments challenging, as decreases in precursor emission, aimed at improving local air quality, can lead to O3 increases instead when the formation chemistry is VOC-sensitive. In addition, close to emission sources the titration effect of O3 via Reaction (R7) can dominate. The term titration refers to a temporary sink of O3 through reaction with NO, which can dominate NOx cycling at night due to the absence of NO2 photolysis or in proximity to large primary NO sources, which rapidly convert all or a part of O3 to NO2. O3 changes with NOx are then similar to those affected by VOC-sensitive chemistry, making it difficult to identify the required measures to achieve O3 decreases. An additional challenge is the lifetime of O3, which is of the order of hours to days close to the surface, and of weeks to months in the free troposphere. Therefore, an exceedance of O3 standards can result not only from local production, but also from long-range transport from outside the studied region (Cooper et al., 2010). Particularly remote sites are often dominated by the O3 background rather than local formation. Derwent et al. (2015) reported an average of 16–24 ppbv of European surface O3 originates from intercontinental transport in the Northern Extratropics. The contribution of transported O3 to the total O3 was found to exhibit a strong seasonal cycle with the largest impact in winter. In contrast, short-lived pollutants such as NOx (lifetime of minutes to hours) are significantly easier to control with emission standards as reductions in local emissions directly translate to decreases in the local burden.
Various studies have investigated surface O3 in urban environments. An important method for identifying the dominating formation sensitivity of O3 is the weekend effect, which was originally suggested by Levitt and Chock (1976). Lower NOx on weekends due to less vehicle traffic, which is often observed in densely populated and polluted regions, causes O3 to increase when chemistry is VOC-sensitive. This observation was reported by Fujita et al. (2003), Chinkin et al. (2003) and Pollack et al. (2012) for the Californian South Coast Air Basin (SoCAB), an area known for its poor air quality. More recent studies including Baidar et al. (2015), Nussbaumer and Cohen (2020), Perdigones et al. (2022) showed that SoCAB O3 chemistry was transitioning and approaching NOx sensitivity in recent years with lower O3 on weekends compared to weekdays as an outcome of successful emission reductions. While O3 increases on weekends are often an indication for VOC-sensitive O3 chemistry, decreased O3 titration on weekends (via Reaction R7) due to less NO can also lead to higher weekend O3, as shown by Murphy et al. (2007) close to Sacramento (US). In that case, the reaction of NO with O3 outweighs the photolysis of NO2, and the net loss of O3 () proceeds faster than the reactions shown in Fig. 1. Geddes et al. (2009) reported unchanged O3 levels in Toronto, Canada, between 2000 and 2007 despite significant precursor reductions, where lowered O3 production was countered by decreased O3 titration.
A number of studies have investigated O3 trends across Europe over the past decades, many of which reported increases in surface O3 despite precursor reductions, particularly in polluted regions (Yan et al., 2018; Boleti et al., 2020; Adame et al., 2022; Massagué et al., 2024; Wang et al., 2025a). These studies highlight the continued need to monitor O3 and its formation processes in Europe. Fewer studies have focused on O3 in Switzerland. Ordoñez et al. (2005) investigated O3 in Switzerland between 1992 and 2002 and found O3 titration and dry deposition to be the prevailing processes during winter, while summertime O3 was dominated by O3 production. Aksoyoglu et al. (2014) reported increases in average surface O3 at all sites in Switzerland between 1990 and 2005 based on observations and modeling. These increases were attributed to the reduced impact of titration at polluted sites and to changes in background O3 at the remaining sites. In contrast to average O3, peak O3 was found to decrease at rural sites. Boleti et al. (2018) analyzed changes in surface O3 in Switzerland between 1990 and 2014 and found that O3 was increasing at the majority of the 21 investigated stations until the mid 2000s, but was decreasing afterwards. The trend reversal occurred earlier for sites further away from NOx emissions sources and later for sites impacted by traffic. Boleti et al. (2019) reported continuous decreases in peak O3 in Switzerland over the same time period.
O3 exhibits a strong dependence on temperature, as highlighted by various studies in the U.S., Europe and Asia (Pusede et al., 2015; Coates et al., 2016; Porter and Heald, 2019; Nussbaumer and Cohen, 2020; Wu et al., 2024; Chang et al., 2025; Qin et al., 2025). Explanations for this correlation are numerous and include meteorological reasons, such as stagnation and humidity, as well as an enhanced abundance of precursors, e.g. temperature-dependent VOC emissions, soil NOx emissions or PAN (peroxy acetyl nitrate) decomposition (Porter and Heald, 2019). Li et al. (2025) reported a 50 % decrease in the temperature dependence of summertime O3 in the U.S. between 1990 and 2021 as a combined outcome of meteorological changes and anthropogenic NOx reductions, the latter reducing the O3 impact of temperature-dependent biogenic VOCs, dry deposition and PAN decomposition (decrease in the O3-T sensitivity). This was found to outweigh increases in the O3-T sensitivity by soil-NOx emissions under anthropogenic NOx reductions.
In this study, we investigate summertime O3 in Switzerland between 2000 and 2024 based on 12 different ground-based measurement sites. We present decadal trends for O3, its precursors and exceedance probabilities of current air quality standards under traffic, (sub)urban, rural and background conditions, as well as day-of-week patterns and the correlation with temperature. The NABEL network offers a unique framework for comparing O3 formation mechanisms across a compact geographic region characterized by a high site diversity, including polluted conditions with large local anthropogenic emissions, urban conditions with less primary sources of O3 precursors, more pristine conditions with low local emissions and background conditions with negligible local pollution and free tropospheric impact. Unlike the majority of the air quality literature focusing on a specific city or urban agglomeration, this study provides an overview of the mechanisms that control O3 levels under these diverse conditions. Current literature on O3 air quality in Switzerland (Boleti et al., 2018, 2019) incorporates data through 2014. This study closes this decade-long gap and reveals unexpected increases of O3 at polluted sites. Finally, this study provides evidence for titration as a driver of changing O3-temperature sensitivity under polluted conditions, which has not been heretofore reported and may be an important consideration when unraveling photochemical processes in other regions.
2.1 NABEL network
We use surface observations from the NABEL (Nationales Beobachtungsnetz für Luftfremdstoffe) network, which provides long-term measurements of trace gases and meteorology at 16 different sites in Switzerland (Hüglin et al., 2024). The network is maintained and operated by the Federal Office of the Environment (FOEN) and the Swiss Federal Laboratories for Materials Science and Technology (Empa). The meteorological data are provided by NABEL (stations BER, LAU, ZUE, DUE, DAV, RIG) and MeteoSwiss (stations BAS, CHA, LUG, MAG, PAY, TAE). For this analysis, we chose 12 sites representative of traffic (Bern-Bollwerk BER and Lausanne-César-Roux LAU), (sub)urban (Zürich-Kaserne ZUE, Dübendorf-Empa DUE, Basel-Binningen BAS and Lugano-Universita LUG), rural (Magadino-Cadenazzo MAG, Payerne PAY and Tänikon TAE) and background (Chaumont CHA, Davos-Seehornwald DAV and Rigi-Seebodenalp RIG) conditions with a record of O3 since the year 2000. We define the background as rural sites between 1000 and 2000 m altitude (excluding sites at higher altitudes that predominantly sample the free troposphere). The sites RIG and CHA are located at the slope and the ridge of mountains, respectively, and are therefore impacted by the nocturnal residual layer during the night and in the morning hours. We differentiate between rural sites at low and high elevations to capture the local photochemistry at sites with negligible anthropogenic pollution versus conditions which are impacted both by local processes as well as free tropospheric impacts due to the influence of the residual layer. Figure 2 shows a map with the location of the NABEL sites used here. We use trace gas observations of NO, NO2 and O3. At the majority of the stations, NO and NO2 are measured via chemiluminescence with a molybdenum converter (employment of three different instrument types: APNA 370 NOx monitor (HORIBA), 42i TL/42iQ TL NOx Analyzer (Thermo Fisher Scientific) and T200 NOx Analyzer (Teledyne API)). O3 is measured via UV-absorption (49i ozone analyzer, Thermo Fisher Scientific). The instruments are zero point corrected every four weeks. The maximum four-week zero point drifts are ±0.2 ppbv for NOx and ±0.3 ppbv for O3. Span calibrations of the NOx instruments are also performed every four weeks. For O3, span calibration requires the use of a transfer photometer, which is deployed twice a year (in April and September) at each site. Drifts of the O3 instruments are corrected when the response deviates more than ±2 % of the calibration gas concentration. The measurement uncertainties of NO, NO2 and O3 comply with the requirements for regulatory measurements and are in the range of the limit values < 10 % (Empa and BAFU, 2024). The observed variability is dominated by the atmospheric conditions and the influence of local sources rather than the instrumental uncertainty. Non-methane volatile organic compounds are measured via flame ionization detection, but the spatial and temporal availability of the measurements is limited. Continuous measurements are available at three urban sites (DUE, LUG and ZUE) only, which we use as an estimation for decadal VOC changes across Switzerland. Long-term speciated VOC or VOC reactivity measurements are not available at these sites. We further use temperature, pressure and solar radiation measurements, which are provided by Empa and BAFU at DAV, DUE, HAE, LAU, RIG, ZUE and by MeteoSwiss at BAS, CHA, LUG, MAG, PAY, TAE. Further details regarding the location of the NABEL sites and the measurement methods can be found in the NABEL technical report (Empa and BAFU, 2024).
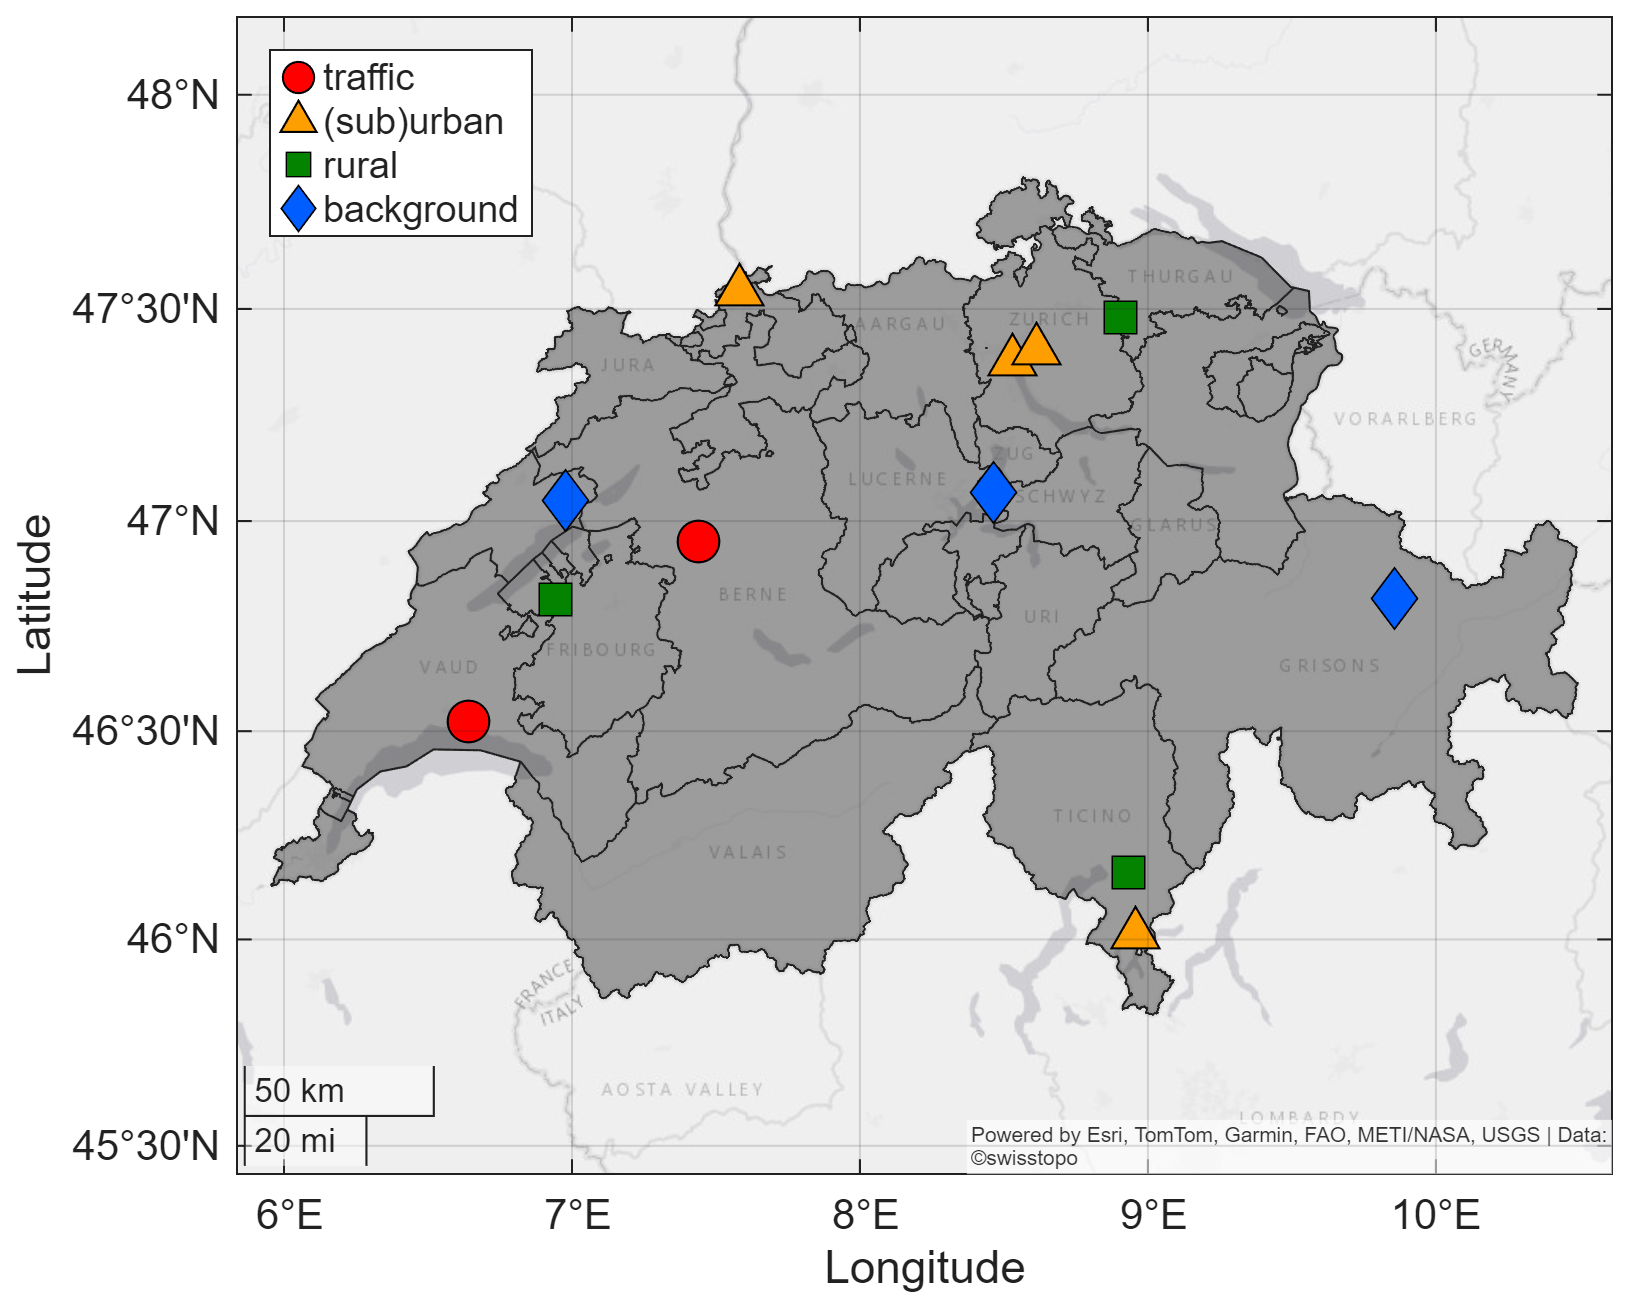
Figure 2Location of the NABEL sites used in this study. © Map Data: swisstopo (Federal Office of Topography swisstopo, 2024).
2.2 Data Processing
Unhealthy levels of O3 mostly occur in the summer months and we therefore focus this analysis on the months of April to August. We use hourly values between 09:00 and 18:00 local time (UTC+2), which we refer to as daytime in the following. Throughout the months of interest, these hours occur at least two hours after local sunrise and two hours before local sunset, which we chose to minimize the substantial impact of the diurnal variation in the boundary layer height. For some analyses, we have separated data into weekdays (Monday to Friday) and weekends (Saturday and Sunday). We further perform temperature-dependent analyses and define a low (10–20 °C), medium (20–30 °C) and high (≥ 30 °C) temperature range. For investigating the exceedance probability of O3 and Ox, we follow the air quality standards of the Swiss Ordinance of 16 December 1985 on Air Pollution Control (Luftreinhalte-Verordnung), which states that the 1 h average values must not exceed 120 µg m−3 more than once per year (Schweizerischer Bundesrat, 1985). At all stations, we consider O3 and Ox hourly values above 60 ppbv to be in exceedance of this standard. The exceedance probability (EP) is defined as the percentage of hours during daytime from April to August with O3 (O3 EP) or Ox (Ox EP) exceeding 60 ppbv. The observational frequency at the NABEL sites is highly consistent over time, which we show in Fig. S1 of the Supplement for O3, NOx and temperature measurements. At all stations, the data completeness exceeds 90 % for hourly measurements in each year.
3.1 Decadal Summertime Trends of Trace Gases
Figure 3 shows the decadal changes of summertime (a) NOx, (b) O3, (c) Ox and (d) the share of O3 in Ox at traffic (red), (sub)urban (orange), rural (green) and background (blue) sites between 2000 and 2024. The relative change between the beginning and the end of the record is shown in the boxes in the top right corners. Solid boxes represent significant (p-value ≤ 0.05) and dashed boxes represent insignificant (p-value > 0.05) trends. We show the 1σ standard deviation of the averaging in Fig. S2 of the Supplement, which highlights the atmospheric variability and ranges between 25 % for background Ox and 95 % for urban NOx.
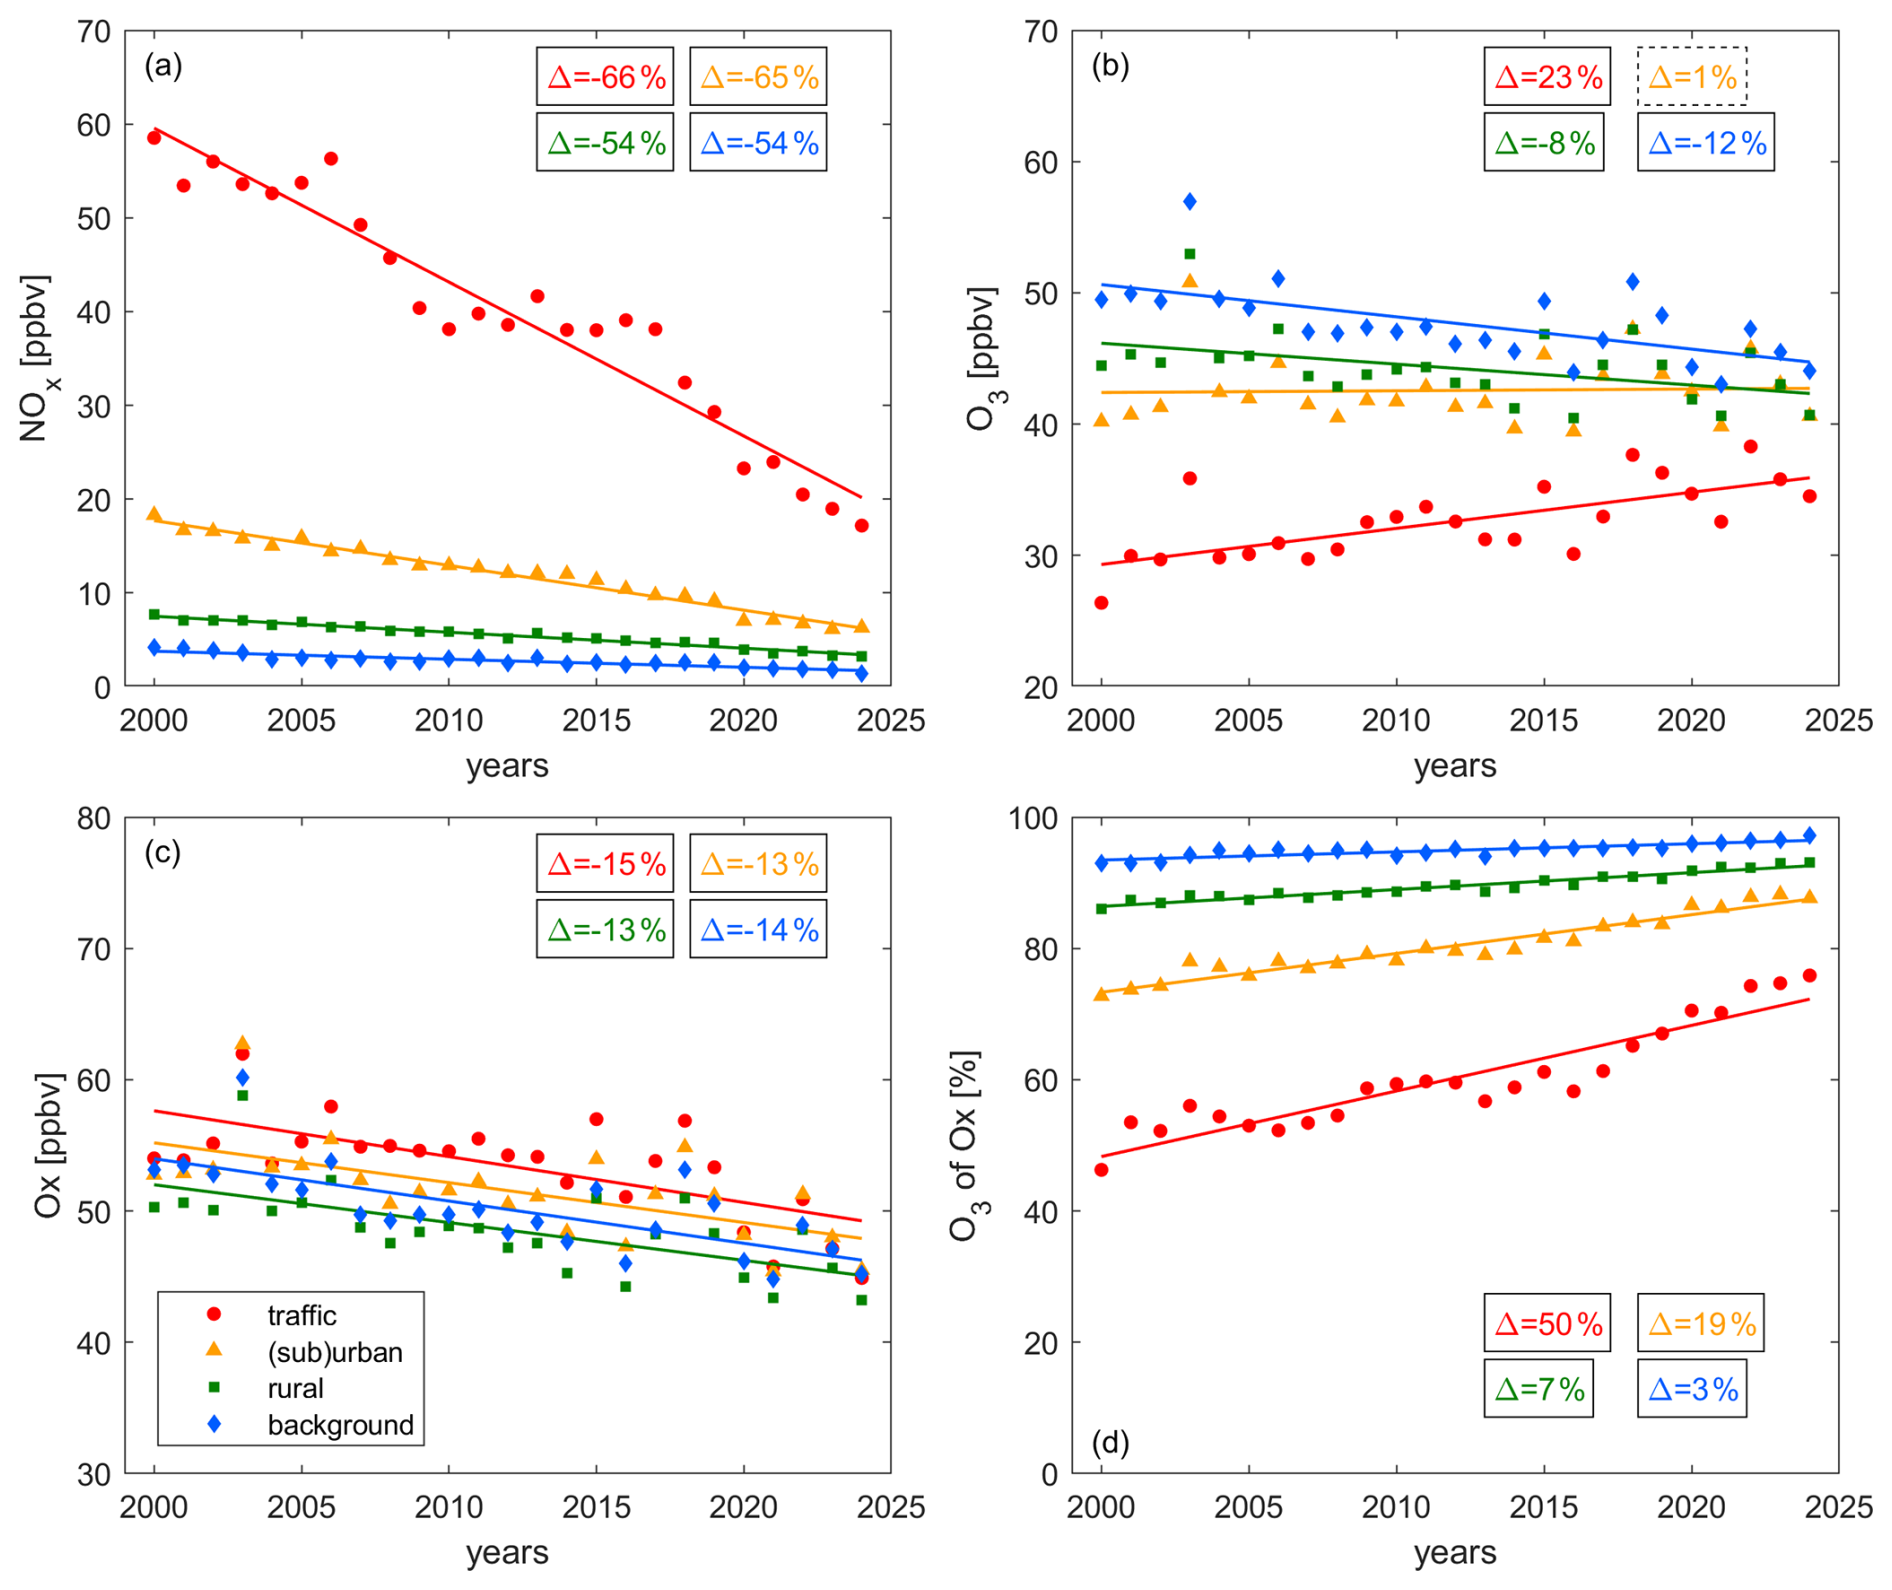
Figure 3Decadal trends of (a) NOx, (b) O3, (c) Ox and (d) the share of O3 in Ox at traffic (red), (sub)urban (orange), rural (green) and background (blue) sites. The markers show the yearly averages and the lines represent their associated linear fits. The boxes show the relative change of the trace gas levels between 2000 and 2024, whereby solid lines denote significant (p-value ≤ 0.05) and dashed lines insignificant (p-value > 0.05) trends.
NOx has decreased at all sites with a similar relative magnitude over the past two decades. All trends are significant. In 2000, average NOx was around 60 ppbv at the traffic sites and has decreased to 20 ppbv today (−1.64 ppbv yr−1, R2 = 0.93). It should be noted, that the decrease plateaued between 2009 and 2017, and then continued to the present day. This plateau is only pronounced at traffic sites, which could point towards the role of on-road emissions, and coincides with the time of the disclosure of the Dieselgate scandal in September 2015. Grange et al. (2020) found a reduction in NOx emissions by up to 36 % from affected diesel vehicles as an outcome of hard- or software updates in the United Kingdom in the years following 2015. Further research is required to determine to what degree emissions from the diesel fleet could have affected the observed plateau in NOx levels in Switzerland and the subsequent decline in the late 2010s. Average NOx at (sub)urban sites declined by around (−0.48 ppbv yr−1, R2 = 0.97) and halved at rural (−0.17 ppbv yr−1, R2 = 0.97) and background (−0.09 ppbv yr−1, R2 = 0.83) sites. These NOx reductions highlight the successful anthropogenic emission control in response to legislative restrictions over the past decades and are ongoing. The extent of NOx reductions is slightly smaller at rural and background compared to traffic and (sub)urban sites (∼ vs. ∼ ), which is consistent with larger relative contributions from natural NOx emissions at more remote sites. At all sites, both NO and NO2 have declined, as shown in Fig. S3 of the Supplement. At traffic sites, NO has declined faster than NO2 (78 % vs. 53 %) and the ratio between NO and NO2 has decreased from 1.1 to 0.6 over time as shown in Fig. S3c. The ratio declined faster before 2010 (from 1.1 to 0.7), with a more modest decline to present day (from 0.7 to 0.6). The majority of NOx is emitted as NO and therefore, close to major sources, such as busy roads, the ratio of NO to NO2 is expected to be higher compared to more remote areas. The observed decline in NO : NO2 over time is in line with findings from Hüglin and Rohrbach (2022), who investigated NO and NO2 levels in Zürich (Switzerland), and could be an indication that NO emissions control has been more effective than NO2 reductions or represent the increasing share of diesel vehicles on roads, with a higher share of NO2 in NOx emissions compared to gasoline cars. Empa (2024) reported an increase in overall tailpipe NO2 emissions in Switzerland from 3737 t yr−1 in 2000 to 5862 t yr−1 in 2020 (peak in 2015 with 10 174 t yr−1), while NOx emissions declined from 58 331 t yr−1 in 2000 to 26 864 t yr−1 in 2020. The increase in NO2 emissions was entirely associated with diesel vehicles, partially offset by a decline in NO2 emissions from gasoline engines. Grange et al. (2017) reported increases in the NO2 NOx ratio at European roadsides between 1995 and 2009 and a small decrease between 2010 and 2015. Potential explanations include the improvements of the exhaust after-treatment technologies with subsequent Euro standards, both in light- and heavy duty vehicles, which lead to NOx reductions with NO2 NOx emission ratios initially rising and then stabilizing and falling again from 2019 onward. The observed turnover coincides with the change in rate, which we observe in 2010 for traffic sites in Switzerland. The COVID-19 pandemic led to governmental measures to decelerate the spread of the virus and resulted in decreases in primary pollutants in many countries (Gkatzelis et al., 2021). While the lockdown measures in Switzerland were overall more moderate in comparison to the European average, reductions of around 20 % in private motorized road transport in 2020 compared to 2019 were reported by the Swiss Federal Office of Statistics (Bundesamt für Statistik BFS, 2024, 2025b). On 16 March 2020 the Swiss federal council announced an “extraordinary situation” and introduced measures to contain the pandemic, which lasted approximately two months (Schweizerischer Bundesrat, 2020). For this time period, we observe reductions in NOx mixing ratios by around in comparison to the previous year. The reduction was only around 10 %–15 % in the following summer months. NOx summertime averages were lower in 2020 compared to 2019 and 2021 at traffic and (sub)urban sites, which could be an outcome of the COVID-19 measures. However, the difference is in the range of the observed year-to-year variability for other years. Further aspects, which could impact the decadal NOx trend are changes in hybrid and remote work, for which the Swiss Federal Statistical Office reported an increase from around 25 % for pre-COVID years to 37 % in recent years (Bundesamt für Statistik BFS, 2025a). However, the population in Switzerland is currently increasing by around 1 % yr−1 and the number of private motorized vehicles has increased from around 3.5 million in 2000 to 4.8 million today (Bundesamt für Statistik BFS, 2024). The number of traffic congestion hours on national roads has continuously increased since the COVID-19 pandemic and was approximately twice as high in 2024 compared to pre-pandemic levels (Bundesamt für Strassen ASTRA, Fachbereich Verkehrsmanagement, 2025).
Figure 3b shows the decadal changes of O3. At the traffic sites, O3 has increased by 0.28 ppbv yr−1 (R2 = 0.49) between 2000 and 2024. This increase occurred despite strong decreases in NOx and can be explained by either a VOC-sensitive O3 formation chemistry or the dominance of titration, with NO decreases “releasing” O3. (Sub)urban O3 does not show any trend over time with levels of around 40 to 45 ppbv, while rural O3 has decreased by 0.16 ppbv yr−1 since 2000 (R2 = 0.20). The strongest decrease over time can be observed in background O3 by 0.25 ppbv yr−1 (R2 = 0.39). Overall, O3 close to traffic emissions shows the lowest values, followed by (sub)urban and rural O3. Background O3 levels are highest, but the gap to traffic O3 has diminished over time from an average of 20 ppbv in 2000 to 10 ppbv today.
Figure 3c shows Ox trends since 2000, which are decreasing at all sites with similar rates around 0.3 ppbv yr−1 (R2 ∼ 0.4). While O3 values show strong differences between the individual locations, Ox levels are more similar (around 50 ppbv today) highlighting the importance of partitioning between NO2 and O3. We would expect to see higher Ox for less remote locations due to stronger pollution, which can be observed for rural, followed by (sub)urban and traffic sites. In contrast, background Ox is higher than rural Ox. A potential explanation could be the impact of air masses entrained from the nighttime residual layer (with elevated O3), coupled with the reduced effectiveness of loss processes such as deposition, titration or other nighttime chemical losses. An additional contribution could be the intrusion of free tropospheric air with higher O3 levels due to the elevation of the background sites (> 1000 m). Ox decreases over time at all sites despite the increase of O3 at traffic sites due to the dominance of NO2 reductions.
Figure 3d shows the changes in the share of O3 in Ox over time, which increased at all sites. The increase is strongest for the most polluted sites and almost negligible for background conditions. At traffic sites, Ox consisted of 50 % O3 and 50 % NO2 at the beginning of the record, and the share of O3 increased to around 75 % today. This suggests that the role of titration has diminished over the past two decades and aligns with the observations of strong NO2 decreases and O3 increases. At (sub)urban sites the share of O3 in Ox has increased from 75 % to 90 % and at rural sites from 85 % to 95 %. Ox at background sites is almost equal to O3, which shows that titration is negligible.
Boleti et al. (2018) investigated trace gas trends at the NABEL sites between 1990 and 2014 and reported a reversal of increasing O3 trends at certain “breakpoint” years. These breakpoints occurred earlier for more remote and later for more polluted sites. They found a reversal of the trends at sites, which we categorize as rural and background, in the early 2000s. This is in line with our findings of decreasing O3 trends under these conditions from 2000 onward. Boleti et al. (2018) further reported breakpoints for (sub)urban and traffic sites in the late 2000s and early 2010s, respectively. We observe a small decline at these sites between 2012 and 2014. However, this temporary reduction is a modest deviation from an overall increasing trend (during a short plateau in NOx levels), which continues beyond the end of the study period of Boleti et al. (2018). Differences between this study and Boleti et al. (2018) could additionally arise as the latter investigated meteorology-adjusted values of O3 whereas we use direct observations.
3.2 Weekend Effect
Figure 4 shows the absolute differences between weekend and weekday levels of (a) NOx, (b) O3, (c) Ox and (d) the share of O3 in Ox at traffic (red), (sub)urban (orange), rural (green) and background (blue) sites. Positive values indicate higher weekday and negative values higher weekend levels. Weekday NOx is higher than weekend NOx at all sites with the largest difference for traffic sites and diminishing differences with increasingly remote conditions. This is likely caused by strong day-of-week patterns in on-road vehicle emissions with commuter and freight traffic on weekdays, which is more pronounced in city centers. The background sites are not located in proximity to any roads. However, the lifetime of NOx is on the order of a few hours to a day and the decline in NOx at the background sites could reflect the decline in transported NOx from nearby sources. The absolute weekend-weekday difference decreased significantly at all sites by around between 2000 and 2024. However, the relative difference remained constant over time at the traffic sites (Fig. S4). This suggests that the fleet composition at the measured sites does not depend on the day of the week or that emission reductions have been consistent across different vehicle types. Weekday reductions at (sub)urban, rural and background sites have been more efficient than weekend reductions leading to an increase in the relative difference over time by 25 % (R2 = 0.52), 25 % (R2 = 0.43) and 12 % (R2 = 0.17), respectively (Fig. S4). This could indicate that the fleet composition shows a different behavior than that observed for traffic sites or that different source types with day-of-week patterns are important at these sites, such as emissions from industrial activities. Further research is needed to understand these site-dependent magnitudes in NOx reduction on weekdays vs. weekends.
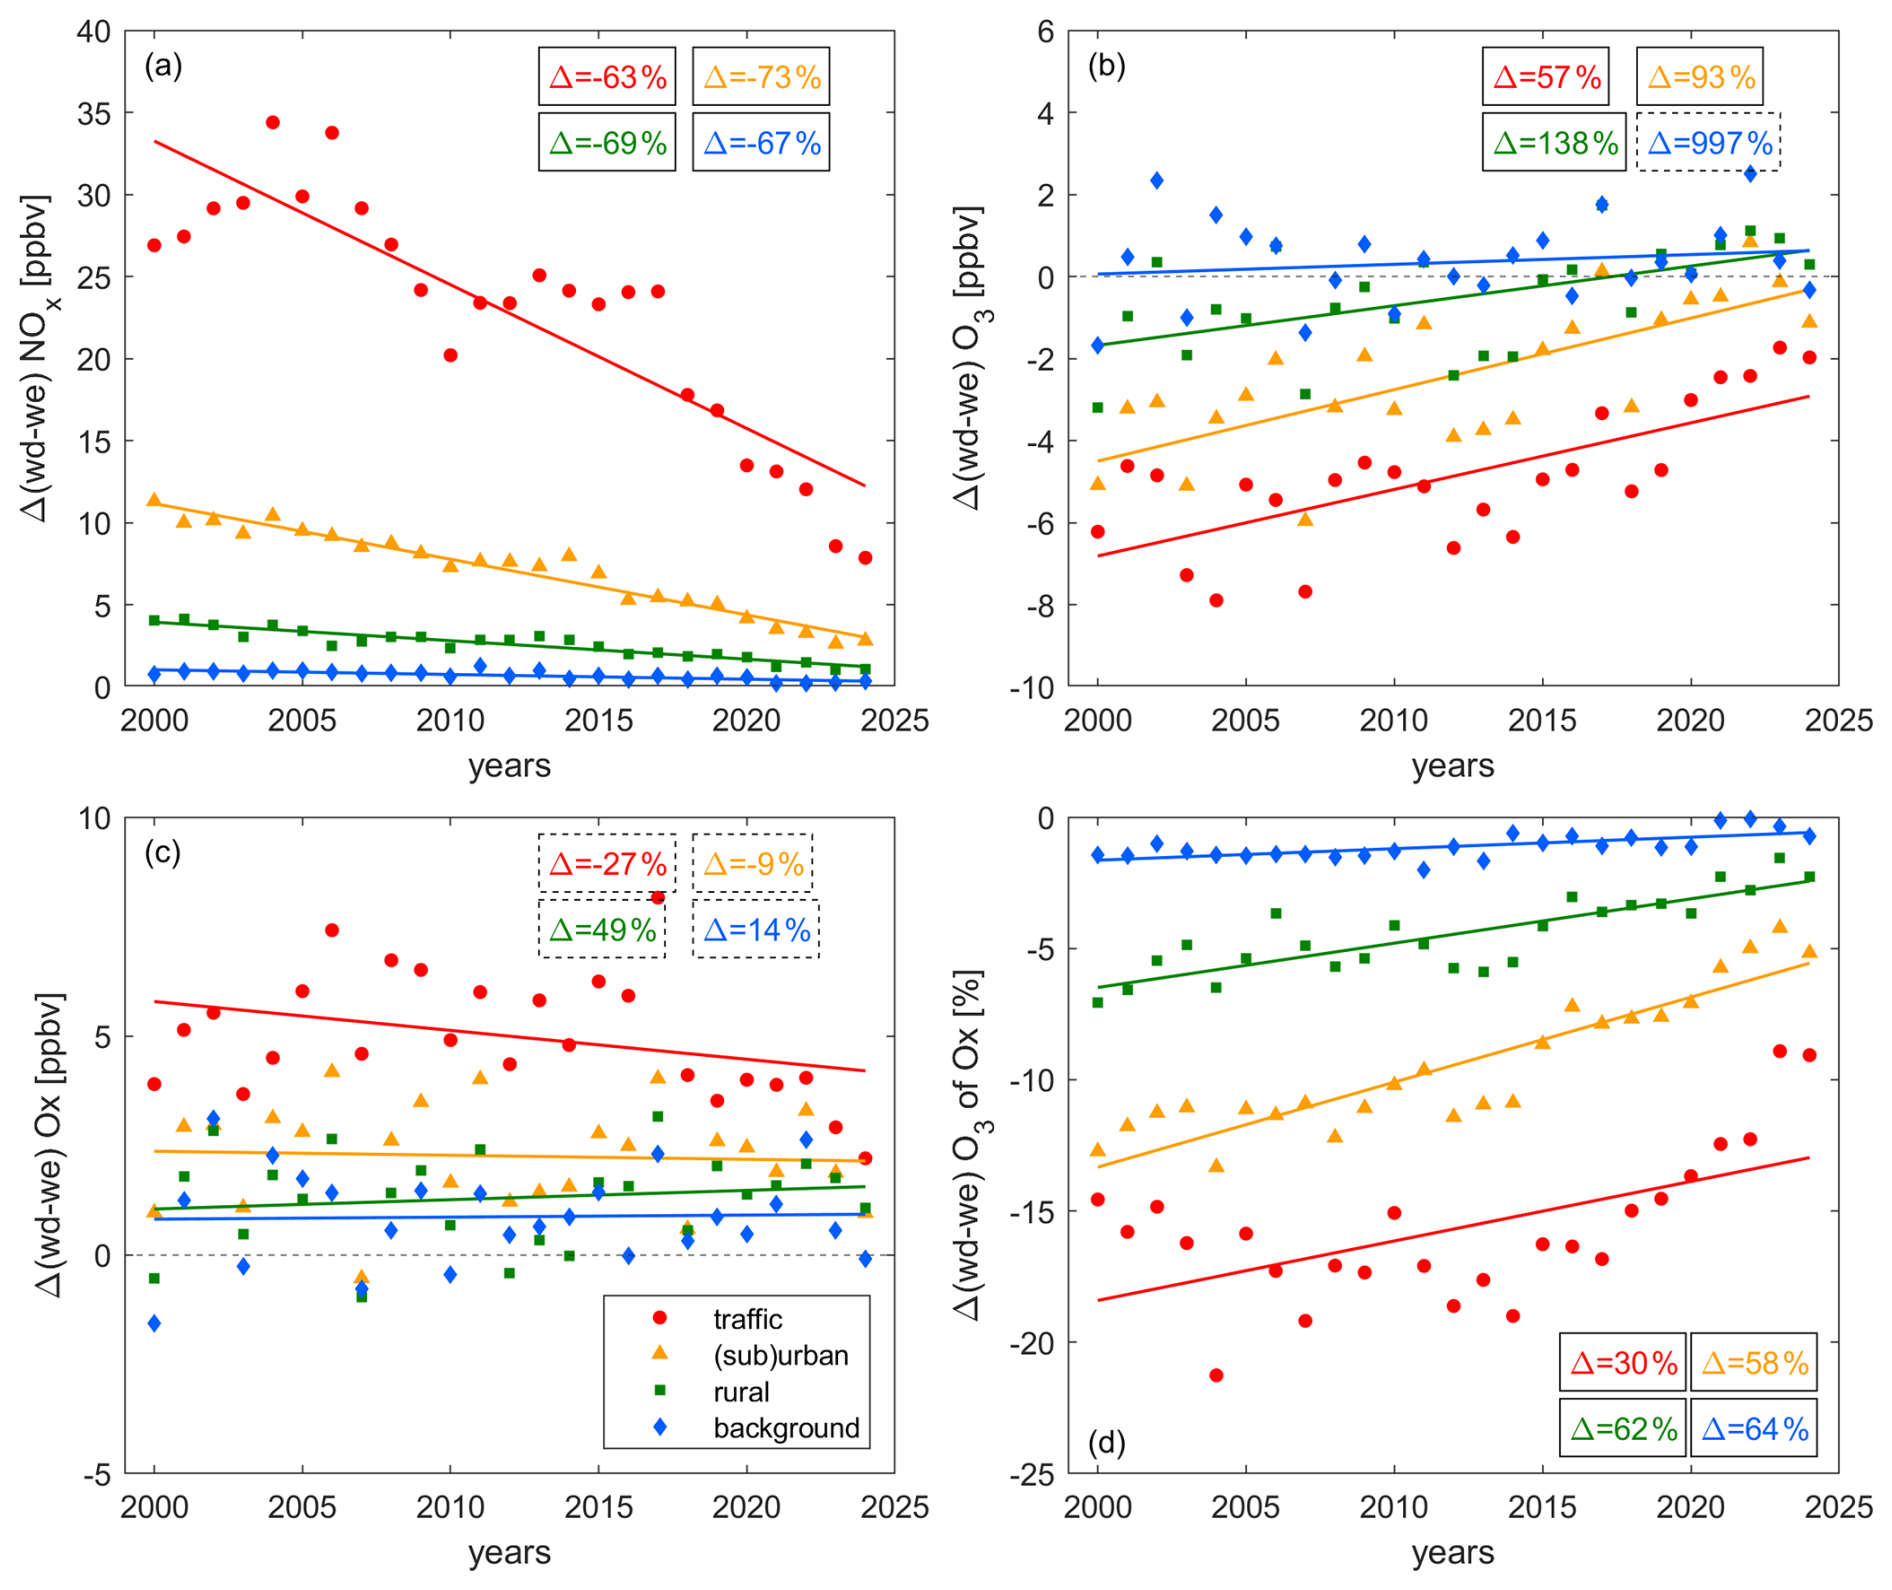
Figure 4Decadal trends of the difference in weekday and weekend levels of (a) NOx, (b) O3, (c) Ox and (d) the share of O3 in Ox at traffic (red), (sub)urban (orange), rural (green) and background (blue) sites. The markers show the yearly averages and the lines represent their associated linear fits. The boxes show the relative change of the trace gas levels between 2000 and 2024, whereby solid lines denote significant (p-value ≤ 0.05) and dashed lines insignificant (p-value > 0.05) trends.
Figure 4b presents the weekend–weekday changes of O3 over time. The background sites do not show a pronounced difference between weekdays and weekends, which is expected due to a small weekend–weekday difference in background NOx levels. All other sites show a pronounced weekend-O3 effect at the beginning of the record, which has decreased over time. Δ(wd–we) O3 at traffic sites decreased from 7 ppbv in 2000 to around 2 ppbv today. (Sub)urban and rural Δ(wd–we) O3 were 4 and 2 ppbv, respectively, in 2000. The difference in weekday and weekend O3 is small at these (sub)urban and rural sites today. It is difficult to determine the precise timing of the reversal of the weekend effect, however, weekday O3 has been higher than weekend O3 at rural stations continuously since 2019, while it has been mostly lower at (sub)urban sites. Higher weekday than weekend O3 for higher weekday than weekend NOx indicates dominating NOx-sensitive chemistry. The observations therefore suggest that NOx-sensitive chemistry has been dominant at background sites since the beginning of the record and that (sub)urban and rural sites are likely currently transitioning (or have recently transitioned) to NOx-sensitive O3 formation. Traffic sites are dominated by titration or VOC-sensitive O3 formation, either of which could explain higher weekend than weekday levels of O3 as a result of lower weekend than weekday NOx. Decadal changes of VOCs at ZUE, DUE and LUG (Fig. S5 of the Supplement) highlight that the extent of VOC and NOx reductions was similar over the past 20 years. Therefore, we do not expect any changes in the location of the transition point between VOC- and NOx-sensitive O3 formation over time. For sites characterized by NOx-sensitive chemistry, changes in VOCs do not impact the abundance of O3. Under VOC-sensitive conditions, a decline in O3 may result from VOC reductions. However, a precise quantification of the impact would require knowledge of the identity of these VOCs or the overall VOC reactivity, for which additional measurements are needed at all sites.
Figure 4c shows that all sites are characterized by higher Ox on weekdays compared to weekends. For sites with a negligible impact of titration we expect the same weekend effect of O3 and Ox (Murphy et al., 2007; Pusede and Cohen, 2012). This can be observed for background conditions, as well as rural sites in recent years and suggests dominating NOx-sensitive O3 formation. In contrast, for rural and (sub)urban sites at the beginning of the record as well as for traffic sites for the entire period, O3 has shown a distinct weekend effect with higher values on weekends, while Ox values have been higher on weekdays. This is suggestive of a sizeable impact of titration at rural and (sub)urban sites in the early 2000s and at traffic sites up to today, whereby a decrease of NO emissions on weekends shifts the equilibrium between NO2 and O3 towards O3. No significant trend over time can be observed for the Ox weekend-weekday difference at any site.
In Fig. 4d, we present the weekend-weekday difference of the share of O3 in Ox. While no significant difference can be observed for background sites, all other sites exhibit a higher share of O3 on weekends. This weekend effect is strongest for traffic, followed by (sub)urban and rural sites, which aligns with the findings for the weekend effect of NO2 and O3 and emphasizes that titration still plays a major role at traffic sites today. This conclusion is additionally supported by the diurnal cycle of NO and O3 (Fig. S6 of the Supplement), which shows that weekday morning NO peaks at traffic sites are associated with distinct daily O3 minima.
3.3 The Effect of Temperature
3.3.1 Decadal Changes in Temperature
Figure 5 shows (a) the trend of average summer daytime temperature over time and (b) the changes in high temperature days, defined as the number of days between April and August where temperatures exceed 30 °C for at least one hour. We have combined rural, (sub)urban and traffic sites in Fig. 5b. The background sites are located at higher elevation and therefore show lower temperatures and a negligible number of exceedances. For the trend analysis we exclude the year 2003, which was a severe heatwave year and showed a temperature anomaly of more than 5 °C in Switzerland (Black et al., 2004; Schär et al., 2004). We show these data points in Fig. 5a as open symbols. An increase in average temperature by 1.5 °C is observed at all sites since the beginning of the century. This in line with the current literature reporting rapid surface temperature increases in Europe since the 1990s (Dong et al., 2017; Twardosz et al., 2021). Twardosz et al. (2021) reported a summer time warming of 0.070–0.075 °C yr−1 in Switzerland between 1985 and 2020. The April to August average temperature was 13.8 °C at background sites and 19.2 °C at the remaining sites in 2024. The 1σ standard deviation of the averaging represents the inter-annual variability and is of the order of 50 % for the background sites and 30 % for the remaining sites. The number of days with a temperature exceeding 30 °C has increased more than 3-fold since 2000, when only around 10 d (∼ 7 % of all days) exhibited high temperatures, compared to 35 d today (almost of all days). We present the share of daily maximum temperature exceedances of the 95th percentile of all measurements at individual site types in Fig. S7 of the Supplement, which highlights that peak temperatures have increased similarly at all sites independent of the altitude.
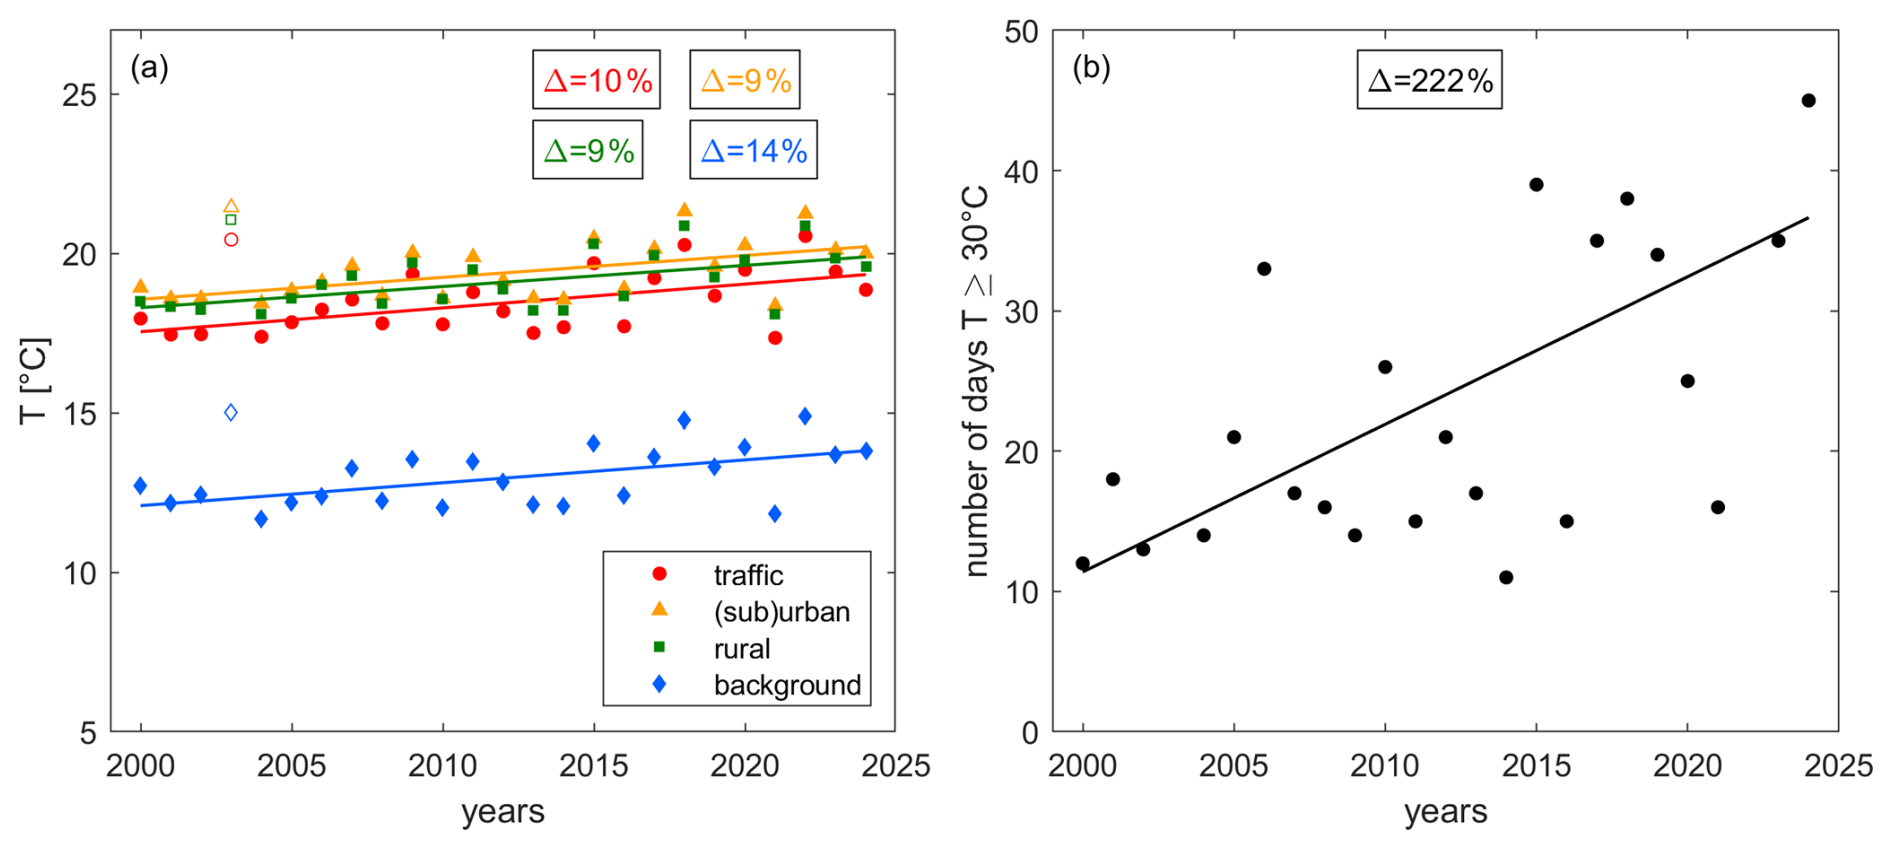
Figure 5Decadal trends of (a) average April–August daytime temperature at traffic (red), (sub)urban (orange), rural (green) and background (blue) sites and (b) the number of days above 30 °C (accounting for the maximum temperature at traffic, (sub)urban and rural stations combined). Boxes show the relative change between 2000 and 2024. All trends are significant (p-value ≤ 0.05).
3.3.2 Relationship of Trace Gases and Temperature
Figure 6 presents the relationship between (a) NOx, (b) O3, (c) Ox and (d) the share of O3 in Ox with temperature, which all exhibit strong correlations. We focus on data points above 10 and below 35 °C when calculating correlations. We show the 1σ standard deviation of the averaging in Fig. S8 of the Supplement. NOx levels decrease at all sites with increasing temperatures, while O3, Ox and the share of O3 in Ox show a strong positive correlation with temperature.
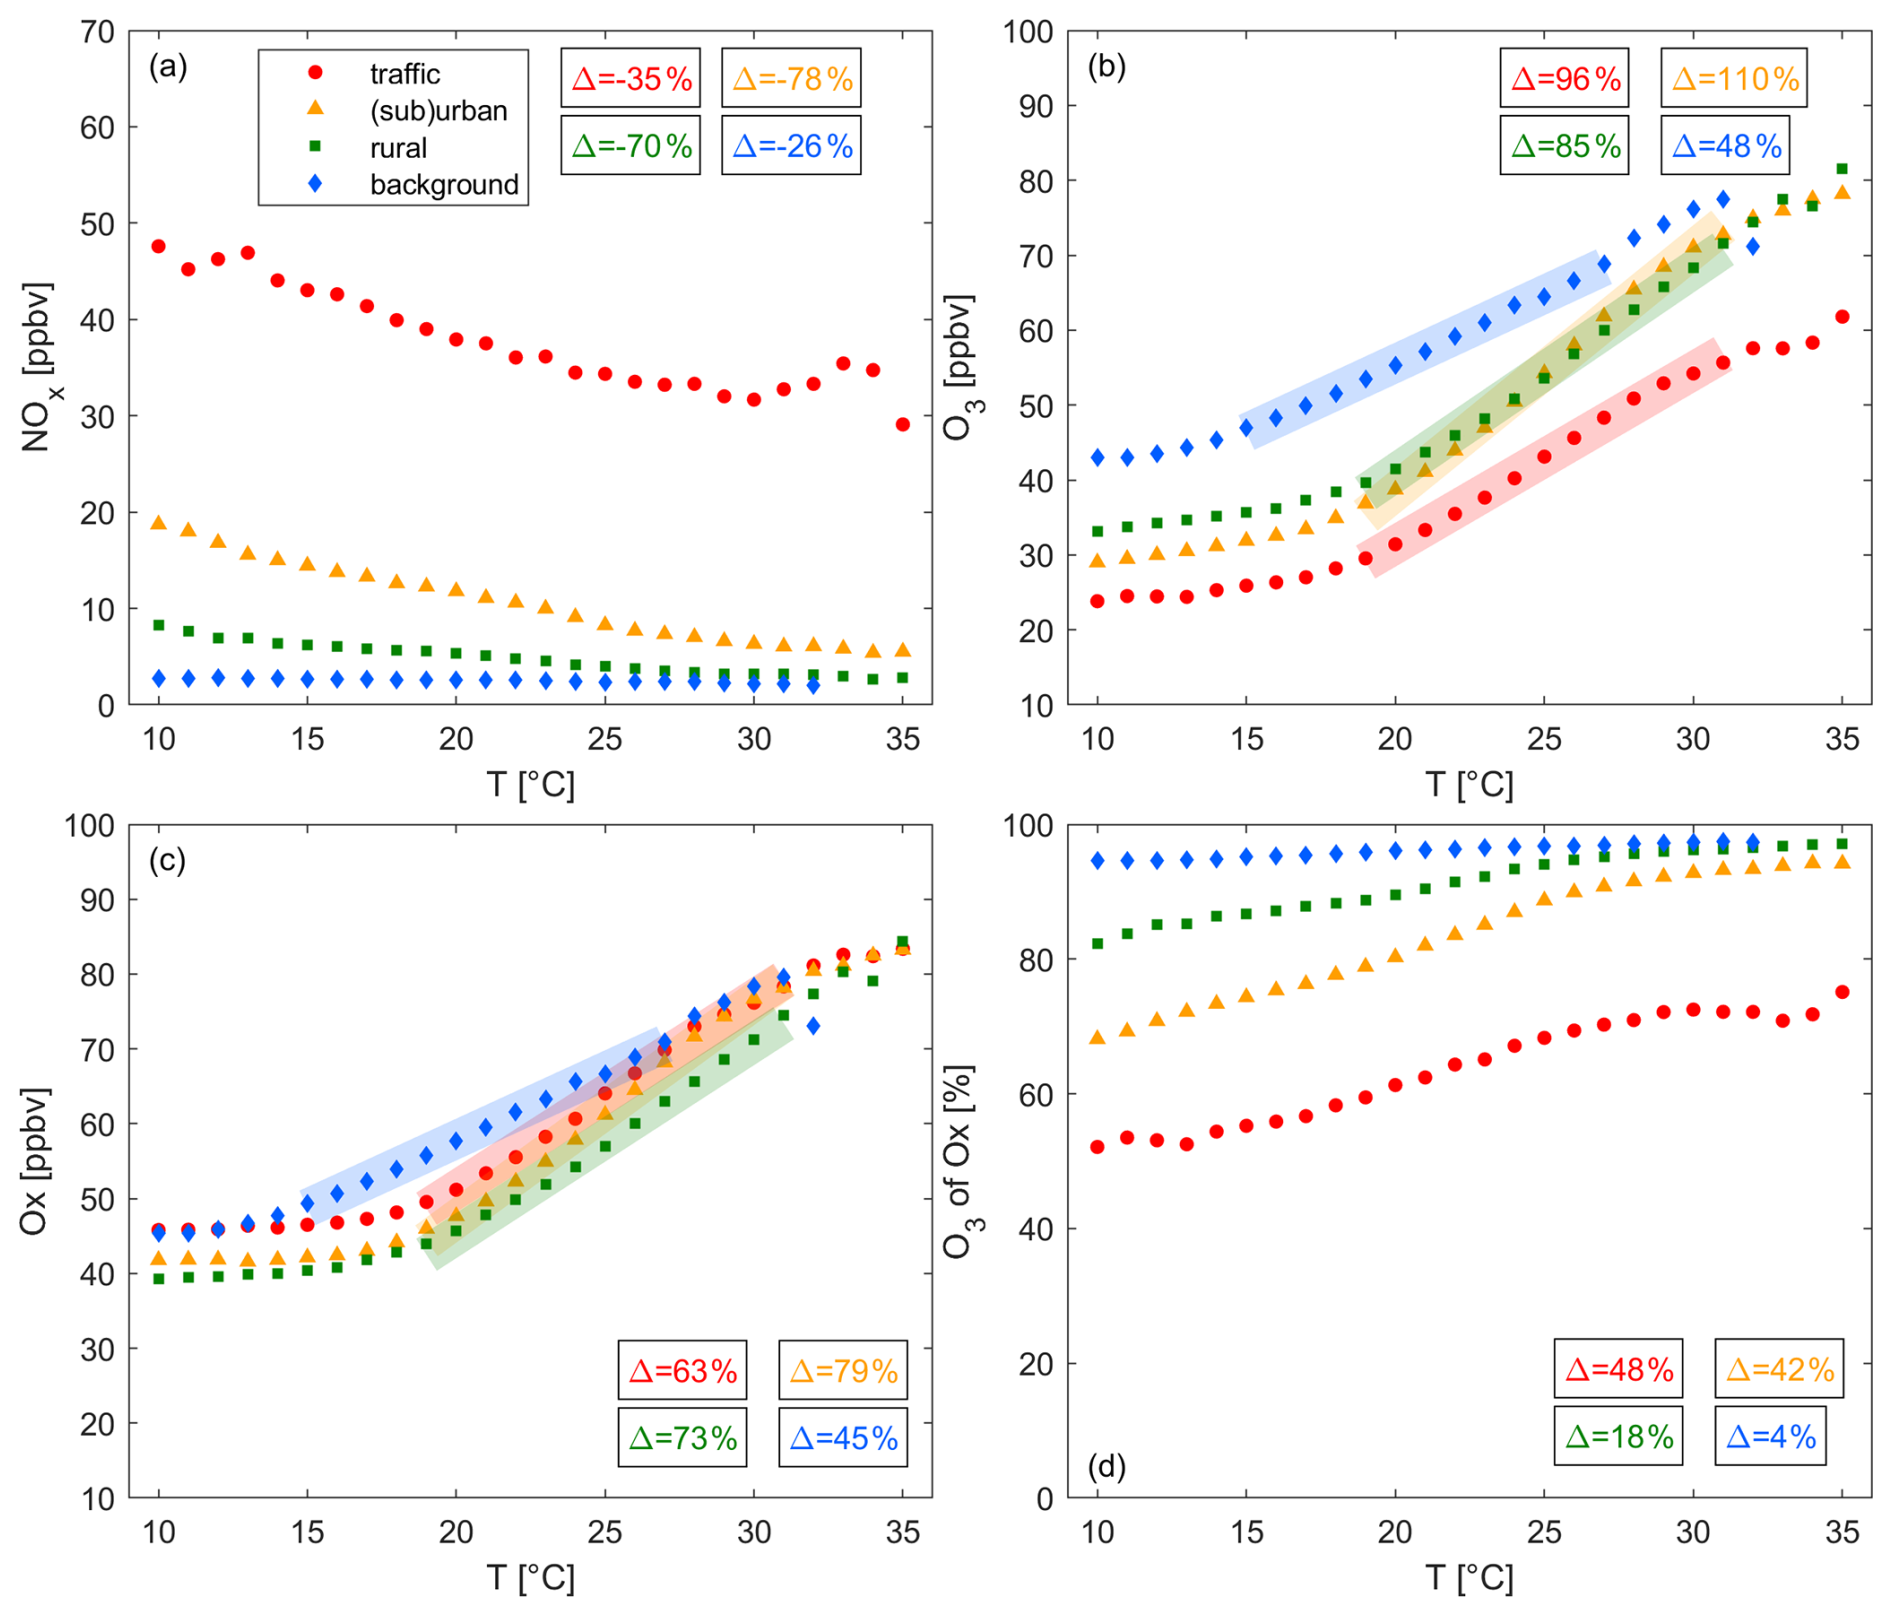
Figure 6Changes of (a) NOx, (b) O3, (c) Ox and (d) the share of O3 in Ox with temperature at traffic (red), (sub)urban (orange), rural (green) and background (blue) sites. The markers show the averages for all daytime (09:00–18:00 LT) hourly data (2000–2024) for each temperature bin. The boxes show the relative change of the trace gas levels for panels (a) and (d) between 10 and 35 °C and for panels (b) and (c) in the highlighted sections. All trends are significant (p-value ≤ 0.05).
The NOx temperature anti-correlation is strongest for polluted sites and negligible for background sites. At traffic sites, NOx mixing ratios decrease at a rate of 0.65 ppbv °C−1. A slightly smaller decline of 0.54 ppbv °C−1 can be observed for (sub)urban sites, followed by a decrease of 0.21 ppbv °C−1 for rural sites. These observations suggest that the NOx temperature correlation is linked to on-road NOx emissions and is weaker for remote sites with a larger share of natural NOx sources, such as soil NOx, which is expected to increase with temperature (Oikawa et al., 2015). Light-duty diesel vehicles, particularly prior to the Euro-6 standard, show a strong anti-correlation of NOx emissions and temperature. Grange et al. (2019) reported a decrease of NOx emissions by a factor of 3 for pre Euro-6 passenger cars and light duty vehicles between 0 and 25 °C. In Switzerland, the majority (> 90 %) of tailpipe NOx is emitted from passenger cars, light duty vehicles and heavy duty vehicles (Empa, 2024). We are focusing on emissions within town limits. In 2020, passenger vehicles contributed 72 % of overall in-town NOx vehicle emissions in Switzerland, followed by light-duty vehicles with 12 % and heavy duty vehicles with 8 %. 86 % of passenger car NOx emissions were attributed to diesel vehicles and close to 100 % of light and heavy duty vehicles were diesel-fueled. Therefore, overall 82 % of tailpipe NOx was emitted by diesel vehicles in 2020. 36 % of passenger cars, 21 % of light duty and 37 % of heavy duty vehicles on Swiss roads complied with the Euro-6 standard while most vehicles types were older (pre Euro-6) (Empa, 2024). Assuming an even distribution of gasoline and diesel vehicles on all street categories (in-town, out-of-town and highway), the share of temperature-dependent NOx emissions was 49 % for passenger cars and light duty vehicles in 2020 and 54 % under the assumption that NOx emissions from heavy duty vehicles exhibit a similar temperature dependence to those reported in Grange et al. (2019). At traffic sites, NOx mixing ratios decrease from 50 to 30 ppbv between 10 and 35 °C. Assuming the share of temperature-dependent NOx emissions is representative of the middle of that temperature range (36 ppbv at 22 °C), on-road vehicles are the only source of NOx at traffic sites, emissions relate linearly to mixing ratios and the temperature-dependence reported in Grange et al. (2019) is similar between 10 and 35 °C, NOx mixing ratios would decrease from 45 to 27 ppbv over this temperature-range. We conclude that the temperature dependence of NOx emissions from diesel vehicles can plausibly explain the magnitude of the observed overall NOx-temperature correlation. In 2010, the share of NOx emissions from diesel passenger cars was lower (61 %), however all on-road vehicles were pre Euro-6, leading to a similar share of temperature-dependent emissions of 41 %, and 64 % including heavy duty vehicles. In 2000, the overall fleet of diesel passenger cars was still small and NOx emissions only contributed 11 % to the passenger car NOx emissions (and 46 % for light duty vehicles), leading to a share of 9 % temperature-dependent NOx emissions. In that case, the magnitude of the temperature correlation could only be explained when assuming temperature-dependent heavy duty vehicle NOx emissions, which would increase the share of temperature-dependent emissions to 34 %. Figure S9 of the Supplement shows that NO has decreased more strongly with temperature compared to NO2 at all locations. NO2 does not exhibit a temperature correlation at traffic sites. This further suggests that the temperature correlation is introduced by an emission rather than temperature-dependent chemistry, given the small share of NO2 in primary NOx emissions. The NOx-temperature correlation (Fig. S10 of the Supplement) exhibits little to no change from 2000 to 2024. This highlights that simultaneous NOx reductions and temperature increases can be ruled out as a reason for the observed NOx-temperature correlation.
An additional explanation for the observed negative temperature correlation could be the influence of the planetary boundary layer height (BLH). On sunny days, the BLH is driven primarily by solar radiation, which is closely related to temperature (Collaud Coen et al., 2014). A higher BLH can dilute pollutant emissions into a larger volume, which could explain the decrease of NOx mixing ratios with temperature. While we have eliminated a major part of the BLH diurnal cycle by including only data between 09:00 and 18:00 LT (UTC+2), the day-to-day variation of the BLH remains and could contribute to the observed temperature correlation. Figure S11 presents the BLH-temperature correlation across Switzerland, based on ERA5 reanalysis data of the daily summertime BLH and the 2 m-temperature at 13:00 LT (peak of radiation). While the resolution of the ERA5 data (0.25 ° × 0.25 °) is not sufficient to resolve the topography of Switzerland, it provides an estimation of the BLH-temperature correlation. The positive correlation supports our theory that dilution effects could impact the temperature correlation of trace gases and that the day-to-day variability of the BLH is significant. We observe a 15 %–20 % decrease in the NO-temperature correlation when eliminating diurnal BLH changes (Fig. S12). While this observation could highlight the impact of BLH variations throughout the day, it could also indicate that a part of the NO-temperature correlation results from NO emissions during the morning rush hour, which is usually accompanied by lower temperatures.
The hypotheses discussed above provide likely explanations for the observed NOx-T correlation. However, the definitive driver(s) can only be identified through extensive source apportionment, footprint analysis and a precise characterization of the temperature behavior of these sources, which is outside the scope of this study.
Figure 6b shows that O3 is positively correlated with temperature at all sites. O3 levels approximately double at background sites and almost triple at rural, (sub)urban and traffic sites over the observed temperature range. A close linear dependence of O3 on temperature is observed above 15 °C at background sites ( = 1.8 ppbv °C−1) and above 17 °C at traffic ( = 2.3 ppbv °C−1), at (sub)urban ( = 3.2 ppbv °C−1) and at rural sites ( = 2.7 ppbv °C−1). A positive correlation of O3 and temperature is expected and aligns with the current literature as discussed in Sect. 1. Several factors might contribute to the observed O3-temperature dependence in Switzerland including enhanced stagnation, intense solar radiation at high temperatures, enhanced reaction rates and temperature-dependent natural and anthropogenic precursor emissions. A positive correlation of BLH and temperature can introduce a positive temperature correlation for O3 due to the intrusion of free tropospheric air characterized by elevated O3. At polluted sites, decreasing NOx with temperature (Fig. 6a) may contribute to the positive O3-temperature relationship by alleviating titration or increasing ozone production (NOx-saturated O3 chemistry). Background sites are not impacted by titration and do not show a NOx-temperature dependence while still exhibiting a strong response of O3 to temperature. This suggests that different mechanisms drive the temperature dependence of O3 in more remote locations or that O3 is not produced locally. Decreasing NOx with temperature at rural sites with dominant NOx-sensitive O3 would lead to O3 decreases and must therefore be counterbalanced by other processes, e.g. stagnation, solar radiation or reaction rates.
In Fig. 6c, we show the Ox temperature correlation, which is very similar to O3. The major difference is an elevated baseline of Ox at low temperatures for traffic (∼ 22 ppbv higher than for O3 at 10 °C), (sub)urban (∼ 13 ppbv higher) and rural sites (∼ 6 ppbv higher). This difference gets smaller with increasing temperature. The reason for this can be seen in panel (d), which shows that the share of O3 in Ox increases with temperature. For more polluted regions as well as lower temperatures the fraction of NO2 in Ox gets larger and vice versa. O3 and Ox are almost equal above 25 °C at background, rural and (sub)urban sites. For traffic sites the difference persists, which aligns with a remainder of 25 % NO2 in Ox at high temperatures. This again suggests the importance of titration at traffic sites.
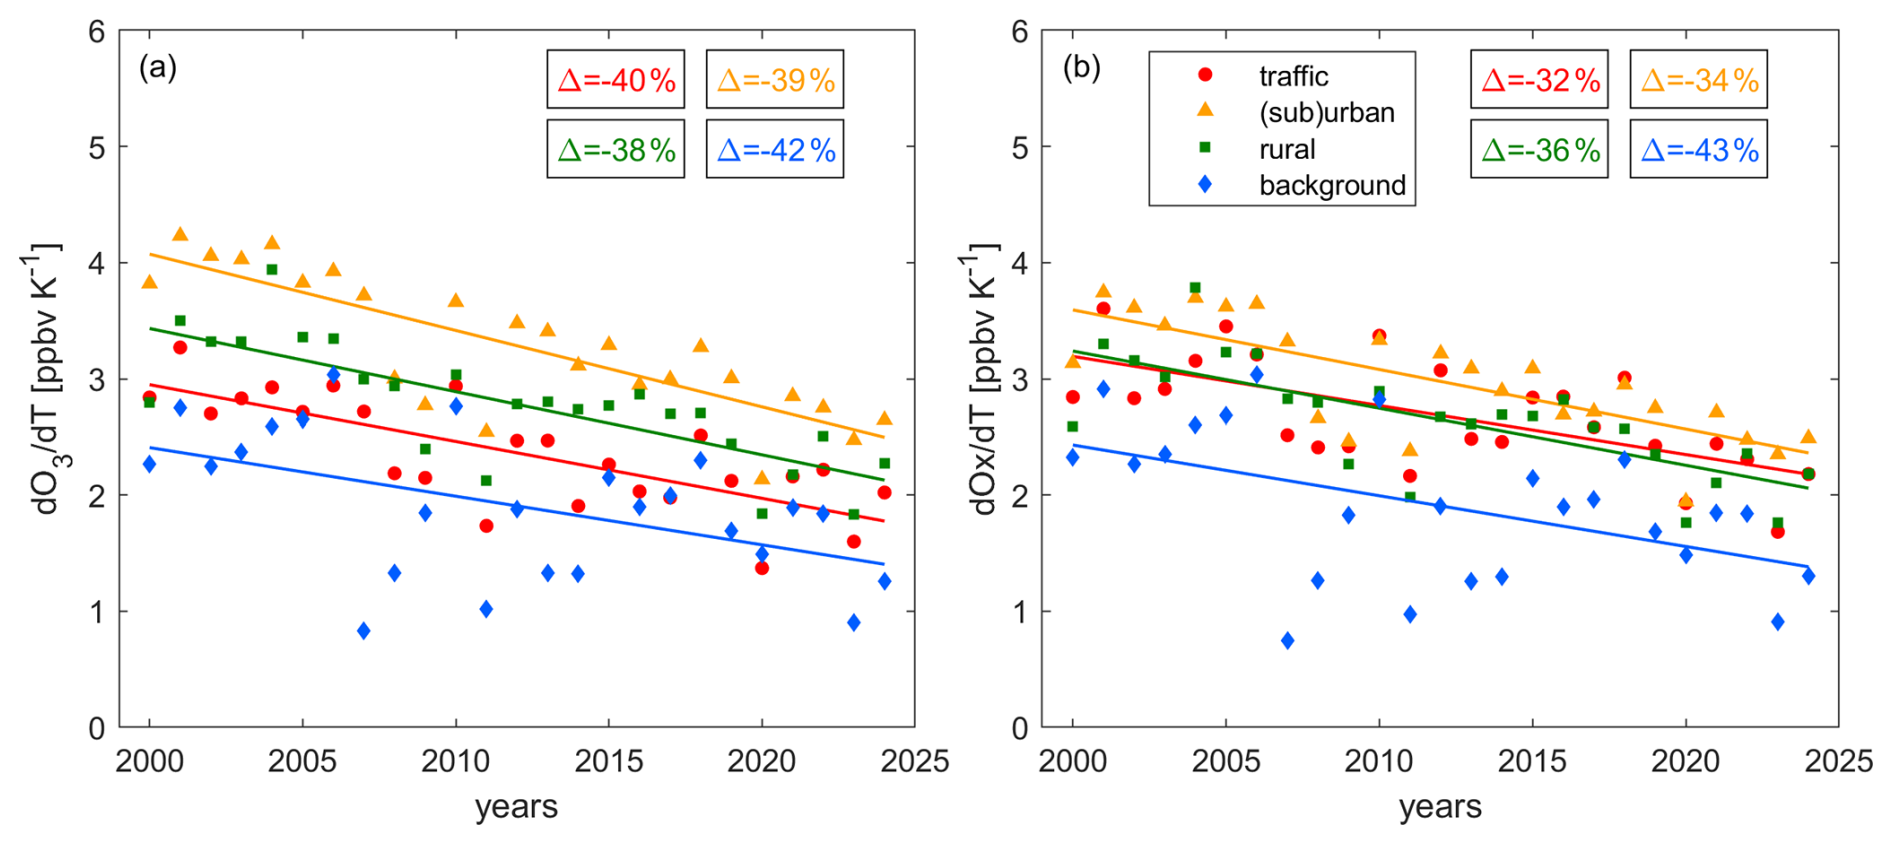
Figure 7Changes of the (a) O3 and (b) Ox temperature dependence over time. Data points represent the slope of O3 and Ox vs. temperature in Fig. 6b and c, respectively, in the linear (highlighted) area. The chosen temperature range for the fit is 19–31 °C for traffic, (sub)urban and rural conditions and 15–27 °C for background conditions. Background sites are located at elevated altitudes and have therefore lower temperatures. Boxes show the relative change between 2000 and 2024. Solid lines denote significant (p-value ≤ 0.05) and dashed lines insignificant (p-value > 0.05) trends.
3.3.3 Decadal Trends of and
Figure 7 shows the temperature dependence of (a) O3 () and (b) Ox () over time. and are calculated over the highlighted part of Fig. 6b and c, which shows a strong linear correlation (R2 > 0.99). At all site types, the temperature dependence of O3 and Ox has decreased over time. This decrease amounts to around and is independent of the site properties. The consistency of these decreases, considering the different O3 trends and mechanisms of O3 formation at the sites (as discussed in Sect. 3.1 and 3.2) is remarkable. At the beginning of the century, rates ranged between 2.5 and 4 ppbv °C−1, while they are between 1.5 and 2.5 ppbv °C−1 today. We presented the decadal trends of O3 in Fig. 3b, which shows decreases for background and rural sites, no significant changes for (sub)urban sites and increases for traffic sites. Figure 8 highlights that these decadal trends are dependent on the temperature ranges, which we show for (a) low 10 °C ≤ T ≤ 20 °C, (b) medium 20 °C ≤ T ≤ 30 °C and (c) high T ≥ 30 °C temperatures. Background and rural sites exhibit negative O3 trends over time for all temperature ranges, but the observed decrease gets larger with increasing temperature (e.g. for rural sites O3 declines at 0.08 ppbv yr−1 at low temperatures, 0.39 ppbv yr−1 at medium temperatures and 0.74 ppbv yr−1 at high temperatures). For (sub)urban sites, O3 has increased over time for low temperatures (0.10 ppbv yr−1), but decreased for medium (−0.26 ppbv yr−1) and high temperatures (−0.69 ppbv yr−1). The trends at traffic sites are positive for low (0.29 ppbv yr−1), positive but insignificant for medium and negative (and insignificant) for high temperatures. This is in line with findings by Boleti et al. (2019) who reported a decline of peak O3 (which coincides with high temperatures) at all NABEL locations, but the traffic sites, between 1990 and 2014. The rate of decadal O3 changes is therefore highest (and positive) for polluted regions at low temperatures (and high NOx) and lowest (and negative) for remote sites at high temperatures (and low NOx), which can explain the observed decadal decrease in in Fig. 7a. O3 levels have declined more rapidly at high versus low temperatures for background and rural sites and the trend has even reversed from positive to negative for (sub)urban and traffic sites. Figure 7b highlights that the temperature dependence of Ox has decreased similarly compared to O3 at all sites. While Ox trends for all temperature ranges are negative (Fig. S13), higher temperatures show steeper declines, representing the temperature effects in decadal O3 trends.
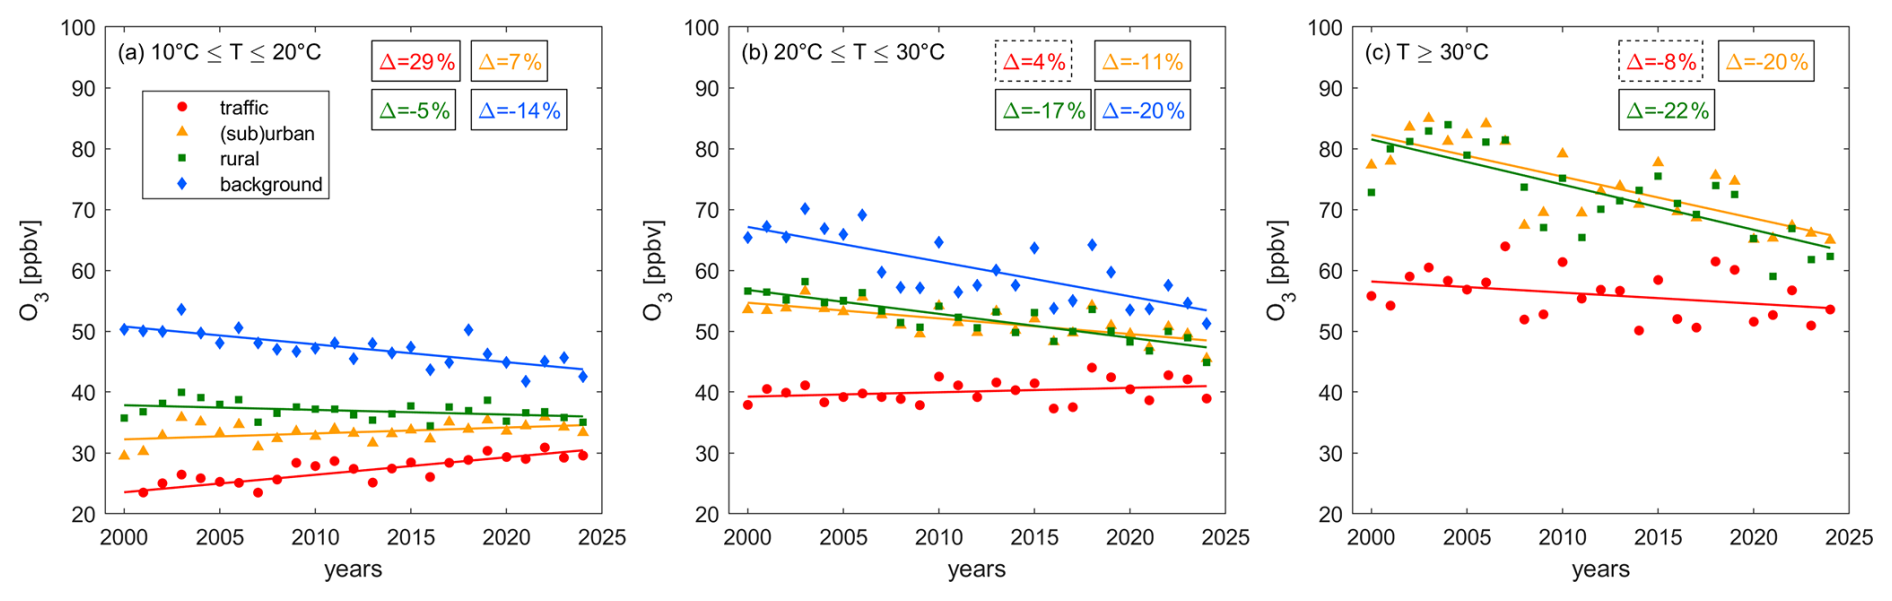
Figure 8Decadal changes of O3 at (a) low, (b) medium and (c) high temperatures at traffic (red), (sub)urban (orange), rural (green) and background (blue) sites. Data for high temperatures at background sites are sparse and therefore disregarded. The markers show the yearly averages and the lines represent their associated linear fits. Boxes show the relative change between 2000 and 2024. Solid lines denote significant (p-value ≤ 0.05) and dashed lines insignificant (p-value > 0.05) trends.
The current literature reports a similar decline in O3 temperature sensitivity, though the underlying explanations vary. Li et al. (2025) reported a decline in the O3 temperature dependence in the U.S. between 1990 and 2021, which they attributed to meteorological factors, as well as increased effects of temperature-dependent BVOC emissions, dry deposition and PAN decomposition under anthropogenic NOx reductions. A decrease in the O3 temperature dependence with decreasing NOx levels has additionally been reported in the U.S. among others by Wu et al. (2008) suggesting an increased NOx loss via temperature-enhanced isoprene emissions and the formation of isoprene nitrates, and isoprene ozonolysis, as well as Bloomer et al. (2009) and Rasmussen et al. (2013). Coates et al. (2016) suggested a decrease in the O3 temperature sensitivity in response to decreases in ambient NOx due to enhancements of reactions rates and biogenic VOCs, which was largest for high- and small for low-NOx conditions.
Several of these studies suggest temperature-dependent VOC emissions under reductions in anthropogenic NOx as a reason for a decline in the O3-temperature response. Under VOC-sensitive O3 formation chemistry, temperature is known to increase O3 levels at constant NOx via enhanced VOCs. In turn, decreasing NOx leads to a decline in the temperature sensitivity of O3 when moving towards NOx-sensitive O3 chemistry. We find that O3 formation in Switzerland is either dominated by the O3 titration effect (polluted sites) or NOx-sensitive chemistry (remote sites). Consequently, changes in VOCs are unlikely to impact O3 formation and cannot explain the observed decline in the temperature sensitivity of O3. Other mechanisms presented in the literature, including changes in meteorology, dry deposition or PAN decomposition under NOx reductions, could contribute to the decrease in in Switzerland. Changes in the ozone production efficiency over time could additionally impact the temperature sensitivity of O3. Local measurements of NOy would be required to investigate OPE changes.
Additionally, we suggest that the share of O3 in Ox could be a key factor in controlling the temperature-dependent trends at polluted sites (Fig. 8), which directly affects the decline in O3 temperature sensitivity (Fig. 7a). For polluted regions with large NOx sources and low temperatures, a considerable fraction of Ox is NO2 (Fig. 6d) and a decrease of NOx over time releases O3, which affects increasing decadal trends as shown for traffic sites in Fig. 8a. At higher temperatures the share of O3 in Ox is higher and therefore the titration effect of the decadal NOx decline is smaller, which manifests in a less steep decadal increase for O3 at medium temperatures (Fig. 8b) and a further flattening at high temperatures (Fig. 8c). NOx reductions only become effective in reducing O3 when the share of O3 in Ox is large enough, which is most strongly affected by ambient NOx levels and temperature. While this is not the case for traffic sites even at high temperatures, we observe the change for (sub)urban sites, where O3 increases over time at low temperatures. In contrast at medium temperatures, the share of O3 in Ox is sufficiently large that the O3 release through declining NOx is outweighed by the reduction of O3 formation when chemistry is NOx-sensitive. At high temperatures, the effect of reduced O3 formation is even larger and the decadal O3 decline is steeper, affecting the reduction in the O3-temperature sensitivity. We conclude that the consistent trends in Switzerland are likely driven by different mechanisms, including previously suggested meteorological and chemical processes at remote and background sites, with an additional role for O3 titration at polluted sites. Further research is needed to quantify the relative role of these mechanisms in polluted and clean locations.
3.4 O3 and Ox exceedance probabilities
Figure 9 shows the exceedance probability EP (defined as the percentage of April–August daytime hourly values above 60 ppbv) of O3 (a) over time and (b) with temperature. The change of Ox EP with temperature can be seen in Fig. 9c. The decadal O3 EP trend is presented in Fig. 9a and is similar to the O3 trends from Fig. 3b. For rural and background sites the probability of O3 exceeding the current air quality standard of 60 ppbv has decreased over time. While at the beginning of the century 20 %–25 % of all summertime measurements exceeded the threshold, respectively, the share has decreased to around 5 %–10 % today. O3 EP at (sub)urban and traffic sites does not show a significant trend over time. The exceedance probability at (sub)urban sites is similar to rural and background sites, whereas it is much lower and only around 5 % for traffic conditions. As discussed previously, this is the result of O3 being stored in NO2 due to titration close to NO sources. Consistent with the Ox trend shown in Fig. 3c, Fig. S14 shows that Ox exceedance probabilities exhibit a significant, negative trend for all sites, highlighting NOx-sensitive conditions under rural and background conditions and the impact of titration at traffic and (sub)urban sites (for the majority of the record).
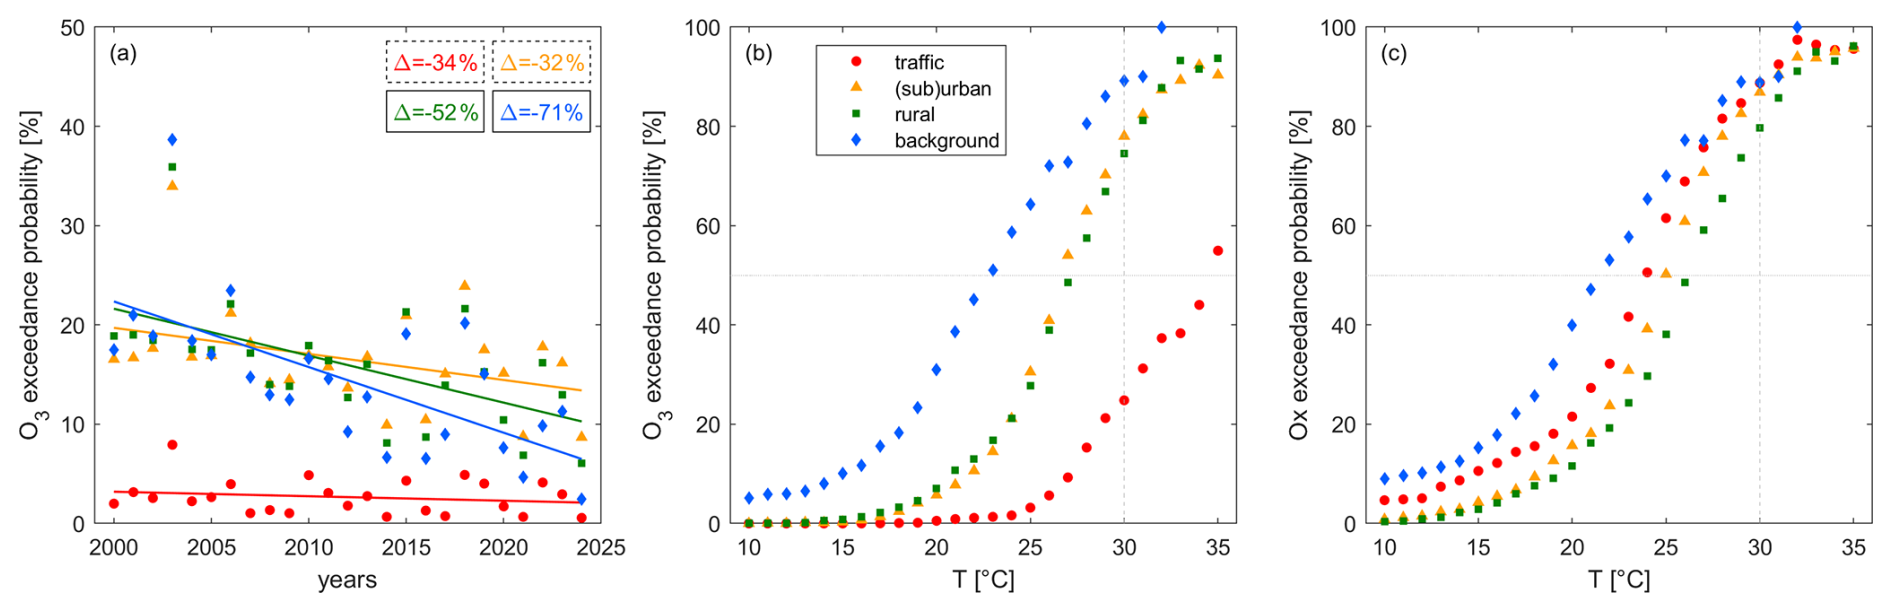
Figure 9(a) Average decadal trends and (b) the temperature dependence of the O3 exceedance probability and (c) the temperature dependence of the Ox exceedance probability at traffic (red), (sub)urban (orange), rural (green) and background (blue) sites. Panels (b) and (c) represent the entire study period from 2000 to 2024.
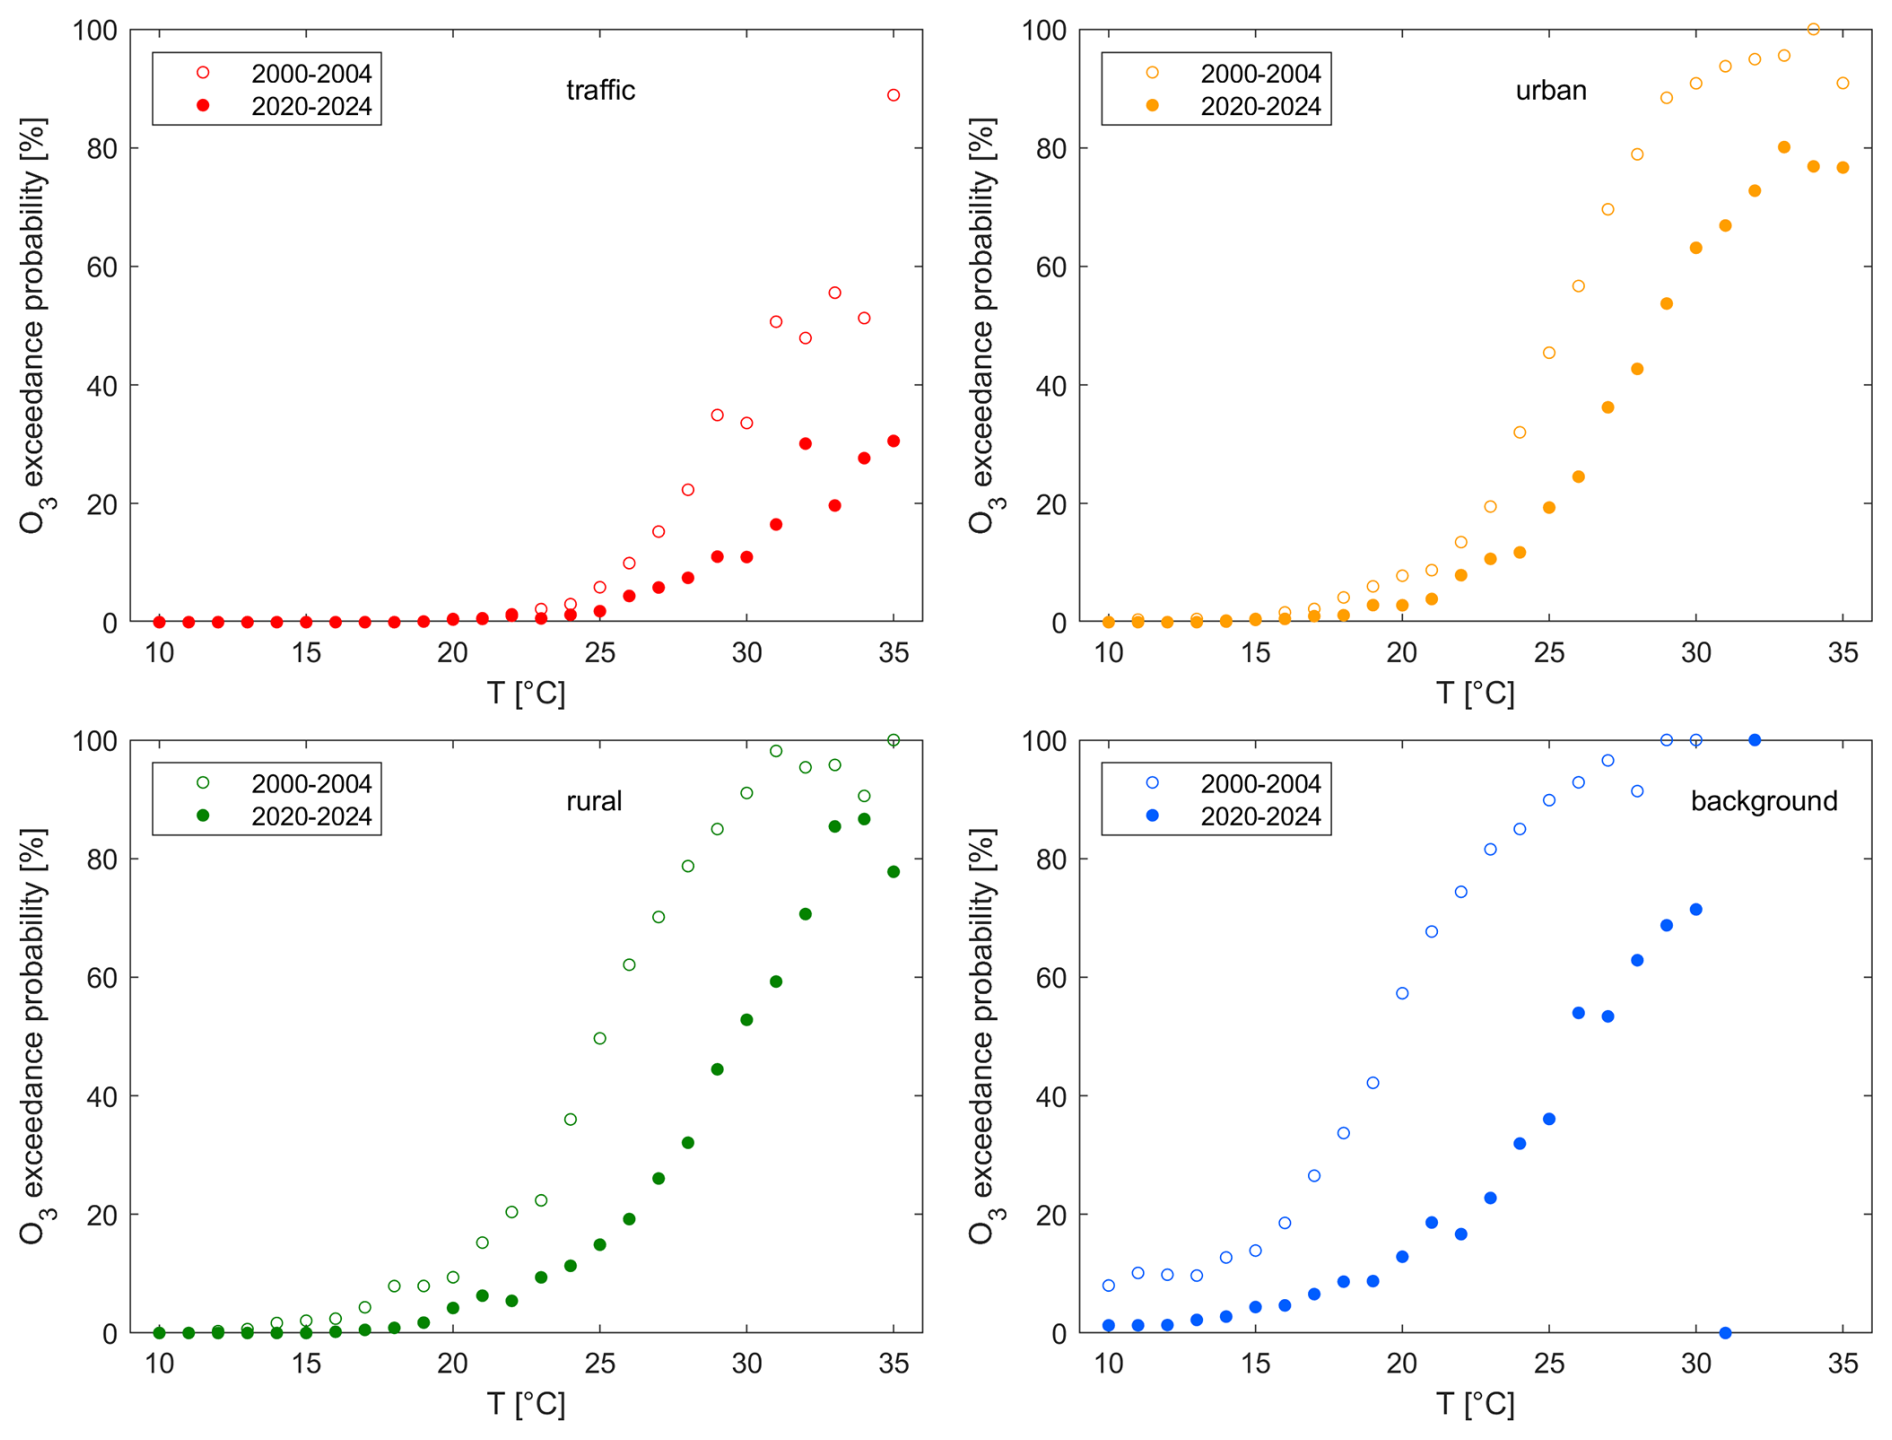
Figure 10Temperature correlation of the O3 exceedance probability at (a) traffic, (b) (sub)urban, (c) rural and (d) background sites as an average for the beginning of the record as open symbols (2000–2004) and today (2020–2024) as filled symbols.
Figure 9b shows the temperature dependence of O3 exceedances. For low temperatures – at background sites below 2 °C and at the remaining sites below 15 °C – O3 exceedances do not occur. The exceedance probability then rapidly increases with temperature and above 30 °C, the likelihood of reaching unhealthy levels of O3 is above 20 % at traffic sites and above 75 % at (sub)urban, rural and background sites. Figure 10 shows that these numbers have decreased by up to 35 % (percentage points) between the beginning of the century (2000–2004) and today (2020–2024), which is a positive outcome of NOx reductions. The extent of this decrease is generally higher for higher temperatures and increasing remoteness, which is in line with our findings from Fig. 8 for the temperature-dependent O3 decadal trends. Despite this effectiveness of NOx reductions in shifting O3 exceedances to higher temperatures, the likelihood of high-temperature days has increased 3-fold over the same time period (Fig. 5b), weakening the described positive outcomes – a phenomenon often referred to as a climate penalty. Ox exceedance probabilities show a similar temperature dependence, as shown in Fig. 9c. At (sub)urban, rural and background sites Ox is almost entirely O3 and therefore the Ox and O3 EPs are similar. For traffic sites even at high temperatures Ox still consists of a significant amount of NO2 and therefore the O3 EP is lower than the Ox EP – at 30 °C by around 50 %. With ongoing NOx reductions the EP O3 curve will approximate the EP Ox curve when titration becomes negligible and decreases in NOx become effective in reducing O3.
These observations highlight the complex interplay of NOx levels and temperature in driving the dominating O3 chemistry in polluted environments. High temperatures are often accompanied by stagnation and high solar intensity increasing the share of O3 in Ox and thereby leading to more frequent exceedances. At the same time, these temperatures (where titration is less relevant, Fig. 6d) create a chemical environment where NOx reductions become effective in reducing O3.
In this study, we have investigated the processes impacting O3 levels under traffic, (sub)urban, rural and background conditions across Switzerland during summertime since the beginning of this century. The study is based on observations of NO, NO2, O3 and meteorological parameters at 12 surface stations, which are part of the NABEL (Nationales Beobachtungsnetz für Luftfremdstoffe) network.
NOx levels have continuously decreased over the past two decades at all stations, highlighting successful emission reductions. These reductions have led to O3 decreases at rural and background stations. In contrast, average summertime O3 has been relatively consistent at (sub)urban and even increased at traffic sites. Boleti et al. (2018) studied O3 trends in Switzerland and concluded that by 2014, average O3 levels were decreasing at all sites. Our findings, showing the continued increase of O3 in polluted environments beyond the study period of Boleti et al. (2018), are therefore vital and highlight the urge for continuous and stringent precursor reductions.
Using the O3 and Ox weekend effect we show that chemistry has been dominated by NOx-sensitive O3 formation at background sites over the entire study period, whereas titration has been the prevailing mechanism controlling O3 levels at traffic sites. Rural sites have recently switched to NOx-sensitive chemistry, and (sub)urban sites are currently making this shift. Despite the level of anthropogenic NOx pollution, temperature plays an important role in controlling O3. This strong positive correlation has several contributors, including enhanced stagnation (which often accompanies high temperatures and can lead to local O3 build-up), increased solar radiation, the inverse temperature-correlation of NOx and intrusion of O3-rich free tropospheric air under a high boundary layer. We find that decadal O3 decreases are stronger at higher temperatures or even reverse from positive to negative trends at more polluted sites, which in turn, affects a continuous decrease in the temperature dependence of O3 () over time. This observations has been previously reported by among others Wu et al. (2008), Bloomer et al. (2009), Rasmussen et al. (2013) and Li et al. (2025) in the U.S. as well as Otero et al. (2021) in Europe. While the reason for this observation is regionally different and not fully understood up to this point, we offer an explanation related to the share of O3 in Ox titration for polluted sites, which is smallest for low temperatures and polluted sites and increases with rising temperature and increasing remoteness. While we find a similar decrease in O3-temperature sensitivity at all sites, the effect of titration is largest at most polluted sites and other processes likely dominate the trend at more remote locations.
The exceendance probabilities for O3 and Ox of the current O3 Swiss air quality standard additionally show a strong temperature dependence and unhealthy levels occur with a probability of more than 80 % at (sub)urban, rural and background sites on hot summer days (T ≥ 30 °C). Due to NOx reductions, the occurrence of O3 exceedances is now limited to the highest temperatures, however, the share of summer days exceeding 30 °C is around 3 times larger today than it was at the beginning of the century, which offsets part of the success in emission reductions. O3 levels at traffic sites are still suppressed by large amounts of NOx and we expect increases in O3 exceedances, particularly at lower temperatures, for the coming years before the impact of titration becomes negligible and NOx reductions effective. Many different factors, including the rate of NOx reductions and meteorological parameters, make it challenging to predict the crossover point. Assuming a change from dominant titration to dominant NOx-sensitive O3 formation for rural sites in the middle of the studied period and for (sub)urban sites in recent years, the crossover occurs when O3 makes up at least 85 % of Ox. If we assume a continued increase in the share of O3 in Ox of 1 % yr−1 (Fig. 3d), chemistry at traffic sites would be dominated by NOx-sensitive O3 formation rather than titration starting in 2035. Aksoyoglu et al. (2014) reported the dominant effect of titration on O3 levels in Switzerland between 1990 and 2005. Twenty years later, polluted sites are still titration-dominated despite strong precursor emission declines, highlighting the challenge of sufficient pollutant reductions to achieve clean air.
These findings emphasize that O3 remains an air quality concern in Switzerland. NOx reductions are now effective in reducing O3 levels at (sub)urban, rural and background sites, but exceedances, particularly at high temperatures, remain frequent. Therefore, rapid NOx reductions are required to reduce O3 levels, which are also needed to overcome the dominance of titration at polluted sites. Continued long-term monitoring of O3 and its precursors is critical to identify changes in the non-linear processes, which drive the abundance of O3 and impact local air quality. Of particular benefit in Switzerland would be the addition of long-term speciated VOC measurements at multiple sites, which are currently strongly limited, but are important precursors to local O3 formation and can support our understanding of the shifting role of natural and anthropogenic precursors. Finally, more research is needed to understand and monitor the climate penalty on O3 under continuous anthropogenic precursor reductions and increasing temperatures.
Trace gas measurements and meteorological observations used in this study can be obtained from the data query tool of the Federal Office of the Environment (2025) (in German: Bundesamt für Umwelt BAFU): https://www.bafu.admin.ch/bafu/en/home/topics/air/luftbelastung/data/data-query-nabel.html (last access: 12 November 2025).
The supplement related to this article is available online at https://doi.org/10.5194/acp-26-5355-2026-supplement.
CMN and CLH conceptualized the study and interpreted the data. CMN carried out the analysis and prepared the figures. AMH investigated O3 air quality in Zürich as part of her BSc thesis (supervised by CMN), which provided the starting point for this work. CH measured and provided the NABEL data. All co-authors contributed to reviewing and proofreading of the manuscript.
The contact author has declared that none of the authors has any competing interests.
Publisher's note: Copernicus Publications remains neutral with regard to jurisdictional claims made in the text, published maps, institutional affiliations, or any other geographical representation in this paper. The authors bear the ultimate responsibility for providing appropriate place names. Views expressed in the text are those of the authors and do not necessarily reflect the views of the publisher.
We acknowledge NABEL (FOEN/Empa) for providing data used in this study. We further acknowledge MeteoSwiss for providing meteorological data.
This paper was edited by Drew Gentner and reviewed by two anonymous referees.
Adame, J., Gutiérrez-Álvarez, I., Cristofanelli, P., Notario, A., Bogeat, J., López, A., Gómez, A., Bolívar, J., and Yela, M.: Surface ozone trends over a 21-year period at El Arenosillo observatory (Southwestern Europe), Atmos. Res., 269, 106048, https://doi.org/10.1016/j.atmosres.2022.106048, 2022. a
Aksoyoglu, S., Keller, J., Ciarelli, G., Prévôt, A. S. H., and Baltensperger, U.: A model study on changes of European and Swiss particulate matter, ozone and nitrogen deposition between 1990 and 2020 due to the revised Gothenburg protocol, Atmos. Chem. Phys., 14, 13081–13095, https://doi.org/10.5194/acp-14-13081-2014, 2014. a, b
Baidar, S., Hardesty, R., Kim, S.-W., Langford, A., Oetjen, H., Senff, C., Trainer, M., and Volkamer, R.: Weakening of the weekend ozone effect over California's South Coast Air Basin, Geophys. Res. Lett., 42, 9457–9464, https://doi.org/10.1002/2015GL066419, 2015. a
Black, E., Blackburn, M., Harrison, G., Hoskins, B., and Methven, J.: Factors contributing to the summer 2003 European heatwave, Weather, 59, 217–223, https://doi.org/10.1256/wea.74.04, 2004. a
Bloomer, B. J., Stehr, J. W., Piety, C. A., Salawitch, R. J., and Dickerson, R. R.: Observed relationships of ozone air pollution with temperature and emissions, Geophys. Res. Lett., 36, https://doi.org/10.1029/2009GL037308, 2009. a, b
Boleti, E., Hüglin, C., and Takahama, S.: Ozone time scale decomposition and trend assessment from surface observations in Switzerland, Atmos. Environ., 191, 440–451, https://doi.org/10.1016/j.atmosenv.2018.07.039, 2018. a, b, c, d, e, f, g, h
Boleti, E., Hüglin, C., and Takahama, S.: Trends of surface maximum ozone concentrations in Switzerland based on meteorological adjustment for the period 1990–2014, Atmos. Environ., 213, 326–336, https://doi.org/10.1016/j.atmosenv.2019.05.018, 2019. a, b, c
Boleti, E., Hueglin, C., Grange, S. K., Prévôt, A. S. H., and Takahama, S.: Temporal and spatial analysis of ozone concentrations in Europe based on timescale decomposition and a multi-clustering approach, Atmos. Chem. Phys., 20, 9051–9066, https://doi.org/10.5194/acp-20-9051-2020, 2020. a
Bundesamt für Statistik BFS: Mobilität und Verkehr: Panorama, Statistical report, Neuchâtel, Switzerland, https://www.bfs.admin.ch/bfs/en/home/statistics/mobility-transport.assetdetail.33027189.html (last access: 14 February 2026), 2024. a, b
Bundesamt für Statistik BFS: Teleheimarbeit, https://www.bfs.admin.ch/bfs/de/home/statistiken/kultur-medien-informationsgesellschaft-sport/informationsgesellschaft/gesamtindikatoren/volkswirtschaft/teleheimarbeit.assetdetail.34948916.html (last access: 14 February 2026), 2025a. a
Bundesamt für Statistik BFS: Mobilität und Verkehr – Taschenstatistik 2025, Statistical report, Neuchâtel, Switzerland, https://doi.org/10.71668/xyja-zn22, 2025b. a
Bundesamt für Strassen ASTRA, Fachbereich Verkehrsmanagement: Verkehrsentwicklung und Verfügbarkeit der Nationalstrassen Jahresbericht 2024, Report, https://www.astra.admin.ch/astra/de/home/themen/nationalstrassen/verkehrsfluss-stauaufkommen/verkehrsfluss-nationalstrassen.html (last access: 14 February 2026), 2025. a
Chace, W. S., Womack, C., Ball, K., Bates, K. H., Bohn, B., Coggon, M., Crounse, J. D., Fuchs, H., Gilman, J., Gkatzelis, G. I., Jernigan, C. M., Novak, G. A., Novelli, A., Peischl, J., Pollack, I., Robinson, M. A., Rollins, A., Schafer, N. B., Schwantes, R. H., Selby, M., Stainsby, A., Stockwell, C., Taylor, R., Treadaway, V., Veres, P. R., Warneke, C., Waxman, E., Wennberg, P. O., Wolfe, G. M., Xu, L., Zuraski, K., and Brown, S. S.: Ozone Production Efficiencies in the Three Largest United States Cities from Airborne Measurements, Environ. Sci. Technol., https://doi.org/10.1021/acs.est.5c02073, 2025. a
Chang, K.-L., McDonald, B. C., Harkins, C., and Cooper, O. R.: Surface ozone trend variability across the United States and the impact of heat waves (1990–2023), Atmos. Chem. Phys., 25, 5101–5132, https://doi.org/10.5194/acp-25-5101-2025, 2025. a
Chinkin, L. R., Coe, D. L., Funk, T. H., Hafner, H. R., Roberts, P. T., Ryan, P. A., and Lawson, D. R.: Weekday versus weekend activity patterns for ozone precursor emissions in California's South Coast Air Basin, J. Air Waste Manage. Assoc., 53, 829–843, https://doi.org/10.1080/10473289.2003.10466223, 2003. a
Coates, J., Mar, K. A., Ojha, N., and Butler, T. M.: The influence of temperature on ozone production under varying NOx conditions – a modelling study, Atmos. Chem. Phys., 16, 11601–11615, https://doi.org/10.5194/acp-16-11601-2016, 2016. a, b
Collaud Coen, M., Praz, C., Haefele, A., Ruffieux, D., Kaufmann, P., and Calpini, B.: Determination and climatology of the planetary boundary layer height above the Swiss plateau by in situ and remote sensing measurements as well as by the COSMO-2 model, Atmos. Chem. Phys., 14, 13205–13221, https://doi.org/10.5194/acp-14-13205-2014, 2014. a
Cooper, O., Derwent, D., Collins, B., Doherty, R., Stevenson, D., Stohl, A., and Hess, P.: Chapter 1: Conceptual Overview of Hemispheric or Intercontinental Transport of Ozone and Particulate Matter, in: Hemispheric transport of air pollution, edited by: Dentener, F., Keating, T. J., and Akimoto, H., United Nations, New York and Geneva, ISBN 978-92-1-117043-6, 2010. a
Crutzen, P. J.: Tropospheric ozone: An overview, Springer, https://doi.org/10.1007/978-94-009-2913-5_1, 1988. a
Denman, K. L., Brasseur, G., Chidthaisong, A., Ciais, P., Cox, P. M., Dickinson, R. E., Hauglustaine, D., Heinze, C., Holland, E., Jacob, D., Lohmann, U., Ramachandran, S., da Silva Dias, P. L., Wofsy, S. C., and Zhang, X.: Couplings Between Changes in the Climate System and Biogeochemistry, in: Climate Change 2007: The Physical Science Basis, Contribution of Working Group I to the Fourth Assessment Report of the Intergovernmental Panel on Climate Change, edited by: Solomon, S., Qin, D., Manning, M., Chen, Z., Marquis, M., Averyt, K. B., Tignor, M., and Miller, H. L., Cambridge University Press, Cambridge, United Kingdom and New York, NY, USA, ISBN 978052188009-1, 2007. a
Derwent, R. G., Utembe, S. R., Jenkin, M. E., and Shallcross, D. E.: Tropospheric ozone production regions and the intercontinental origins of surface ozone over Europe, Atmos. Environ., 112, 216–224, https://doi.org/10.1016/j.atmosenv.2015.04.049, 2015. a
Dong, B., Sutton, R. T., and Shaffrey, L.: Understanding the rapid summer warming and changes in temperature extremes since the mid-1990s over Western Europe, Clim. Dynam., 48, 1537–1554, https://doi.org/10.1007/s00382-016-3158-8, 2017. a
Empa: Luftschadstoff-Emissionen des Strassenverkehrs 1990–2060, Report, Bern, Switzerland, https://www.bafu.admin.ch/bafu/de/home/themen/luft/publikationen-studien/publikationen/luftschadstoff-emissionen-des-strassenverkehrs-1990-2060.html (last access: 15 November 2025), 2024. a, b, c
Empa and BAFU: Technischer Bericht zum Nationalen Beobachtungsnetz für Luftfremdstoffe (NABEL) 2024, Technical report, Dübendorf, Switzerland, https://www.bafu.admin.ch/bafu/de/home/themen/luft/zustand/daten/nationales-beobachtungsnetz-fuer-luftfremdstoffe--nabel-/berichte-des-nabel.html (last access: 15 November 2025), 2024. a, b
European Environmental Agency: Harm to human health from air pollution in Europe: burden of disease status, https://doi.org/10.2800/3950756, 2024. a
Federal Office of the Environment: Data query NABEL, https://www.bafu.admin.ch/bafu/en/home/topics/air/luftbelastung/data/data-query-nabel.html (last access: 15 November 2025), 2025. a
Federal Office of Topography swisstopo: swissBOUNDARIES3D, https://www.swisstopo.admin.ch/en/landscape-model-swissboundaries3d#Additional-information (last access: 15 November 2025), 2024. a
Fujita, E. M., Stockwell, W. R., Campbell, D. E., Keislar, R. E., and Lawson, D. R.: Evolution of the magnitude and spatial extent of the weekend ozone effect in California's South Coast Air Basin, 1981–2000, J. Air Waste Manage. Assoc., 53, 802–815, https://doi.org/10.1080/10473289.2003.10466225, 2003. a
Geddes, J. A., Murphy, J. G., and Wang, D. K.: Long term changes in nitrogen oxides and volatile organic compounds in Toronto and the challenges facing local ozone control, Atmos. Environ., 43, 3407–3415, https://doi.org/10.1016/j.atmosenv.2009.03.053, 2009. a
Gkatzelis, G. I., Gilman, J. B., Brown, S. S., Eskes, H., Gomes, A. R., Lange, A. C., McDonald, B. C., Peischl, J., Petzold, A., Thompson, C. R., and Kiendler-Scharr, A.: The global impacts of COVID-19 lockdowns on urban air pollution: A critical review and recommendations, Elem. Sci. Anth., 9, 00176, https://doi.org/10.1525/elementa.2021.00176, 2021. a
Grange, S. K., Lewis, A. C., Moller, S. J., and Carslaw, D. C.: Lower vehicular primary emissions of NO2 in Europe than assumed in policy projections, Nat. Geosci., 10, 914–918, https://doi.org/10.1038/s41561-017-0009-0, 2017. a
Grange, S. K., Farren, N. J., Vaughan, A. R., Rose, R. A., and Carslaw, D. C.: Strong temperature dependence for light-duty diesel vehicle NOx emissions, Environ. Sci. Technol., 53, 6587–6596, https://doi.org/10.1021/acs.est.9b01024, 2019. a, b, c
Grange, S. K., Farren, N. J., Vaughan, A. R., Davison, J., and Carslaw, D. C.: Post-dieselgate: evidence of NOx emission reductions using on-road remote sensing, Environ. Sci. Technol. Lett., 7, 382–387, https://doi.org/10.1021/acs.estlett.0c00188, 2020. a
Guenther, A. B., Jiang, X., Heald, C. L., Sakulyanontvittaya, T., Duhl, T., Emmons, L. K., and Wang, X.: The Model of Emissions of Gases and Aerosols from Nature version 2.1 (MEGAN2.1): an extended and updated framework for modeling biogenic emissions, Geosci. Model Dev., 5, 1471–1492, https://doi.org/10.5194/gmd-5-1471-2012, 2012. a
Guo, F., Bui, A. A., Schulze, B. C., Yoon, S., Shrestha, S., Wallace, H. W., Sakai, Y., Actkinson, B. W., Erickson, M. H., Alvarez, S., Sheesley, R., Usenko, S., Flynn, J., and Griffin, R. J.: Urban core-downwind differences and relationships related to ozone production in a major urban area in Texas, Atmos. Environ., 262, 118624, https://doi.org/10.1016/j.atmosenv.2021.118624, 2021. a
Huang, T., Zhu, X., Zhong, Q., Yun, X., Meng, W., Li, B., Ma, J., Zeng, E. Y., and Tao, S.: Spatial and temporal trends in global emissions of nitrogen oxides from 1960 to 2014, Environ. Sci. Technol., 51, 7992–8000, https://doi.org/10.1021/acs.est.7b02235, 2017. a
Hüglin. C. and Rohrbach, S.: Zeitliche Entwicklung der NO2 – Immissionen an verkehrsbelasteten städtischen Standorten, Technical Report, Dübendorf, Switzerland, https://www.empa.ch/documents/56101/29574162/Trend+NO2+Immissionen+Stadt+2022.pdf/ddba8b88-c599-4ed4-8b94-cc24670be683?version=1.0&t=1717509377000&download=true (last access: 15 November 2025), 2022. a
Hüglin, C., Buchmann, B., Steinbacher, M., and Emmenegger, L.: The Swiss National Air Pollution Monitoring Network (NABEL) – Bridging Science and Environmental Policy, Chimia, 78, 722–727, https://doi.org/10.2533/chimia.2024.722, 2024. a
Kleinman, L. I., Daum, P. H., Lee, Y.-N., Nunnermacker, L. J., Springston, S. R., Weinstein-Lloyd, J., and Rudolph, J.: Ozone production efficiency in an urban area, J. Geophys. Res.-Atmos., 107, ACH–23, https://doi.org/10.1029/2002JD002529, 2002. a
Levitt, S. B. and Chock, D. P.: Weekday-weekend pollutant studies of the Los Angeles basin, JAPCA J. Air Waste Ma., 26, 1091–1092, https://doi.org/10.1080/00022470.1976.10470368, 1976. a
Li, S., Wang, H., and Lu, X.: Anthropogenic emission controls reduce summertime ozone–temperature sensitivity in the United States, Atmos. Chem. Phys., 25, 2725–2743, https://doi.org/10.5194/acp-25-2725-2025, 2025. a, b, c
Massagué, J., Torre-Pascual, E., Carnerero, C., Escudero, M., Alastuey, A., Pandolfi, M., Querol, X., and Gangoiti, G.: Extreme ozone episodes in a major Mediterranean urban area, Atmos. Chem. Phys., 24, 4827–4850, https://doi.org/10.5194/acp-24-4827-2024, 2024. a
Mazzuca, G. M., Ren, X., Loughner, C. P., Estes, M., Crawford, J. H., Pickering, K. E., Weinheimer, A. J., and Dickerson, R. R.: Ozone production and its sensitivity to NOx and VOCs: results from the DISCOVER-AQ field experiment, Houston 2013, Atmos. Chem. Phys., 16, 14463–14474, https://doi.org/10.5194/acp-16-14463-2016, 2016. a
McDonald, B. C., de Gouw, J. A., Gilman, J. B., Jathar, S. H., Akherati, A., Cappa, C. D., Jimenez, J. L., Lee-Taylor, J., Hayes, P. L., McKeen, S. A., Cui, Y. Y., Kim, S., Gentner, D. R., Isaacman-VanWertz, G., Goldstein, A. H., Harley, R. A., Frost, G. J., Roberts, J. M., Ryerson, T. B., and Trainer, M.: Volatile chemical products emerging as largest petrochemical source of urban organic emissions, Science, 359, 760–764, https://doi.org/10.1126/science.aaq0524, 2018. a
McDuffie, E. E., Smith, S. J., O'Rourke, P., Tibrewal, K., Venkataraman, C., Marais, E. A., Zheng, B., Crippa, M., Brauer, M., and Martin, R. V.: A global anthropogenic emission inventory of atmospheric pollutants from sector- and fuel-specific sources (1970–2017): an application of the Community Emissions Data System (CEDS), Earth Syst. Sci. Data, 12, 3413–3442, https://doi.org/10.5194/essd-12-3413-2020, 2020. a
Murphy, J. G., Day, D. A., Cleary, P. A., Wooldridge, P. J., Millet, D. B., Goldstein, A. H., and Cohen, R. C.: The weekend effect within and downwind of Sacramento – Part 1: Observations of ozone, nitrogen oxides, and VOC reactivity, Atmos. Chem. Phys., 7, 5327–5339, https://doi.org/10.5194/acp-7-5327-2007, 2007. a, b
Nault, B. A., Laughner, J. L., Wooldridge, P. J., Crounse, J. D., Dibb, J., Diskin, G., Peischl, J., Podolske, J. R., Pollack, I. B., Ryerson, T. B., Scheuer, E., Wennberg, P. O., and Cohen, R. C.: Lightning NOx emissions: Reconciling measured and modeled estimates with updated NOx chemistry, Geophys. Res. Lett., 44, 9479–9488, https://doi.org/10.1002/2017GL074436, 2017. a
Nussbaumer, C. M. and Cohen, R. C.: The role of temperature and NOx in ozone trends in the Los Angeles Basin, Environ. Sci. Technol., 54, 15652–15659, https://doi.org/10.1021/acs.est.0c04910, 2020. a, b
Nuvolone, D., Petri, D., and Voller, F.: The effects of ozone on human health, Environ. Sci. Pollut. R., 25, 8074–8088, https://doi.org/10.1007/s11356-017-9239-3, 2018. a
Oikawa, P., Ge, C., Wang, J., Eberwein, J., Liang, L., Allsman, L., Grantz, D., and Jenerette, G.: Unusually high soil nitrogen oxide emissions influence air quality in a high-temperature agricultural region, Nat. Commun., 6, 8753, https://doi.org/10.1038/ncomms9753, 2015. a
Ordóñez, C., Mathis, H., Furger, M., Henne, S., Hüglin, C., Staehelin, J., and Prévôt, A. S. H.: Changes of daily surface ozone maxima in Switzerland in all seasons from 1992 to 2002 and discussion of summer 2003, Atmos. Chem. Phys., 5, 1187–1203, https://doi.org/10.5194/acp-5-1187-2005, 2005. a
Otero, N., Rust, H. W., and Butler, T.: Temperature dependence of tropospheric ozone under NOx reductions over Germany, Atmos. Environ., 253, 118334, https://doi.org/10.1016/j.atmosenv.2021.118334, 2021. a
Perdigones, B. C., Lee, S., Cohen, R. C., Park, J.-H., and Min, K.-E.: Two decades of changes in summertime ozone production in California's South Coast Air Basin, Environ. Sci. Technol., 56, 10586–10595, https://doi.org/10.1021/acs.est.2c01026, 2022. a
Pollack, I., Ryerson, T., Trainer, M., Parrish, D., Andrews, A., Atlas, E. L., Blake, D., Brown, S. S., Commane, R., Daube, B. C., de Gouw, J. A., Dubé, W. P., Flynn, J., Frost, G. J., Gilman, J. B., Grossberg, N., Holloway, J. S., Kofler, J., Kort, E. A., Kuster, W. C., Lang, P. M., Lefer, B., Lueb, R. A., Neuman, J. A., Nowak, J. B., Novelli, P. C., Peischl, J., Perring, A. E., Roberts, J. M., Santoni, G., Schwarz, J. P., Spackman, J. R., Wagner, N. L., Warneke, C., Washenfelder, R. A., Wofsy, S. C., and Xiang, B.: Airborne and ground-based observations of a weekend effect in ozone, precursors, and oxidation products in the California South Coast Air Basin, J. Geophys. Res.-Atmos., 117, https://doi.org/10.1029/2011JD016772, 2012. a
Porter, W. C. and Heald, C. L.: The mechanisms and meteorological drivers of the summertime ozone–temperature relationship, Atmos. Chem. Phys., 19, 13367–13381, https://doi.org/10.5194/acp-19-13367-2019, 2019. a, b
Pusede, S. E. and Cohen, R. C.: On the observed response of ozone to NOx and VOC reactivity reductions in San Joaquin Valley California 1995–present, Atmos. Chem. Phys., 12, 8323–8339, https://doi.org/10.5194/acp-12-8323-2012, 2012. a
Pusede, S. E., Steiner, A. L., and Cohen, R. C.: Temperature and recent trends in the chemistry of continental surface ozone, Chem. Rev., 115, 3898–3918, https://doi.org/10.1021/cr5006815, 2015. a, b
Qin, M., She, Y., Wang, M., Wang, H., Chang, Y., Tan, Z., An, J., Huang, J., Yuan, Z., Lu, J., Wang, Q., Liu, C., Liu, Z., Xie, X., Li, J., Liao, H., Pye, H. O. T., Huang, C., Guo, S., Hu, M., Zhang, Y., Jacob, D. J., and Hu, J.: Increased urban ozone in heatwaves due to temperature-induced emissions of anthropogenic volatile organic compounds, Nat. Geosci., 18, 50–56, https://doi.org/10.1038/s41561-024-01608-w, 2025. a
Rasmussen, D., Hu, J., Mahmud, A., and Kleeman, M. J.: The ozone–climate penalty: past, present, and future, Environ. Sci. Technol., 47, 14258–14266, https://doi.org/10.1021/es403446m, 2013. a, b
Schär, C., Vidale, P. L., Lüthi, D., Frei, C., Häberli, C., Liniger, M. A., and Appenzeller, C.: The role of increasing temperature variability in European summer heatwaves, Nature, 427, 332–336, https://doi.org/10.1038/nature02300, 2004. a
Schweizerischer Bundesrat: 814.318.142.1 Luftreinhalte-Verordnung, https://www.fedlex.admin.ch/eli/cc/1986/208_208_208/de#app7ahref0 (last access: 15 November 2025), 1985. a, b
Schweizerischer Bundesrat: Verordnung 2 über Massnahmen zur Bekämpfung des Coronavirus (COVID-19) (COVID-19-Verordnung 2), https://www.newsd.admin.ch/newsd/message/attachments/60681.pdf (last access: 14 February 2026), 2020. a
Seinfeld, J. H. and Pandis, S. N.: Atmospheric chemistry and physics: from air pollution to climate change, 3rd edn., John Wiley & Sons, ISBN 978-1-118-94740-1, 2016. a
Sindelarova, K., Granier, C., Bouarar, I., Guenther, A., Tilmes, S., Stavrakou, T., Müller, J.-F., Kuhn, U., Stefani, P., and Knorr, W.: Global data set of biogenic VOC emissions calculated by the MEGAN model over the last 30 years, Atmos. Chem. Phys., 14, 9317–9341, https://doi.org/10.5194/acp-14-9317-2014, 2014. a
Stockwell, C. E., Coggon, M. M., Schwantes, R. H., Harkins, C., Verreyken, B., Lyu, C., Zhu, Q., Xu, L., Gilman, J. B., Lamplugh, A., Peischl, J., Robinson, M. A., Veres, P. R., Li, M., Rollins, A. W., Zuraski, K., Baidar, S., Liu, S., Kuwayama, T., Brown, S. S., McDonald, B. C., and Warneke, C.: Urban ozone formation and sensitivities to volatile chemical products, cooking emissions, and NOx upwind of and within two Los Angeles Basin cities, Atmos. Chem. Phys., 25, 1121–1143, https://doi.org/10.5194/acp-25-1121-2025, 2025. a
Tan, Z., Lu, K., Dong, H., Hu, M., Li, X., Liu, Y., Lu, S., Shao, M., Su, R., Wang, H., Wu, Y., Wahner, A., and Zhang, Y.: Explicit diagnosis of the local ozone production rate and the ozone-NOx-VOC sensitivities, Sci. Bull., 63, 1067–1076, https://doi.org/10.1016/j.scib.2018.07.001, 2018. a
Twardosz, R., Walanus, A., and Guzik, I.: Warming in Europe: recent trends in annual and seasonal temperatures, Pure Appl. Geophys., 178, 4021–4032, https://doi.org/10.1007/s00024-021-02860-6, 2021. a, b
Wang, Y., van Pinxteren, D., Tilgner, A., Hoffmann, E. H., Hell, M., Bastian, S., and Herrmann, H.: Ozone (O3) observations in Saxony, Germany, for 1997–2020: trends, modelling and implications for O3 control, Atmos. Chem. Phys., 25, 8907–8927, https://doi.org/10.5194/acp-25-8907-2025, 2025a. a
Wang, Y., Yang, Y., Yuan, Q., Li, T., Zhou, Y., Zong, L., Wang, M., Xie, Z., Ho, H. C., Gao, M., Tong, S., Lolli, S., and Zhang, L.: Substantially underestimated global health risks of current ozone pollution, Nat. Commun., 16, 102, https://doi.org/10.1038/s41467-024-55450-0, 2025b. a
Weng, H., Lin, J., Martin, R., Millet, D. B., Jaeglé, L., Ridley, D., Keller, C., Li, C., Du, M., and Meng, J.: Global high-resolution emissions of soil NOx, sea salt aerosols, and biogenic volatile organic compounds, Sci. Data, 7, 148, https://doi.org/10.1038/s41597-020-0488-5, 2020. a
Wu, S., Mickley, L. J., Leibensperger, E. M., Jacob, D. J., Rind, D., and Streets, D. G.: Effects of 2000–2050 global change on ozone air quality in the United States, J. Geophys. Res.-Atmos., 113, https://doi.org/10.1029/2007JD008917, 2008. a, b
Wu, W., Fu, T.-M., Arnold, S. R., Spracklen, D. V., Zhang, A., Tao, W., Wang, X., Hou, Y., Mo, J., Chen, J., Li, Y., Feng, X., Lin, H., Huang, Z., Zheng, J., Shen, H., Zhu, L., Wang, C., Ye, J., and Yang, X.: Temperature-dependent evaporative anthropogenic VOC emissions significantly exacerbate regional ozone pollution, Environ. Sci. Technol., 58, 5430–5441, https://doi.org/10.1021/acs.est.3c09122, 2024. a
Yan, Y., Pozzer, A., Ojha, N., Lin, J., and Lelieveld, J.: Analysis of European ozone trends in the period 1995–2014, Atmos. Chem. Phys., 18, 5589–5605, https://doi.org/10.5194/acp-18-5589-2018, 2018. a