the Creative Commons Attribution 4.0 License.
the Creative Commons Attribution 4.0 License.
 | 09 Apr 2026
A new data set of nighttime chemical heating rates in the upper mesosphere and lower thermosphere derived from SCIAMACHY OH (9–6) emissions and SABER profiles
Xiaolin Wu
Anne K. Smith
Martin Kaufmann
Guoying Jiang
Shuai Liu
Jiyao Xu
Chemical heating from exothermic reactions is a key component of the upper mesosphere–lower thermosphere (UMLT) energy budget, yet its quantification remains uncertain. We derive a new data set of heating rates at 22:00 local time for seven major reactions using Scanning Imaging Absorption Spectrometer for Atmospheric Chartography (SCIAMACHY) OH (9–6) limb emissions, collocated with Sounding of the Atmosphere using Broadband Emission Radiometry (SABER) temperature and ozone profiles. The retrieval assumes chemical equilibrium for ozone and HOx and applies updated Einstein coefficients from HITRAN-2020. Consistent with earlier studies, the relative importance of individual reactions varies systematically with altitude: the hydrogen + ozone reaction (H+O3) provides the leading contribution below ∼92 km, whereas three-body oxygen recombination () dominates above this level. Other reactions make a substantial contribution across much of the 80–96 km region, accounting for roughly one-third to one-half of the total chemical heating above ∼86 km. The derived latitude-altitude heating structures of the dominant reactions are significantly modulated by atmospheric tides. In the equatorial zone, these heating rates exhibit a pronounced semiannual cycle that tracks seasonal changes in temperature and key reactants. Relative to previous SCIAMACHY-based estimates, the updated data set yields lower heating rates from H+O3. An uncertainty assessment indicates ∼30 % uncertainty for H+O3 and ∼45 %–80 % for . These results refine and consolidate current understanding of chemical heating and its variability in the UMLT.
- Article
(9115 KB) - Full-text XML
- BibTeX
- EndNote


The upper mesosphere–lower thermosphere (UMLT) region, spanning altitudes from approximately 80–120 km, is a critical coupling zone between the ionosphere and the lower atmosphere. Within this region, dynamics, energetics, and photochemistry are tightly coupled. Understanding its energy budget is essential for interpreting the thermal structure, circulation, chemical composition, as well as their interactions (Mlynczak and Solomon, 1993). The primary energy source in this region is solar ultraviolet radiation absorbed by molecular oxygen and ozone. While part of the absorbed energy is immediately converted into heat, a significant portion is stored as chemical potential energy through photolysis (Mlynczak, 2000). The stored chemical energy is subsequently released primarily as heat, and partly as airglow radiation, through various exothermic reactions, making chemical heating a critical component of the UMLT energy budget, particularly at night when direct solar heating is absent.
To better appreciate the importance of chemical heating in the mesopause region, we consider representative peak magnitudes of the major energy budget terms in the 80–100 km altitude range. Radiative cooling in this region is dominated by CO2 15 µm emission, with magnitudes typically (States and Gardner, 2000; Mlynczak et al., 2022, 2024). This cooling is balanced by various heating terms. The diurnally averaged solar heating due to ultraviolet absorption by O2 and O3 typically amounts to , while chemical heating rates are estimated to reach magnitudes of ∼10–15 K d−1 (Mlynczak and Solomon, 1993; Mlynczak, 2000). Regarding dynamical effects, processes such as gravity wave breaking and adiabatic motions can produce large local heating or cooling rates, reaching several tens of K d−1 in localized layers or during transient events (e.g., Lübken, 1997; Gardner and Yang, 1998; Vincent, 2015; Grygalashvyly et al., 2024). However, on a global and annual mean basis, the total energy input from solar radiation and chemical reactions is generally considered sufficient to account for the radiative cooling by CO2 (Mlynczak et al., 2013b, 2018), while the net contribution of dynamical effects is estimated to be relatively small.
Given the significant contribution of chemical heating to the energy budget, accurate quantification of its rates is crucial. Furthermore, such quantification provides important insights into mesospheric inversion layers (Ramesh et al., 2017) and enables energetic constraints on the concentrations of key reactive species, such as atomic oxygen (Mlynczak et al., 2013a).
The importance of chemical heating was recognized early by Kellogg (1961), who proposed the hypothesis that energy released from atomic oxygen recombination could explain the anomalous warming of the polar winter mesosphere. However, accurately quantifying chemical heating remains challenging, primarily due to the difficulty in directly measuring the densities of key reactants, particularly atomic oxygen (O) and hydrogen (H). To overcome this challenge, comprehensive photochemical models were subsequently developed to provide systematic estimates of heating rates from the complex oxygen–hydrogen system (Crutzen, 1971; Hunt, 1972; Garcia and Solomon, 1985). Mlynczak and Solomon (1991) used the established two-dimensional model of Garcia and Solomon (1985) to assess the heating released by exothermic reactions involving odd-hydrogen species. Their results showed that these reactions were a major heat source in the upper mesosphere, sometimes becoming the dominant heating process.
In parallel with model development, observational constraints on the UMLT improved steadily. In particular, rocket-borne measurements of atomic oxygen, atmospheric density, and temperature have facilitated more reliable estimates of chemical heating rates. Based on high-latitude rocket data, Brasseur and Offermann (1986) found that the reaction is a major source of heat in the UMLT, and that odd hydrogen species also play a significant role in the thermal budget. More recently, Grygalashvyly et al. (2024) retrieved nighttime chemical heating using rocket measurements over Andøya from three key reactions and found that vertically averaged chemical heating across the mesopause generally exceeds the heat of dissipation of turbulent energy, with the latter only surpassing chemical heating in narrow layers of several hundred meters.
Satellite observations have provided additional insights into the spatiotemporal variability of the chemical heating rates. Riese et al. (1994) used atomic oxygen and hydrogen densities retrieved from the Solar Mesosphere Explorer (SME) hydroxyl (OH) airglow data (Thomas, 1990) to calculate the total chemical energy release from the main seven exothermic reactions. They found that the heating rates were significantly higher than those reported in previous studies. Kaufmann et al. (2008, 2013) estimated a peak chemical heating rate of about 10 K d−1 for the reaction between H and O3, based on the Scanning Imaging Absorption Spectrometer for Atmospheric Chartography (SCIAMACHY) OH (9–6) spectral data. Further progress came with the Sounding of the Atmosphere using Broadband Emission Radiometry (SABER) instrument, where Mlynczak et al. (2013a, 2018) retrieved O and H densities from the OH 2.0 µm channel. The official SABER Level 2B heating-rate products, based on these retrievals, were subsequently used by Ramesh et al. (2014, 2017) to investigate the relationship between chemical heating and mesospheric inversion layers. More recently, Kulikov et al. (2024a) derived an independent data set of O, H, and chemical heating rates from SABER 2 µm emissions, but used an OH emission model different from that of Mlynczak et al. (2013a, 2018). These studies demonstrate that OH airglow emissions serve as an effective proxy for chemical heating rate retrieval. Nevertheless, uncertainties in the OH emission mechanism remain a persistent challenge, contributing to substantial uncertainty in the estimated heating rates.
Recent updates to the key physical parameters in the OH emission model (Sharma et al., 2015; Kalogerakis et al., 2016), along with the updated Einstein coefficients from the HITRAN-2020 database (Gordon et al., 2022), provide an opportunity to reassess chemical heating rates in the UMLT region. Given the considerable uncertainties in deriving heating rates from airglow observations, independent determinations using different instruments and retrieval approaches are essential for characterizing systematic biases and building confidence in the results.
This study aims to derive a new data set of chemical heating rates for seven major exothermic reactions in the UMLT and to characterize their spatial and seasonal structures, based on SCIAMACHY OH (9–6) observations and SABER ozone and temperature data, using the latest physical parameters.
The structure of this paper is as follows. Section 2 introduces the data sets and the method for retrieving chemical heating rates. Section 3 presents the main results, including an uncertainty analysis, representative vertical profiles, and the spatial and seasonal variability of the heating rates. Section 4 compares the derived heating rates with other existing data sets. Section 5 summarizes the main findings of this study.
2.1 Data
The OH emission spectra used in this study were measured by the SCIAMACHY instrument (Bovensmann et al., 1999) onboard the European Environmental Satellite (Envisat), which operated from 2002–2012 in a sun-synchronous orbit. During nighttime limb observations, the instrument scanned tangent altitudes from approximately 73–148 km with a vertical step of about 3.3 km. The latitudinal region covered by SCIAMACHY limb observations varies seasonally between 50° S and 80° N, depending on the solar illumination geometry and calibration measurements performed on the night side of the satellite orbit (Bovensmann et al., 1999; Sui et al., 2024). SCIAMACHY measured radiation across eight spectral channels from 220–2400 nm, with spectral resolution ranging from 0.2–1.5 nm depending on the channel (Gottwald et al., 2006). In this study, we use OH (9–6) limb emission spectra from channel 6, spanning 1377–1400 nm with a spectral resolution of 1.5 nm, recorded at 22:00 local solar time (LST). Channel 6 is well-calibrated and has been previously used to retrieve the densities of oxygen and hydrogen (Zhu and Kaufmann, 2018; Wu et al., 2025), as well as H+O3 heating rates (Kaufmann et al., 2008, 2013).
Since SCIAMACHY lacked simultaneous nighttime measurements of ozone, temperature, and total density in the UMLT, these parameters were obtained from the SABER version 2.0 data set. SABER is a key payload on the Thermosphere, Ionosphere, Mesosphere, Energetics and Dynamics (TIMED) satellite and has been providing high-quality global measurements of mesosphere and lower thermosphere since 2002. The instrument is a limb-scanning multichannel radiometer that measures atmospheric temperature, airglow emissions, and constituent profiles (Russell et al., 1994; Mlynczak and Russell, 1995).
To improve the signal-to-noise ratio of the SCIAMACHY radiance data and to ensure sampling consistency between the two instruments, the data from both instruments were processed into monthly zonal medians calculated independently at each altitude level. The median for each 5° latitude bin was calculated from the measurements within a spatiotemporal window of ±2.5° in latitude and ±1 hour at 22:00 LST. Due to the precessing orbit of the TIMED satellite, SABER measurements within the 22:00 LST window are available on a limited number of days per month. A statistical analysis for 2005 shows that each month includes 18–31 d with measurements in the 22:00 LST (±1 h) window. When aggregated into 5° latitude bins, each bin contains on average about 9 sampling days per month; approximately 75 % of the bins are sampled on more than 5 d, and about 40 % on more than 10 d. Despite this limited temporal sampling, the use of monthly zonal medians effectively reduces the influence of short-term atmospheric variability and outliers, providing representative climatological profiles. The mixing ratios of N2 and O2 were taken from the NRLMSIS 2.0 model (Emmert et al., 2021).
2.2 Hydroxyl night airglow model
In the UMLT, the odd-hydrogen family is tightly coupled by fast reactions. Because the partitioning among HOx adjusts on seconds-to-minutes timescales at these altitudes, photochemical steady state is appropriate for OH and HO2 at night: their chemical production and loss rates approximately balance. The dominant reactions involve H, O, O3, temperature, and the background species O2 and N2, and are summarized in Table 1.
Hydroxyl (OH) forms primarily via the exothermic reaction , which produces vibrationally excited OH (denoted OH(v)). OH is removed mainly by reactions with O and O3.
For the excited vibrational manifold OH(v), we assume steady balance of level populations: for each v, production by H+O3 is balanced by radiative decay and collisional quenching by O, O2, and N2. Under optically thin conditions, radiative transfer effects along the line of sight can be neglected, allowing the observed radiance to be directly related to the local volume emission rate (VER). The VER for a transition depends linearly on the upper-state population and the corresponding Einstein A-coefficients.
This allows the retrieval of [O] and [H], where the square brackets denote the number density of the respective species, from OH (9–6) volume emission rates, following the method described by Zhu and Kaufmann (2018) and Wu et al. (2025):
In this expression, VER(9−6) refers to the volume emission rate of the OH (9–6) airglow band measured by SCIAMACHY (in units of photons ). The numerator represents the production rate of OH(v=9) via the exothermic reaction H+O3, where k1 is the rate constant for this reaction, and f9 is the branching ratio for the v=9 state, taken as 0.47 (Adler-Golden, 1997). The denominator represents the total loss of OH(v=9). and represent the quenching rate coefficients of OH(v=9) by O2 and N2, respectively. kO,9 is the total loss rate of OH(v=9) with O by chemical and collisional quenching. These removal rate constants are consistent with those used in Zhu and Kaufmann (2018) and Wu et al. (2025). The parameter A9 refers to the total spontaneous emission rate for the v=9 state, and A96 corresponds to the sum of the Einstein coefficients for all ro-vibrational lines considered in the OH (9–6) band. Both values are taken from the HITRAN-2020 database (Gordon et al., 2022).
At night in the UMLT ozone varies on timescales short enough that its chemical production and loss approximately balance (photochemical steady state). Photolysis is negligible, and the dominant terms are (i) three-body formation of ozone by and (ii) loss by reaction with atomic hydrogen and atomic oxygen, and . Other sinks (e.g., OH+O3) are typically smaller at night in this altitude range and are neglected here for simplicity. Recent studies indicate that the lower boundary of the nighttime ozone chemical equilibrium depends on season and latitude and can be located several kilometers above 80 km (Kulikov et al., 2018, 2023). The potential impact of deviations from chemical equilibrium is discussed in Sect. 3.1 and is found to be limited for the primary heating structures considered in this study. Therefore, we adopt 80 km as the nominal lower boundary for the retrieval. Under this equilibrium assumption, the following relation holds:
k6 and k7 are the rate constants for the reactions and O+O3, respectively. M represents the background atmosphere. These reaction rates are taken from Burkholder et al. (2020).
Following the approach of Zhu and Kaufmann (2018) and Wu et al. (2025), we simultaneously solve for the densities of atomic oxygen and atomic hydrogen by combining the OH airglow model (Eq. 1) with the ozone chemical equilibrium equation (Eq. 2). The primary update in this study is the use of Einstein coefficients from the HITRAN-2020 database, replacing the HITRAN-2012 values used in earlier work.
In addition to [H] and [O], estimating chemical heating also requires the densities of OH and HO2, for which no direct observations are available. These densities are inferred assuming chemical equilibrium, with the lower boundary altitude ranging from 73–85 km depending on season and latitude (Kulikov et al., 2024b). The formulas for calculating the densities of OH and HO2 are given below, with the corresponding reaction rate constants listed in Table 1. Equations (3) and (4) form a coupled set of algebraic equations for [OH] and [HO2], which are solved simultaneously under the assumption of chemical equilibrium.
Table 1Chemical reactions, rate constants, and enthalpy changes.
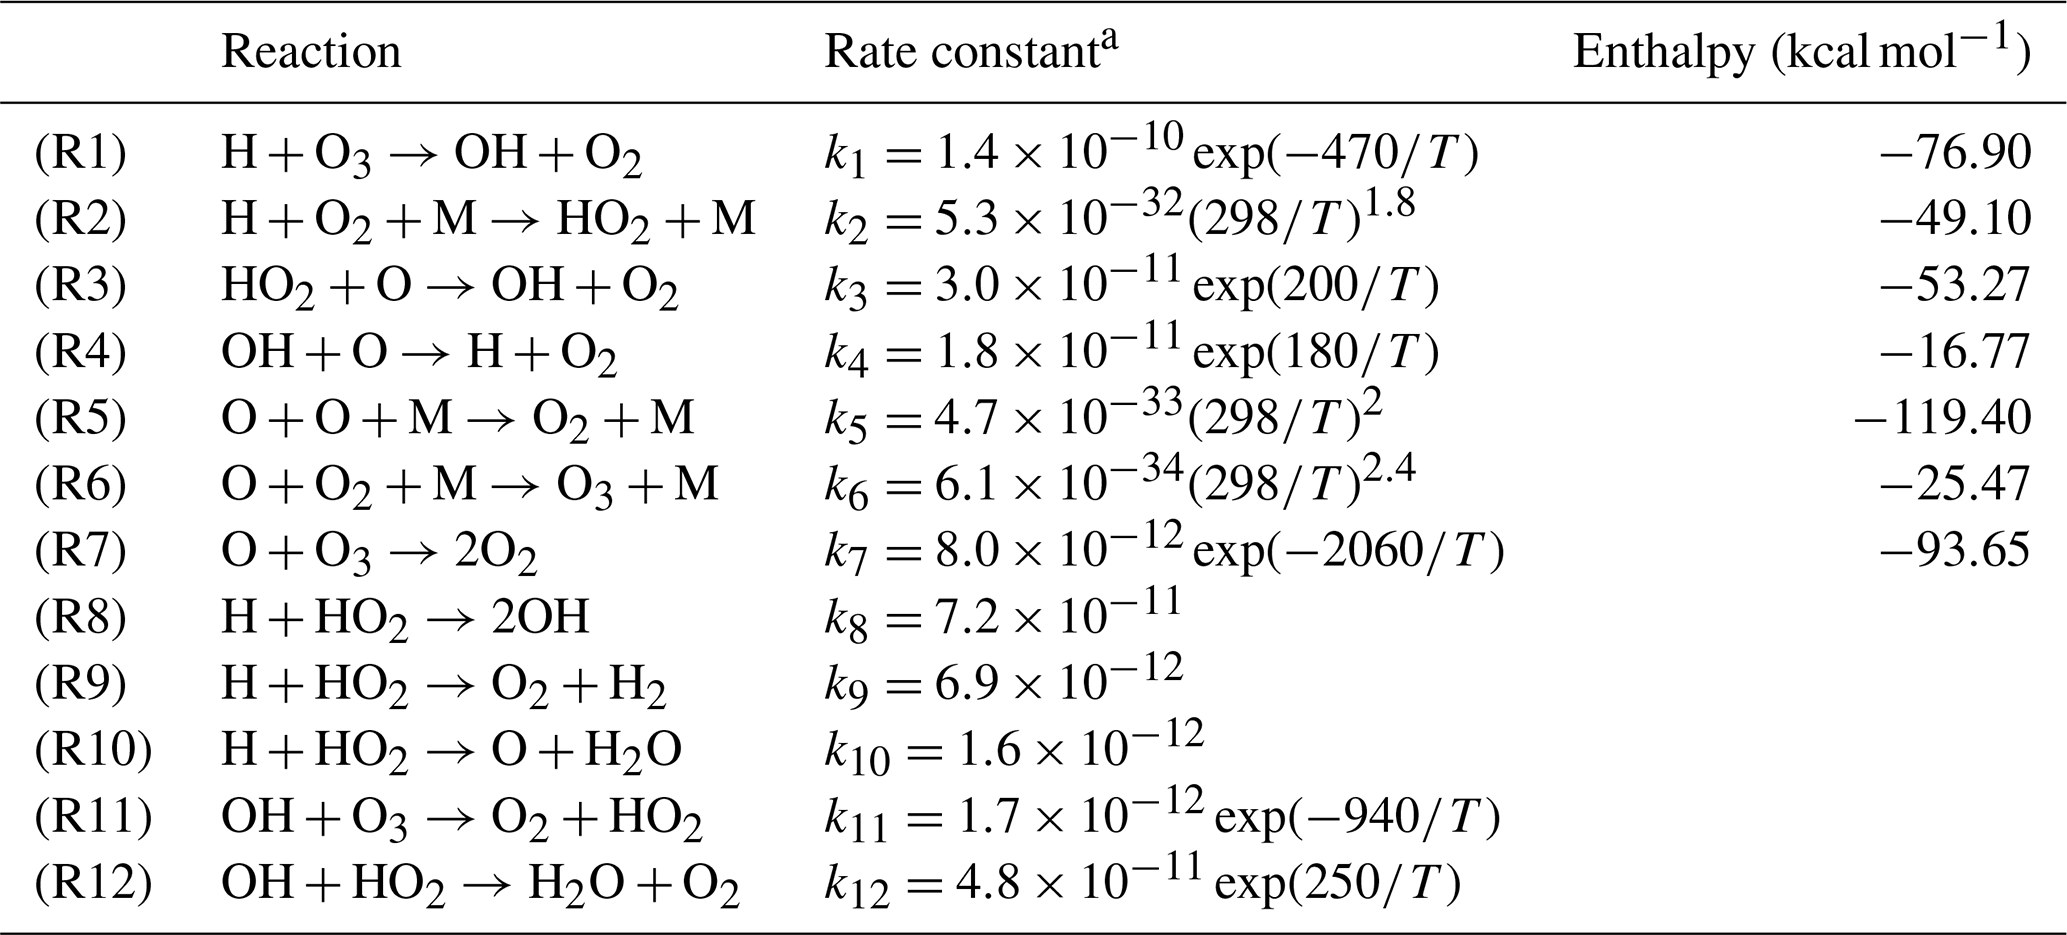
a Units are for two-body reactions and for three-body reactions. Rate constants are taken from Burkholder et al. (2020).
2.3 Derivation of heating rates
The chemical heating in the mesopause region originates from the release of potential energy stored in chemical species produced by the solar photolysis of O2 and H2O. This process generates the primary chemical families responsible for heating: the odd-oxygen family (), which acts as the main energy carrier, and the odd-hydrogen family (), which drives highly efficient catalytic cycles. The stored energy is released primarily as heat through two main pathways: direct recombination of odd-oxygen (e.g., ) and catalytic reactions, among which the reaction between H and O3 is particularly significant. To quantitatively evaluate the heat released by these processes, this study focuses on seven key exothermic reactions involving the Ox and HOx families, as identified by Mlynczak and Solomon (1993). These reactions (R1–R7), along with their energy releases and rate constants from Burkholder et al. (2020), are detailed in Table 1.
It is important to note that the total energy released by these exothermic reactions is not always fully converted into atmospheric heating. A portion of the chemical energy can be transferred to the internal energy of the product molecules, which may then be radiated away as chemiluminescence before it can be thermalized through collisions. As a result, the chemical heating efficiency, defined as the ratio of energy converted to heat to the total energy released, can be less than one for certain reactions. The reaction of H+O3 is the most prominent example of this in the mesopause, as it produces vibrationally excited hydroxyl radicals, which subsequently radiate strongly in the Meinel bands. Based on a detailed evaluation, Mlynczak and Solomon (1993) recommended a heating efficiency of approximately 0.6 for this reaction. Smith et al. (2015) revisited the heating efficiency and found that the efficiency varies with atmospheric pressure, atomic oxygen concentration, and temperature, and that a value of 0.6 remains a good estimate for the global annual mean. Therefore, this study adopts an efficiency of 0.6 for the H+O3 reaction, and unit efficiency (1.0) for the other six reactions as recommended by Mlynczak and Solomon (1993).
Heating rates () for a given Reaction (Rx) can be calculated by the following formula:
Where ΔE represents the exothermicity of the Reaction (Rx), and ϵ is its heating efficiency. The term Pc is the rate of the reaction, calculated as the product of the reaction rate constant kx and the number densities of the corresponding reactants. For example, for Reaction (R1) between H and O3, Pc is . While the number densities of reactants H, O, OH, and HO2 required for calculating Pc are retrieved in this study, the remaining inputs such as O3, atmospheric density, and temperature are obtained from the SABER data set. The factor originates from the relationship between the specific heat capacity of air at constant pressure and the gas constant. kB is the Boltzmann constant and [M] is the total atmospheric number density.
3.1 Uncertainty analysis
In this section, we analyze the uncertainties in the heating rates for the dominant Reactions (R1) H+O3 and (R5) . Uncertainty estimates are obtained by perturbing key input parameters and model coefficients including temperature, O3 density, collisional quenching rates, Einstein coefficients, and heating efficiency, and then quantifying their respective impact on the calculated heating rates. In addition, the use of monthly zonal median data prior to retrieval can introduce biases due to the nonlinear dependence of the retrieval algorithm on its inputs. This nonlinearity-induced uncertainty is evaluated using synchronous SABER observations, as detailed in Appendix A.
The SABER kinetic temperature uncertainty is taken as 2 K at 80 km and increases to 7–8 K at 96 km (Remsberg et al., 2008). The uncertainty in O3 density is taken to be 20 % (Smith et al., 2013). For the collisional rate coefficients, we adopt uncertainty ranges of for kO,9, for , and for (Kalogerakis et al., 2011; Zhu and Kaufmann, 2018). HITRAN-2020 does not provide explicit uncertainties for Einstein A-coefficients, as they are assumed to share the same uncertainties as line intensities (Gordon et al., 2022). For the OH (9–6) lines used here, the HITRAN uncertainty code indicates 10 %–20 %; we therefore adopt 20 % as a representative value. For heating efficiency, we assume 0.6±0.1 for Reaction (R1) (Smith et al., 2015; Grygalashvyly et al., 2024).
For the heating rates of Reaction (R1), our analysis shows that the uncertainty in the collisional quenching rate has the largest impact, causing a perturbation of approximately 20 %. Heating efficiency and Einstein coefficients are also major sources of uncertainty, causing approximately 17 % and 15 % perturbations to the results, respectively. The influence of other parameters is smaller. Uncertainties in quenching rates kO,9 and temperature each lead to a perturbation of approximately 10 % in the calculated heating rate. The nonlinearity-induced uncertainty is estimated to be below 3 %. The remaining factors, including quenching rates and O3 density, have a limited impact of no more than 3 %. Assuming these error sources are independent, the total RSS uncertainty for Reaction (R1) is estimated to be approximately 30 % at 80–96 km, dominated by the uncertainties in , heating efficiency, and the Einstein coefficients.
For Reaction (R5), temperature is the dominant source of uncertainty, inducing a 20 %–60 % perturbation in the primary heating region above 90 km. Other major contributors include the Einstein coefficients and the collisional quenching rate kO,9, inducing uncertainties of approximately 30 % and 20 %–30 %, respectively. The impact of is moderate, introducing a 15 %–30 % variation, whereas the effects of O3 density and are smaller, at around 10 % and 5 %, respectively. The nonlinearity-induced uncertainty is approximately 10 %. The total RSS uncertainty for Reaction (R5) is estimated to be 45 %–80 % at 80–96 km, primarily driven by temperature, the Einstein coefficients and kO,9.
Finally, the total RSS uncertainty for the combined chemical heating from all seven Reactions (R1–R7) is estimated to be 25 %–65 % between 80 and 96 km, with a peak value of 65 % at 96 km. The dominant sources of uncertainty vary with altitude. Above 90 km, temperature is the largest contributor, introducing a perturbation of about 50 % at 96 km. The second-largest contributor in this region is the quenching rate kO,9, causing a perturbation of approximately 30 % at 96 km. Below 90 km, is the dominant factor, introducing a perturbation of about 20 %. Additionally, the uncertainty in the Einstein coefficients remains non-negligible across 80–96 km, causing a perturbation of approximately 15 %–20 %. The nonlinearity-induced uncertainty is in the range of 5 %–15 %.
It should be noted that the retrieval relies on the assumption of chemical equilibrium for O3, OH, and HO2. This assumption may not hold in the 80–85 km altitude range, depending on season and latitude (Kulikov et al., 2018, 2023, 2024b). However, the retrieved [H] and the heating rate of Reaction (R1) are only weakly affected. This is because the reaction rate k1[H][O3] is determined by the observed OH (9–6) emission and the total OH(v=9) loss rate. At 80–85 km, the total loss rate is dominated by radiative decay and quenching by O2 and N2, while the contribution from atomic oxygen quenching is two to three orders of magnitude smaller (Smith et al., 2010, Fig. 1). Thus, errors in [O] caused by the equilibrium breakdown do not significantly propagate to the R1 heating rates. In contrast, the densities of O, OH, and HO2 derived from chemical equilibrium relationships are more sensitive to the validity of the equilibrium assumption, potentially introducing larger uncertainties in the heating rates for Reactions (R3–R7) at 80–85 km. Nevertheless, for Reaction (R5) , our primary focus is on its dominant heating layer located above 85 km, and thus the main results for this reaction are largely unaffected.
3.2 Heating rate profiles
Figure 1 displays the chemical heating rate profiles for the seven chemical reactions calculated using Eq. (5) and their total, and averaged over June–August 2007, for the 20–40° S (left), 10° S–10° N (middle), and 20–40° N (right) latitude bands. The results indicate that Reaction (R1) H+O3 is the primary chemical heating source below 92 km, with heating rates peaking at 4–5 K near 90 km and a maximum relative contribution of 45 % to the total heating at 86 km. Above 92 km, the Reaction (R5) becomes the main contributor, peaking at 3–4 K around 93–96 km, and accounting for up to 50 % of the total heating at 96 km. The contributions from Reaction (R2) and (R3) are minimal, with maximum values of only 0.5–1 K near 83 km. Their similar vertical profiles are expected, as the product of Reaction (R2) (HO2) serves as a reactant in Reaction (R3). The heating rates from Reaction (R4) peak at around 90 km with a maximum of 1.7 K, contributing about 15 % to the total heating below 90 km. Reaction (R6) reaches a peak heating of about 2.6 K near 90 km. The altitude profile of Reaction (R6) closely resembles that of Reaction (R1), as Reaction (R6) produces O3, which acts as a key reactant in Reaction (R1). For Reaction (R7), the maximum heating rate is less than 1 K around 93 km, with negligible contribution below 85 km. Overall, the total chemical heating rate peaks around 11 K at 90–93 km and decreases away from this altitude range.
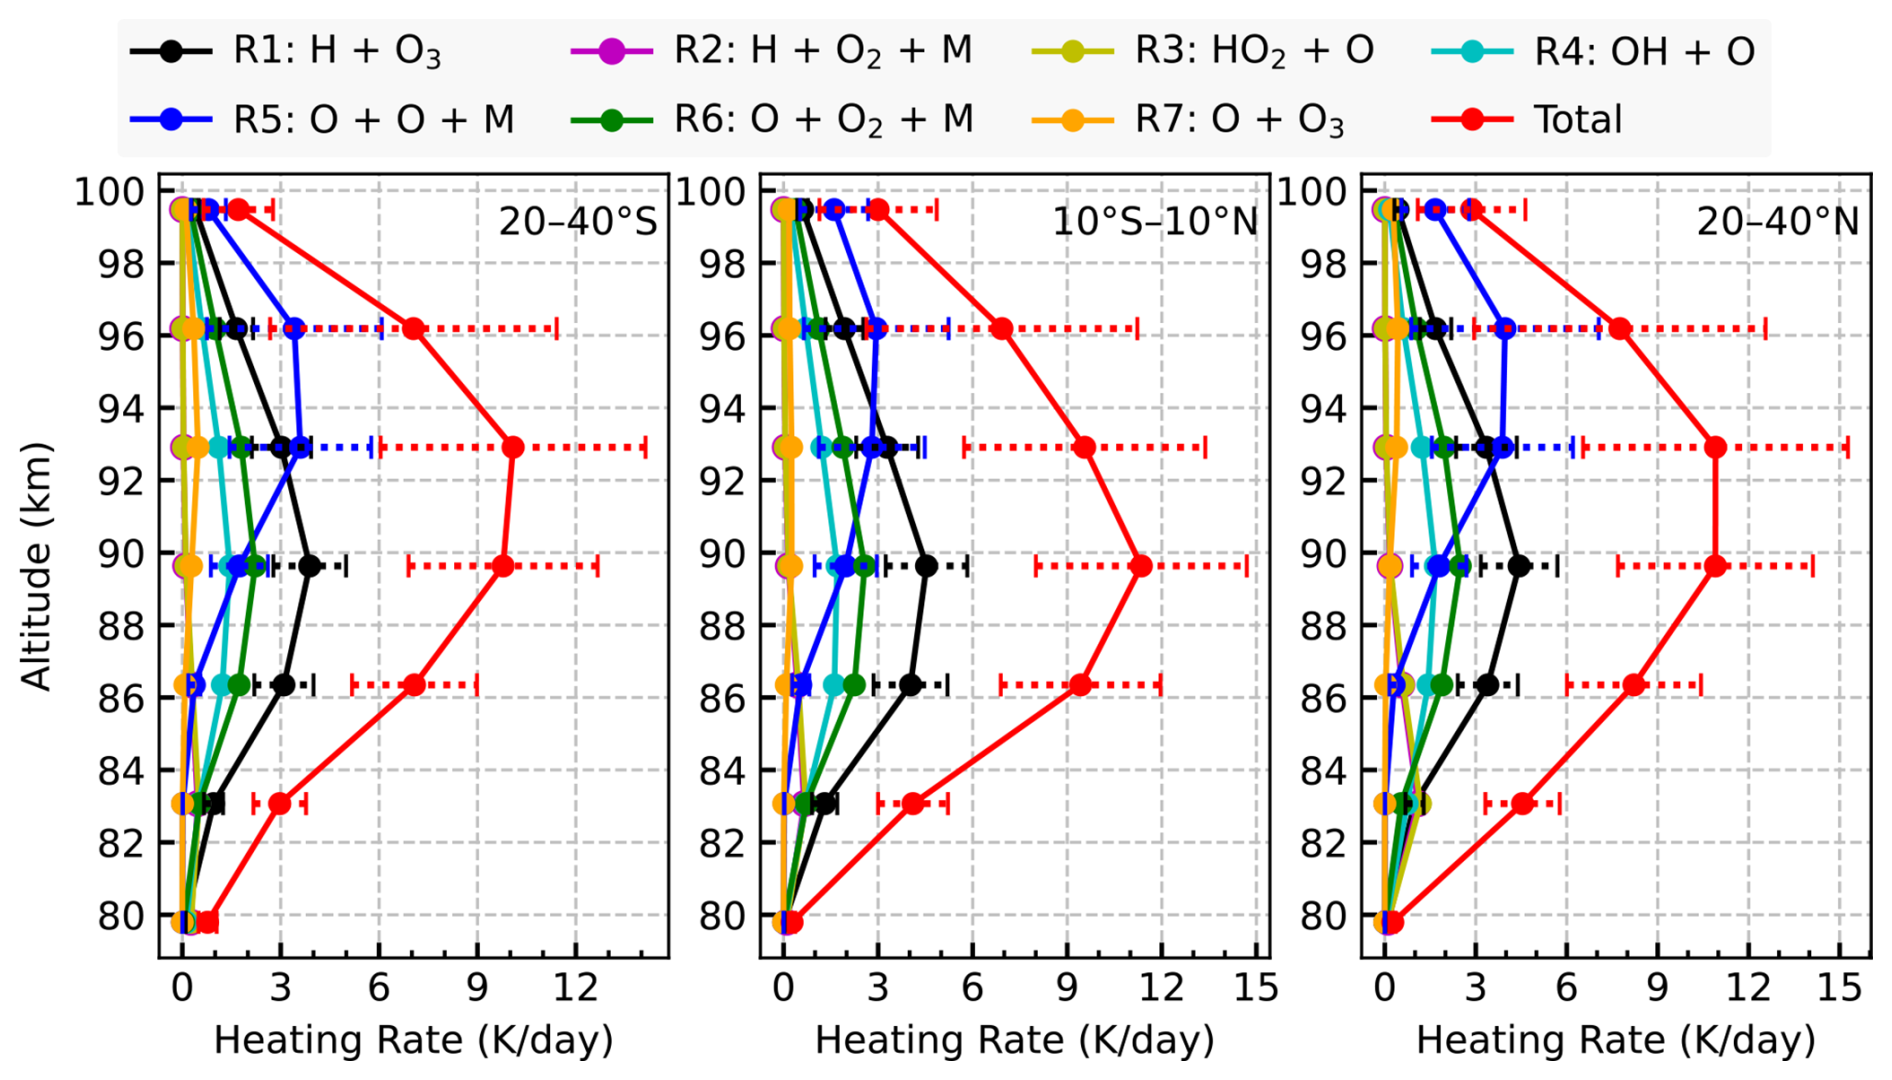
Figure 1Chemical heating rate profiles (K d−1) from seven exothermic Reactions (R1–R7) and their total sum, averaged over June–August 2007, for 20–40° S, 10° S–10° N, and 20–40° N latitude bands between 80 and 100 km at 22:00 LST. Horizontal dotted lines denote the estimated uncertainties for Reactions (R1), (R5), and the total chemical heating.
The analysis above reveals that Reaction (R1) H+O3 and Reaction (R5) are the two dominant contributors to chemical heating. Reaction (R1) serves as the main heating source below approximately 92 km, with its rate governed by the local densities of H and O3, as well as the ambient temperature, whereas Reaction (R5) dominates above this altitude, with its rate primarily driven by the atomic oxygen concentration. Although Reactions (R1) and (R5) are the primary sources of heating, the combined contribution from other chemical reactions is also non-negligible. Above 86 km, these other reactions contribute around 30 %–50 % to the total chemical heating, while below 86 km, their contribution exceeds 50 %.
We further evaluated the relative contributions of the odd-hydrogen reactions (R1–R4) and odd-oxygen reactions (R5–R7) to the total chemical heating over the 80–100 km altitude range. The results show that the relative contribution from the odd-hydrogen reactions decreases with altitude, whereas that from the odd-oxygen reactions increases. The two contributions become comparable near 92 km.
This vertical structure, characterized by a crossover altitude around 92 km, is a fundamental feature of the nighttime UMLT energy budget and is consistent with previous research. Early modeling studies showed that heating from odd-hydrogen chemistry can exceed that from odd-oxygen reactions between 70 and 90 km (Mlynczak and Solomon, 1991). SME observations demonstrated that odd-oxygen reactions dominate near 93 km, while at lower altitudes the influence of atomic oxygen decreases rapidly, giving way to odd-hydrogen reactions (Riese et al., 1994). Thus, our findings, derived from SCIAMACHY OH limb emissions collocated with SABER atmospheric profiles, provide a robust, independent confirmation of this UMLT energy budget feature.
3.3 Latitude–altitude distribution
The latitude–altitude distribution of the chemical heating rate from Reaction (R1) for each month of 2007 is illustrated in Fig. 2. The heating peak occurs around 85–90 km, with peak rates of 4–8 K d−1, which vary with season and latitude. Heating rates are generally higher in spring and autumn, particularly at the equator and in the mid-latitudes. By averaging all low- to mid-latitude profiles from 2003 to 2011, we find that the heating peak for Reaction (R1) is approximately 4–5 K d−1 at 85–90 km.
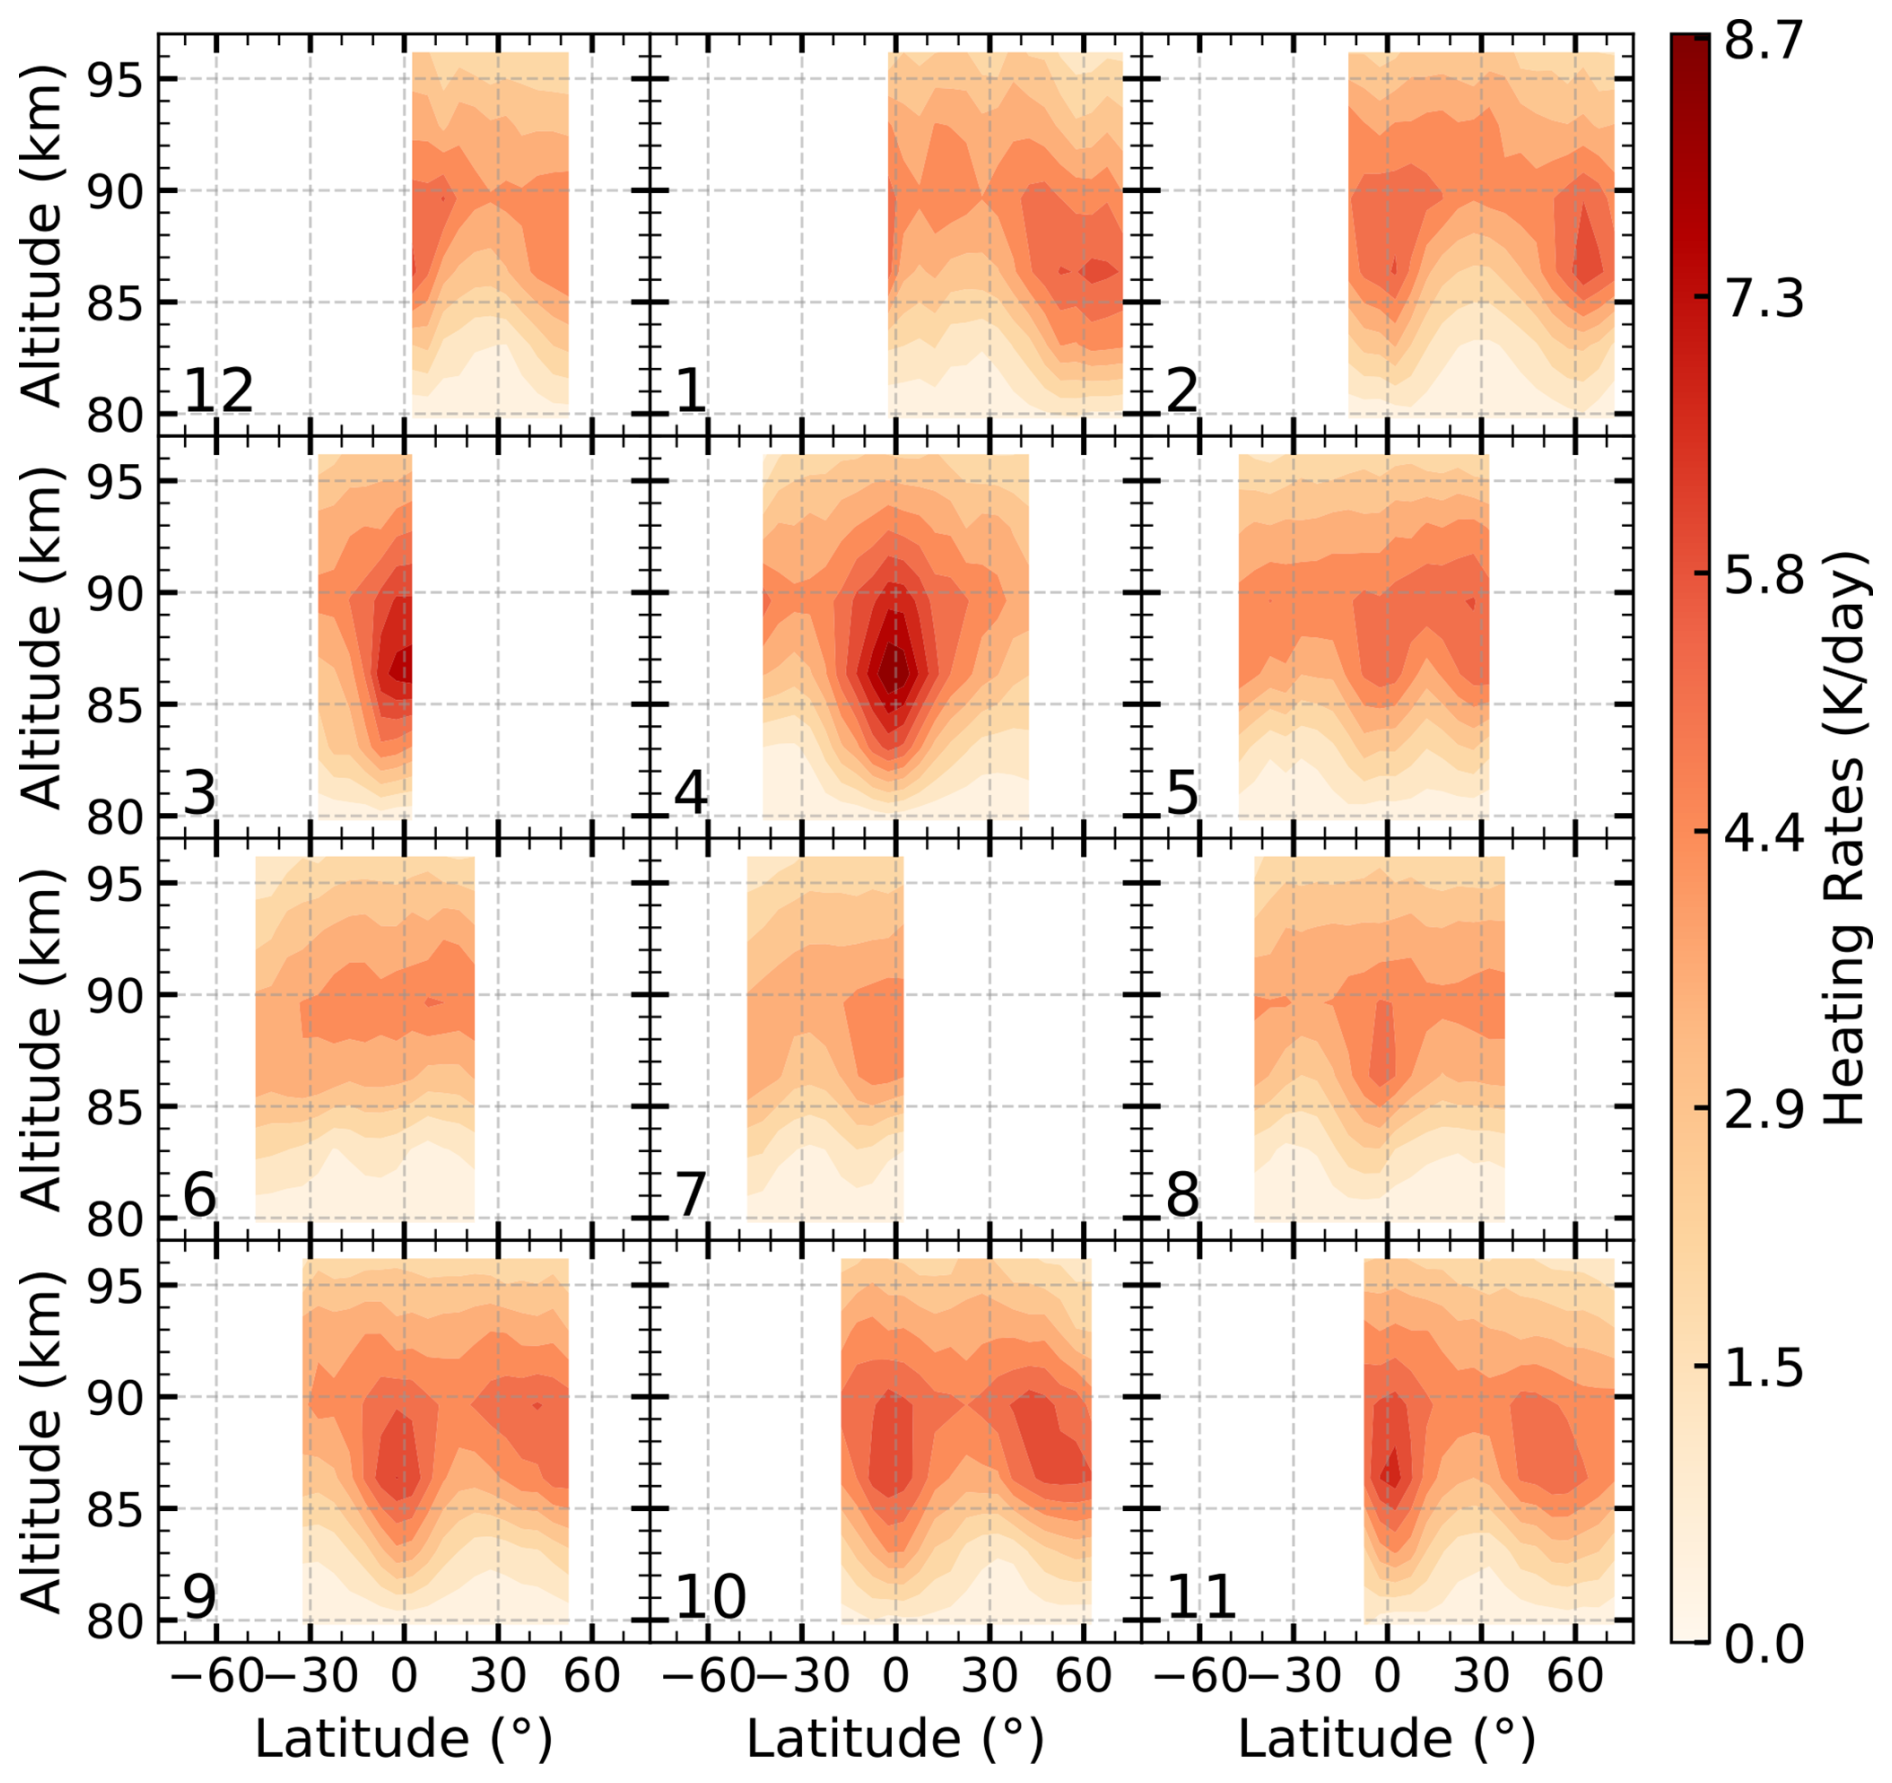
Figure 2Latitude–altitude distribution of chemical heating rates for Reaction (R1) H+O3 in 2007 at 22:00 LST, derived from SCIAMACHY OH (9–6) emission data and SABER atmospheric profiles. The numbers indicate the month of the year.
Figure 3 shows the latitude–altitude distribution of chemical heating rates for Reaction (R5) , in 2007. Reaction (R5) primarily produces heating above 90 km, with peak values near 96 km, where atomic oxygen reaches its maximum concentration. Its peak magnitude varies substantially, ranging from 4–18 K d−1 depending on season and latitude. In terms of latitude, the largest heating rates are typically centered around 30° N, reaching a maximum of 18 K d−1 in October. However, in April, substantial heating also occurs in the equatorial region, with rates of about 10 K d−1 and heating extending downward to around 85 km. Based on calculations from 2003 to 2011, the averaged peak heating rate for Reaction (R5) is around 5 K d−1 at 92–96 km.
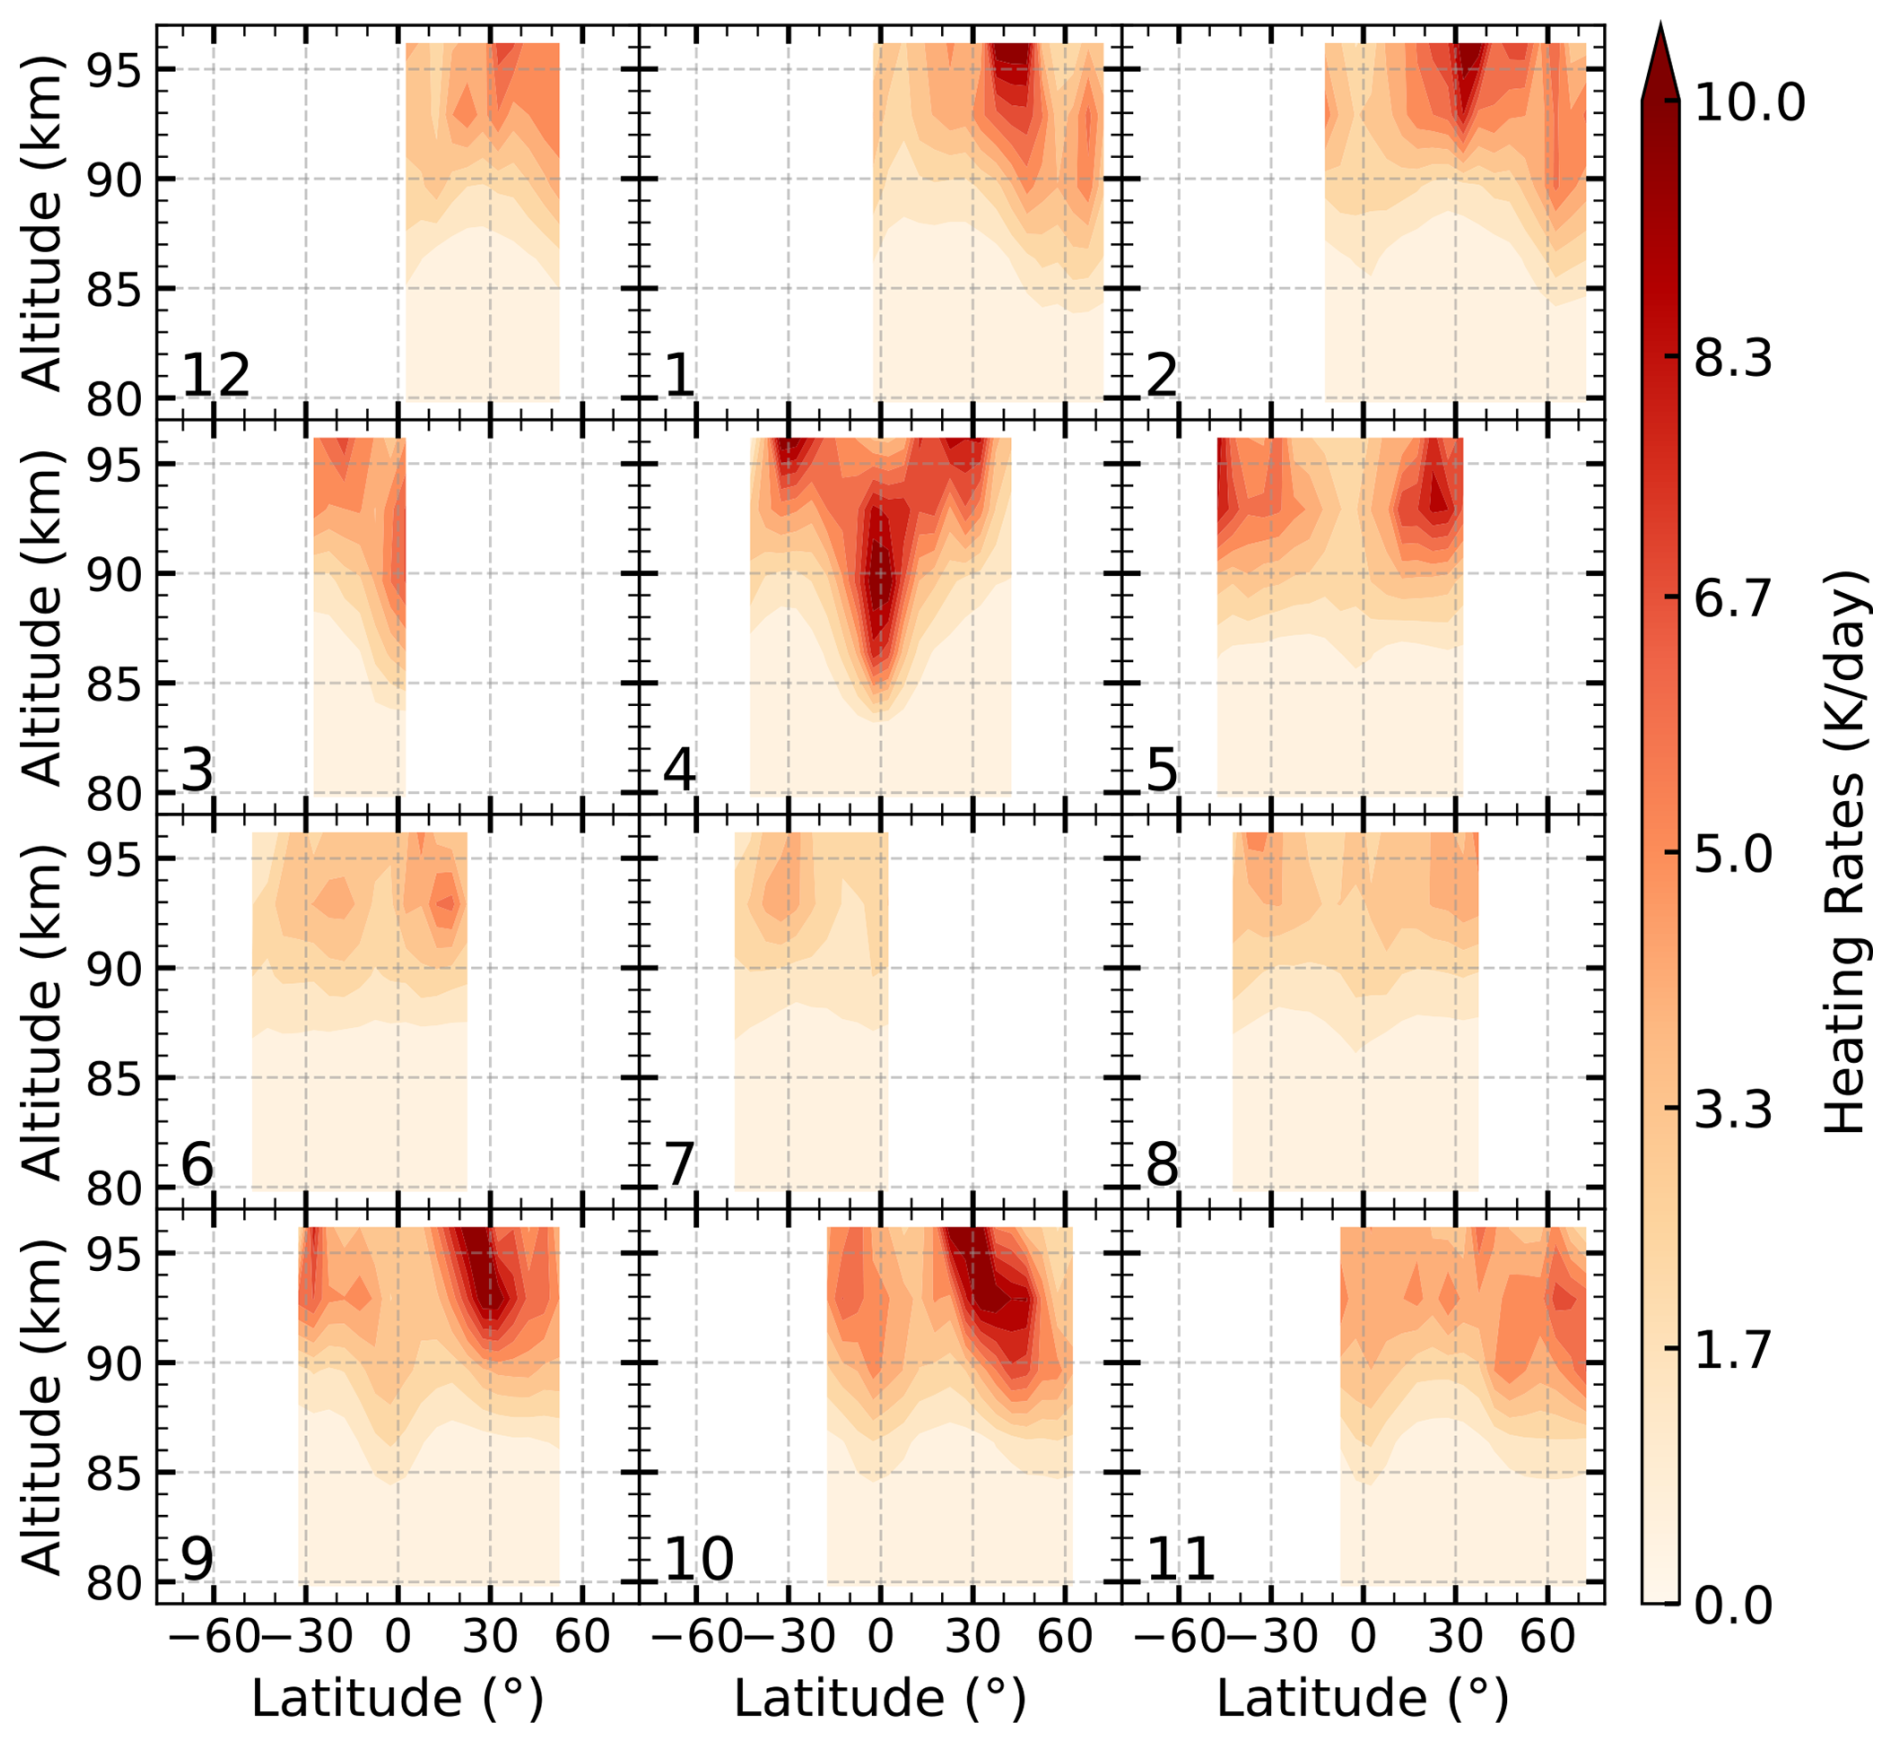
Figure 3Latitude–altitude distribution of chemical heating rates for Reaction (R5) in 2007 at 22:00 LST, derived from SCIAMACHY OH (9–6) emission data and SABER atmospheric profiles. The numbers indicate the month of the year.
The distribution of total heating rates from the seven exothermic reactions in 2007 is presented in Fig. 4. The peak of the total chemical heating occurs between 85 and 96 km, with magnitudes ranging from 10–38 K d−1. Both the peak altitude and intensity vary with season and latitude. The peak altitude around 30° N is higher than that at the equator. This is because at 30° N, the contribution from Reaction (R5), which peaks near 96 km, becomes more significant compared to Reaction (R1), effectively increasing the altitude of the total heating maximum. Seasonally, the heating rates are lower in summer compared to other seasons. Based on the average of low- to mid-latitude profiles from 2003 to 2011, the peak of the total heating rate is approximately 14 K d−1 at 90–93 km.
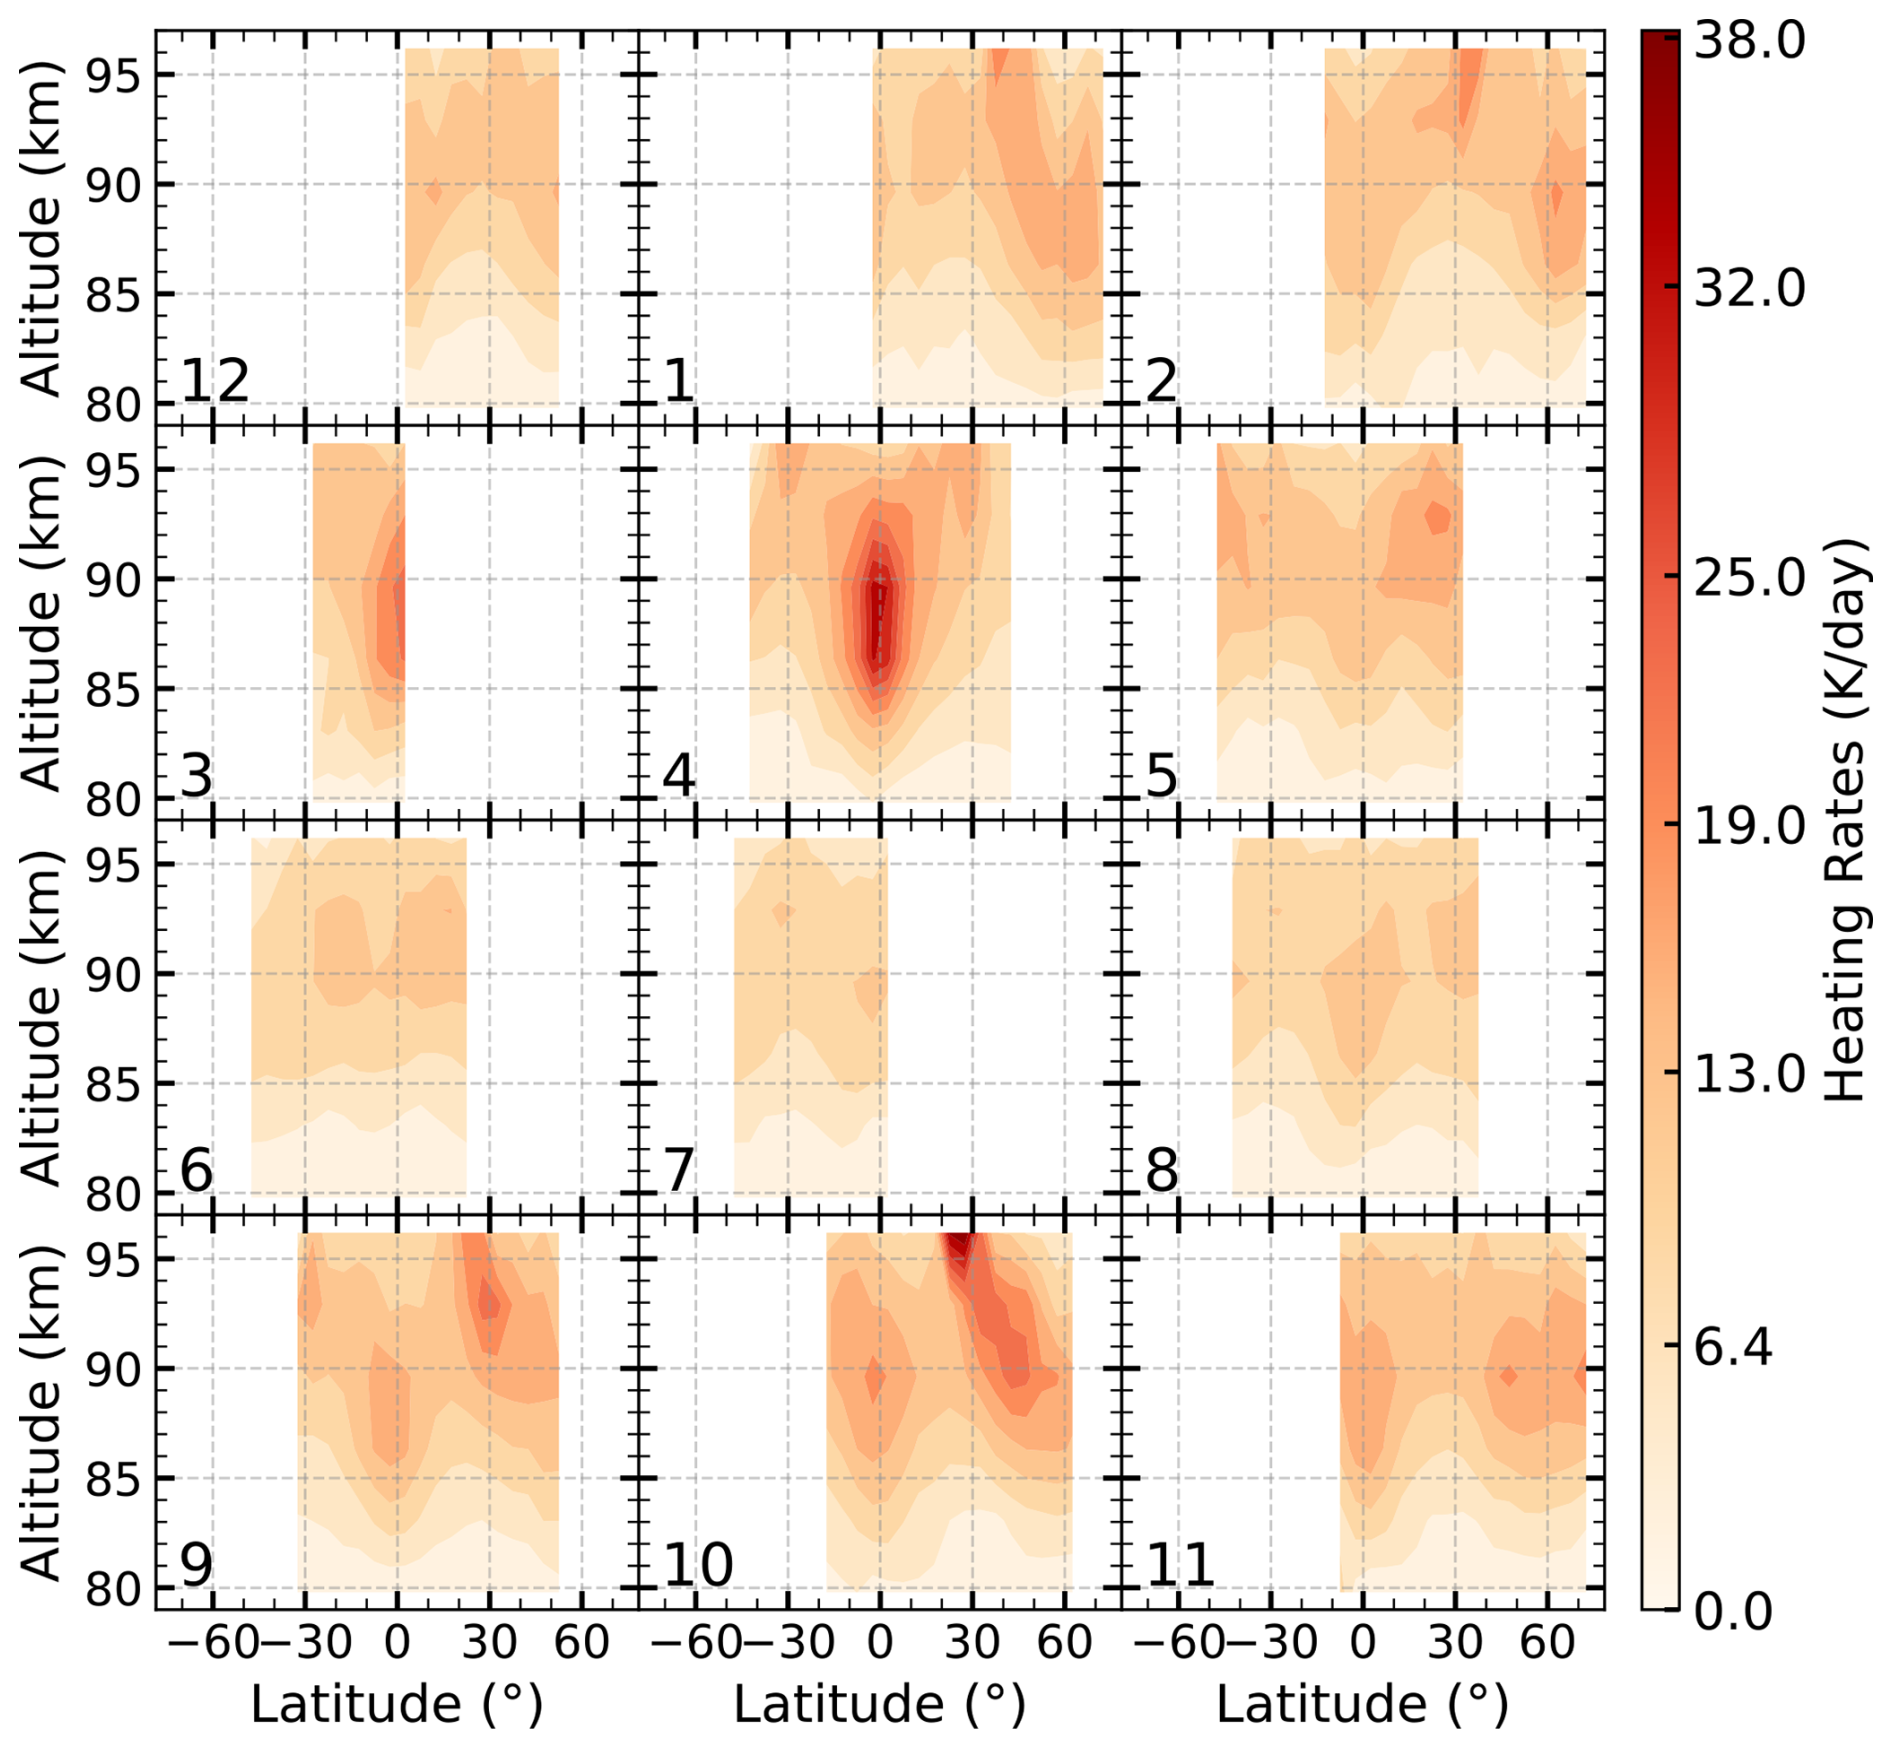
Figure 4Latitude–altitude distribution of total heating rates of seven exothermic Reactions (R1–R7) in 2007 at 22:00 LST, derived from SCIAMACHY OH (9–6) emission data and SABER atmospheric profiles. The numbers indicate the month of the year.
It is important to note that the results in Figs. 2–4 represent derived heating rates at 22:00 LST, and that their structures are subject to modulation by atmospheric tides. To assess this influence, we present the temperature perturbation at 22:00 LST in Fig. 5. The perturbation, obtained by subtracting the diurnally averaged temperature (over a 60 d window) from the monthly mean temperature at 22:00 LST, represents the thermal signature of tidal activity. The figure reveals significant positive perturbations in the equatorial region at 80–90 km and in the subtropical regions above 90 km. This spatial pattern corresponds to the enhanced H+O3 heating near the equator shown in Fig. 2 and the heating enhancement near 96 km in the subtropics shown in Fig. 3.
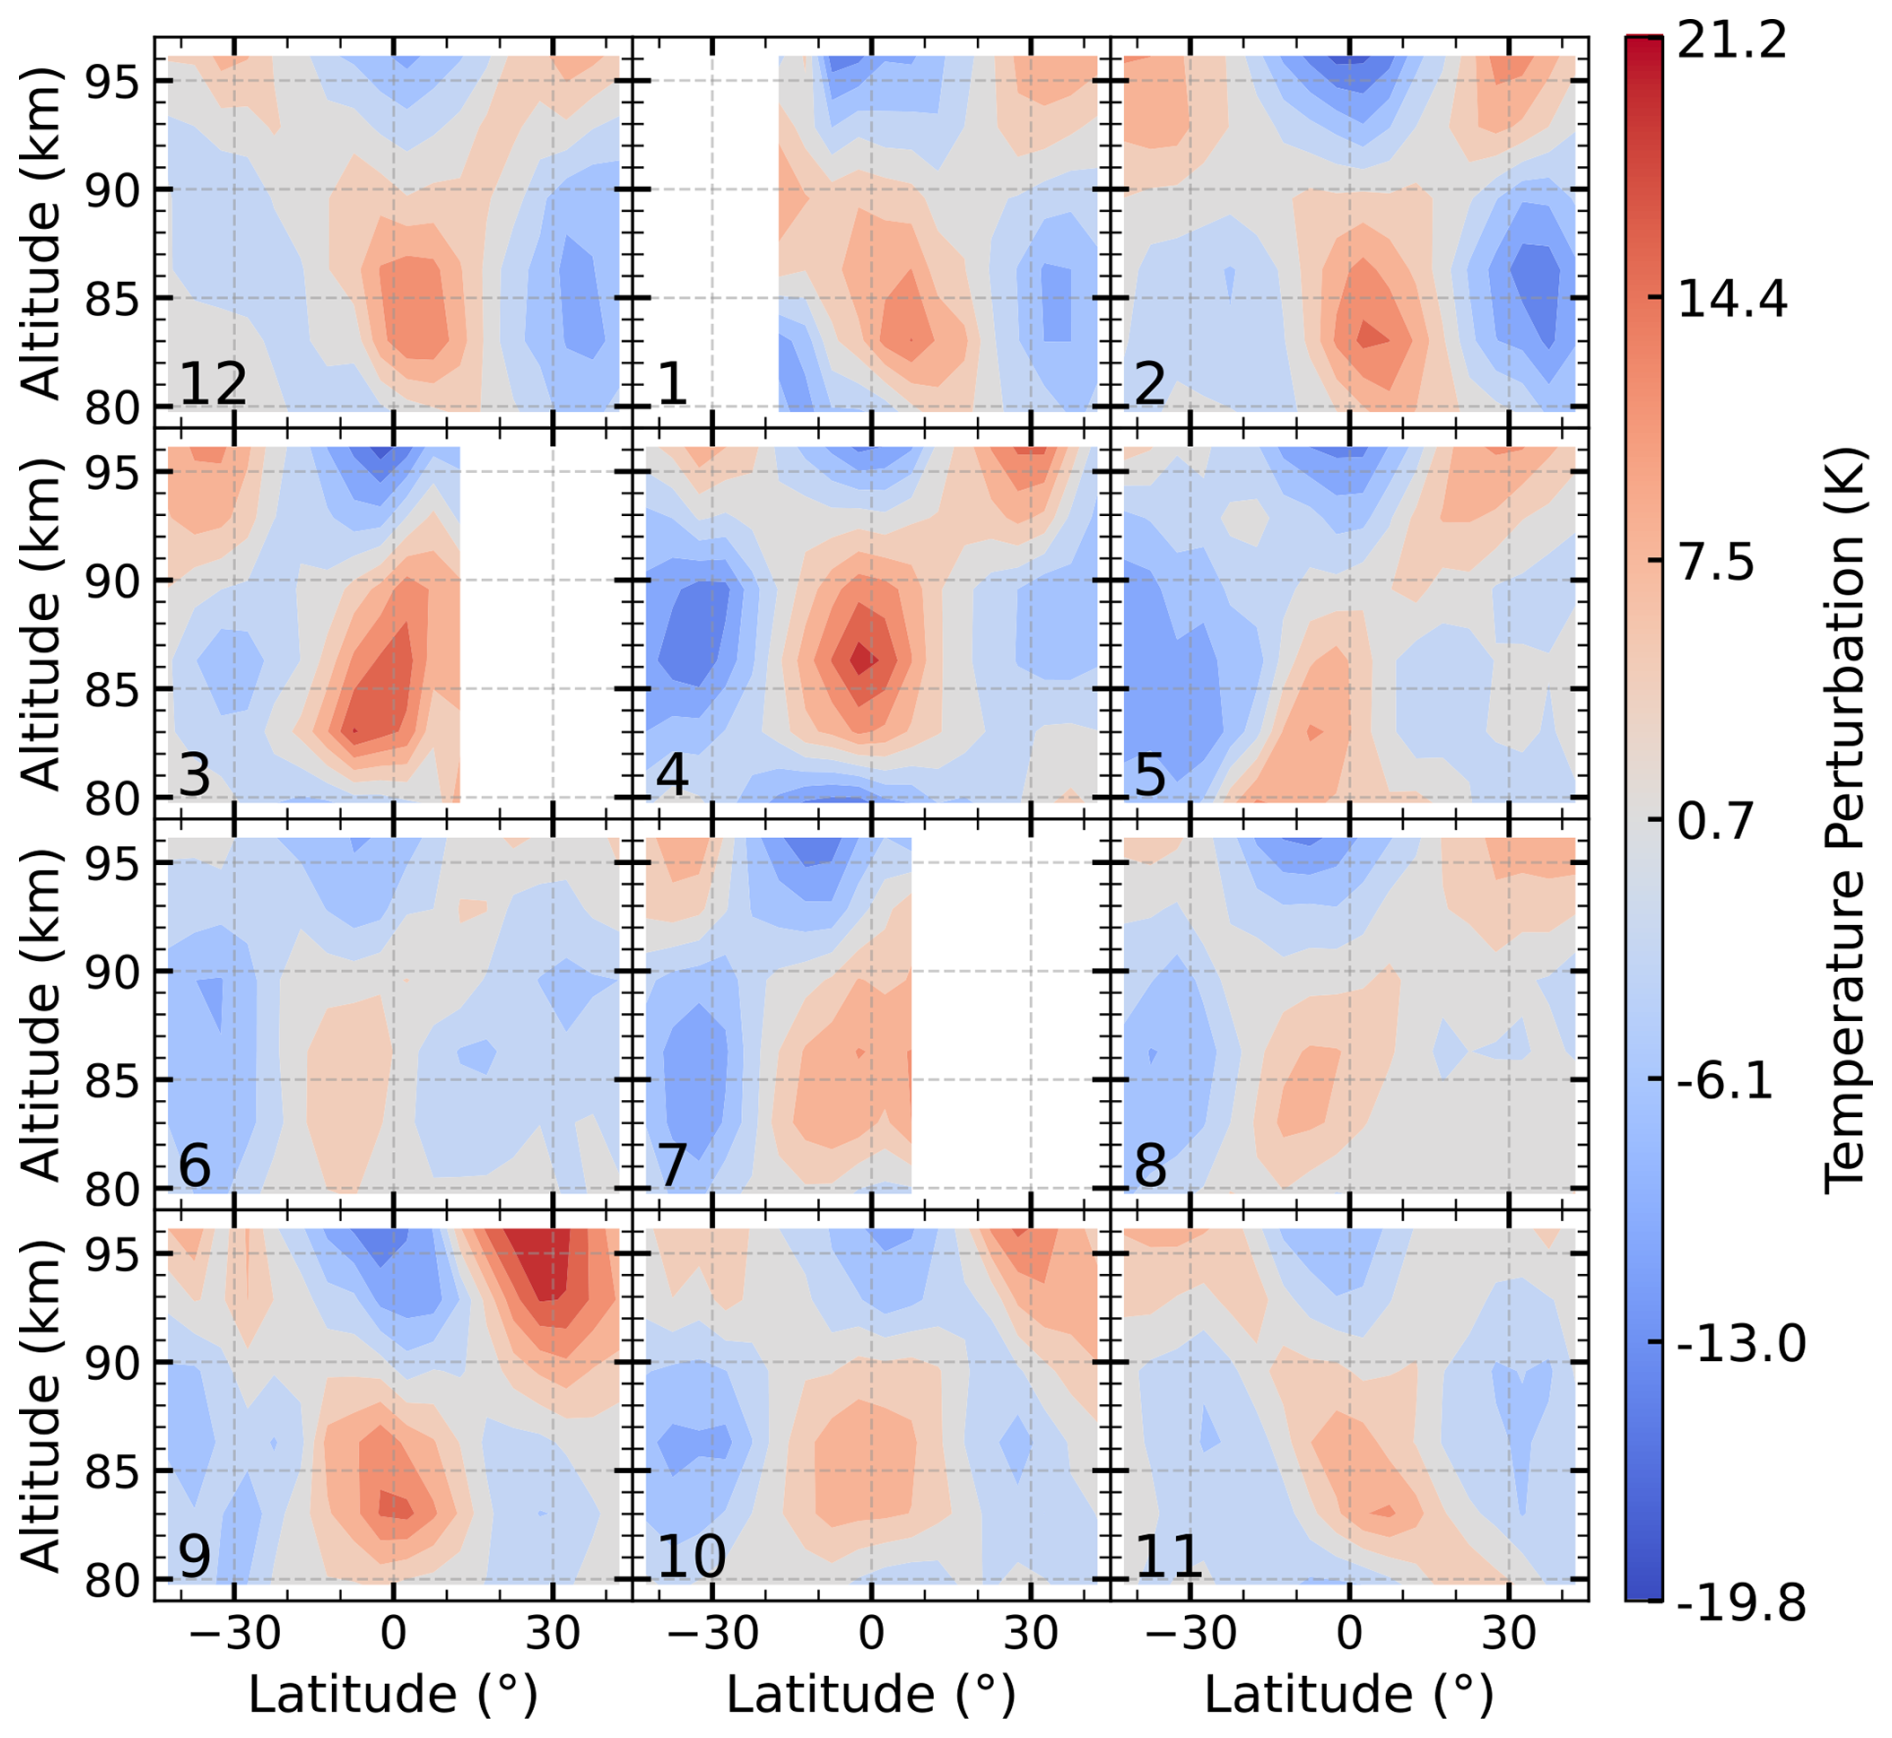
Figure 5Latitude-altitude distribution of the monthly mean SABER temperature perturbation at 22:00 LST for 2007. The perturbation, calculated as the monthly mean temperature at 22:00 LST minus the diurnally averaged temperature (over a 60 d window).
This correspondence suggests that tidal activity is a key factor influencing the heating patterns in the UMLT region. In particular, tidal temperature perturbations can directly modulate chemical heating through the temperature-dependent reaction rate coefficients. Moreover, vertical motions associated with the migrating diurnal tide drive downward transport of O-rich air, leading to enhanced atomic oxygen concentrations in this region (Smith et al., 2010; Jones et al., 2014). As shown in Zhu and Kaufmann (2018), the atomic oxygen distribution exhibits a latitude–altitude structure very similar to the tidal pattern in Fig. 5, with a pronounced peak near 96 km in the subtropics. Since the R5 heating rate is proportional to the square of [O], the enhanced [O] substantially amplifies the heating. Furthermore, this increase in atomic oxygen also promotes ozone production through the reaction, which in turn enhances the H+O3 heating rate and contributes to the patterns shown in Fig. 2.
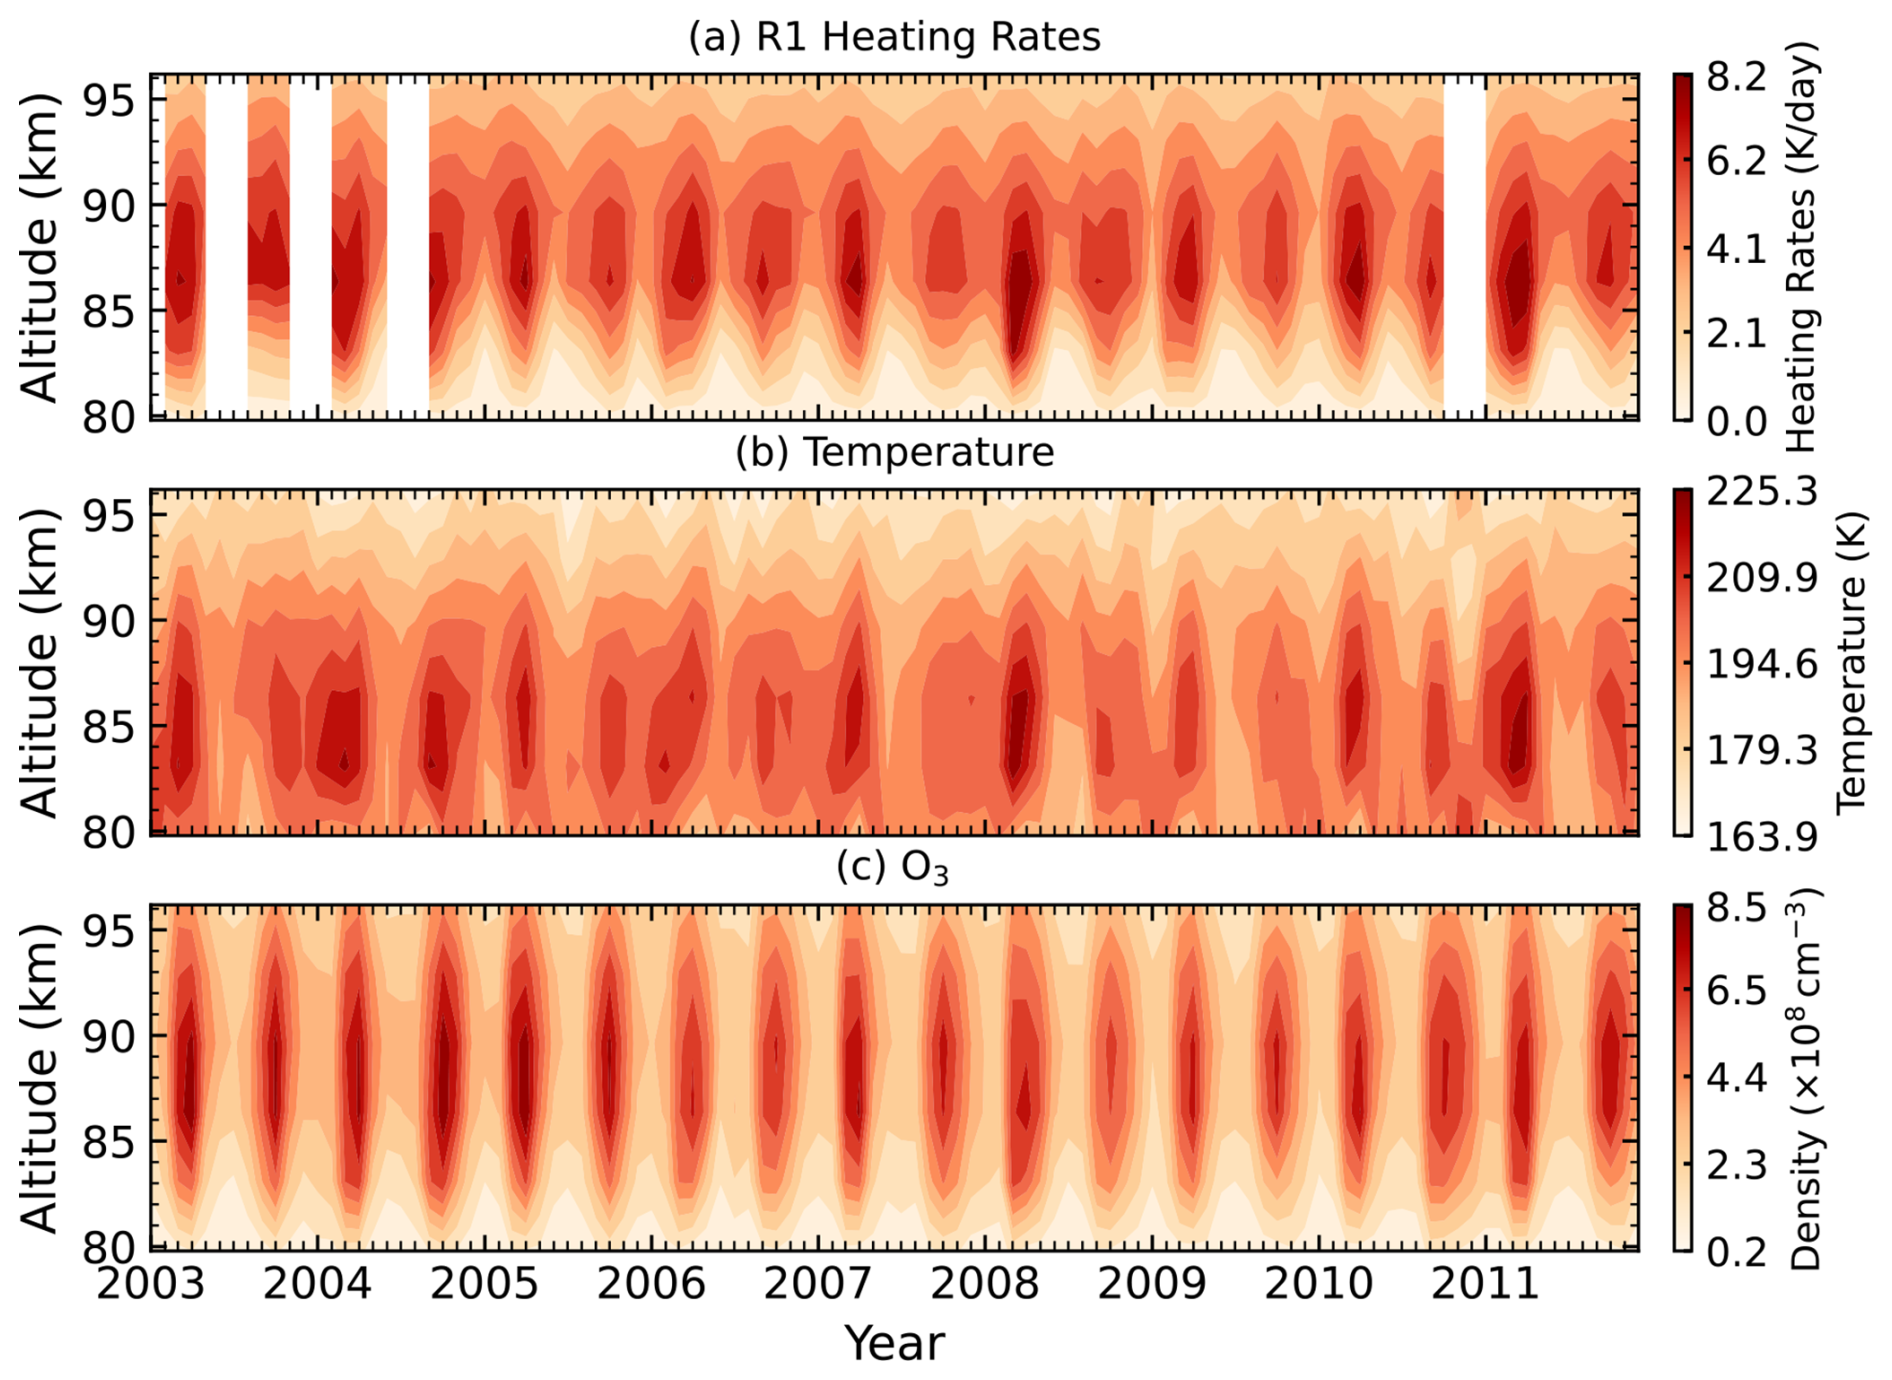
Figure 6Time–altitude distributions from 2003 to 2011 in the equatorial region (10° S–10° N) at 22:00 LST for (a) Reaction (R1) heating rates (K d−1), (b) temperature (K), and (c) O3 density (cm−3) over 80–96 km. White regions indicate data gaps.
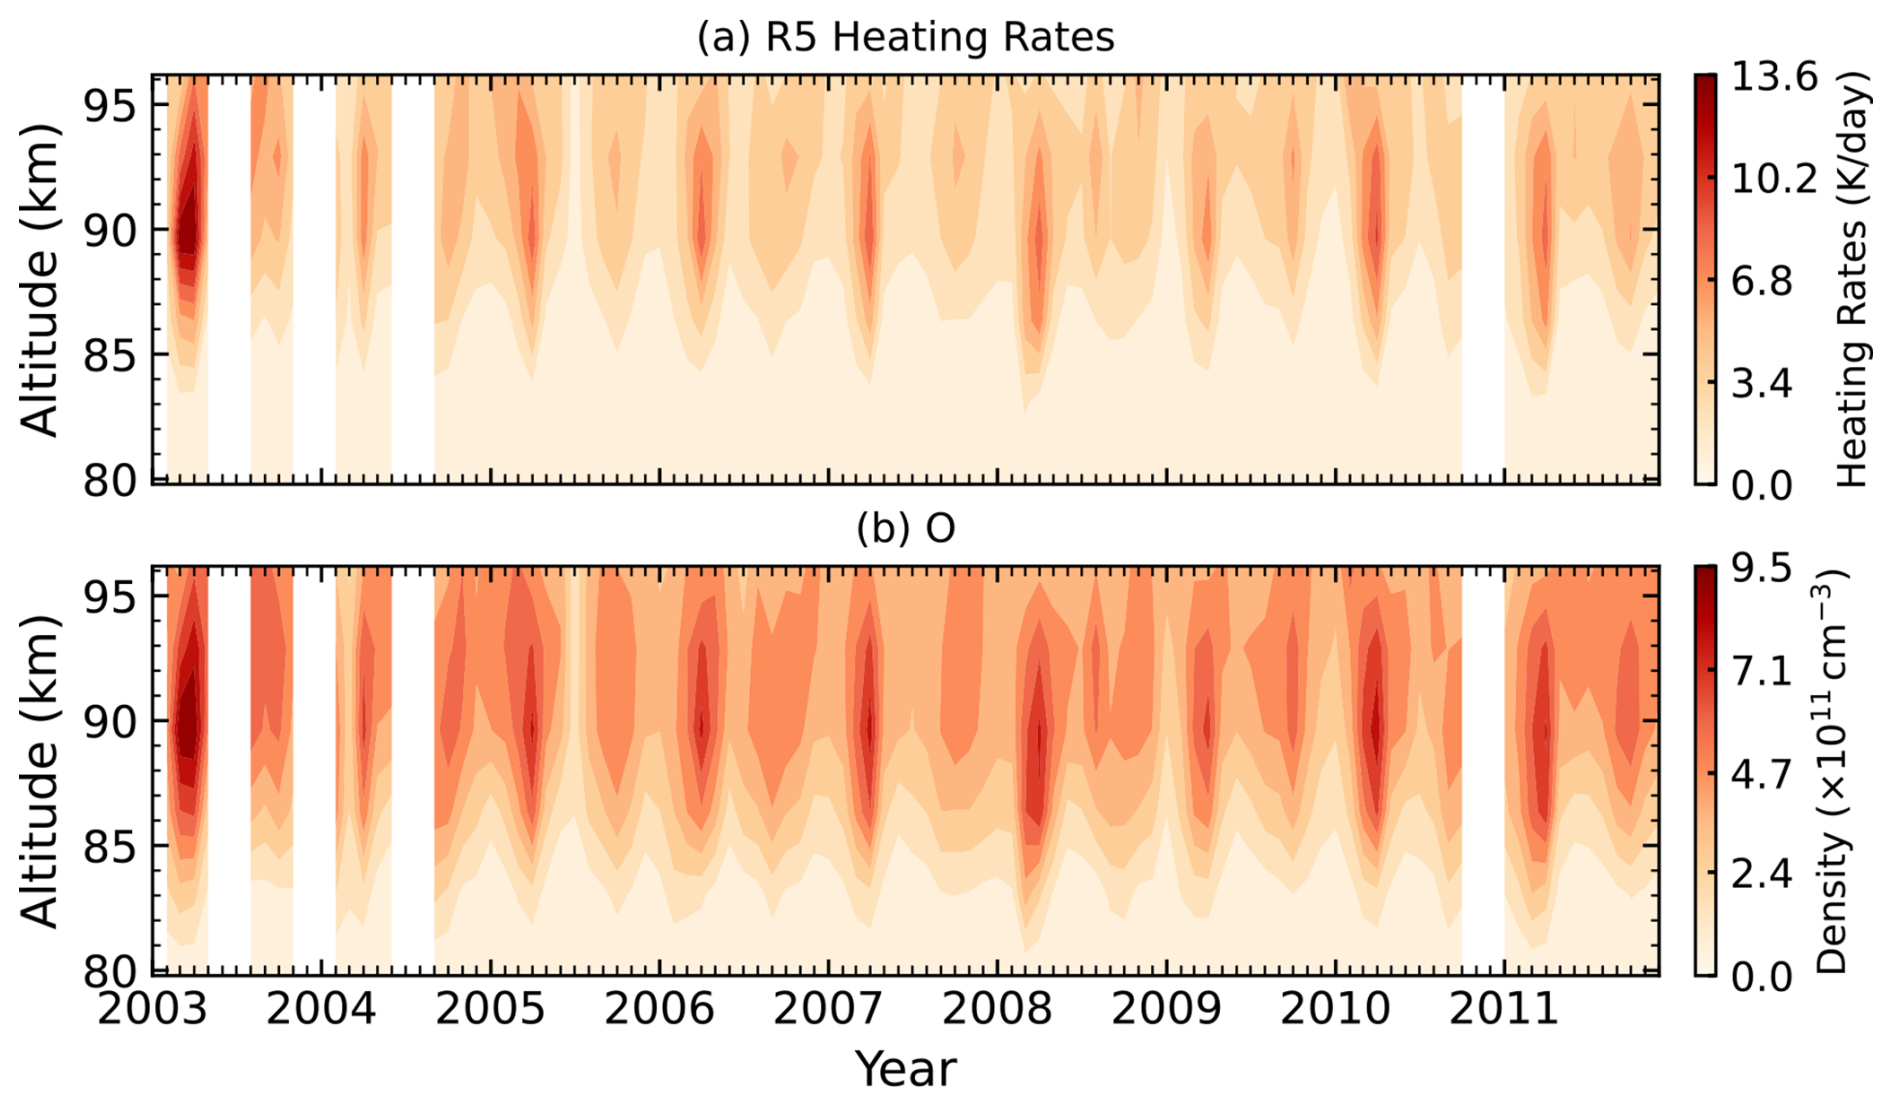
Figure 7Time–altitude distributions from 2003 to 2011 in the equatorial region (10° S–10° N) at 22:00 LST for (a) Reaction (R5) heating rates (K d−1) and (b) O density (cm−3) over 80–96 km. White regions indicate data gaps.
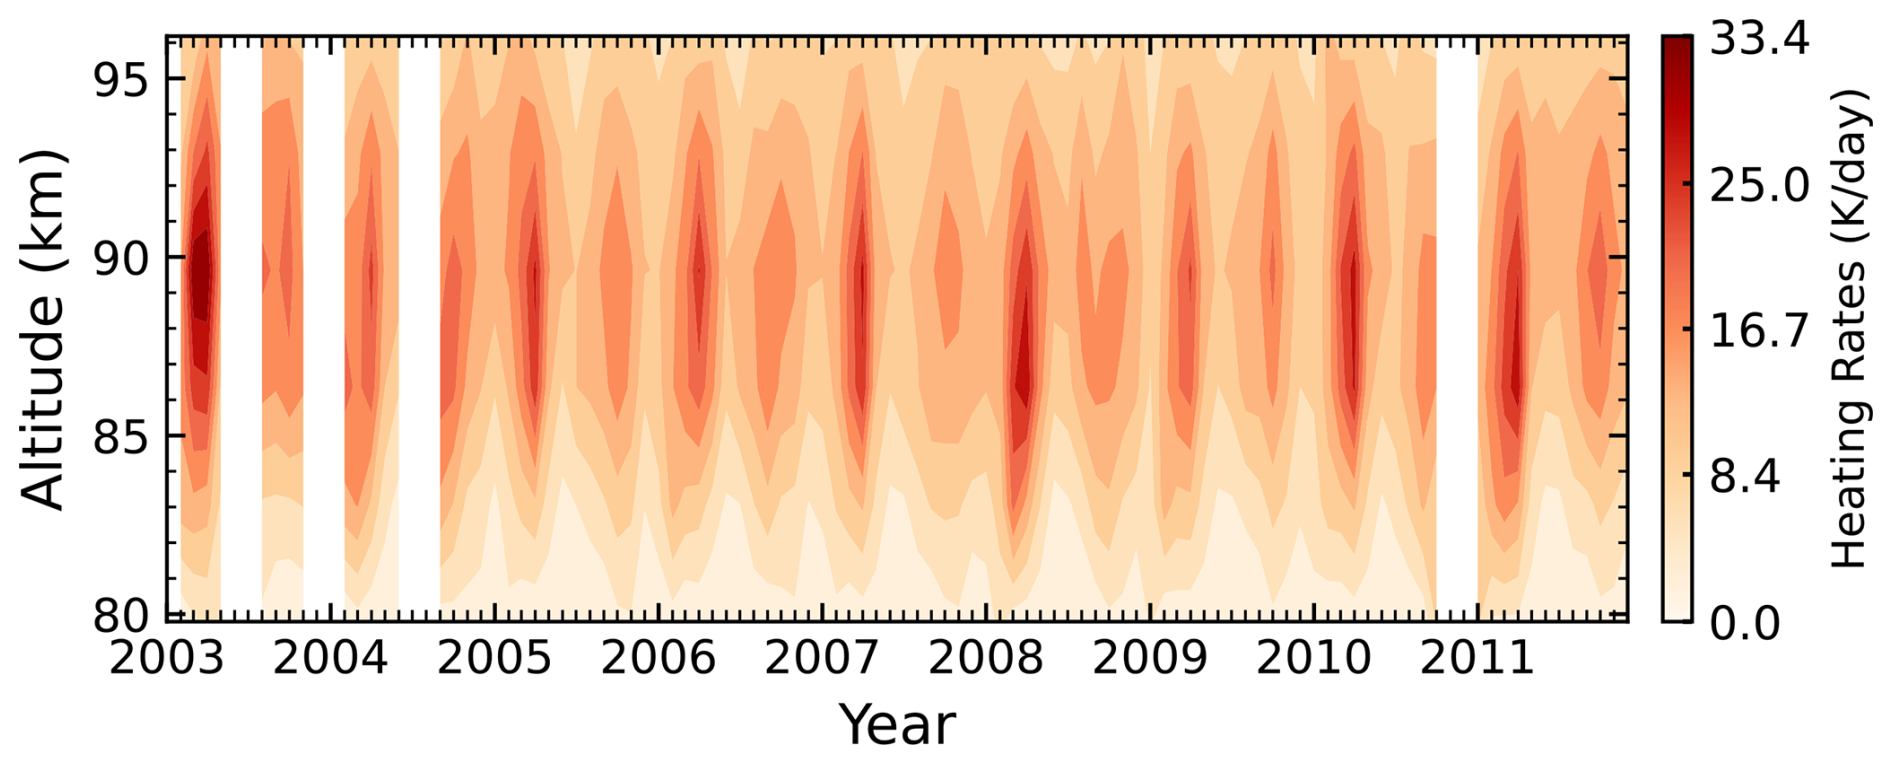
Figure 8Time–altitude distributions from 2003 to 2011 in the equatorial region (10° S–10° N) at 22:00 LST for total heating rates (K d−1) from Reactions (R1)–(R7) over 80–96 km. White regions indicate data gaps.
3.4 Seasonal variation
In this section, we examine the seasonal variations of the heating rates for the primary chemical Reactions (R1) and (R5), as well as for the total chemical heating. Figure 6 shows the time–altitude distributions from 2003 to 2011 for Reaction (R1) heating rates, temperature, and O3 density in the equatorial region (10° S–10° N). The mean chemical heating rate of Reaction (R1) in this region is approximately 5–6 K d−1 at 85–90 km. A clear semiannual oscillation (SAO) is evident for Reaction (R1), with maxima occurring near the equinoxes and stronger amplitudes in spring. As seen in Fig. 6b and c, this seasonal variation strongly correlates with temporal changes in both temperature and O3 density, which is driven by the semiannual cycle of the migrating diurnal tide (Zhang et al., 2006; Smith et al., 2013). This relationship is expected, as higher temperatures and increased O3 concentrations enhance the reaction rate, resulting in greater chemical heating.
Figure 7 shows the seasonal variations in heating rates of Reaction (R5) and the atomic oxygen densities in the equatorial region (10° S–10° N). The mean chemical heating rate of Reaction (R5) in this region is approximately 3–4 K d−1 between 90 and 96 km. Similar to Reaction (R1), the heating rates for Reaction (R5) exhibit a semiannual cycle, with peaks occurring during the spring and autumn equinoxes, and notably stronger during spring. These variations closely follow the seasonal cycle of atomic oxygen, which is strongly modulated by downward transport driven by the migrating diurnal tide.
Figure 8 shows the seasonal variations in the total heating rates from Reactions (R1)–(R7) in the equatorial region (10° S–10° N). The mean total heating rate is approximately 12–15 K d−1 between 85 and 93 km. The heating rates exhibit a clear semiannual cycle, with enhanced heating during the equinox seasons, especially in spring. The total chemical heating is primarily dominated by Reactions (R1) and (R5), and its vertical and temporal structure is largely controlled by the combined influences of O3, O, and temperature.
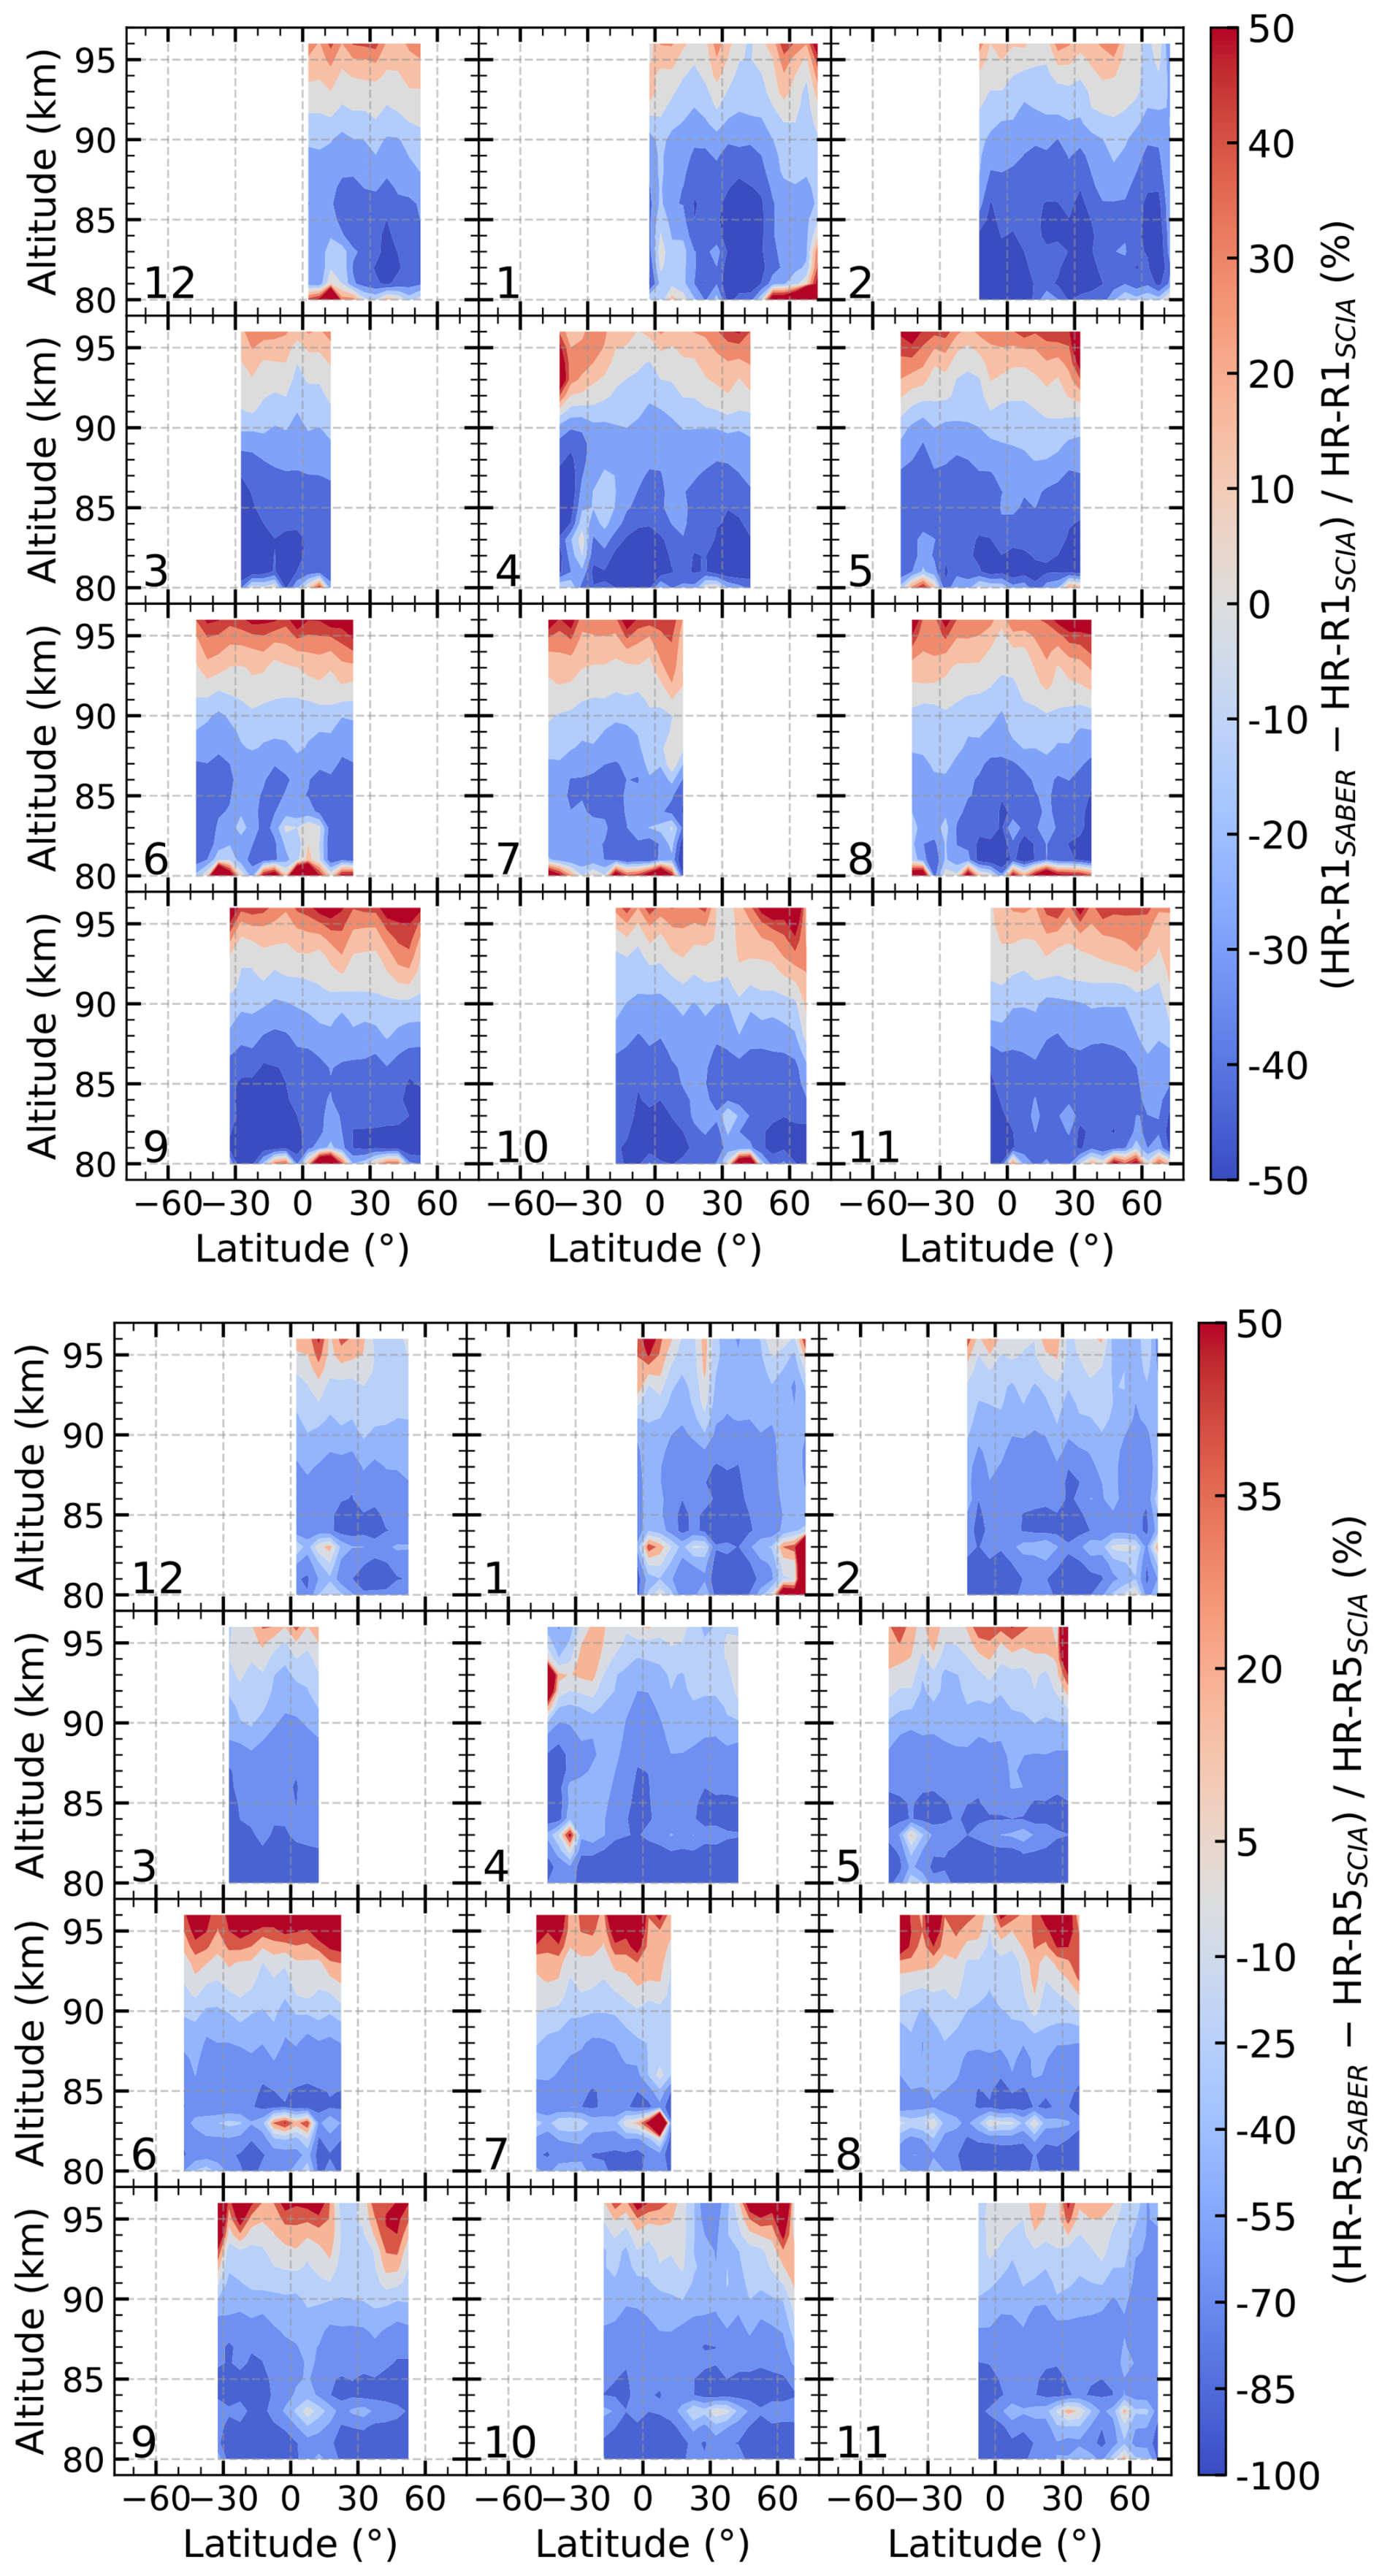
Figure 9Latitude–altitude distribution of percentage differences for 2008 at 22:00 LST between heating rates for Reaction (R1) (top panel) and Reaction (R5) (bottom panel) derived from SABER and those derived from SCIAMACHY in this work. The SABER-based heating rates were calculated using the atomic oxygen and hydrogen densities reported by Mlynczak et al. (2018).
Kaufmann et al. (2008) were the first to use SCIAMACHY OH (9–6) emissions to retrieve heating rates for the H+O3 reaction, based on Einstein coefficients from HITRAN-2004. However, the HITRAN-2004 data set was later found to contain a programming error and incorrect parity assignments (e and f) in the pure rotational bands (Rothman et al., 2009). Subsequently, Kaufmann et al. (2013) updated their retrievals using corrected Einstein coefficients and re-estimated the associated chemical heating rates. Their results showed that the peak heating rates for the H+O3 reaction in the equatorial region are approximately 8–10 K d−1, whereas our results yield lower values of approximately 5–6 K d−1. This substantial discrepancy mainly arises from their use of a higher quenching rate and a lower nascent fraction f9 relative to the values used here, as discussed in detail by Wu et al. (2025). Therefore, our results, based on the latest physical parameters, represent an update to those reported by Kaufmann et al. (2013).
We also compare our heating rates with those calculated using atomic oxygen and hydrogen profiles retrieved from SABER observations. Mlynczak et al. (2013a) derived O and H densities from SABER 2 µm emissions, but these were later revised using updated model coefficients (Mlynczak et al., 2018). In this study, we use the updated O and H profiles from Mlynczak et al. (2018) to compute heating rates for Reactions (R1) and (R5) and compare them to our SCIAMACHY-derived results. The background atmospheric parameters used in the calculations, including temperature and O3, are taken from SABER.
Figure 9 shows the percentage differences between the chemical heating rates derived from SCIAMACHY and those derived from SABER for Reactions (R1) and (R5). For the H+O3 reaction (R1, top panel), the two data sets exhibit a distinct vertically dependent discrepancy. Above 92 km, the SABER-derived rates are generally higher than our results, with the difference reaching approximately 35 % at 96 km. In contrast, below 92 km, the SABER rates are 20 %–45 % lower. A similar vertical pattern is observed for the reaction (R5, bottom panel): SABER-derived rates exceed the SCIAMACHY estimates by 10 %–25 % above 95 km, while below 90 km, they are 40 %–80 % lower. Under the same background atmospheric inputs (temperature, ozone, and total number density), these discrepancies are expected, as they directly reflect the known systematic differences in atomic oxygen and hydrogen densities retrieved from SCIAMACHY and SABER (Zhu and Kaufmann, 2018; Wu et al., 2025). For Reaction (R1), the heating rate is linearly proportional to the atomic hydrogen density. Consistent with the heating rate differences, the SABER-retrieved [H] is approximately 35 % higher than the SCIAMACHY values at 96 km, but 20 %–45 % lower below 92 km. In contrast, the heating rate of Reaction (R5) depends on the square of the atomic oxygen density, which amplifies the impact of differences in [O]: SABER-retrieved [O] is higher than SCIAMACHY by 5 %–10 % at 95–96 km, whereas below 90 km, SABER [O] is lower than the SCIAMACHY values by about 25 %–45 %, leading to much larger discrepancies (40 %–80 %) in the resulting heating rates.
In this study, we present a new data set of chemical heating rates for seven primary exothermic reactions in the UMLT region, derived from SCIAMACHY OH (9–6) limb emissions and collocated SABER temperature and ozone profiles. The retrieval using OH (9–6) emissions relies on a relatively simple and direct photochemical model, which depends on fewer kinetic and spectroscopic parameters and therefore minimizes the propagation of uncertainties associated with multi-step cascade modeling. This approach is based on the assumption of chemical equilibrium for ozone and HOx species and uses Einstein coefficients from the HITRAN-2020 database. The observations are for 22:00 LST. Because of the influence of the diurnal tide on chemical and physical processes, the results may differ somewhat from nighttime average heating rates.
Our results indicate that the reactions H+O3 and are the dominant heating sources below and above ∼92 km, respectively. In low-to-mid latitudes, the heating rate of H+O3 peaks on average at 4–5 K d−1 between 85 and 90 km, while that for peaks on average at 5 K d−1 between 92 and 96 km. Besides these two main reactions, other exothermic reactions also make non-negligible contributions, accounting for 30 %–50 % of the total heating above 86 km. The total nighttime heating peaks around 90–93 km at . Additionally, in the equatorial region, the heating rates of H+O3, , and the total of all seven reactions exhibit a clear semiannual variation, with stronger peaks around the spring equinox, mainly driven by seasonal changes in temperature and key reactants (O3 and O).
Comparisons with other heating rate data sets show substantial differences. Our results provide a significantly lower estimate for the H+O3 heating rate, at approximately half the value of that reported in previous SCIAMACHY-based work (Kaufmann et al., 2013), representing an update based on the latest physical parameters. Furthermore, a comparison with SABER-derived heating rates reveals significant, altitude-dependent discrepancies for the dominant reactions. Even when using identical background atmospheres, systematic differences remain in the retrieval results, which is a crucial scientific finding, representing the systematic uncertainties arising from instrumental and retrieval parameters (Zhu and Kaufmann, 2018; Wu et al., 2025).
It is worth noting that our analysis also reveals considerable uncertainties in deriving heating rates from OH airglow. The uncertainty is estimated to be approximately 30 % for (R1) and 45 %–80 % for (R5). The largest sources of the uncertainty are background temperature, collisional rate coefficients, and the Einstein coefficients.
Since there are few observations and many potential sources of uncertainty involved, having more than one independent determination of the heating rate is scientifically valuable. SCIAMACHY provides measurements independent of SABER and thus serves as an important observational constraint on UMLT chemical heating. Furthermore, our results are valuable for atmospheric modeling and for understanding the mesopause energy budget.
As discussed in Sect. 2.1, this study utilizes monthly zonal medians of SCIAMACHY radiance and SABER atmospheric profiles as inputs for the retrieval. However, this pre-retrieval aggregation can introduce biases due to the nonlinear dependence of the retrieval algorithm on input variables (e.g., temperature and reactant densities). These biases require careful evaluation to ensure the validity of the derived results.
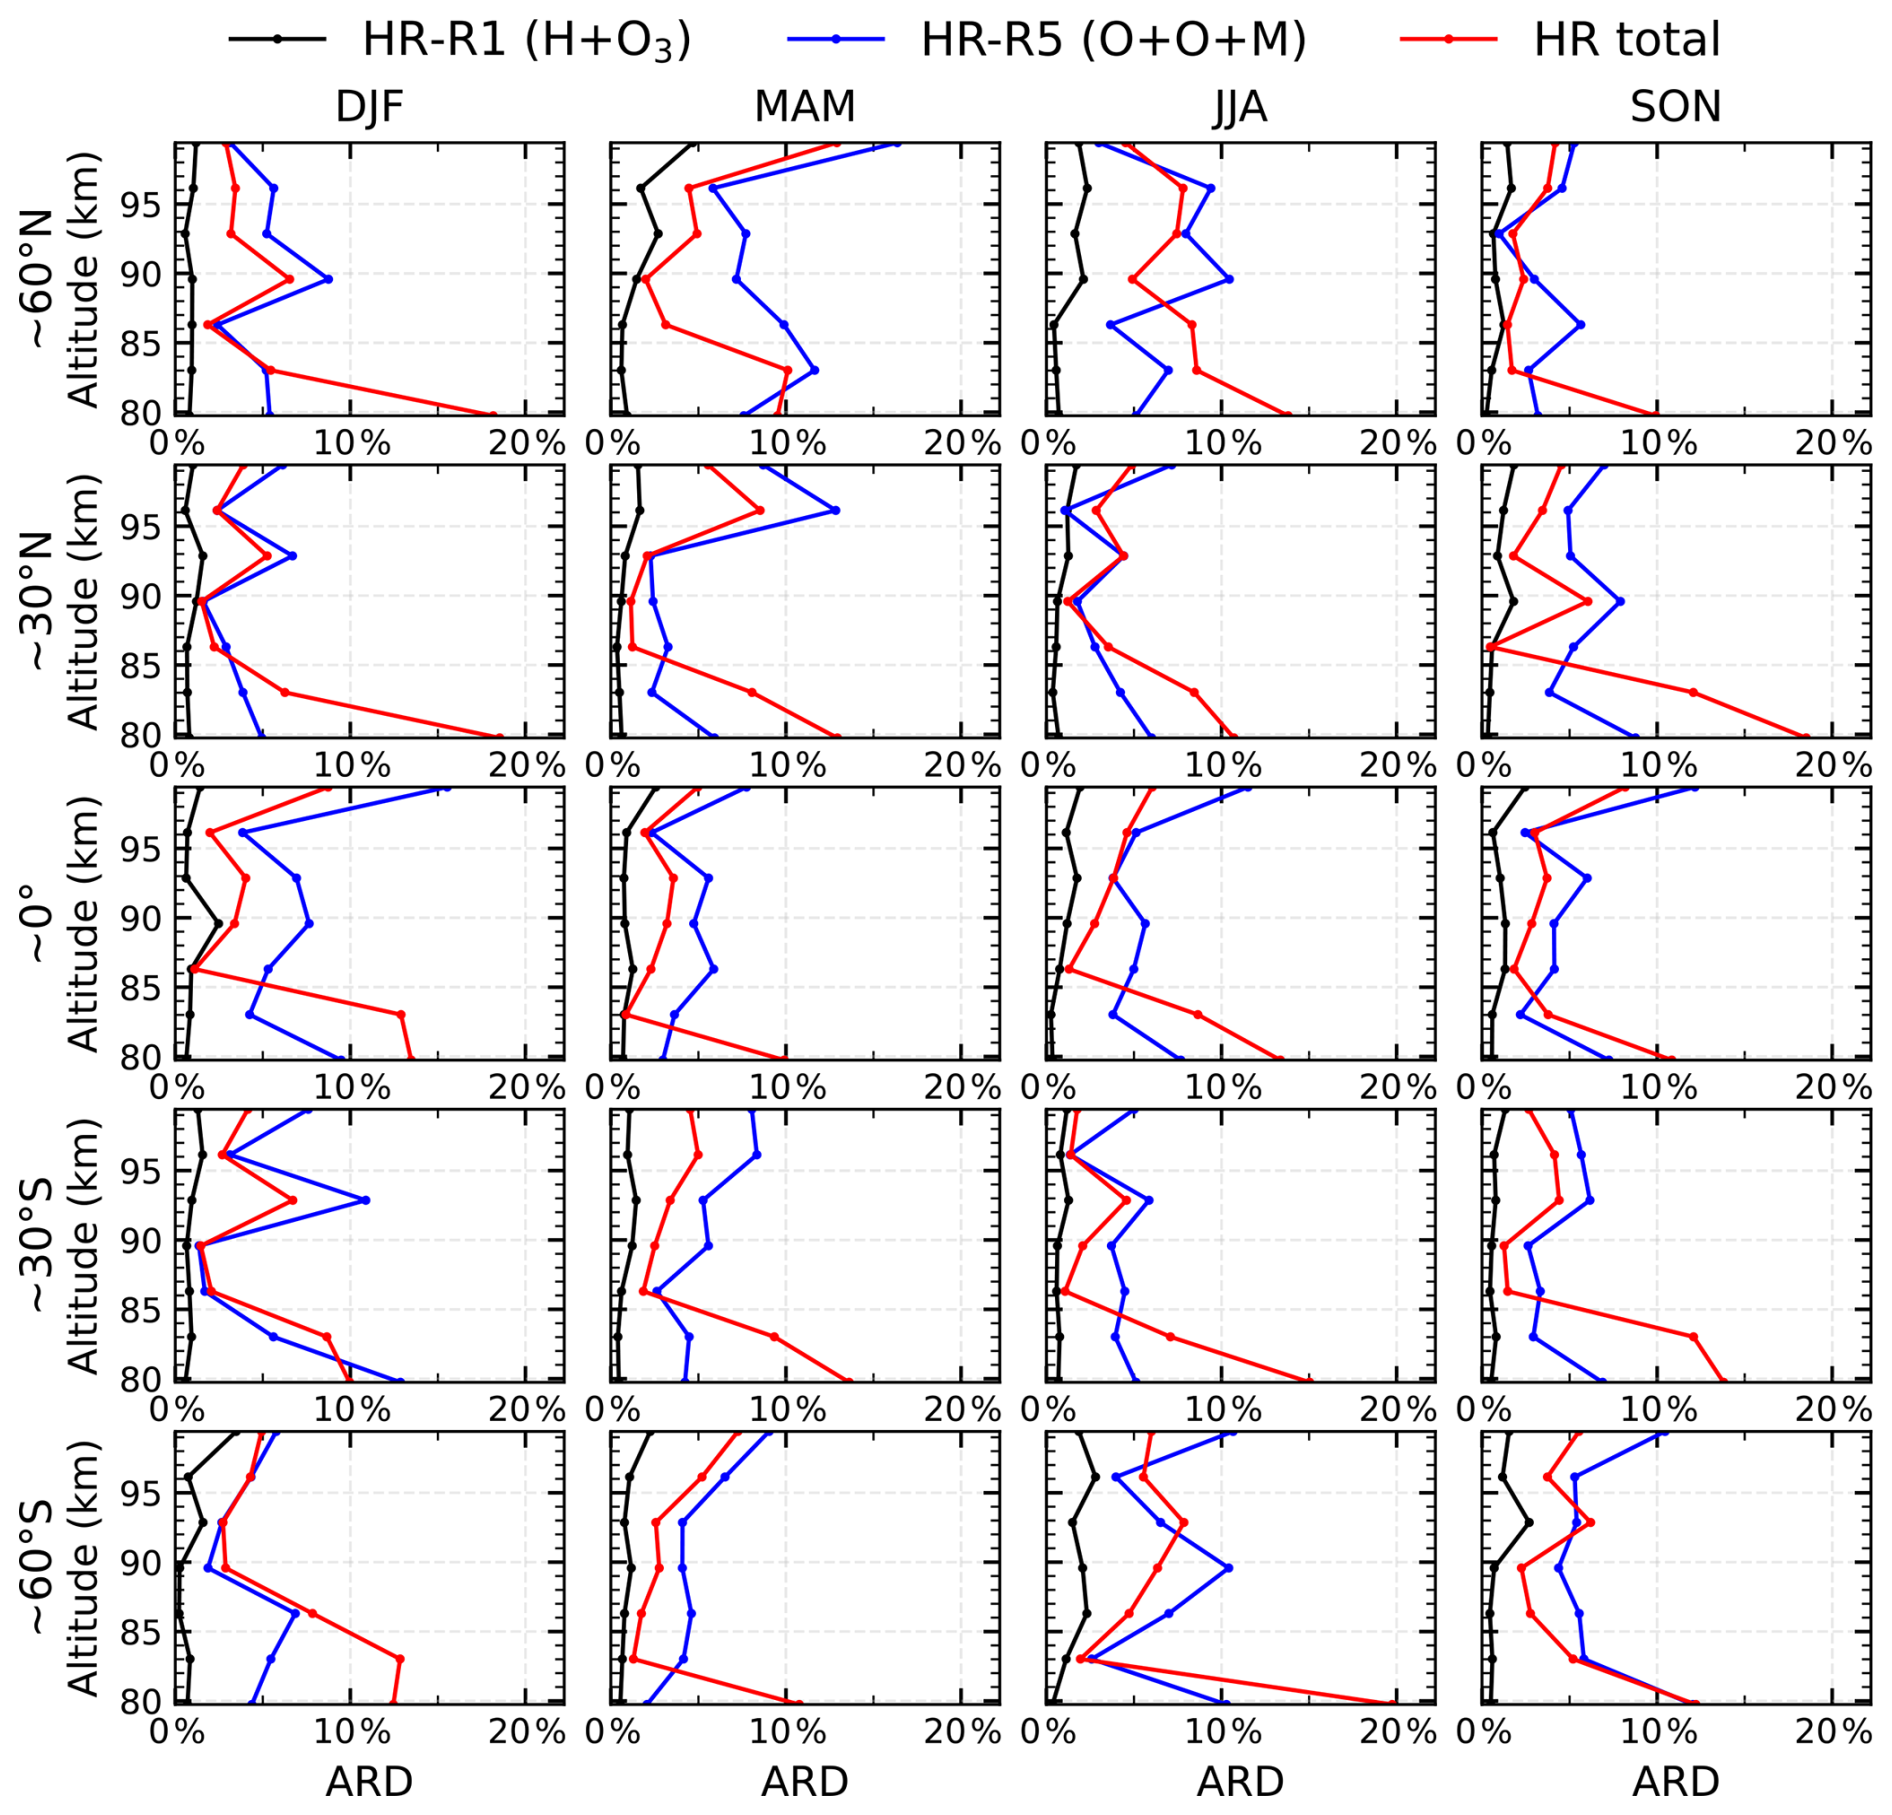
Figure A1Mean absolute relative difference between the two methods across different seasons and latitude bands in 2005 for the heating rates of Reaction (R1) H+O3 (black), Reaction (R5) (blue), and the total chemical heating rate (Reactions R1–R7; red). Columns correspond to winter, spring, summer, and autumn, while rows represent latitude bands centered at 60° N, 30° N, 0°, 30° S, and 60° S, each spanning ±10°.
Since SCIAMACHY and SABER have different sampling geometries, a direct collocation to quantify the bias is challenging. However, SABER provides a unique opportunity to assess this nonlinearity error, as it offers synchronous measurements of OH 2.0 µm radiance, temperature, total density, and ozone. Although the SABER 2.0 µm channel differs from the SCIAMACHY (9–6) transition, both emissions are dominated by the H+O3 reaction, and the functional dependence of the heating rates on temperature and reactant concentrations is mathematically analogous. SABER data can therefore be used as a proxy to evaluate the impact of pre-retrieval aggregation. The collisional parameters employed in this evaluation are taken from Mlynczak et al. (2013a).
We focus on the relative differences between the two methods, both using data within a 22:00 LST (±1 h) window: (1) Median of individual retrievals, where heating rates profiles are first retrieved from each individual SABER profile and then the monthly zonal median is taken within 5° latitude bins; (2) Retrieval from median profiles (this study's method), where the input spectral data are first aggregated as monthly zonal medians within 5° latitude bins and then used for retrieval.
This evaluation is conducted using one full year of SABER observations from 2005. Figure A1 illustrates the mean absolute relative difference (ARD) between the two methods across different seasons and latitude bands. The black, blue, and red lines represent the ARD for the heating rates of Reaction (R1) H+O3, Reaction (R5) , and the total heating rate (Reactions R1–R7), respectively. Columns correspond to winter, spring, summer, and autumn, while rows represent latitude bands centered at 60° N, 30° N, 0°, 30° S, and 60° S, each spanning ±10°. For Reaction (R1) H+O3 (black line), the ARD generally remains below 3 %. For Reaction (R5) (blue line), the bias is mostly within 10 %, but can occasionally reach ∼15 % above 95 km. The total chemical heating rates for Reactions (R1)–(R7) (red line) show a bias generally within 10 % in the main heating region of 85–96 km. The larger discrepancies (10 %–20 %) observed at 80 km are primarily attributed to the significantly smaller heating rates at this altitude, where minor absolute deviations translate into comparatively large relative errors.
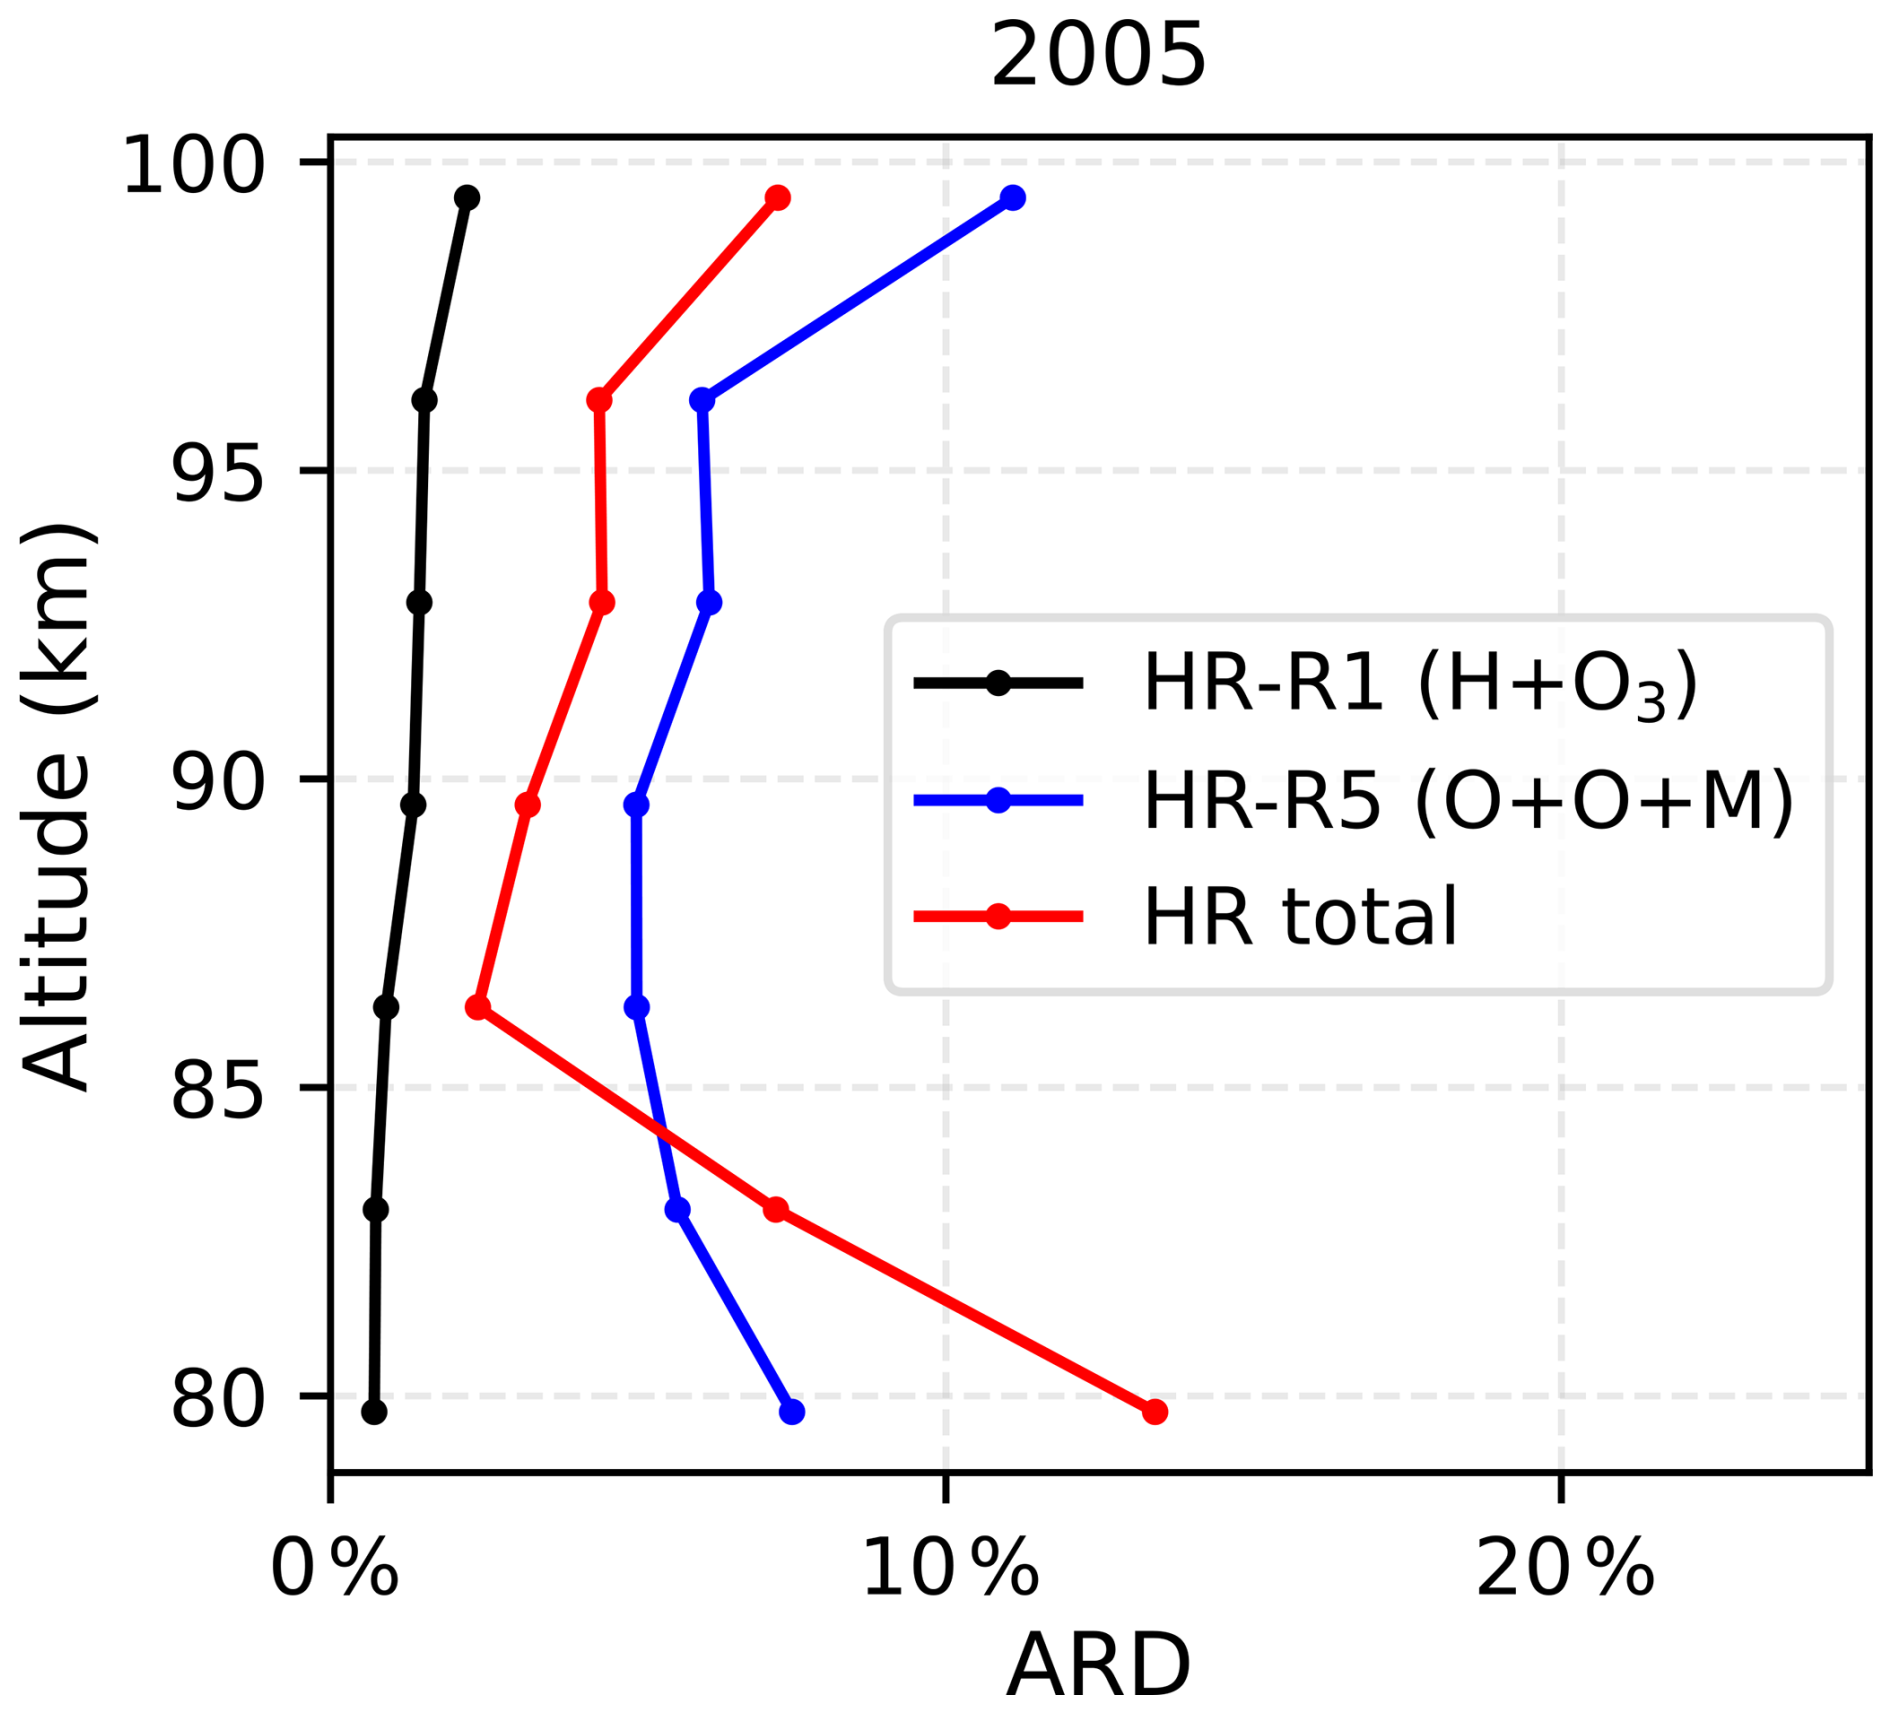
Figure A2Annual mean absolute relative difference (ARD) between the two methods for all monthly zonal profiles in 2005 for the heating rates of Reaction (R1) H+O3 (black), Reaction (R5) (blue), and the total chemical heating rate (Reactions R1–R7; red).
Figure A2 presents the annual mean ARD for all monthly zonal profiles in 2005. The statistical results show that for the H+O3 reaction, the nonlinearity-induced bias remains below 3 %. For the reaction, the bias is generally within 10 %. The bias for the total chemical heating rate is within 5 %–15 %.
The nonlinearity-induced biases are relatively small compared with the uncertainties arising from temperature and rate coefficients (discussed in Sect. 3.1), indicating that the use of monthly zonal median inputs does not significantly affect the retrieval results.
The SCIAMACHY Level 1b version 10 data used in this study are available at https://hm-atmos-ds.eo.esa.int/oads/access/collection/Envisat_SCIAMACHY_Level_1b_SCI_____1P/tree (last access: 20 March 2026). SABER version 2.0 data are available at https://saber.gats-inc.com/browse_data.php (last access: 20 March 2026). The chemical heating rate data set derived in this study is available at https://doi.org/10.57760/sciencedb.space.03261 (Wu and Zhu, 2026).
XW processed the data, performed the analysis, and drafted the manuscript. YZ initiated the topic, processed the initial data, and provided supervision. MK, AKS, and JX assisted in the review and editing, and provided suggestions. GJ and SL provided suggestions through helpful discussion.
The contact author has declared that none of the authors has any competing interests.
Publisher's note: Copernicus Publications remains neutral with regard to jurisdictional claims made in the text, published maps, institutional affiliations, or any other geographical representation in this paper. The authors bear the ultimate responsibility for providing appropriate place names. Views expressed in the text are those of the authors and do not necessarily reflect the views of the publisher.
This work is supported by the Project of Stable Support for Youth Team in Basic Research Field, CAS (YSBR-018), the National Natural Science Foundation of China (42174212), and the Chinese Meridian Project. This material is also based upon work supported by the NSF National Center for Atmospheric Research, which is a major facility sponsored by the U.S. National Science Foundation under Cooperative Agreement No. 1852977.
This research has been supported by the Chinese Academy of Sciences (grant no. YSBR-018) and the National Natural Science Foundation of China (grant no. 42174212).
This paper was edited by John Plane and reviewed by two anonymous referees.
Adler-Golden, S.: Kinetic parameters for OH nightglow modeling consistent with recent laboratory measurements, J. Geophys. Res., 8, https://doi.org/10.1029/97JA01622, 1997. a
Bovensmann, H., Burrows, J. P., Buchwitz, M., Frerick, J., Noël, S., Rozanov, V. V., Chance, K. V., and Goede, A. P. H.: SCIAMACHY: Mission objectives and measurement modes, J. Atmos. Sci., 56, 127–150, https://doi.org/10.1175/1520-0469(1999)056<0127:SMOAMM>2.0.CO;2, 1999. a, b
Brasseur, G. and Offermann, D.: Recombination of atomic oxygen near the mesopause: Interpretation of rocket data, J. Geophys. Res.-Atmos., 91, 10818–10824, https://doi.org/10.1029/JD091iD10p10818, 1986. a
Burkholder, J. B., Sander, S. P., Abbatt, J. P. D., Barker, J. R., Cappa, C., Crounse, J. D., Dibble, T. S., Huie, R. E., Kolb, C. E., Kurylo, M. J., Orkin, V. L., Percival, C. J., Wilmouth, D. M., and Wine, P. H.: Chemical Kinetics and Photochemical Data for Use in Atmospheric Studies, Evaluation No. 19, Jpl publication 19-5, Jet Propulsion Laboratory, Pasadena, CA, https://jpldataeval.jpl.nasa.gov/ (last access: 28 October 2025), 2020. a, b, c
Crutzen, P. J.: Energy conversions and mean vertical motions in the high latitude summer mesosphere and lower thermosphere, in: Astrophysics and Space Science Library, Springer Netherlands, Dordrecht, 78–88, https://doi.org/10.1007/978-94-010-3114-1_4, 1971. a
Emmert, J. T., Drob, D. P., Picone, J. M., Siskind, D. E., Jones, M., Mlynczak, M. G., Bernath, P. F., Chu, X., Doornbos, E., Funke, B., Goncharenko, L. P., Hervig, M. E., Schwartz, M. J., Sheese, P. E., Vargas, F., Williams, B. P., and Yuan, T.: NRLMSIS 2.0: A whole-atmosphere empirical model of temperature and neutral species densities, Earth Space Sci., 8, e2020EA001321, https://doi.org/10.1029/2020EA001321, 2021. a
Garcia, R. R. and Solomon, S.: The effect of breaking gravity waves on the dynamics and chemical composition of the mesosphere and lower thermosphere, J. Geophys. Res.-Atmos., 90, 3850–3868, https://doi.org/10.1029/JD090iD02p03850, 1985. a, b
Gardner, C. S. and Yang, W.: Measurements of the dynamical cooling rate associated with the vertical transport of heat by dissipating gravity waves in the mesopause region, J. Geophys. Res.-Atmos., 103, 16909–16926, https://doi.org/10.1029/98JD00683, 1998. a
Gordon, I. E., Rothman, L. S., Hargreaves, R. J., Hashemi, R., Karlovets, E. V., Skinner, F. M., Conway, E. K., Hill, C., Kochanov, R. V., Tan, Y., Wcisło, P., Finenko, A. A., Nelson, K., Bernath, P. F., Birk, M., Boudon, V., Campargue, A., Chance, K. V., Coustenis, A., Drouin, B. J., Flaud, J.-M., Gamache, R. R., Hodges, J. T., Jacquemart, D., Mlawer, E. J., Nikitin, A. V., Perevalov, V. I., Rotger, M., Tennyson, J., Toon, G. C., Tran, H., Tyuterev, V. G., Adkins, E. M., Baker, A., Barbe, A., Canè, E., Császár, A. G., Dudaryonok, A., Egorov, O., Fleisher, A. J., Fleurbaey, H., Foltynowicz, A., Furtenbacher, T., Harrison, J. J., Hartmann, J.-M., Horneman, V.-M., Huang, X., Karman, T., Karns, J., Kassi, S., Kleiner, I., Kofman, V., Kwabia-Tchana, F., Lavrentieva, N. N., Lee, T. J., Long, D. A., Lukashevskaya, A. A., Lyulin, O. M., Makhnev, V. Y., Matt, W., Massie, S. T., Melosso, M., Mikhailenko, S. N., Mondelain, D., Müller, H. S. P., Naumenko, O. V., Perrin, A., Polyansky, O. L., Raddaoui, E., Raston, P. L., Reed, Z. D., Rey, M., Richard, C., Tóbiás, R., Sadiek, I., Schwenke, D. W., Starikova, E., Sung, K., Tamassia, F., Tashkun, S. A., Vander Auwera, J., Vasilenko, I. A., Vigasin, A. A., Villanueva, G. L., Vispoel, B., Wagner, G., Yachmenev, A., and Yurchenko, S. N.: The HITRAN2020 molecular spectroscopic database, J. Quant. Spectrosc. Ra., 277, 107949, https://doi.org/10.1016/j.jqsrt.2021.107949, 2022. a, b, c
Gottwald, M., Bovensmann, H., Lichtenberg, G., Noel, S., von Bargen, A., Slijkhuis, S., Piter, A., Hoogeveen, R., von Savigny, C., Buchwitz, M., Kokhanovsky, A., Richter, A., Rozanov, A., Holzer-Popp, T., Bramstedt, K., Lambert, J.-C., Skupin, J., Wittrock, F., Schrijver, H., and Burrows, J. P.: SCIAMACHY, Monitoring the Changing Earth's Atmosphere, DLR, Germany, 2006. a
Grygalashvyly, M., Strelnikov, B., Strelnikova, I., Rapp, M., Lübken, F.-J., Schütt, C., Stephan, C., Eberhart, M., Löhle, S., and Fasoulas, S.: Chemical heat derived from rocket-borne WADIS-2 experiment, Earth Planets Space, 76, 180, https://doi.org/10.1186/s40623-024-02129-x, 2024. a, b, c
Hunt, B. G.: Photochemical heating of the mesosphere and lower thermosphere, Tellus, 24, 47–55, https://doi.org/10.3402/tellusa.v24i1.10619, 1972. a
Jones, M., Forbes, J. M., and Hagan, M. E.: Tidal-induced net transport effects on the oxygen distribution in the thermosphere, Geophys. Res. Lett., 41, 5272–5279, https://doi.org/10.1002/2014GL060698, 2014. a
Kalogerakis, K. S., Smith, G. P., and Copeland, R. A.: Collisional removal of by O, O2, O3, N2, and CO2, J. Geophys. Res., 116, D20307, https://doi.org/10.1029/2011JD015734, 2011. a
Kalogerakis, K. S., Matsiev, D., Sharma, R. D., and Wintersteiner, P. P.: Resolving the mesospheric nighttime 4.3 µm emission puzzle: Laboratory demonstration of new mechanism for OH(v) relaxation, Geophys. Res. Lett., 43, 8835–8843, https://doi.org/10.1002/2016GL069645, 2016. a
Kaufmann, M., Lehmann, C., Hoffmann, L., and Funke, B.: Chemical heating rates derived from SCIAMACHY vibrationally excited OH limb emission spectra, Adv. Space Res., https://doi.org/10.1016/j.asr.2007.07.045, 2008. a, b, c
Kaufmann, M., Ern, M., Lehmann, C., and Riese, M.: The response of atomic hydrogen to solar radiation changes, in: Climate and Weather of the Sun-Earth System (CAWSES): Highlights from a Priority Program, edited by: Lübken, F.-J., Springer Netherlands, Dordrecht, 171–188, https://doi.org/10.1007/978-94-007-4348-9_10, 2013. a, b, c, d, e
Kellogg, W. W.: Chemical heating above the polar mesopause in winter, J. Meteorol., 18, 373–381, https://doi.org/10.1175/1520-0469(1961)018<0373:CHATPM>2.0.CO;2, 1961. a
Kulikov, M. Y., Belikovich, M. V., Grygalashvyly, M., Sonnemann, G. R., Ermakova, T. S., Nechaev, A. A., and Feigin, A. M.: Nighttime ozone chemical equilibrium in the mesopause region, J. Geophys. Res.-Atmos., 123, 3228–3242, https://doi.org/10.1002/2017JD026717, 2018. a, b
Kulikov, M. Yu., Belikovich, M. V., Chubarov, A. G., Dementyeva, S. O., and Feigin, A. M.: Boundary of nighttime ozone chemical equilibrium in the mesopause region: long-term evolution determined using 20 year satellite observations, Atmos. Chem. Phys., 23, 14593–14608, https://doi.org/10.5194/acp-23-14593-2023, 2023. a, b
Kulikov, M. Y., Belikovich, M. V., Chubarov, A. G., Dementyeva, S. O., and Feigin, A. M.: Retrieval of nighttime distributions of mesosphere–lower thermosphere characteristics from satellite data, Izv. Atmos. Ocean. Phys., 60, 74–86, https://doi.org/10.1134/S0001433824700051, 2024a. a
Kulikov, M. Yu., Belikovich, M. V., Chubarov, A. G., Dementyeva, S. O., and Feigin, A. M.: Technical note: Nighttime OH and HO2 chemical equilibria in the mesosphere–lower thermosphere, Atmos. Chem. Phys., 24, 10965–10983, https://doi.org/10.5194/acp-24-10965-2024, 2024b. a, b
Lübken, F.-J.: Seasonal variation of turbulent energy dissipation rates at high latitudes as determined by in situ measurements of neutral density fluctuations, J. Geophys. Res.-Atmos., 102, 13441–13456, https://doi.org/10.1029/97JD00853, 1997. a
Mlynczak, M. G.: A contemporary assessment of the mesospheric energy budget, in: Geophysical Monograph Series, edited by: Siskind, D. E., Eckermann, S. D., and Summers, M. E., vol. 123, American Geophysical Union, Washington, DC, 37–52, https://doi.org/10.1029/GM123p0037, 2000. a, b
Mlynczak, M. G. and Russell, J. M.: An overview of the SABER experiment for the TIMED mission, in: Optical Remote Sensing of the Atmosphere, Optica Publishing Group, MA2, https://doi.org/10.1364/ORSA.1995.MA2, 1995. a
Mlynczak, M. G. and Solomon, S.: Middle atmosphere heating by exothermic chemical reactions involving odd-hydrogen species, Geophys. Res. Lett., 18, 37–40, https://doi.org/10.1029/90GL02672, 1991. a, b
Mlynczak, M. G. and Solomon, S.: A detailed evaluation of the heating efficiency in the middle atmosphere, J. Geophys. Res.-Atmos., 98, 10517–10541, https://doi.org/10.1029/93JD00315, 1993. a, b, c, d, e
Mlynczak, M. G., Hunt, L. A., Mast, J. C., Thomas Marshall, B., Russell, J. M., Smith, A. K., Siskind, D. E., Yee, J.-H., Mertens, C. J., Javier Martin-Torres, F., Earl Thompson, R., Drob, D. P., and Gordley, L. L.: Atomic oxygen in the mesosphere and lower thermosphere derived from SABER: Algorithm theoretical basis and measurement uncertainty, J. Geophys. Res.-Atmos., 118, 5724–5735, https://doi.org/10.1002/jgrd.50401, 2013a. a, b, c, d, e
Mlynczak, M. G., Hunt, L. H., Mertens, C. J., Marshall, B. T., Russell, J. M., López-Puertas, M., Smith, A. K., Siskind, D. E., Mast, J. C., Thompson, R. E., and Gordley, L. L.: Radiative and energetic constraints on the global annual mean atomic oxygen concentration in the mesopause region, J. Geophys. Res.-Atmos., 118, 5796–5802, https://doi.org/10.1002/jgrd.50400, 2013b. a
Mlynczak, M. G., Hunt, L. A., Russell III, J. M., and Marshall, B. T.: Updated SABER night atomic oxygen and implications for SABER ozone and atomic hydrogen, Geophys. Res. Lett., 45, 5735–5741, https://doi.org/10.1029/2018GL077377, 2018. a, b, c, d, e, f
Mlynczak, M. G., Hunt, L. A., Garcia, R. R., Harvey, V. L., Marshall, B. T., Yue, J., Mertens, C. J., and Russell, J. M.: Cooling and contraction of the mesosphere and lower thermosphere from 2002 to 2021, J. Geophys. Res.-Atmos., 127, e2022JD036767, https://doi.org/10.1029/2022JD036767, 2022. a
Mlynczak, M. G., Hunt, L. A., Garcia, R., Lopez-Puertas, M., Mertens, C. J., Nowak, N., and Marshall, B. T.: Energy conservation in the cooling and contracting upper mesosphere and lower thermosphere, Geophys. Res. Lett., 51, e2024GL109757, https://doi.org/10.1029/2024GL109757, 2024. a
Ramesh, K., Sridharan, S., and Vijaya Bhaskara Rao, S.: Causative mechanisms for the occurrence of a triple layered mesospheric inversion event over low latitudes, J. Geophys. Res.-Space, 119, 3930–3943, https://doi.org/10.1002/2013JA019750, 2014. a
Ramesh, K., Sridharan, S., Raghunath, K., and Rao, S. V. B.: A chemical perspective of day and night tropical (10° N–15° N) mesospheric inversion layers, J. Geophys. Res.-Space, 122, 3650–3664, https://doi.org/10.1002/2016JA023721, 2017. a, b
Remsberg, E. E., Marshall, B. T., Garcia-Comas, M., Krueger, D., Lingenfelser, G. S., Martin-Torres, J., Mlynczak, M. G., Russell, J. M., Smith, A. K., Zhao, Y., Brown, C., Gordley, L. L., Lopez-Gonzalez, M. J., Lopez-Puertas, M., She, C., Taylor, M. J., and Thompson, R. E.: Assessment of the quality of the Version 1.07 temperature-versus-pressure profiles of the middle atmosphere from TIMED/SABER, J. Geophys. Res.-Atmos., 113, 2008JD010013, https://doi.org/10.1029/2008JD010013, 2008. a
Riese, M., Offermann, D., and Brasseur, G.: Energy released by recombination of atomic oxygen and related species at mesopause heights, J. Geophys. Res.-Atmos., 99, 14585–14593, https://doi.org/10.1029/94JD00356, 1994. a, b
Rothman, L., Gordon, I., Barbe, A., Benner, D., Bernath, P., Birk, M., Boudon, V., Brown, L., Campargue, A., Champion, J.-P., Chance, K., Coudert, L., Dana, V., Devi, V., Fally, S., Flaud, J.-M., Gamache, R., Goldman, A., Jacquemart, D., Kleiner, I., Lacome, N., Lafferty, W., Mandin, J.-Y., Massie, S., Mikhailenko, S., Miller, C., Moazzen-Ahmadi, N., Naumenko, O., Nikitin, A., Orphal, J., Perevalov, V., Perrin, A., Predoi-Cross, A., Rinsland, C., Rotger, M., Šimečková, M., Smith, M., Sung, K., Tashkun, S., Tennyson, J., Toth, R., Vandaele, A., and Vander Auwera, J.: The HITRAN 2008 molecular spectroscopic database, J. Quant. Spectrosc. Ra., 110, 533–572, https://doi.org/10.1016/j.jqsrt.2009.02.013, 2009. a
Russell, III, J. M., Mlynczak, M. G., and Gordley, L. L.: Overview of the Sounding of the Atmosphere Using Broadband Emission Radiometry (SABER) experiment for the Thermosphere-Ionsphere-Mesosphere Energetics and Dynamics (TIMED) mission, in: Optical Spectroscopic Techniques and Instrumentation for Atmospheric and Space Research, vol. 2266, SPIE, 406–415, https://doi.org/10.1117/12.187579, 1994. a
Sharma, R. D., Wintersteiner, P. P., and Kalogerakis, K. S.: A new mechanism for OH vibrational relaxation leading to enhanced CO2 emissions in the nocturnal mesosphere, Geophys. Res. Lett., 42, 4639–4647, https://doi.org/10.1002/2015GL063724, 2015. a
Smith, A. K., Marsh, D. R., Mlynczak, M. G., and Mast, J. C.: Temporal variations of atomic oxygen in the upper mesosphere from SABER, J. Geophys. Res., 115, D18309, https://doi.org/10.1029/2009JD013434, 2010. a, b
Smith, A. K., Harvey, V. L., Mlynczak, M. G., Funke, B., García-Comas, M., Hervig, M., Kaufmann, M., Kyrölä, E., López-Puertas, M., McDade, I., Randall, C. E., Russell III, J. M., Sheese, P. E., Shiotani, M., Skinner, W. R., Suzuki, M., and Walker, K. A.: Satellite observations of ozone in the upper mesosphere, J. Geophys. Res.-Atmos., 118, 5803–5821, https://doi.org/10.1002/jgrd.50445, 2013. a, b
Smith, A. K., López-Puertas, M., Xu, J., and Mlynczak, M. G.: The heating efficiency of the exothermic reaction H+O3 in the mesosphere, J. Geophys. Res.-Atmos., 120, 12739–12747, https://doi.org/10.1002/2015JD024061, 2015. a, b
States, R. J. and Gardner, C. S.: Thermal structure of the mesopause region (80–105 km) at 40∘N latitude. Part I: Seasonal variations, J. Atmos. Sci., 57, 66–77, https://doi.org/10.1175/1520-0469(2000)057<0066:TSOTMR>2.0.CO;2, 2000. a
Sui, Y. Y., Zhu, Y. J., Chen, Q. Y., He, M. S., and Xu, J. Y.: Inversion of O2 1.27 µm nightglow emissions: A climatological analysis using satellite limb-viewed spectra and harmonic analysis, Earth Planet. Phys., 8, 1–14, https://doi.org/10.26464/epp2024029, 2024. a
Thomas, R. J.: Atomic hydrogen and atomic oxygen density in the mesopause region: Global and seasonal variations deduced from Solar Mesosphere Explorer near-infrared emissions, J. Geophys. Res.-Atmos., 95, 16457–16476, https://doi.org/10.1029/JD095iD10p16457, 1990. a
Vincent, R. A.: The dynamics of the mesosphere and lower thermosphere: A brief review, Prog. Earth Planet. Sci., 2, 4, https://doi.org/10.1186/s40645-015-0035-8, 2015. a
Wu, X. and Zhu, Y.: Nighttime chemical heating rates at 80–100 km derived from SCIAMACHY and SABER (2003–2011), Science Data Bank [data set], https://doi.org/10.57760/sciencedb.space.03261, 2026. a
Wu, X., Zhu, Y., Smith, A. K., Kaufmann, M., and Xu, J.: Nighttime atomic hydrogen abundance retrieved from SCIAMACHY hydroxyl airglow measurements in the mesopause region, Geophys. Res. Lett., 52, e2025GL116311, https://doi.org/10.1029/2025GL116311, 2025. a, b, c, d, e, f, g
Zhang, X., Forbes, J. M., Hagan, M. E., Russell, J. M., Palo, S. E., Mertens, C. J., and Mlynczak, M. G.: Monthly tidal temperatures 20–120 km from TIMED/SABER, J. Geophys. Res.-Space, 111, https://doi.org/10.1029/2005JA011504, 2006. a
Zhu, Y. and Kaufmann, M.: Atomic oxygen abundance retrieved from SCIAMACHY hydroxyl nightglow measurements, Geophys. Res. Lett., 45, 9314–9322, https://doi.org/10.1029/2018GL079259, 2018. a, b, c, d, e, f, g, h