the Creative Commons Attribution 4.0 License.
the Creative Commons Attribution 4.0 License.
 | 08 Apr 2026
Evaluation of reanalysis precipitable water vapor under typhoon conditions using multi-source observations
Jiaqi Shi
Min Li
Andrea K. Steiner
Sebastian Scher
Minghao Zhang
Wenliang Gao
Yongzhao Fan
Kefei Zhang
Precipitable Water Vapor (PWV) exhibits rapid and complex variations during typhoons, and its evaluation under typhoon conditions remains challenging due to sparse observations over the oceans. This study systematically evaluates PWV estimates from three state-of-the-art reanalyses during 113 typhoons between 2020 and 2024 over the Northwest Pacific and East Asia. The fifth-generation European Centre for Medium-Range Weather Forecasts Reanalysis (ERA5), the Modern-Era Retrospective Analysis for Research and Applications Version 2 (MERRA-2), and the Japanese Reanalysis for Three Quarters of a Century (JRA-3Q) are compared with ground-based Global Navigation Satellite System (GNSS), radiosonde, and Radio Occultation (RO) observations. Results based on ground-based GNSS, which serve as the primary reference in this study, show that ERA5 achieves the best overall accuracy, with a bias changing from −1.48 mm in non-typhoon periods to −0.18 mm during typhoons and root mean square error (RMSE) decreasing from 3.47 to 3.30 mm during typhoons. JRA-3Q also exhibits smaller errors during typhoons than during non-typhoon periods, although its bias and RMSE remain relatively large. Conversely, MERRA-2 shows higher error during typhoons, with the bias shifting from −0.63 mm in non-typhoon periods to 0.76 mm during typhoons, indicating a transition from modest underestimation to modest overestimation. Comparisons with radiosonde and RO observations show consistently high correlations for all three reanalyses, supporting their general reliability under typhoon conditions. Overall, the results provide an accuracy reference during typhoons and support the applicability of reanalysis PWV for typhoon-related studies, with ERA5 appearing the most robust among the datasets evaluated.
- Article
(7575 KB) - Full-text XML
- BibTeX
- EndNote


Water vapor is primarily distributed within the troposphere and is one of the most important greenhouse gases. It plays a critical role in energy exchange within weather systems, the hydrological cycle, and climate change (e.g., Schneider et al., 2010; Sherwood et al., 2010). Precipitable Water Vapor (PWV), defined as the total amount of water vapor contained in a vertical column of the atmosphere per unit area, is a key variable for characterizing atmospheric water vapor. It is an important input parameter for Numerical Weather Prediction (NWP) models and is widely used in meteorological and climatological monitoring and forecasting (e.g., Zhao et al., 2020; Zhang et al., 2022). The spatio-temporal variation and distribution of PWV (also referred to as column water vapor) are related to the vertical structure of atmospheric moisture, tropical deep convection, and precipitation (Muller et al., 2009; Holloway and Neelin, 2009).
Tropical Cyclones (TCs) are among the most destructive types of extreme weather. They occur frequently, exhibit high intensity, and cause widespread impacts (Emanuel, 2005; Walsh et al., 2012; Chan et al., 2018; Wang et al., 2020a; Shi et al., 2021; Xi et al., 2023). TCs are often accompanied by heavy rainfall and secondary disasters such as flooding, landslides, and debris flows (Woodruff et al., 2013; Cogan et al., 2018; Utsumi and Kim, 2022). Under a warming climate, the average translation speed of TCs has been reported to decrease globally by about 10 % over 1949–2016. Meanwhile, TC precipitation rates are projected to increase, with a global median increase of approximately 14 % across models, which may contribute to more prolonged and damaging impacts in affected regions (Kossin, 2018; Elsner, 2020; Knutson et al., 2020) . In the Northwest Pacific and the South China Sea, where TCs are referred to as typhoons, typhoons have frequently affected the Asia–Pacific region in recent years, including China, South Korea, and Japan, with southeastern China being particularly vulnerable and experiencing substantial casualties and economic losses (Esteban and Longarte-Galnares, 2010; Jung et al., 2024; Wang et al., 2024). Some intense typhoons and their residual circulations have even penetrated deep into inland China. For example, Typhoon In-Fa (2106) in 2021 and the double typhoons Doksuri (2305) and Khanun (2306) in 2023 caused record-breaking rainfall and devastating flooding in Henan province and Beijing–Tianjin–Hebei region in China (Shi et al., 2022; Zhao et al., 2024). Typhoons are moisture-sensitive systems whose development depends strongly on the availability and transport of atmospheric water vapor. PWV therefore provides an effective metric for depicting the pathways and strength of moisture transport during typhoons and for tracking moisture-related variations associated with their evolution and movement. Accordingly, high-accuracy PWV estimates are crucial for understanding the mechanisms underlying extreme precipitation during TCs, improving TC monitoring and forecasting, and supporting disaster risk assessment and mitigation efforts.
Various measurement techniques have been employed to retrieve PWV, including radiosondes, water vapor radiometers, satellite-based microwave/infrared remote sensing, and sun photometers (Ichoku et al., 2002; King et al., 2003; Li et al., 2003; Turner et al., 2007). In recent decades, advances in Global Navigation Satellite System (GNSS) technologies and Low Earth Orbit (LEO) satellites have enabled the widespread application of ground-based GNSS and space-based GNSS Radio Occultation (RO) for atmospheric observations (e.g., Melbourne et al., 1994; Kursinski et al., 1996; Li et al., 2017). However, these techniques have limitations when applied to fast-moving, ocean-based, and moisture-complex weather systems such as TCs, and obtaining PWV with both high resolution and temporal continuity remains challenging. In this context, gridded global reanalysis datasets provide atmospheric fields with high spatial and temporal resolution and no gaps, making it possible to obtain PWV at any time and location through interpolation. Reanalysis data therefore offer valuable resources for retrospectively investigating moisture transport and evolution during typhoons and for characterizing the spatio-temporal variability of atmospheric water vapor. Currently, several research institutions provide atmospheric reanalysis datasets that are widely used, including the fifth-generation European Centre for Medium-Range Weather Forecasts (ECMWF) Reanalysis (ERA5) (Hersbach et al., 2020), the Modern-Era Retrospective Analysis for Research and Applications Version 2 (MERRA-2) (Gelaro et al., 2017), and the Japanese Reanalysis for Three Quarters of a Century (JRA-3Q) (Kosaka et al., 2024). Despite their broad use, the accuracy of reanalysis-based PWV can be affected by differences in data assimilation strategies and the underlying numerical models, as well as by the uneven spatio-temporal distribution of assimilated observations. Therefore, reanalysis-based PWV products should be systematically evaluated for accuracy and applicability before practical application.
Previous studies have evaluated the accuracy of PWV estimates from reanalysis datasets across different regions. These evaluations commonly rely on independent observations, including ground-based GNSS, radiosondes, and GNSS RO, as reference data. In particular, ground-based GNSS-PWV typically achieves high accuracy (within 1–2 mm) and is not assimilated into any of the three reanalysis datasets examined in this study, making it an independent and reliable reference for validation (Wang et al., 2020b; Li et al., 2025). However, because GNSS stations are sparsely distributed over the oceans, radiosonde and GNSS RO observations are often used as complementary validation sources. At the regional scale, ERA5 generally achieves lower PWV errors (< 1 mm) over China and outperforms its predecessor ERA-Interim, with cross-validation using radiosonde data further supporting its reliability (Zhang et al., 2019a, b). In India, ERA5 also clearly outperforms MERRA-2 in PWV monitoring (Rani and Singh, 2025). Over the southern Tibetan Plateau, multiple reanalysis products exhibit systematic positive biases in the seasonal PWV cycle, likely linked to the persistent wet bias in regional models (Wang et al., 2017). In the Arctic, the Copernicus Arctic Regional Reanalysis (CARRA) shows good agreement with radiosonde observations, but with evident seasonal variability (Zhang et al., 2025). At the global scale, reanalysis PWV agrees well with GNSS, radiosonde, and RO observations (Zhang et al., 2018). However, considerable uncertainties remain in tropical and Southern Hemisphere regions, particularly for PWV estimates from the National Center for Environmental Prediction/Department of Energy (NCEP/DOE) dataset (Vey et al., 2010). Geographic and climatic factors have also been shown to influence the consistency between reanalysis and GNSS-derived PWV (Bock and Parracho, 2019). Among the various products, ERA5 generally performs better than others, while a newly released Chinese global reanalysis dataset, China Meteorological Administration-40 (CRA40), exhibits comparable performance to ERA5 in PWV estimation (Wang et al., 2020b; Li et al., 2025). However, as CRA40 data are not fully publicly available, it is not included in this study. GNSS RO data have also been used to compare ERA5 and MERRA-2 PWV estimates in tropical and subtropical regions (Johnston et al., 2021). Additionally, humidity modeling discontinuities in ERA5 at 09:00 and 21:00 UTC have been reported, which introduce diurnal jumps in Zenith Tropospheric Delay (ZTD) and subsequently affect PWV estimations (Yuan et al., 2025).
Existing evaluation studies have primarily focused on long-term and large-scale averages, with limited systematic evaluation of PWV accuracy from reanalysis datasets under extreme weather conditions such as typhoons. Moreover, comparative analyses of PWV estimation accuracy between typhoon and non-typhoon periods remain scarce. Driven by this research gap, we provide a systematic evaluation of PWV estimates from ERA5, JRA-3Q, and MERRA-2 during typhoon events using ground-based GNSS, radiosonde, and RO data from January 2020 to December 2024 over the Northwest Pacific and East Asia region. The data and methods used in this study are introduced in Sect. 2. Section 3 presents the evaluation results, and Sect. 4 provides the discussion and conclusions.
In this section, the typhoon datasets, the three reanalyses, and the observational data from ground-based GNSS, radiosondes, and RO used in this study are introduced. The PWV retrieval method, data quality control procedures, and the spatio-temporal collocation strategy are also described. In addition, the evaluation metrics and their formulations are provided.
2.1 Typhoon data
The typhoon dataset used in this study is obtained from the International Best Track Archive for Climate Stewardship (IBTrACS), which provides a unified, publicly available best-track dataset by integrating historical and recent records from multiple operational agencies worldwide (Knapp et al., 2010; Gahtan et al., 2024). IBTrACS includes key parameters such as TC-center position, time, maximum sustained wind speed, and wind radius, typically reported at 3 and 6 h intervals. According to IBTrACS, the reporting agency currently responsible for the Northwest Pacific is the Japan Meteorological Agency (JMA), therefore, the JMA-reported typhoon information is used in this study. Because most GNSS stations used in this study are located in China and the China Meteorological Administration (CMA) and JMA intensity classifications are broadly comparable, typhoon categories are assigned following the CMA classification scheme, which defines six categories based on wind speed: tropical depression (10.8–17.1 m s−1), tropical storm (17.2–24.4 m s−1), severe tropical storm (24.5–32.6 m s−1), typhoon (32.7–41.4 m s−1), severe typhoon (41.5–50.9 m s−1), and super typhoon (≥ 51.0 m s−1). For simplicity, these are denoted as L1 to L6, respectively. In this study, L1 typhoons are not included since no stations are collocated with their tracks.
There are 113 typhoons recorded from January 2020 to December 2024, and the spatial distribution of their tracks is shown in Fig. 1a, together with the locations of the GNSS and radiosonde stations. Figure 1b illustrates the number of typhoons by category over the five-year period, summed by month. Typhoons occur most frequently from June to November, with relatively higher counts in August, September, and October. The largest number of tropical storms (L2) occurs in August, and the largest number of super typhoons (L6) occurs in September.
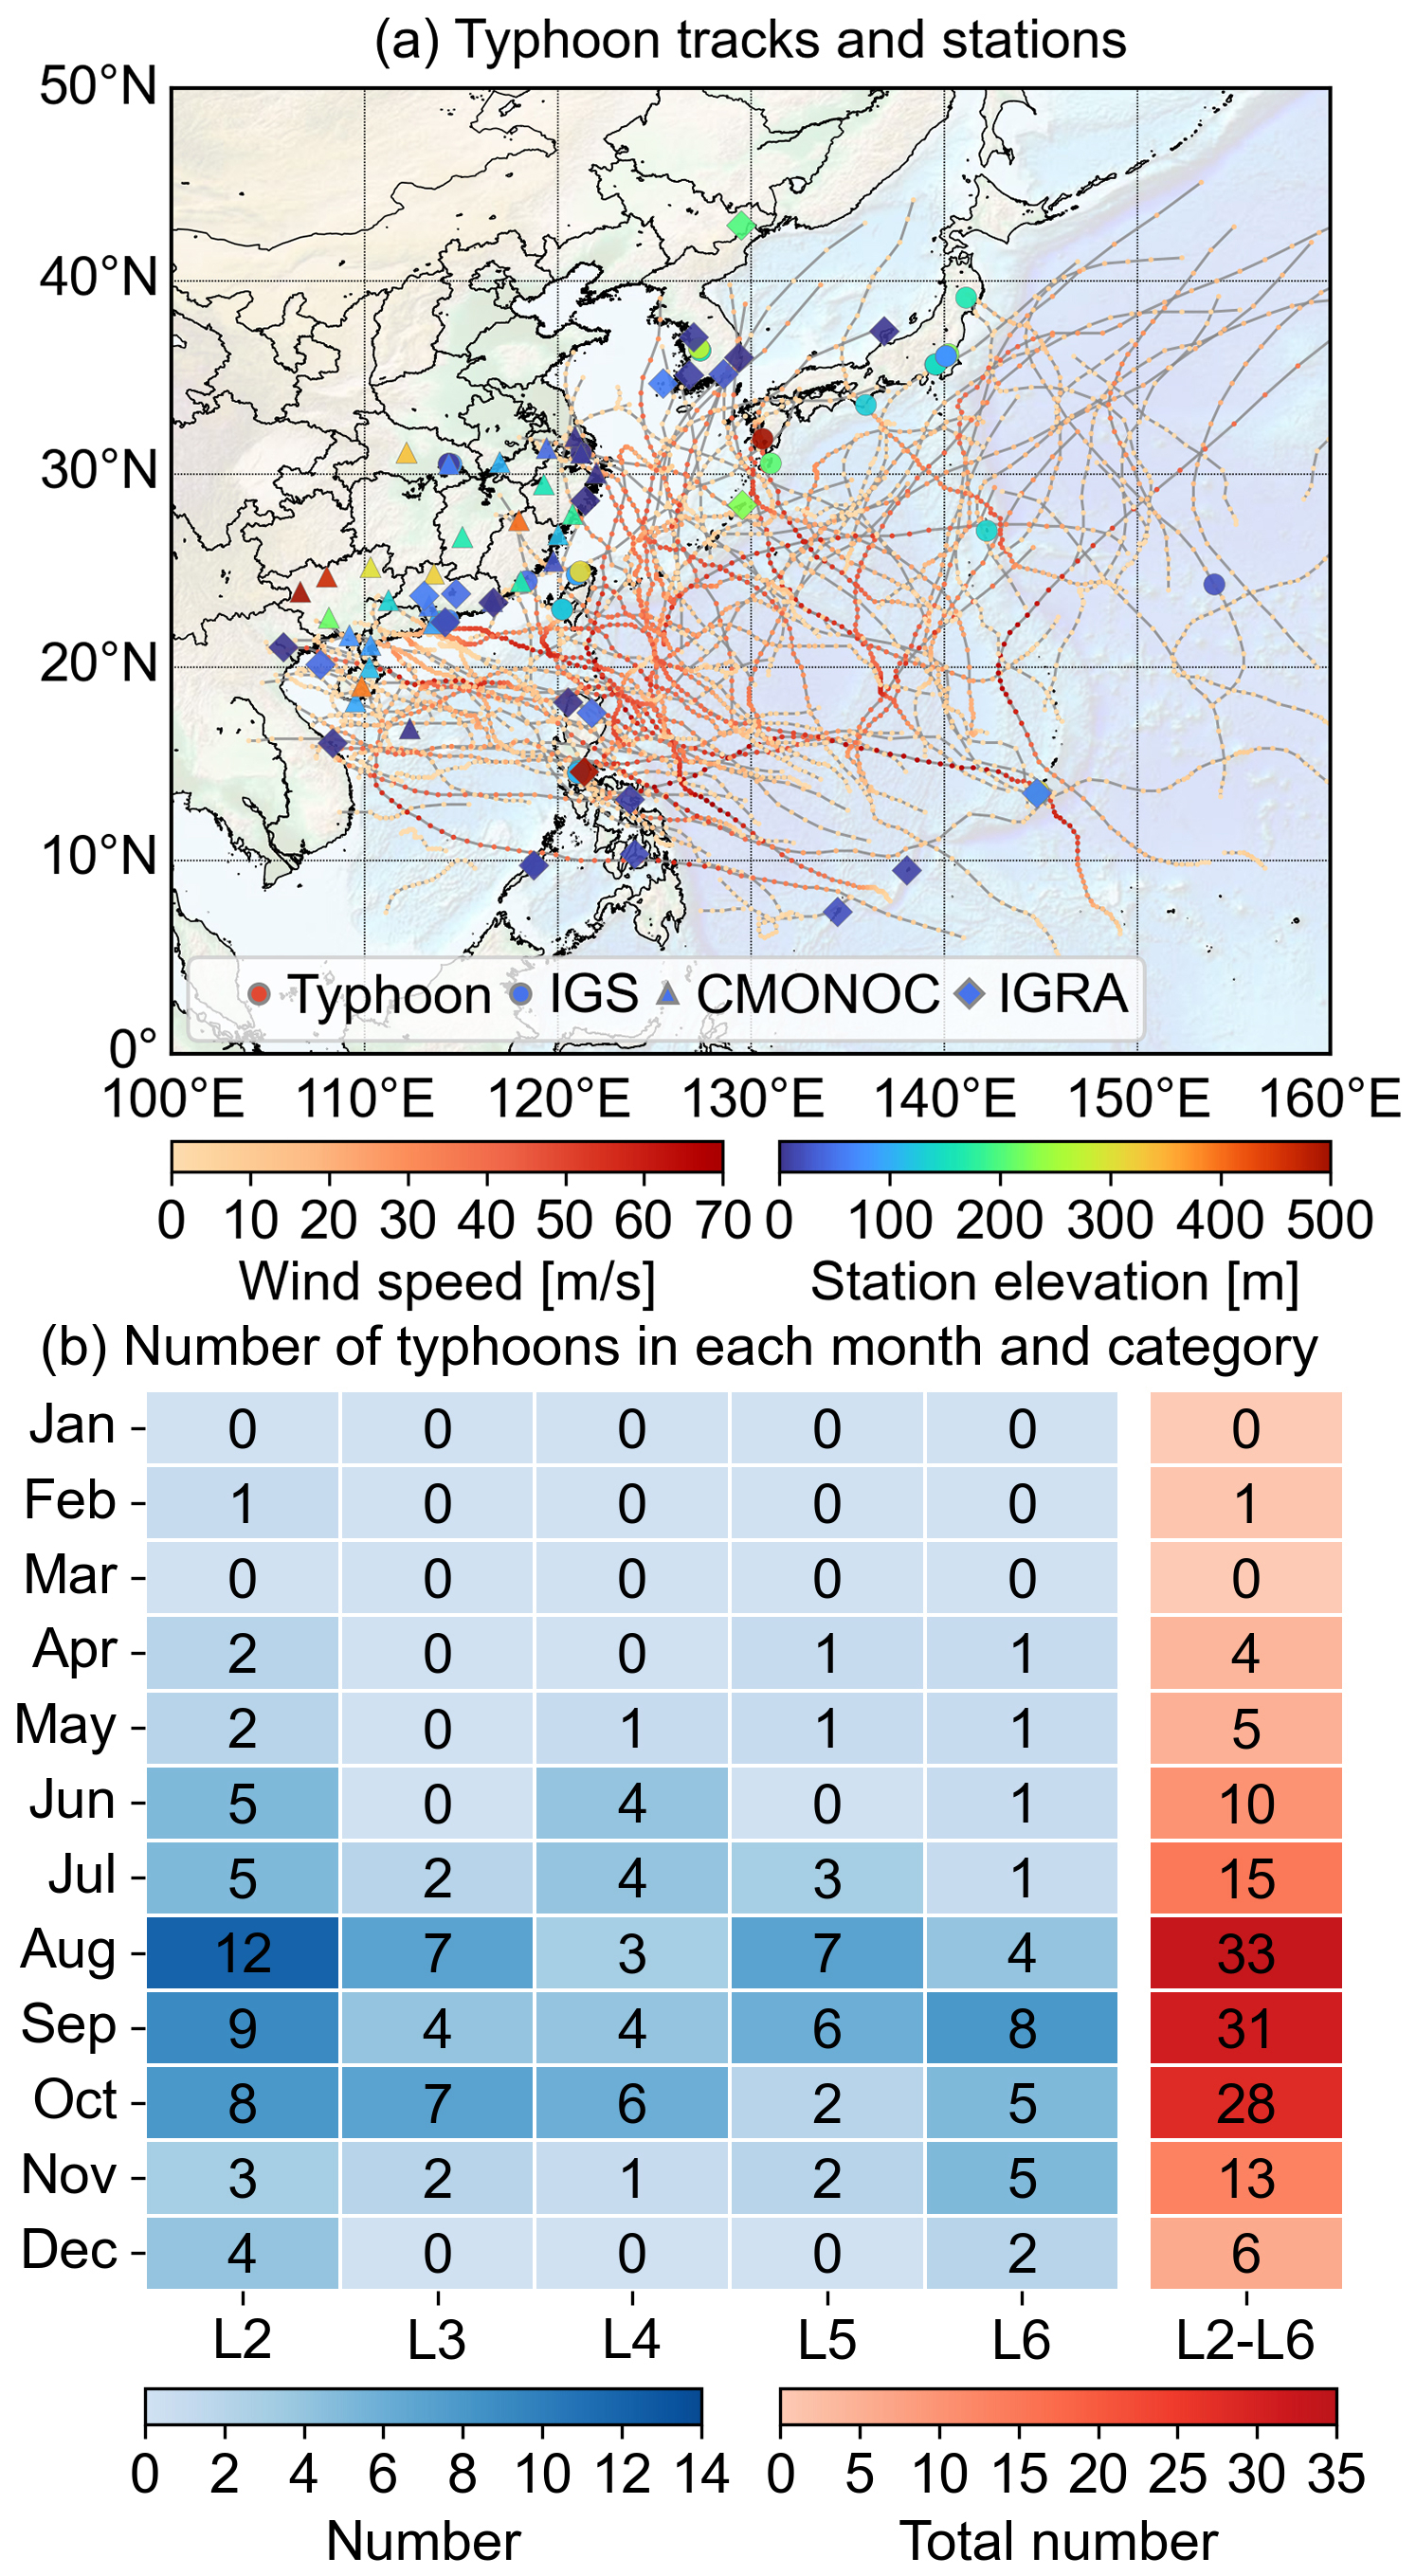
Figure 1(a) Spatial distribution of typhoon tracks, ground-based GNSS stations from IGS (marked by circles) and CMONOC (marked by triangles), and IGRA radiosonde stations (marked by diamonds) with colorbars indicating wind speed (in m s−1, left) and station elevation (in m, right). (b) Number of typhoons in each month and category from January 2020 to December 2024.
2.2 Reanalysis data
2.2.1 ERA5
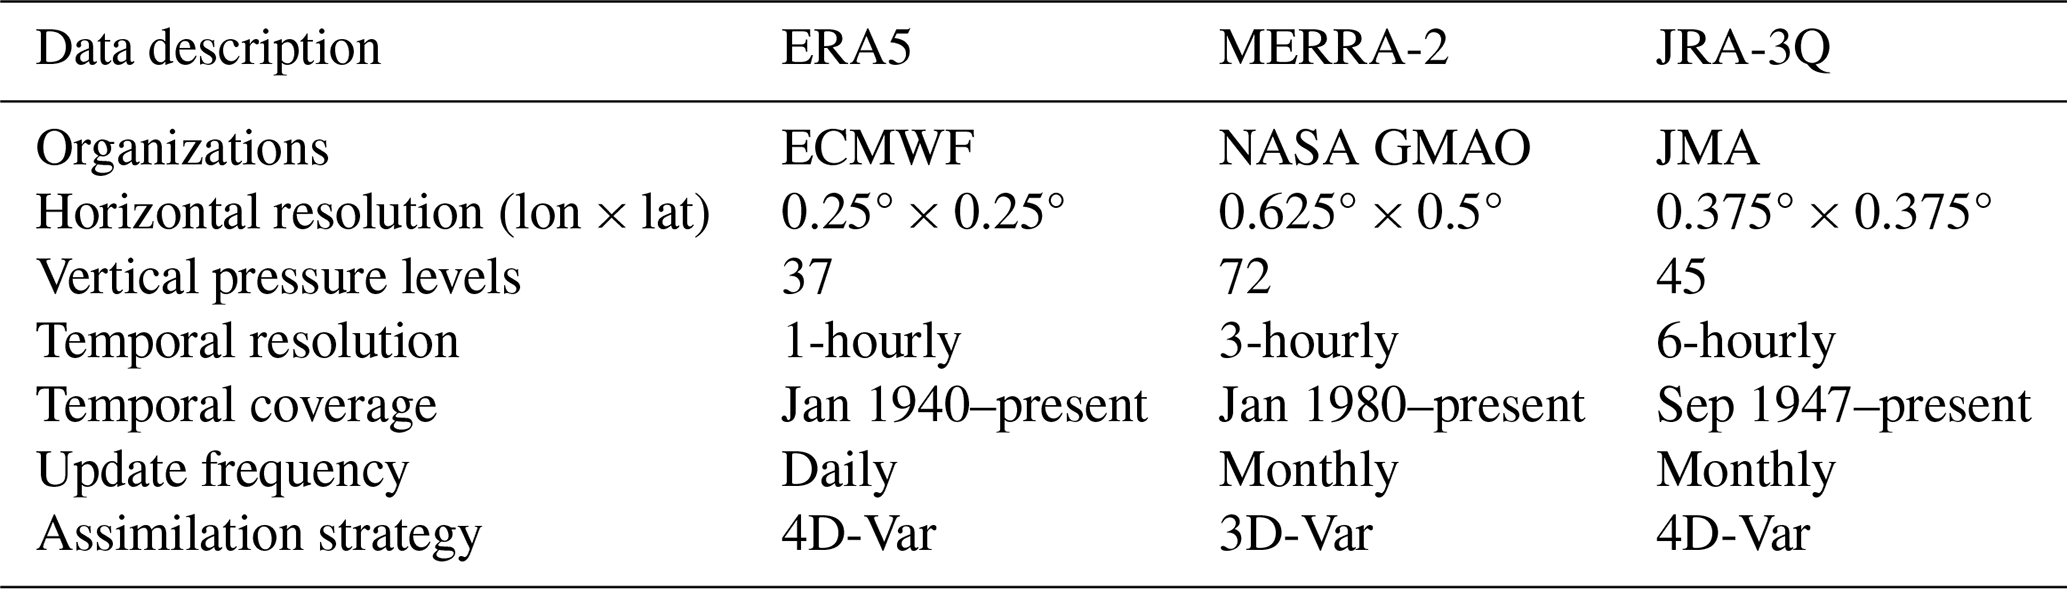
ERA5 is the fifth generation of ECMWF reanalysis for global climate and weather, providing a consistent record since 1940 and representing a state-of-the-art product developed by ECMWF (Hersbach et al., 2020; Soci et al., 2024). ERA5 is produced using an ensemble-based four-dimensional variational (4D-Var) data assimilation system and model forecasts in CY41R2 of the ECMWF Integrated Forecast System (IFS), with 137 hybrid pressure levels in the vertical and the top level at 0.01 hPa. Atmospheric data are available on interpolated 37 pressure levels. The horizontal resolution is 0.25° × 0.25°, and the finest temporal resolution is hourly.
2.2.2 MERRA-2
MERRA-2, developed by the Global Modeling and Assimilation Office (GMAO) at the National Aeronautics and Space Administration (NASA), provides global atmospheric reanalysis data starting from 1980 (Gelaro et al., 2017). Compared to its predecessor MERRA, MERRA-2 incorporates improvements in the Goddard Earth Observing System (GEOS) model and the Gridpoint Statistical Interpolation (GSI) assimilation system, enabling the assimilation of modern satellite observations such as hyperspectral radiance, microwave radiances, RO, and NASA ozone profiles. MERRA-2 has a horizontal resolution of 0.5° × 0.625° and 72 vertical levels up to 0.01 hPa, and the 3-hourly instantaneous data are used in this study.
2.2.3 JRA-3Q
JRA-3Q is produced by the JMA using an advanced global NWP system to improve the quality and temporal coverage of long-term reanalysis (Kosaka et al., 2024). It builds on developments since JRA-55 and extending the record back to September 1947 and including many notable typhoon events. JRA-3Q assimilates a wide range of reprocessed observational datasets, including rescued historical observations and satellite data provided by global meteorological and satellite centers. It employs a 4D-Var data assimilation system and addresses many of the limitations found in JRA-55, resulting in a high-quality and consistent dataset spanning over 75 years. The vertical structure includes 45 pressure levels, with a horizontal resolution of 0.375° × 0.375° and a temporal resolution of 6 h. JRA-3Q dataset was officially released in 2022, and related evaluation studies are still relatively limited. The evaluation conducted in this study may serve as a helpful reference for its future application.
Table 1 summarizes the data providers, spatial and temporal resolutions, start time, update frequency, and assimilation strategies of the three reanalysis datasets. Further details can be found in the corresponding documentation (Gelaro et al., 2017; Hersbach et al., 2020; Bell et al., 2021; Kosaka et al., 2024).
Table 1Summary of three atmospheric reanalysis datasets used in this study.
2.3 GNSS data
2.3.1 Ground-based GNSS data
Ground-based GNSS provides continuous, all-weather, high-precision observations of atmospheric variables with high temporal resolution, making it well-suited for evaluating reanalysis data under typhoon conditions. The International GNSS Service (IGS) provides Zenith Path Delay (ZPD, also known as ZTD) products at 5 min intervals. However, most IGS stations in the Asia–Pacific region are concentrated in Japan and South Korea, with sparse coverage along China's southeastern coast. To improve spatial coverage, GNSS data from the Crustal Movement Observation Network of China (CMONOC) are also used. These data are processed using the Position and Navigation Data Analyst (PANDA) software developed by Wuhan University (Shi et al., 2008), based on the Precise Point Positioning (PPP) technique (Zumberge et al., 1997), to generate ZTD estimates at the same temporal resolution as the IGS products. A quality control procedure is applied to exclude loosely constrained ZTD estimates, defined as those deviating from the station's monthly mean by more than four standard deviations (Zhang et al., 2017). The locations and elevations of IGS and CMONOC stations are shown in Fig. 1a. To minimize errors in the vertical interpolation of PWV, stations with elevations greater than 500 m are excluded. In total, 32 IGS and 29 CMONOC stations are used in this study.
2.3.2 GNSS RO data
GNSS RO data of the Constellation Observing System for Meteorology, Ionosphere, and Climate-2 (COSMIC-2) mission, as the successor to COSMIC, are provided via the COSMIC Data Analysis and Archive Center (CDAAC) in Boulder, USA (Schreiner et al., 2020). The orbital inclination of the COSMIC-2 constellation is designed to increase RO sampling in tropical and subtropical regions, and most profiles are distributed within a latitude range of 45° N to 45° S. PWV estimation requires profiles of specific humidity or water vapor partial pressure profiles. This study uses near-real-time wet profile (hereafter “wetPrf”) from the Level 2 products. The wetPrfs provide atmospheric parameters with a vertical sampling of 50 m below 20 km and 100 m between 20 and 60 km (the upper limit of the profiles). These data are retrieved using a one-dimensional variational (1D-Var) technique, and the lowermost height varies among profiles (Wee et al., 2022). In tropical and subtropical regions, super-refraction can prevent signals from penetrating to the surface, resulting in variations in the lowermost height across COSMIC-2 profiles (Schreiner et al., 2020; Wang et al., 2022). To reduce vertical interpolation errors, only wetPrfs that pass the CDAAC quality control procedures and reach below 500 m are used in this study.
2.4 Radiosonde data
Radiosonde data used in this study are obtained from the Integrated Global Radiosonde Archive (IGRA), with routine observations conducted twice daily at approximately 00:00 and 12:00 UTC. PWV derived from radiosonde profiles typically has an uncertainty of 5 % to 8 % (Pérez-Ramírez et al., 2014; Turner et al., 2003). Despite certain limitations, radiosonde observations remain a standard reference for evaluating the PWV retrieved from other techniques (Gui et al., 2017). Quality control follows procedures described in previous studies (Wang and Zhang, 2008; Zhang et al., 2017), with additional criteria applied to ensure profile completeness and temporal coverage: (1) Profiles must reach at least 300 hPa, and only profiles with at least 30 vertical levels are used for PWV calculation; (2) Profiles containing large data gaps, defined as pressure intervals exceeding 200 hPa between successive humidity measurements, are discarded; (3) Stations must operate continuously from January 2020 to December 2024, with at least 200 observations per year; (4) Stations with elevations exceeding 500 m are excluded (Shi et al., 2025). Based on these criteria, a total of 25 radiosonde stations are retained for evaluation, and their locations are shown in Fig. 1.
2.5 PWV estimation methods
PWV can be derived using two approaches. The first integrates specific humidity or water vapor partial pressure and is applied to reanalysis, radiosonde, and RO data. The second converts the Zenith Wet Delay (ZWD) estimated from GNSS PPP into PWV using a conversion factor.
2.5.1 Reanalysis-PWV, radiosonde-PWV, and RO-PWV
The vertical integration for PWV can be expressed as follows:
where p1 and p2 (in hPa) are the upper and lower pressure limits of the integration, respectively, q is the specific humidity (in g kg−1), ρw is the density of liquid water, whose value is 1000 kg m−3, and gs is the mean gravitational acceleration at the station. It is defined as:
where gn=9.80665 m s−2 is the value of normal gravity, φ is latitude (in rad), h is elevation (in m). Specific humidity q can also be replaced by water vapor partial pressure e, with the conversion relationship as follows:
where p is pressure (in hPa).
2.5.2 GNSS-PWV
The ZTD, comprising Zenith Hydrostatic Delay (ZHD) and ZWD, can be accurately estimated from GNSS observations using PPP, with ZHD precisely computed using the Saastamoinen model (Saastamoinen, 1972; Elgered et al., 1991):
where φ is latitude (in rad) of the station, H is the ellipsoidal height of the station (in km). ps represents the surface air pressure (in hPa). The ZWD is obtained by subtracting the ZHD from the ZTD:
the PWV can be obtained by multiplying ZWD by the water vapor conversion factor:
where Π is the water vapor conversion factor, expressed as:
where ρw=1000 kg m−3 is the density of liquid water, Rv=461.51 J K−1 kg−1 is the specific gas constant for water vapor, ± 10 K hPa−1 and k3=3.776 ± 0.004 × 10⁵ K2 hPa−1 are atmospheric refractivity constants, respectively. Tm denotes the weighted mean temperature, which can be determined using either an empirical linear model (Bevis et al., 1994) or by integration based on meteorological reanalysis data. It has been indicated in previous studies that calculating Tm using the integration method provides greater accuracy (Wang et al., 2005). The formula is presented as Eq. (8) (Davis et al., 1985; Bevis et al., 1992):
where e is the water vapor pressure at the station's zenith (in hPa), T is the temperature (in K), hs is the height of the station (in m), and h is the height (in m).
2.6 Data collocation schemes and PWV horizontal interpolation method
Wind radius can be used to characterize the spatial extent of a typhoon's influence. For the Northwest Pacific, recent IBTrACS records are primarily based on information from the JMA, which includes wind radius reported for different wind speed thresholds. In this study, a dynamic collocation scheme is adopted using the 30 kt wind radius to associate GNSS and radiosonde stations as well as RO profiles with the typhoon track. Specifically, the 30 kt wind radius includes the longest and shortest radius of 30 kt winds, and their mean is taken as the effective influence radius at each time. For GNSS and radiosonde observations, a station is considered collocated with the typhoon center when the distance between the station and the typhoon center is smaller than the time dependent effective radius. Temporally, the value at the target time is obtained by linear interpolation using the two observations closest in time. For RO profiles, a profile is regarded as collocated when the distance between the mean tangent point location and the typhoon center is smaller than the corresponding time dependent effective radius and the time difference does not exceed 30 min.
For PWV horizontal interpolation, bilinear interpolation is used. The target location is given by (lon,lat), where , and . The bilinear interpolation is expressed as:
where a wlon and wlat are the weights along the longitudinal and latitudinal directions, respectively. PWV11 denotes the PWV value at (lon1,lat1), and PWV21, PWV12, and PWV22 are defined analogously at (lon2,lat1), (lon1,lat2), and (lon2,lat2).
2.7 Statistical metrics
The statistical metrics used in this study include the systematic deviation of PWV from reanalysis with respect to observations, denoted as bias, Relative Bias (RB), Root Mean Square Error (RMSE), and de-biased RMSE (dRMSE). The dRMSE represents the residual error after bias removal and is used to isolate the random component of PWV errors. They are calculated by the following formulas:
where PWVreanalysis represents the PWV from different reanalysis data, and PWVreference is the reference PWV, which can be GNSS-PWV, radiosonde-PWV, or RO-PWV, is the mean value of bias.
In addition, to characterize the local spatial variability of reanalysis data, the Neighborhood Standard Deviation (NSD) is adopted as one of the evaluation metrics (Wei et al., 2013). NSD is used as a descriptive metric of subgrid scale spatial variability in reanalysis PWV around the target location. Larger NSD indicates stronger spatial heterogeneity within neighboring grid cells and thus a higher potential for representativeness mismatch when gridded fields are compared with point observations (Bock and Parracho, 2019). Because TCs are asymmetric and can exhibit sharp moisture gradients, high NSD does not necessarily imply a large reanalysis error, but provides context for interpreting the evaluation results under typhoon conditions. As illustrated in Fig. 2, NSD is computed at two spatial scales using the standard deviation of PWV from the 4 nearest grid points (NSD-4) and the 16 nearest grid points (NSD-16) around the typhoon center.
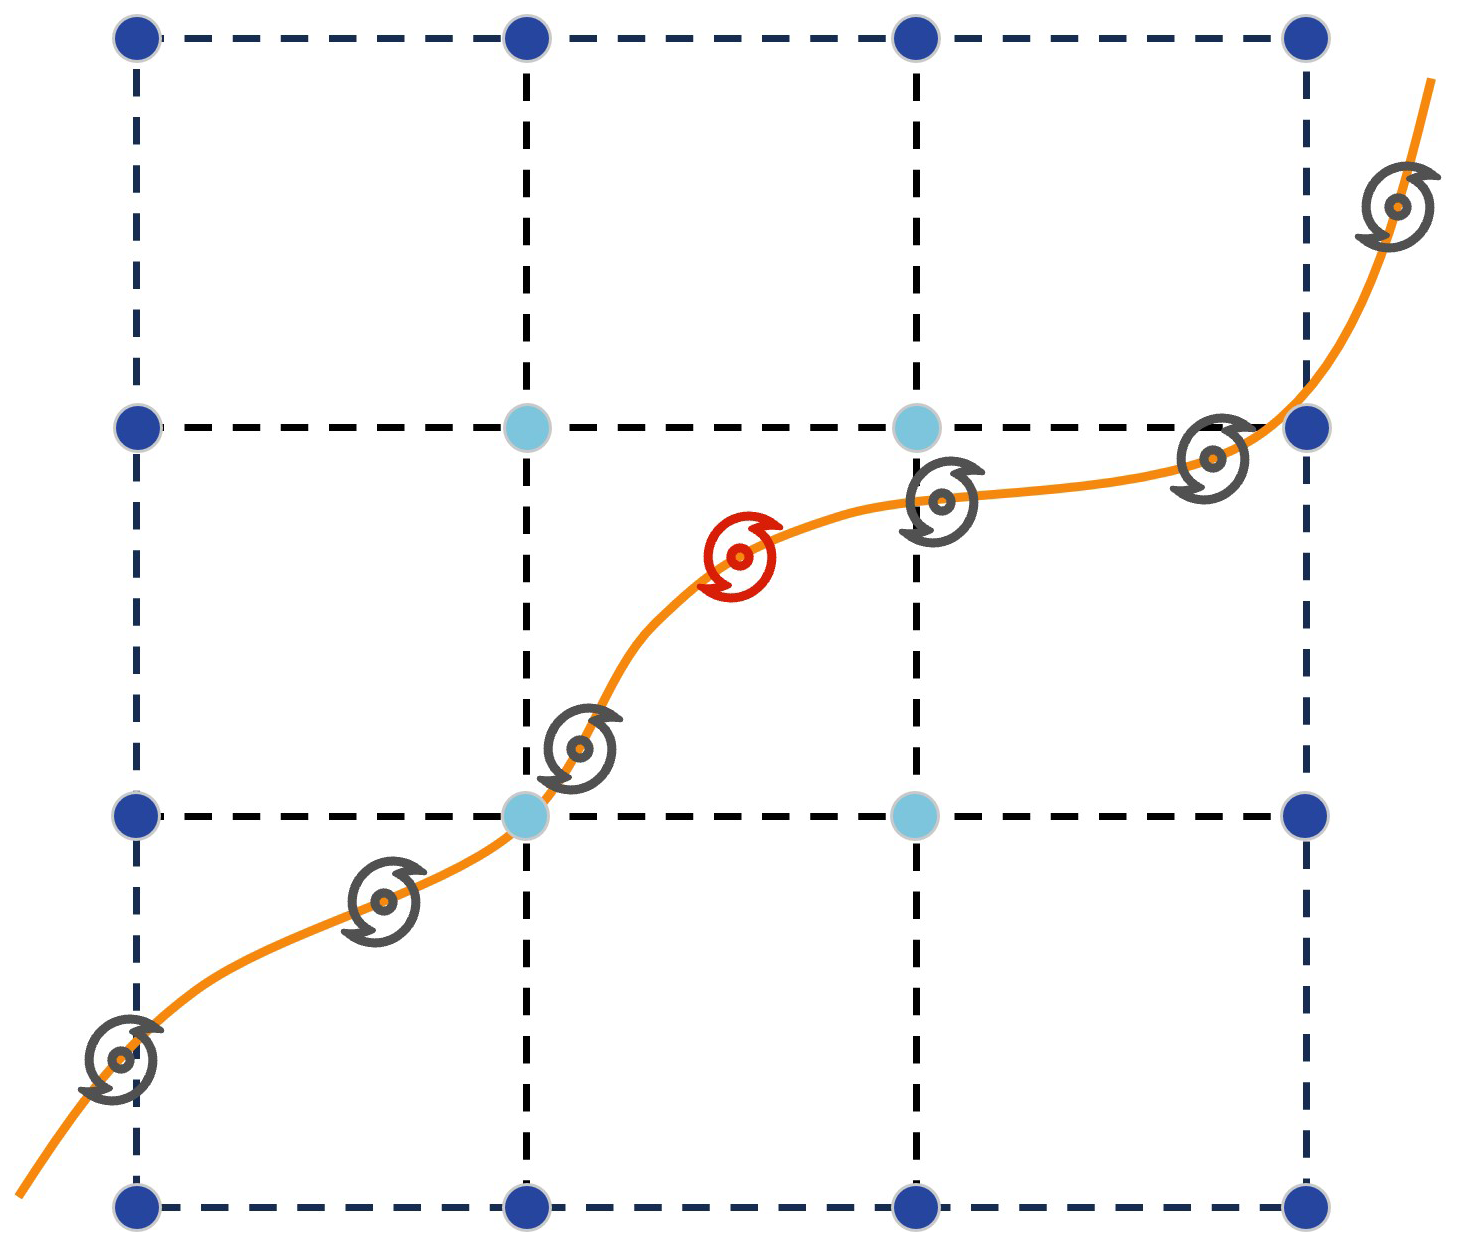
Figure 2Schematic of NSD calculation. The orange line shows the typhoon track; the red marker indicates the typhoon center. The 16 nearest grid points are shown in dark blue and light blue, with the 4 closest points in light blue.
NSD-4 and NSD-16 can be calculated according to the following equation:
where denotes the mean PWV of the neighboring points, and M is set to 4 or 16.
This section presents the evaluation results of PWV estimates from the three reanalysis datasets. For clarity, prefixes are used to distinguish PWV derived from different data sources and their corresponding statistical metrics. Specifically, GNSS-PWV, radiosonde-PWV (RS-PWV), and RO-PWV denote PWV retrieved from ground-based GNSS, radiosonde, and RO data, respectively. For the reanalysis products, the initial letter of each dataset is used as a prefix. Accordingly, E-PWV, M-PWV, and J-PWV refer to PWV estimated from ERA5, MERRA-2, and JRA-3Q, respectively. The prefix “REA-” is used as a collective term for PWV estimates and associated statistical metrics derived from the three reanalysis datasets.
3.1 Evaluation using ground-based GNSS data
In this subsection, subscripts are used to distinguish results from different GNSS networks when needed. Specifically, GNSS-PWVI and GNSS-PWVC denote PWV estimated from IGS and CMONOC stations, respectively.
3.1.1 Monthly evaluation
To provide a comprehensive understanding of the PWV accuracy of the three reanalysis datasets, evaluations are conducted using data from 64 GNSS stations spanning January 2020 to December 2024. Monthly mean PWV from the reanalyses is compared to GNSS-PWV, with results shown in Fig. 3.
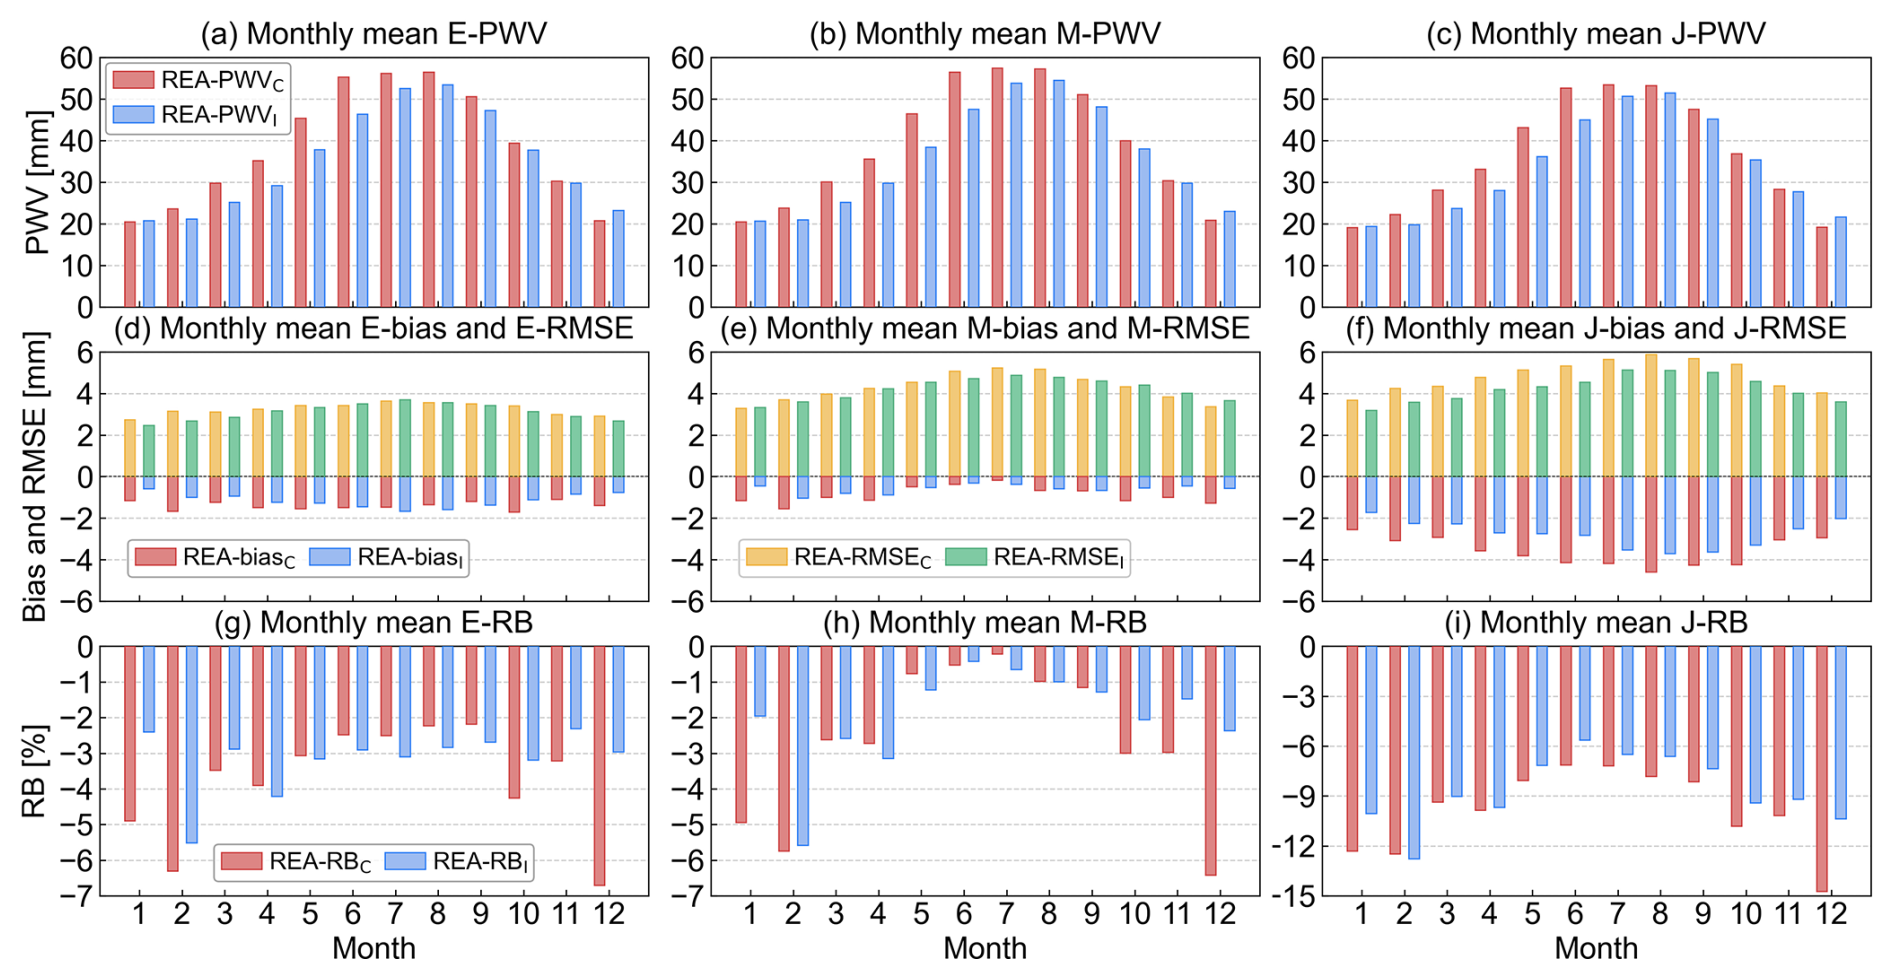
Figure 3Monthly mean evaluation results. Panels (a)–(c) show REA-PWV (mm); red and blue bars denote REA-PWV sampled at the locations of CMONOC (REA-PWVC) and IGS (REA-PWVI) stations, respectively. Panels (d)–(f) show REA-bias and REA-RMSE (mm); red and yellow bars denote bias and RMSE at CMONOC stations (REA-biasC and REA-RMSEC), respectively, and blue and green bars denote bias and RMSE at IGS stations (REA-biasI and REA-RMSEI), respectively. Panels (g)–(i) show REA-RB (%); red and blue bars denote RB at CMONOC (REA-RBC) and IGS (REA-RBI) stations, respectively. Subscripts C and I indicate that reanalysis PWV is sampled at CMONOC and IGS station locations, respectively, and that the corresponding statistical metrics (bias, RMSE, and RB) are computed against GNSS observations from the same network.
Monthly mean PWV from the three reanalyses (E-PWV, M-PWV, and J-PWV) show high consistency and pronounced seasonality in Fig. 3a–c, peaking at about 55 mm in July–August and dropping to about 20 mm in boreal winter. Notably, the PWV maximum slightly precedes the main typhoon season (August–October). REA-PWVC is generally higher than REA-PWVI from February to November but lower in the remaining months, mainly reflecting the different spatial distribution of GNSS stations from these two networks. Among the reanalyses, E-PWV and M-PWV are very similar, whereas J-PWV remains consistently lower than both E-PWV and M-PWV across all months. Biases in Fig. 3d–f indicate that ERA5 and JRA-3Q have negative biases in every month (red and blue bars), with the absolute value of the bias positively correlated with PWV, consistent with previous studies indicating that mean REA-PWV is negatively biased in low-latitude regions (Wang et al., 2020b). The largest E-biasC and E-biasI occur in October and July (−1.70 and −1.66 mm), while the largest J-biasC and J-biasI both occur in August (−4.59 and −3.69 mm). In contrast, M-PWV agrees well with GNSS-PWV, with M-biasC and M-biasI remaining below 1 mm and approaching near-zero from May to September. RMSE (yellow and green bars in Fig. 3d–f) follows a PWV-like seasonal cycle, with ERA5 having the smallest RMSE, followed by MERRA-2, and JRA-3Q the largest. RB in Fig. 3g–i is smaller in summer and larger in winter, as expected because it represents bias normalized by PWV, so its seasonality is largely governed by the PWV distribution and aligns with the bias pattern.
For the months with more than ten typhoons within the five-year period (June–November), network-weighted mean bias and RMSE are obtained by combining the CMONOC- and IGS-based results, with weights determined by each network's proportion of the total number of used GNSS stations. The resulting E-bias, M-bias, and J-bias are −1.26, −0.73, and −3.16 mm, respectively, while the E-RMSE, M-RMSE, and J-RMSE are 3.18, 4.25, and 4.55 mm, respectively (not shown). Among the three datasets, MERRA-2 shows the smallest systematic deviation, whereas ERA5 yields the lowest RMSE, suggesting greater stability for E-PWV. For JRA-3Q, both the absolute value of J-bias and J-RMSE are the largest among the three reanalyses in most months. The next section presents a more detailed evaluation of REA-PWV under typhoon conditions.
3.1.2 Composite evaluation considering adjacent periods of typhoons
Typhoon monitoring agencies release typhoon data based on wind speed. Data recording begins or ends when the wind speed reaches or falls below a specified threshold. It has been found that water vapor plays a critical role in TC formation, high column water vapor appears near the pouch center and starts to increase about 42 h prior to genesis, while a substantial increase in precipitation occurs within 24 h before genesis (Wang, 2014; Wang and Hankes, 2016). Moreover, even after typhoon dissipation or passage, residual circulation can continue to exert influence (Duan et al., 2014). Therefore, in addition to the recorded typhoon period (hereafter “r-typhoon”), REA-PWV is also evaluated during a 3 d Adjacent Period (AP), defined as the 3 d before and the 3 d after r-typhoon. A schematic of r-typhoon and AP is provided in the top panel of Fig. 4.
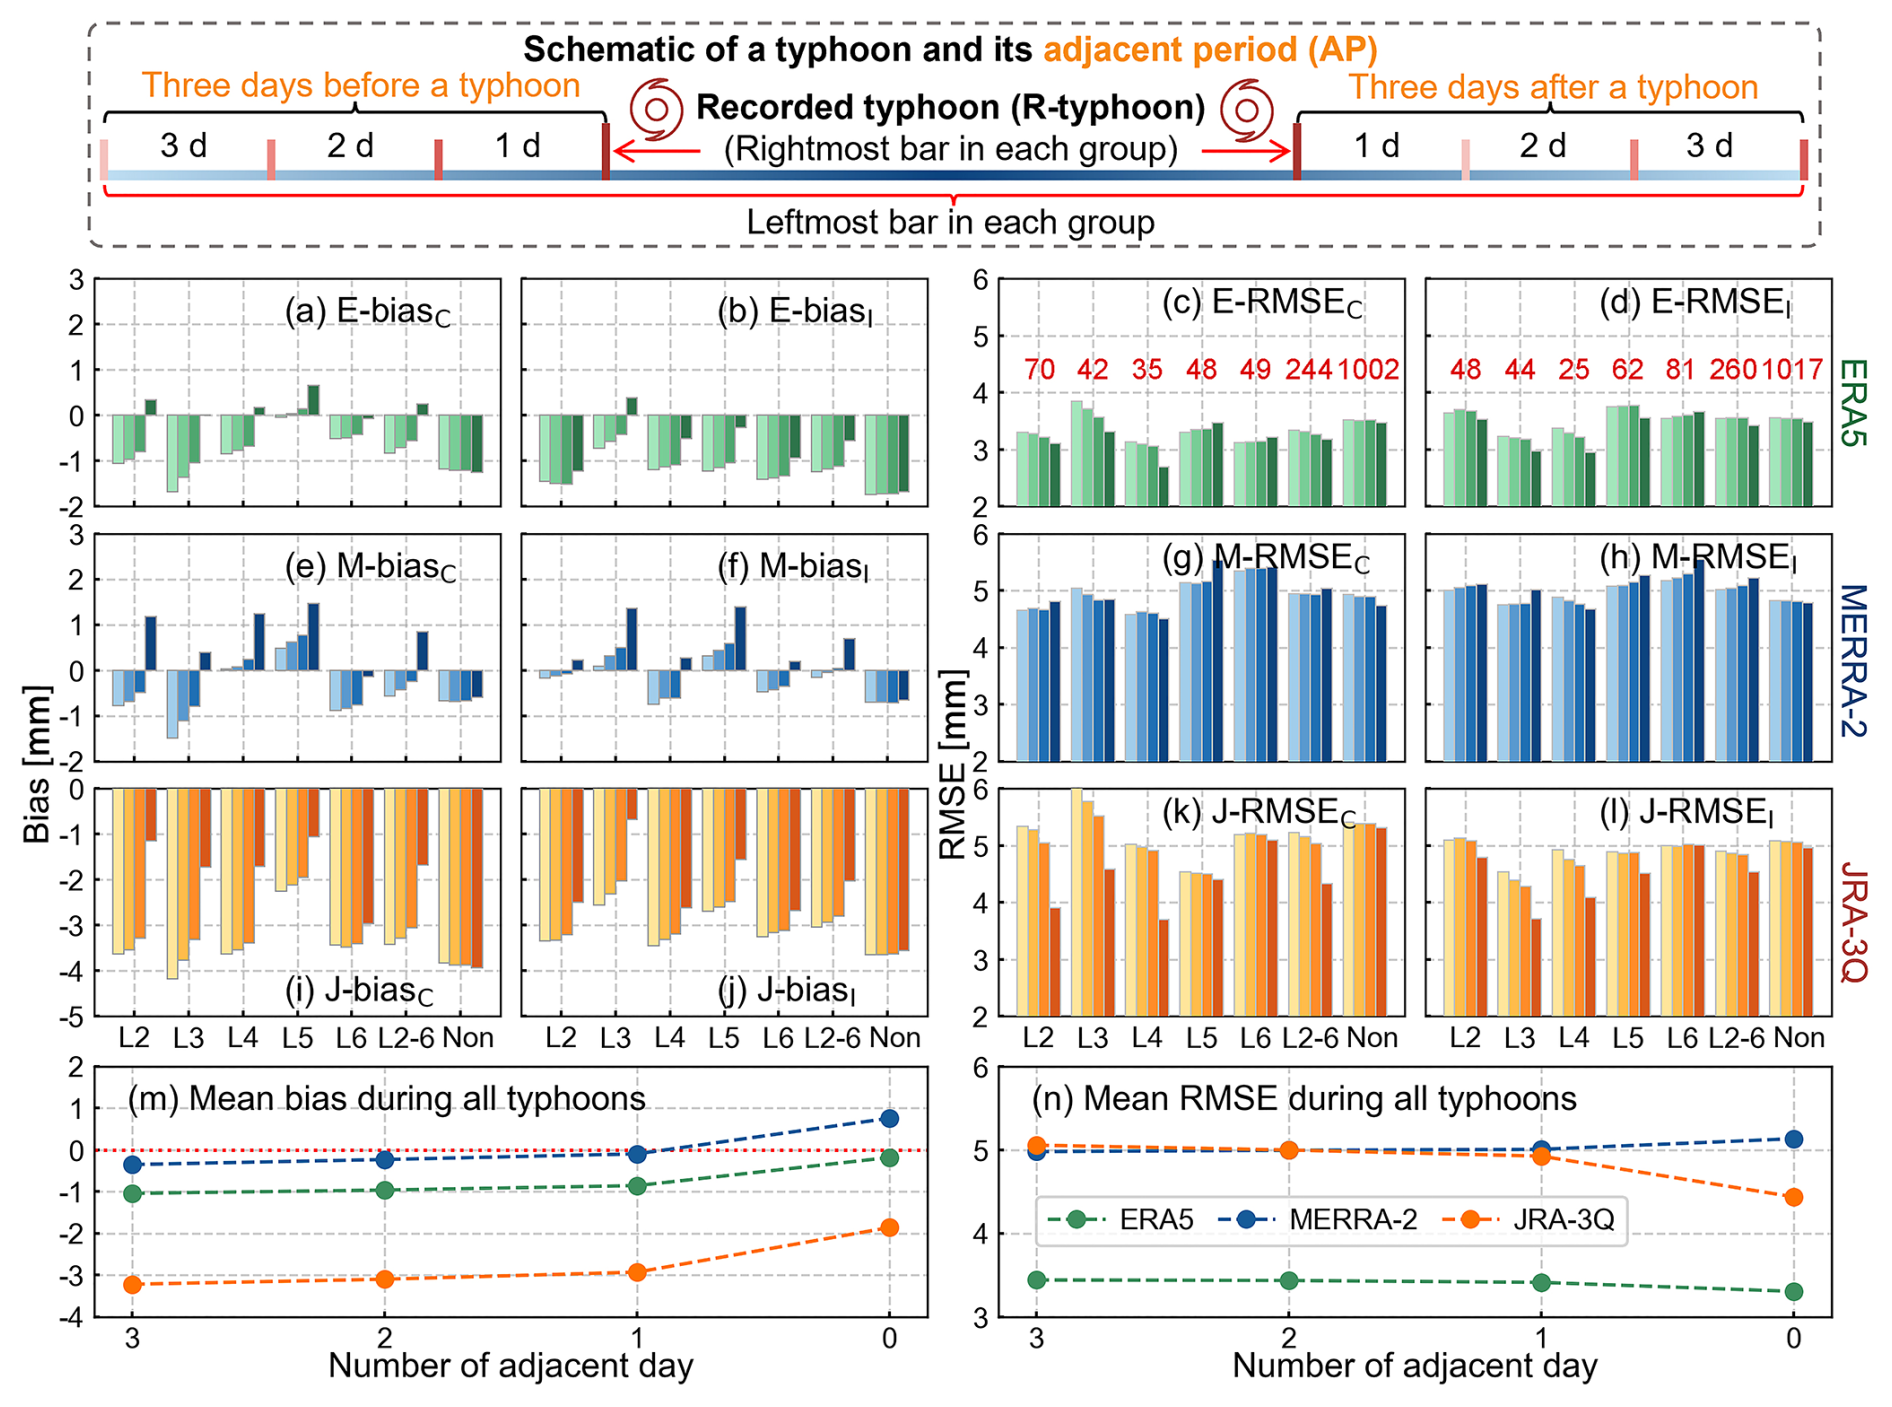
Figure 4The top panel shows the schematic timeline of r-typhoon and the AP. Panels (a)–(l) present biases and RMSEs under different AP settings across typhoon categories – ERA5 (a–d); MERRA-2 (e–h); JRA-3Q (i–l). Within each bar cluster, color from light to dark correspond to AP ± 3, AP ± 2, AP ± 1 d, and r-typhoon, respectively. “L2-6” and “Non” denote the results for all typhoons and for non-typhoon periods, respectively. Panels (c) and (d) report the numbers of CMONOC and IGS station–typhoon pairs. Panels (m) and (n) summarize the mean bias and RMSE averaged over all typhoons as a function of AP.
Figure 4a–l shows bar charts of REA-biases and REA-RMSEs under different AP settings and typhoon categories. Here, “Non” denotes the mean results for the same stations and calendar periods in non-typhoon years during 2020–2024; for example, for typhoon Doksuri in 2023, “Non” refers to the same stations and dates in 2020, 2021, 2022, and 2024, when no typhoon occurred. The magnitude of the REA-bias generally decreases as AP shortens from ± 3 d to r-typhoon period, meaning that biases tend to move closer to zero or shift from negative to positive. For ERA5 and JRA-3Q, both E-bias and J-bias decrease overall with a shorter AP, and E-bias at CMONOC stations becomes slightly positive during r-typhoon period (Fig. 4a, b, i, j). In contrast, M-bias increases slightly as AP shortens and turns more clearly positive during r-typhoon period (Fig. 4e, f), with a larger absolute value than under the ± 3 d AP. Under non-typhoon conditions, the “Non” group in Fig. 4a, b, e, f, i, j shows consistently negative REA-biases and no pronounced dependence on AP length. For RMSE, E-RMSE and J-RMSE exhibit a slight overall decrease as AP shortens (Fig. 4c, d, k, l), although this tendency is weak for E-RMSE computed at IGS stations. In addition, J-RMSE decreases more markedly with shorter AP for weaker typhoons (L2–L4; Fig. 4k). By contrast, M-RMSE during r-typhoon period is slightly higher than during AP (Fig. 4g, h), indicating slightly larger errors when only r-typhoon period is considered. Similar to the bias, RMSE under non-typhoon conditions shows no pronounced dependence on AP (the “Non” clusters in Fig. 4c, d, g, h, k, l).
When aggregated across all typhoons, E-bias and J-bias are smaller than those during non-typhoon periods regardless of whether AP is included (the two rightmost bar groups in Fig. 4a, b, i, j). The corresponding RMSEs are also slightly lower than their non-typhoon counterparts (the two rightmost bar groups in Fig. 4c, d, k, l). This indicates that E-PWV and J-PWV exhibit higher overall accuracy during typhoon periods than during non-typhoon periods. Moreover, as AP shortens, E-bias, J-bias, E-RMSE, and J-RMSE further decrease, indicating that r-typhoon-only evaluation shows smaller errors than evaluations that include AP. For MERRA-2, M-bias is negative and close to zero when AP spans ± 1 to ± 3 d, whereas it becomes positive during r-typhoon period, with a larger absolute value than that during non-typhoon periods (Fig. 4e, f, two rightmost bar groups). Meanwhile, M-RMSE is slightly higher during typhoon periods than during non-typhoon periods and is consistently larger than E-RMSE, while remaining comparable to J-RMSE (comparison of the two rightmost bar groups in Fig. 4g, h with those in Fig. 4c, d, k, l). The summaries in Fig. 4m, n quantify these differences: during r-typhoon period, the mean E-bias, M-bias, and J-bias are −0.18, 0.76, and −1.86 mm, respectively, and the mean E-RMSE, M-RMSE, and J-RMSE are 3.30, 5.13, and 4.44 mm, respectively. Overall, E-PWV shows the best performance during r-typhoon periods. M-PWV shows a positive shift in bias, but the mean bias remains within 1 mm. J-PWV improves relative to non-typhoon periods, although a negative bias remains.
3.1.3 Evaluation during recorded typhoon periods
This section focuses on the accuracy of PWVs during r-typhoon from reanalyses, without considering AP. Table 2 presents mean REA-biases, REA-RMSEs and dRMSEs of all typhoons during both r-typhoon and non-typhoon.
Table 2Mean REA-bias, REA-RMSE, and REA-dRMSE (mm) during r-typhoon period and non-typhoon periods at all GNSS stations, aggregated over all typhoons.
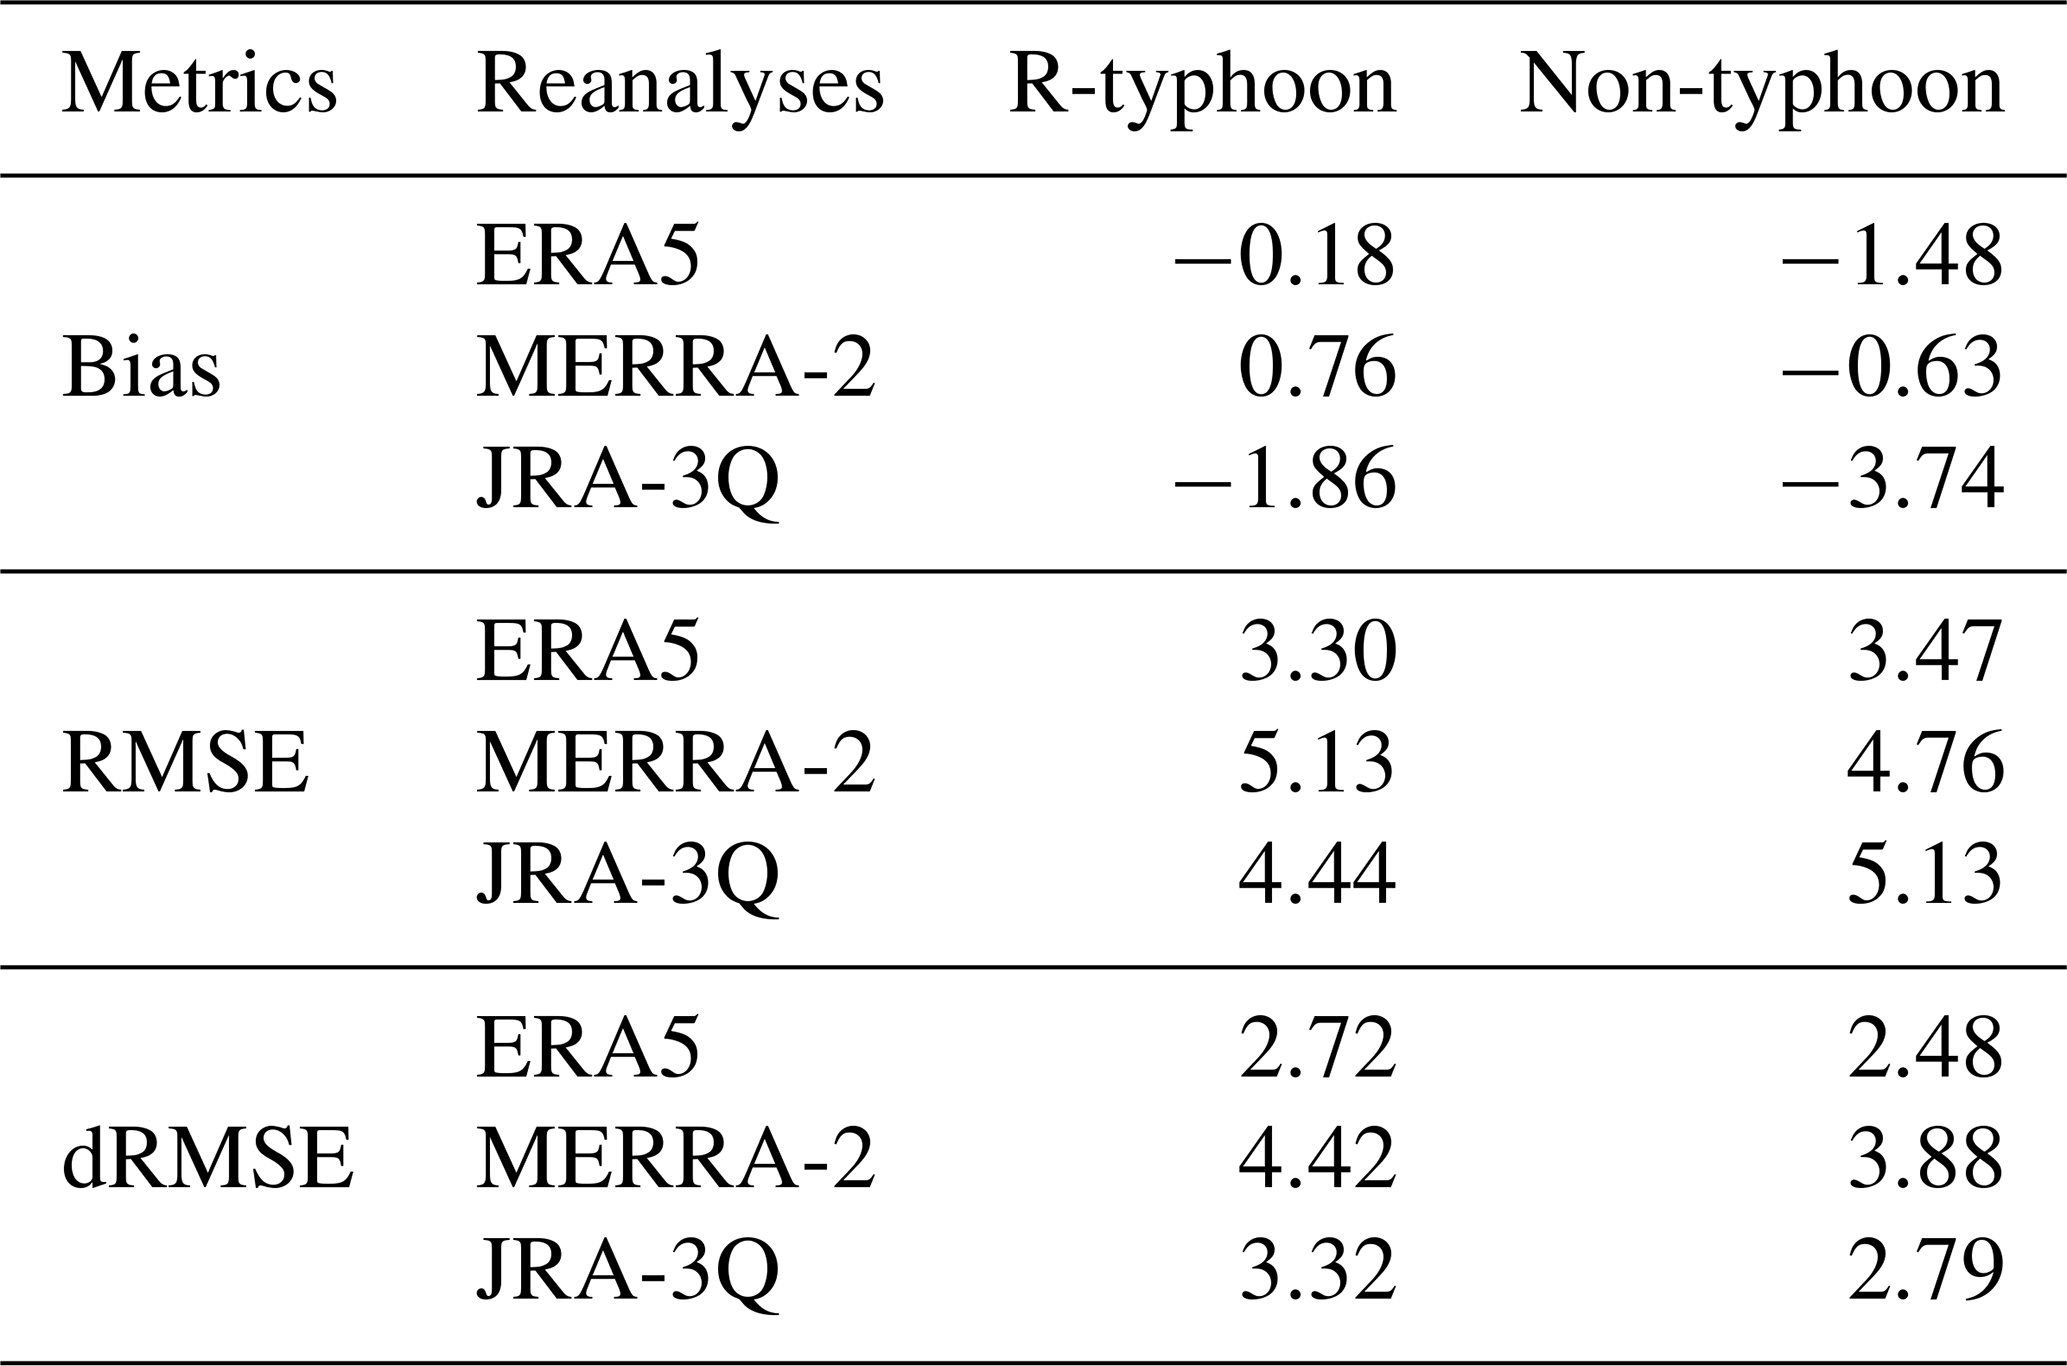
Based on the bias results in Table 2, E-bias and J-bias during r-typhoon period are both closer to zero than during non-typhoon periods, indicating reduced underestimation in E-PWV and J-PWV under typhoon conditions. Among the three reanalyses, E-bias is closest to zero. In contrast, M-bias is larger during r-typhoon period than during non-typhoon periods and changes sign from negative to positive. Even so, r-typhoon M-bias (0.76 mm) is smaller in absolute value than r-typhoon J-bias (−1.86 mm). During non-typhoon periods, all three reanalyses underestimate PWV (E-bias = −1.48 mm, M-bias = −0.63 mm, and J-bias = −3.74 mm), with MERRA-2 showing the smallest bias magnitude. During r-typhoon period, the underestimation in ERA5 and JRA-3Q is alleviated, whereas MERRA-2 shifts to a moderate overestimation.
The RMSE results further show that, relative to non-typhoon periods, E-RMSE and J-RMSE during r-typhoon period decrease by 0.17 and 0.69 mm, respectively, whereas M-RMSE increases by 0.37 mm. E-RMSE is also the smallest among the three reanalyses, indicating the lowest overall error for E-PWV during r-typhoon period, followed by J-PWV, while M-PWV shows comparatively larger uncertainty. Since RMSE reflects both systematic and random components of error, Table 2 also reports dRMSE to characterize the random component after removing the bias. The dRMSE results show that all three REA-dRMSEs are higher during r-typhoon period than during non-typhoon periods, indicating an overall increase in the random error component under typhoon conditions. Notably, for ERA5 and JRA-3Q in Table 2, RMSE decreases from non-typhoon periods to r-typhoon period while dRMSE increases, indicating that the lower RMSE during r-typhoon is mainly driven by a reduction in systematic bias, which offsets part of the increase in the random error component. Conversely, the larger RMSEs during non-typhoon periods are primarily associated with larger biases rather than larger random errors. Overall, Table 2 suggests improved performance for E-PWV and J-PWV during r-typhoon period, whereas MERRA-2 shows a sign change in bias and a modest increase in RMSE, although its bias magnitude remains smaller than that of JRA-3Q.
Figure 5 shows the spatial distributions of REA-biases, REA-RMSEs, and REA-dRMSEs at GNSS stations during r-typhoon period for all typhoons. For the biases (Fig. 5a, d, g), E-bias exhibits both positive and negative values across stations and is overall closer to zero. In contrast, M-bias is predominantly positive, whereas J-bias is dominated by negative values (Fig. 5d, g), consistent with the earlier finding that M-bias shifts from negative to positive during r-typhoon period. Stations with positive E-bias and M-bias show some spatial similarity and are relatively concentrated in southern and southeastern China, while positive J-bias occurs at only a few stations. For the RMSEs (Fig. 5b, e, h), E-RMSE is generally the smallest and shows a comparatively homogeneous spatial distribution (Fig. 5b). M-RMSE is relatively low over southern China but exceeds 6 mm at a few stations in southeastern China (Fig. 5e). J-RMSE falls between E-RMSE and M-RMSE overall (Fig. 5h), with isolated stations showing comparatively large values (e.g., ∼ 7.91 mm at GXHC), which may be related to the limited number of available stations–typhoon matchups, making the statistics more sensitive to individual events. For dRMSE (Fig. 5c, f, i), E-dRMSE remains the lowest, followed by J-dRMSE, whereas M-dRMSE is the largest and shows a latitudinal gradient, with larger values at higher latitudes. Notably, the difference between J-RMSE and J-dRMSE is comparatively pronounced (Fig. 5h, i), indicating a larger contribution of systematic bias to J-RMSE.
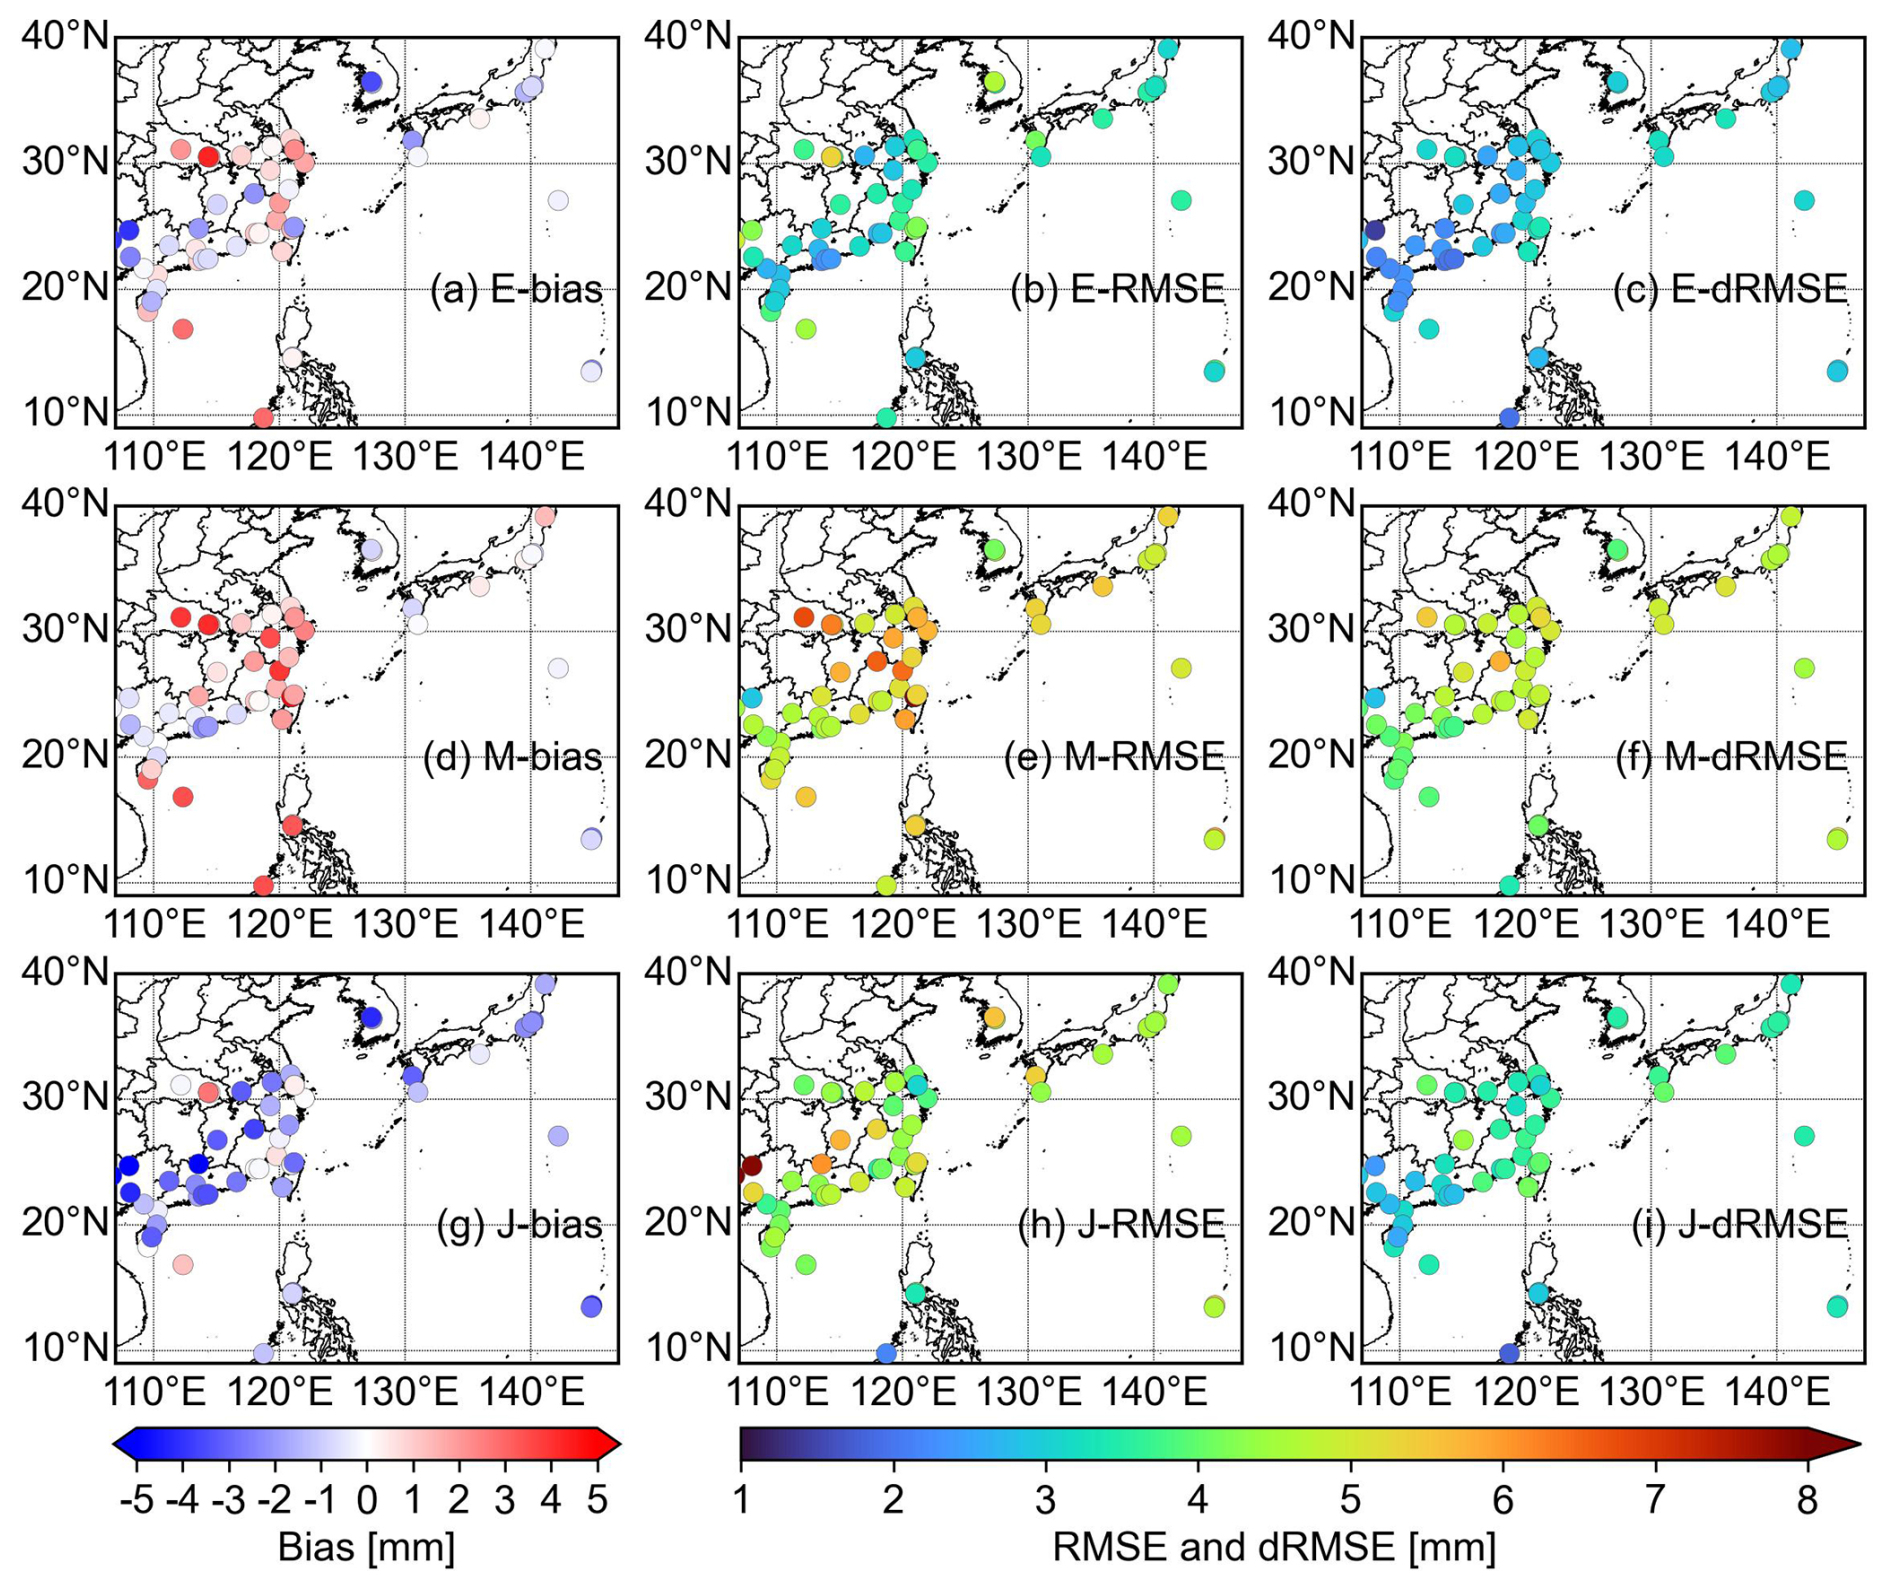
Figure 5Spatial distribution of mean REA-biases, REA-RMSEs, and REA-dRMSEs (in mm) at GNSS stations during r-typhoon period, aggregated over all typhoons.
3.2 Evaluation using radiosonde observations
Although all three reanalyses assimilate radiosonde observations, RS-PWV is still used as a reference because of its high accuracy, to further evaluate REA-PWVs. Figure 6 compares REA-PWVs against RS-PWV across different typhoon stages and categories, including the 3 d before r-typhoon (pre-typhoon, Fig. 6a), r-typhoon (r-typhoon, Fig. 6b), and the 3 d after r-typhoon (post-typhoon, Fig. 6c), as well as r-typhoon results for individual categories (Fig. 6d–h). Figure 6i provides the non-typhoon counterpart for comparison, and Fig. 6j–k summarizes the corresponding biases and RMSEs using bar charts. For convenience, E-r, M-r, and J-r denote the correlation coefficients (r) between RS-PWV and E-PWV, M-PWV, and J-PWV, respectively.
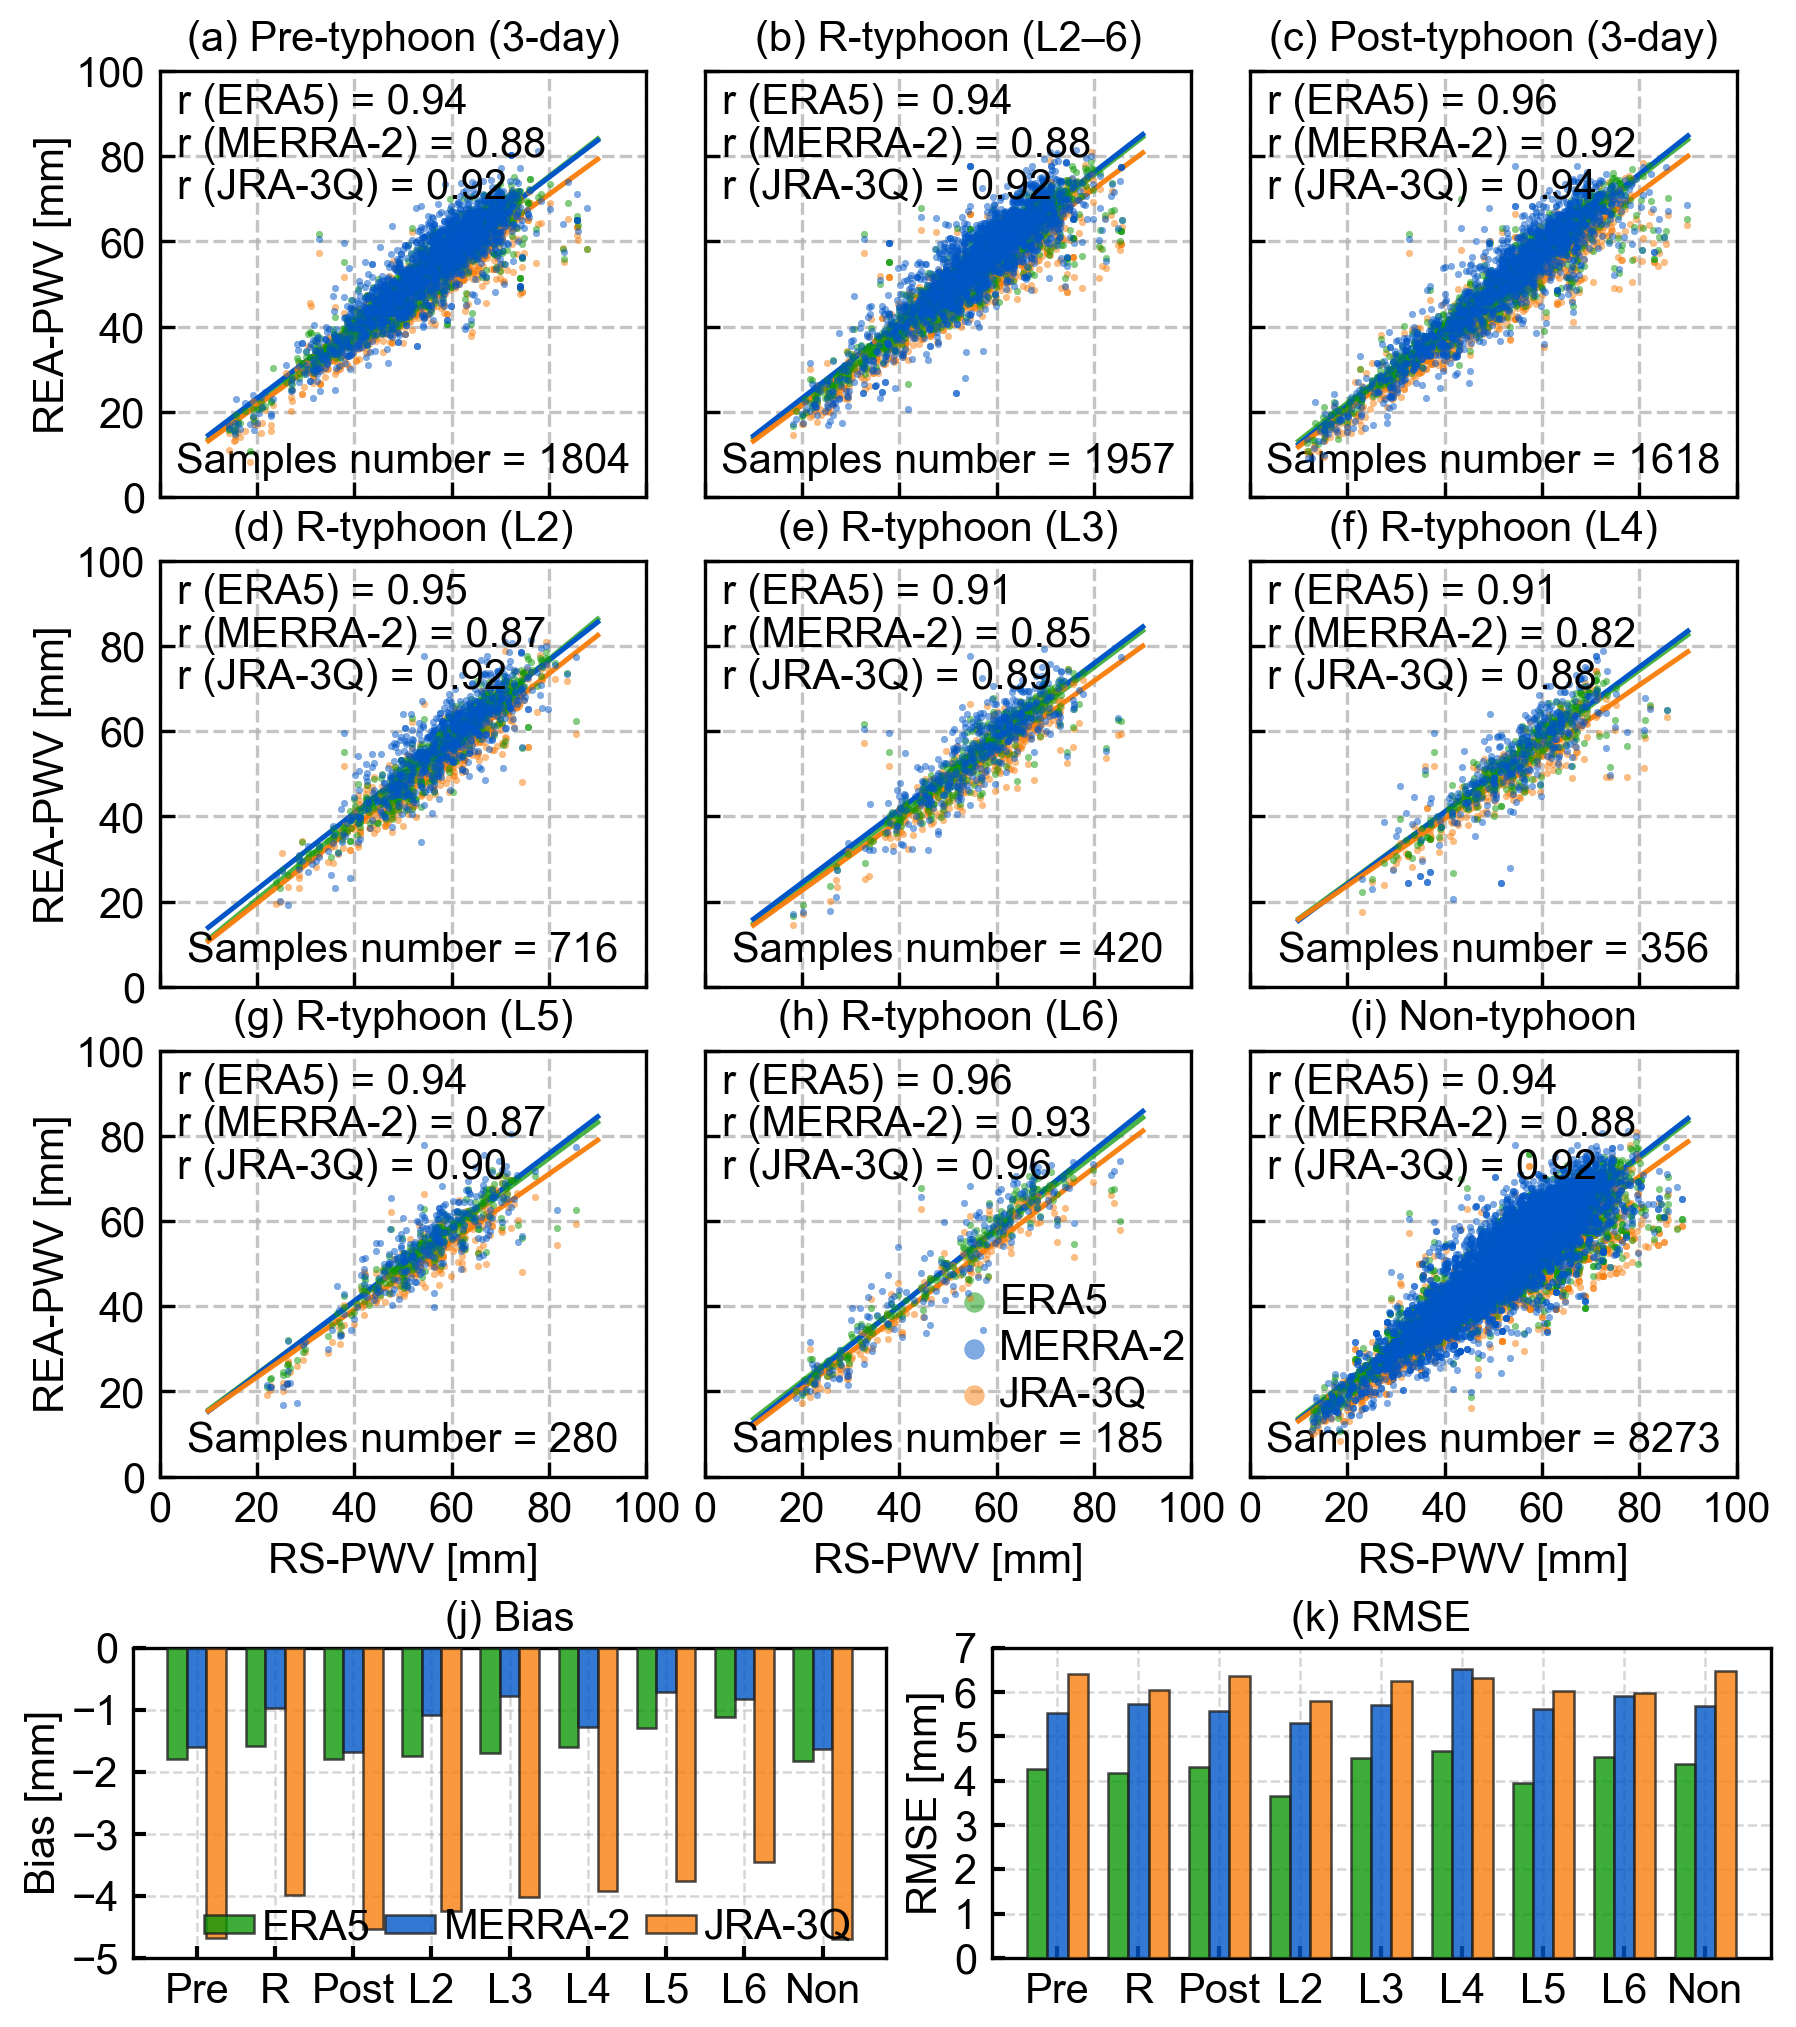
Figure 6Correlation statistics of REA-PWVs and RS-PWVs for (a) pre-typhoon period (3 d before r-typhoon), (b) r-typhoon period, (c) post-typhoon period (3 d after r-typhoon), (d–h) r-typhoon periods for different categories, and (i) non-typhoon periods. Panels (j) and (k) summarize the corresponding REA-biases and REA-RMSEs for panels (a)–(i). Correlation coefficient (r) and the number of samples are shown in each panel (a)–(i).
Comparing the three typhoon stages (Fig. 6a–c), E-r, M-r, and J-r are identical for pre-typhoon and r-typhoon periods, with E-r and J-r exceeding 0.9 and M-r equal to 0.88, consistent with the relatively larger M-RMSE during r-typhoon noted in Sect. 3.1. Correlations increase modestly in the post-typhoon period. For r-typhoon results stratified by typhoon category (Fig. 6d–h), all three correlations are higher for L2, L5, and L6 and lower for L3 and L4. Overall, E-r is the highest across categories and remains above 0.91; J-r is slightly lower and matches E-r during L6; M-r is generally the lowest but peaks during L6, reaching 0.93. Both J-r and M-r reach their minima during L4, at 0.82 and 0.88, respectively. When comparing the aggregated r-typhoon and non-typhoon results, E-r, M-r, and J-r are essentially the same, with values of 0.94, 0.88, and 0.92. To further quantify accuracy differences between r-typhoon and non-typhoon conditions, Table 3 reports the corresponding summary statistics, which align with the “R” and “Non” bar groups in Fig. 6j–k.
The conclusions drawn using RS-PWV as the reference are generally consistent with those based on GNSS-PWV. As shown in Table 3, during r-typhoon period, E-bias and J-bias are closer to zero than during non-typhoon period, decreasing by 0.30 and 0.78 mm, respectively. E-RMSE and J-RMSE are also smaller during r-typhoon period, with reductions of 0.21 and 0.51 mm. By contrast, M-RMSE is nearly unchanged between r-typhoon and non-typhoon periods, differing by only 0.02 mm. For dRMSE, M-dRMSE and J-dRMSE are slightly higher during r-typhoon period than during non-typhoon period, whereas E-dRMSE is slightly lower during r-typhoon period. It should be noted that the RS-PWV- and GNSS-PWV-based statistics do not always rank the three reanalyses in the same way. For example, during r-typhoon period, M-bias is the smallest among the three REA-biases. Such differences may be related to the relatively limited number of radiosonde observations and a smaller set of matched samples available for evaluation, which makes the statistics more sensitive to individual samples. Therefore, the results in this section are best interpreted as complementary that supports the GNSS-referenced evaluation.
Table 3Mean REA-bias, REA-RMSE, and REA-dRMSE (mm) during r-typhoon and non-typhoon periods at all radiosonde stations, aggregated over all typhoons.
3.3 Comparison with COSMIC-2 RO data
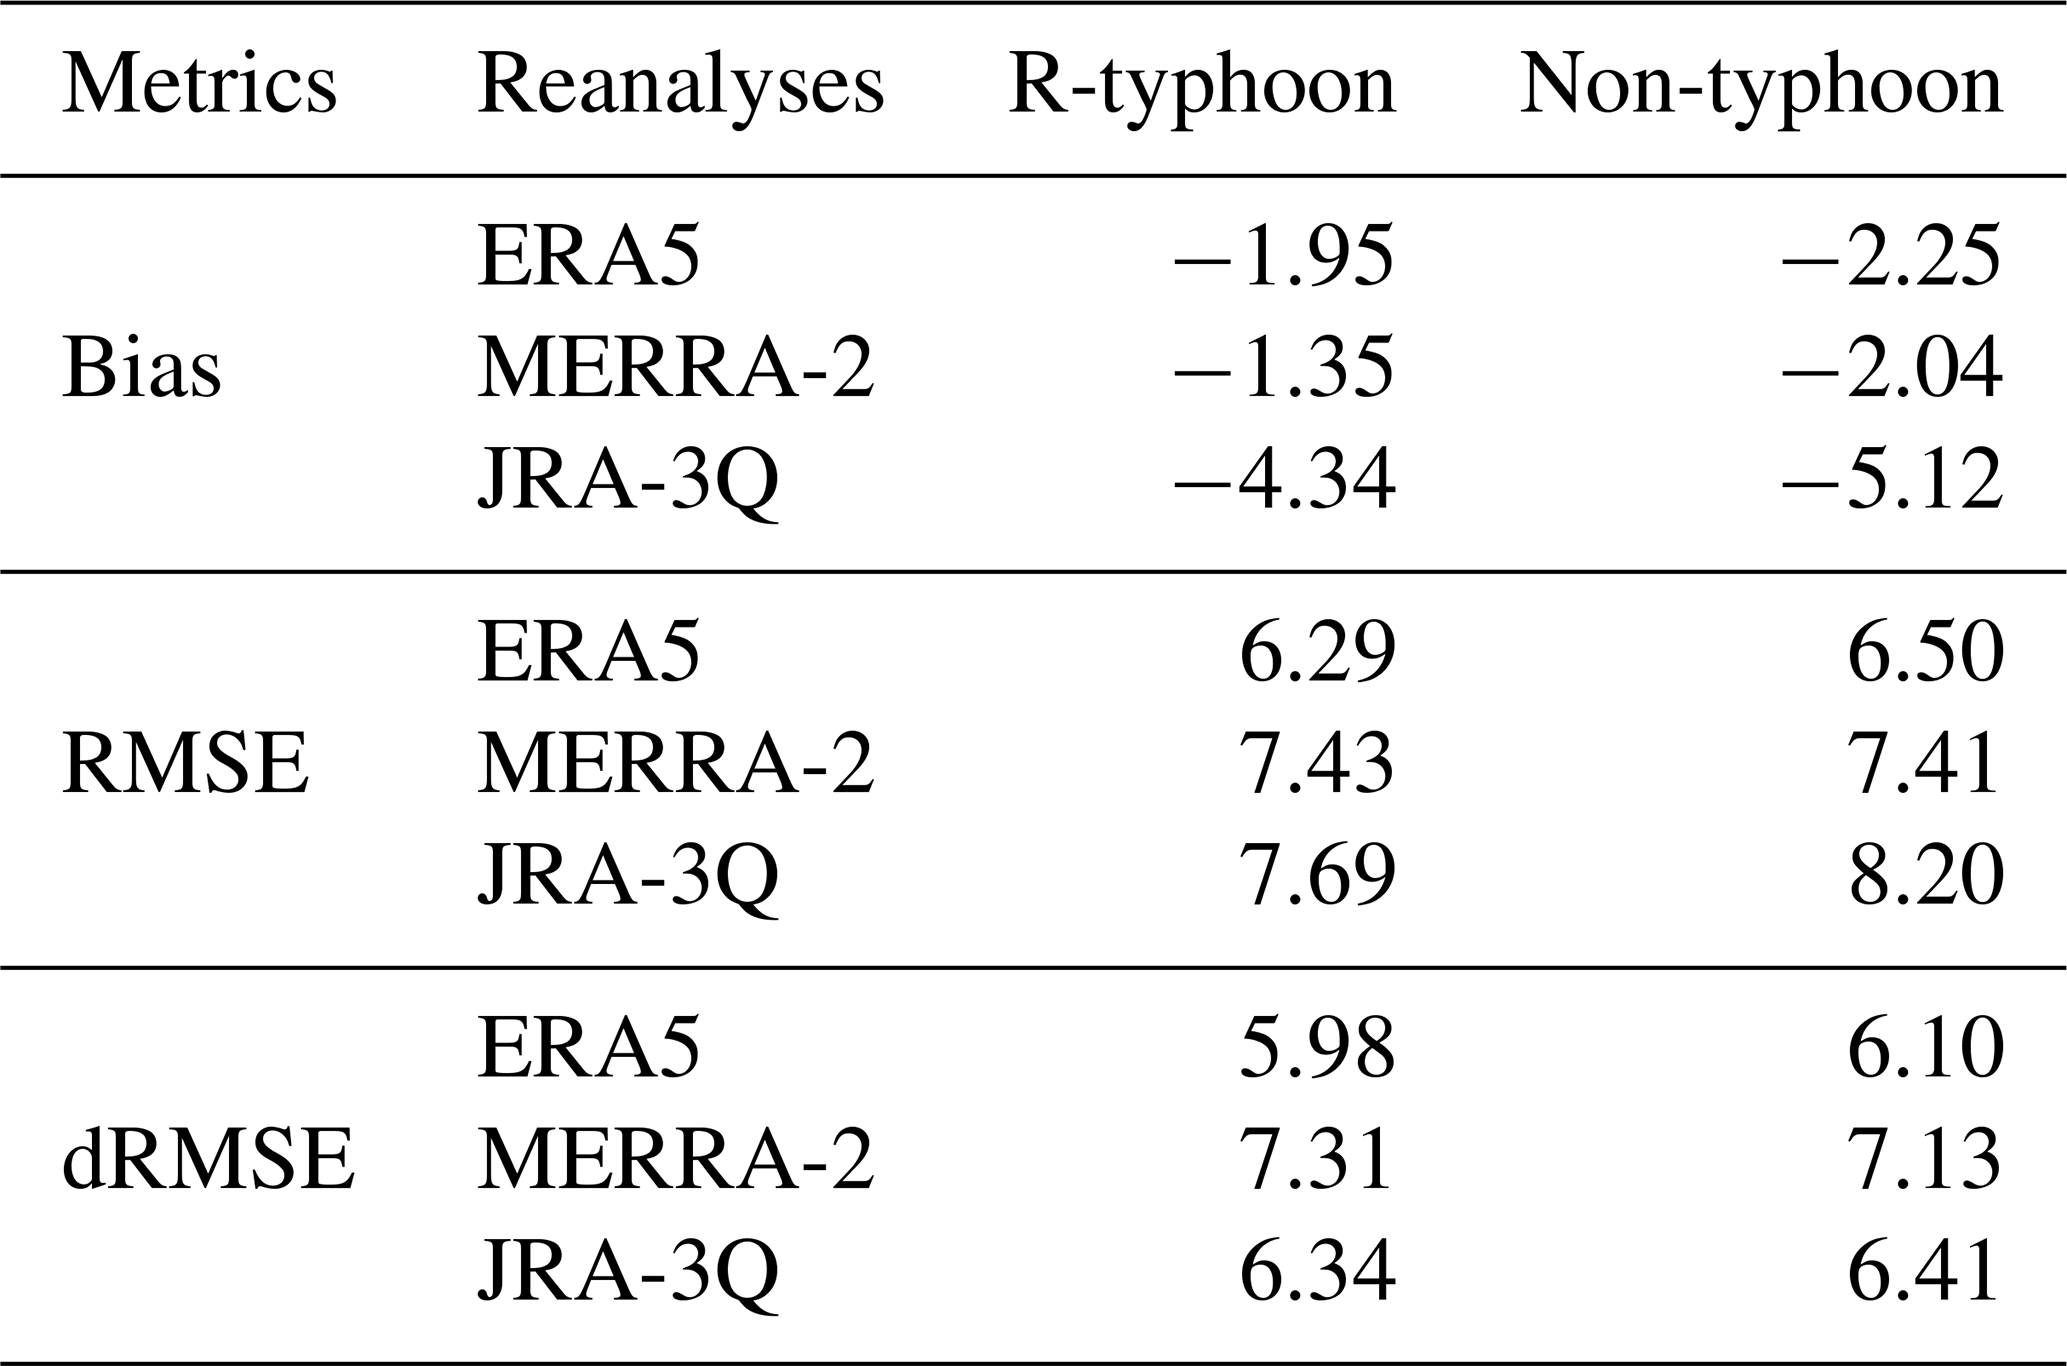
Evaluation using GNSS-PWV and RS-PWV as references is constrained by station locations, whereas RO-PWV can be used to compare REA-PWVs over the ocean. Based on the collocation scheme described in Sect. 2.6, 160 and 1299 COSMIC-2 RO profiles are collocated with typhoon centers during r-typhoon and non-typhoon periods, respectively, and these RO profiles are mainly distributed over the ocean. Given that only 160 samples are available during r-typhoon period, results stratified by typhoon category are not further reported in this section. Figure 7 shows the comparison results for (a) r-typhoon and (b) non-typhoon periods. During r-typhoon period, E-r, M-r, and J-r are 0.81, 0.77, and 0.80, respectively, which are lower than those during non-typhoon period by 0.09, 0.12, and 0.10. Table 4 further summarizes biases, RMSEs, and dRMSEs for r-typhoon and non-typhoon periods.
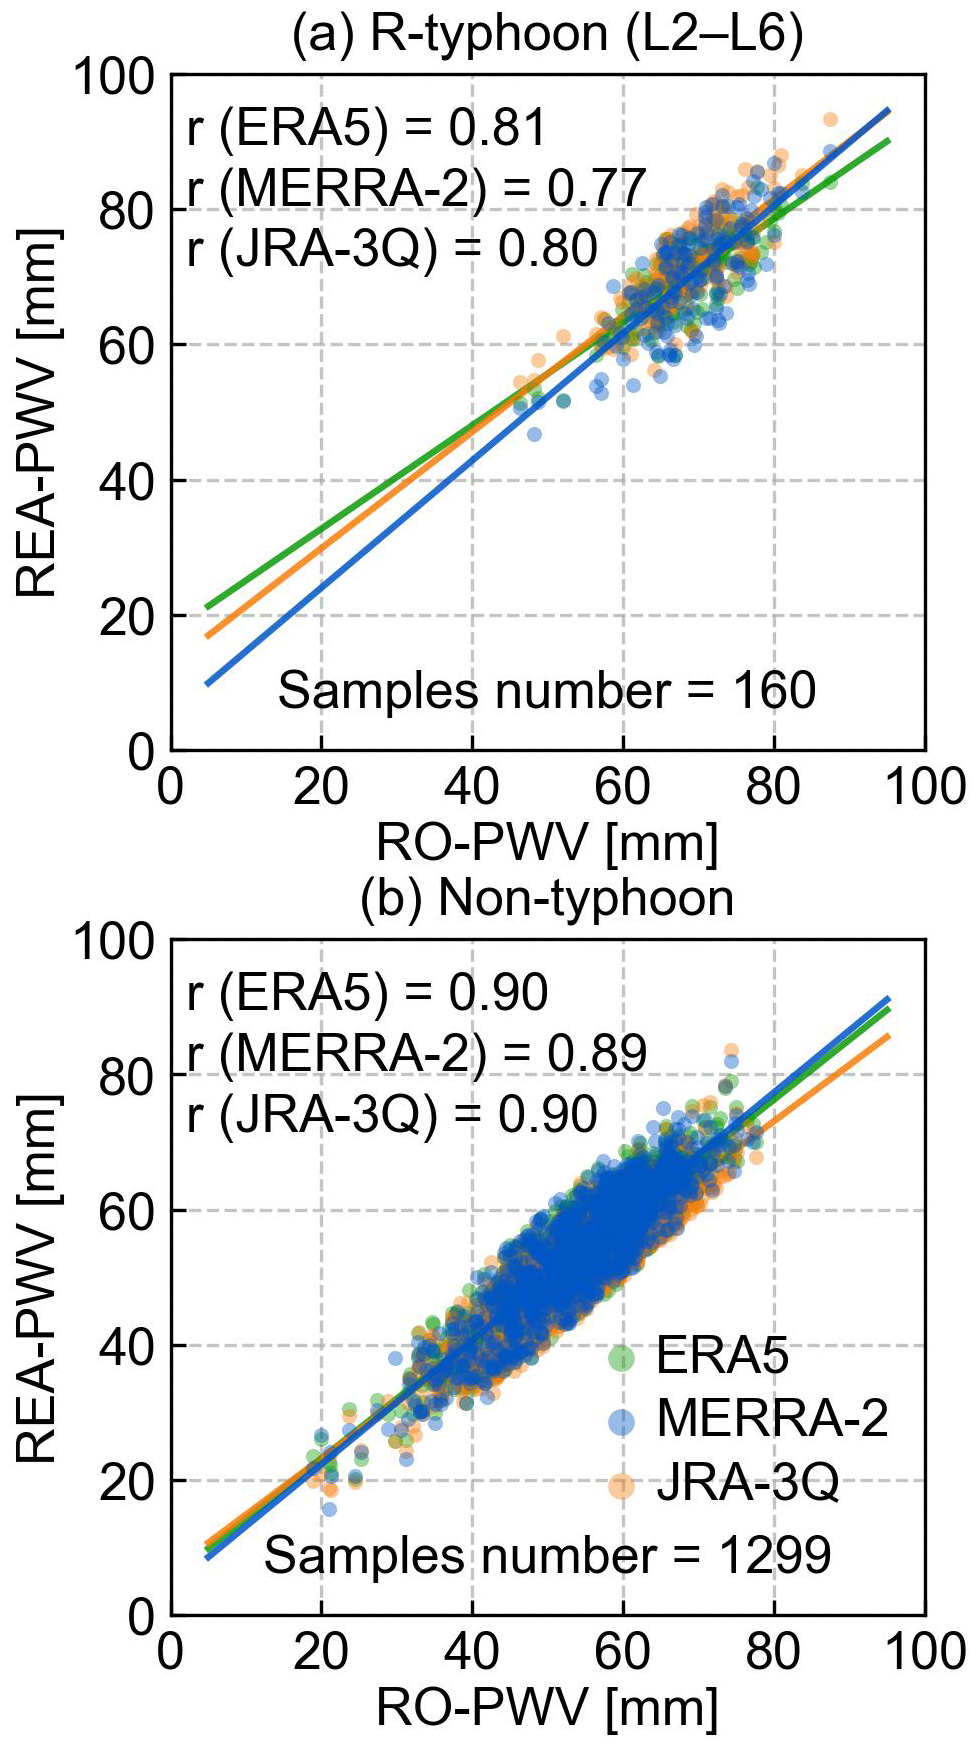
Figure 7Correlation statistics of REA-PWVs and RO-PWVs for (a) r-typhoon and (b) non-typhoon periods. Correlation coefficients (r) and the number of samples are shown in each panel.
Table 4Mean REA-bias, REA-RMSE, and REA-dRMSE (mm) during r-typhoon and non-typhoon periods when compared with RO-PWV, aggregated over all typhoons.

The error characteristics derived from comparisons with RO-PWV differ from those in the previous two sections, where GNSS-PWV and RS-PWV were used as references. During r-typhoon period, all three REA-biases are positive and are generally larger than those during non-typhoon period, indicating that the reanalyses tend to overestimate PWV relative to RO-PWV under typhoon conditions. Specifically, during r-typhoon period, E-bias and M-bias are 1.27 and 1.12 mm, respectively, are comparable, whereas J-bias exceeds 3 mm. The REA-RMSEs are also larger during r-typhoon period than during non-typhoon period, suggesting increased overall uncertainty. In particular, M-RMSE and J-RMSE are 5.17 and 5.25 mm, respectively, exceeding E-RMSE by 1.05 and 1.13 mm. For dRMSE, M-dRMSE and J-dRMSE increase during r-typhoon period relative to non-typhoon period, whereas E-dRMSE decreases slightly. Overall, across both periods, MERRA-2 shows the smallest bias, while ERA5 yields the lowest RMSE. It should be noted that although more than 4500 COSMIC-2 RO profiles are available per day in tropical and subtropical regions, the number of RO profiles used for comparison remains limited under the current collocation scheme. The differences between the RO-based results and those based on GNSS-PWV and RS-PWV may be related to the limited number of collocated samples and differences in land–ocean sampling, because most RO profiles used here are located over the ocean, whereas GNSS and radiosonde stations are mainly distributed over land. In addition, under typhoon influence, the water vapor field over the ocean tends to be more variable and spatially inhomogeneous, which may also contribute to larger discrepancies in this comparison.
3.4 Local spatial heterogeneity of REA-PWVs
NSD is used to characterize the local spatial heterogeneity of gridded REA-PWVs and thus reflects the consistency among neighboring grid points. Comparing NSD between typhoon and non-typhoon periods helps quantify the complexity of PWV spatial structure under typhoon conditions. Table 5 summarizes NSD-16 and NSD-4 for the three REA-PWVs during r-typhoon and non-typhoon periods across all typhoon events.
Table 5Mean NSD-16 and NSD-4 (mm) of three REA-PWVs during r-typhoon and non-typhoon periods over all typhoons.
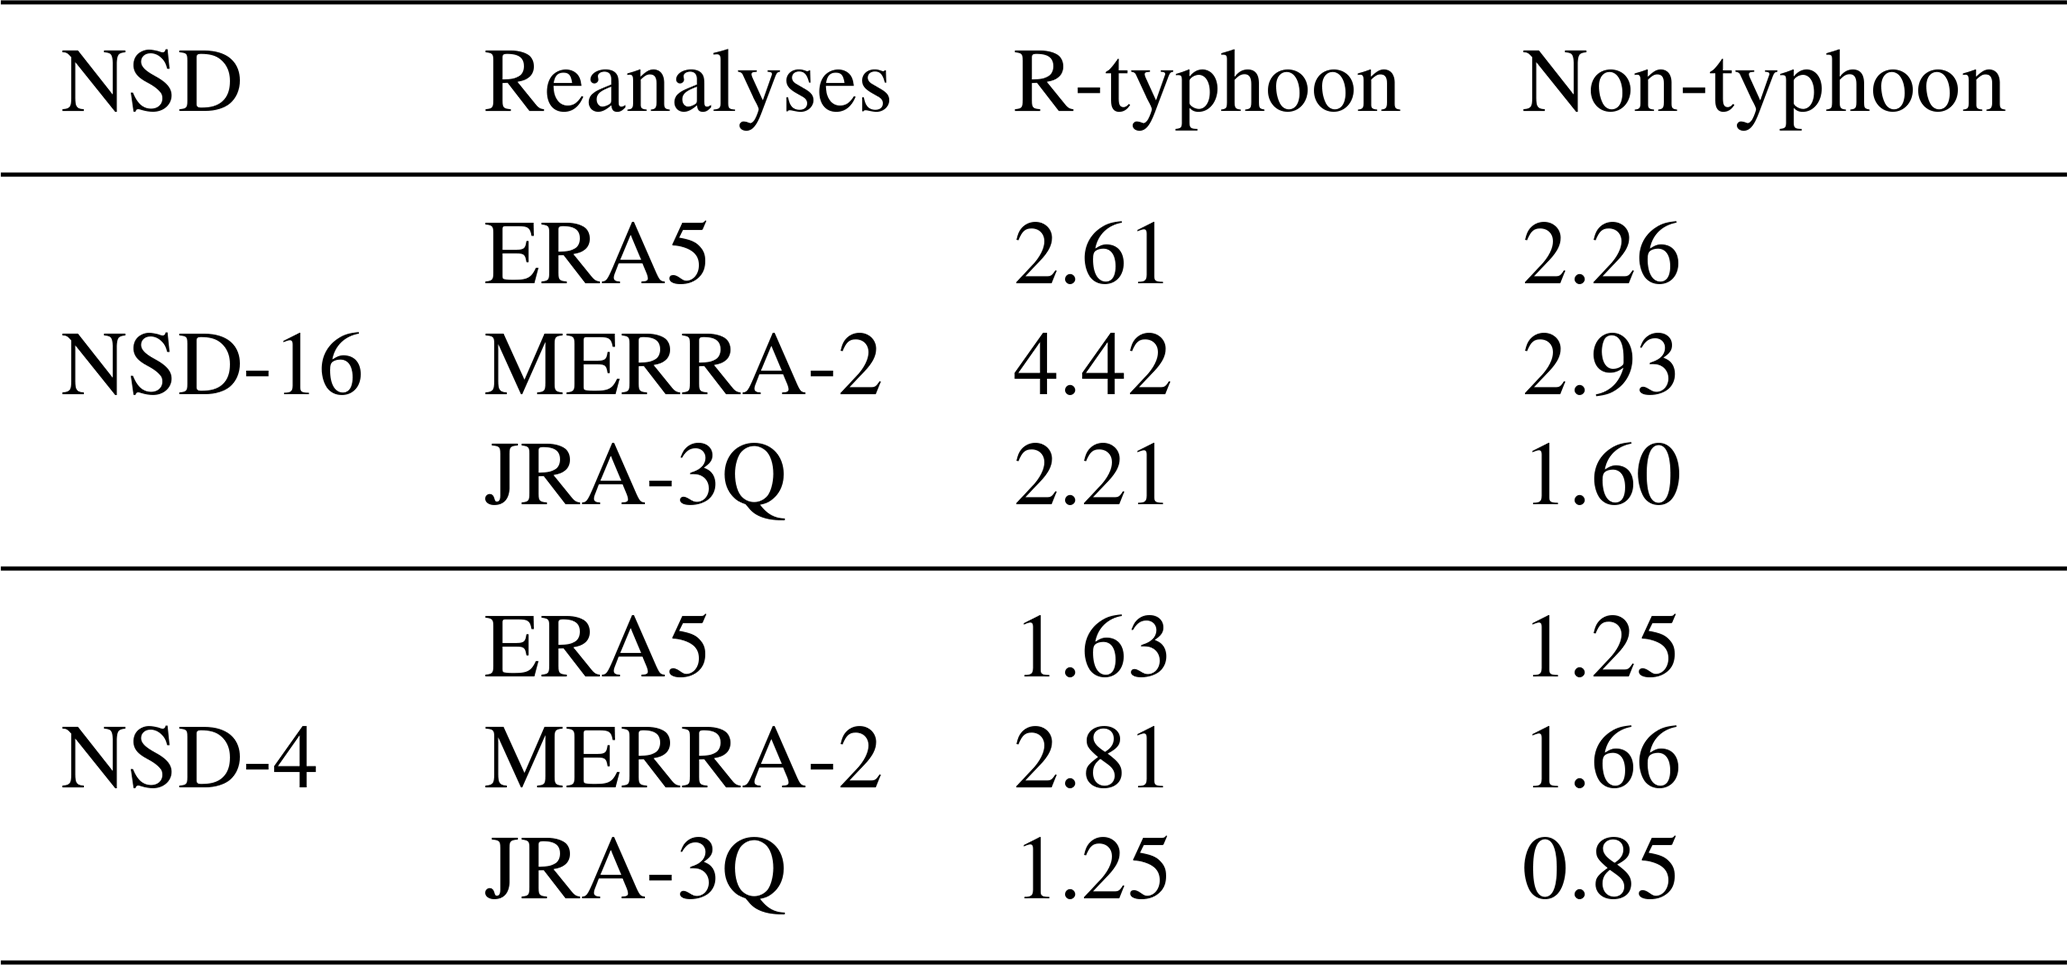
According to Table 5, NSD-16 is generally larger than NSD-4 because it spans a broader neighborhood and includes more grid points, indicating that spatial variability is larger when evaluated over a broader neighborhood. Relative to non-typhoon periods, NSD increases for all three reanalyses during r-typhoon period, suggesting a more complex local PWV structure and stronger spatial inhomogeneity under typhoon conditions. Specifically, E-NSD-16, M-NSD-16, and J-NSD-16 increase by 15.5 %, 50.9 %, and 38.1 %, respectively, while the corresponding increases for NSD-4 are larger, reaching 30.4 %, 69.3 %, and 47.1 %. The relative increase is larger for NSD-4 than for NSD-16, indicating that NSD changes more strongly when evaluated at a smaller neighborhood scale. Systematic differences are also evident among the reanalyses. MERRA-2 exhibits the largest NSD at both scales and the strongest increase from non-typhoon to r-typhoon, whereas ERA5 and JRA-3Q show lower NSD values and more moderate changes. It should be noted that NSD describes spatial variability of the local PWV field rather than PWV error itself. Therefore, higher NSD during r-typhoon period can be interpreted indicating stronger local spatial variability when comparing REA-PWVs.
This study presents a systematic evaluation of PWV during typhoons from the ERA5, MERRA-2, and JRA-3Q reanalyses using three independent observational references: ground-based GNSS, radiosonde, and COSMIC-2 RO data. A total of 113 typhoon events from January 2020 to December 2024 are analyzed. The evaluation focuses on contrasts between typhoon and non-typhoon periods in bias, RMSE, and dRMSE, and further examines dependence on typhoon category when sample sizes permit.
In the ground-based evaluations, GNSS provides higher temporal resolution and a larger sample size and is therefore used as the primary reference in this study. The radiosonde-based evaluation serves as an independent external check. Using GNSS-PWV as the reference, ERA5 shows the best overall performance under typhoon conditions, with the bias closest to zero and the lowest RMSE (−0.18 and 3.30 mm). M-bias lies between E-bias and J-bias, while M-RMSE is the largest among the three reanalyses. J-PWV exhibits a more pronounced negative bias, and J-RMSE falls between E-RMSE and M-RMSE. Relative to non-typhoon period, the absolute values of E-bias and J-bias decrease, indicating reduced mean systematic bias in E-PWV and J-PWV during typhoons. M-bias increases slightly but remains below 1 mm, suggesting that MERRA-2 maintains a bias level comparable to that in non-typhoon period. In terms of RMSE, E-RMSE and J-RMSE decrease by 0.17 and 0.69 mm during typhoon period, respectively. Together with the bias changes, this indicates an overall reduction in total error for E-PWV and J-PWV, whereas M-RMSE is higher during typhoon period than during non-typhoon period. By construction, dRMSE is no greater than RMSE, however, all three REA-dRMSEs are higher during typhoon period than during non-typhoon period, which may reflect more pronounced short-term variability of water vapor and a stronger random error component under typhoon conditions. Therefore, changes in REA-PWV performance during typhoons should be interpreted by jointly considering both systematic and random error components. When RS-PWV is used as the reference, the three REA-biases during typhoon period are overall closer to zero than those during non-typhoon period, with M-bias being the smallest, followed by E-bias, while J-bias remains relatively pronounced. For RMSE, E-RMSE and J-RMSE are lower during typhoon period than during non-typhoon period, whereas M-RMSE is broadly comparable between the two periods.
Using RO-PWV as the reference yields patterns that are not fully consistent with the ground-based evaluations. Under typhoon conditions, the three REA-biases are positive overall, and both their absolute values and RMSEs are larger than those under non-typhoon conditions. This indicates that, for the RO collocations available in this study, REA-PWVs tend to overestimate PWV relative to RO-PWV. This contrast does not contradict the GNSS-based and radiosonde-based conclusions because the RO collocations are concentrated over oceanic regions, introducing a clear land–ocean sampling difference relative to the samples used in the ground-based evaluations. Moreover, under the relatively strict collocation scheme, only 160 collocated samples are available under typhoon conditions, making the statistics more sensitive to sample composition. In terms of inter-product comparison, E-bias and M-bias are comparable under typhoon conditions, with M-bias lower by 0.15 mm, whereas J-bias is larger. For RMSE, E-RMSE is the lowest and is 1.05 mm lower than M-RMSE, while J-RMSE is the largest. Overall, these results continue to indicate the relatively robust performance of ERA5. In addition, the NSD results show enhanced local spatial variability in REA-PWV under typhoon conditions, reflecting a more complex spatial structure of the water vapor field during typhoons.
Consistent evidence from three independent references suggests that the reanalyses can provide continuous PWV information that is practically useful and reasonably reliable under typhoon conditions. Overall, ERA5 shows more consistent performance and lower error levels. JRA-3Q improves relative to non-typhoon conditions in most cases, although a systematic bias can remain in some situations. MERRA-2 tends to maintain a bias close to zero, but its uncertainty becomes more pronounced under typhoon conditions, consistent with its higher NSD and its larger increases in RMSE and NSD from non-typhoon to typhoon conditions.
This study supports the reliability and applicability of reanalysis-derived PWV under typhoon conditions and provides continuous water vapor information for typhoon monitoring and process-based analyses. It also provides a performance reference for reanalysis PWV under typhoon weather. Over oceanic regions where ground-based observations are sparse, reanalysis PWV can serve as an important reference for PWV retrieved from other technologies, facilitating product evaluation and bias diagnosis. This reference can also provide contextual information for interpreting discrepancies among different observations under typhoon conditions, thereby improving the interpretability and utility of oceanic PWV estimates in both scientific research and operational applications related to typhoons.
Typhoon data are provided by IBTrACS (https://www.ncei.noaa.gov/products/international-best-track-archive, last access: 1 April 2026), ERA5 hourly data on pressure levels is provided by ECMWF (https://cds.climate.copernicus.eu/datasets/reanalysis-era5-pressure-levels, last access: 1 April 2026). MERRA-2 M2I3NVASM data is provided by GMAO (https://disc.gsfc.nasa.gov/datasets/M2I3NVASM_5.12.4/summary?keywords=M2I3NVASM, last access: 1 April 2026). JRA-3Q isobaric analysis fields data is provided by JMA (https://rda.ucar.edu/datasets/d640000, last access: 1 April 2026). GNSS tropospheric products and observations are provided by IGS (https://cddis.nasa.gov/archive/gnss/products/troposphere/zpd, last access: 1 April 2026) and CMONOC (data are available upon request and downloaded after approval). Radiosonde data is provided by IGRA (https://www.ncei.noaa.gov/data/igra, last access: 1 April 2026). COSMIC-2 RO wet profiles are provided by UCAR (https://data.cosmic.ucar.edu/gnss-ro/cosmic2, last access: 1 April 2026.).
Conceptualization was carried out by JS. Data curation was performed by JS, JH, and YF. Methodology was developed by JS, MZ, and YF, with validation provided by JS and WG. Visualization was carried out by JS and JH. Formal analysis was contributed by AKS, MZ, and WG. Software support was provided by ML. Investigation was conducted by JS. Supervision was provided by ML and AKS. Writing – original draft was prepared by JS, and writing – review and editing was contributed by ML, AKS, SS, and KZ. Funding acquisition was secured by ML. All authors discussed the results, contributed to the manuscript revision, and agreed to the final version of the paper.
The contact author has declared that none of the authors has any competing interests.
Publisher's note: Copernicus Publications remains neutral with regard to jurisdictional claims made in the text, published maps, institutional affiliations, or any other geographical representation in this paper. The authors bear the ultimate responsibility for providing appropriate place names. Views expressed in the text are those of the authors and do not necessarily reflect the views of the publisher.
This article is part of the special issue “The SPARC Reanalysis Intercomparison Project (S-RIP) Phase 2 (ACP/WCD inter-journal SI)”. It is not associated with a conference.
This research was partially supported by the Special Scholarship for Graduate Students' Overseas (Outbound) Exchange Program of Wuhan University. Part of the work was carried out during my research stay at the Wegener Center for Climate and Global Change, University of Graz, Austria. The authors gratefully acknowledge the data support from China Earthquake Networks Center, Crustal Movement Observation Network of China. The authors would also like to thank Dr. Fan Si from Physikalisches Institut der Ruprecht-Karls-Universität Heidelberg, Germany, Dr. Junyi Gao from the University of Edinburgh, UK, and Junyi Han from the Eberhard Karls Universität Tübingen, Germany, for their help. In addition, all authors of this paper would like to thank Handling Editor Dr. Gabriele Stiller, the two anonymous referees, and all editors who contributed to the processing of this paper.
This study is supported by the Natural Science Foundation of Hubei Province, China (grant no. 2025AFA038) and the National Natural Science Foundation of China (grant nos. 42474032, 42030109, 41931075, and 42004020).
This paper was edited by Gabriele Stiller and reviewed by two anonymous referees.
Bell, B., Hersbach, H., Simmons, A., Berrisford, P., Dahlgren, P., Horányi, A., Muñoz-Sabater, J., Nicolas, J., Radu, R., Schepers, D., Soci, C., Villaume, S., Bidlot, J., Haimberger, L., Woollen, J., Buontempo, C., and Thépaut, J.: The ERA5 global reanalysis: Preliminary extension to 1950, Q. J. Roy. Meteorol. Soc., 147, 4186–4227, https://doi.org/10.1002/qj.4174, 2021.
Bevis, M., Businger, S., Herring, T. A., Rocken, C., Anthes, R. A., and Ware, R. H.: GPS meteorology: Remote sensing of atmospheric water vapor using the global positioning system, J. Geophys. Res.-Atmos., 97, 15787–15801, https://doi.org/10.1029/92JD01517, 1992.
Bevis, M., Businger, S., Chiswell, S., Herring, T. A., Anthes, R. A., Rocken, C., and Ware, R. H.: GPS meteorology: Mapping zenith wet delays onto precipitable water, J. Appl. Meteorol. Clim., 33, 379–386, https://doi.org/10.1175/1520-0450(1994)033<0379:GMMZWD>2.0.CO;2, 1994.
Bock, O. and Parracho, A. C.: Consistency and representativeness of integrated water vapour from ground-based GPS observations and ERA-Interim reanalysis, Atmos. Chem. Phys., 19, 9453–9468, https://doi.org/10.5194/acp-19-9453-2019, 2019.
Chan, F. K. S., Chuah, C. J., Ziegler, A. D., Dąbrowski, M., and Varis, O.: Towards resilient flood risk management for Asian coastal cities: Lessons learned from Hong Kong and Singapore, J. Cleaner Prod., 187, 576–589, https://doi.org/10.1016/j.jclepro.2018.03.217, 2018.
Cogan, J., Gratchev, I., and Wang, G.: Rainfall-induced shallow landslides caused by ex-Tropical Cyclone Debbie, 31st March 2017, Landslides, 15, 1215–1221, https://doi.org/10.1007/s10346-018-0982-4, 2018.
Davis, J. L., Herring, T. A., Shapiro, I. I., Rogers, A. E. E., and Elgered, G.: Geodesy by radio interferometry: Effects of atmospheric modeling errors on estimates of baseline length, Radio Sci., 20, 1593–1607, https://doi.org/10.1029/rs020i006p01593, 1985.
Duan, Y., Chen, L., Liang, J., Wang, Y., Wu, L., Cui, X., Ma, L., and Li, Q.: Research progress in the unusual variations of typhoons before and after landfalling, Acta Meteor. Sin., 72, 969–986, https://doi.org/10.11676/qxxb2014.085, 2014.
Elgered, G., Davis, J. L., Herring, T. A., and Shapiro, I. I.: Geodesy by radio interferometry: Water vapor radiometry for estimation of the wet delay, J. Geophys. Res.-Sol. Ea., 96, 6541–6555, https://doi.org/10.1029/90jb00834, 1991.
Elsner, J. B.: Continued increases in the intensity of strong tropical cyclones, Bull. Am. Meteorol. Soc., 101, E1301–E1303, https://doi.org/10.1175/BAMS-D-19-0338.1, 2020.
Emanuel, K.: Increasing destructiveness of tropical cyclones over the past 30 years, Nature, 436, 686–688, https://doi.org/10.1038/nature03906, 2005.
Esteban, M. and Longarte-Galnares, G.: Evaluation of the productivity decrease risk due to a future increase in tropical cyclone intensity in Japan: productivity decrease due to tropical cyclones, Risk Anal., 30, 1789–1802, https://doi.org/10.1111/j.1539-6924.2010.01483.x, 2010.
Gahtan, J., Knapp, K. R., Schreck, C. J. I., Diamond, H. J., Kossin, J. P., and Kruk, M. C.: International Best Track Archive for Climate Stewardship (IBTrACS) project, version 4.01 (Version 4r01), https://doi.org/10.25921/82ty-9e16, 2024.
Gelaro, R., McCarty, W., Suárez, M. J., Todling, R., Molod, A., Takacs, L., Randles, C. A., Darmenov, A., Bosilovich, M. G., Reichle, R., Wargan, K., Coy, L., Cullather, R., Draper, C., Akella, S., Buchard, V., Conaty, A., Da Silva, A. M., Gu, W., Kim, G.-K., Koster, R., Lucchesi, R., Merkova, D., Nielsen, J. E., Partyka, G., Pawson, S., Putman, W., Rienecker, M., Schubert, S. D., Sienkiewicz, M., and Zhao, B.: The modern-era retrospective analysis for research and applications, version 2 (MERRA-2), J. Climate, 30, 5419–5454, https://doi.org/10.1175/JCLI-D-16-0758.1, 2017.
Gui, K., Che, H., Chen, Q., Zeng, Z., Liu, H., Wang, Y., Zheng, Y., Sun, T., Liao, T., Wang, H., and Zhang, X.: Evaluation of radiosonde, MODIS-NIR-Clear, and AERONET precipitable water vapor using IGS ground-based GPS measurements over China, Atmos. Res., 197, 461–473, https://doi.org/10.1016/j.atmosres.2017.07.021, 2017.
Hersbach, H., Bell, B., Berrisford, P., Hirahara, S., Horányi, A., Muñoz-Sabater, J., Nicolas, J., Peubey, C., Radu, R., Schepers, D., Simmons, A., Soci, C., Abdalla, S., Abellan, X., Balsamo, G., Bechtold, P., Biavati, G., Bidlot, J., Bonavita, M., De Chiara, G., Dahlgren, P., Dee, D., Diamantakis, M., Dragani, R., Flemming, J., Forbes, R., Fuentes, M., Geer, A., Haimberger, L., Healy, S., Hogan, R. J., Hólm, E., Janisková, M., Keeley, S., Laloyaux, P., Lopez, P., Lupu, C., Radnoti, G., De Rosnay, P., Rozum, I., Vamborg, F., Villaume, S., and Thépaut, J.: The ERA5 global reanalysis, Q. J. Roy. Meteorol. Soc., 146, 1999–2049, https://doi.org/10.1002/qj.3803, 2020.
Holloway, C. E. and Neelin, J. D.: Moisture vertical structure, column water vapor, and tropical deep convection, J. Atmos. Sci., 66, 1665–1683, https://doi.org/10.1175/2008JAS2806.1, 2009.
Ichoku, C., Levy, R., Kaufman, Y. J., Remer, L. A., Li, R., Martins, V. J., Holben, B. N., Abuhassan, N., Slutsker, I., Eck, T. F., and Pietras, C.: Analysis of the performance characteristics of the five-channel Microtops II Sun photometer for measuring aerosol optical thickness and precipitable water vapor, J. Geophys. Res.-Atmos., 107, 4179, https://doi.org/10.1029/2001jd001302, 2002.
Johnston, B. R., Randel, W. J., and Sjoberg, J. P.: Evaluation of tropospheric moisture characteristics among COSMIC-2, ERA5 and MERRA-2 in the tropics and subtropics, Remote Sens., 13, 880, https://doi.org/10.3390/rs13050880, 2021.
Jung, K., Kam, J., and Lee, S.: Tropical cyclone risk assessment reflecting the climate change trend: the case of South Korea, Nat. Hazards, 120, 5841–5867, https://doi.org/10.1007/s11069-024-06428-0, 2024.
King, M. D., Menzel, W. P., Kaufman, Y. J., Tanre, D., Bo-Cai Gao, Platnick, S., Ackerman, S. A., Remer, L. A., Pincus, R., and Hubanks, P. A.: Cloud and aerosol properties, precipitable water, and profiles of temperature and water vapor from MODIS, IEEE Trans. Geosci. Remote Sens., 41, 442–458, https://doi.org/10.1109/tgrs.2002.808226, 2003.
Knapp, K. R., Kruk, M. C., Levinson, D. H., Diamond, H. J., and Neumann, C. J.: The International Best Track Archive for Climate Stewardship (IBTrACS): Unifying tropical cyclone data, Bull. Am. Meteorol. Soc., 91, 363–376, https://doi.org/10.1175/2009BAMS2755.1, 2010.
Knutson, T., Camargo, S. J., Chan, J. C. L., Emanuel, K., Ho, C.-H., Kossin, J., Mohapatra, M., Satoh, M., Sugi, M., Walsh, K., and Wu, L.: Tropical cyclones and climate change assessment: Part II: Projected response to anthropogenic warming, Bull. Am. Meteorol. Soc., 101, E303–E322, https://doi.org/10.1175/BAMS-D-18-0194.1, 2020.
Kosaka, Y., Kobayashi, S., Harada, Y., Kobayashi, C., Naoe, H., Yoshimoto, K., Harada, M., Goto, N., Chiba, J., Miyaoka, K., Sekiguchi, R., Deushi, M., Kamahori, H., Nakaegawa, T., Tanaka, T. Y., Tokuhiro, T., Sato, Y., Matsushita, Y., and Onogi, K.: The JRA-3Q reanalysis, J. Meteor. Soc. Japan, 102, 49–109, https://doi.org/10.2151/jmsj.2024-004, 2024.
Kossin, J. P.: A global slowdown of tropical-cyclone translation speed, Nature, 558, 104–107, https://doi.org/10.1038/s41586-018-0158-3, 2018.
Kursinski, E. R., Hajj, G. A., Bertiger, W. I., Leroy, S. S., Meehan, T. K., Romans, L. J., Schofield, J. T., McCleese, D. J., Melbourne, W. G., Thornton, C. L., Yunck, T. P., Eyre, J. R., and Nagatani, R. N.: Initial results of radio occultation observations of Earth's atmosphere using the Global Positioning System, Science, 271, 1107–1110, https://doi.org/10.1126/science.271.5252.1107, 1996.
Li, M., Li, W., Shi, C., Jiang, K., Guo, X., Dai, X., Meng, X., Yang, Z., Yang, G., and Liao, M.: Precise orbit determination of the Fengyun-3C satellite using onboard GPS and BDS observations, J. Geodesy, 91, 1313–1327, https://doi.org/10.1007/s00190-017-1027-9, 2017.
Li, W., Yao, Y., Zhang, L., Peng, W., Du, Z., Zuo, Y., and Wang, W.: Evaluating global precipitable water vapor products from four public reanalysis using radiosonde data, Geod. Geodyn., 16, 693–705, https://doi.org/10.1016/j.geog.2025.02.007, 2025.
Li, Z., Muller, J., and Cross, P.: Comparison of precipitable water vapor derived from radiosonde, GPS, and moderate-resolution imaging spectroradiometer measurements, J. Geophys. Res.-Atmos., 108, 2003JD003372, https://doi.org/10.1029/2003JD003372, 2003.
Melbourne, W. G., Davis, E. S., Duncan, C. B., Hajj, G. A., Hardy, K. R., Kursinski, E. R., Meehan, T. K., Young, L. E., and Yunck, T. P.: The application of spaceborne GPS to atmospheric limb sounding and global change monitoring, JPL Publication 94-18, Jet Propulsion Lab, Pasadena, CA, USA, 147, 1994.
Muller, C. J., Back, L. E., O'Gorman, P. A., and Emanuel, K. A.: A model for the relationship between tropical precipitation and column water vapor, Geophys. Res. Lett., 36, L16804, https://doi.org/10.1029/2009GL039667, 2009.
Pérez-Ramírez, D., Whiteman, D. N., Smirnov, A., Lyamani, H., Holben, B. N., Pinker, R., Andrade, M., and Alados-Arboledas, L.: Evaluation of AERONET precipitable water vapor versus microwave radiometry, GPS, and radiosondes at ARM sites, J. Geophys. Res.-Atmos., 119, 9596–9613, https://doi.org/10.1002/2014jd021730, 2014.
Rani, S. and Singh, J.: Evaluation of MODIS, ERA5, and MERRA2 derived integrated precipitable water vapor of India using ground-based GPS data, Ann. Am. Assoc. Geogr., 115, 1506–1531, https://doi.org/10.1080/24694452.2025.2493823, 2025.
Saastamoinen, J.: Atmospheric correction for the troposphere and stratosphere in radio ranging satellites, in: The Use of Artificial Satellites for Geodesy, 247–251, https://doi.org/10.1029/GM015p0247, 1972.
Schneider, T., O'Gorman, P. A., and Levine, X. J.: Water vapor and the dynamics of climate changes, Rev. Geophys., 48, RG3001, https://doi.org/10.1029/2009rg000302, 2010.
Schreiner, W. S., Weiss, J. P., Anthes, R. A., Braun, J., Chu, V., Fong, J., Hunt, D., Kuo, Y. -H., Meehan, T., Serafino, W., Sjoberg, J., Sokolovskiy, S., Talaat, E., Wee, T. K., and Zeng, Z.: COSMIC-2 radio occultation constellation: First results, Geophys. Res. Lett., 47, e2019GL086841, https://doi.org/10.1029/2019gl086841, 2020.
Sherwood, S. C., Roca, R., Weckwerth, T. M., and Andronova, N. G.: Tropospheric water vapor, convection, and climate, Rev. Geophys., 48, RG2001, https://doi.org/10.1029/2009rg000301, 2010.
Shi, C., Zhao, Q., Geng, J., Lou, Y., Ge, M., and Liu, J.: Recent development of PANDA software in GNSS data processing, in: Proceedings of Society of Photo-Optical Instrumentation Engineers (SPIE) 7285, International Conference on Earth Observation Data Processing and Analysis (ICEODPA), 72851S, https://doi.org/10.1117/12.816261, 2008.
Shi, C., Zhou, L., Fan, L., Zhang, W., Cao, Y., Wang, C., Xiao, F., Lv, G., and Liang, H.: Analysis of “21⋅7” extreme rainstorm process in Henan Province using BeiDou/GNSS observation, China J. Geophys., 65, 186–196, https://doi.org/10.6038/cjg2022P0706, 2022.
Shi, J., Zhang, K., Wu, S., Shi, S., and Shen, Z.: Investigation of the atmospheric boundary layer height using radio occultation: a case study during twelve super typhoons over the northwest Pacific, Atmosphere, 12, 1457, https://doi.org/10.3390/atmos12111457, 2021.
Shi, J., Li, M., Steiner, A. K., Li, W., Zhang, M., Fan, Y., Gao, W., and Zhang, K.: Stacking machine learning model for precipitable water vapor vertical adjustment using GNSS networks and radio occultation data, Atmos. Res., 325, 108212, https://doi.org/10.1016/j.atmosres.2025.108212, 2025.
Soci, C., Hersbach, H., Simmons, A., Poli, P., Bell, B., Berrisford, P., Horányi, A., Muñoz-Sabater, J., Nicolas, J., Radu, R., Schepers, D., Villaume, S., Haimberger, L., Woollen, J., Buontempo, C., and Thépaut, J.: The ERA5 global reanalysis from 1940 to 2022, Q. J. Roy. Meteorol. Soc., 150, 4014–4048, https://doi.org/10.1002/qj.4803, 2024.
Turner, D. D., Lesht, B. M., Clough, S. A., Liljegren, J. C., Revercomb, H. E., and Tobin, D. C.: Dry bias and variability in Vaisala RS80-H radiosondes: The ARM experience, J. Atmos. Oceanic Technol., 20, 117–132, https://doi.org/10.1175/1520-0426(2003)020<0117:dbaviv>2.0.co;2, 2003.
Turner, D. D., Clough, S. A., Liljegren, J. C., Clothiaux, E. E., Cady-Pereira, K. E., and Gaustad, K. L.: Retrieving liquid water path and precipitable water vapor from the Atmospheric Radiation Measurement (ARM) microwave radiometers, IEEE Trans. Geosci. Remote Sens., 45, 3680–3690, https://doi.org/10.1109/tgrs.2007.903703, 2007.
Utsumi, N. and Kim, H.: Observed influence of anthropogenic climate change on tropical cyclone heavy rainfall, Nat. Clim. Chang., 12, 436–440, https://doi.org/10.1038/s41558-022-01344-2, 2022.
Vey, S., Dietrich, R., Rülke, A., Fritsche, M., Steigenberger, P., and Rothacher, M.: Validation of precipitable water vapor within the NCEP/DOE reanalysis using global GPS observations from one decade, J. Climate, 23, 1675–1695, https://doi.org/10.1175/2009JCLI2787.1, 2010.
Walsh, K. J. E., McInnes, K. L., and McBride, J. L.: Climate change impacts on tropical cyclones and extreme sea levels in the South Pacific – A regional assessment, Glob. Planet. Chang., 80, 149–164, https://doi.org/10.1016/j.gloplacha.2011.10.006, 2012.
Wang, J. and Zhang, L.: Systematic errors in global radiosonde precipitable water data from comparisons with ground-based GPS measurements, J. Climate, 21, 2218–2238, https://doi.org/10.1175/2007JCLI1944.1, 2008.
Wang, J., Zhang, L., and Dai, A.: Global estimates of water-vapor-weighted mean temperature of the atmosphere for GPS applications, J. Geophys. Res.-Atmos., 110, D21101, https://doi.org/10.1029/2005jd006215, 2005.
Wang, L., Zhou, Y., Lei, X., Zhou, Y., Bi, H., and Mao, X.: Predominant factors of disaster caused by tropical cyclones in South China coast and implications for early warning systems, Sci. Total Environ., 726, 138556, https://doi.org/10.1016/j.scitotenv.2020.138556, 2020a.
Wang, S., Xu, T., Nie, W., Jiang, C., Yang, Y., Fang, Z., Li, M., and Zhang, Z.: Evaluation of precipitable water vapor from five reanalysis products with ground-based GNSS observations, Remote Sens., 12, 1817, https://doi.org/10.3390/rs12111817, 2020b.
Wang, S., Xu, T., Xu, Y., Jiang, C., Gao, F., Zhang, Z., Yang, Y., Fang, Z., and Xue, H.: Intercomparison of total precipitable water derived from COSMIC-2 and three different microwave radiometers over the ocean, IEEE Trans. Geosci. Remote Sens., 60, 4107610, https://doi.org/10.1109/TGRS.2022.3160020, 2022.
Wang, Y., Yang, K., Pan, Z., Qin, J., Chen, D., Lin, C., Chen, Y., Lazhu, Tang, W., Han, M., Lu, N., and Wu, H.: Evaluation of precipitable water vapor from four satellite products and four reanalysis datasets against GPS measurements on the southern Tibetan Plateau, J. Climate, 30, 5699–5713, https://doi.org/10.1175/JCLI-D-16-0630.1, 2017.
Wang, Z.: Role of cumulus congestus in tropical cyclone formation in a high-resolution numerical model simulation, J. Atmos. Sci., 71, 1681–1700, https://doi.org/10.1175/JAS-D-13-0257.1, 2014.
Wang, Z. and Hankes, I.: Moisture and precipitation evolution during tropical cyclone formation as revealed by the SSM/I–SSMIS retrievals, J. Atmos. Sci., 73, 2773–2781, https://doi.org/10.1175/JAS-D-15-0306.1, 2016.
Wang, Z., Xia, N., Zhao, X., Ji, X., and Wang, J.: Comprehensive risk assessment of typhoon disasters in China's coastal areas based on multi-source geographic big data, Sci. Total Environ., 926, 171815, https://doi.org/10.1016/j.scitotenv.2024.171815, 2024.
Wee, T.-K., Anthes, R. A., Hunt, D. C., Schreiner, W. S., and Kuo, Y.-H.: Atmospheric GNSS RO 1D-Var in use at UCAR: Description and validation, Remote Sens., 14, 5614, https://doi.org/10.3390/rs14215614, 2022.
Wei, Q., Li, X., Ma, T., Wang, S., Dai, T., Fan, P., Yu, Y., Jin, Y., and Liu, Y.: A neighborhood standard deviation based algorithm for generating PET crystal position maps, in: 2013 IEEE Nuclear Science Symposium and Medical Imaging Conference (2013 NSS/MIC), 2013 IEEE Nuclear Science Symposium and Medical Imaging Conference (2013 NSS/MIC), 1–4, https://doi.org/10.1109/NSSMIC.2013.6829273, 2013.
Woodruff, J. D., Irish, J. L., and Camargo, S. J.: Coastal flooding by tropical cyclones and sea-level rise, Nature, 504, 44–52, https://doi.org/10.1038/nature12855, 2013.
Xi, D., Lin, N., and Gori, A.: Increasing sequential tropical cyclone hazards along the US East and Gulf coasts, Nat. Clim. Change, 13, 258–265, https://doi.org/10.1038/s41558-023-01595-7, 2023.
Yuan, P., Blewitt, G., Kreemer, C., Jiang, W., Liu, T., He, L., Shan, Q., Balidakis, K., Schuh, H., Wickert, J., and Deng, Z.: A global assessment of diurnal discontinuities in ERA5 tropospheric zenith total delays using 10 years of GNSS data, Geophys. Res. Lett., 52, e2024GL113140, https://doi.org/10.1029/2024GL113140, 2025.
Zhang, C., Wang, S., Zhao, Y., Xu, Y., Zhang, J., Mo, Y., and Yu, H.: Evaluation of water vapor from CARRA reanalysis based on GNSS and radiosonde observation in the Arctic, J. Atmos. Sol-terr. Phy., 268, 106431, https://doi.org/10.1016/j.jastp.2025.106431, 2025.
Zhang, K., Li, H., Wang, X., Zhu, D., He, Q., Li, L., Hu, A., Zheng, N., and Li, H.: Recent progresses and future prospectives of ground-based GNSS water vapor sounding, Acta Geod. Cartogr. Sin., 51, 1172–1191, 2022.
Zhang, Q., Ye, J., Zhang, S., and Han, F.: Precipitable water vapor retrieval and analysis by multiple data sources: Ground-based GNSS, radio occultation, radiosonde, microwave satellite, and NWP reanalysis data, J. Sensors, 2018, 1–13, https://doi.org/10.1155/2018/3428303, 2018.
Zhang, W., Lou, Y., Haase, J. S., Zhang, R., Zheng, G., Huang, J., Shi, C., and Liu, J.: The use of ground-based GPS precipitable water measurements over China to assess radiosonde and ERA-Interim moisture trends and errors from 1999 to 2015, J. Climate, 30, 7643–7667, https://doi.org/10.1175/JCLI-D-16-0591.1, 2017.
Zhang, W., Zhang, H., Liang, H., Lou, Y., Cai, Y., Cao, Y., Zhou, Y., and Liu, W.: On the suitability of ERA5 in hourly GPS precipitable water vapor retrieval over China, J. Geodesy, 93, 1897–1909, https://doi.org/10.1007/s00190-019-01290-6, 2019a.
Zhang, Y., Cai, C., Chen, B., and Dai, W.: Consistency evaluation of precipitable water vapor derived from ERA5, ERA-Interim, GNSS, and radiosondes over China, Radio Sci., 54, 561–571, https://doi.org/10.1029/2018RS006789, 2019b.
Zhao, D., Xu, H., Li, Y., Yu, Y., Duan, Y., Xu, X., and Chen, L.: Locally opposite responses of the 2023 Beijing–Tianjin–Hebei extreme rainfall event to global anthropogenic warming, npj Clim. Atmos. Sci., 7, https://doi.org/10.1038/s41612-024-00584-7, 2024.
Zhao, Q., Ma, X., Yao, W., Liu, Y., and Yao, Y.: A drought monitoring method based on precipitable water vapor and precipitation, J. Climate, 33, 10727–10741, https://doi.org/10.1175/jcli-d-19-0971.1, 2020.
Zumberge, J. F., Heflin, M. B., Jefferson, D. C., Watkins, M. M., and Webb, F. H.: Precise point positioning for the efficient and robust analysis of GPS data from large networks, J. Geophys. Res.-Sol. Ea., 102, 5005–5017, https://doi.org/10.1029/96jb03860, 1997.