the Creative Commons Attribution 4.0 License.
the Creative Commons Attribution 4.0 License.
 | 27 Mar 2026
The variability of Antarctic fast ice extent related to tropical sea surface temperature anomalies
Chen Jiang
Lejiang Yu
Timo Vihma
While numerous studies have examined the influence of meteorological variables on fast ice, the mechanistic linkages between fast-ice variability and large-scale climatic oscillations have remained inadequately explored. Empirical Orthogonal Function (EOF) analysis is applied to circumpolar Antarctic fast-ice extent data (March 2000–February 2018) to investigate seasonal-scale teleconnections between fast ice anomalies and tropical sea surface temperature (SST) variability. Results demonstrate a fluctuating but increasing trend in fast-ice extent during austral winter and spring, with spatially predominant anomalies concentrated in the West Antarctic. A physical pathway linking tropical and subtropical SST anomalies to fast-ice variability is elucidated through multiscale interactions: SST anomalies modulate outgoing longwave radiation (OLR), subsequently perturbing the 200 hPa geopotential height field and triggering atmospheric Rossby wave trains. These planetary waves propagate from the tropics towards the Antarctic coastal zone, generating anomalies in the Southern Annular Mode (SAM) and other patterns of mean-sea-level pressure (MSLP) and surface wind field. These atmospheric adjustments directly regulate fast-ice mechanical formation/disintegration processes while indirectly influencing thermodynamic ice evolution through air temperature modifications. Tropical SST anomalies predominantly exciting planetary waves during austral autumn, whereas the subtropical South Pacific SST dipole mode emerges as the primary forcing mechanism during austral winter and spring. Seasonal variations in atmospheric forcing on fast ice are identified. By tracing how remote SST forcing propagates through atmospheric wave dynamics to influence regional fast-ice conditions, this study advances process-level understanding of tropical and subtropical impacts on the Antarctic.
- Article
(9311 KB) - Full-text XML
- BibTeX
- EndNote


Landfast ice (fast ice) defined as sea ice that remains immobilized along coastlines, ice shelves, or iceberg margins, is present throughout the coastal regions of Antarctica. It occurs for periods ranging from weeks to several decades. Fast ice has been observed to extend 200 km from the Antarctic coastline. Fast ice reaches its annual maximum extent during October with an average extent of ∼601 000 km2 (Fraser et al., 2021). Based on morphological characteristics and formation mechanisms, fast ice is categorized into two primary types: level fast ice and deformed fast ice. Level fast ice, which dominates in areal extent in the Antarctic (Fedotov et al., 1998), forms in situ through thermodynamically driven processes and is typically thinner. In contrast, deformed fast ice results from the dynamic stacking of drifting ice under wind or wave forcing, being thicker and exhibiting greater stability than level fast ice (Inall et al., 2022). The relative proportion of these two types is governed by coastal geomorphology (Porter-Smith et al., 2021) and advective barriers such as glacier tongues and grounded icebergs (Fraser et al., 2012). On the basis of its persistence, fast ice is further divided into seasonal fast ice, which melts during austral spring or summer, and multi-year fast ice, predominantly occurring in embayments or associated with grounded icebergs (Fraser et al., 2021). The mechanical strength of multi-year fast ice significantly exceeds that of seasonal fast ice (Kharitonov and Borodkin, 2022).
Fast ice plays critical roles in the cryosphere and Earth system. First, it provides mechanical stabilization for vulnerable ice shelves and glacier tongues (Massom et al., 2018) and can respond rapidly to environmental forcing (Leonard et al., 2021). Fast ice also plays a strong role in the defence of weakened Antarctic ice shelves (Bennetts and Teder, 2025; Teder et al., 2025). Second, fast ice modulates the size of coastal polynya and dense water production (Fraser et al., 2019), which influences the formation rate of Antarctic Bottom Water (Ohshima et al., 2013). Third, fast ice serves as a seasonal reservoir of nutrients and its breakup and offshore advection potentially fertilize the ocean (Grotti et al., 2005). Fourth, fast ice also provides a substrate for early-stage primary production (Meiners et al., 2018), which fuels coastal marine food webs, and supports key ecosystem processes (Bluhm et al., 2017).
The formation of fast ice in austral autumn is influenced by oceanic factors including SST variability (Li et al., 2023), vertical oceanic heat flux (Maksym, 2019; Hu et al., 2023), and salinity (Brett et al., 2020). The primary mechanisms for fast ice shrink in late spring include break-out events (Squire, 2020), internal melt (Zhao et al., 2022), wind speed and direction, and tensile failure caused by wind and storm-driven waves (Crocker and Wadhams, 1989; Voermans et al., 2021).
The atmospheric forcing factors also influence the variability of Antarctic fast ice across time scales ranging from hours to synoptic, seasonal, and interannual. Major atmospheric drivers include air temperature (Heil, 2006), wind speed and direction, storms and cyclones (Crocker and Wadhams, 1989), and snowfall (Kawamura et al., 1997; Ushio, 2006). However, most research on atmospheric impacts has so far been conducted regionally. In Prydz Bay, Heil (2006) analysed five decades (1950s–2003) of fast-ice records at Australia's Davis Station and found that the duration of seasonal fast ice depends on winter and spring temperatures, while interannual variability is primarily controlled by wind and storms. Yu et al. (2017) and Liu et al. (2024) identified ice surface temperature as the primary determinant of seasonal fast ice near China's Zhongshan Station. Zhao et al. (2019) demonstrated through measurements during 2012–2016 that local fast-ice thickness decreases with increasing snow accumulation. Zhai et al. (2019) reported that low air temperatures and wind speeds promote fast-ice expansion in the vicinity of Inexpressible Island. In the Ross Sea, Leonard et al. (2021) observed that the extent and duration fast ice near the McMurdo station are influenced by seasonal storm intensity; winter storm intensity additionally affects the following summer's fast ice conditions. On the Antarctic Peninsula and the Weddell Sea, Massom et al. (2018) and Wille et al. (2022) demonstrated the importance of persistent warm northerly winds in triggering anomalous break-up of fast ice near ice shelves, where wind-driven pack ice movement facilitates wave-induced fracturing. Herman et al. (2021) emphasized the role of ocean wave action in fast ice fragmentation near ice shelves. Arndt et al. (2020) identified snow accumulation as a major factor controlling fast ice formation in far eastern part of the Weddell Sea, with strong easterly winds redistributing snow on fast ice and contributing to its summer break-up.
In addition to synoptic-scale processes, numerous studies have examined the roles of large-scale atmospheric and oceanic forcing factors on the formation and decay of regional fast ice. Extensive research has noted linkages between the total Antarctic sea ice extent and large-scale climate modes (Pezza et al., 2012; Clem and Fogt, 2013; Coggins and McDonald, 2015; Irving and Simmonds, 2016; Meehl et al., 2016; Baba and Renwick, 2017; Clem et al., 2017; Simmonds and Li, 2021; Chung et al., 2022; Yu et al., 2022), while fewer studies have assessed their relationships in process level. Using ice records from the South Orkney Islands, Murphy et al. (2014) identified the non-stationary relationship between Weddell Sea fast-ice extent and climate modes, such as the El Nino–Southern Oscillation (ENSO) and the Southern Annular Mode (SAM). Aoki (2017) observed a significant positive correlation between the latitude of fast-ice edges in Lützow–Holm Bay, East Antarctica and eastern equatorial Pacific SST during 1997–2016. However, their studies only focused on a specific region, not the entire Antarctic fast-ice zone. In this study we employ Empirical Orthogonal Function (EOF) analysis to obtain the main modes of Antarctic fast ice variability and analyse SST and atmospheric variables related to the modes to build the relationship between seasonal Antarctic fast ice and climate modes (tropical Pacific SST) for the 2000–2018 period.
The monthly Antarctic fast ice dataset was derived from the Antarctic sea ice distribution data publicly released by Fraser et al. (2021) in the Australian Antarctic Data Centre website. This dataset classifies sea ice in National Aeronautics and Space Administration Moderate Resolution Imaging Spectroradiometer (NASA MODIS) imagery, covering an 18 year period from March 2000 to February 2018, with a spatial resolution of 1 km and a temporal resolution of 15 d. This dataset was utilized to extract the monthly boundaries of fast ice. The latitude of the fast-ice edge at each longitude (1° resolution) was identified by determining the boundary between fast ice and drifting ice or open ocean. The latitudinal difference between the fast ice outer boundary and the corresponding Antarctic continental coastline was calculated to generate a time series of fast ice edge across all longitudes around Antarctica.
Oceanic and atmospheric datasets were derived from the European Centre for Medium-Range Weather Forecasts (ECMWF) fifth-generation reanalysis (ERA5) (Hersbach et al., 2020), which has a spatial resolution of 0.25°×0.25°. Due to its high resolution and advanced data-assimilation system, ERA5 performs well with respect to variables that are of key importance in our study: upper-tropospheric geopotential height fields in the tropics (Hoffmann and Spang, 2022) and MSLP and wind fields in the Southern Ocean (McErlich et al., 2023).
Monthly averaged sea surface temperature (SST), MSLP, 2 m air temperature, 10 m wind fields, and 200 hPa geopotential height fields from ERA5 were employed. In addition, we used the monthly top-of-the-atmosphere (TOA) outgoing longwave radiation (OLR) data provided by the National Oceanic and Atmospheric Administration Climate Prediction Center (NOAA CPC) (Xie et al., 2023). These oceanic and atmospheric datasets were used to investigate the relationship between fast ice variability and atmospheric circulation anomalies.
We detrended the fast ice boundary time series together with the sea surface temperature and atmospheric variables. We then removed the monthly climatological mean for each respective month to derive anomaly fields for all variables. Finally, the data were grouped into seasons as follows. The four austral seasons here refer to spring: September, October and November (SON); summer: December, January and February (DJF); autumn: March, April and May (MAM); winter: June, July and August (JJA). Seasonal anomalies were obtained by subtracting the climatological seasonal cycle from each time series. To visualize the spatiotemporal variations in fast ice offshore distance, EOF analysis was performed on the processed data. This method decomposes the variability of fast ice anomalies into spatial patterns (EOFs) and their associated temporal coefficients, called as Principal Components (PCs). The EOFs and PCs are mutually orthogonal, with the variance contribution of each mode indicating the percentage of total variance explained by the mode. The contribution of the mode to the total trend for each season is calculated by the product of the trend in the PCs of the mode and the EOFs of the mode. The data following EOF decomposition were all standardized.
Regression analysis was employed to establish relationships between meteorological variables and fast ice variability. Regression coefficients were calculated by regressing the time series of each meteorological variable at every spatial grid point onto the standardized PCs of fast ice variability. A two-tailed Student's t-test is used to assess the confidence level of all regression results.
Figure 1 presents the seasonal time series of the total anomaly in fast ice extent over the 18 year period from 2000 to 2017, based on fast ice dataset and processing methods described above. The figure clearly shows that although the fast ice extent in all four seasons displays a broadly similar pattern (initial decline, subsequent increase, another decline, followed by a second rise and final decrease) the magnitude and timing of these variations differ substantially among the seasons. In the autumn (Fig. 1a), the fast ice extent overall shows a relatively clear decreasing trend. The largest positive anomaly occurred in 2000, reaching +0.25° latitude in fast-ice extent. It subsequently decreased, turning negative in 2002 and reaching minimum in 2003 with an anomaly of −0.1° latitude. From 2004 to 2007, the anomaly varied but exhibited an overall increasing tendency. During 2008–2011, the anomaly remained consistently negative, but its magnitude stayed within 0.1° latitude. From 2012 to 2016, the anomaly was consistently positive, with the magnitude also within 0.1° latitude. In 2017, the anomaly rapidly decreased down to −0.2° latitude. In winter (Fig. 1b), the trend of the fast ice anomaly resembles that of autumn, but both the maximum and minimum anomalies have a smaller magnitude than in autumn. Unlike in spring, winter showed a more pronounced negative anomalies during 2008–2010, with the minimum occurring in 2010 at −0.15° latitude. The trends of fast ice extent in spring (Fig. 1c) and summer (Fig. 1d) are nearly identical. However, spring 2000 showed a large positive anomaly, while the summer anomaly was almost zero. Unlike autumn and winter, spring and summer exhibited larger positive anomalies during 2012–2015, with the maximum values occurring within this period. To better understand the relationship between the temporal and spatial variability of fast ice, we perform an EOF decomposition on the fast ice data and base our subsequent analysis on the leading modes.
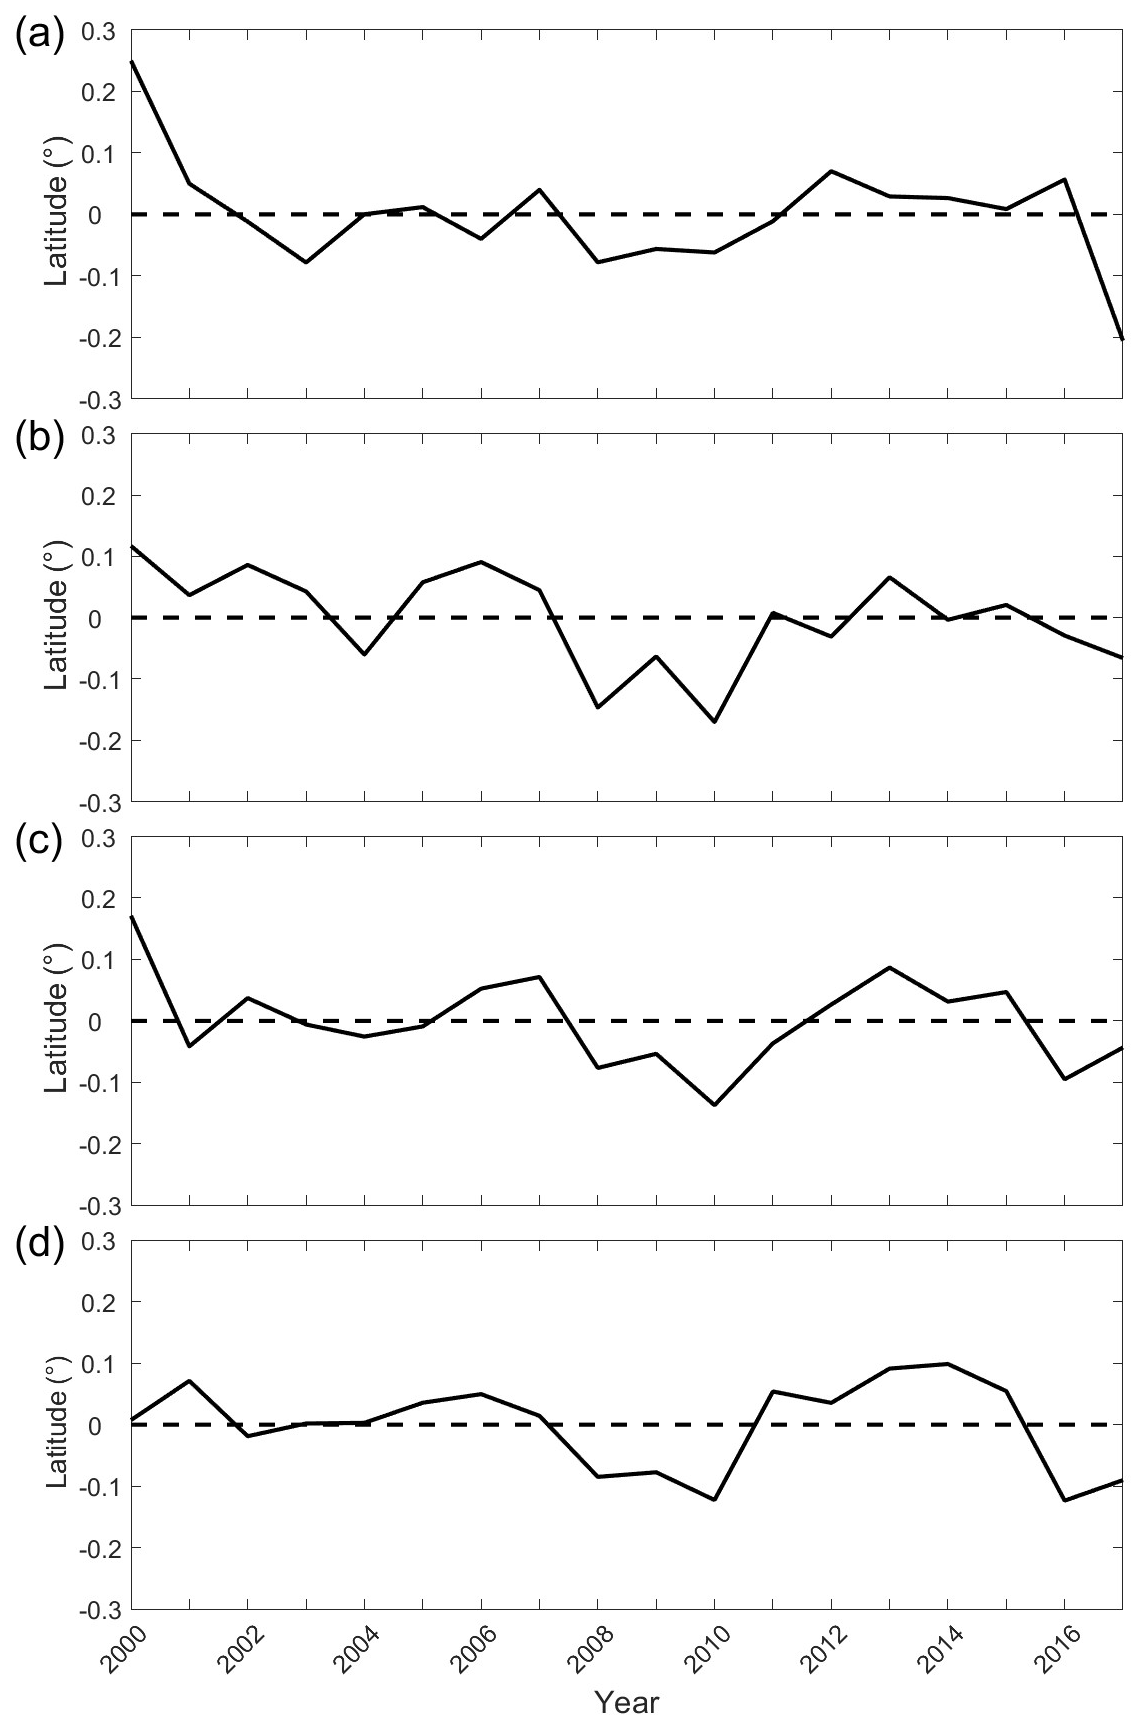
Figure 1Time series of fast ice extent anomaly (offshore differences in latitude): (a) autumn, (b) winter, (c) spring, (d) summer.
EOF analysis of seasonal Antarctic fast-ice extent anomalies from 2000 to 2017 revealed distinct seasonal differences. The variance contributions of every EOF mode for each season are shown as Table 1. The first mode accounted for a substantial proportion of the total variance, with the largest percentage of 41 % in winter and the smallest of 31 % in summer. The percentage of variance explained by the second mode ranges from 13 % in autumn to 22 % in summer.
Table 1Variance contributions (%) of each mode from the EOF of fast ice extent anomalies in each season.

3.1 EOF analysis of seasonal Antarctic fast-ice extent anomalies
The leading EOF (EOF1) represents the spatial pattern corresponding to PC1 (Fig. 2a, c, e, and g). It shows how much and in which direction the variable changes at each location when PC1 increases by one standard deviation, thereby illustrating the relative magnitude and sign of variability across different spatial regions. In this section, we focus on the Ross Sea (RS), the Bellingshausen Sea (BAS), the Amundsen Sea, the Weddell Sea (WS), and the Indian Ocean (IO) and the Pacific Ocean (PO) regions. The latitudinal ranges of these regions are illustrated in Fig. 2a, c, e, and g. The EOF1 highlights pronounced high spatial variability of fast ice in West Antarctica, the eastern BAS, WS, RS and regions surrounding the Antarctic Peninsula (55–65° W). These areas are characterized by complex coastlines and offshore islands, which promote the formation of extensive fast ice at greater distances from the coast. Variations in island-associated fast ice strongly influence fast ice edge variability. It is worth noting that the area of RS fast ice is relatively small. However, due to the presence of the Ross Ice Shelf, the fast ice extends far offshore, resulting in high variability. Nevertheless, the high variability observed here for RS is of limited practical significance. Therefore, the high variability of RS will not be discussed further. In contrast, East Antarctica, with its smoother coastline along IO and PO, exhibited low spatial variability, except for localized variability near Prydz Bay (70–80° E).
In autumn (Fig. 2a), sizeable high spatial variability of fast ice was observed in the western WS and the eastern BAS. IO displayed low spatial variability pattern while the east–west variability is opposite, with pronounced high spatial variability near Prydz Bay (70–80° E). During winter (Fig. 2c), the western WS and BAS showed high spatial variability, while the eastern WS and IO displayed reduced spatial variability. During spring (Fig. 2e), the eastern BAS and Antarctic Peninsula regions (55–65° W) experienced overall high spatial variability. WS exhibited sizeable high spatial variability, while the eastern WS showed low spatial variability. In summer (Fig. 2g), BAS and IO showed reduced spatial variability. The western WS exhibited high spatial variability.
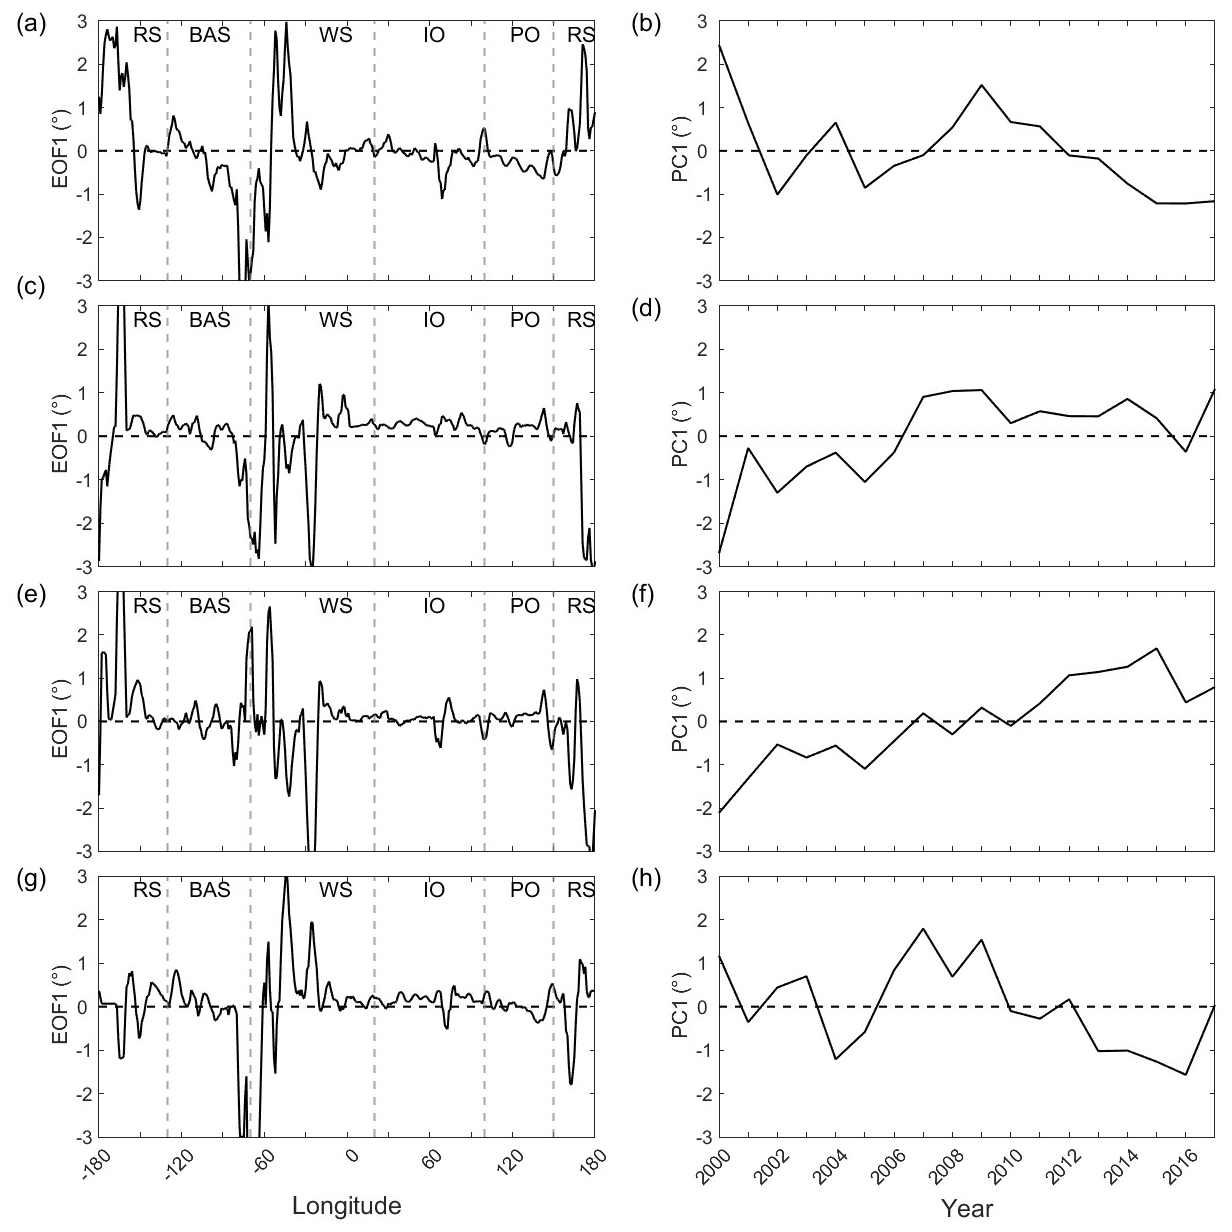
Figure 2The EOF1s and PC1s of first EOF mode of Antarctic fast ice extent anomalies (2000–2018) for each season: (a) spatial pattern (EOF1) during autumn, (b) temporal principal component (PC1) during autumn, (c) EOF1 during winter, (d) PC1 during winter, (e) EOF1 during spring, (f) PC1 during spring, (g) EOF1 during summer, (h) PC1 during summer. In the figure, RS refers to the Ross Sea, BAS refers to the Bellingshausen Sea and Amundsen Sea, WS refers to the Weddell Sea, IO refers to the Indian Ocean, and PO refers to the Pacific Ocean.
We also conducted a correlation analysis on the spatial modes of each season. The spatial modes between winter and spring show good correlation, with a correlation coefficient of 0.72. There is also a certain degree of correlation between summer and autumn, with a correlation coefficient of 0.47. The correlations are all statistically significant. However, the correlation coefficients between other seasons are minimal.
As shown in Fig. 2b, d, e, and g, the PC1 over the 18 year period revealed distinct seasonal differences. Winter (Fig. 2d) and spring (Fig. 2f) exhibited a gradual increasing trend in fast-ice extent superimposed on interannual fluctuations whereas summer (Fig. 2h) and autumn (Fig. 2b) exhibited a gradual decreasing trend and interannual and decadal variability with the highes variability in 2007 (summer) and 2009 (autumn). Furthermore, the trend in the PC1 time series in all season is significant (p<0.05).
3.2 Multiscale analysis of fast-ice anomalies in each season
To explain the spatial patterns of the first modes, we make the regression of oceanic and meteorological variables (SST, air temperature, MSLP, and wind fields) onto the PC1s.
During the autumn, the regression coefficient map for SST (Fig. 3a) reveals significant positive anomalies in the tropical western Pacific and negative anomalies in the central-eastern Pacific, the values in center of anomalies area are 0.4 and −0.6 °C, respectively, resembling the SST pattern associated with La Niña events. Since this study divides the data by season, the results differ from the more southerly ENSO structure presented in the paper by Aoki (2017). These SST anomalies enhance convective activity in the western Pacific, resulting in high, cold cloud tops, manifested as negative TOA OLR anomalies. The anomalies in this area are almost as low as −8 W m−2 (Fig. 4a), and establish atmospheric teleconnections. Concurrently, negative SST anomalies in the central-eastern Pacific and tropical Indian Ocean correspond to positive OLR anomalies. A mid-latitude SST dipole in the central Pacific (positive anomalies south and north of the equatorial negative region) induces negative OLR anomalies. They are indicative of enhanced convective activity, which results in an increase in high-level clouds with cold tops and divergence in the upper troposphere, then generate strong positive 200 hPa geopotential height anomaly (the maximum values are higher than 20 gpm) southeast of Australia (Fig. 5a). This anomaly propagates eastward as an atmospheric wave train, amplifying the Amundsen Sea Low (ASL) through a trough over the southeastern Pacific, the negative pressure anomalies in the centre of ASL is lower than −2 hPa (Fig. 6c). The intensified ASL creates asymmetric pressure patterns over Antarctica, with lower pressures in West Antarctica and higher pressures in the Atlantic sector. Wind fields (Fig. 6d) exhibit a strong clockwise circulation around the ASL, driving northerly winds along the western Antarctic Peninsula. These northerly winds promote onshore ice stacking (dynamic effect) but also elevate temperatures (thermal effect), leading to ice melt. In addition, a research of Fogt et al. (2012) confirmed that the number and central pressure of extratropical-high-latitude cyclones is related to the climatic intensity of the ASL. So more cyclones because of the high climatic intensity of ASL can promote the disintegration of fast ice, leading to a reduction in fast ice extent. In Fig. 6a, we clearly see that the air temperature exhibits a zonal oscillation pattern of three positive and three negative anomalies, resembling the Zonal Wave 3 (ZW3) structure. Irving and Simmonds (2015) point out that the ZW3 structure has an important influence on the variation of autumn sea ice concentration. For instance, the anomalously warm conditions west of the Antarctic Peninsula coincide with reduced sea ice concentration in the Bellingshausen Sea. This may be attributed to the role of ZW3 as a driver of meridional movement of cyclones (Uotila et al., 2013). We further conclude that declining sea ice concentration can weaken the protective barrier of fast ice, leading to its disintegration and resulting in a pronounced deficit of fast ice in the Bellingshausen Sea west of the Antarctic Peninsula (Fig. 2a). In the Amundsen Sea, easterly winds may favour fast-ice formation farther west, resulting in a west-positive, east-negative distribution. Over the southeastern Indian Ocean, negative SST and air temperature anomalies dominate, inversely correlating with fast ice variability (Fig. 6b). Thus, autumn fast ice anomalies are driven by atmospheric wave-induced circulation changes in the Pacific and Atlantic sectors, while thermal factors prevail in the Indian Ocean sector.
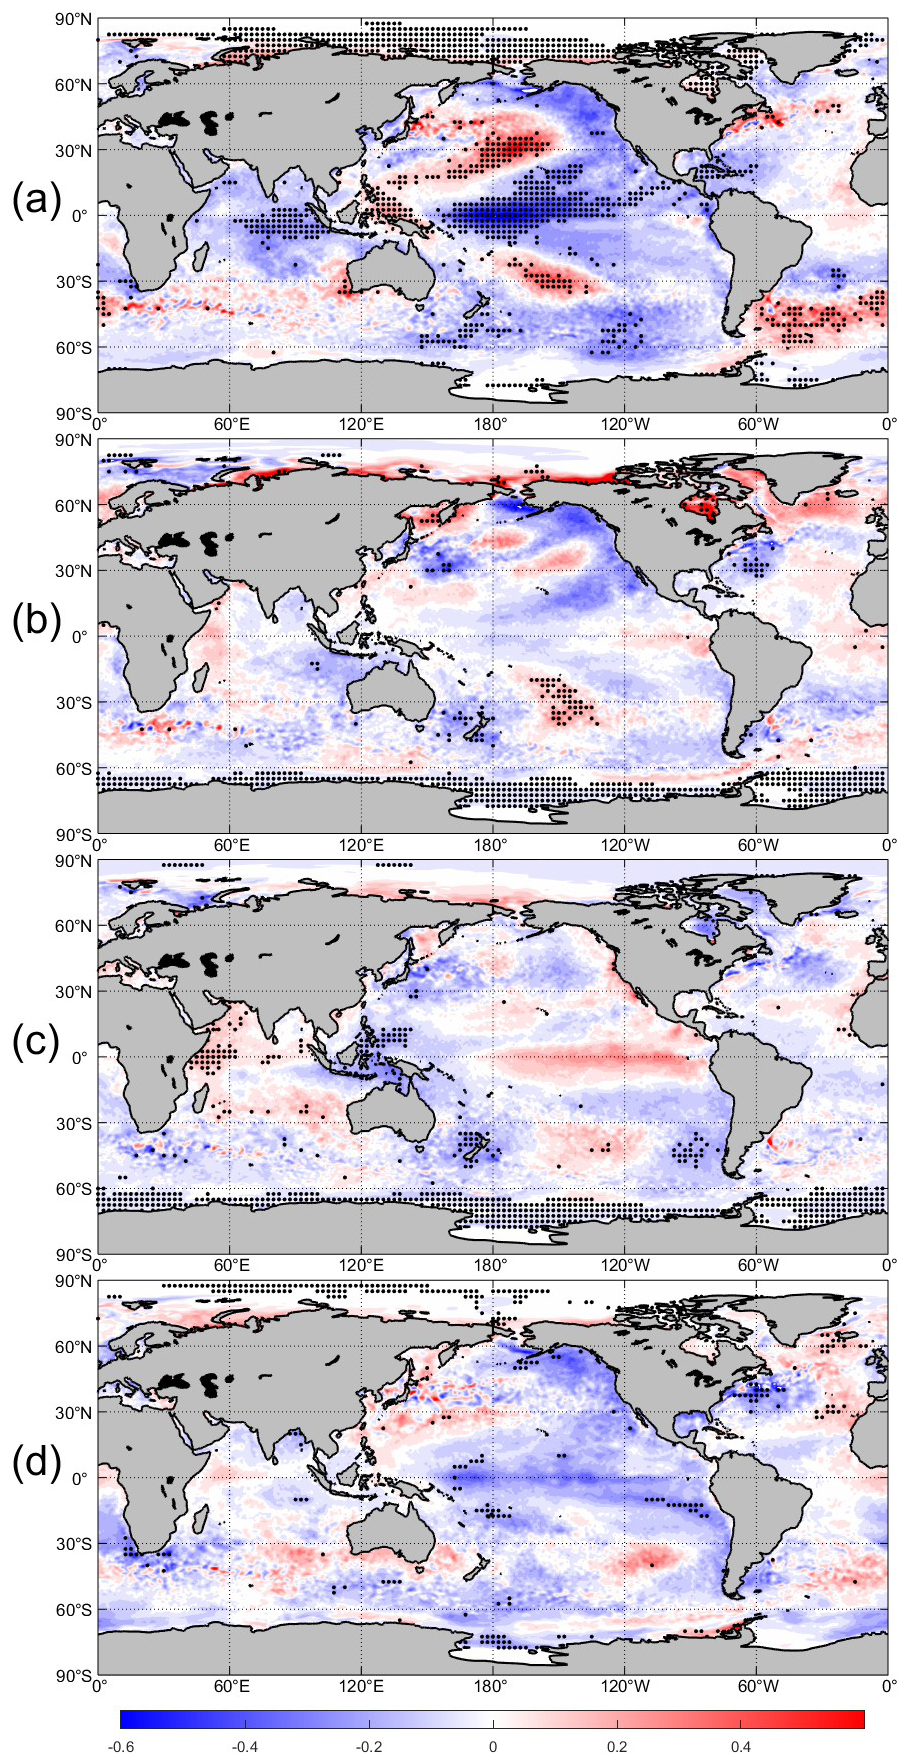
Figure 3Regression of SST (in °C) onto the PC1: (a) autumn, (b) winter, (c) spring, and (d) summer. Regions with black dots indicate areas passing the 95 % confidence level.
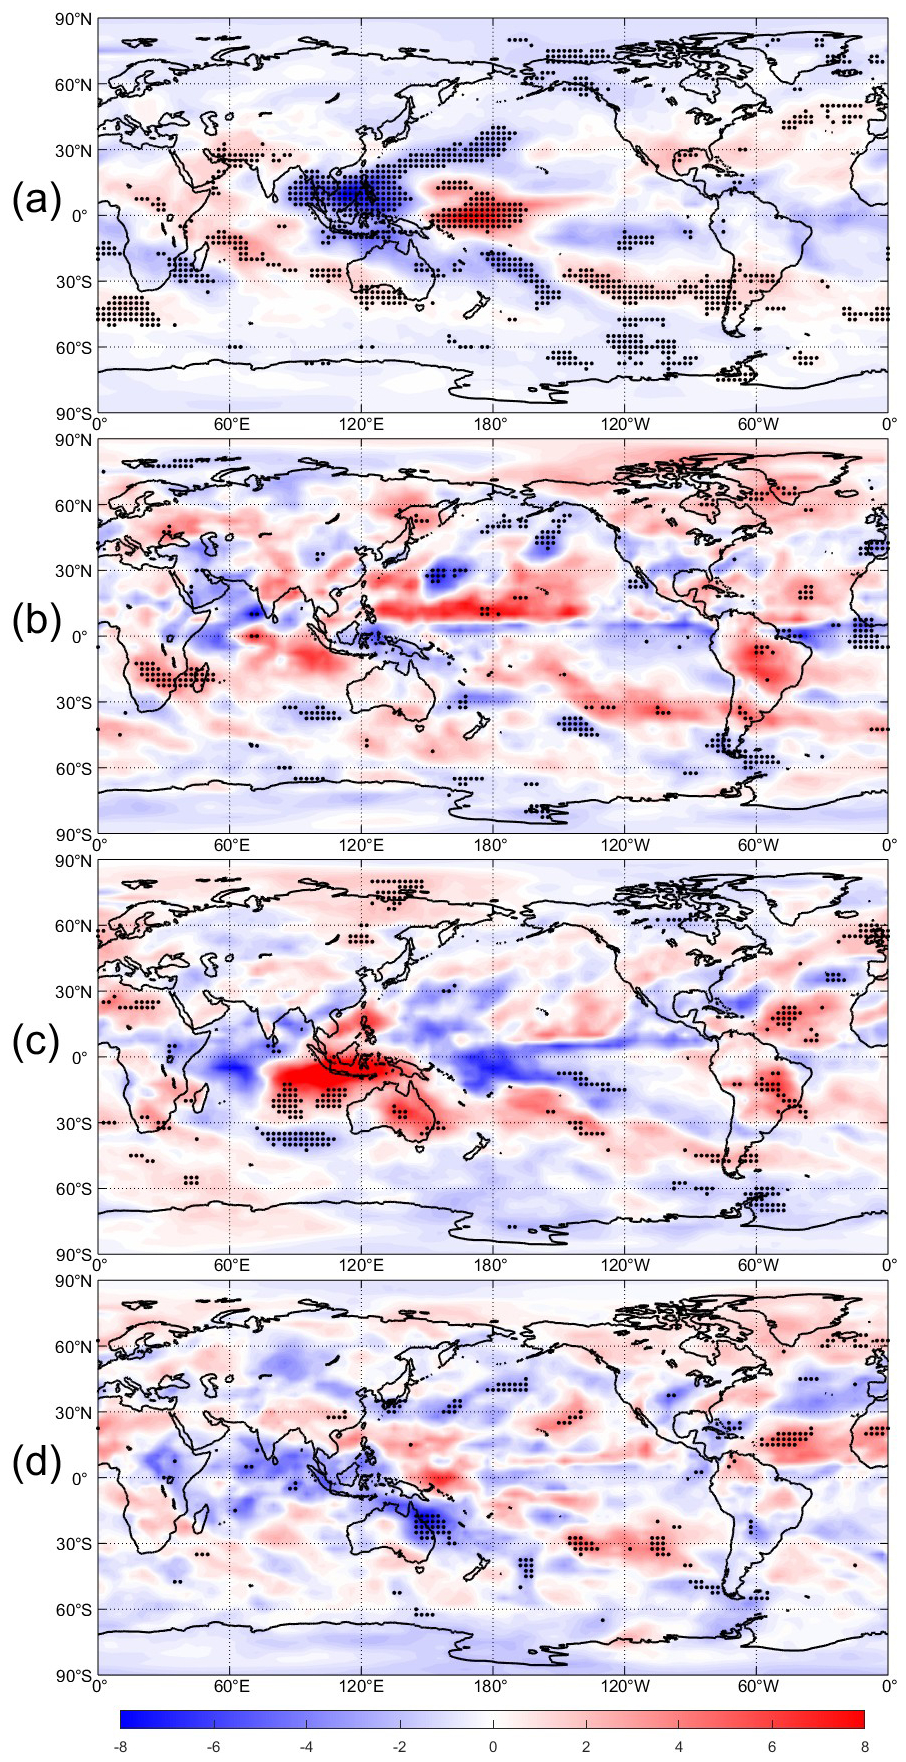
Figure 4Regression of OLR (in W m−2) onto the PC1: (a) autumn, (b) winter, (c) spring, and (d) summer. Regions with black dots indicate areas passing the 95 % confidence level.
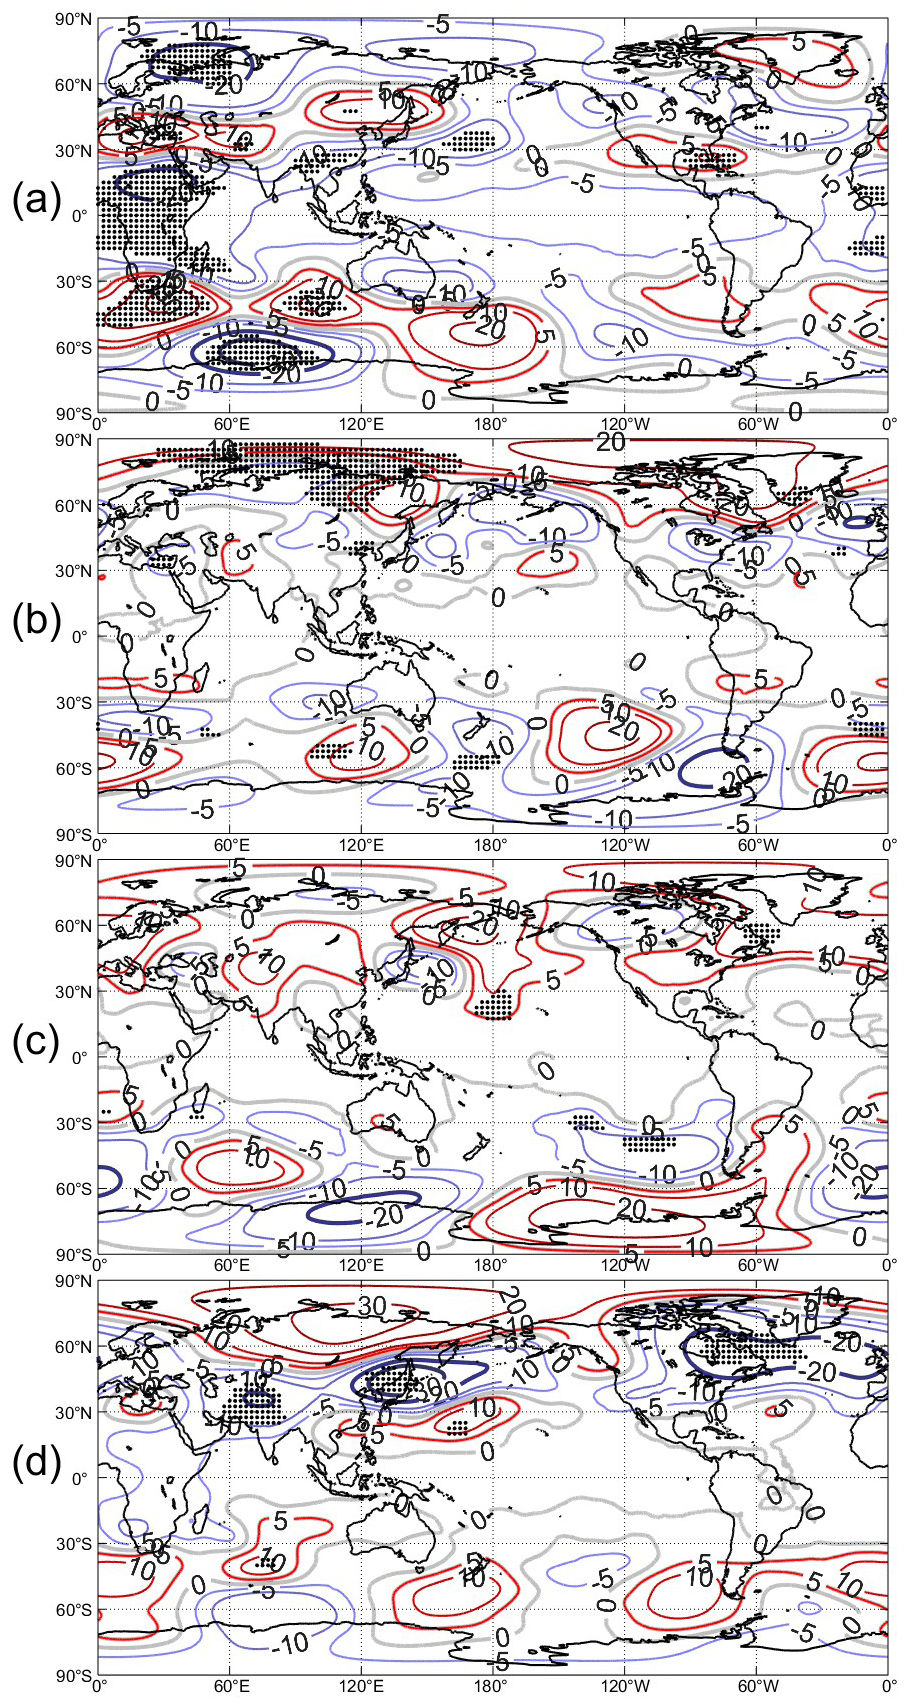
Figure 5Regression of 200 hPa geopotential height (in gpm) onto the PC1: (a) autumn, (b) winter, (c) spring, and (d) summer. Regions with black dots indicate areas above 95 % confidence level.
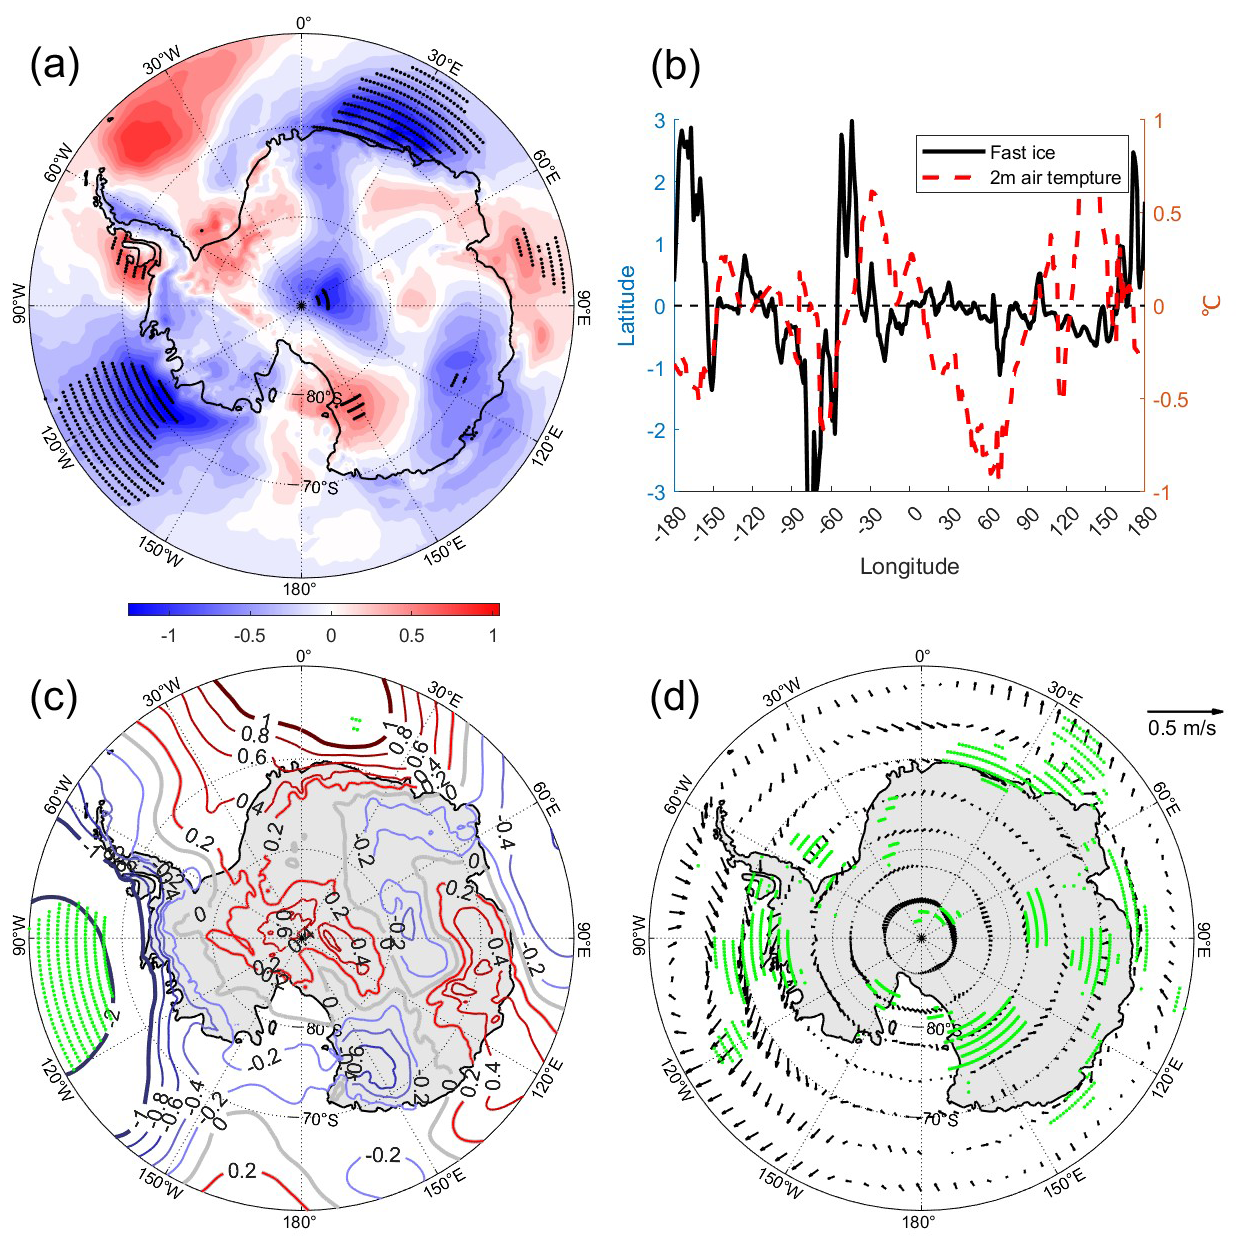
Figure 6Regression of atmospheric variables onto the PC1 during autumn: (a) 2 m air temperature (in °C), (b) 2 m air temperature (dashed) in fast ice region and fast ice coverage (solid), (c) MSLP (in hPa), (d) 10 m wind field. Green and black dots indicate above 95 % confidence level.
During winter, SST regression coefficients (Fig. 3b) show an insignificant tropical signal but a significant mid-latitude dipole off eastern Australia, with southwest-negative and northeast-positive anomalies, the values in the center of anomalies area are 0.4 and −0.4 °C. Corresponding OLR anomalies (Fig. 4b) display a southwest-positive and northeast-negative pattern, alongside a negative OLR anomaly over the Drake Passage. The 200 hPa geopotential height field (Fig. 5b) exhibits a wave train propagating eastward from the southern Indian Ocean to the South Atlantic, alternating between positive and negative anomalies. This wave train influences MSLP, generating high-pressure anomalies over the southeastern Indian Ocean (higher than 1 hPa) and southeastern Atlantic (higher than 1 hPa), and low-pressure anomalies over the southeastern Pacific (lower than −1 hPa) and Drake Passage (Fig. 7c). The eastward-shifted ASL induces strong northeasterly winds along the Antarctic Peninsula (Fig. 7d), causing onshore ice accumulation along the eastern coast and offshore ice dispersal along the western coast of the peninsula. In East Antarctica, southerly winds associated with a high-pressure system over the southeastern Indian Ocean enhance cooling, promoting fast ice growth. Convergent winds near Prydz Bay facilitate ice formation, while divergent winds at 110° E lead to ice fragmentation. Air temperature regressions (Fig. 7a and b) indicate an inverse relationship with fast ice anomalies (Fig. 2c), underscoring the dominance of thermodynamic processes in winter.
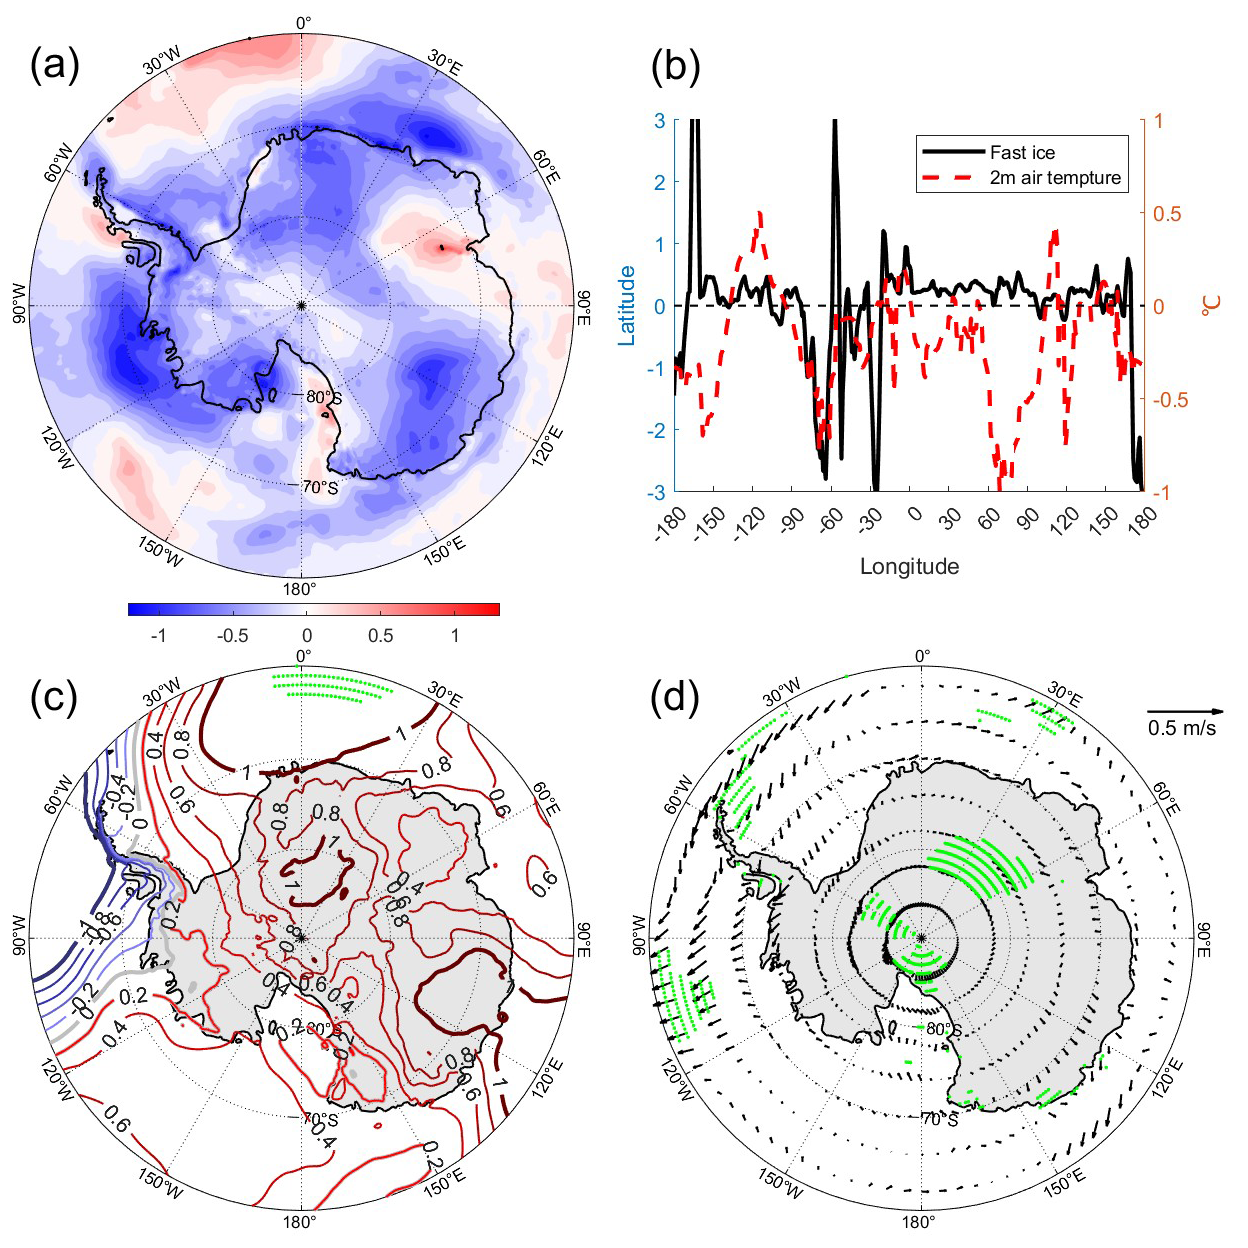
Figure 7The same as Fig. 6, but for winter.
During the spring, the regression coefficient distribution of SST in Fig. 4c reveals a reversed pattern in tropical SST compared to autumn and winter, with significant negative anomalies in the eastern Indian Ocean and western Pacific and positive regression coefficients in the eastern Pacific. The magnitudes of anomalies reach approximately 0.3 °C, being smaller than in autumn and winter. The corresponding OLR (Fig. 6c) exhibits significant positive anomalies (8 W m−2) over the eastern Indian Ocean and western Pacific and negative anomalies (−8 W m−2) over the eastern Pacific. The anomalies of OLR are more significant than winter. This reversed tropical SST distribution maintains the SST dipole in the mid-latitude Pacific during the spring, though its position shifts southward to 50° S, with its orientation changing from a wintertime positive southwest-northeast gradient to a springtime positive west–east gradient (Fig. 3c). The anomalous geopotential height distribution at 200 hPa (Fig. 5c) shows that both high and low geopotential height centers shift southward to the margins of the Antarctic continent and the Southern Ocean. Negative anomalies dominate from the eastern Indian Ocean to the western Pacific, while positive anomalies prevail over the eastern Pacific and Drake Passage, and negative anomalies re-emerge over the Atlantic. The magnitudes of both positive and negative geopotential height anomalies exceed 20 gpm, and the spatial coverage of large anomalies expands compared to autumn and winter.
The upper-level anomalies influence MSLP, with the MSLP distribution in Fig. 8c characterized by a high-pressure anomaly over most of the Antarctic continent and large parts of the Southern Ocean, exceeding 1 hPa over most of East Antarctica and western Amundsen Sea. Low-pressure anomalies occur over the Antarctic Peninsula and surrounding seas, as well as over the western Pacific sector. The negative anomalies of MSLP have smaller magnitudes than the positive anomalies. The pressure anomalies drive wind anomalies (Fig. 8d), with strong southerly wind anomalies over the Bellingshausen Sea and around the Antarctic Peninsula. These result in lower temperatures, promoting fast-ice expansion. In contrast, the Amundsen Sea lies between two low-pressure centers under a high-pressure ridge, where divergent winds induce fast ice fracturing. However, lower temperatures in this region simultaneously favor fast ice retention, leading to a large variability in fast ice coverage. Over the Weddell Sea, northerly wind anomalies dominate, inhibiting fast ice preservation and resulting in reduced coverage (Fig. 2e). In the Atlantic and western Indian Ocean, zonal easterly winds prevail, causing fast ice variability to depend heavily on topography and wind convergence/divergence.
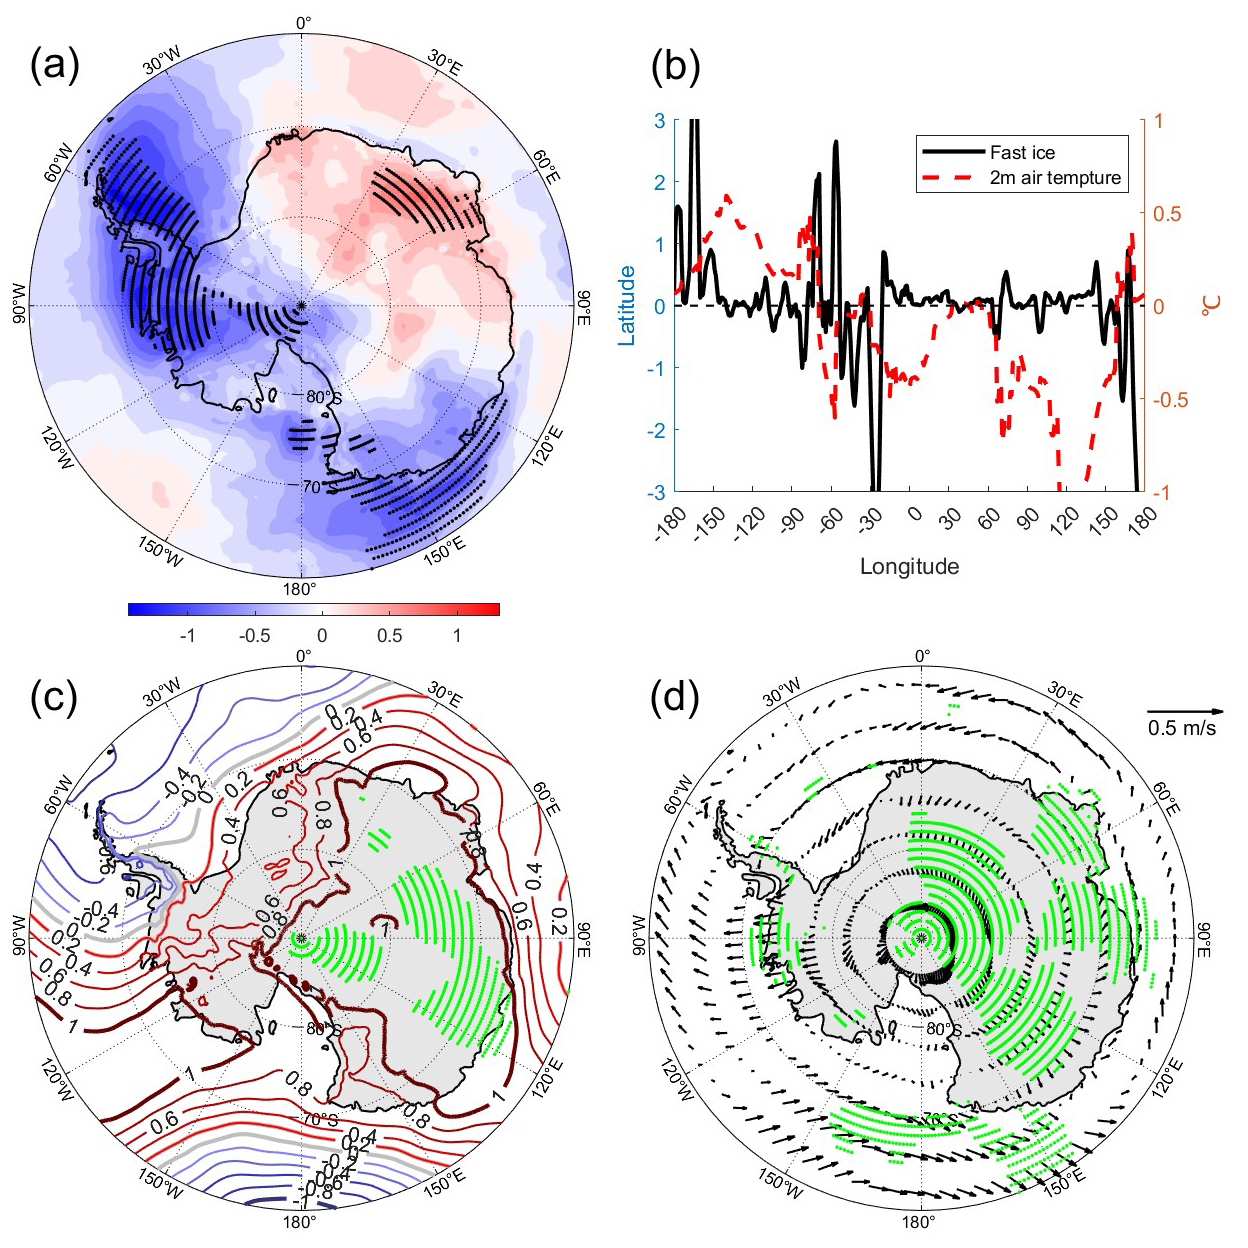
Figure 8The same as Fig. 6, but for spring.
The Prydz Bay (70° E) experiences northerly winds and elevated temperatures, leading to reduced fast ice coverage. Near 110° E in the eastern Indian Ocean sector of the Southern Ocean, wind divergence promotes fast ice fracturing and reduction, while wind convergence near 150° E enhances fast ice accumulation. Notably, a comparison between fast ice and temperature anomalies (Fig. 8a and b) indicates a weaker correlation in spring than in winter, with opposing temperature-fast ice relationships occurring in the Amundsen Sea, Bellingshausen Sea, and parts of the eastern Indian Ocean sector of the Southern Ocean. This suggests that dynamic factors, rather than thermal conditions, dominate fast ice variability during the spring breakup season.
During the summer, the SST regression coefficients in Fig. 3d show overall negative values (about −0.2 °C) across the tropical Pacific, with pronounced negative anomalies in the western Pacific, weak positive anomalies (less than 0.2 °C) in the Indian Ocean, and negligible coefficients in the Atlantic. The OLR (Fig. 4d) displays positive anomalies near New Guinea and significant negative anomalies (lower than −8 W m−2) in the south of Australia and east of the Australian coast. The mid-latitude eastern Pacific exhibits strong positive OLR anomalies (4 W m−2). These zonal variations in OLR anomalies generate spatially varying 200 hPa geopotential height anomalies (Fig. 5d), with alternating positive and negative anomaly centers aligned along 60° S, forming a circumpolar atmospheric wave train. Correspondingly, the Southern Ocean MSLP (Fig. 9c) adopts a tripole structure: high-pressure centers over the South Atlantic, central Indian Ocean, and Ross Sea, and low-pressure centers over the Bellingshausen Sea, eastern Indian Ocean, and western Indian Ocean. The wind field (Fig. 9d) aligns with the pressure anomalies, with easterly winds on both sides of the Antarctic Peninsula driving onshore winds in the eastern side and offshore winds in the western side, resulting in a higher fast-ice coverage east of the Peninsula and a lower one west of it. Strong southerlies over the Amundsen Sea lower temperatures, locally increasing the fast-ice cover. In the Ross Sea, northerly winds elevate temperatures, but wind convergence introduces variability in fast ice (Heil, 2006). Over the Weddell Sea, southerly winds enhance fast ice accumulation. The Atlantic sector, situated between high and low-pressure anomalies, experiences southerly winds with localized convergence/divergence, leading to substantial fast ice fluctuations (Fig. 2g). Temperature regression coefficients (Fig. 9a and b) reveal that the correlation between fast ice and temperature is stronger in summer than in spring. Inverse relationships between temperature and fast ice occur in the Amundsen Sea, Bellingshausen Sea, eastern Weddell Sea, and eastern Indian Ocean sector.
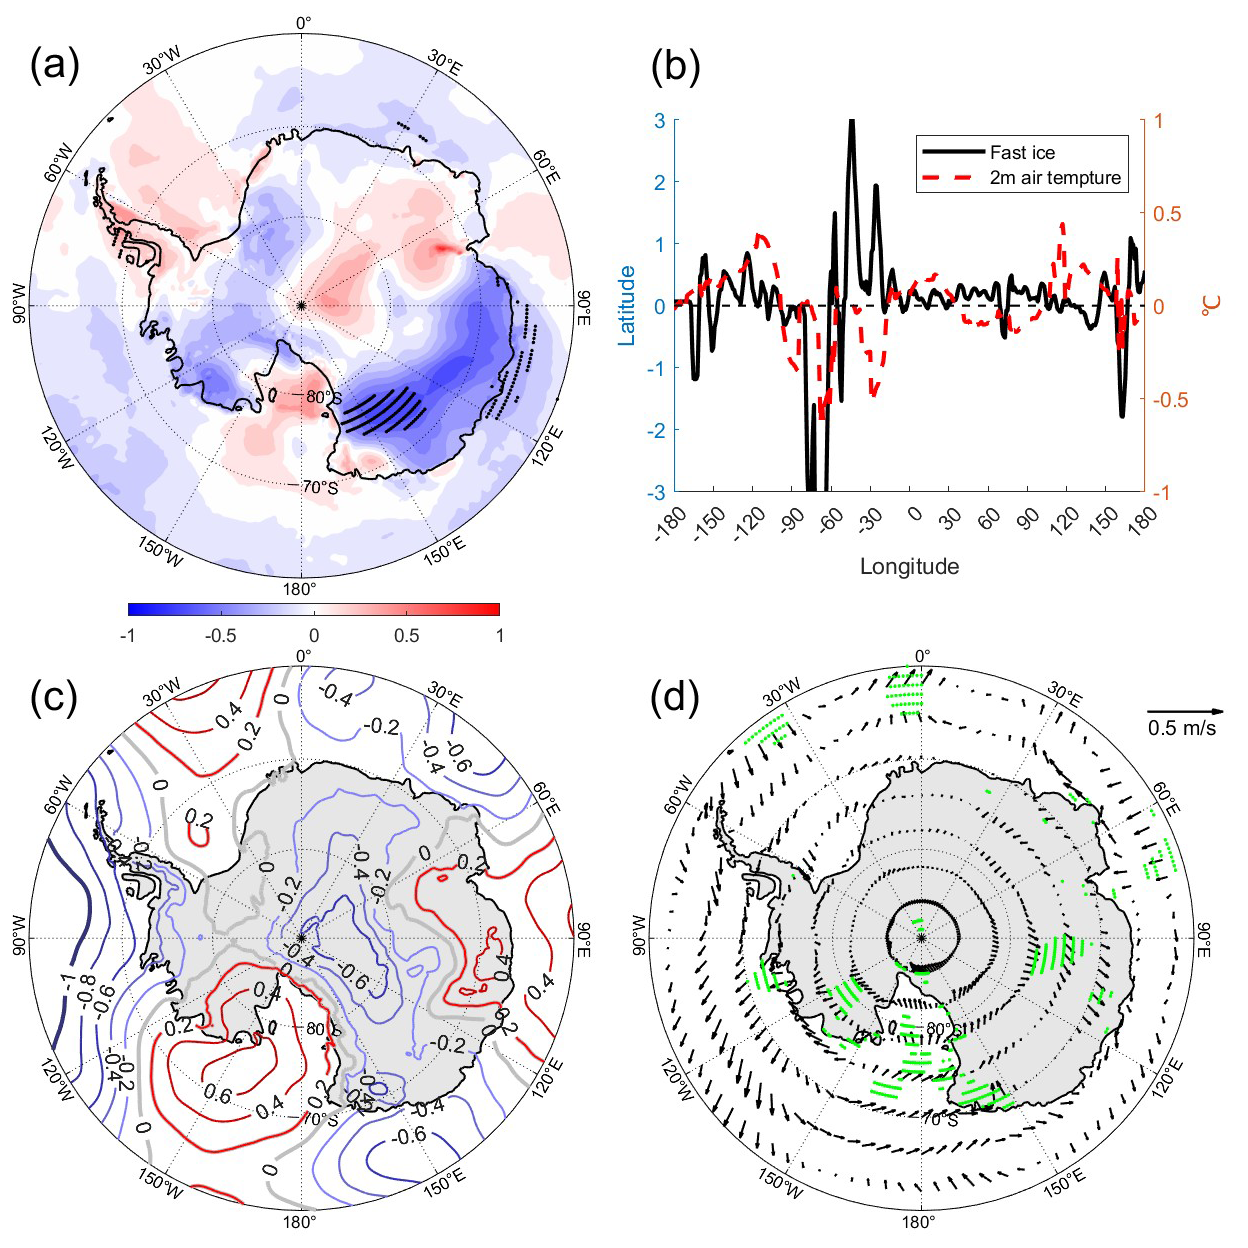
Figure 9The same as Fig. 6, but for summer.
In this study, we employed EOF analysis method to examine the main modes of the variation of seasonal Antarctic fast ice extent for the 2000–2018 period. These main modes show distinct temporal and spatial variability depending on seasons. Temporally, the PC1s exhibit a gradually increasing trend with fluctuations during the winter and spring. In contrast, during the summer and autumn, the PCs show an interannual and decadal variability. Spatially, the anomalies in fast ice extent are more pronounced in West Antarctica, particularly in the Antarctic Peninsula, the Bellingshausen and Weddell Seas. This finding is consistent with the changes in the width of fast ice zone (Li et al., 2020). This spatial variability is attributed to the complex coastline of West Antarctica and the presence of numerous peripheral islands, where changes in island-associated fast ice significantly contribute to regional anomalies. Li et al. (2020) also suggests that icebergs play a critical role in the formation and maintenance of fast ice along this coastline. In contrast, the Indian Ocean sector of East Antarctica, characterized by a smoother coastline, exhibits relatively minor variations.
The analysis further elucidates the physical mechanisms by which remote SST anomalies influence Antarctic fast ice. During the autumn, tropical SST anomalies trigger convective activity, leading to upper-level outgoing longwave radiation OLR anomalies. These anomalies excite planetary-scale atmospheric waves, manifested as alternating positive and negative geopotential height anomalies at 200 hPa. As these waves propagate poleward, they perturb near-coastal MSLP and wind fields due to barotropic structure, which directly modulate fast-ice formation or disintegration. Southerly winds, onshore zonal winds, and wind convergence in both direction and speed contribute to the expansion of fast ice extent, whereas northerly winds, offshore zonal winds, and wind divergence lead to reductions in fast ice coverage. Rapid, large-scale reductions in Antarctic fast-ice cover are typically triggered when offshore winds (often in combination with ocean swell and thermodynamic weakening) fracture or detach the ice, leading to its disintegration and opening of coastal polynyas. Additionally, wind anomalies indirectly affect fast ice by altering air temperatures, thereby influencing thermodynamic processes. During the winter and spring, the dominant driver shifts to the subtropical SST dipole mode in the Southern Hemisphere. This dipole pattern similarly influences Antarctic fast ice through the aforementioned chain of processes, though its spatial configuration shifts southward during spring. In the summer, the weakening of the SST dipole reduces the wavelength of atmospheric planetary waves, altering wind speed and direction patterns around Antarctica and resulting in distinct seasonal differences in fast ice variability compared to preceding seasons.
Aoki (2017) established a correlation between the latitude of fast ice edges and sea surface temperatures (SST) in the eastern equatorial Pacific, further describing a teleconnection mechanism whereby anomalously warm SSTs in the tropical eastern Pacific during the summer trigger Rossby waves that propagate toward East Antarctica's Queen Maud Land. Separately, Murphy et al. (2014) demonstrated linkages between Weddell Sea fast ice extent and climate modes (ENSO/SAM), noting that fast ice break-up is modulated by SAM-associated westerly/northwesterly winds. Our results align with their studies, extending previous studies into the entire Antarctic fast-ice zone.
Our study also reveals seasonal differences in the dominant factors controlling fast ice. During the autumn and winter, thermodynamic processes, particularly air temperature, predominantly govern ice extent across most regions. Higher temperatures are associated with less fast ice, while lower temperatures promote its expansion. However, in the spring and summer, when formation of new fast ice is limited, the correlation between air temperature and ice extent weakens, with over half of the regions showing no inverse relationship. Instead, wind direction and speed emerge as the primary dynamical drivers, explaining most of the variability in fast-ice extent. This suggests that dynamic forcing (e.g., wind-driven ice advection, compaction, and disintegration) dominates fast-ice anomalies during these seasons. Wei and Qin (2016) and Voermans et al. (2021) similarly concluded that during the spring, strong onshore winds and gale-driven ocean waves erode coastal fast ice margins.
Although we focused on the novel aspect of remote forcing of tropical and subtropical SSTs on Antarctic fast ice, we recognize that the direct oceanic forcing is local and includes both dynamic and thermodynamic factors. The former are related to currents, tidal effects, and swell (Inall et al., 2022), while basal melt is the primary thermodynamic factor (Kusahara et al., 2021).
The 18 year study period (2000–2018) was insufficient to capture the interdecadal-scale oscillations that may influence Antarctic fast ice dynamics. Long-term observations are required to disentangle these complex interactions between tropical SST anomalies and Antarctic fast ice and validate the proposed mechanisms. The impacts of global warming on Antarctic fast-ice extent should also be investigated in future studies. Further, to achieve more robust process-level attribution of the statistical results obtained, coupled climate model experiments with prescribed tropical SST anomalies are needed. Process-level understanding of the interannual and decadal variability of Antarctic fast-ice extent across seasons enhances our knowledge of the processes governing the variability and future evolution of Antarctic sea ice and ice shelves.
The fast-ice dataset analysed here is freely available at https://doi.org/10.26179/5d267d1ceb60c (Fraser and Massom, 2020). Monthly atmospheric variables are provided by the ERA5 reanalysis dataset (https://doi.org/10.24381/cds.f17050d7, Hersbach et al., 2023). Monthly sea surface temperature (SST) data are derived from the U.S. National Oceanic and Atmospheric Administration (NOAA)'s Extended Reconstructed SST dataset, version 5 (https://psl.noaa.gov/data/gridded/data.noaa.ersst.v5.html, last access: 14 June 2024). The OLR data are available from the NOAA Interpolated OLR (https://psl.noaa.gov/data/gridded/data.uninterp_OLR.html, last access: 14 June 2024). Computer code is available from the corresponding author upon reasonable request.
LY designed the study; CJ performed the EOF and regression analyses; CJ and LY wrote the manuscript draft with contributions from JZ and TV.
The contact author has declared that none of the authors has any competing interests.
Publisher's note: Copernicus Publications remains neutral with regard to jurisdictional claims made in the text, published maps, institutional affiliations, or any other geographical representation in this paper. The authors bear the ultimate responsibility for providing appropriate place names. Views expressed in the text are those of the authors and do not necessarily reflect the views of the publisher.
We thank the European Centre for Medium-Range Weather Forecasts (ECMWF) for making the ERA5 data available to the public.
This research has been supported by the National Key R&D Program of China (2024YFF0506601); the National Natural Science Foundation of China (grant nos. 42276251, 42576278, 42211530033). Jiechen Zhao was supported by the Taishan Scholars Program, and Timo Vihma was supported by the Research Council of Finland (contract 364657).
This paper was edited by Marco Gaetani and reviewed by two anonymous referees.
Aoki, S.: Breakup of land-fast sea ice in Lützow–Holm Bay, East Antarctica, and its teleconnection to tropical Pacific sea surface temperatures, Geophys. Res. Lett., 44, 3219–3227, https://doi.org/10.1002/2017GL072835, 2017.
Arndt, S., Hoppmann, M., Schmithüsen, H., Fraser, A. D., and Nicolaus, M.: Seasonal and interannual variability of landfast sea ice in Atka Bay, Weddell Sea, Antarctica, The Cryosphere, 14, 2775–2793, https://doi.org/10.5194/tc-14-2775-2020, 2020.
Baba, K. and Renwick, J.: Aspects of intraseasonal variability of Antarctic sea ice in austral winter related to ENSO and SAM events, J. Glaciol., 63, 838–846, https://doi.org/10.1017/jog.2017.49, 2017.
Bennetts, L. G. and Teder, N. J.: Fast ice: The last line of defence for weakened Antarctic ice shelves, Nat. Geosci., 18, 574–575, https://doi.org/10.1038/s41561-025-01714-3, 2025.
Bluhm, B., Swadling, K., and Gradinger, R.: Sea ice as a habitat for macrograzers, Sea ice, 3rd edn., edited by: Thomas, D., John Wiley & Sons, Ltd., https://doi.org/10.1002/9781118778371.ch16, 2017.
Brett, G. M., Irvin, A., Rack, W., Hass, C., Langhome, P. J., and Leonard, G. H.: Variability in the distribution of fast ice and the sub-ice platelet layer near McMurdo ice shelf, J. Geophys. Res.-Oceans, 125, e2019JC015678, https://doi.org/10.1029/2019JC015678, 2020.
Chung, E.-S., Kim, S.-J., Timmermann, A., Ha, K.-J., Lee, S.-K., Stuecker, M. F., Rodgers, K. B., Lee, S.-S., and Huang, L.: Antarctic sea-ice expansion and Southern Ocean cooling linked to tropical variability, Nat. Clim. Change, 12, 461–468, https://doi.org/10.1038/s41558-022-01339-z, 2022.
Clem, K. R. and Fogt, R. L.: Varying roles of ENSO and SAM on the Antarctic Peninsula climate in austral spring, J. Geophys. Res.-Atmos., 118, 11481–11492, https://doi.org/10.1002/jgrd.50860, 2013.
Clem, K. R., Renwick, J. A., and McGregor, J.: Large-Scale Forcing of the Amundsen Sea Low and Its Influence on Sea Ice and West Antarctic Temperature, J. Climate, 30, https://doi.org/10.1175/JCLI-D-16-0891.1,2017.
Coggins, J. H. J. and McDonald, A. J.: The influence of the Amundsen Sea Low on the winds in the Ross Sea and surroundings: Insights from a synoptic climatology, J. Geophys. Res.-Atmos., 120, 2167–2189, https://doi.org/10.1002/2014JD022830, 2015.
Crocker, G. B. and Wadhams, P.: Breakup of Antarctic fast ice, Cold Reg. Sci. Technol., 17, 61–76, https://doi.org/10.1038/s41561-025-01714-3, 1989.
Fedotov, V., Cherepanov, N., and Tyshko, K.: Some features of the growth, structure and metamorphism of East Antarctic landfast sea ice, Antarctic research series: Antarctic sea ice: Physical processes, interactions and variability, 1st edn., edited by: Jeffries, M., American Geophysical Union, 343–354, https://doi.org/10.1029/AR074p0343, 1998.
Fogt, R. L., Wovrosh, A. J., Ryan, A. L., and Simmonds, I.: The characteristic variability and connection to the underlying synoptic activity of the Amundsen-Bellingshausen Seas Low, J. Geophys. Res.-Atmos., 117, 7111, https://doi.org/10.1029/2011JD017337, 2012.
Fraser, A. D. and Massom, R.: Circum-Antarctic landfast sea ice extent, 2000–2018, Ver. 2.2, Australian Antarctic Data Centre [data set], https://doi.org/10.26179/5d267d1ceb60c, 2020.
Fraser, A. D., Massom, R. A., Michael, K. J., Galton-Fenzi, B. K., and Lieser, J. L.: East Antarctic landfast sea ice distribution and variability, 2000–08, J. Climate, 25, 1137–1156, https://doi.org/10.1175/JCLI-D-10-05032.1, 2012.
Fraser, A. D., Ohshima, K. I., Nihashi, S., Massom, R. A., Tamura, T., Nakata, K., Williams, G., Carpentier, S., and Willmes, S.: Landfast ice controls on sea-ice production in the Cape Darnley Polynya: A case study, Remote Sens. Environ., 233, 111315, https://doi.org/10.1016/j.rse.2019.111315, 2019.
Fraser, A. D., Massom, R. A., Handcock, M. S., Reid, P., Ohshima, K. I., Raphael, M. N., Cartwright, J., Klekociuk, A. R., Wang, Z., and Porter-Smith, R.: Eighteen-year record of circum-Antarctic landfast-sea-ice distribution allows detailed baseline characterisation and reveals trends and variability, The Cryosphere, 15, 5061–5077, https://doi.org/10.5194/tc-15-5061-2021, 2021.
Grotti, M., Soggia, F., Ianni, C., and Frache, R.: Trace metals distributions in coastal sea ice of Terra Nova Bay, Ross Sea, Antarctica, Antarct. Sci., 17, 289–300, https://doi.org/10.1017/S0954102005002695, 2005.
Heil, P.: Atmospheric conditions and fast ice at Davis, East Antarctica: A case study, J. Geophys. Res., 111, C05009, https://doi.org/10.1029/2005JC002904, 2006.
Herman, A., Wenta, M., and Cheng, S.: Sizes and shapes of sea ice floes broken by waves – A case study from the East Antarctic coast, Front. Earth Sci., 9, 655977, https://doi.org/10.3389/feart.2021.655977, 2021.
Hersbach, H., Bell, B., Berrisford, P., Hirahara, S., Horányi, A., Muñoz-Sabater, J., Nicolas, J., Peubey, C., Radu, R., Schepers, D., Simmons, A., Soci, C., Abdalla, S., Abellan, X., Balsamo, G., Bechtold, P., Biavati, G., Bidlot, J., Bonavita, M., De Chiara, G., Dahlgren, P., Dee, D., Diamantakis, M., Dragani, R., Flemming, J., Forbes, R., Fuentes, M., Geer, A., Haimberger, L., Healy, S., Hogan, R. J., Hólm, E., Janisková, M., Keeley, S., Laloyaux, P., Lopez, P., Lupu, C., Radnoti, G., de Rosnay, P., Rozum, I., Vamborg, F., Villaume, S., and Thépaut J.-N.: The ERA5 global reanalysis, Q. J. Roy. Meteor. Soc., 146, 1999–2049, https://doi.org/10.1002/qj.3803, 2020.
Hersbach, H., Bell, B., Berrisford, P., Biavati, G., Horányi, A., Muñoz Sabater, J., Nicolas, J., Peubey, C., Radu, R., Rozum, I., Schepers, D., Simmons, A., Soci, C., Dee, D., and Thépaut, J.-N.: ERA5 monthly averaged data on single levels from 1940 to present, Copernicus Climate Change Service (C3S) Climate Data Store (CDS) [data set], https://doi.org/10.24381/cds.f17050d7, 2023.
Hoffmann, L. and Spang, R.: An assessment of tropopause characteristics of the ERA5 and ERA-Interim meteorological reanalyses, Atmos. Chem. Phys., 22, 4019–4046, https://doi.org/10.5194/acp-22-4019-2022, 2022.
Hu, H., Zhao, J., Heil, P., Qin, Z., Ma, J., Hui, F., and Cheng, X.: Annual evolution of the ice–ocean interaction beneath landfast ice in Prydz Bay, East Antarctica, The Cryosphere, 17, 2231–2244, https://doi.org/10.5194/tc-17-2231-2023, 2023.
Inall, M., Brearley, A., Henley, S., Fraser, A. D., and Reed, S.: Landfast ice controls on turbulence in Antarctic coastal seas, J. Geophys. Res.-Oceans, 127, e2021JC017963, https://doi.org/10.1029/2021JC017963, 2022.
Irving, D. and Simmonds, I.: A Novel Approach to Diagnosing Southern Hemisphere Planetary Wave Activity and Its Influence on Regional Climate Variability, J. Climate, 28, 9041–9057, https://doi.org/10.1175/JCLI-D-15-0287.1, 2015.
Irving, D. and Simmonds, I.: A New Method for Identifying the Pacific–South American Pattern and Its Influence on Regional Climate Variability, J. Climate, 29, https://doi.org/10.1175/JCLI-D-15-0843.1, 2016.
Kawamura, T., Ohshima, K. I., Takizawa, T., and Ushio, S.: Physical, structural, and isotopic characteristics and growth processes of fast sea ice in Lützow–Holm Bay, Antarctica, J. Geophys. Res., 102, 3345–3355, https://doi.org/10.1029/96JC03206, 1997.
Kharitonov, V. V. and Borodkin, V. A.: Texture features of multi-year fresh ice in the Transcription bay, East Antarctica, in the period of summer melting, Led i Sneg, Ice and Snow, 62, 275–286, https://doi.org/10.31857/s2076673422020132, 2022.
Kusahara, K., Hirano, D., Fujii, M., Fraser, A. D., and Tamura, T.: Modeling intensive ocean–cryosphere interactions in Lützow–Holm Bay, East Antarctica, The Cryosphere, 15, 1697–1717, https://doi.org/10.5194/tc-15-1697-2021, 2021.
Leonard, G. H., Turner, K. E., Richter, M. E., Whittaker, M. S., and Smith, I. J.: Brief communication: The anomalous winter 2019 sea-ice conditions in McMurdo Sound, Antarctica, The Cryosphere, 15, 4999–5006, https://doi.org/10.5194/tc-15-4999-2021, 2021.
Li, N., Lei, R., Heil, P., Cheng, B., Ding, M., Tian, Z., and Li, B.: Seasonal and interannual variability of the landfast ice mass balance between 2009 and 2018 in Prydz Bay, East Antarctica, The Cryosphere, 17, 917–937, https://doi.org/10.5194/tc-17-917-2023, 2023.
Li, X., Shokre, M., Hui, F., Chi, Z., Heil, P., Chen, Z., Yu, Y., Zhai, M., and Cheng, X.: The spatio-temporal patterns of landfast ice in Antarctica during 2006–2011 and 2016–2017 using high-resolution SAR imagery, Remote Sens. Environ., 242, 111736, https://doi.org/10.1016/j.rse.2020.111736, 2020.
Liu, J., Li, X., Wang, S., Wei, Z., Hui, F., and Cheng, X.: Analysis of fast ice anomalies and their causes in 2023 in Prydz Bay, East Antarctica, Advances in Climate Change Research, 2024, 784–797, https://doi.org/10.1016/j.accre.2024.09.002, 2024.
Maksym, T.: Arctic and Antarctic Sea Ice Change: Contrasts, Commonalities, and Causes, Annu. Rev. Mar. Sci., 11, 187–213, https://doi.org/10.1146/annurev-marine-010816-060610, 2019.
Massom, R. A., Scambos, T. A., Bennetts, L. G., Reid, P., Squire, V. A., and Stammerjohn, S. E.: Antarctic ice shelf disintegration triggered by sea ice loss and ocean swell, Nature, 558, 383–389, https://doi.org/10.1038/s41586-018-0212-1, 2018.
McErlich, C., McDonald, A., Renwick, J., and Schuddeboom, A.: An assessment of Southern Hemisphere extratropical cyclones in ERA5 using WindSat. J. Geophys. Res.-Atmos., 128, e2023JD038554, https://doi.org/10.1029/2023JD038554, 2023.
Meehl, G. A., Arblaster, J. M., Bitz, C. M., Chung, C. T. Y., and Teng, H.: Antarctic sea-ice expansion between 2000 and 2014 driven by tropical Pacific decadal climate variability, Nat. Geosci., 9, 590–595, https://doi.org/10.1038/ngeo2751, 2016.
Meiners, K. M., Vancoppenolle, M., Carnat, G., Castellani, G., Delille, B., Delille, D., Dieckmann, G. S., Flores, H., Fripiat, F., Grotti, M., Lange, B. A., Lannuzel, D., Martin, A., McMinn, A., Nomura, D., Peeken, I., Rivaro, P., Ryan, K. G., Stefels, J., Swadling, K. M., Thomas, D. N., Tison, J.-L., van der Merwe, P., van Leeuwe, M. A., Weldrick, C., and Yang, E. J.: Chlorophyll-a in Antarctic landfast sea ice: A first synthesis of historical ice core data, J. Geophys. Res.-Oceans, 123, 8444–8459, https://doi.org/10.1029/2018JC014245, 2018.
Murphy, E. J., Clarke, A., Abram, N. J., and Turner, J.: Variability of sea-ice in the northern Weddell Sea during the 20th century, J. Geophys. Res.-Oceans, 119, 4549–4572, https://doi.org/10.1002/2013JC009511, 2014.
Ohshima, K. I., Fukamachi, Y., Williams, G. D., Nihashi, S., Roquet, F., Kitade, Y., Tamura, T., Hirano, D., Herraiz-Borreguero, L., Field, I., Hindell, M., Aoki, S., and Wakatsuchi, M.: Antarctic Bottom Water production by intense sea-ice formation in the Cape Darnley polynya, Nat. Geosci., 6, 235–240, https://doi.org/10.1038/ngeo1738, 2013.
Pezza, A. B., Rashid, H. A., and Simmonds, I., Climate links and recent extremes in antarctic sea ice, high-latitude cyclones, Southern Annular Mode and ENSO, Clim. Dynam., 38, 57–73, https://doi.org/10.1007/s00382-011-1044-y, 2012.
Porter-Smith, R., McKinlay, J., Fraser, A. D., and Massom, R. A.: Coastal complexity of the Antarctic continent, Earth Syst. Sci. Data, 13, 3103–3114, https://doi.org/10.5194/essd-13-3103-2021, 2021.
Simmonds, I. and Li, M.: Trends and variability in polar sea ice, global atmospheric circulations, and baroclinicity, Ann. NY Acad. Sci., 167–186, https://doi.org/10.1111/nyas.14673, 2021.
Squire, V. A.: Ocean wave interactions with sea ice: A reappraisal, Annu. Rev. Fluid Mech., 52, 37–60, https://doi.org/10.1146/annurev-fluid-010719-060301, 2020.
Teder, N. J., Bennetts, L. G., Reid, P. A., Massom, R. A., Pitt, J. P. A., Scambos, T. A., and Fraser, A. D.: Large-scale ice-shelf calving events follow prolonged amplifications in flexure, Nat. Geosci., 18, 599–606, https://doi.org/10.1038/s41561-025-01713-4, 2025.
Uotila, P., Vihma, T., and Tsukernik, M.: Close interactions between the Antarctic cyclone budget and large-scale atmospheric circulation, Geophys. Res. Lett., 40, https://doi.org/10.1002/grl.50560, 2013.
Ushio, S.: Factors affecting fast-ice break-up frequency in Lützow–Holm Bay, Antarcticaa, Ann. Glaciol., 44, 177–182, https://doi.org/10.3189/172756406781811835, 2006.
Voermans, J. J., Liu, Q., Marchenko, A., Rabault, J., Filchuk, K., Ryzhov, I., Heil, P., Waseda, T., Nose, T., Kodaira, T., Li, J., and Babanin, A. V.: Wave dispersion and dissipation in landfast ice: comparison of observations against models, The Cryosphere, 15, 5557–5575, https://doi.org/10.5194/tc-15-5557-2021, 2021.
Wei, L. and Qin, T.: Characteristics of cyclone climatology and variability in the Southern Ocean, Acta Oceanol. Sin., 35, 59–67, https://doi.org/10.1007/s13131-016-0913-y, 2016.
Wille, J. D., Favier, V., Jourdain, N. C., Kittel, C., Turton, J. V., Agosta, C., Gorodetskaya, I. V., Picard, G., Codron, F., Santos, C. L., Amory, C., Fettweis, X., Blanchet, J., Jomelli, V., and Berchet, A.: Intense atmospheric rivers can weaken ice shelf stability at the Antarctic Peninsula, Communications Earth and Environment, 3, 90, https://doi.org/10.1038/s43247-022-00422-9, 2022.
Xie, P., Wu, S., and Guo, Y.: CPC Daily Blended Outgoing Longwave Radiation (OLR) V1 data, https://www.psl.noaa.gov/data/gridded/data.cpc_blended_olr-2.5deg.html (last access: 14 June 2024), 2023.
Yu, L., Yang, Q., Zhou, M., Lenschow, D. H., Wang, X., Zhao, J., Sun, Q., Tian, Z., Shen, H., and Zhang, L.: The variability of surface radiation fluxes over landfast sea ice near Zhongshan station, east Antarctica during austral spring, Int. J. Digit. Earth, 12, 1–18, https://doi.org/10.1016/j.scitotenv.2019.02.264, 2017.
Yu, L., Zhong, S., Vihma, T., Sui, C., and Sun, B.: Linking the Antarctic sea ice extent changes during 1979–2020 to seasonal modes of Antarctic sea ice variability, Environ. Res. Lett., 17, 114026, https://doi.org/10.1088/1748-9326/ac9c73, 2022.
Zhai, M., Zhao, T., Hui, F., Cheng, X., Liu, A., Yuam, J., Yu, Y., and Ding, M.: Anomalous extensive landfast sea ice in the vicinity of inexpressible Island, Antarctica, Adv. Polar. Sci., 30, 406–411, https://doi.org/10.13679/j.advps.2018.0044, 2019.
Zhao, J., Cheng, B., Vihma, T., Yang, Q., Hui, F., Zhao, B., Hao, G., Shen, H., and Zhang, L.: Observation and thermodynamic modeling of the influence of snow cover on landfast sea ice thickness in Prydz Bay, East Antarctica, Cold Reg. Sci. Technol., 168, 102869, https://doi.org/10.1016/j.coldregions.2019.102869, 2019.
Zhao, J., Cheng, B., Vihma, T., Lu, P., Han, H., and Shu, Q.: The internal melting of landfast sea ice in Prydz Bay, East Antarctica, Environ. Res. Lett., 17, 074012, https://doi.org/10.1088/1748-9326/ac76d9, 2022.