the Creative Commons Attribution 4.0 License.
the Creative Commons Attribution 4.0 License.
 | 04 Mar 2026
Improving Arctic surface radiation estimation using a nonlinear perturbation model with a fused multi-satellite cloud fraction dataset
Yueming Zheng
Yichuan Ma
Xinyan Liu
Arctic has been undergoing rapid climate change, where radiative processes are key controlling factors. However, cloud-related uncertainties remain the primary barrier to accurately estimating the radiation budget. Strong coupling between clouds and other variables complicates the isolation of cloud-related impacts, and the linear assumptions in traditional models further restrict attribution of radiation changes to cloud-related influences. This study introduces an artificial neural network model that emulates radiative components typically represented in radiative transfer or climate models. Without relying on linear assumptions, the model directly quantifies the influence of cloud fraction (CF) on radiation. Using a more accurate CF dataset, we refined the monthly downwelling shortwave radiation (DSR) estimates from Clouds and the Earth's Radiant Energy System (CERES) SYN products and further estimated all-wave net radiation (NR) from the corrected DSR. Validation against ground-based observations confirmed that the CF-corrected DSR effectively mitigated the overestimation in CERES DSR, reducing biases by up to 23 W m−2. At sites where CF underestimation exceeded 25 %, the monthly-mean bias decreased from 25.70 to 4.88 W m−2, with RMSE reduced from 40.36 to 32.60 W m−2. The estimated monthly NR also improved markedly (RMSE reduced from 34.88 to 28.90 W m−2). Under large CF underestimation (>30 %), the CERES NR nearly failed (R2=0.0182), whereas NR derived from CF-corrected DSR retained reasonable agreement (R2=0.5411). Importantly, this work produces a new NR dataset with enhanced accuracy over the Arctic, offering direct value for studies of surface energy balance, climate feedbacks, and long-term variability.
- Article
(18198 KB) - Full-text XML
- BibTeX
- EndNote


The Arctic is currently warming at rates two to four times higher than those in lower latitudes (Cohen et al., 2020; Coulbury and Tan, 2024; Rantanen et al., 2022), a phenomenon known as Arctic amplification (Previdi et al., 2021). This rapid warming profoundly alters the Arctic climate system, affecting sea ice, permafrost, and atmospheric circulation patterns (Bennartz et al., 2013; Goosse et al., 2018). Among the key physical quantities that govern energy exchange in the climate system, surface net radiation (NR) – the net sum of between incoming and outgoing shortwave and longwave radiation at the surface – plays a central role in determining surface energy budgets, ice–albedo feedback, and surface temperature variability (Brown and Caldeira, 2017; Goessling et al., 2025; Huang et al., 2021; Loeb et al., 2022).
Despite its importance, current estimates of radiation over polar regions remain highly uncertain. According to the Intergovernmental Panel On Climate Change (IPCC, 2023), satellite-based assessments indicate that the uncertainties in global monthly mean fluxes are about 10 W m−2, while those over polar regions are even larger than other regions. These uncertainties can distort the assessment of surface energy balance, compromise the accuracy of global temperature trend estimates, and reduce the simulation reliability of changes in cryosphere (Cheng et al., 2017; Loeb et al., 2021; Prince and L'Ecuyer, 2024). Lee et al. (2019) showed that discrepancies in surface radiative fluxes among reanalysis datasets (up to ∼60 W m−2 in shortwave) can substantially affect Arctic sea-ice simulations, such flux differences led to sea-ice volume changes of 3000–4000 km3 and altered interannual variability by up to 40 %. This highlights the strong sensitivity of Arctic sea ice to uncertainties in surface radiation.
Improving the radiation estimates in the Arctic is therefore an urgent task, especially in the context of detecting early signals of anthropogenic influence and validating climate model projections (Danso et al., 2020; Van Tricht et al., 2016; Zheng et al., 2025). However, achieving this goal remains challenging due to the complex radiative interactions between surface and atmosphere. Among them, clouds represent a dominant source of uncertainty (Tao et al., 2025). Clouds regulate the Earth's radiation balance by reflecting incoming shortwave radiation and absorbing/emitting longwave radiation (Dessler, 2010; McCoy et al., 2017; Sledd and L'Ecuyer, 2019). However, in the Arctic, accurately detecting cloud remains challenging, particularly for passive satellite sensors. Clouds are characterized by numerous parameters such as optical depth, phase, height, and particle size, retrieving them consistently from spaceborne measurements is inherently difficult. Previous studies have demonstrated that CF plays a dominant role in regulating radiative fluxes (Qian et al., 2012). By controlling the areal extent of cloud coverage, CF exerts a first-order influence on shortwave radiation, whereas other cloud properties mainly modulate the radiative response within already cloudy regions. Among these variables, cloud fraction (CF) is arguably a simplified descriptor, yet it has become the most fundamental parameter for radiation studies owing to its availability across multiple satellite products with long temporal coverage and broad spatial extent. Despite this advantage, CF still suffers from considerable retrieval uncertainties, which can directly propagate into biases in surface radiation estimates. For instance, Liu (2022) showed that limitations in detecting low-level Arctic clouds with active sensors (25 % underestimation) can introduce errors in monthly mean cloud radiative forcing of up to ∼2.5 W m−2 at the surface and ∼3.4 W m−2 at the TOA. Zib et al. (2012) evaluated five reanalysis datasets against BSRN observations at Arctic sites and found that CF biases of up to 20 %–30 % could lead to monthly deviations in downward shortwave radiation (DSR) exceeding 90 W m−2. Wei et al. (2021), analyzing CMIP6 models showed that systematic CF overestimation of about 5 %–15 % in the Arctic resulted in positive biases in NR greater than 3 W m−2. These findings suggest that biases in CF is a substantial contributor of uncertainty in Arctic radiation estimation.
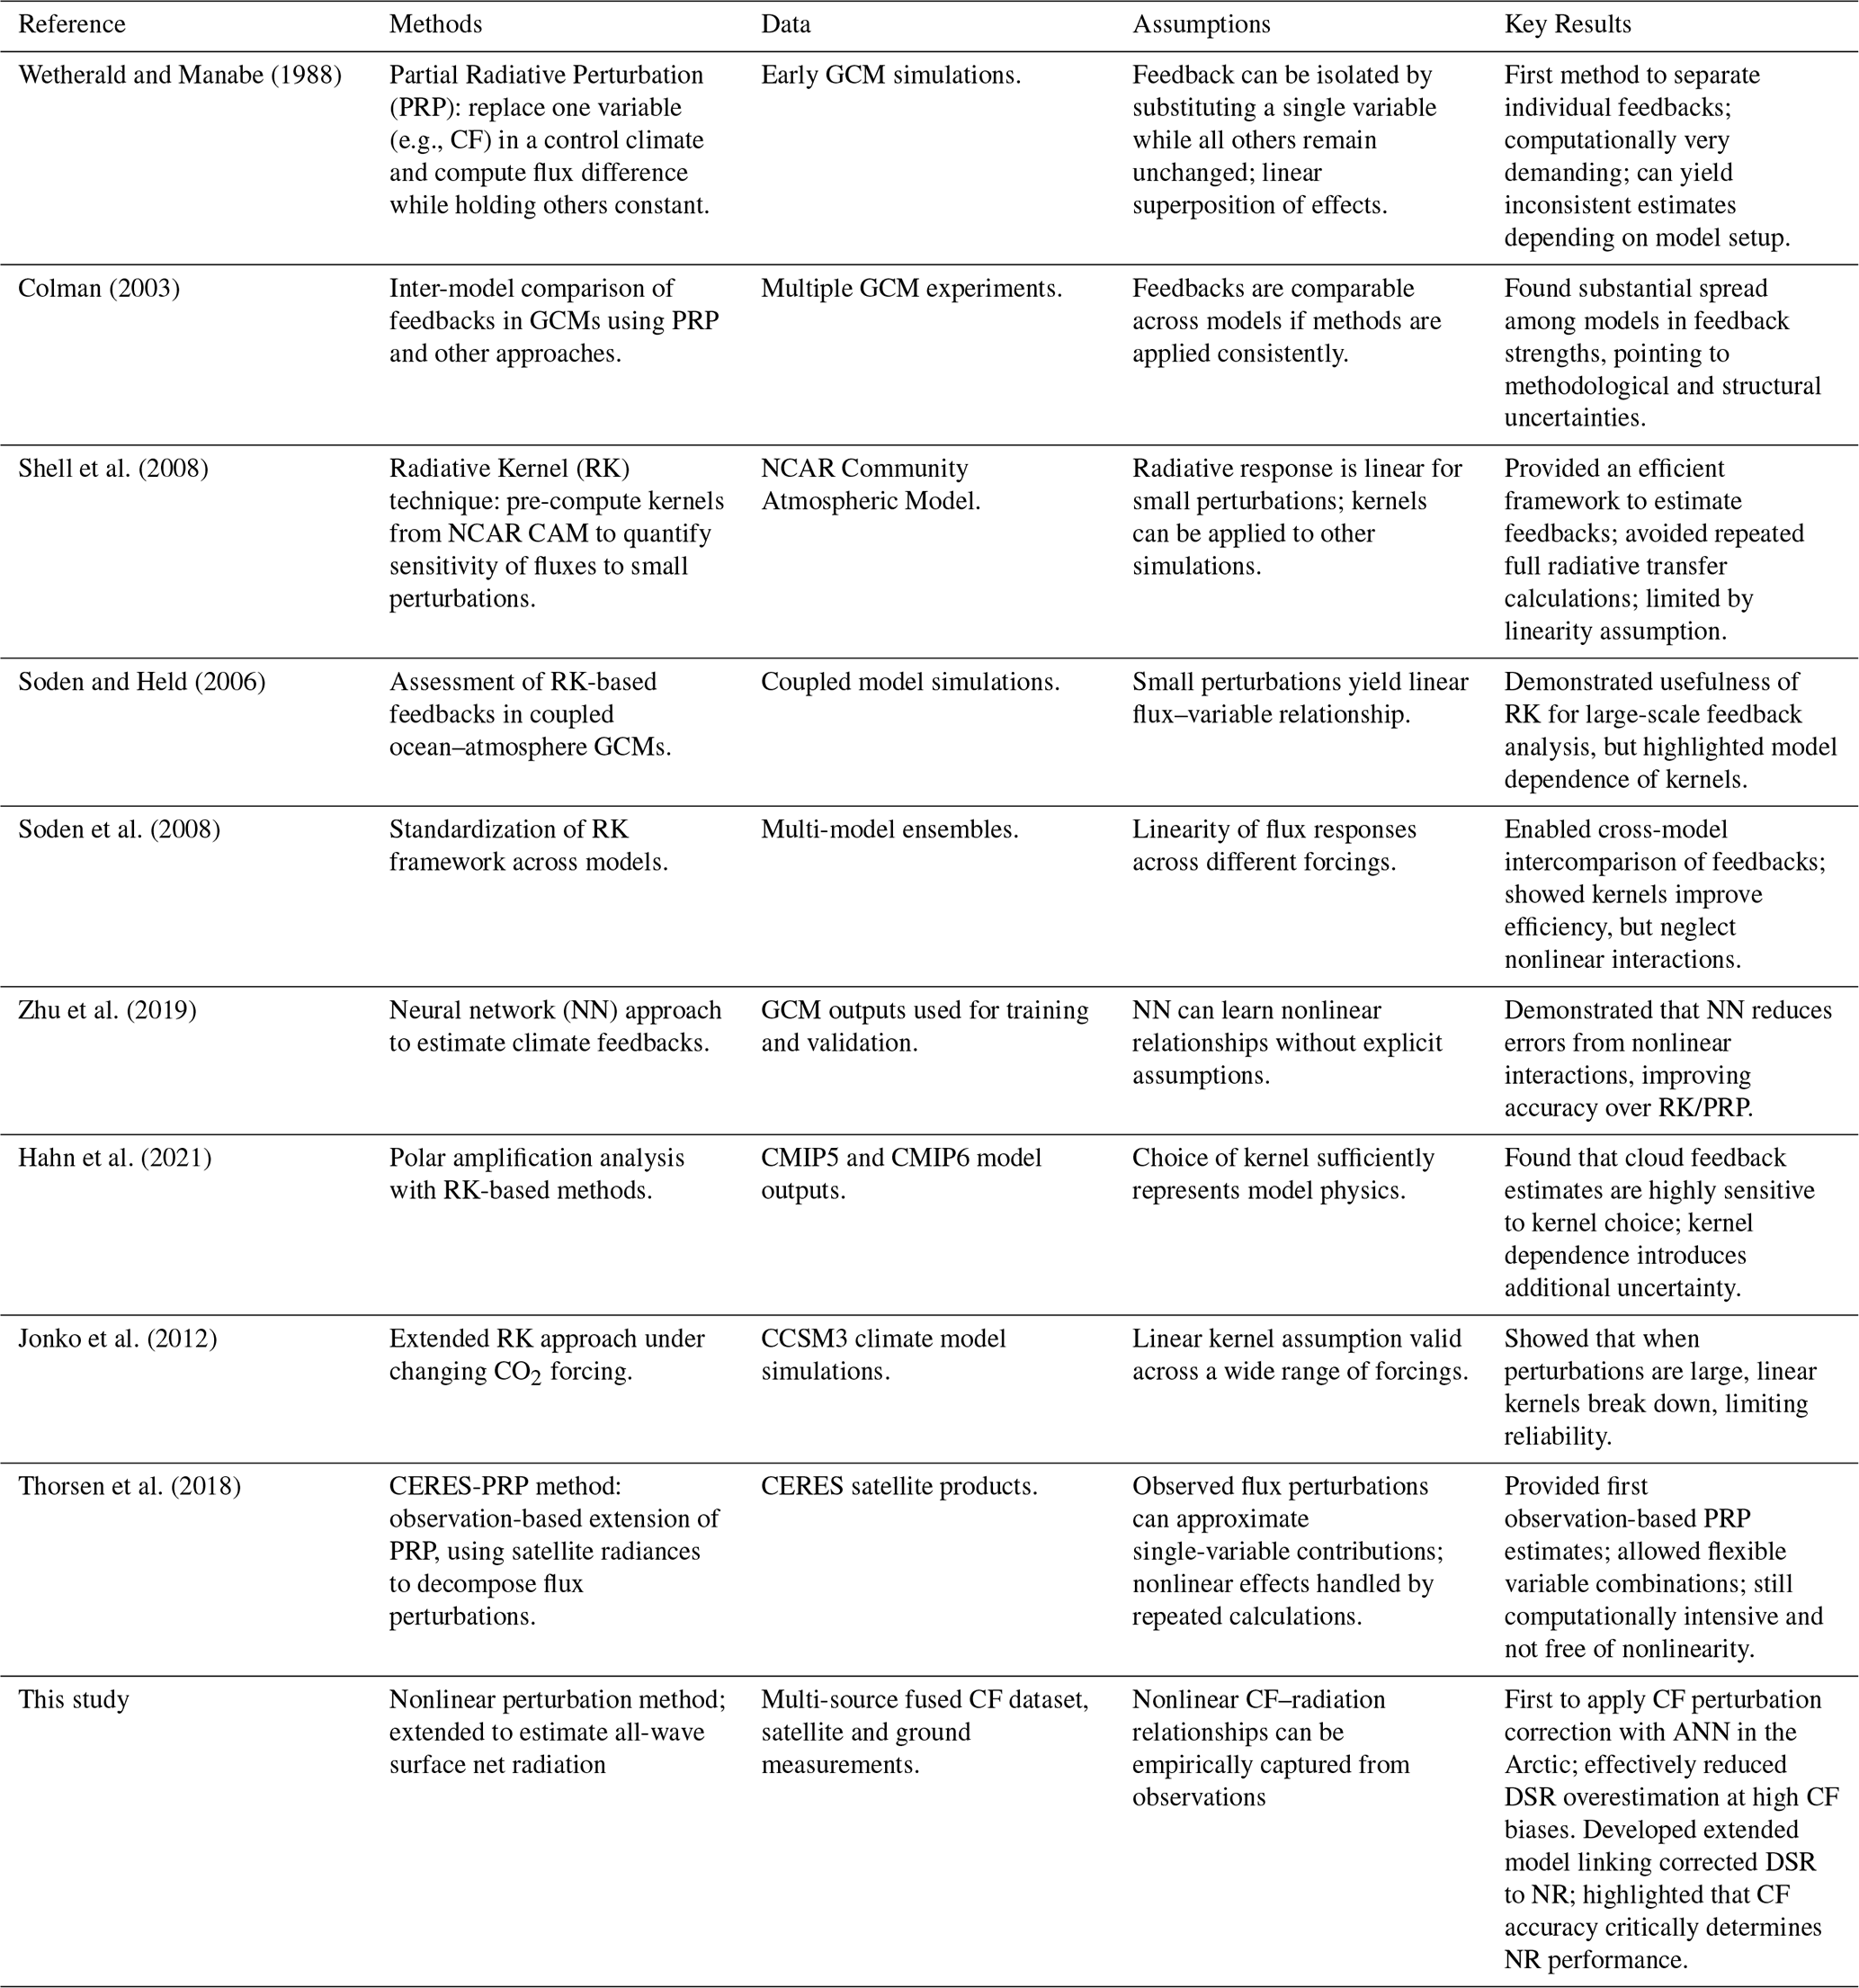
Given that biases in CF can directly propagate into uncertainties in radiation, it is therefore necessary to quantify the specific contributions of CF to the radiation budget. Such quantification provides a pathway for improving radiation estimates when more accurate CF datasets become available. In previous studies, the partial radiative perturbation (PRP) method has been widely used for this purpose because it explicitly separates the radiative influence of individual variables (e.g., CF), thereby offering a direct means to assess how CF errors translate into radiation biases. However, PRP requires repeated radiative transfer calculations and often yields inconsistent feedback estimates across models (Colman, 2003; Soden et al., 2004; Wetherald and Manabe, 1988). These limitations have motivated the development of several related perturbation-based approaches (Table 1). For example, the radiative kernel method improves computational efficiency by precomputing flux sensitivities, yet its assumption of linearity breaks down when cloud–radiation interactions are strongly nonlinear, leading to significant errors (Shell et al., 2008; Soden et al., 2008; Zhu et al., 2019). Moreover, the structure of the kernel itself varies across models, introducing model dependence and affecting cloud feedback estimates (Hahn et al., 2021; Jonko et al., 2012). Even satellite-based variants such as CERES-PRP reduce some model dependence but still require multiple computations and remain limited by the accuracy of the underlying CF datasets (Thorsen et al., 2018).
To address these challenges, we developed a nonlinear perturbation method that captures the relationship between CF perturbations and shortwave radiation changes under various atmospheric and surface conditions. Another major advancement of this study lies in the coupling of this method with a more accurate CF dataset that we previously developed (Liu et al., 2023). Unlike standard passive-sensor cloud products, this dataset employs spatiotemporal fusion techniques to merge CF information from active and passive satellite observations as well as ground-based measurements. Its fused, multi-source design substantially reduces biases in CF estimates and ensures improved spatiotemporal completeness. By coupling the nonlinear perturbation method with this enhanced CF dataset, we effectively corrected CF-induced DSR biases in the Clouds and the Earth's Radiant Energy System (CERES) SYN. Furthermore, to minimize potential error propagation arising from independently adjusting shortwave and longwave components, we extended the method to directly estimate the NR based on the corrected DSR. The objectives of this study are: (i) to construct a nonlinear perturbation relationship between CF and DSR based on satellite observations, and apply it to correct Arctic DSR with improved CF products; (ii) to develop an extended model for directly estimating NR based on the corrected DSR.
Table 1Summary of perturbation-based methods for quantifying radiative impacts of CF and other climate variables (the current paper is added for completeness).
2.1 CERES SYN1deg
The CERES SYN1deg product (Level 3) provides monthly, daily, and hourly averages of TOA fluxes based on the Angular Distribution Model (ADM), as well as TOA and surface fluxes derived from a radiative transfer model (Rutan et al., 2015). The ADM is a core component of the CERES retrieval algorithm, converting radiances observed under specific viewing geometries into broadband TOA fluxes. This conversion is accomplished by applying scene-dependent angular distribution functions that characterize the directional distribution of radiation for different surface and cloud conditions. Validation against Baseline Surface Radiation Network (BSRN) observations shows that hourly all-sky shortwave fluxes errors are typically within ±1 % globally and about −1.9 % poleward of 60°, with RMSE around 12.6 W m−2 globally and 19.4 W m−2 in the Arctic; monthly RMSE values are 5.7 W m−2 globally and 20.2 W m−2 at high latitudes (NASA POWER Project, 2024). The SYN1deg Ed4A product integrates fluxes observed by CERES with cloud properties derived from Moderate Resolution Imaging Spectroradiometer (MODIS) and Geostationary (GEO) image products (Doelling et al., 2013, 2016). Cloud retrievals are based on the CERES Cloud Working Group Ed4A algorithms (Minnis et al., 2011, 2021; Trepte et al., 2019), and above 60° latitude the SYN cloud products are fully consistent with those from SSF. Given that the SYN product provides only diurnal monthly averages of cloud properties, and that shortwave radiation is exclusively influenced by daytime cloud, this study utilizes cloud products sourced from the SSF, which offers daytime cloud data.
2.2 Fused Cloud Fraction of Arctic
Fused_cf_Arc is a daytime Arctic CF product developed by Liu et al. (2023) that employs spatiotemporal fusion methods, utilizing cumulative distribution function matching and Bayesian maximum entropy to integrate CF products from active satellites, passive satellites, and ground observations. This product spans the period from 2000 to 2020, offering a seamless monthly daytime average for the Arctic region with a spatial resolution of 1°. Compared to other products, Fused_cf_Arc provides more comprehensive spatiotemporal coverage and enhanced accuracy. Its coefficient of determination (R2) improves by approximately 0.20 to 0.48 when compared to products such as MOD08, CERES-SSF, International Satellite Cloud Climatology Project (ISCCP), Cloud, Albedo, and Radiative Transfer Algorithm (CLARA), and Cloud-Aerosol Lidar and Infrared Pathfinder Satellite Observations (CALIPSO). In terrestrial areas, the root mean square error (RMSE) and bias are reduced by approximately 6.09 % and 4.04 %, respectively. In marine regions, these metrics improve by 0.05 to 0.31, 2.85 %, and 3.15 %. Notably, the performance of Fused_cf_Arc is most significantly enhanced in the Greenland.
2.3 Merra-2 Reanalysis Data
MERRA-2 is a suite of global atmospheric reanalysis products developed by the NASA Global Modeling and Assimilation Office, incorporating recent advancements in modeling and data assimilation (Gelaro et al., 2017). It provides monthly global air temperature (Ta) and specific humidity data from 1980 onward. For the estimation of NR, the extended model required Ta and relative humidity (RH) as input variables. While RH is not directly available in MERRA-2, it can be derived from its specific humidity data.
2.4 GLASS FVC Product
Surface vegetation affects the relationship between shortwave radiation and NR (Chen et al., 2022). In this study, the GLASS fractional vegetation cover (FVC) was selected for its comprehensive spatiotemporal coverage and high accuracy. Jia et al. (2015) developed a robust FVC retrieval algorithm based on MODIS surface reflectance data, achieving an RMSE of 0.157 when validated against ground-based measurements. After applying gap-filling techniques, the GLASS FVC became spatially continuous at the global scale, making it highly suitable for various vegetation monitoring and research applications (Wang et al., 2020). This dataset features a spatial resolution of 500 m and a temporal resolution of 8 d.
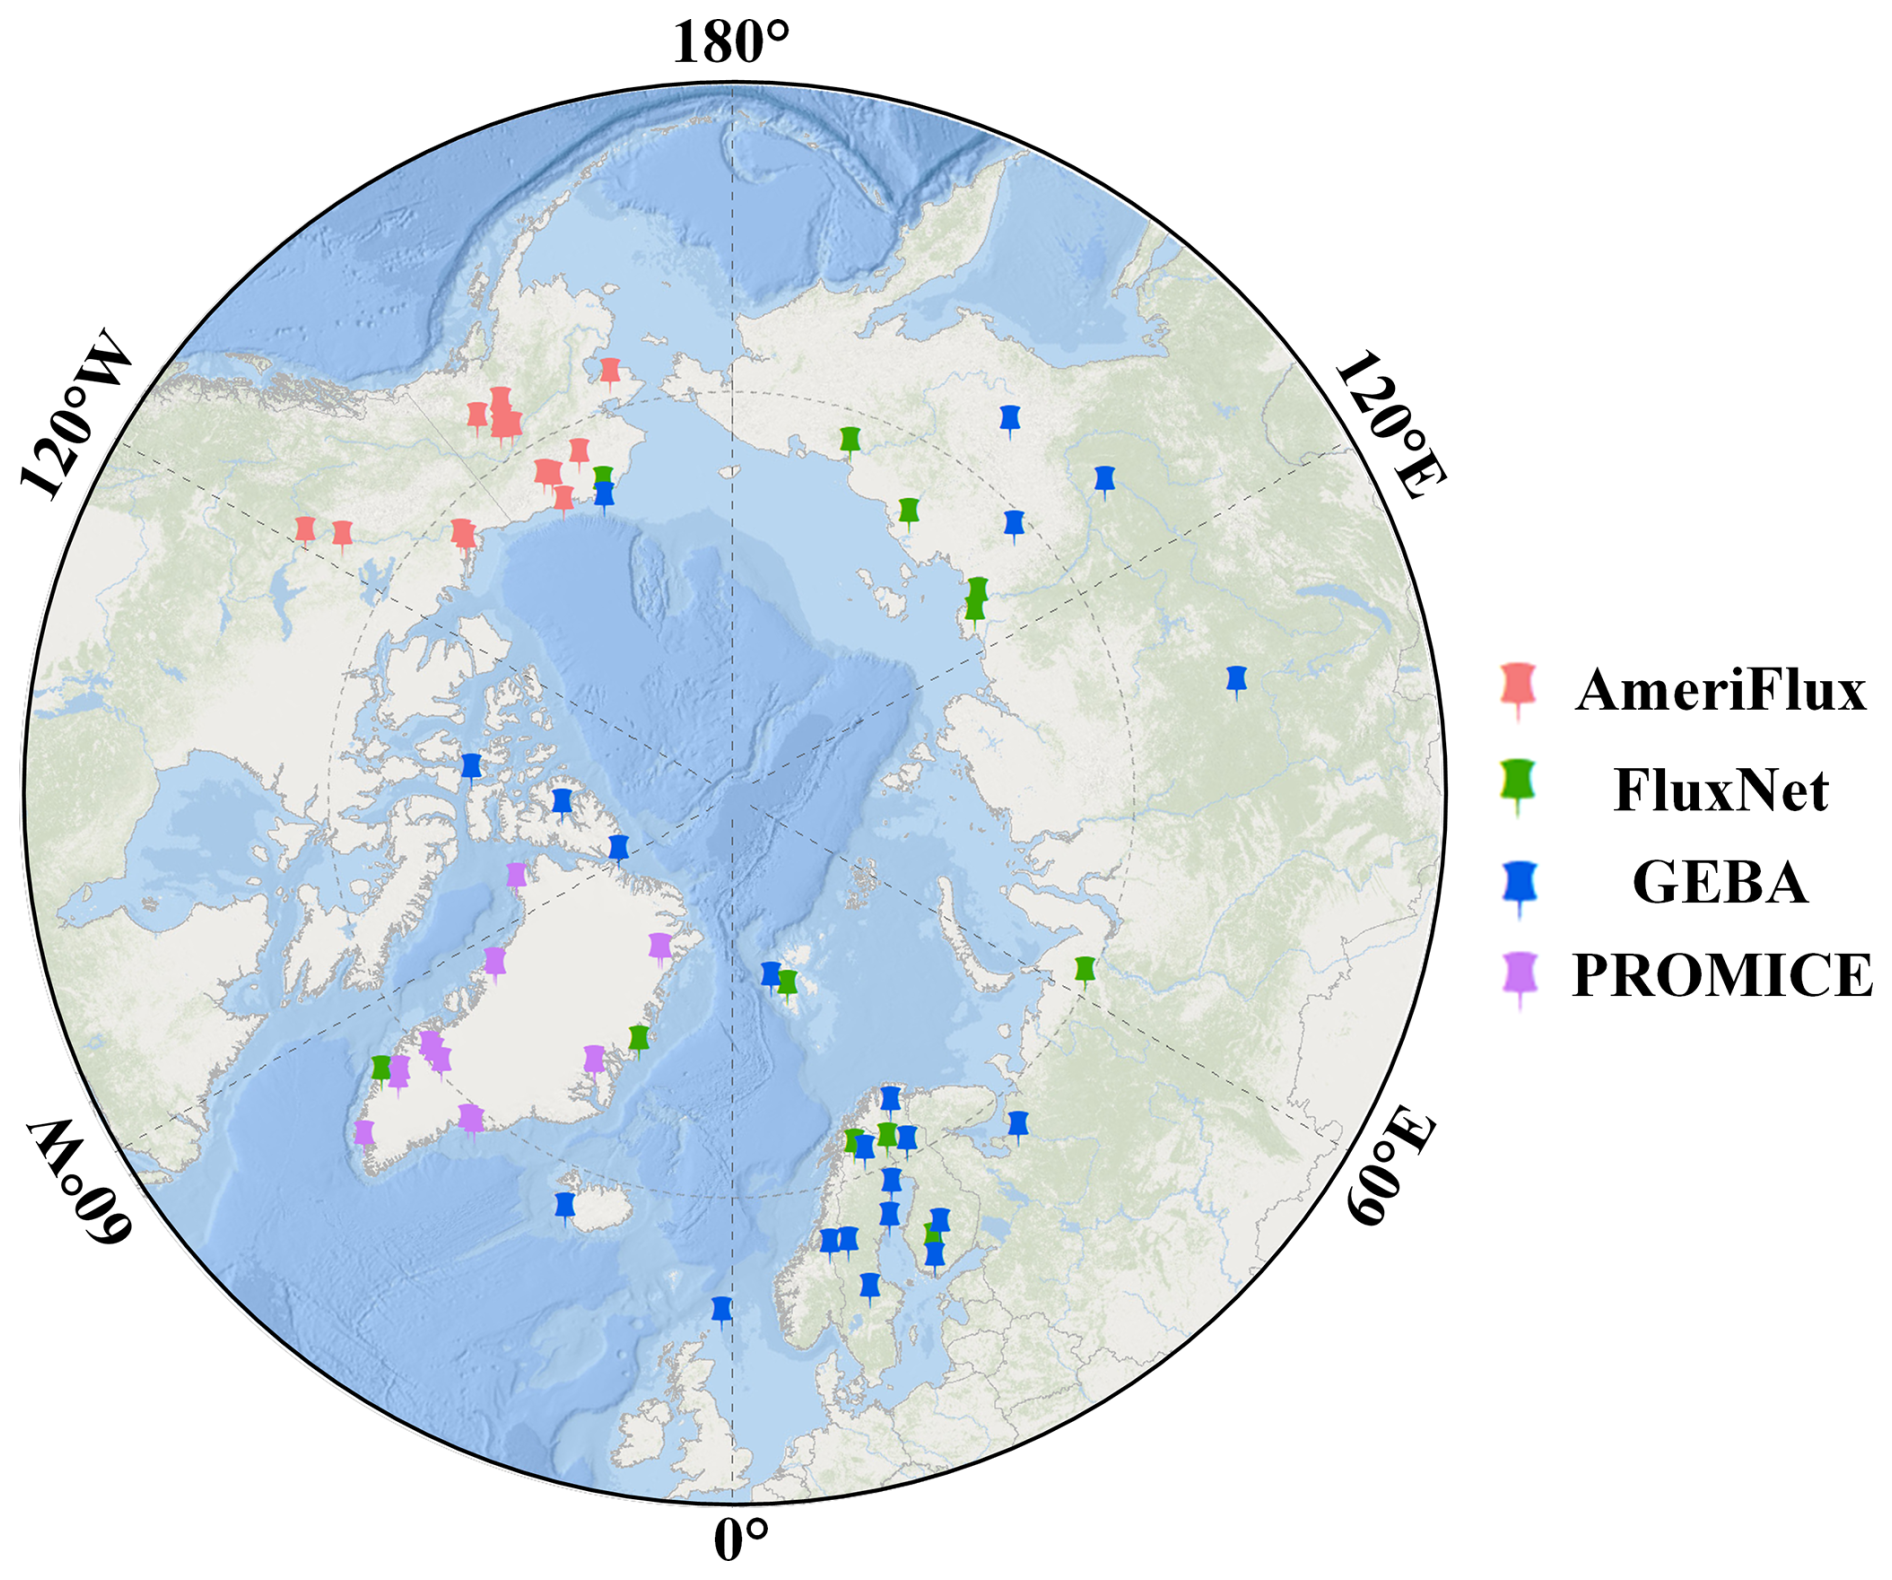
Figure 1Spatial distribution of 66 ground stations from four radiation flux networks. The base map was designed and developed by Esri | Powered by Esri. For more information on this map, visit https://goto.arcgisonline.com/maps/Arctic_Ocean_Base (last access: 27 February 2026).
2.5 Ground-measured data
Ground measurements provide accurate surface radiation observation data that can be used to validate our results. In this study, ground measurement data were obtained from four reliable radiation flux observation networks: FLUXNET, AmeriFlux, Global Energy Balance Archive (GEBA), and The Programme for Monitoring of the Greenland Ice Sheet (PROMICE) (Fig. 1).
FLUXNET is one of the largest global flux observation networks, integrating over 800 active and historical sites that span most climate zones and representative biomes to monitor carbon, water, and energy fluxes in terrestrial ecosystems (Pastorello et al., 2017). For this research, 13 sites that include data on radiation were selected for analysis. Within this global network, AmeriFlux serves as the North American regional component, supported by the U.S. Department of Energy and partner agencies. Established in 1996 with about 15 sites, AmeriFlux has expanded to more than 110 active towers across diverse ecosystems. For this study, we used data from 18 AmeriFlux sites located north of 60° N that include radiation measurements, primarily in northern and western Alaska.
The GEBA database is designed to centrally store measurements of surface energy flux from around the world, maintained by the Swiss Federal Institute of Technology Zurich (Wild et al., 2017). This database includes observational data for 15 components of surface energy flux, strictly comprising only directly measured surface fluxes and excluding empirically derived fluxes. Gilgen et al. (1998) provide a detailed description of the error estimates and quality checks applied to these data. The Arctic contains a significant number of GEBA sites, including ocean buoys and ground observation stations. However, most of these sites have relatively short operational periods. In this study, 22 sites within the 2000–2020 were selected for validation.
The PROMICE is a project aimed at monitoring changes in the Greenland ice sheet, operated by Denmark, Greenland, and other partners (Fausto et al., 2021). PROMICE has established a network across the western, central, and eastern regions of Greenland to monitor variables such as surface elevation changes, snow depth, temperature, humidity, and the impact of global climate change on the ice sheet. In this study, 14 sites from the PROMICE network, covering the period from 2000 to 2020, were selected as validation data.
The improved estimation of NR was carried out in two steps. First, we developed a nonlinear perturbation model based entirely on satellite observations, using an artificial neural network (ANN) to quantify DSR biases induced by CF errors. This model was applied to correct the DSR from CERES SYN using a more accurate CF dataset. In the second step, to avoid the propagation of errors caused by separately correcting shortwave and longwave components, we incorporated additional auxiliary variables – including MERRA-2 air temperature (Ta) and relative humidity (RH), as well as GLASS fractional vegetation cover (FVC) – and constructed an extended model to directly estimate NR based on the corrected DSR.
3.1 Bias Correction of Shortwave Radiation Using a Nonlinear CF Perturbation Model
3.1.1 Theoretical framework
The theoretical foundation of the methods used in this study is based on the observation-based radiation kernel approach (CERES-PRP) proposed by Thorsen et al. (2018), which has been further improved. CERES-PRP employs the NASA Langley Fu-Liou radiation transfer model, with model inputs primarily derived from various observational datasets (monthly means) used in the processing of CERES version 4 data products. CERES-PRP calculates the radiation perturbation δFΔx,CM caused by some perturbation Δx of variable x using the central difference method:
where the fluxes F are at some level of atmospheric level (TOA or surface), calculated using NASA Langley Fu-Liou radiation transfer model. and represent the effect of perturbation Δx calculated using forward and backward finite differences, respectively. The subscript “C” and “M” denote that the flux perturbation is relative to the climatological monthly mean base state and the monthly mean base state, respectively. x denotes the monthly mean, and Δx is the deseasonalized anomaly in the monthly mean value x relative to the climatological monthly mean , defined as . refers to the monthly means of all other variables related to radiation transfer. ( denote the climatological monthly means. OCM(Δx2) represents the minimized truncation error.
Since the fluxes computed relative to the monthly () and climatological () have different time average-related biases, this reduces the accuracy of Eq. (1). The δFΔx,CM can also be calculated using the following formula:
First, the radiation perturbation δFΔx is calculated using the monthly mean-based equations (Eqs. 3 and 5). If, during the calculation, the variable x+Δx results in non-physical values (e.g., for CF perturbations, x+Δx may become less than 0 or greater than 100), the rules outlined by Thorsen et al. (2018) are followed. In this case, either Eq. (2) or Eq. (4) is selected for the calculation, or the cloud boundary perturbation is adjusted to be as close as possible to the true perturbation without being unphysical. Finally, all valid calculation results are averaged to obtain the final central differencing δFΔx. Since the calculation of δFΔx requires intensive radiative transfer computations, to enhance computational efficiency, the RK is pre-calculated. Multiple calculations are performed as needed to avoid nonlinearity in the RK. In subsequent applications, the δFΔx can be obtained directly by multiplying the known perturbation Δx by the corresponding kernel coefficient KΔx:
3.1.2 Nonlinear CF Perturbation Model
To replace the extensive radiation transfer calculations (Eqs. 1 to 5) and further avoid additional pre-computation of the RK (Eq. 6), we employ an ANN model to construct the relationship between the perturbation variable (CF) and shortwave fluxes. Subsequently, the radiative perturbation δFΔcf induced by a change Δcf in the perturbation variable CF can be directly derived from Eq. (7).
where fANN represents the nonlinear function linking input variables and shortwave radiation. FSYN is the radiation from the CERES SYN, “cf” is from the CERES SSF CF, Δcf represents the difference between the CF in the CERES SSF and the Fused_cf_Arc, non-physical perturbation values are addressed following the rules proposed by Thorsen et al. (2018), and O(Δcf2) is the truncation error in the ANN model calculation process. Due to the strong capability of ANN in capturing nonlinear dependencies, this residual term is found to be negligibly small and therefore omitted. The corrected shortwave radiation using the improved CF dataset is then written as:
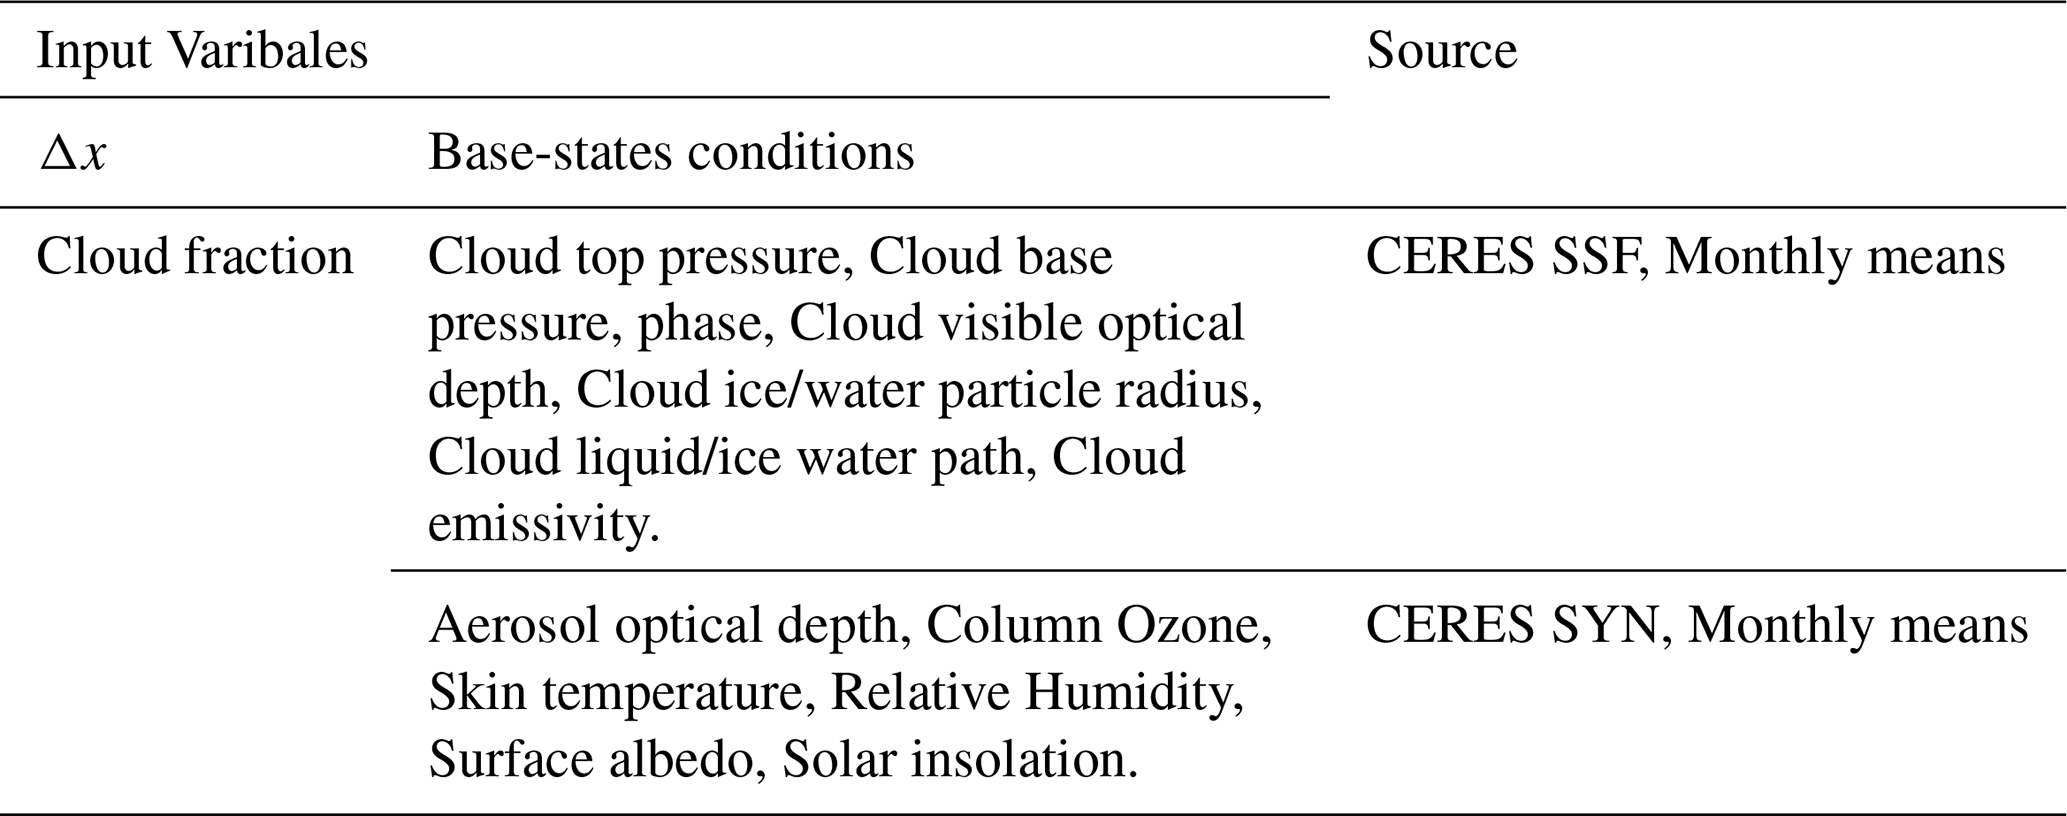
The ANN model is trained using the backpropagation (BP) algorithm with 40 neurons in the hidden layer, a maximum of 400 iterations, a learning rate of 0.03, and a target error of 0.00004, while other parameters were set to their default values. The model inputs were derived entirely from the monthly means of the CERES version 4 dataset, including cloud properties and other meteorological variables related to radiation transfer theory (Table 2), with the dependent variables being shortwave radiation, covering data from April to September 2003 to April to September 2020. 70 % of the data was randomly selected for training, while 30 % was used for validation.
3.2 Extended Model for all-wave net radiation Estimation
Shortwave radiation plays a crucial role in the formation of NR. Building upon our previous research (Chen et al., 2022), we further leveraged the strong correlation between shortwave radiation and NR to develop an extended estimation model based on shortwave radiation. To implicitly constrain the longwave component of NR, near-surface air temperature and atmospheric humidity are included as key thermodynamic variables related to surface emission and atmospheric emissivity. Fractional vegetation cover is used as an integrated indicator of land surface conditions affecting radiative partitioning. Previous studies have demonstrated that vegetation and temperature are key factors in regulating the relationship between shortwave radiation and NR (Huang et al., 2016; Jiang et al., 2015), while the length of daylight (LRD) has been found to influence their daily mean relationship (Chen et al., 2020). Accordingly, the extended model incorporates shortwave radiation, surface albedo, LRD, fractional vegetation cover (FVC), Ta, and RH as key variables, all aggregated to monthly means as model inputs. Ultimately, the NR was estimated as follows:
where f is constructed using an ANN model, NR, DSR, and albedo are derived from CERES observations. The LRD is calculated pixel by pixel based on solar angles and pixel latitude and longitude. FVC is obtained from the GLASS product, Ta and RH are sourced from MERRA-2 or derived from its data. To ensure spatial consistency, all ancillary variables were reprojected and resampled to the native spatial resolution and grid of the CERES product prior to model construction. Nearest-neighbor resampling was applied to preserve the original physical values of each variable.
3.3 Evaluation statistics
We conducted a comparative evaluation of the radiation before and after correction using ground station data, employing the following three statistical metrics:
where yi is the radiation before/after correction, is the mean of the radiation before/after correction. Yground,i is the ground-based measured radiation, and is the mean of the ground-based measured radiation.
4.1 CF Perturbation Model training and validation
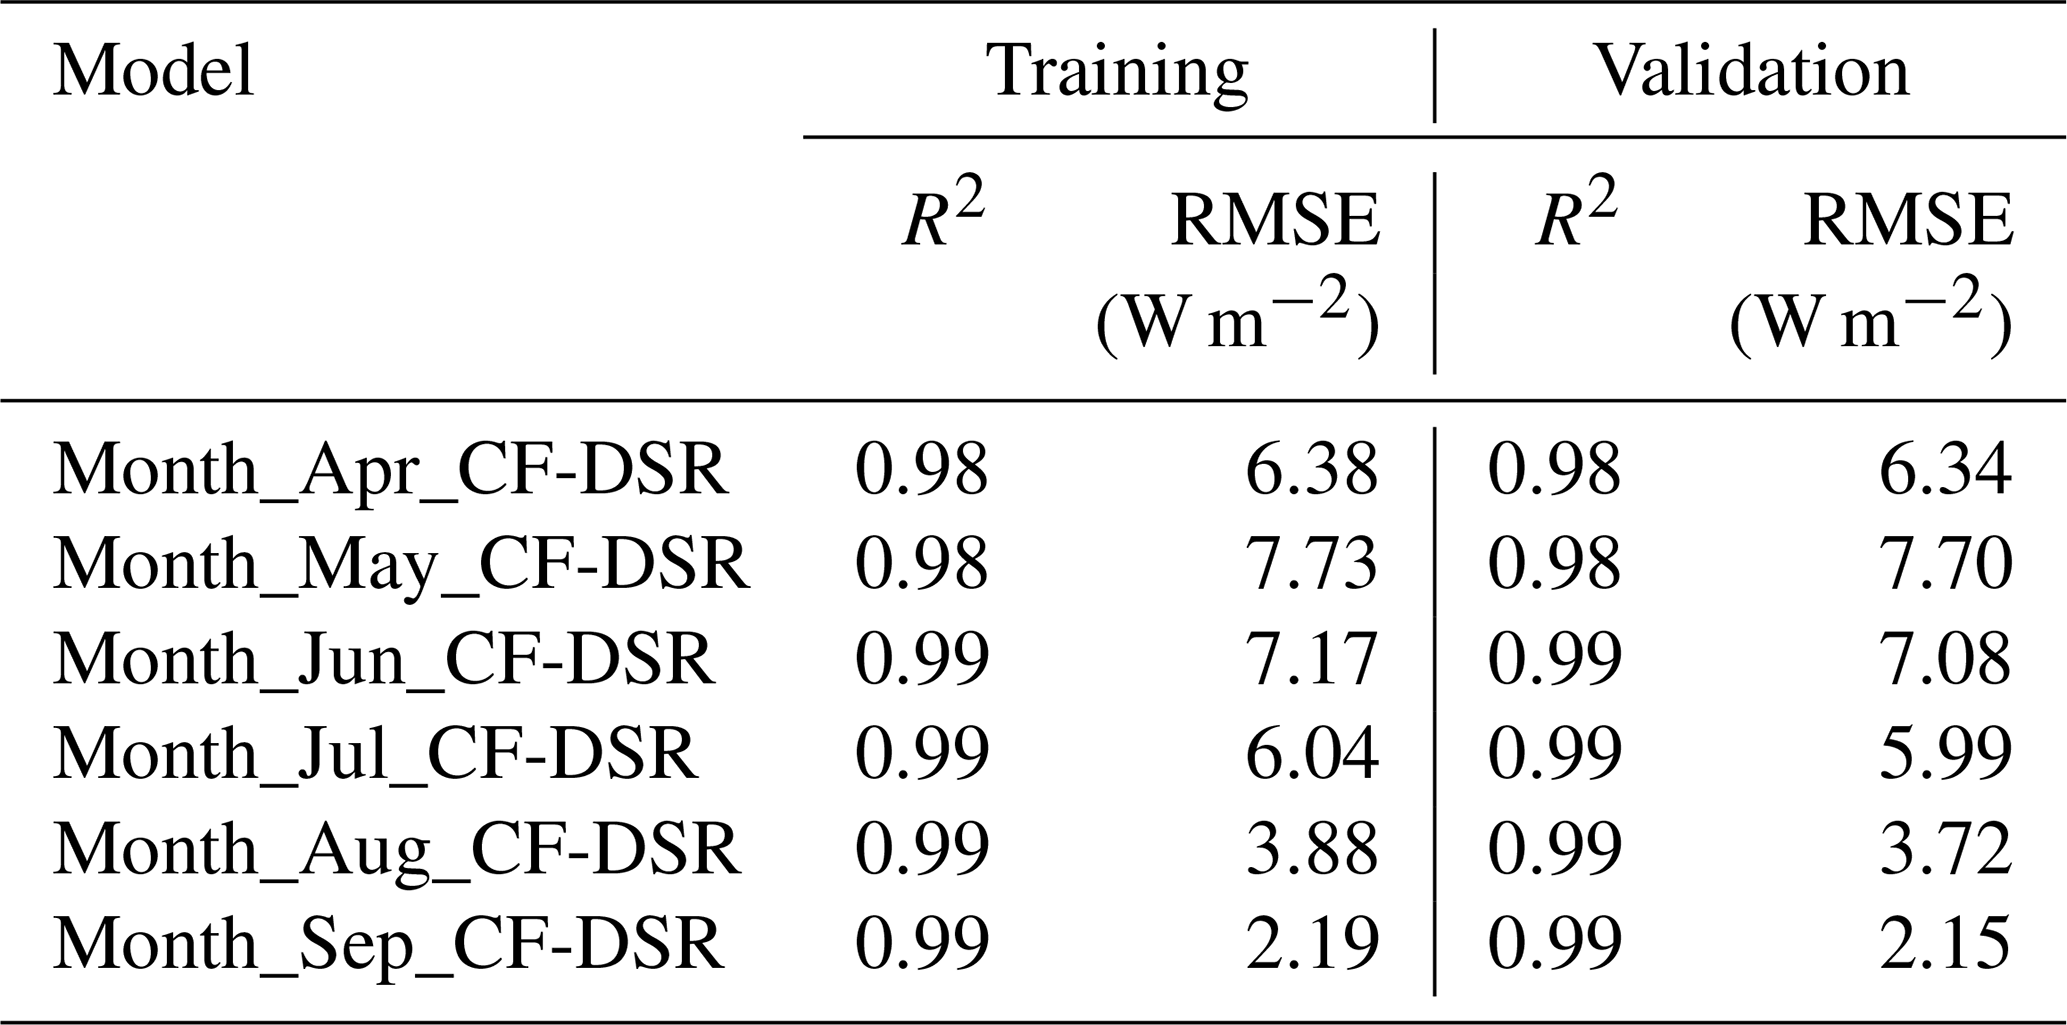
As there are obvious seasonal variations in radiation, we developed separate ANN models for each month. Table 3 presents the accuracy of all models on the training and validation datasets. All models exhibit an R2 value greater than 0.98 on both the training and validation datasets, with most reaching 0.99. The root-mean square errors (RMSEs) are below 7.7 W m−2, showing slight variation across months, peaking in June and reaching its lowest in September. For all models, the RMSEs during the validation process is slightly lower than that during the training process, indicating that the models did not overfit. Overall, the results demonstrate that our models possess high reliability.
Table 3Training and validation accuracy of CF-Radiation Perturbation Model. Note “Month_Apr_CF-DSR” refers to the CF-DSR perturbation model for April.
4.2 Validation of corrected DSR against ground measurements
Figure 2 presents the validation of our corrected DSR estimates using all ground station data, alongside the CERES SYN DSR for comparison. The results show improvements across all metrics following adjustment. Specifically, R2 increased from 0.8453 to 0.8527, RMSE decreased from 28.14 to 27.04 W m−2, and bias reduced from 1.18 to −0.06 W m−2. The corrected DSR align more closely with the 1:1 line, particularly showing notable improvements in addressing the overestimation of DSR. These results are expected, as our cloud product provides more comprehensive coverage, capturing higher daytime CFs compared to CERES (Liu et al., 2023), which leads to reduced DSR values.
We further present the validation results for sites where CERES significantly underestimates CF relative to Fused_cf_Arc (Fig. 3), which more clearly highlight the performance of the corrected DSR. For sites with CF underestimation exceeding 10 %, RMSE decreased from 33.09 to 30.37 W m−2, and bias reduced from 10.98 to 1.01 W m−2. For sites with CF underestimation greater than 20 %, RMSE decreased from 38.36 to 32.37 W m−2, with a remarkable bias improvement, dropping by nearly 20 W m−2 (from 22.41 to 3.68 W m−2). These results demonstrate that the DSR corrected using the more accurate cloud product shows substantial improvements under conditions where CERES CF is severely underestimated.
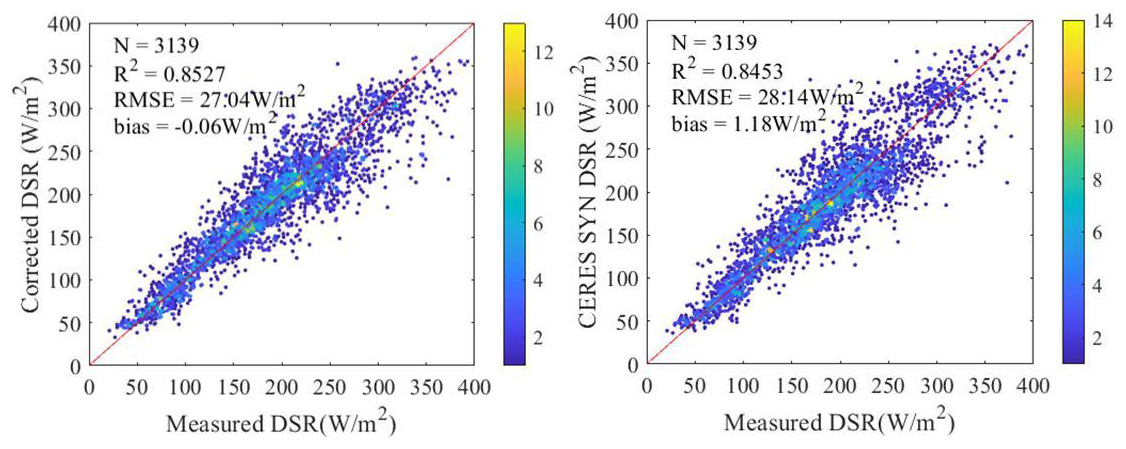
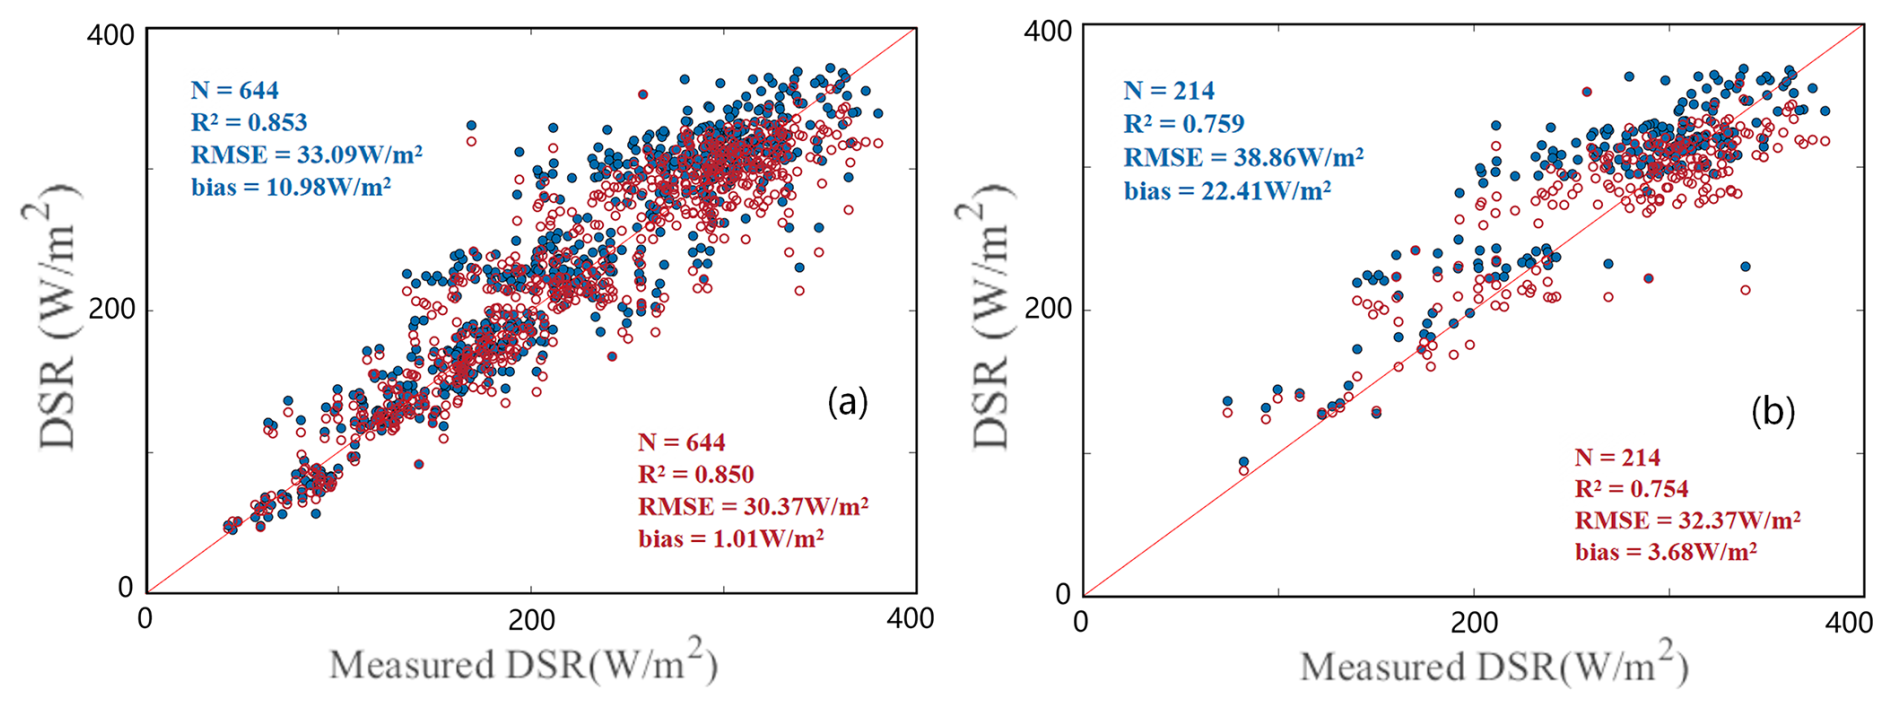
Figure 3Validation of DSR against ground stations before and after correction at sites where CERES CF is underestimated relative to Fused_cf_Arc by more than 10 % (a) and 20 % (b). Blue represents the values before correction, while red represents the values after correction.
We further examined the DSR at stations where CERES CF was increasingly underestimated relative to Fused_cf_Arc, in order to evaluate the performance of the correction under different levels of CF underestimation. The results reveal that both RMSE and bias are closely related to the magnitude of this underestimation. For RMSE (Fig. 4), the corrected DSR shows relatively stable performance when CERES CF underestimation ranges from more than 5 % up to more than 30 %, with RMSE values increasing only moderately from 28 to 33.4 W m−2. When the CF underestimation further exceeds 30 % and reaches 35 %, the RMSE rises more sharply, reaching 41.06 W m−2. By contrast, the uncorrected DSR (CERES DSR) exhibits a much stronger sensitivity to CF underestimation, with RMSE steadily increasing from 30.57 W m−2 at stations with CF underestimation greater than 5 % to as high as 46.42 W m−2 at greater than 35 %. Similarly, the bias (Fig. 4) indicates that the correction substantially reduces systematic deviations. After correction, the bias changes gradually from −0.40 to 10.13 W m−2 across the range of stations with CF underestimation greater than 5 % to greater than 35 %. In comparison, the uncorrected DSR shows a considerably larger positive bias, increasing from 2.83 to 33.05 W m−2. These results demonstrate that the CF-based correction effectively mitigates both random and systematic errors, particularly under conditions with moderate to large CF underestimation.
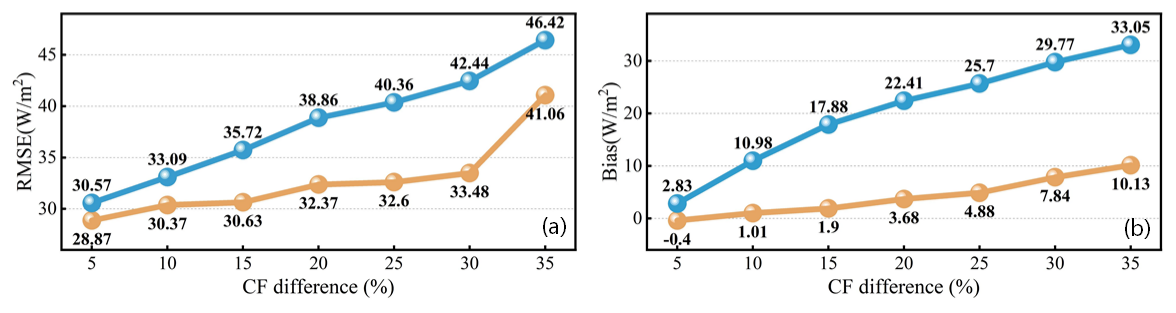
Figure 4Validation of DSR against ground-based observations before and after correction for stations with CF differences exceeding various thresholds (Fused_cf_Arc – CERES SYN). The x axis denotes CF difference thresholds (%, e.g., >5 %, >10 %, … >35 %), while the y axis represents the RMSE (a) or bias (b). Blue and orange curves correspond to results before and after correction, respectively.
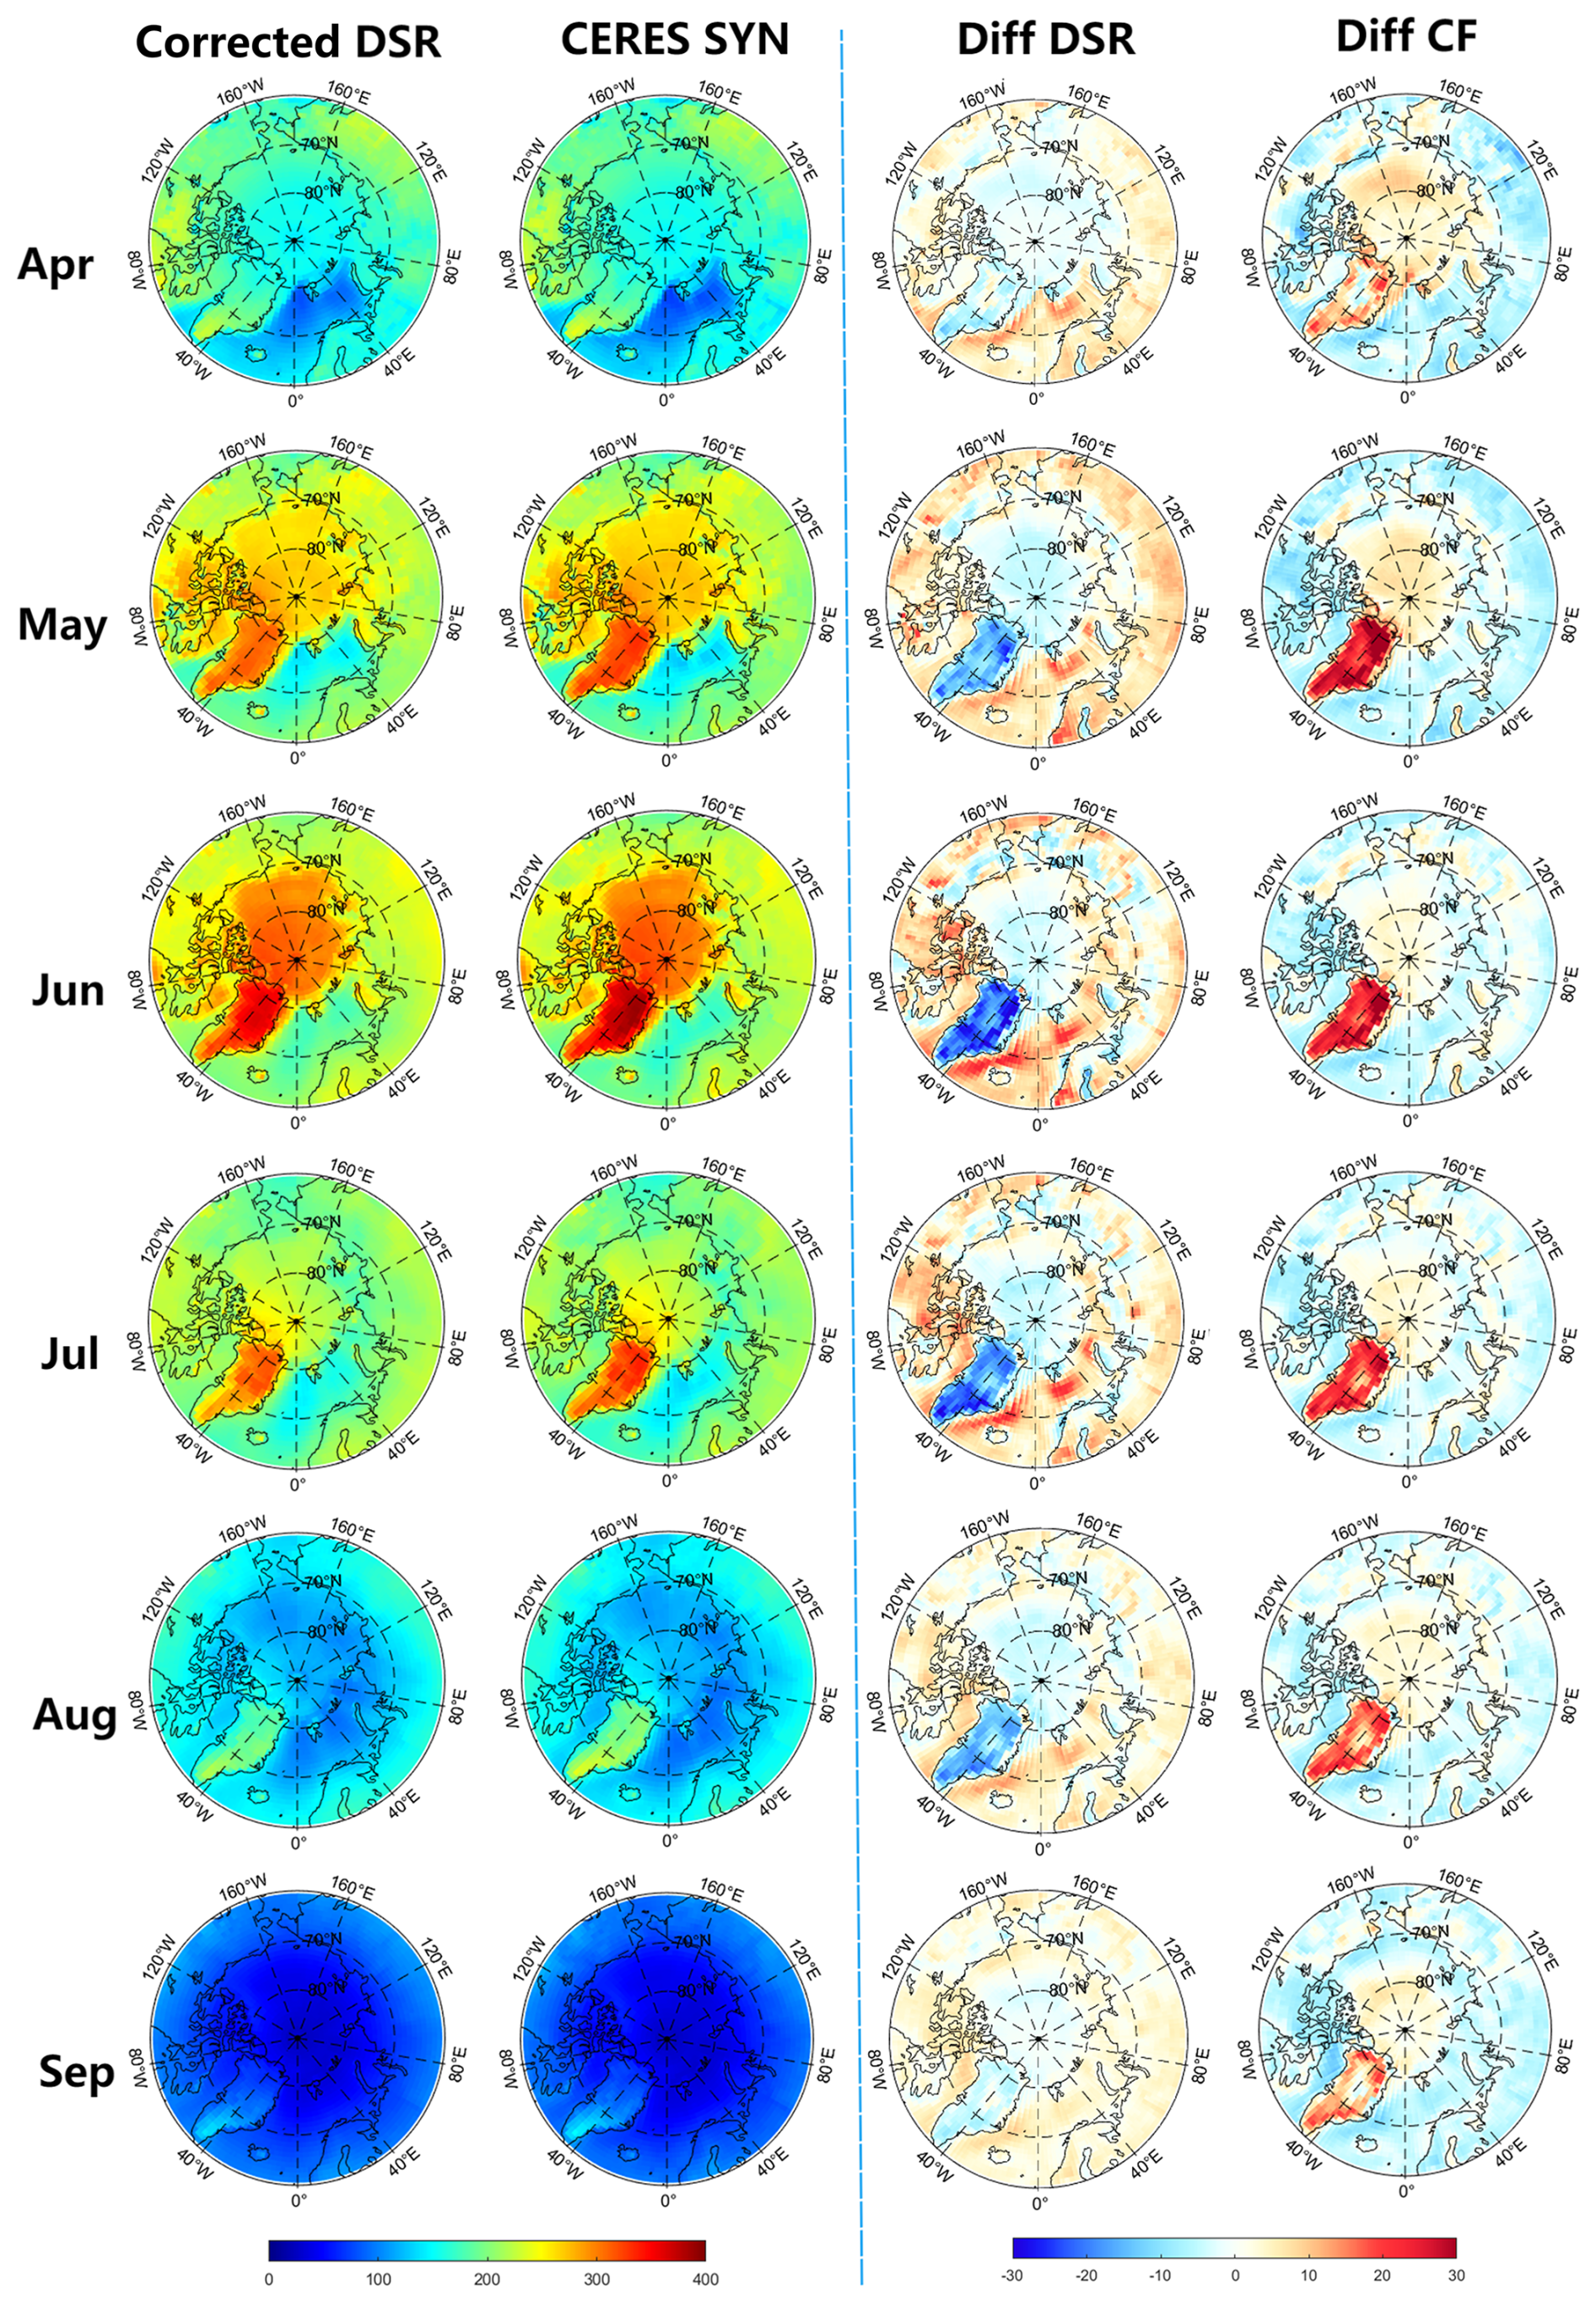
Figure 5The spatial distribution of the monthly mean DSR for April and September from 2003 to 2020, both before and after correction, as well as the spatial distribution of the differences between the two, and the CF differences (Fused_cf_Arc – CERES SYN). All metrics have units of W m−2.
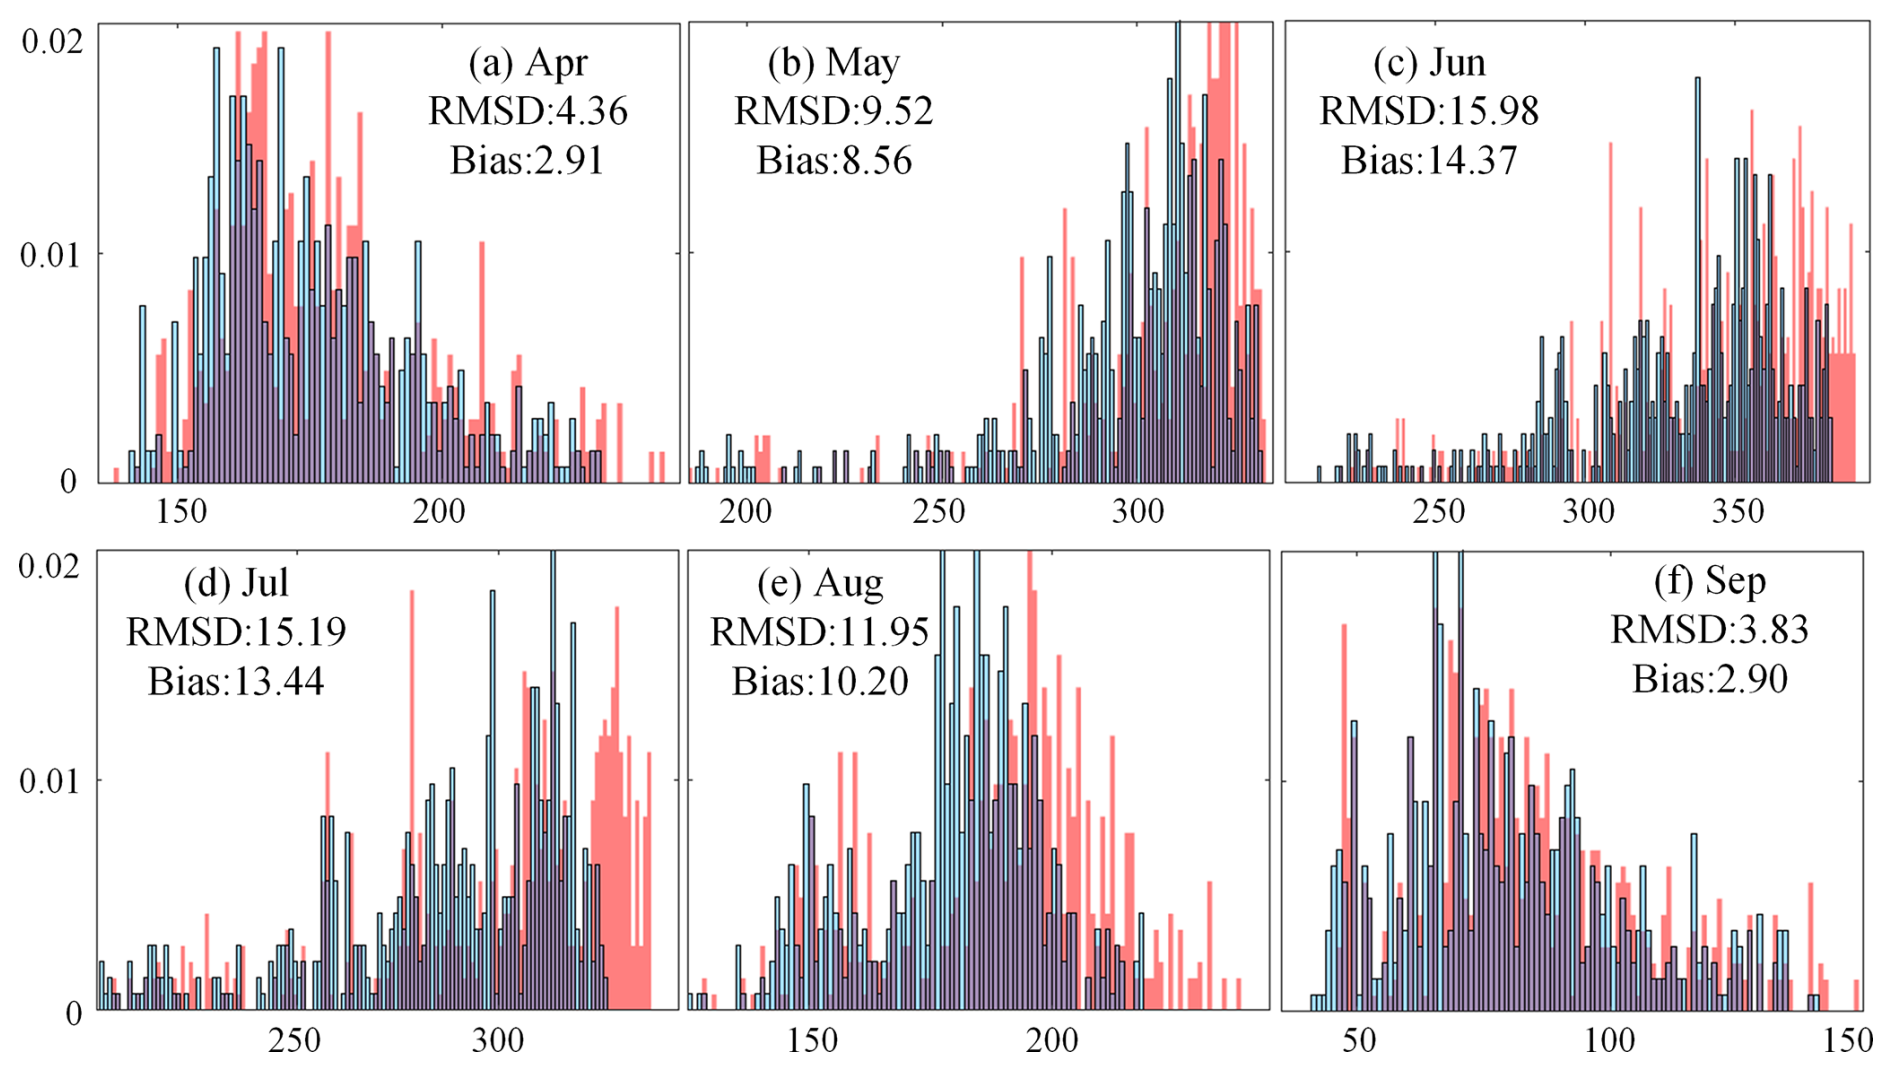
Figure 6Histogram of multi-year average monthly DSR before (red bin) and after (blue bin) correction over Greenland. All RMSD and Bias statistics have units of W m−2. The vertical coordinate represents the frequency and the horizontal coordinate represents the DSR value (W m−2).
4.3 Comparison of DSR before and after correction
Figure 5 presents the spatial distribution of the monthly mean DSR from April to September during the period 2003–2020. The most pronounced differences between the corrected and uncorrected DSR occur over Greenland, particularly in June, where discrepancies reach up to 30 W m−2. Figure 6 further highlights these differences through histograms over Greenland, demonstrating that the correction primarily reduces high DSR values during May, June, July, and August. The correction effects exhibit a distinct seasonal pattern, with more substantial correction during summer. The most notable case is observed in June, where the root-mean-square difference (RMSD) reaches 15.98 W m−2, bias is 14.37 W m−2, and the maximum per-pixel difference exceeds 35 W m−2. In contrast, the correction in September is much less significant, with an RMSD of only 3.83 W m−2.
The correction of DSR is influenced not only by the magnitude of CF biases but also by modulation from the solar zenith angle (He et al., 2013, 2015; Kim and Liang, 2010). In May and June, although CF biases are generally larger in May than in June, the correction effect on DSR is more pronounced in June. For example, in northeastern Greenland, pixels with a 39 % CF bias in May correspond to a DSR difference of 25 W m−2 between the original and corrected values. Whereas in June, pixels with a 32 % CF bias exhibit a DSR difference of up to 35 W m−2. This discrepancy is primarily attributed to the lower solar zenith angle in June, which enables more solar radiation to reach the surface, thereby amplifying the influence of CF biases on DSR. Consequently, even relatively smaller CF biases can result in more substantial correction effects.
4.4 Validation of estimated all-wave net radiation
The extended model was developed to estimate the monthly mean NR based on the corrected DSR. The LRD was employed to account for the influence of diurnal variations in shortwave radiation on NR across different seasons. As a result, the model does not need to be developed separately for each month; instead, the seasonal effects are implicitly incorporated through the LRD. During validation, the model achieved an R2 of 0.99, an RMSE of 5.87 W m−2, and a bias of 0 W m−2 on the validation dataset (Fig. 7), demonstrating excellent performance. In addition, the estimated NR was further validated against in situ observations from ground-based stations.
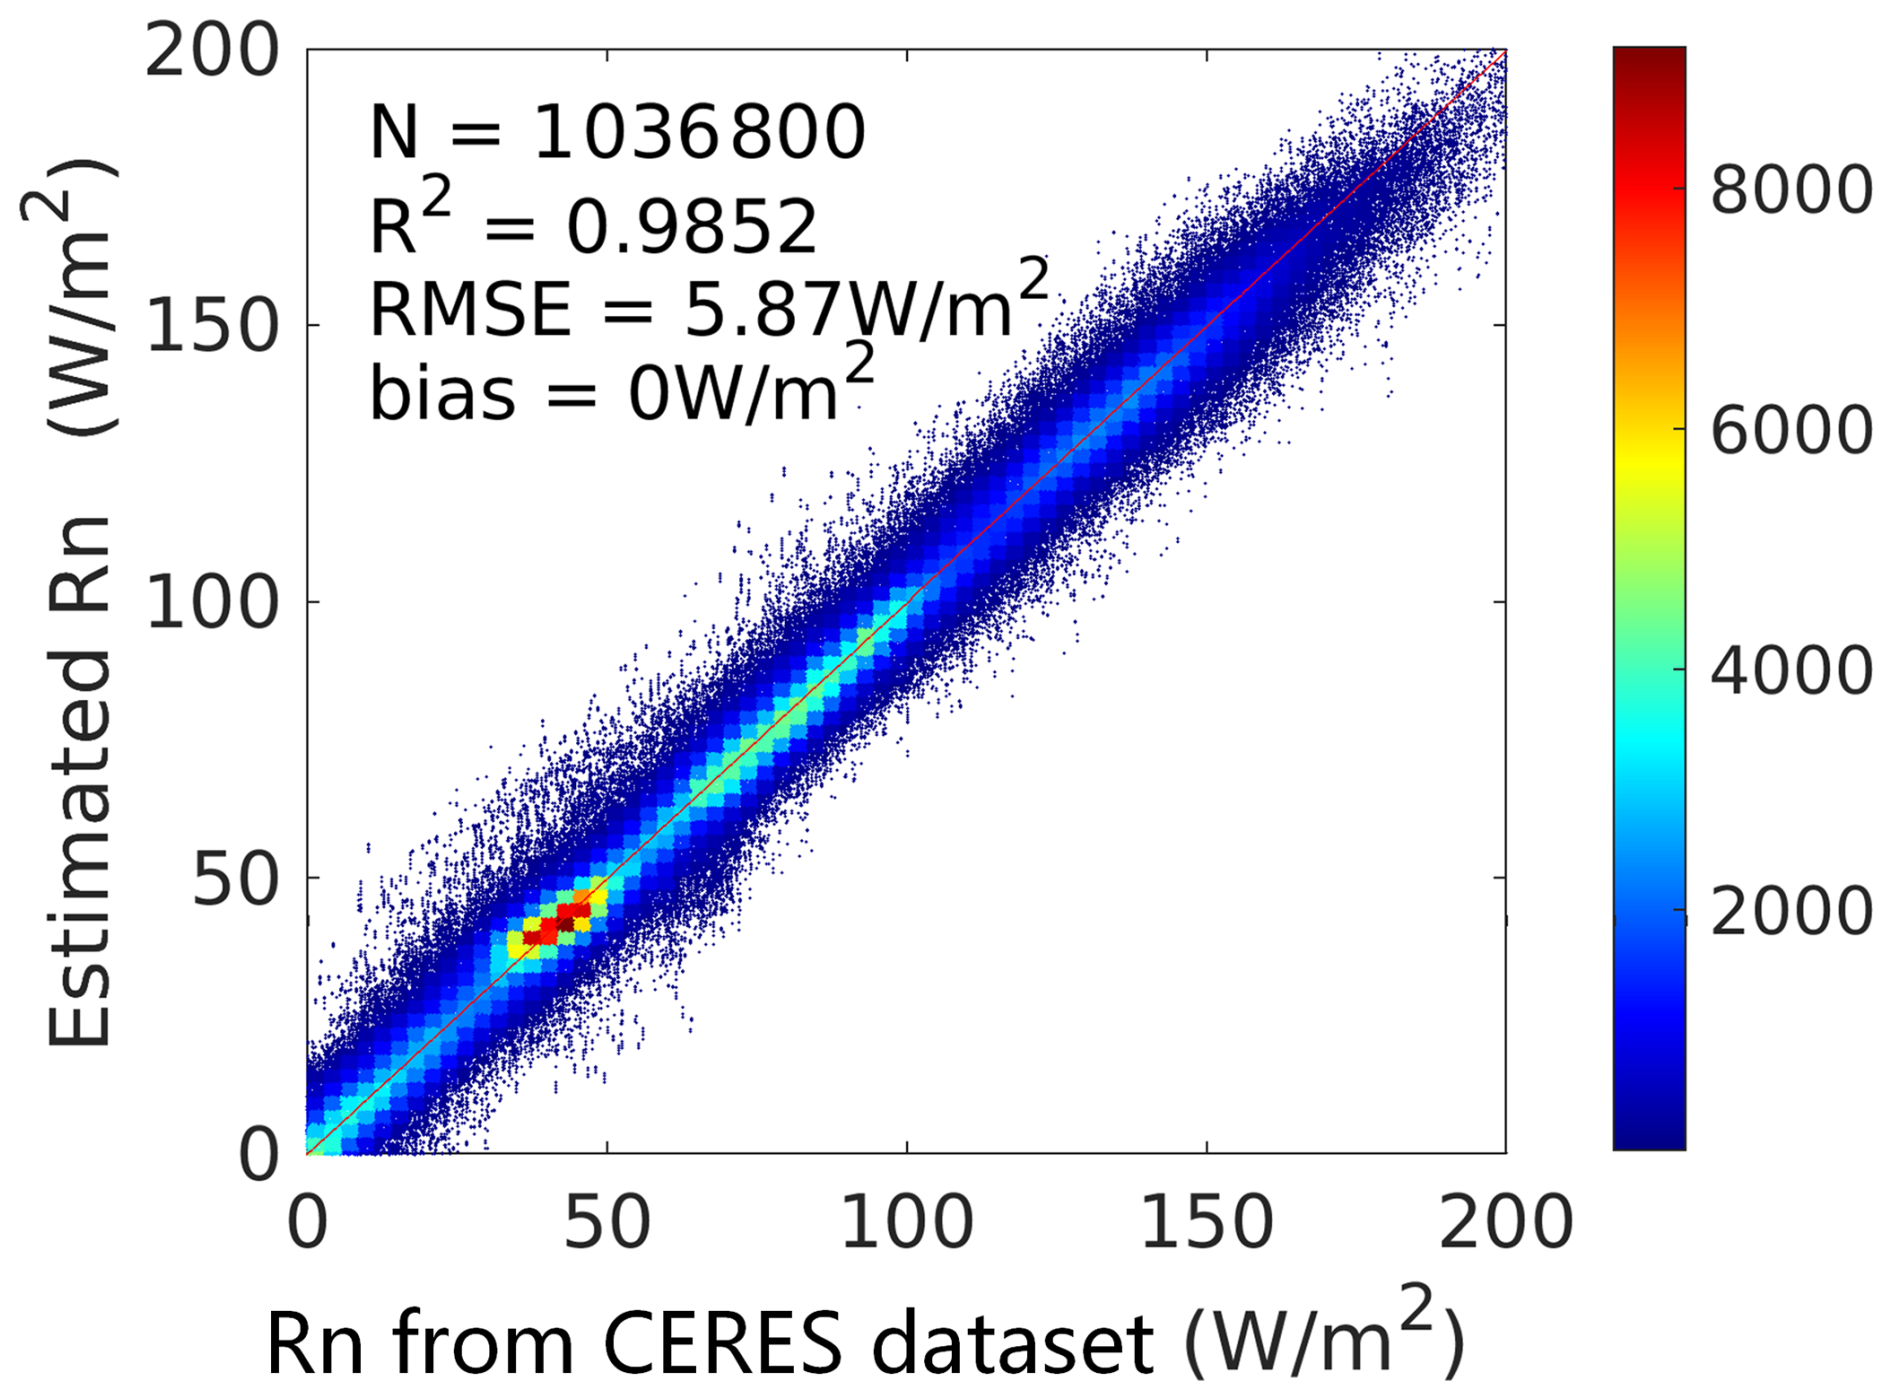
Figure 7Scatter plot comparing the NR estimated using the extend model with the CERES-SYN NR dataset.
Figure 8 presents a comparison of scatterplots between the estimated NR from this study, CERES SYN dataset and ground-based observations. The estimated NR shows clear advantages over CERES NR in terms of overall agreement with ground-based observations. Specifically, the estimated NR achieves an R2 of 0.77 and an RMSE of 28.9 W m−2, compared with 0.61 and 34.88 W m−2 for CERES NR. Although the bias of the estimated NR is somewhat larger (14.88 vs. 10.08 W m−2), the scatter plots indicate that the correction substantially improves the distribution of points along the 1:1 line. In particular, the underestimation present in CERES NR around 50–100 W m−2 is largely alleviated, leading to a more consistent representation of the observed variability.
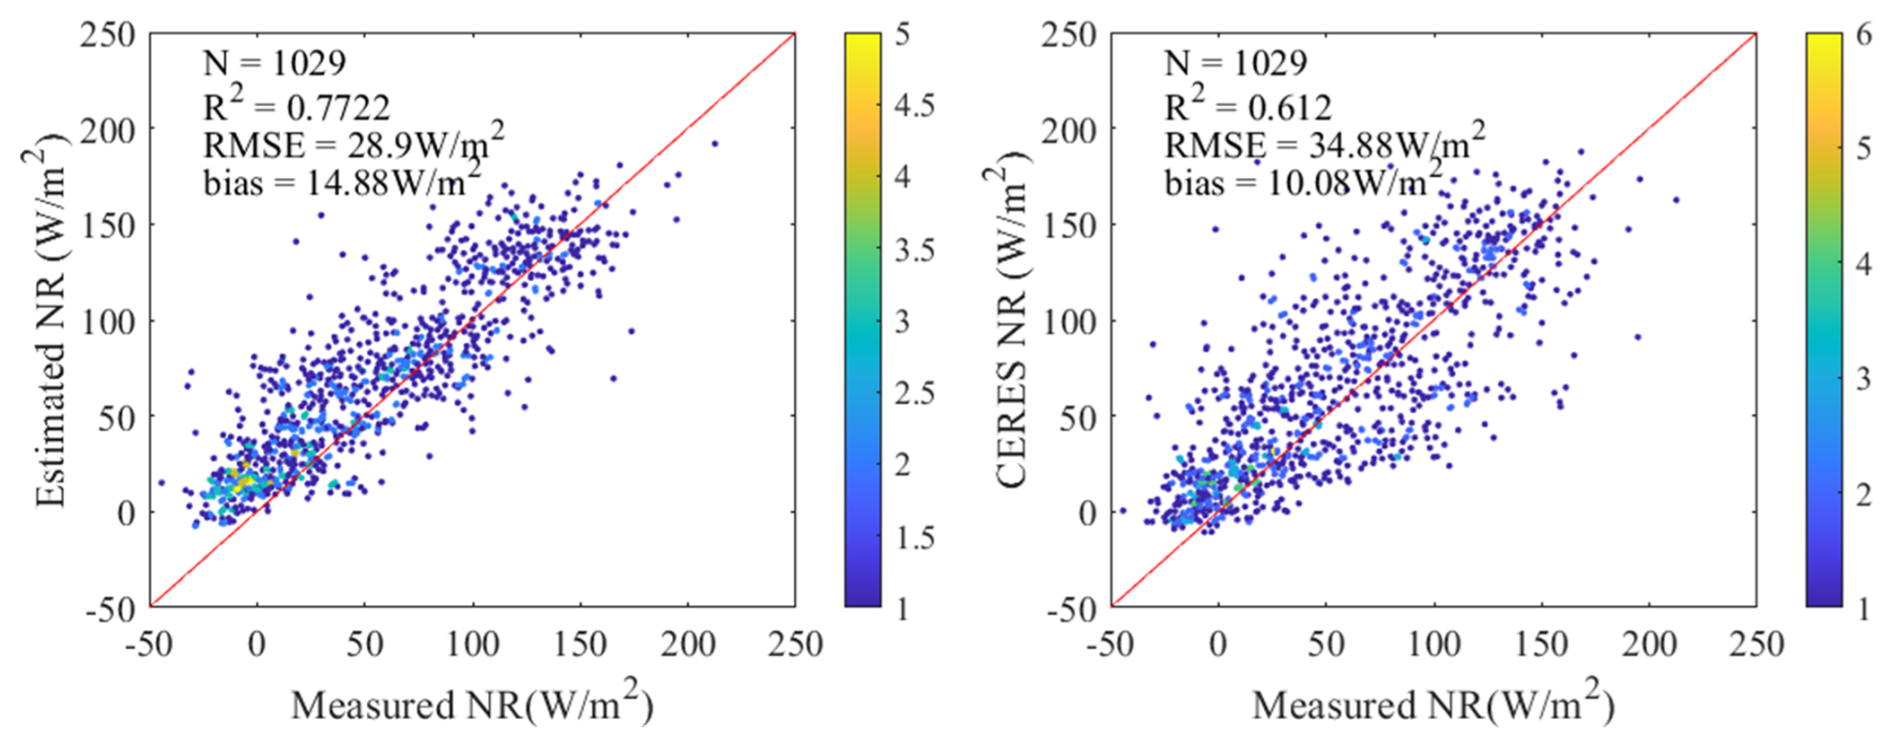
Figure 8Scatterplot comparison between the estimated NR from this study, CERES SYN dataset, and ground-based observations.
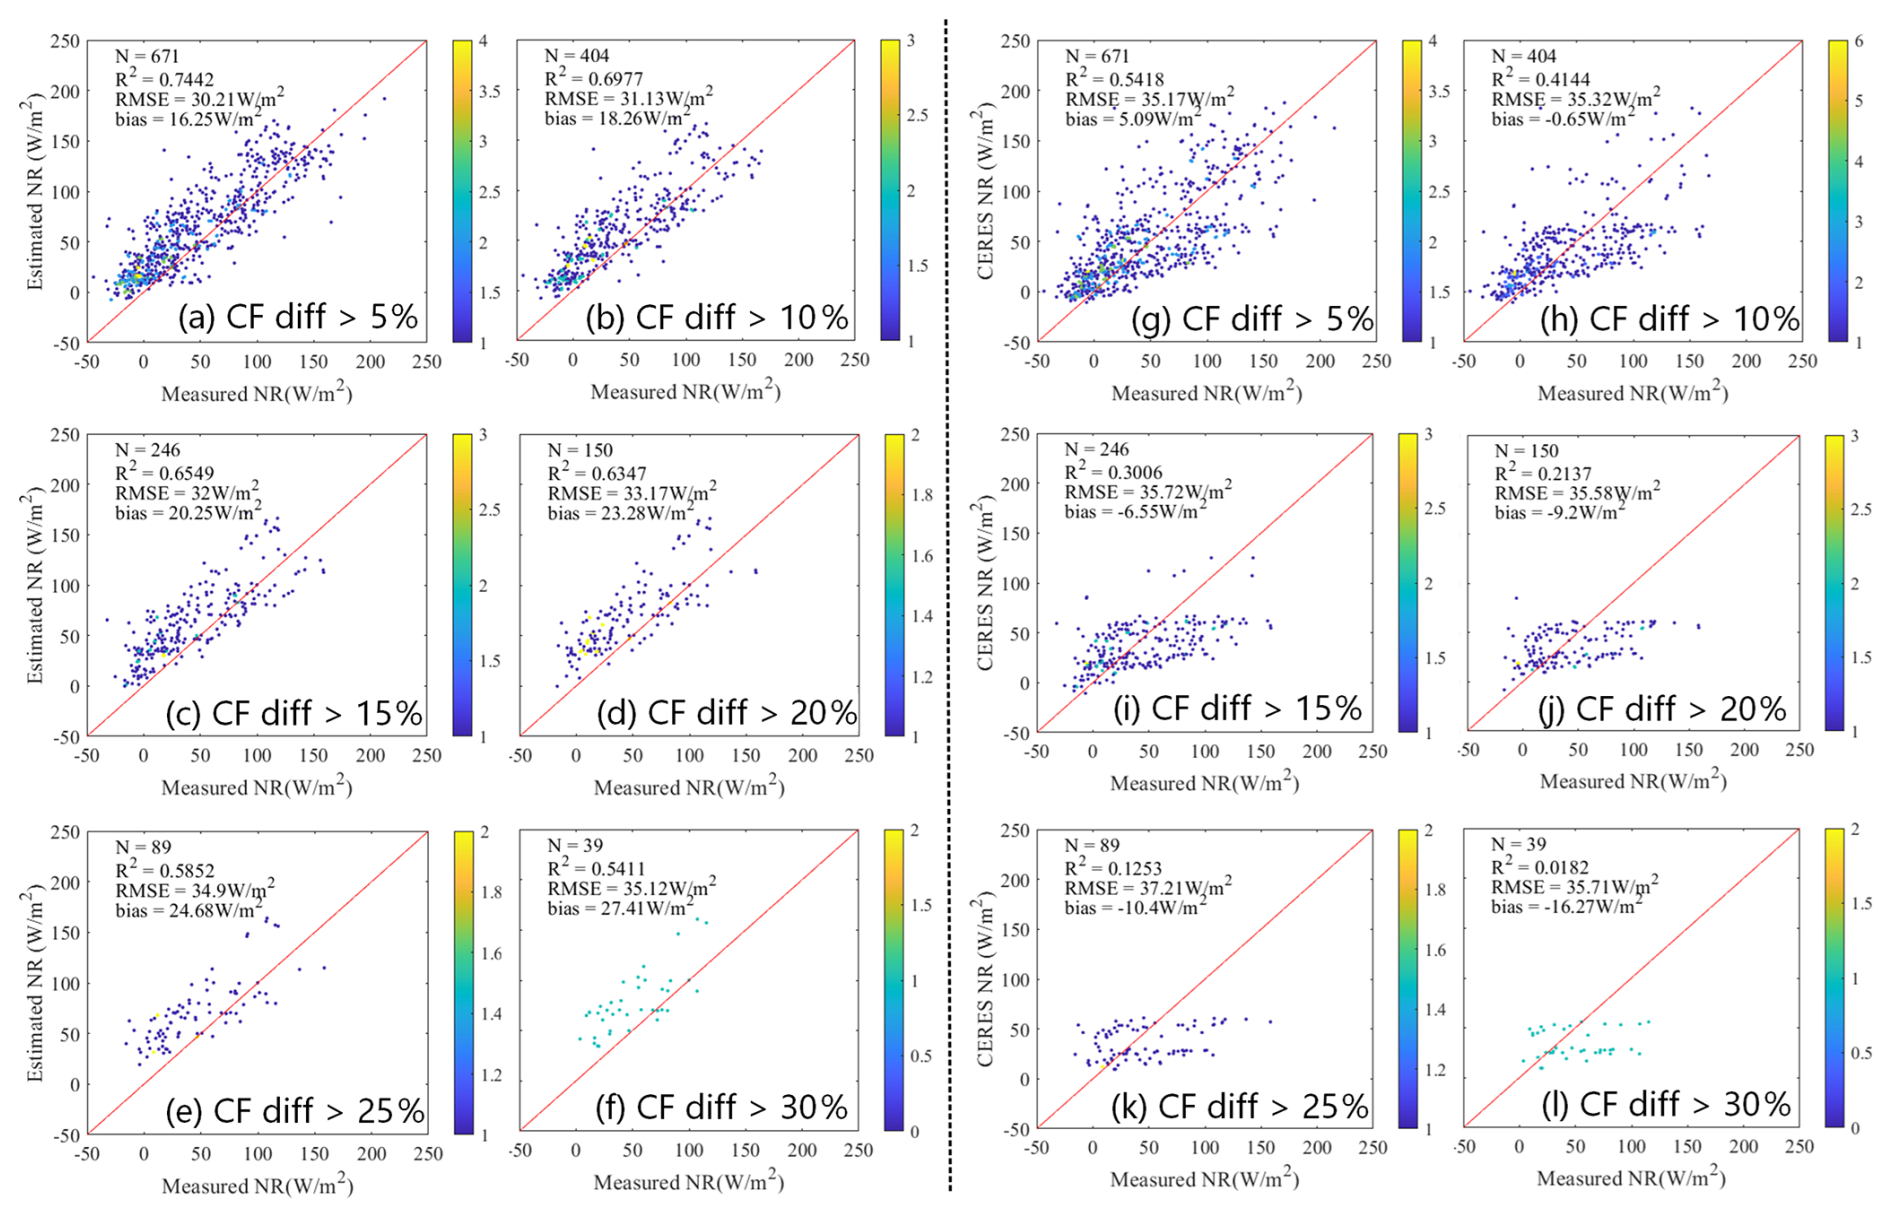
Figure 9Validation of NR against ground-based observations before (g–l) and after (a–f) correction for stations with CF differences exceeding various thresholds (Fused_cf_Arc – CERES SYN).
We further examined the validation performance under different levels of CF underestimation (CERES SYN relative to Fused_cf_Arc). This analysis allows us to assess how the CF-based correction behaves under varying degrees of underestimation. As shown in Fig. 9, validation of the estimated NR against ground-based measurements under different CF difference thresholds further highlights the advantage of using the CF-corrected DSR as the basis for NR calculation. the estimated NR maintains a relatively robust correlation with observations across all CF difference ranges, with R2 values decreasing gradually from 0.74 (>5 %) to 0.54 (>30 %). Although the RMSE (30.21–35.12 W m−2) and bias (16.25–27.41 W m−2) indicate an overall tendency toward overestimation, the scatter plots remain distributed along the 1:1 line, suggesting that the systematic bias is more uniform.
By contrast, the CERES NR shows considerably weaker performance under large CF underestimation. Its R2 drops rapidly from 0.54 (>5 %) to nearly zero (>30 %), with scatter plots at CF underestimation greater than 20 % exhibiting an almost horizontal distribution, indicating a loss of physical consistency with ground observations. While the RMSE values of CERES NR are comparable to those of the estimated NR, the near-absence of correlation at high CF underestimation suggests that CERES NR fails to capture the variability of surface conditions under such circumstances.
These results imply that the NR estimated from the CF-corrected DSR provides a more reliable representation of the radiation variability, particularly in terms of correlation structure, even though the magnitude bias remains to be further improved. In other words, the correction ensures that the retrieved NR retains meaningful sensitivity to surface and atmospheric variations, whereas CERES NR tends to collapse under conditions of high CF underestimation. Nevertheless, it should be noted that the performance of the estimated NR is still limited when CF differences are large. Under heavy cloud cover, retrieving NR from satellite observations has long been recognized as an intrinsic challenge. Future efforts may focus on incorporating additional constraints from longwave radiation, atmospheric water vapor, or surface properties to further reduce systematic biases.
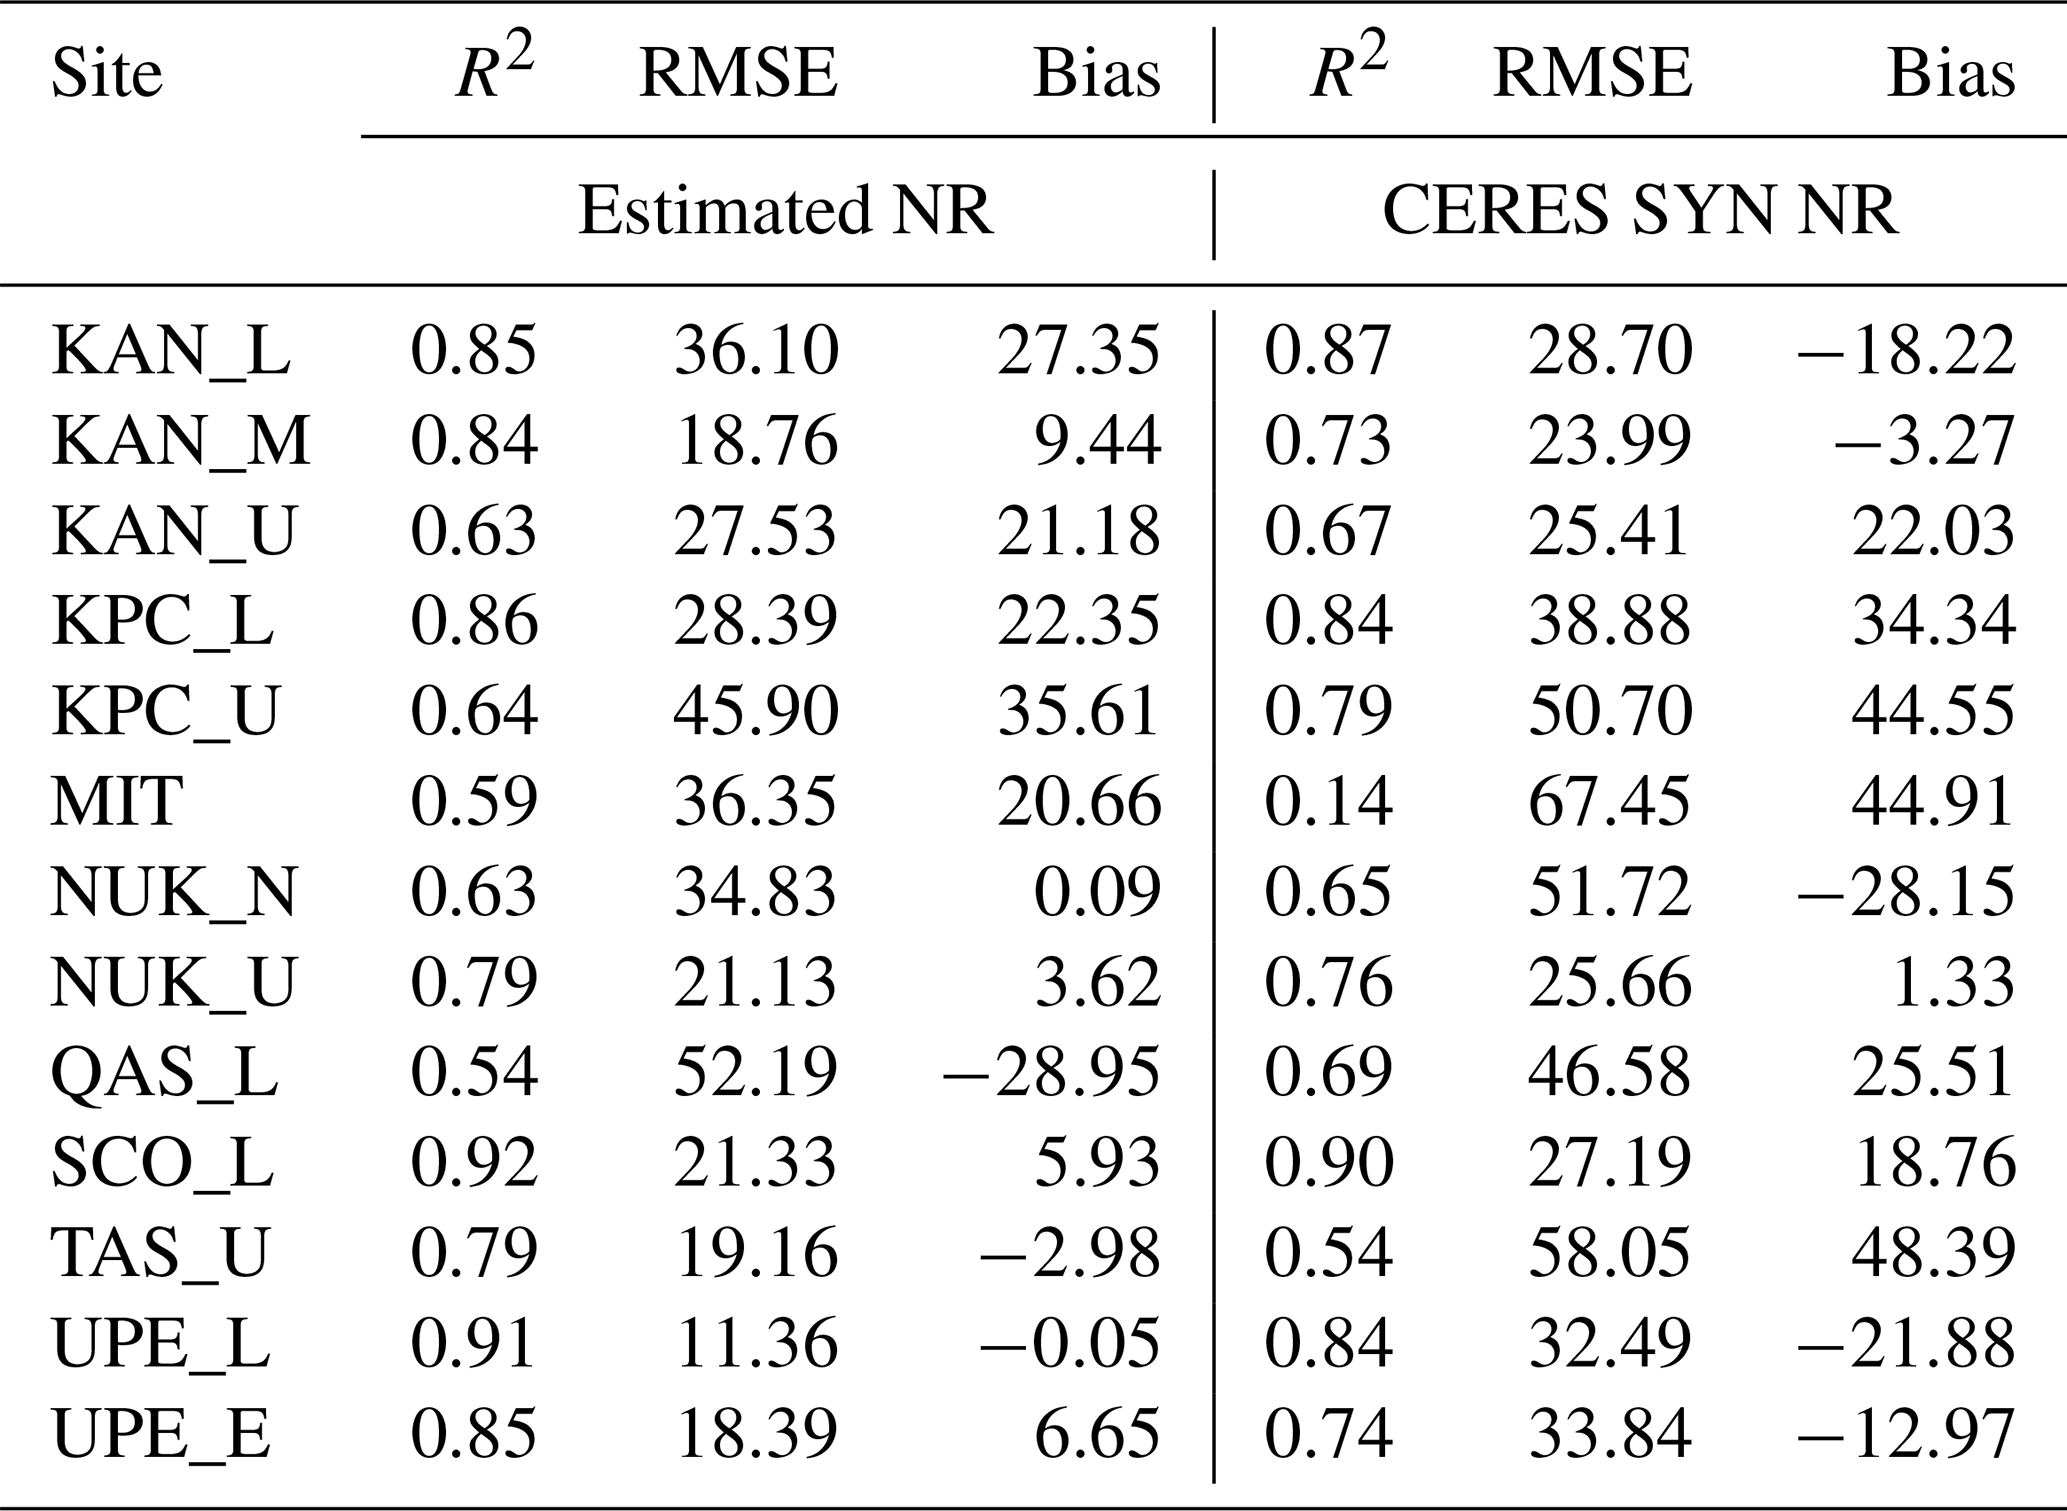
Given the pronounced difference of CF over Greenland, we highlight the validation results of NR at selected ground stations in Greenland (Table 4). The results demonstrate that the estimated NR aligns much more closely with ground-based measurements than the original CERES SYN data. Overall, these findings confirm that the proposed extended model is robust. It significantly improves the accuracy of radiation estimates and enhances the reliability and utility of the resulting radiation products.
Table 4Validation results of the estimated NR and CERES SYN NR against at observation at PROMICE sites in Greenland.
4.5 Comparison between the estimated all-wave net radiation and the CERES SYN
As shown in Fig. 10, the spatial distribution of the multi-year monthly mean NR over the Arctic from April 2003 to September 2018 is presented for the estimated NR in this study and the CERES SYN. In contrast to the DSR correction results, the differences between the estimated NR and CERES SYN are relatively minor, particularly over Greenland, where the DSR correction had previously shown substantial discrepancies. Moreover, while increased CF typically results in reduced DSR due to enhanced reflection, an opposite pattern is observed in northeastern Greenland during May and July: higher CF is associated with increased NR.
This phenomenon could be attributed to the dual-component nature of NR, which comprises both shortwave and longwave radiation. Clouds reduce the surface energy input by attenuating incoming shortwave solar radiation, while simultaneously enhancing the absorption and re-emission of longwave radiation by the atmosphere, thereby suppressing the loss of longwave radiation from the surface. Notably, in regions such as Greenland, which are characterized by high surface albedo, the contribution of surface-reflected shortwave radiation is relatively large, weakening the net cooling effect of clouds (Miller et al., 2015). As noted by (Kay and L'Ecuyer, 2013), low-level Arctic clouds can exert a net warming effect, as the enhancement of downward longwave radiation often outweighs the reduction in shortwave radiation reaching the surface. The results in this study are consistent with this perspective: in specific regions and months – such as in northeastern Greenland during summer – the enhancement of longwave radiation associated with increased CF is sufficient to offset or even exceed the reduction in shortwave radiation, resulting in a net increase in NR.
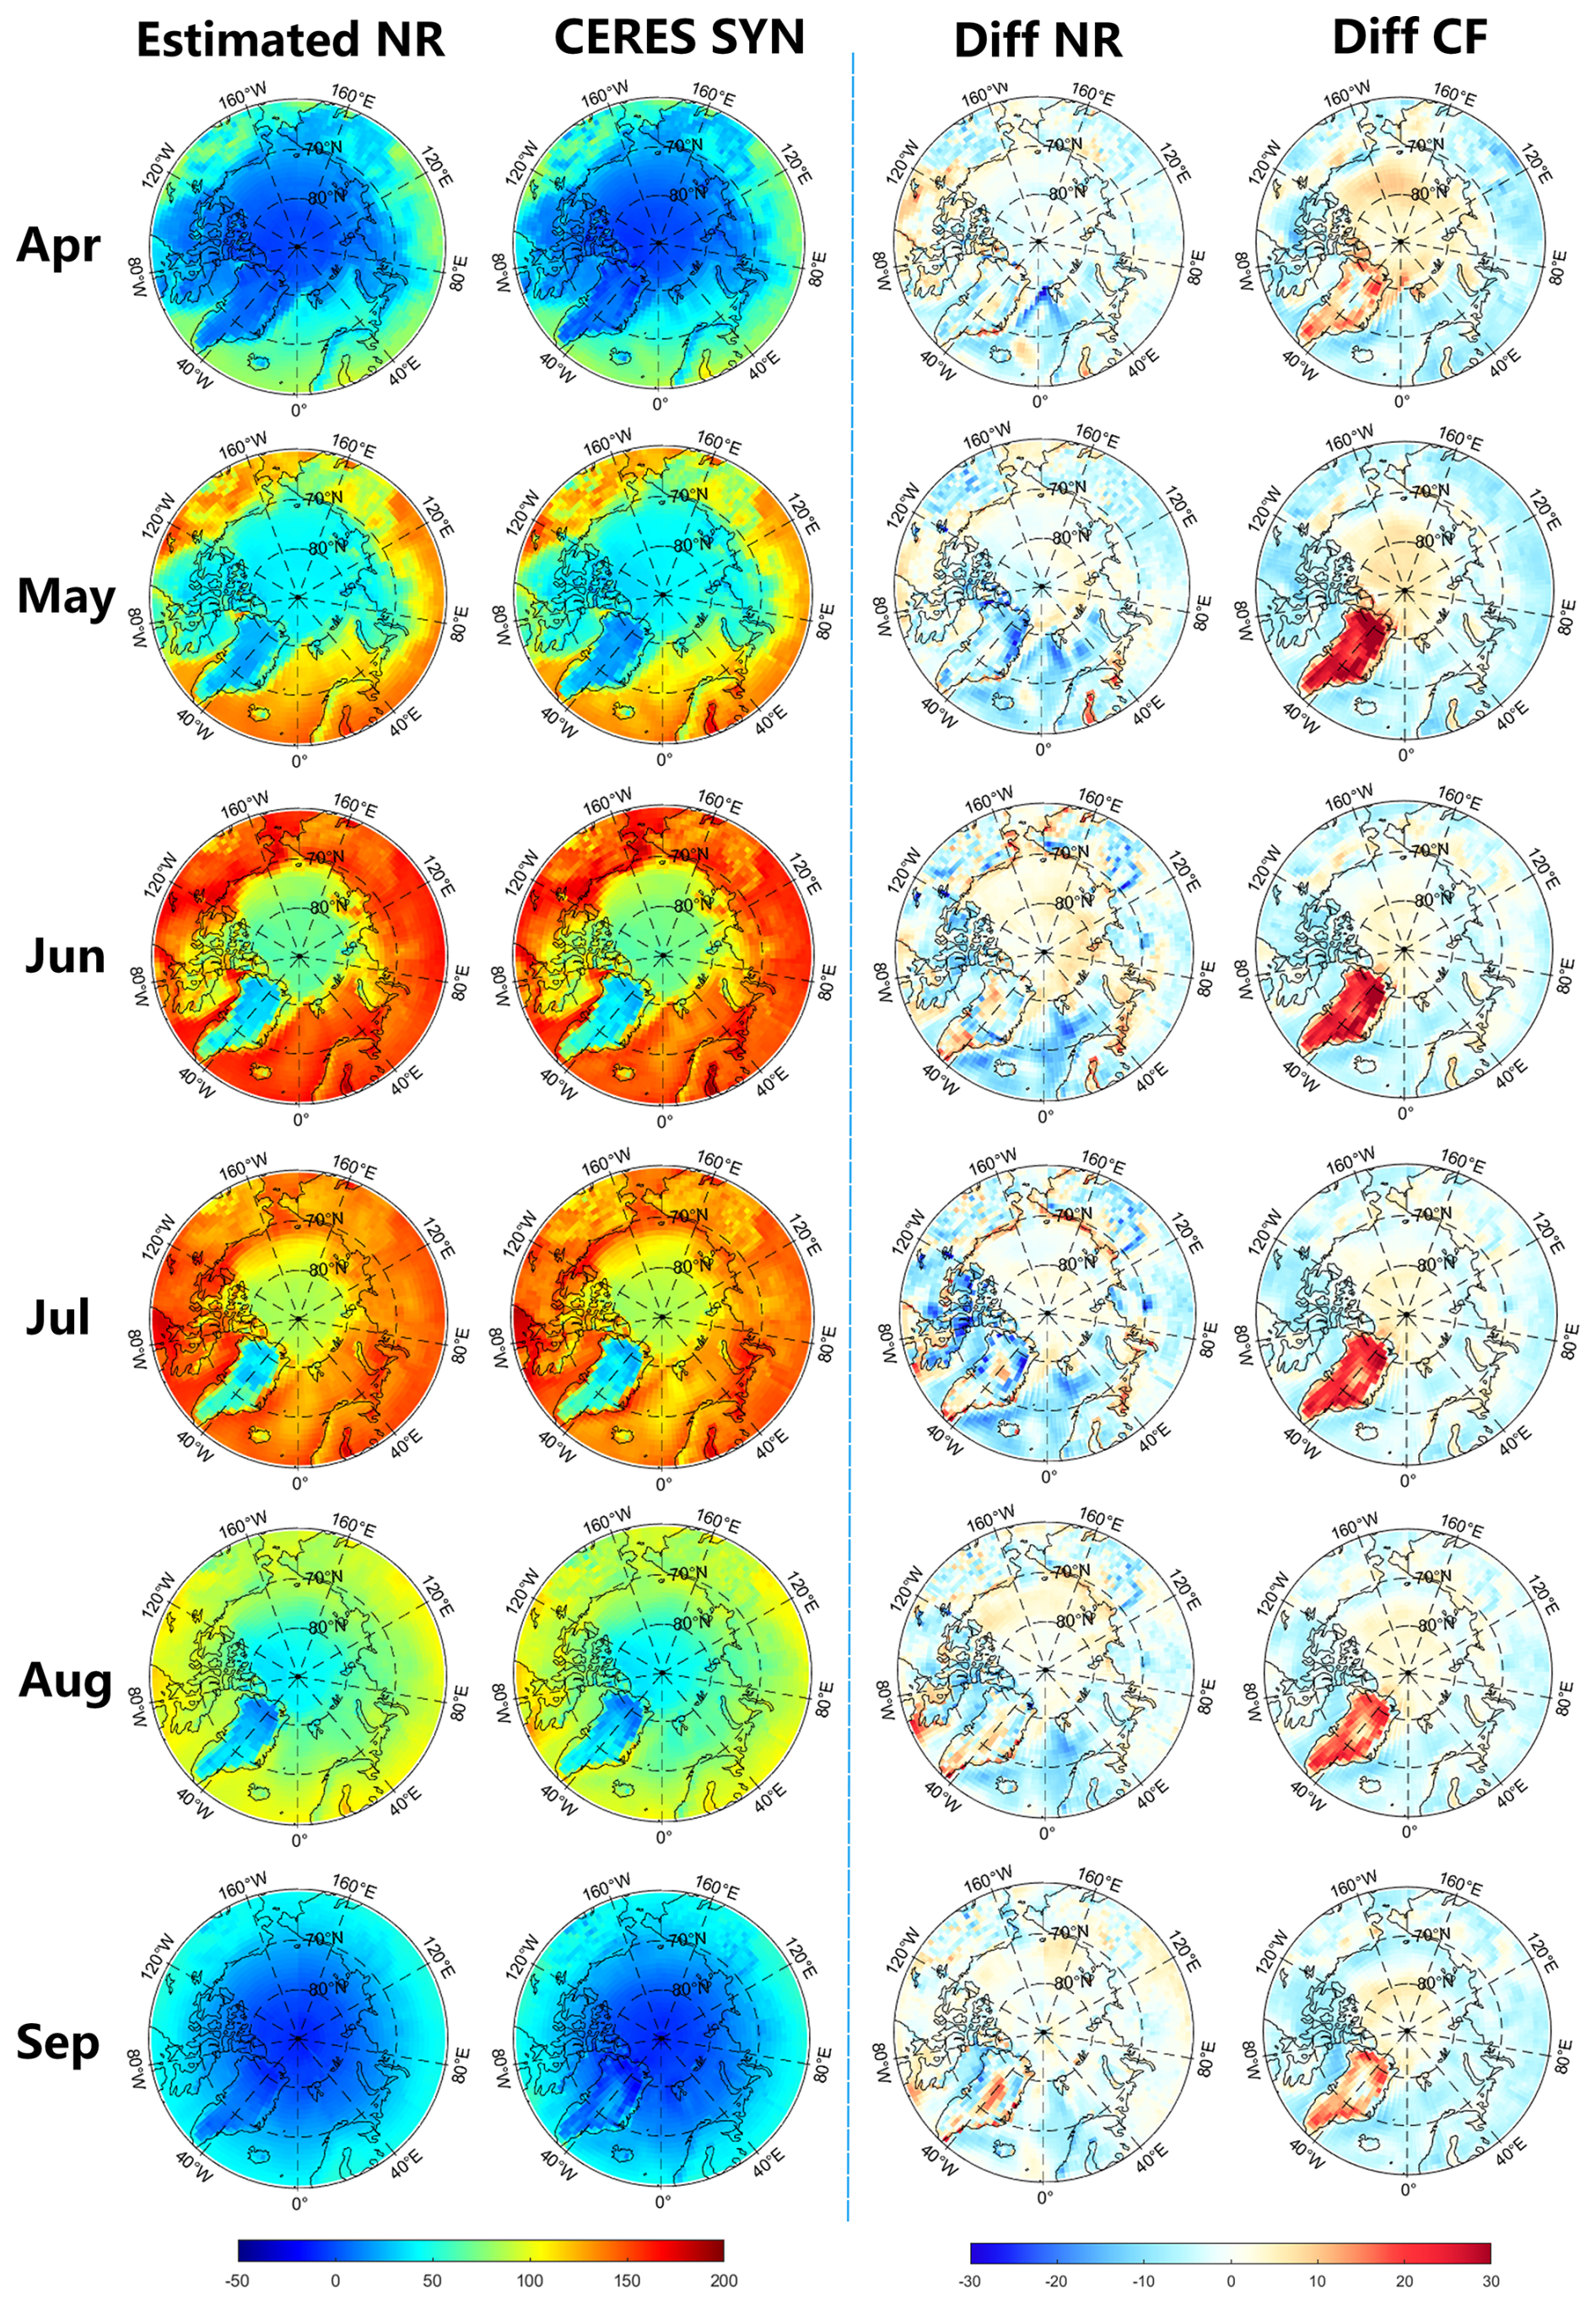
Figure 10The spatial distribution of the monthly mean NR for April and September from 2003 to 2020, estimated NR in this study and the CERES SYN, as well as the spatial distribution of the differences between the two (estimated NR – CERES NR), and the CF differences (Fused_cf_Arc – CERES SYN).
Overall, compared with the CERES product, the NR estimated from the improved DSR in this study demonstrates higher accuracy during the warm season, highlighting its enhanced capability to represent the surface radiation balance under melt-season conditions. This dataset is particularly valuable for studies focusing on summer Arctic radiation–related research, such as Oehri et al. (2022)'s investigation of summer energy flux–vegetation interactions and Tjernström et al. (2019)'s analysis of warm-air advection and summer energy budget dynamics. Furthermore, this dataset can be used for cross-validation among multiple products or for analyzing multi-year NR trends during the summer. However, because the NR is derived from DSR, it cannot be produced during the polar night. Unlike CERES, our dataset cannot support all-season climate analyses due to the absence of DSR in winter. Moreover, the ANN-derived NR lacks the physically based interpretability of CERES, which relies on radiative transfer theory and independently retrieved shortwave and longwave fluxes. As such, our product cannot be used for process-level radiation budget studies. Nonetheless, owing to its high accuracy in the warm season, the ANN-based NR provides a useful complementary dataset for warm-season applications, where the improved DSR directly enhances NR accuracy.
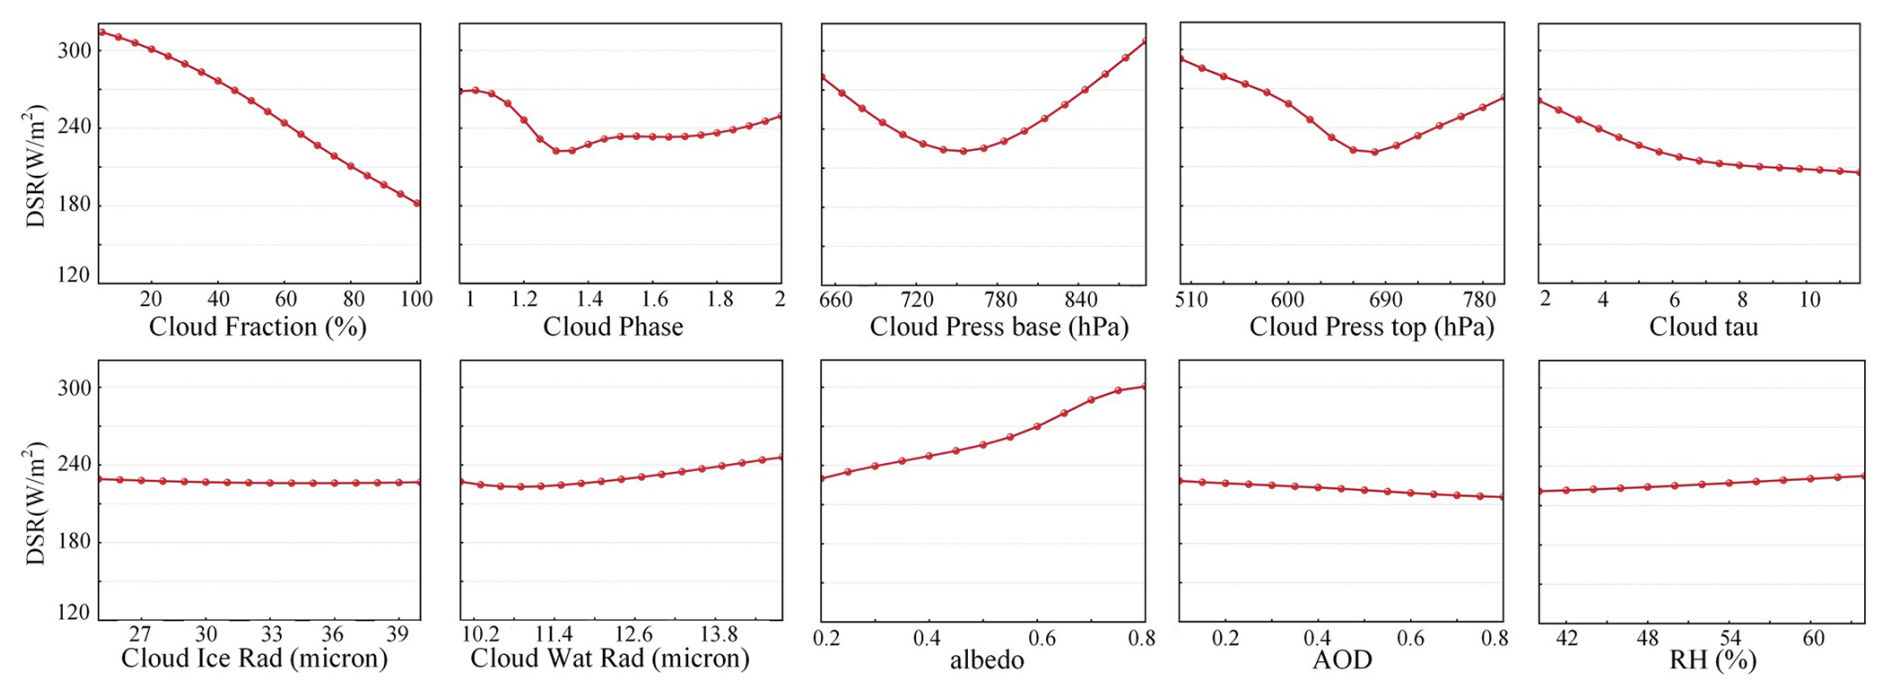
Figure 11Sensitivity of DSR to individual input variables. Each panel shows the DSR response to a single variable, varied across its range while keeping all others fixed. Red lines indicate the mean response.
Sensitivity of DSR to variations in model input parameters
To assess the relative importance of CF among various input variables, we conducted a sensitivity analysis. Specifically, single input variable was varied individually while all other variables were held constant, and the corresponding DSR responses were evaluated. As shown in Fig. 11, DSR is most sensitive to CF: as CF increases from 5 % to 100 %, DSR decreases markedly from approximately 315 to 180 W m−2, indicating a strong negative correlation. Cloud top pressure also exerts a non-negligible influence, whereas cloud radius, aerosol optical depth, and relative humidity have relatively weak impacts, suggesting that even large uncertainties in these variables are unlikely to introduce substantial DSR bias.
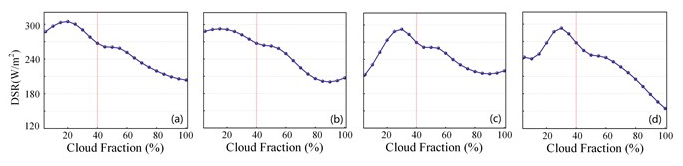
Figure 12Sensitivity of DSR to the combined variation of multiple cloud variables. (a) Varying variables include CF and cloud phase. (b) Varying variables include CF, cloud phase, and cloud base pressure. (c) Varying variables include CF, cloud phase, cloud base pressure, and cloud top pressure. (d) Varying variables include CF, cloud phase, cloud base pressure, cloud top pressure, and cloud tau.
To investigate the impact of variable covariations on the response structure of DSR, we performed a series of multivariate variation experiments. As illustrated in Fig. 12: (a) when only CF and cloud phase are varied, the influence of cloud phase is relatively minor, and the negative DSR response to increasing CF persists clearly; (b) adding cloud base pressure reduces the visibility of its individual impact – previously seen as increasing DSR when exceeding 760 hPa – because the dominant CF effect overrides it; (c) when cloud top pressure is further included, the DSR response exhibits a “rise-then-fall” pattern, indicating that under low CF conditions, other cloud variables can still exert noticeable influence on DSR, but as CF increases, its controlling effect gradually becomes predominant.
We also examined the monthly mean CF over the Arctic (not shown), and found that CF exceeds 40 % in most regions. Combined with the analysis in Fig. 12, this suggests that once CF exceeds 40 %, DSR consistently decreases with increasing CF. This further confirms that CF is the dominant factor influencing DSR in cloud-rich regions such as the Arctic. Given that CF retrievals from passive remote sensing remain highly uncertain, CF likely represents a major source of current radiative biases. Therefore, even though CF is the only variable available for correction, its dominant influence on DSR makes it sufficient for effectively reducing the bias. The success of our correction further supports the validity of this approach (Figs. 2 and 3).
In this study, we developed a CF perturbation model based on an ANN and utilized a more accurate CF product, Fused_cf_Arc, to correct CERES SYN DSR over the Arctic. Building upon this correction, we further established an extended model that enables direct estimation of NR based on the corrected DSR.
By integrating an ANN-based CF perturbation model with the more accurate Fused_cf_Arc product, we effectively corrected CERES SYN DSR over the Arctic. The correction substantially improved the agreement with 66 ground-based sites, reducing RMSE from 30.57 to 28.87 W m−2 and bias from 2.83 to 0.40 W m−2. Importantly, while the accuracy of CERES DSR degraded rapidly with increasing CF underestimation (RMSE rising to 42.44 W m−2 and bias to 29.77 W m−2 at sites with >30 % CF underestimation), the corrected DSR maintained a much lower error level (RMSE 33.48 W m−2, bias 10.13 W m−2). The improvements were most pronounced over Greenland, where local corrections reached up to 30 W m−2, and seasonal analyses confirmed the enhanced robustness of our method under diverse solar–cloud conditions. These results highlight the critical role of CF accuracy in DSR estimation and demonstrate the effectiveness of our correction in mitigating CF-related biases.
Building upon the corrected DSR, we developed an extended model for directly estimating NR without explicitly retrieving longwave components. Compared with CERES NR, our NR estimates showed markedly higher consistency with ground measurements, with R2 increasing from 0.612 (CERES NR) to 0.772 and RMSE decreasing from 34.88 W m−2 (CERES NR) to 28.90 W m−2. Although the bias rose slightly (from 10.08 W m−2 (CERES NR) to 14.88 W m−2), the corrected NR significantly alleviated the underestimation in the 50–100 W m−2 range. Importantly, in cases of pronounced CERES CF underestimation (>30 %), the CERES NR essentially loses its ability to capture radiation variability (R2=0.0182), whereas the estimated NR retains substantial representational skill (R2=0.5411). This confirms that NR retrieved from CF-corrected DSR provides a more reliable representation of radiation variability, preserving physical sensitivity to surface and atmospheric processes.
Overall, this study demonstrates a practical and physically consistent framework for improving surface radiation retrievals in the Arctic, where satellite products often suffer from cloud-related uncertainties. By leveraging improved CF information and employing a data-driven approach that bypasses radiative transfer assumptions, the proposed methodology enhances both the accuracy and interpretability of DSR and NR estimates. These advances are particularly valuable for studies focusing on summer Arctic radiation–related research. In addition, the dataset can support cross-validation among multiple products and analyses of multi-year summer radiation trends.
All datasets used in this study, as well as the newly generated radiation products, are available from the authors upon request.
YZ and TH organized the paper and conducted the related analysis. YZ drew the article graph and prepared the paper. TH and YM conceptualized the paper and revised the whole article. XL modified the paper and provided suggestions for this study. All authors contributed to the discussion of the results and reviewed the paper.
The contact author has declared that none of the authors has any competing interests.
Publisher's note: Copernicus Publications remains neutral with regard to jurisdictional claims made in the text, published maps, institutional affiliations, or any other geographical representation in this paper. The authors bear the ultimate responsibility for providing appropriate place names. Views expressed in the text are those of the authors and do not necessarily reflect the views of the publisher.
The authors gratefully acknowledge the providers of the datasets used in this study. CERES data were obtained from NASA Langley Research Center (https://ceres.larc.nasa.gov/, last access: 27 February 2026). The fused Arctic cloud product is available at Zenodo (https://doi.org/10.5281/zenodo.7624605, Liu and He, 2022). MERRA-2 reanalysis data were provided by NASA GMAO (https://gmao.gsfc.nasa.gov/reanalysis/MERRA-2/, last access: 27 February 2026). The GLASS land surface product can be accessed via GLASS Data Portal (http://www.glass.umd.edu/, last access: 27 February 2026). Site-based observations were obtained from FLUXNET (https://fluxnet.org/, last access: 27 February 2026), AmeriFlux (https://ameriflux.lbl.gov/, last access: 27 February 2026), GEBA (https://www.geba.ethz.ch/, last access: 27 February 2026), and PROMICE (https://www.promice.org/, last access: 27 February 2026). The authors sincerely thank all data providers for making these valuable datasets publicly available. The authors gratefully acknowledge the assistance of ChatGPT in polishing the language of this work. The authors are grateful for its contribution in improving the quality of our work.
This research was supported in part by the National Natural Science Foundation of China (General Program) (grant no. 42571425), in part by the Hubei Provincial Natural Science Foundation–Meteorological Innovation and Development Joint Fund Key Program (grant no. 2025AFD419), and in part by the FengYun Application Pioneering Project and the Innovation Center for FengYun Meteorological Satellite (grant no. FY-APP.XC-2023.21)
This paper was edited by Guy Dagan and reviewed by Tristan L'Ecuyer and one anonymous referee.
Bennartz, R., Shupe, M. D., Turner, D. D., Walden, V. P., Steffen, K., Cox, C. J., Kulie, M. S., Miller, N. B., and Pettersen, C.: July 2012 Greenland melt extent enhanced by low-level liquid clouds, Nature, 496, 83–86, https://doi.org/10.1038/nature12002, 2013.
Brown, P. T. and Caldeira, K.: Greater future global warming inferred from Earth's recent energy budget, Nature, 552, 45–50, https://doi.org/10.1038/nature24672, 2017.
Chen, J., He, T., Jiang, B., and Liang, S.: Estimation of all-sky all-wave daily net radiation at high latitudes from MODIS data, Remote Sens. Environ., 245, 111842, https://doi.org/10.1016/j.rse.2020.111842, 2020.
Chen, J., He, T., and Liang, S.: Estimation of Daily All-Wave Surface Net Radiation With Multispectral and Multitemporal Observations From GOES-16 ABI, IEEE T. Geosci. Remote, 60, 1–16, https://doi.org/10.1109/TGRS.2022.3140335, 2022.
Cheng, L., Trenberth, K. E., Fasullo, J., Boyer, T., Abraham, J., and Zhu, J.: Improved estimates of ocean heat content from 1960 to 2015, Sci. Adv., 3, https://doi.org/10.1126/sciadv.1601545, 2017.
Cohen, J., Zhang, X., Francis, J., Jung, T., Kwok, R., Overland, J., Ballinger, T. J., Bhatt, U. S., Chen, H. W., Coumou, D., Feldstein, S., Gu, H., Handorf, D., Henderson, G., Ionita, M., Kretschmer, M., Laliberte, F., Lee, S., Linderholm, H. W., Maslowski, W., Peings, Y., Pfeiffer, K., Rigor, I., Semmler, T., Stroeve, J., Taylor, P. C., Vavrus, S., Vihma, T., Wang, S., Wendisch, M., Wu, Y., and Yoon, J.: Divergent consensuses on Arctic amplification influence on midlatitude severe winter weather, Nat. Clim. Chang., 10, 20–29, https://doi.org/10.1038/s41558-019-0662-y, 2020.
Colman, R.: A comparison of climate feedbacks in general circulation models, Clim. Dynam., 20, 865–873, https://doi.org/10.1007/s00382-003-0310-z, 2003.
Coulbury, C. and Tan, I.: Top of the Atmosphere Shortwave Arctic Cloud Feedbacks: A Comparison of Diagnostic Methods, Geophys. Res. Lett., 51, e2023GL107780, https://doi.org/10.1029/2023GL107780, 2024.
Danso, D. K., Anquetin, S., Diedhiou, A., Kouadio, K., and Kobea, A. T.: Daytime low-level clouds in West Africa – occurrence, associated drivers, and shortwave radiation attenuation, Earth Syst. Dynam., 11, 1133–1152, https://doi.org/10.5194/esd-11-1133-2020, 2020.
Dessler, A. E.: A Determination of the Cloud Feedback from Climate Variations over the Past Decade, Science, 330, 1523–1527, https://doi.org/10.1126/science.1192546, 2010.
Doelling, D. R., Loeb, N. G., Keyes, D. F., Nordeen, M. L., Morstad, D., Nguyen, C., Wielicki, B. A., Young, D. F., and Sun, M.: Geostationary Enhanced Temporal Interpolation for CERES Flux Products, J. Atmos. Ocean. Tech., 30, 1072–1090, https://doi.org/10.1175/JTECH-D-12-00136.1, 2013.
Doelling, D. R., Sun, M., Nguyen, L. T., Nordeen, M. L., Haney, C. O., Keyes, D. F., and Mlynczak, P. E.: Advances in Geostationary-Derived Longwave Fluxes for the CERES Synoptic (SYN1deg) Product, J. Atmos. Ocean. Tech., 33, 503–521, https://doi.org/10.1175/JTECH-D-15-0147.1, 2016.
Fausto, R. S., van As, D., Mankoff, K. D., Vandecrux, B., Citterio, M., Ahlstrøm, A. P., Andersen, S. B., Colgan, W., Karlsson, N. B., Kjeldsen, K. K., Korsgaard, N. J., Larsen, S. H., Nielsen, S., Pedersen, A. Ø., Shields, C. L., Solgaard, A. M., and Box, J. E.: Programme for Monitoring of the Greenland Ice Sheet (PROMICE) automatic weather station data, Earth Syst. Sci. Data, 13, 3819–3845, https://doi.org/10.5194/essd-13-3819-2021, 2021.
Gelaro, R., McCarty, W., Suárez, M. J., Todling, R., Molod, A., Takacs, L., Randles, C. A., Darmenov, A., Bosilovich, M. G., Reichle, R., Wargan, K., Coy, L., Cullather, R., Draper, C., Akella, S., Buchard, V., Conaty, A., Da Silva, A. M., Gu, W., Kim, G.-K., Koster, R., Lucchesi, R., Merkova, D., Nielsen, J. E., Partyka, G., Pawson, S., Putman, W., Rienecker, M., Schubert, S. D., Sienkiewicz, M., and Zhao, B.: The Modern-Era Retrospective Analysis for Research and Applications, Version 2 (MERRA-2), J. Climate, 30, 5419–5454, https://doi.org/10.1175/JCLI-D-16-0758.1, 2017.
Gilgen, H., Wild, M., and Ohmura, A.: Means and Trends of Shortwave Irradiance at the Surface Estimated from Global Energy Balance Archive Data, J. Climate, 11, 2042–2061, https://doi.org/10.1175/1520-0442-11.8.2042, 1998.
Goessling, H. F., Rackow, T., and Jung, T.: Recent global temperature surge intensified by record-low planetary albedo, Science, 387, 68–73, https://doi.org/10.1126/science.adq7280, 2025.
Goosse, H., Kay, J. E., Armour, K. C., Bodas-Salcedo, A., Chepfer, H., Docquier, D., Jonko, A., Kushner, P. J., Lecomte, O., Massonnet, F., Park, H.-S., Pithan, F., Svensson, G., and Vancoppenolle, M.: Quantifying climate feedbacks in polar regions, Nat. Commun., 9, 1919, https://doi.org/10.1038/s41467-018-04173-0, 2018.
Hahn, L. C., Armour, K. C., Zelinka, M. D., Bitz, C. M., and Donohoe, A.: Contributions to Polar Amplification in CMIP5 and CMIP6 Models, Front. Earth Sci., 9, 710036, https://doi.org/10.3389/feart.2021.710036, 2021.
He, T., Liang, S., Yu, Y., Wang, D., Gao, F., and Liu, Q.: Greenland surface albedo changes in July 1981–2012 from satellite observations, Environ. Res. Lett., 8, 044043, https://doi.org/10.1088/1748-9326/8/4/044043, 2013.
He, T., Liang, S., Wang, D., Shi, Q., and Goulden, M. L.: Estimation of high-resolution land surface net shortwave radiation from AVIRIS data: Algorithm development and preliminary results, Remote Sens. Environ., 167, 20–30, https://doi.org/10.1016/j.rse.2015.03.021, 2015.
Huang, G., Li, X., Ma, M., Li, H., and Huang, C.: High resolution surface radiation products for studies of regional energy, hydrologic and ecological processes over Heihe river basin, northwest China, Agr. Forest Meteorol., 230–231, 67–78, https://doi.org/10.1016/j.agrformet.2016.04.007, 2016.
Huang, Y., Ding, Q., Dong, X., Xi, B., and Baxter, I.: Summertime low clouds mediate the impact of the large-scale circulation on Arctic sea ice, Commun. Earth Environ., 2, 38, https://doi.org/10.1038/s43247-021-00114-w, 2021.
Intergovernmental Panel On Climate Change (IPCC): Climate Change 2021 – The Physical Science Basis: Working Group I Contribution to the Sixth Assessment Report of the Intergovernmental Panel on Climate Change, 1st edn., Cambridge University Press, https://doi.org/10.1017/9781009157896, 2023.
Jia, K., Liang, S., Liu, S., Li, Y., Xiao, Z., Yao, Y., Jiang, B., Zhao, X., Wang, X., Xu, S., and Cui, J.: Global Land Surface Fractional Vegetation Cover Estimation Using General Regression Neural Networks From MODIS Surface Reflectance, IEEE T. Geosci. Remote, 53, 4787–4796, https://doi.org/10.1109/TGRS.2015.2409563, 2015.
Jiang, B., Zhang, Y., Liang, S., Wohlfahrt, G., Arain, A., Cescatti, A., Georgiadis, T., Jia, K., Kiely, G., Lund, M., Montagnani, L., Magliulo, V., Ortiz, P. S., Oechel, W., Vaccari, F. P., Yao, Y., and Zhang, X.: Empirical estimation of daytime net radiation from shortwave radiation and ancillary information, Agr. Forest Meteorol., 211–212, 23–36, https://doi.org/10.1016/j.agrformet.2015.05.003, 2015.
Jonko, A. K., Shell, K. M., Sanderson, B. M., and Danabasoglu, G.: Climate Feedbacks in CCSM3 under Changing CO2 Forcing. Part I: Adapting the Linear Radiative Kernel Technique to Feedback Calculations for a Broad Range of Forcings, J. Climate, 25, 5260–5272, https://doi.org/10.1175/JCLI-D-11-00524.1, 2012.
Kay, J. E. and L'Ecuyer, T.: Observational constraints on Arctic Ocean clouds and radiative fluxes during the early 21st century, J. Geophys. Res.-Atmos., 118, 7219–7236, https://doi.org/10.1002/jgrd.50489, 2013.
Kim, H.-Y. and Liang, S.: Development of a hybrid method for estimating land surface shortwave net radiation from MODIS data, Remote Sens. Environ., 114, 2393–2402, https://doi.org/10.1016/j.rse.2010.05.012, 2010.
Lee, S.-B., Kim, B.-M., Ukita, J., and Ahn, J.-B.: Uncertainties in Arctic Sea Ice Thickness Associated with Different Atmospheric Reanalysis Datasets Using the CICE5 Model, Atmosphere, 10, 361, https://doi.org/10.3390/atmos10070361, 2019.
Liu, X. and He, T.: A long-term monthly dataset of cloud fraction over the Arctic based on multiple satellite products using cumulative distribution function matching and Bayesian maximum entropy (1.2), Zenodo [data set], https://doi.org/10.5281/zenodo.7624605, 2022.
Liu, X., He, T., Liang, S., Li, R., Xiao, X., Ma, R., and Ma, Y.: A monthly 1° resolution dataset of daytime cloud fraction over the Arctic during 2000–2020 based on multiple satellite products, Earth Syst. Sci. Data, 15, 3641–3671, https://doi.org/10.5194/essd-15-3641-2023, 2023.
Liu, Y.: Impacts of active satellite sensors' low-level cloud detection limitations on cloud radiative forcing in the Arctic, Atmos. Chem. Phys., 22, 8151–8173, https://doi.org/10.5194/acp-22-8151-2022, 2022.
Loeb, N. G., Johnson, G. C., Thorsen, T. J., Lyman, J. M., Rose, F. G., and Kato, S.: Satellite and Ocean Data Reveal Marked Increase in Earth's Heating Rate, Geophys. Res. Lett., 48, https://doi.org/10.1029/2021GL093047, 2021.
Loeb, N. G., Mayer, M., Kato, S., Fasullo, J. T., Zuo, H., Senan, R., Lyman, J. M., Johnson, G. C., and Balmaseda, M.: Evaluating Twenty-Year Trends in Earth's Energy Flows From Observations and Reanalyses, J. Geophys. Res.-Atmos., 127, https://doi.org/10.1029/2022JD036686, 2022.
McCoy, D. T., Eastman, R., Hartmann, D. L., and Wood, R.: The Change in Low Cloud Cover in a Warmed Climate Inferred from AIRS, MODIS, and ERA-Interim, J. Climate, 30, 3609–3620, https://doi.org/10.1175/JCLI-D-15-0734.1, 2017.
Miller, N. B., Shupe, M. D., Cox, C. J., Walden, V. P., Turner, D. D., and Steffen, K.: Cloud Radiative Forcing at Summit, Greenland, J. Climate, 28, 6267–6280, https://doi.org/10.1175/JCLI-D-15-0076.1, 2015.
Minnis, P., Sun-Mack, S., Young, D. F., Heck, P. W., Garber, D. P., Chen, Y., Spangenberg, D. A., Arduini, R. F., Trepte, Q. Z., Smith, W. L., Ayers, J. K., Gibson, S. C., Miller, W. F., Hong, G., Chakrapani, V., Takano, Y., Liou, K.-N., Xie, Y., and Yang, P.: CERES Edition-2 Cloud Property Retrievals Using TRMM VIRS and Terra and Aqua MODIS Data – Part I: Algorithms, IEEE T. Geosci. Remote, 49, 4374–4400, https://doi.org/10.1109/TGRS.2011.2144601, 2011.
Minnis, P., Sun-Mack, S., Chen, Y., Chang, F.-L., Yost, C. R., Smith, W. L., Heck, P. W., Arduini, R. F., Bedka, S. T., Yi, Y., Hong, G., Jin, Z., Painemal, D., Palikonda, R., Scarino, B. R., Spangenberg, D. A., Smith, R. A., Trepte, Q. Z., Yang, P., and Xie, Y.: CERES MODIS Cloud Product Retrievals for Edition 4 – Part I: Algorithm Changes, IEEE T. Geosci. Remote, 59, 2744–2780, https://doi.org/10.1109/TGRS.2020.3008866, 2021.
NASA POWER Project: Solar Flux Assessment – Validation of CERES SYN1deg all-sky shortwave fluxes against BSRN observations, NASA Langley Research Center, https://power.larc.nasa.gov/docs/methodology/energy-fluxes/solar-validation/ (last access: 17 September 2025), 2024.
Oehri, J., Schaepman-Strub, G., Kim, J.-S., Grysko, R., Kropp, H., Grünberg, I., Zemlianskii, V., Sonnentag, O., Euskirchen, E. S., Reji Chacko, M., Muscari, G., Blanken, P. D., Dean, J. F., Di Sarra, A., Harding, R. J., Sobota, I., Kutzbach, L., Plekhanova, E., Riihelä, A., Boike, J., Miller, N. B., Beringer, J., López-Blanco, E., Stoy, P. C., Sullivan, R. C., Kejna, M., Parmentier, F.-J. W., Gamon, J. A., Mastepanov, M., Wille, C., Jackowicz-Korczynski, M., Karger, D. N., Quinton, W. L., Putkonen, J., Van As, D., Christensen, T. R., Hakuba, M. Z., Stone, R. S., Metzger, S., Vandecrux, B., Frost, G. V., Wild, M., Hansen, B., Meloni, D., Domine, F., Te Beest, M., Sachs, T., Kalhori, A., Rocha, A. V., Williamson, S. N., Morris, S., Atchley, A. L., Essery, R., Runkle, B. R. K., Holl, D., Riihimaki, L. D., Iwata, H., Schuur, E. A. G., Cox, C. J., Grachev, A. A., McFadden, J. P., Fausto, R. S., Göckede, M., Ueyama, M., Pirk, N., De Boer, G., Bret-Harte, M. S., Leppäranta, M., Steffen, K., Friborg, T., Ohmura, A., Edgar, C. W., Olofsson, J., and Chambers, S. D.: Vegetation type is an important predictor of the arctic summer land surface energy budget, Nat. Commun., 13, 6379, https://doi.org/10.1038/s41467-022-34049-3, 2022.
Pastorello, G., Papale, D., Chu, H., Trotta, C., Agarwal, D., Canfora, E., Baldocchi, D., and Torn, M.: A New Data Set to Keep a Sharper Eye on Land-Air Exchanges, Eos, https://doi.org/10.1029/2017EO071597, 2017.
Previdi, M., Smith, K. L., and Polvani, L. M.: Arctic amplification of climate change: a review of underlying mechanisms, Environ. Res. Lett., 16, 093003, https://doi.org/10.1088/1748-9326/ac1c29, 2021.
Prince, H. D. and L'Ecuyer, T. S.: Observed Energetic Adjustment of the Arctic and Antarctic in a Warming World, J. Climate, 37, 2611–2627, https://doi.org/10.1175/jcli-d-23-0294.1, 2024.
Qian, Y., Long, C. N., Wang, H., Comstock, J. M., McFarlane, S. A., and Xie, S.: Evaluation of cloud fraction and its radiative effect simulated by IPCC AR4 global models against ARM surface observations, Atmos. Chem. Phys., 12, 1785–1810, https://doi.org/10.5194/acp-12-1785-2012, 2012.
Rantanen, M., Karpechko, A. Yu., Lipponen, A., Nordling, K., Hyvärinen, O., Ruosteenoja, K., Vihma, T., and Laaksonen, A.: The Arctic has warmed nearly four times faster than the globe since 1979, Commun. Earth Environ., 3, 168, https://doi.org/10.1038/s43247-022-00498-3, 2022.
Rutan, D. A., Kato, S., Doelling, D. R., Rose, F. G., Nguyen, L. T., Caldwell, T. E., and Loeb, N. G.: CERES Synoptic Product: Methodology and Validation of Surface Radiant Flux, J. Atmos. Ocean. Tech., 32, 1121–1143, https://doi.org/10.1175/JTECH-D-14-00165.1, 2015.
Shell, K. M., Kiehl, J. T., and Shields, C. A.: Using the Radiative Kernel Technique to Calculate Climate Feedbacks in NCAR's Community Atmospheric Model, J. Climate, 21, 2269–2282, https://doi.org/10.1175/2007JCLI2044.1, 2008.
Sledd, A. and L'Ecuyer, T.: How Much Do Clouds Mask the Impacts of Arctic Sea Ice and Snow Cover Variations? Different Perspectives from Observations and Reanalyses, Atmosphere, 10, 12, https://doi.org/10.3390/atmos10010012, 2019.
Soden, B. J. and Held, I. M.: An Assessment of Climate Feedbacks in Coupled Ocean–Atmosphere Models, J. Climate, 19, 3354–3360, https://doi.org/10.1175/JCLI3799.1, 2006.
Soden, B. J., Broccoli, A. J., and Hemler, R. S.: On the Use of Cloud Forcing to Estimate Cloud Feedback, J. Climate, 17, 3661–3665, https://doi.org/10.1175/1520-0442(2004)017<3661:OTUOCF>2.0.CO;2, 2004.
Soden, B. J., Held, I. M., Colman, R., Shell, K. M., Kiehl, J. T., and Shields, C. A.: Quantifying Climate Feedbacks Using Radiative Kernels, J. Climate, 21, 3504–3520, https://doi.org/10.1175/2007JCLI2110.1, 2008.
Tao, C., Zhang, M., and Xie, S.: Cloud radiative effect dominates variabilities of surface energy budget in the dark Arctic, Sci. Rep., 15, 2976, https://doi.org/10.1038/s41598-025-86322-2, 2025.
Thorsen, T. J., Kato, S., Loeb, N. G., and Rose, F. G.: Observation-Based Decomposition of Radiative Perturbations and Radiative Kernels, J. Climate, 31, 10039–10058, https://doi.org/10.1175/JCLI-D-18-0045.1, 2018.
Tjernström, M., Shupe, M. D., Brooks, I. M., Achtert, P., Prytherch, J., and Sedlar, J.: Arctic Summer Airmass Transformation, Surface Inversions, and the Surface Energy Budget, J. Climate, 32, 769–789, https://doi.org/10.1175/JCLI-D-18-0216.1, 2019.
Trepte, Q. Z., Bedka, K. M., Chee, T. L., Minnis, P., Sun-Mack, S., Yost, C. R., Chen, Y., Jin, Z., Hong, G., Chang, F.-L., and Smith, W. L.: Global Cloud Detection for CERES Edition 4 Using Terra and Aqua MODIS Data, IEEE T. Geosci. Remote, 57, 9410–9449, https://doi.org/10.1109/TGRS.2019.2926620, 2019.
Van Tricht, K., Lhermitte, S., Lenaerts, J. T. M., Gorodetskaya, I. V., L'Ecuyer, T. S., Noël, B., Van Den Broeke, M. R., Turner, D. D., and Van Lipzig, N. P. M.: Clouds enhance Greenland ice sheet meltwater runoff, Nat. Commun., 7, 10266, https://doi.org/10.1038/ncomms10266, 2016.
Wang, B., Jia, K., Wei, X., Xia, M., Yao, Y., Zhang, X., Liu, D., and Tao, G.: Generating spatiotemporally consistent fractional vegetation cover at different scales using spatiotemporal fusion and multiresolution tree methods, ISPRS J. Photogramm., 167, 214–229, https://doi.org/10.1016/j.isprsjprs.2020.07.006, 2020.
Wei, J., Wang, Z., Gu, M., Luo, J.-J., and Wang, Y.: An evaluation of the Arctic clouds and surface radiative fluxes in CMIP6 models, Acta Oceanol. Sin., 40, 85–102, https://doi.org/10.1007/s13131-021-1705-6, 2021.
Wetherald, R. T. and Manabe, S.: Cloud Feedback Processes in a General Circulation Model, J. Atmos. Sci., 45, 1397–1416, https://doi.org/10.1175/1520-0469(1988)045<1397:CFPIAG>2.0.CO;2, 1988.
Wild, M., Ohmura, A., Schär, C., Müller, G., Folini, D., Schwarz, M., Hakuba, M. Z., and Sanchez-Lorenzo, A.: The Global Energy Balance Archive (GEBA) version 2017: a database for worldwide measured surface energy fluxes, Earth Syst. Sci. Data, 9, 601–613, https://doi.org/10.5194/essd-9-601-2017, 2017.
Zheng, Y., He, T., and Ma, Y.: Analysis of temporal trends and spatial distributions in top-of-atmosphere shortwave radiation based on multiple datasets from satellites observations, reanalyses, climate models, Global Planet. Change, 255, 105040, https://doi.org/10.1016/j.gloplacha.2025.105040, 2025.
Zhu, T., Huang, Y., and Wei, H.: Estimating Climate Feedbacks Using a Neural Network, J. Geophys. Res.-Atmos., 124, 3246–3258, https://doi.org/10.1029/2018JD029223, 2019.
Zib, B. J., Dong, X., Xi, B., and Kennedy, A.: Evaluation and Intercomparison of Cloud Fraction and Radiative Fluxes in Recent Reanalyses over the Arctic Using BSRN Surface Observations, J. Climate, 25, 2291–2305, https://doi.org/10.1175/JCLI-D-11-00147.1, 2012.