the Creative Commons Attribution 4.0 License.
the Creative Commons Attribution 4.0 License.
 | 03 Mar 2026
Ice-nucleating particle depletion in the wintertime boundary layer in the pre-Alpine region during stratus cloud conditions
Markus Hartmann
Heike Wex
Patric Seifert
Anja Hardt
Anna Miller
Katharina Baudrexl
Werner Thomas
Veronika Ettrichrätz
Maximilian Maahn
Tom Gaudek
Willi Schimmel
Fabian Senf
Hannes Griesche
Martin Radenz
Jan Henneberger
This study evaluates the regional variability of the number concentration of ice-nucleating particles (INPs) between the two pre-Alpine central-European sites of Eriswil, Switzerland, and Hohenpeißenberg, Germany, supported by INP measurements from Melpitz, Germany, during the winter months of 2024. The aim of the study is to spatially and temporally evaluate INP availability and removal within the planetary boundary layer (PBL) during Bise situations because reasons for the lack of ice and precipitation in the supercooled clouds observed over the Swiss Plateau remain unclear and may be caused by the lack of INPs. Target scenario of the study were situations when northeasterly winds (so-called Bise winds) prevailed and layers of stratus clouds formed at the top of the PBL at temperatures down to −10 °C. In these situations, it is expected that INPs are depleted along the transport path. The main insights from INP measurements were: first, during the cold-Bise (cloud minimum temperatures as low as −10 °C) and warm-Bise (cloud minimum temperatures above 0 °C), almost no INP contrast was found between Hohenpeißenberg and Eriswil if both were within the PBL. Also, the INP concentration was overall found to be much lower during the cold-Bise than during the later warm-Bise situation. Second, when the Hohenpeißenberg site was located in the free troposphere during the cold-Bise situation, INP concentrations were much higher compared to Eriswil (still within the PBL) but similar to cloud-free Melpitz. These observations led to the conclusion that during cold-Bise situations the INP reservoir within the PBL is depleted, likely by the presence of supercooled stratus. The inversion-capped wintertime PBL, especially during periods of widespread snow cover, is apparently not capable to replenish the INP reservoir from the free troposphere.
- Article
(7222 KB) - Full-text XML
-
Supplement
(8445 KB) - BibTeX
- EndNote


Precipitation and clouds play a major role in the hydrological cycle, the local weather as well as the global climate. Most precipitating clouds in the lower to middle troposphere are mixed-phase clouds, consisting of supercooled liquid water droplets and ice crystals (Mülmenstädt et al., 2015). More than half of the clouds at temperatures around −15 to −20 °C contain ice (Hoose and Möhler, 2012; Radenz et al., 2021). Multiple processes in a mixed-phase cloud system lead to ice crystal growth, for example aggregation, riming, depositional growth (Wegener, 1911; Bergeron, 1935; Findeisen, 1938). Secondary ice formation processes lead to ice crystal number multiplication like rime splintering (Hallet and Mossop, 1974) or collisional breakup. However, all these processes require already existing ice crystals. Above −38 °C (which is above the homogeneous freezing temperature regime), all pristine ice crystals are formed via the heterogeneous freezing process which requires the availability of ice-nucleating particles (INPs) (Hoose and Möhler, 2012). INPs act as a catalyst for ice nucleation, which lowers the energy barrier between the solid and liquid or vapour phase. The most relevant type of heterogeneous freezing at slightly supercooled temperatures is immersion freezing (Holden et al., 2021), which takes place when ice nucleation is triggered by an INP while immersed within a supercooled liquid cloud droplet. The INP in this droplet can be the initial cloud condensation particle or an immersed particle (Hartmann et al., 2011).
The fraction of aerosol particles able to act as INP is generally low. When comparing typical INP concentrations (as e.g. given in Petters and Wright, 2015) with typical particle concentrations, it can be estimated that roughly only one in a million particles can initiate freezing at a temperature of −20 °C. Different types of aerosol particles act as efficient INPs in different temperature regimes. For example, black carbon, organic acids, humic like substances, and ammonium sulphate are found to be inefficient at temperatures above −38 °C (Hoose and Möhler, 2012). Mineral dust becomes effective as an INP at temperatures of −20 °C and lower and is very common in the atmosphere. Biological aerosol particles are already active as INPs at temperatures above −15 °C, with some already showing ice activity even above −5 °C (Pummer et al., 2015). Biological INPs originate from the biosphere, typically connected to microorganisms such as bacteria, fungi, pollen and lichen (Pummer et al., 2015; Kanji et al., 2017). Their contribution to the atmosphere is expected to be limited in winter times, due to a less active biosphere and possibly due to ground and vegetation being covered by snow (Tobo et al., 2024).
Upon the availability of an aerosol particle, which is immersed inside a supercooled droplet, at temperatures where the aerosol can act as an INP, the droplet freezes immediately. Depending mainly on ambient temperature, ice supersaturation, and turbulence during the growth period of ice crystals, diverse crystal shapes are formed (Bailey and Hallett, 2009). For example at temperatures of −3 to −10 °C, prolate shapes like needles, columns, and prisms dominate. At temperatures between −10 and −20 °C, oblate shapes like dendrites and plates dominate (Libbrecht, 2008). The formed pristine ice crystals then interact with the available cloud droplets and ice crystals, which changes their shape during their way through the cloud. Therefore, shape and size of a falling snow crystal holds important information about its formation process and life cycle. Complex snowflakes are formed through the aggregation of multiple ice crystals. Round shapes are formed by a process called riming, where water droplets freeze onto the crystal (Ávila et al., 2009; Maahn et al., 2024). Recent studies show that INP concentrations can vary between different air masses and that this has an impact on the characteristics of clouds (Radenz et al., 2021; Griesche et al., 2021). Radenz et al. (2021) found that clouds in an environment with a low availability of INPs (as in Punta Arenas, Chile) tend to form less ice at the same temperatures clouds would do in an INP-loaded environment as in Leipzig, Germany, or Limassol, Cyprus. Griesche et al. (2021) found similar results for the Arctic. There, a higher fraction of ice-containing clouds was found compared to the mid-latitudes, especially at temperatures between −3 and −10 °C when the clouds were thermodynamically connected to the presumably INP-enriched summertime marine boundary layer.
Slightly supercooled stratiform clouds are frequently found over the Swiss Plateau in Central Europe during the so-called Bise situation. The Bise is a regional, persistent northeasterly or easterly wind over the Swiss Plateau, favouring the formation of these clouds in wintertime. In case of the presence of a high-pressure system north of the Alps and a low-pressure system in Eastern Europe, the north-south surface pressure gradient is increased. The Bise is also a result of the local orography of the Swiss Plateau. Located in a long valley that gets narrower from northeast towards southwest, the Swiss Plateau is located between the Jura and the Alpine mountains. Therefore, a channeling of the air flow from the northeast leads to higher wind speeds in the area, typically accompanied by low temperatures (Wanner and Furger, 1990). Most of the times during a Bise situation, slightly supercooled stratiform clouds form over the Swiss Plateau and the neighbouring regions to the north and northeast. This makes it an ideal location to learn about ice formation at slightly supercooled conditions. Precipitation in these latitudes is mainly formed through the ice phase (Mülmenstädt et al., 2015). Therefore, INPs active at temperatures between 0 and −10 °C, which is a typical Bise cloud minimum temperature, are required to form precipitation in the absence of seeder clouds. Precipitation would be an important factor to remove moisture from the cloud and to reduce its longevity. However, observations show that only every tenth stratiform cloud event over the Swiss Plateau at temperatures around −10 °C forms precipitation (Scherrer and Appenzeller, 2014; Granwehr, 2022). Comparable clouds over Germany are expected to contain ice much more frequently. Kanitz et al. (2011) found that one third of the clouds with minimum temperatures around −10 °C contain ice in Leipzig, Germany. This contrast could explain why models often struggle representing the longevity of the so-called Bise clouds and overestimate the amount of precipitation during Bise situations (Ohneiser et al., 2025a). Reasons for the lack of ice and precipitation in the supercooled clouds over the Swiss Plateau remain unclear and complicate the regional weather forecasts. Further research is required to understand the lack in ice formation in low supercooled clouds over the Swiss Plateau, to improve local weather models and precipitation forecasts. One attempt has recently been performed in the framework of the CLOUDLAB project, which used artificial cloud seeding to improve the understanding of the ice formation process in the supercooled Bise cloud layers (Henneberger et al., 2023).
This publication aims at contributing to the understanding of the complex topic of regional INP variability by means of a combination of INP observations at two different sites located along the typical trajectory of the Bise air masses, namely Hohenpeißenberg, Germany (HPB, 47.80° N, 11.01° E, 977 m a.s.l. upwind station, on top of a hill) and Eriswil, Switzerland (Eri, 47.07° N, 7.87° E, 921 m a.s.l., downwind station, on top of a hill). The dataset is complemented by INP measurements from Melpitz, Germany (51.53° N, 12.94° E, 86 m a.s.l., flat terrain), which is a measurement station located at a rural area in a flat terrain with fields and meadows in the nearby vicinity, and by the incorporation of in situ observations at a further field site over the Swiss plateau.
The central hypothesis for this study is illustrated in Fig. 1a. We hypothesize that an observed lack of ice formation in supercooled low-level stratiform liquid clouds over Eri is due to a lack of INPs in the temperature range in which the clouds form. Further, we hypothesize that, under prevailing northeasterly winds, the few present INPs are activated and removed via precipitating from the stratus cloud deck, and that this would happen over some distance. The hypothesis was formed based on the observation, that during a cold Bise cloud (cloud minimum temperatures as low as −10 °C) at Eri there is typically no significant precipitation, but still, ice crystals form sporadically and can be observed at the ground (illustrated in Fig. 1a). During Bise situations, low, geometrically thin but optically thick stratus clouds form over the Swiss Plateau where drizzle or light snowfall can be expected. In our study region, during northeasterly winds, air masses originate typically from eastern and northeastern Europe. During winter, a high amount of cloud condensation nuclei (CCN) resulting from industry and traffic is transported in these air masses towards Switzerland. However, we expected INP sources active at temperatures around −10 °C to be limited, with biological particles, and therewith INP active at these temperatures, being rare in the cold and snowy eastern Europe during winter times. Following the hypothesis, no significant INP concentrations would be left in the respective temperature regime of the supercooled cloud between 0 and −10 °C at a downwind site as Eri, while somewhat higher INP concentrations may be expected at an upwind site as in HPB. To generate the observed sporadic fall of ice crystals, we propose the following: On top of the stratus cloud, there is typically a strong temperature inversion. In the air above the inversion, in the free troposphere, there is still an INP reservoir available, relevant for the temperature range within the stratus clouds. Via turbulence, the INPs can be entrained into the liquid water cloud and form ice sporadically. A warm Bise situation (temperatures above freezing) or a clear sky situation would not decrease the INP concentration in the PBL significantly.
For investigating this hypothesis, the air masses of two research sites often connected by air flow were sampled. The upwind site was at Hohenpeißenberg, Germany (coordinates: 47.80° N, 11.01° E, 945 m a.s.l.), and the downwind site at Eri, Switzerland (coordinates: 47.07° N, 7.87° E, 921 m a.s.l.). Figure 1b provides a map showing the locations of Eri in central Switzerland and HPB in southern Germany for spatial context. The distance between the two stations is 250 km. Measurements within the PBL inside and outside of clouds reveal insights into the activation and removal of INPs. These measurements (within PBL) in air masses at quasi neighbouring sites allow conclusions about the INP development between these sites if no INP sources are in between. In addition, INP measurements were operationally done at a further upwind site in Melpitz, Germany (51.53° N, 12.94° E, 86 m a.s.l.), which is located approximately 440 km northeast of HPB. The site should be affected by similar air masses coming from north easterly directions.
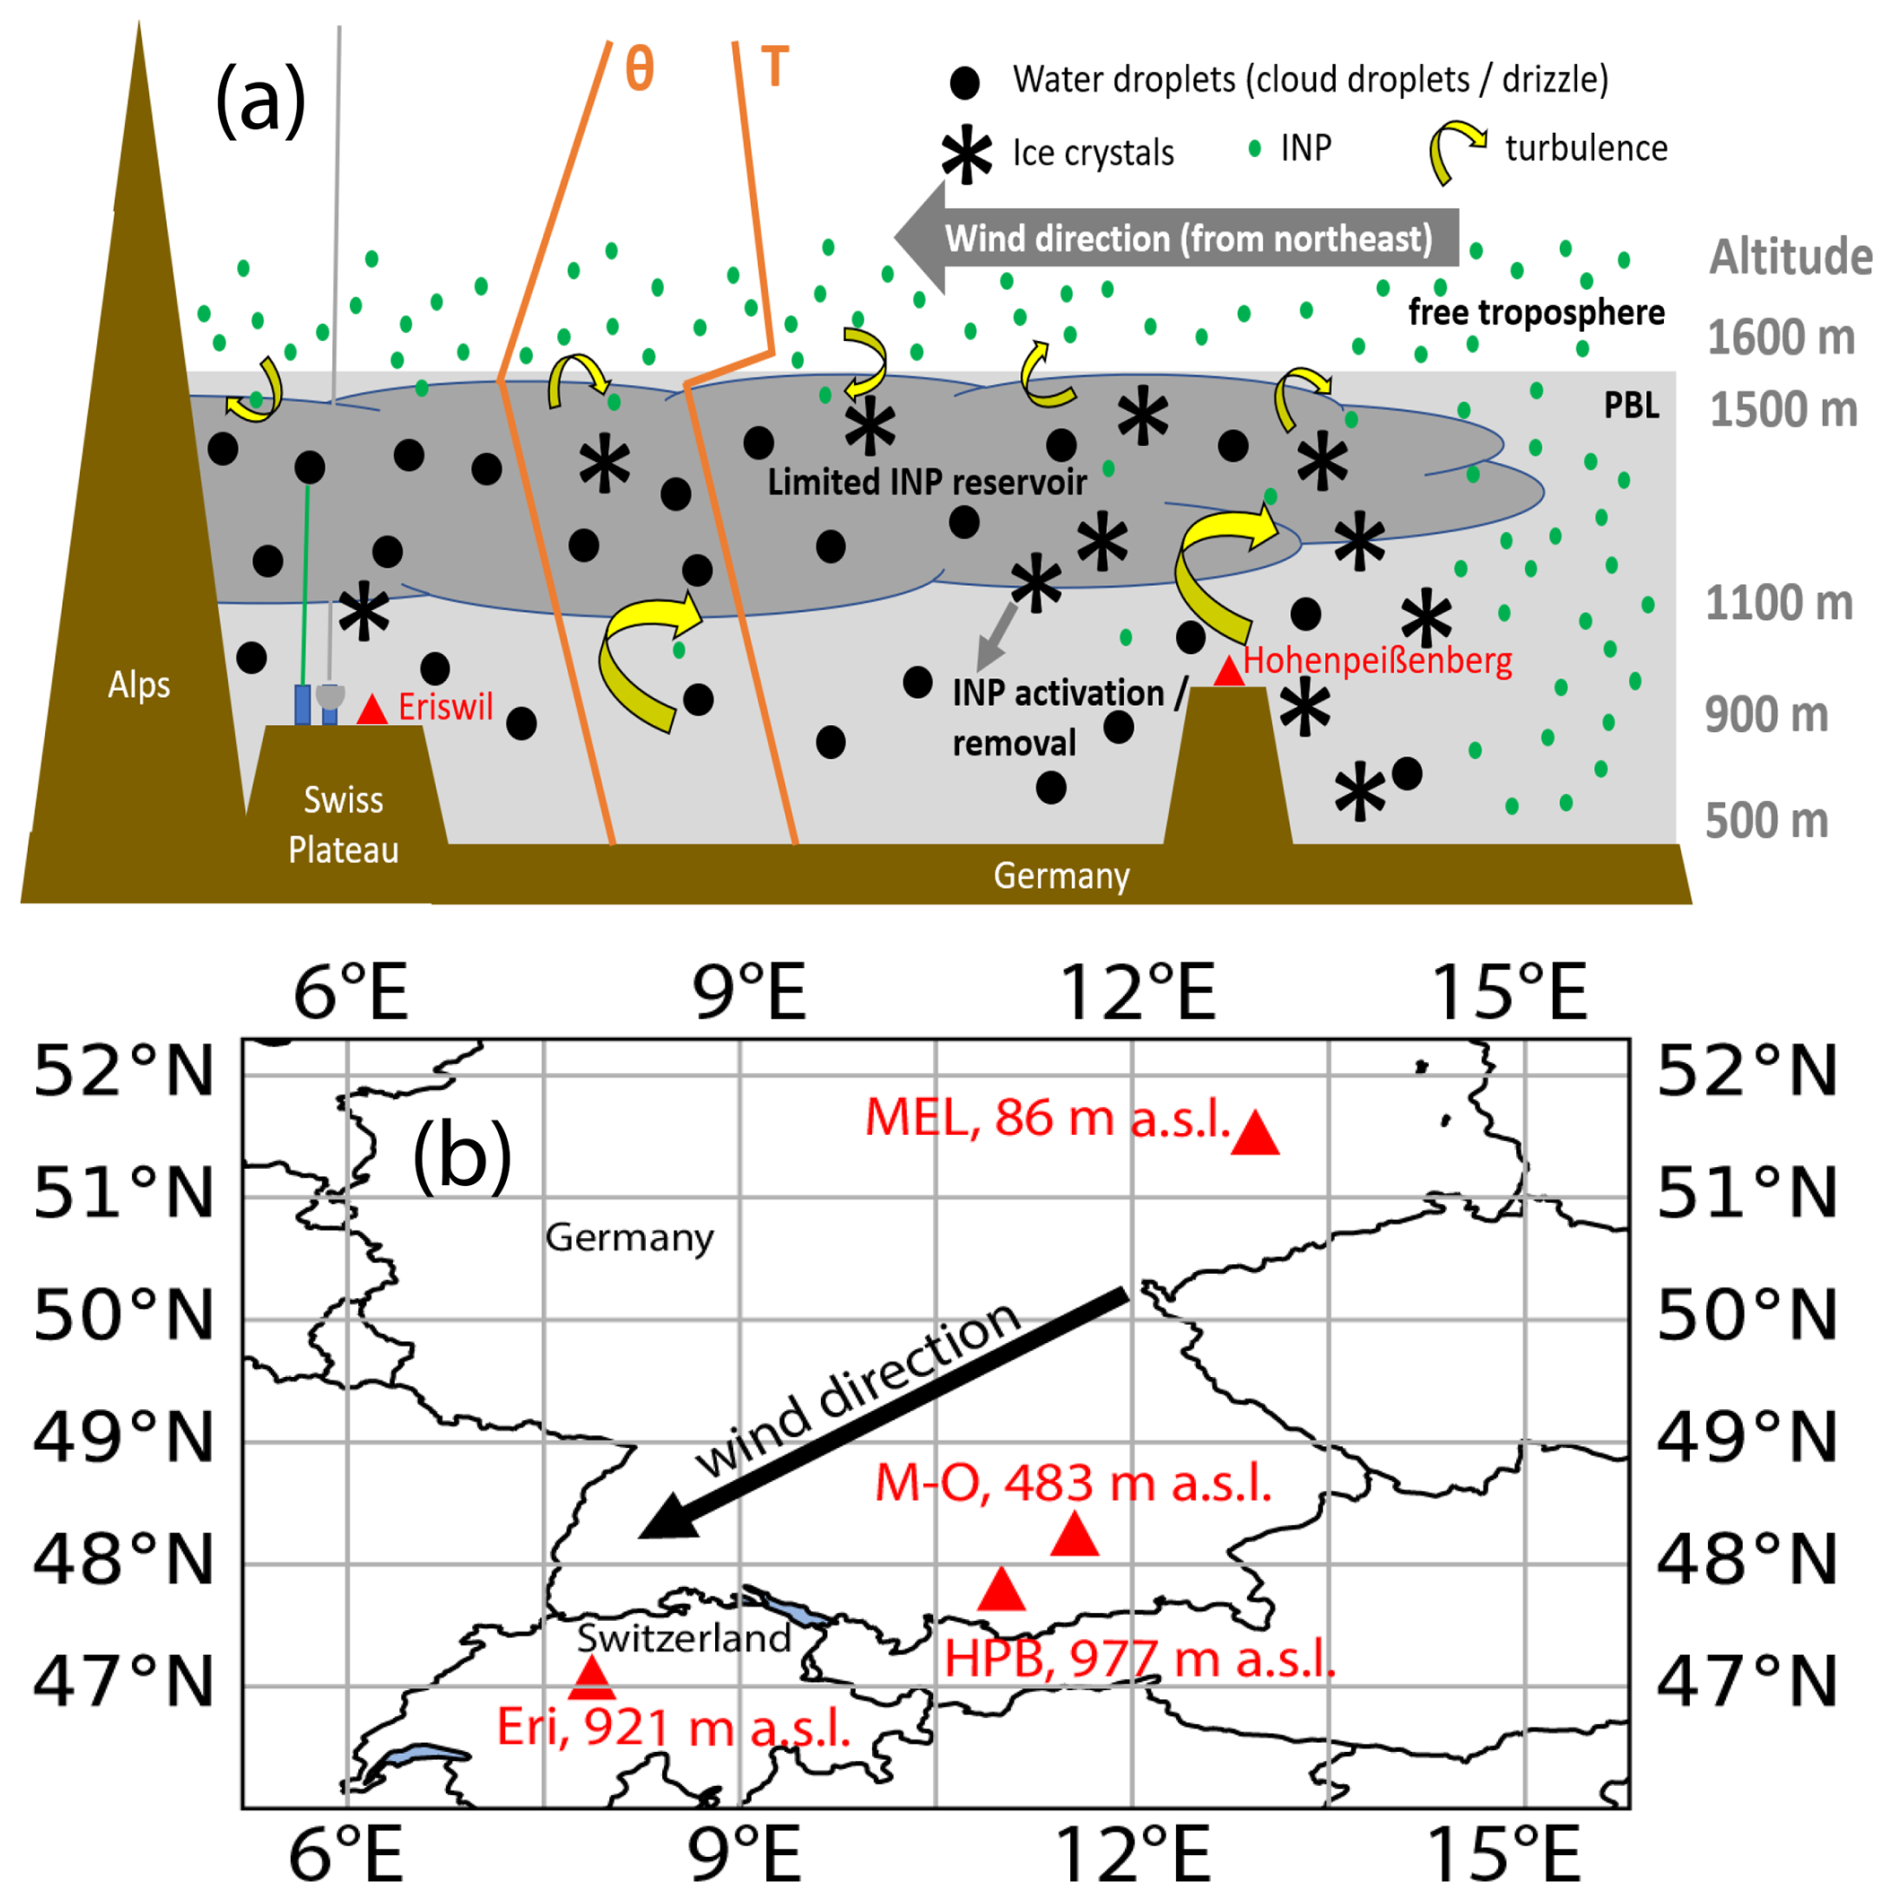
Figure 1(a) Sketch of the hypothesis of an experimental scenario that the INPs get lost within the supercooled stratus cloud after a short time. (b) Map of the locations of MEL, München-Oberschleißheim (M-O), HPB and Eri.
3.1 Experimental setup and data
The two measurement sites in Eri and HPB were equipped with a set of remote-sensing and in situ devices. The setup of the site in Eri is described in more detail in Ohneiser et al. (2025a). Table 1 provides a list of instruments that were used in this study.
(Rose et al., 2005)(Wiegner and Geiß, 2012)(Schönhuber et al., 2008)(RPG, 2024)(Maahn et al., 2024)(Bessardon et al., 2019)Table 1Details on the measurement instruments used in this study.
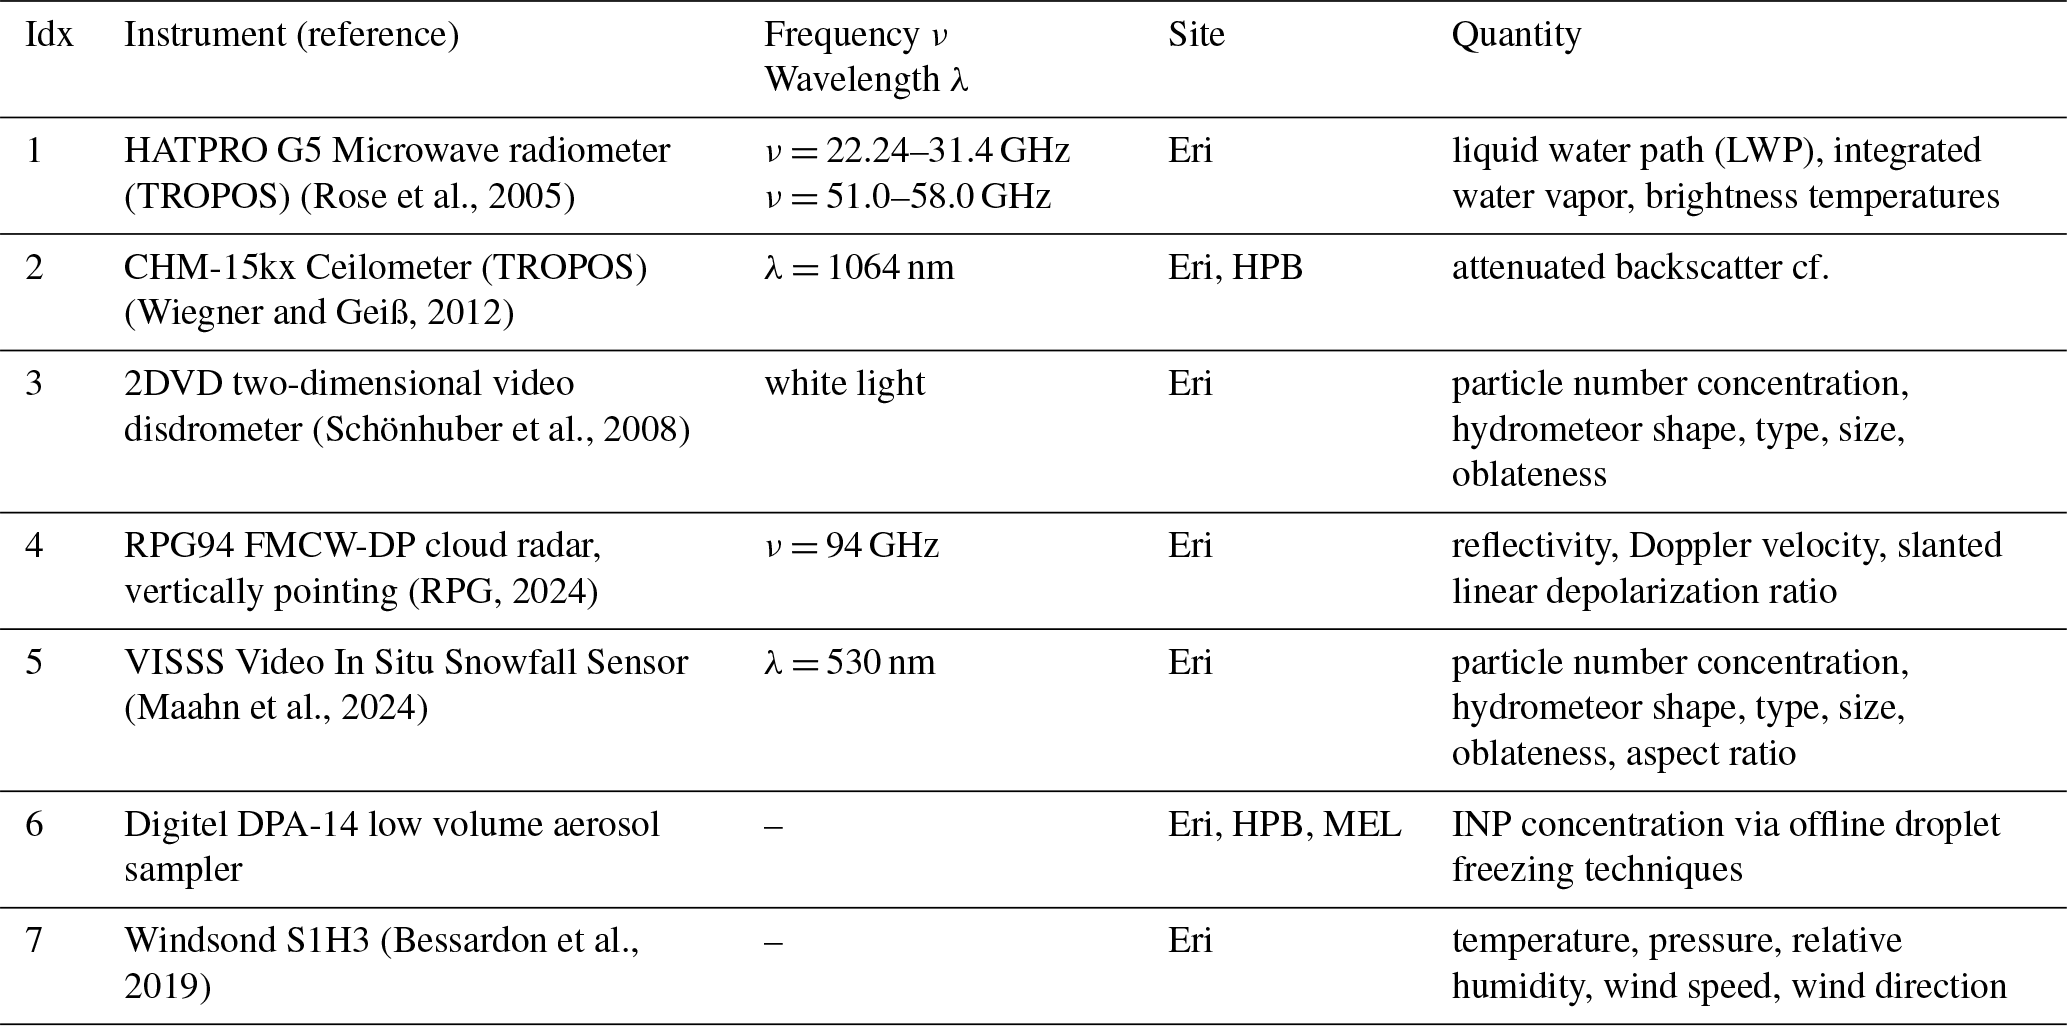
Measurements were done in the framework of the CLOUDLAB (Henneberger et al., 2023) and PolarCAP (Ohneiser et al., 2025a) campaigns. Both campaigns took place side by side. The CLOUDLAB campaign involved a unique set of ground-based and airborne in situ cloud and precipitation sensors and remote-sensing instruments. During the two wintertime campaigns between 2022 and 2024, LACROS enhanced the remote-sensing capabilities of the CLOUDLAB campaign with a large number of ground-based equipment, such as a scanning 35 GHz and vertically-pointing 94 GHz cloud radar from TROPOS, Raman polarization lidar, Doppler lidar, ceilometer, micro rain radar, photometer, disdrometer, and microwave radiometer. In addition, INP sampling was conducted in Eri and additionally at the German Weather Service (Deutscher Wetterdienst, DWD) in Hohenpeißenberg, using a low volume aerosol filter sampler (DIGITEL, DPA14 LVS) with a PM10 inlet at both sites (PM10 refers to particles that pass through the size-selective air inlet, which has a separation efficiency of 50 % for an aerodynamic diameter of 10 µm). The filter magazines for the instruments at both sites were prepared simultaneously prior to shipment to the sites. This was done in a laminar flow hood at TROPOS to eliminate possible contamination on the filters. 47 mm polycarbonate filters with a pore size of 0.4 µm were used. A filter sample typically was collected for 12 h, with a flow rate of 25 L min−1 at ambient conditions resulting in a typical sampling volume of approximately 18 000 STP L (standard conditions: 0 °C; 1013 hPa). During a Bise situation, the sampler was set to run continuously with an automatic filter change typically scheduled for 08:00 and 20:00 UTC (see Ohneiser et al., 2025b). We checked the weather forecast continuously and if we expected to have northeasterly wind conditions for at least four days, we started the measurements. Each sampled filter was stored in a separate Petri dish at −20 °C after sampling until off-line analysis was done at the TROPOS ice-laboratory. Field blank filters were also taken by inserting filters into the sampler, but without sucking air through them, and by subsequently treating these field blanks similar to sampled filters. During the campaign 21 and 17 samples were collected at HPB and Eri, respectively. The same type of sampler but with an inlet for total suspended particles collected particles on polycarbonate filters (pore size of of 0.8 µm) for INP analysis operationally at MEL. A filter is taken every third day for 24 h with a flow rate of about 22 L min−1. A field blank is taken every 9 d. Filter handling and evaluation were the same as for filters collected at Eri and HPB.
Also, LACROS (Leipzig Aerosol and Clouds Remote Observations System; Radenz et al., 2021; Ohneiser et al., 2025a) data of the RPG94 Cloud radar, VISSS, 2DVD, HATPRO, and lidar PollyXT were used. In addition, windsondes were launched in Eri and radiosonde profile information for HPB was taken from University of Wyoming (2024) for the Munich station. Surface temperature information for HPB was taken from the CDC (Climate Data Center from DWD, CDC, 2024).
3.2 INP measurements
Immersion freezing measurements were performed in the TROPOS ice-laboratory, using the two measurement devices Leipzig Ice Nucleation Array (LINA) and Ice Nucleation Droplet Array (INDA) (Hartmann et al., 2019). Both devices have been used in more than 20 studies in the past years, among them a comparison study done by Lacher et al. (2024), in which their results agreed well with those of other similar devices.
In short, INPs were washed off a filter sample by shaking the filter in 3 mL of ultra-pure water. For a LINA measurement, from this particle suspension, 90 droplets with a volume of 1 µL were then set onto a hydrophobic glass slide which itself sat on a Peltier element. On the glass slide, there was a grid which then again was covered with a second glass slide to separate the droplets from each other and the environment. The Peltier element cooled the droplets with a rate of 1 K min−1. The setup was illuminated from above, and a picture was taken every 6 s (i.e., every 0.1 K) with a camera that was also installed above. Frozen droplets were discriminated from non-frozen droplets by a custom, Python-based image analysis algorithm. The result from such a measurement is a curve of frozen fractions fice (i.e., number of frozen droplets total number of droplets) over temperature T.
The remaining suspension was diluted further by adding 3.5 mL ultra-pure water in order to create enough suspension to fill the wells of a PCR (Polymerase Chain Reaction) plate with 50 µL droplets to be used with the INDA device. PCR plates with 96 wells were used, and most of the time, two samples were examined simultaneously by filling 48 wells with one sample and the other 48 wells with the other (for MEL samples a full 96 well PCR plate per was used for each sample). After sealing the PCR tray with a clear adhesive film, it was immersed in an ethanol bath such that the liquid in the bath was above the liquid level in the wells. The bath was then cooled at 1 K min−1. During cooling, the ethanol level was held constant with a custom-designed bath leveler similar to David et al. (2019). A light in the bath illuminated the PCR plate from below, and a camera was installed above and coupled with the cryostat in order to take pictures in 0.1 K intervals. Again, frozen droplets were discriminated from non-frozen droplets with a custom, Python-based image analysis algorithm yielding fice(T).
Afterwards, the PCR plates were heated to 90 °C for 30 min to remove the ice nucleation ability of heat-labile INPs. These heat-labile INPs are a proxy for the fraction of proteinaceous biological INPs (Christner et al., 2008).
From all frozen fraction curves, INP concentrations were then calculated based on the assumption of a Poisson distribution of INPs via the examined droplets or wells, following Vali (1971). A more thorough description of the INP measurements can be found e.g., in Hartmann et al. (2019), Gong et al. (2022) or Sze et al. (2023).
3.3 Hybrid Single-Particle Lagrangian Integrated Trajectory Model – HYSPLIT
HYSPLIT (Hybrid Single-Particle Lagrangian Integrated Trajectory Model, Stein et al., 2015) is a model used to calculate trajectories, origin of air parcels, and dispersion. The model is freely available at HYSPLIT (2025). GDAS (Global Data Assimilation System, 1°-spatial resolution) meteorological data in terms of air pressure, temperature, humidity, wind speed, wind direction, or precipitation are required. The HYSPLIT model uses a Lagrangian approach (applied in the study) as well as a Eulerian approach. The Lagrangian approach is used with a moving frame of reference for the advection and diffusion calculations. The Eulerian approach uses a fixed three-dimensional grid as a frame of reference to compute pollutant air concentrations. The trajectories were calculated twice per measurement day at 02:00 and 14:00 UTC at 100, 250 and 1000 m a.g.l. (above ground level) as 72 h backward trajectories.
INP sampling was done side by side with the CLOUDLAB and PolarCAP projects. During winter 2023/2024, there were two periods with a multi-day northeasterly wind (Bise) situation. The first period started on 6 January 2024 and ended on 12 January 2024. The second period started on 26 February 2024 and ended on 1 March 2024. In the first period, measurements with supercooled conditions at the stratus cloud top were found, in the second period no supercooled conditions were observed.
4.1 Overview over the two measurement periods
Figure 2a presents the temperature evolution during the cold measurement period (6–12 January 2024) as recorded at the field site of Eri and for HPB data from the DWD CDC portal (CDC, 2024). Throughout this period, temperatures remain consistently below freezing at ground level, with the exception of a short interval on 6 January 2024 in Eri. Especially on 8 and 9 January 2024, temperatures range between −5 and −10 °C. A notable temperature increase is observed at HPB on 10 January 2024, where temperatures increase sharply from −10 to 0 °C within a few hours.
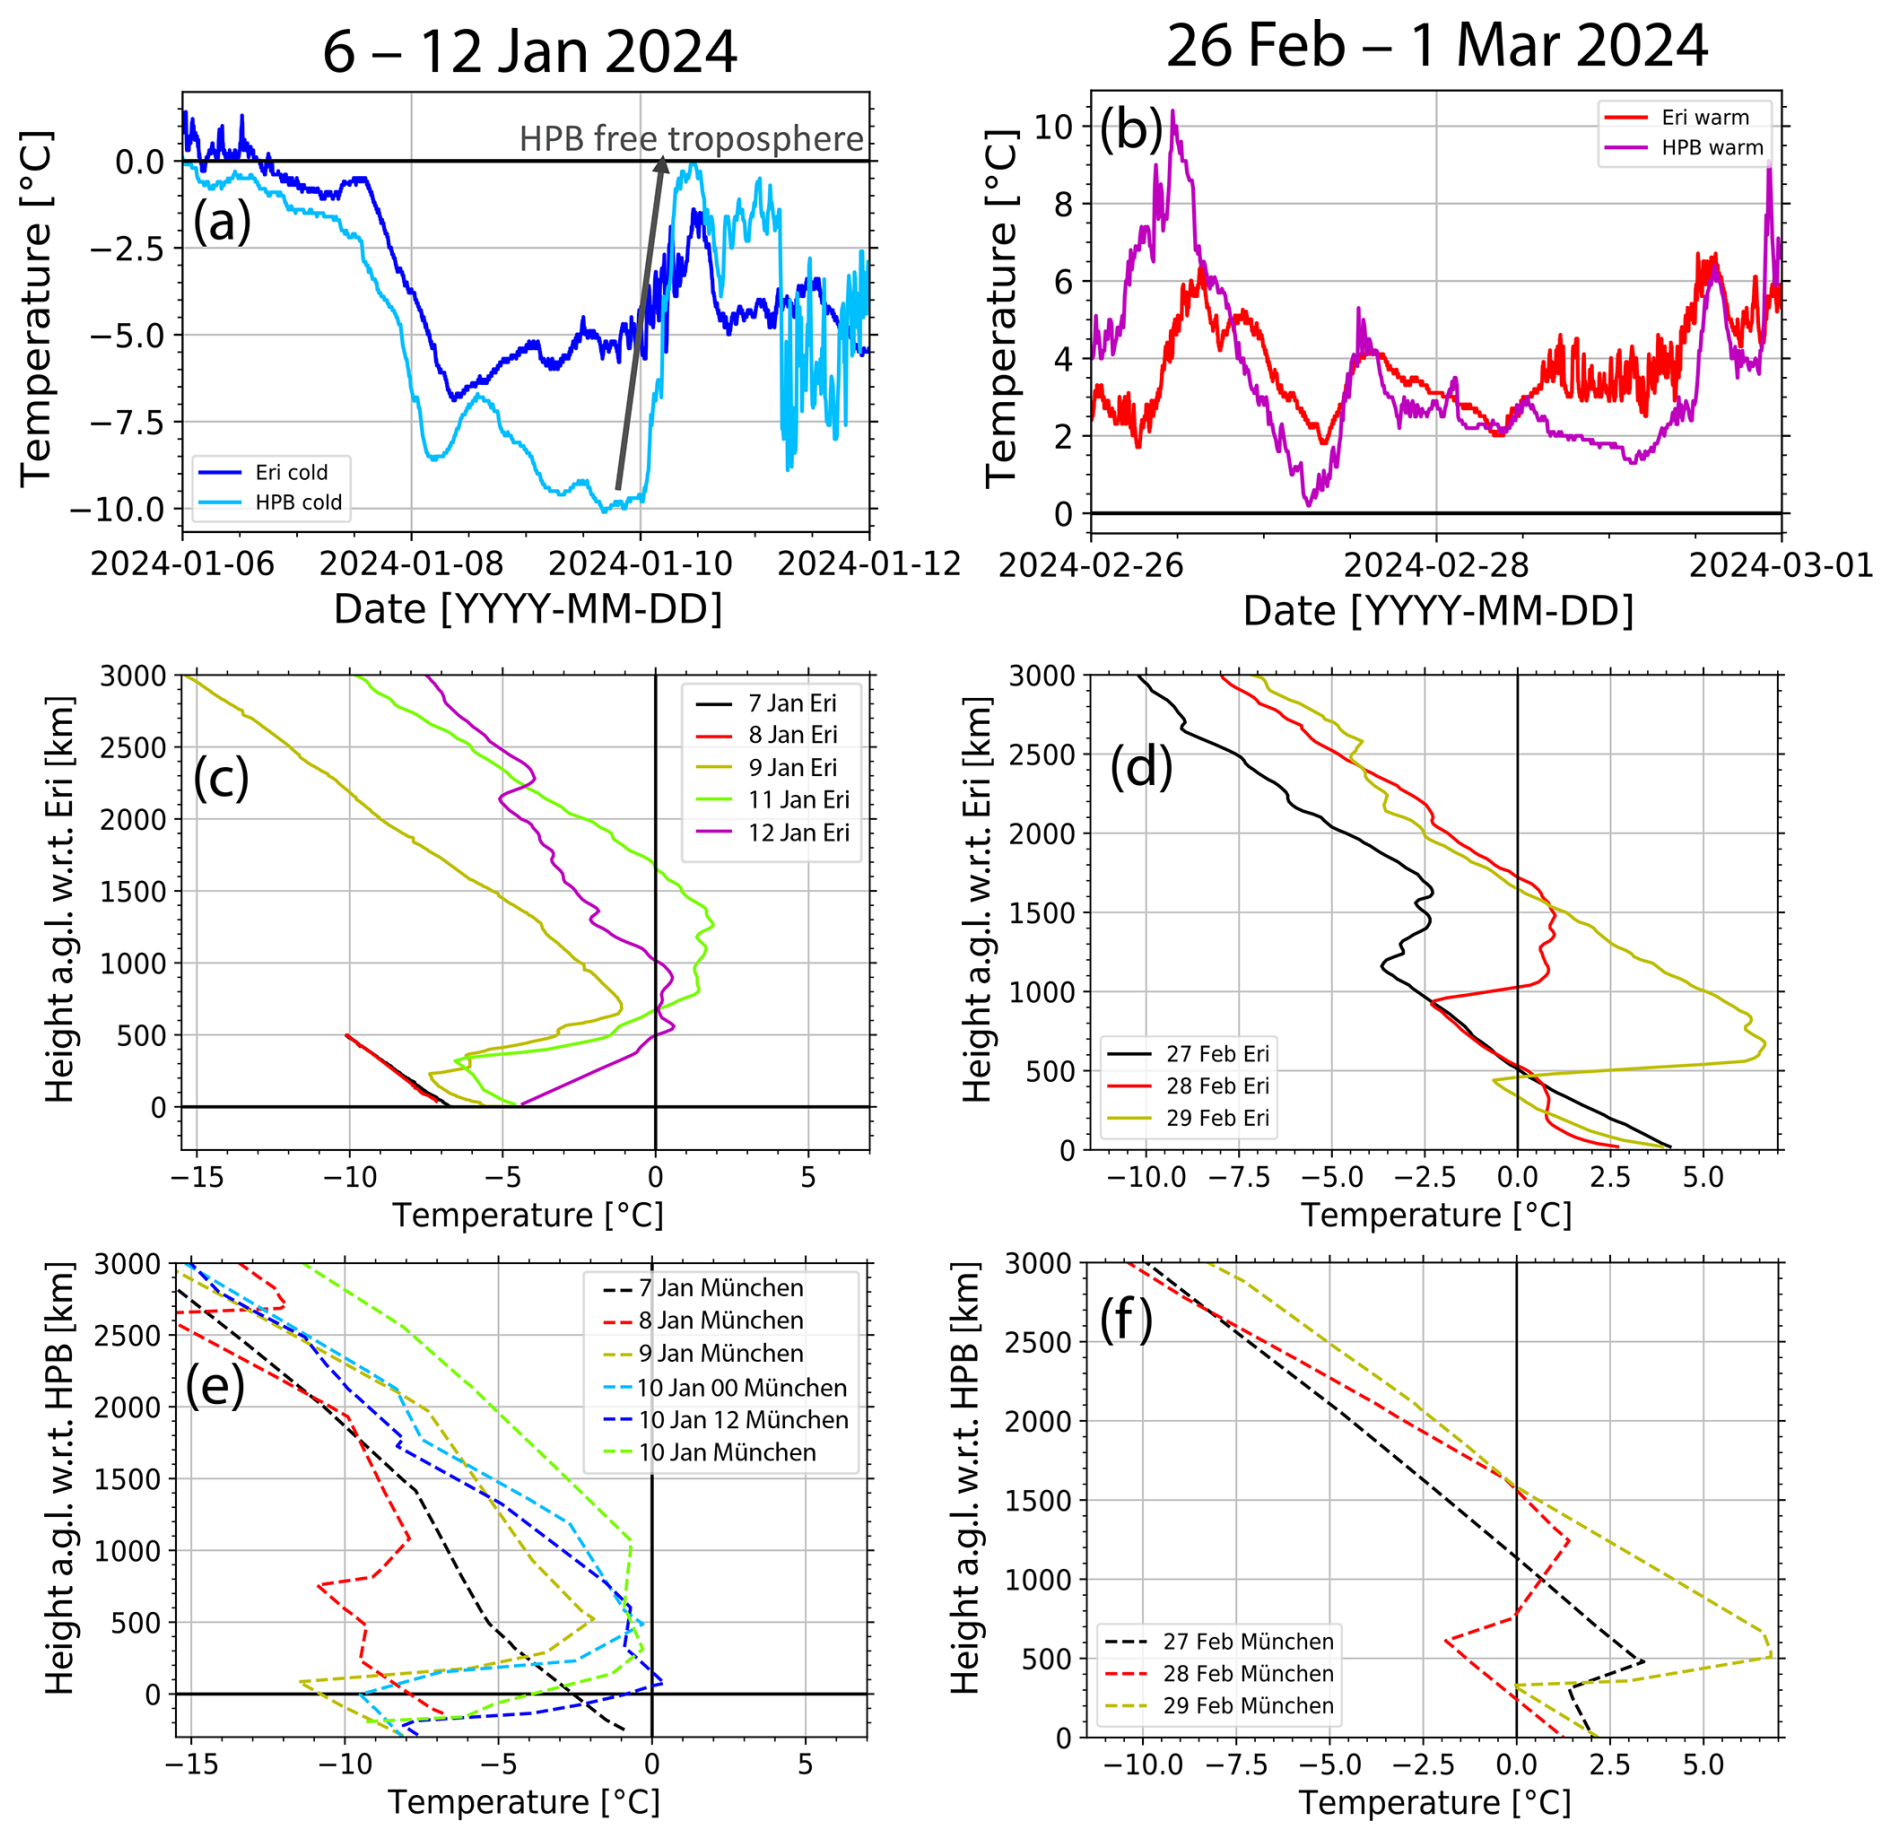
Figure 2Temperature evolution during both measurement periods. (a) Surface temperature during cold period (6–12 January 2024). The transition time when the inversion has lowered and HPB is no longer in the boundary layer but in the free troposphere is indicated with a gray arrow. (b) Surface temperature evolution for the warm period (26 February to 1 March 2024). (c) Temperature profiles for the cold period in Eri. (d) Temperature profiles for the warm period in Eri. (e, f) Temperature profiles for HPB for the cold and warm periods, respectively, represented by München-Oberschleißheim data (CDC, 2024). Eri surface data are observed by LACROS instrumentation at the field site in Eri. HPB profile data are from University of Wyoming (2024). Eri profile data are from radiosonde launches at Eri. Note that a.g.l. relates to the height of 921 m for Eri and 977 m for HPB.
Figure 2c displays vertical profiles of temperature for Eri for the same time period as Fig. 2a, showing the presence of a temperature inversion typically occurring between 100 and 1000 m a.g.l. Stratus clouds are located between 200 and 1500 m a.g.l. On 9 and 11 January, the inversion strength reaches nearly 10 K, resulting in temperatures around 0 °C in parts of the lower atmosphere at the inversion top.
In Fig. 2e the most remarkable change in temperatures happened in HPB (represented by radiosonde launches in München-Oberschleißheim) between 10 January 2024, 00:00 and 12:00 UTC. The inversion decreases in altitude by a few hundred meters which results in a temperature increase of around 10 K in HPB, as already mentioned above (Fig. 2a). Due to that, HPB is no longer situated in the PBL but above the local inversion (decoupled from the PBL) hereafter denoted as in the free troposphere.
During the warm measurement period (Fig. 2b), surface temperatures at both Eri and HPB remain consistently above freezing. Temperatures generally stay below 6 °C, except for HPB, where they occasionally increase to 10 °C, especially on 26 February 2024.
The vertical temperature profiles for the warm period are shown in Fig. 2d and f. Temperature inversions are present during this period as well. The surface temperatures range from 2 to 4 °C, decreasing to around 0 to −3 °C at the lower boundary of the inversion. The upper boundary of the inversion typically remains above freezing temperatures. The occurrence of the inversion leads to an inhibition of the exchange between the PBL and the free troposphere. Below the inversion the air should be well-mixed and therefore, we assume that the INP measurements at the ground are representative for the entire PBL.
Figure 3 provides an overview of radar reflectivity at Eri during the two measurement periods. Figure 3a shows the cold period. Frontal systems produce vertically thick clouds on 6 and 7 January 2024, as well as in parts on 8 and 9 January 2024. Nevertheless, the supercooled low-level liquid Bise cloud layer remains persistent, even during these times (as it can be seen from the increased radar reflectivity between 0 and 1 km altitude). Especially from the radar depolarization ratio (not shown) it can be seen that it is a liquid cloud. In addition, the Holimo measurements (Holographic Imager of Microscopic Objects in the frame of the CLOUDLAB campaign, see Henneberger et al., 2023) regularly confirmed this statement during the campaign. From noon on 8 January 2024 until midnight on 12 January 2024, the Bise cloud persists continuously, with only brief interruptions during the night from 9 to 10 January 2024. During this time, the cloud top slowly descends from approximately 1400 m to between 100 and 200 m a.g.l. INP filters were sampled throughout this period, although there were technical issues at both measurement sites, as indicated in the annotations above Fig. 3a and b (white gaps between the green lines).
Figure 3b shows the evolution of the profile of the radar reflectivity factor during the warm period. The Bise cloud formed on 27 February 2024 and persisted until the evening of 29 February 2024. During this warm Bise event, temperatures were mostly above freezing, both at the surface and within the cloud. Filter sampling was successfully conducted throughout the entire warm Bise period.
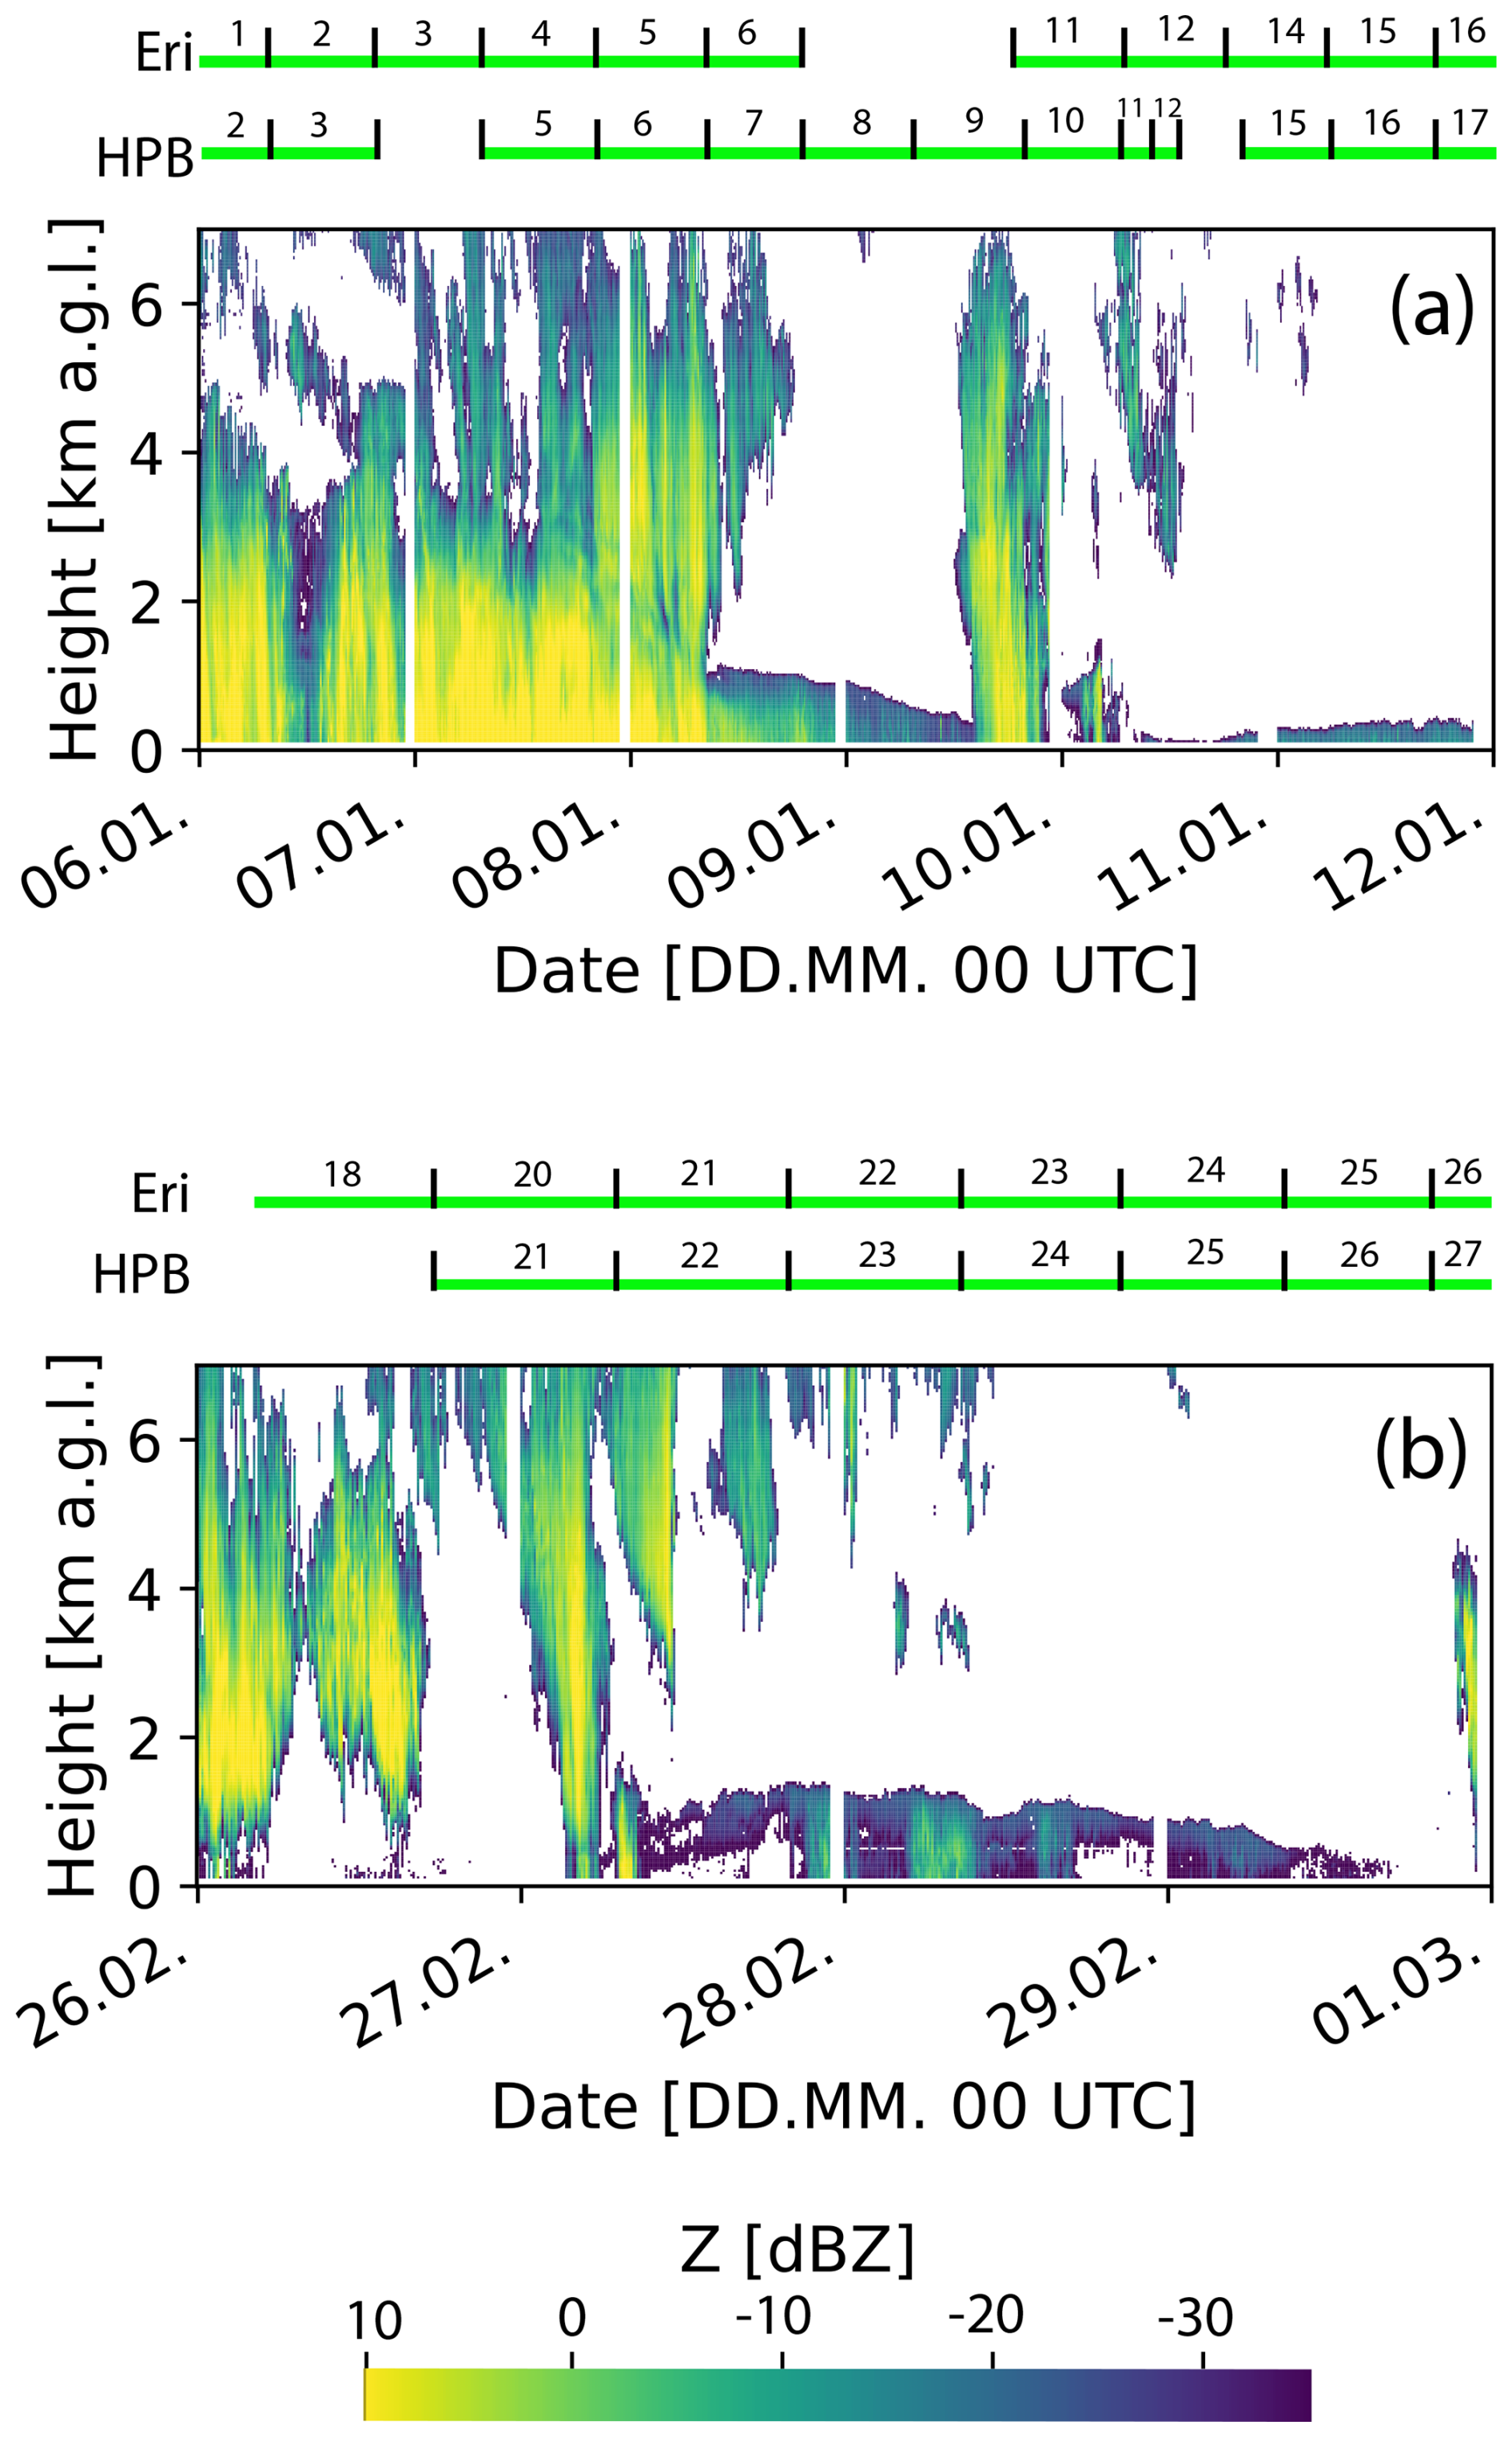
Figure 3Radar reflectivity overview for the two periods (RPG94 cloud radar) for 6–11 January 2024 (cold period in a) and for 26–29 February 2024 (warm period in b) at Eri. In (a) and (b) the green lines on top indicate the measurement time period for each of the filters and the number of the filter sample. Note, that the individual numbers for Eri and HPB are not necessarily synchronous.
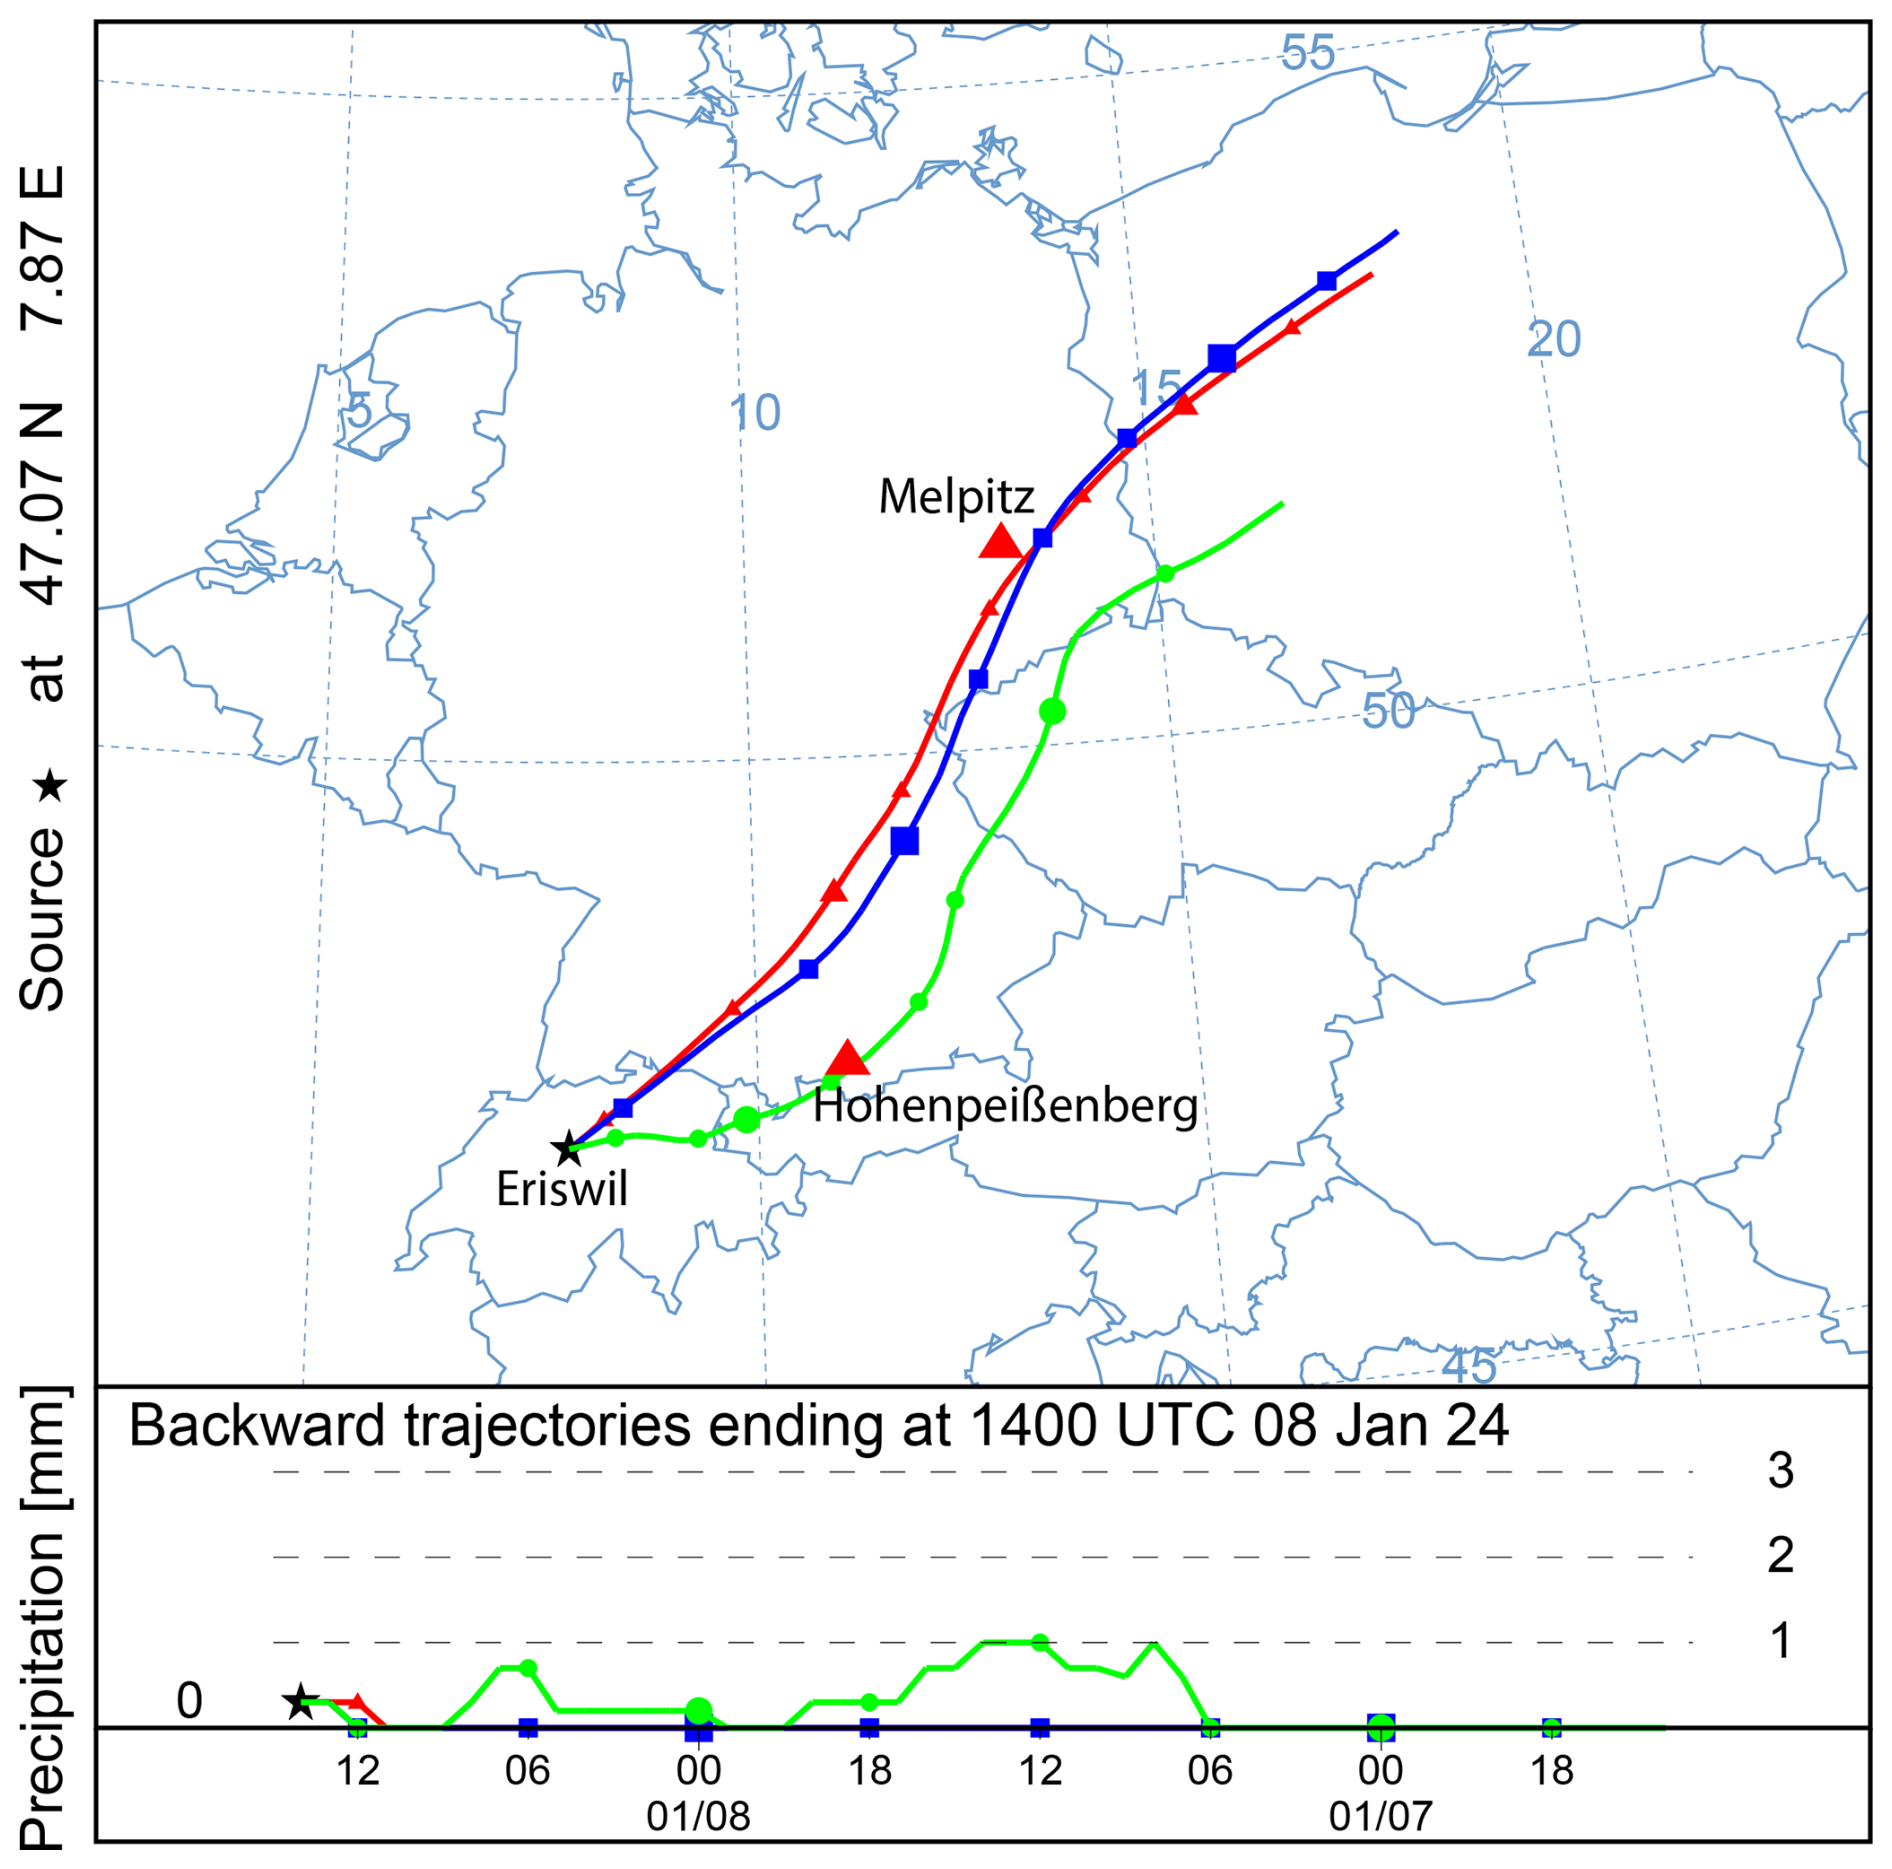
Figure 4HYSPLIT backward trajectories ending at Eri on 8 January 2024, at 14:00 UTC at 100, 250, 1000 m a.g.l., shown in red, blue, green, respectively. In the lower part, the precipitation along the trajectories is shown. Image provided by National Oceanic and Atmospheric Administration (NOAA).
Figure 4, and Figs. S5, S6, and S7 in the Supplement show the backward trajectories ending at Eri at 14:00 UTC on 8, 9, 10, and 11 January 2024, respectively, for the cold Bise situation. Figures S8, S9, and S10 show the backward trajectories ending at Eriswil at 14:00 UTC on 27, 28 and 29 February 2024, respectively, for the warm Bise situation. In all cases it can be seen, that the backward trajectories move very close to HPB (especially during the cold Bise period) and especially on 8 January 2024 the trajectories are aligned with air masses blowing first over MEL, approximately 18 h later over HPB and another 12 h later over Eri. We also checked arbitrary trajectories in a few km lat/lon distance of HPB and Eri and found similar results for the trajectories, making it a robust result. Of course, individual trajectories themselves did not necessarily move directly from MEL via HPB to Eri, however, it can be assumed that the air mass is the same over all places coming roughly from the north-east. Along the trajectory there was only little precipitation.
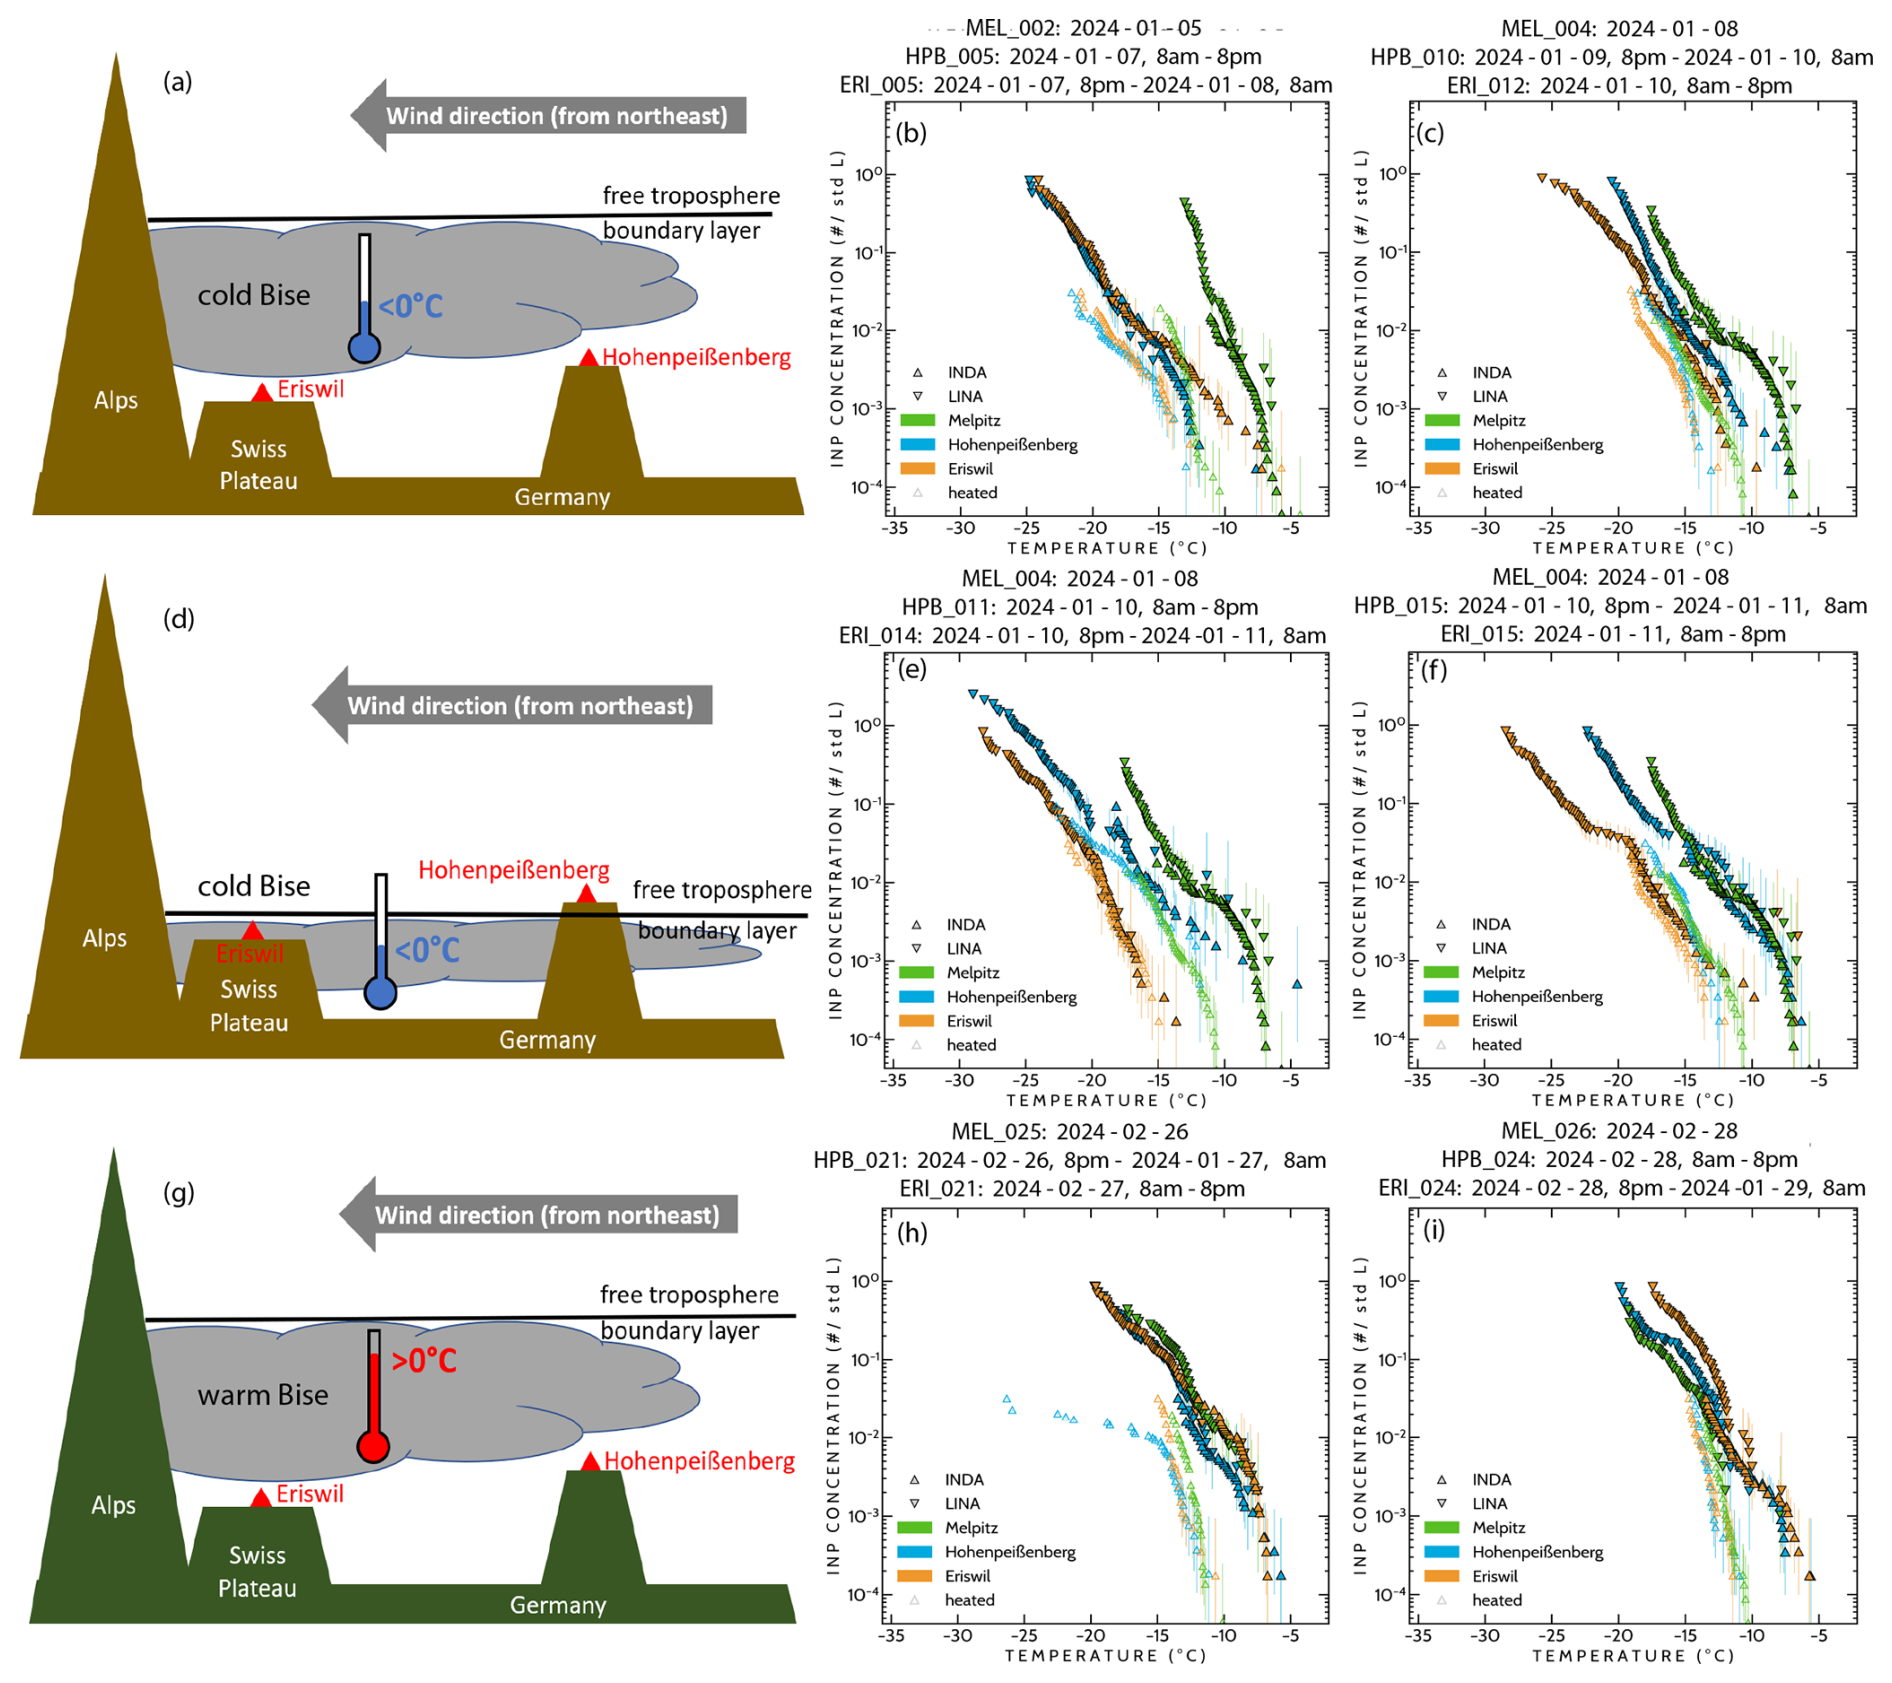
Figure 5INP spectra for three different observed situations with a sketch of the situation in the leftmost column. Panels in the first row (a, b, c) refer to a situation when both Eri and HPB are within clouds during a cold Bise (cloud top temperatures below 0 °C). The second row (d, e, f) depicts the situation of a cold Bise when Eri was within clouds but HPB was directly above clouds in the free troposphere. The third row (g, h, i) shows a warm Bise situation. INP spectra are always shown for Eri, HPB and MEL, with additional data for heated samples for Eri and HPB. Error bars represent the 95 % confidence interval of the statistical uncertainty calculated after Agresti and Coull (1998). For each scenario two case studies were chosen in order to show that the variability of the INP samples within the same scenario is relatively constant while the differences are rather significant for different scenarios. Please note, that the plateauing of the INP spectrum of the heated HPB sample is most likely an artifact of the dilution.
4.2 INP measurements during cold and warm Bise in Eri and HPB
Results from INP measurements are shown in Fig. 5, covering three different scenarios, each in a separate row. In each column, the leftmost panels Fig. 5a, d and g show a sketch of the respective situation, while all other panels show INP concentration spectra. INP spectra from Eri are always shown together with data from HPB taken 12 h earlier. During a Bise situation, the air mass moves towards Eri from northeasterly directions. We therefore assume that a comparable air mass also moved over MEL before. Therefore, INP measurements from MEL that correspond best in time are also added to the respective panels of Fig. 5. For MEL, there was no snow coverage on the ground at the time of the here shown measurements. Concerning Eri, as mentioned before artificial cloud seeding was done with a drone in supercooled Bise cloud layers. A flare was ignited at the drone, releasing silver-iodide that can act as an INP at temperatures below −5 °C (Marcolli et al., 2016). The flare was ignited inside the clouds upwind of the measurement site, so the plume of silver-iodide, the potential source of INPs, could have dispersed and reached the measurement site in theory. However, we want to note that we checked the entire dataset for signals from artificial seeding in the INP measurements. No evidence of cloud seeding particles on the ground was observed throughout the whole campaign.
Figure 5b and c each show the INP measurements at Eri and HPB for the situation when both sites are within the stratus cloud. The cloud top temperatures are below 0 °C and overall the temperatures in these clouds range between 0 and −10 °C. INP concentrations are very similar at Eri and HPB. Heat treatment causes a decrease in INP concentrations, indicating a fraction of heat-labile, probably biological INPs, however, not as pronounced as for the warm Bise situation in Fig. 5h and i. Two days earlier in MEL, the INP concentrations are much higher compared to the other two stations.
In the middle row, Fig. 5e and f show INP measurements for a time when Eri is located in the upper part of the Bise cloud within the PBL, equivalent to the measurements shown in Fig. 5b and c. HPB, however, is slightly above the height level of the temperature inversion and therefore within the free troposphere after the inversion has lowered in altitude (see Fig. 2). The lowering of the inversion layer heights at HPB occurs at 10 January 2024 around 03:00 UTC. Therefore, HPB INP data in Fig. 5e stems from air collected from both the PBL and the free troposphere. In the time period from 10 January, 08:00 p.m. to 11 January, 08:00 a.m. shown in Fig. 5f the measurement at HPB was performed entirely within the free troposphere. Already in Fig. 5e, the INP spectrum from Eri is clearly below that from HPB. That, however, results from a lowering of the INP concentrations at Eri, visible when comparing Fig. 5c to Fig. 5e. For Fig. 5f, when HPB was entirely in the free troposphere, a clear increase in INP concentrations at HPB is seen. For Fig. 5e and f the fraction of heat-labile INPs is negligible at Eri and therewith even lower than before. But when HPB is in the free troposphere, there is a high heat-labile INP fraction. For MEL, which is always located in the PBL, INP spectra are always at the high end of observed INP concentrations. However, in Fig. 5f INP concentrations from HPB start to resemble those from MEL. Interestingly, these INP concentrations for HPB show strong similarity to the warm Bise situation in Fig. 5h and i.
The described results may indicate the presence of similar INP concentrations over a wide area, possibly emitted from snow-free regions upwind of HPB and even further upwind from MEL. Potentially these emissions were present sufficiently long to reach the free troposphere. In this context, it is interesting to note that MEL and a broad region north of MEL, extending over most of northern Germany and Poland, was not covered by clouds (see example from 8 January 2024 in the Supplement). Once a Bise cloud forms, INPs are removed quickly from the cloud, resulting in the low INP concentrations presented above. Of course, INP sources between HPB and Eri must also be taken into account. However, the region in between both sites was snow-covered and temperatures were below freezing which keeps the biological activity at a minimum. Therefore, additional INP sources are considered to be of minor importance.
In February, a warm Bise situation is observed. INP spectra are shown in Fig. 5h and i. Both Eri and HPB are within the stratus cloud and the cloud-top temperatures are not supercooled. INP concentrations at both locations are generally higher than during the cold Bise, and very similar to the respective values measured at MEL. The higher temperatures during the warm Bise do not allow for INP activation in clouds. Still, this similarity between the three locations is remarkable, as they are several hundred kilometers apart. Concerning heat-labile biological INPs that are active above −10 °C, we observe elevated INP concentrations in all unheated samples during the warm Bise situation, regardless of sampling location. This manifests itself as bump-like structures in the INP spectra. Similar bumps were observed for all Melpitz INP spectra shown in Fig. 5, and for the INP spectra from HBP while it was in the free troposphere during the cold Bise (Fig. 5d to f), but not for the cold Bise case, when Eri and HPB were within the PBL (Fig. 5a to c). In comparison to that INP spectra from Eri show that feature only in the warm Bise case (Fig. 5g to i). These elevated concentrations vanish for all heated samples and were hence comprised of proteinaceous, biological INPs. Calculating the heat-labile fraction in the temperature range relevant for biological INPs is hindered by the fact that all INP spectra for heated samples only start below −10 °C.
The loss of INPs upon heating above −10 °C was most pronounced. But when looking at Fig. 5, it can be seen that INP concentrations were also lowered at temperatures below −10 °C at all three stations and for all cases. This shows the presence of proteinaceous, biological INPs across the whole temperature range for which data for heated samples was obtained. In the temperature range below −10 °C, the relation between the fraction of heat-labile INPs and sampling location and time followed a different trend than above −10 °C. The smallest loss occurred for Eri during the cold Bise case while HPB was in free troposphere, with a decrease in INP concentrations by roughly 30 %–40 %. Higher losses were observed for all other cases at all three stations.
In summary, the presence of potentially biological INPs is noteworthy so early in the year, particularly for INPs active above −10 °C as they already were present in early January at MEL and at HPB when it was in the free troposphere.
4.3 Observations of ice crystals during Bise situation
Figure 6 presents a zoomed view of the RPG94 cloud radar reflectivity measurements covering the time period from 7 to 12 January 2024 from the surface to 1.5 km above ground level. Temperature profiles from two radiosonde launches are also provided. In the lowest 300 m, temperatures range from −5 to −10 °C, with warmer air observed above the inversion on 10 and 12 January 2024. The Bise cloud was affected by natural cloud seeding (meaning that ice crystals generated by a higher cloud fell into the Bise cloud system) on 7 January which continues until approximately 8 January, 09:00 UTC (see Ohneiser et al., 2025a). Additionally, sedimenting ice crystals from upper-level cloud layers are visible in the evening of 9 January 2024.
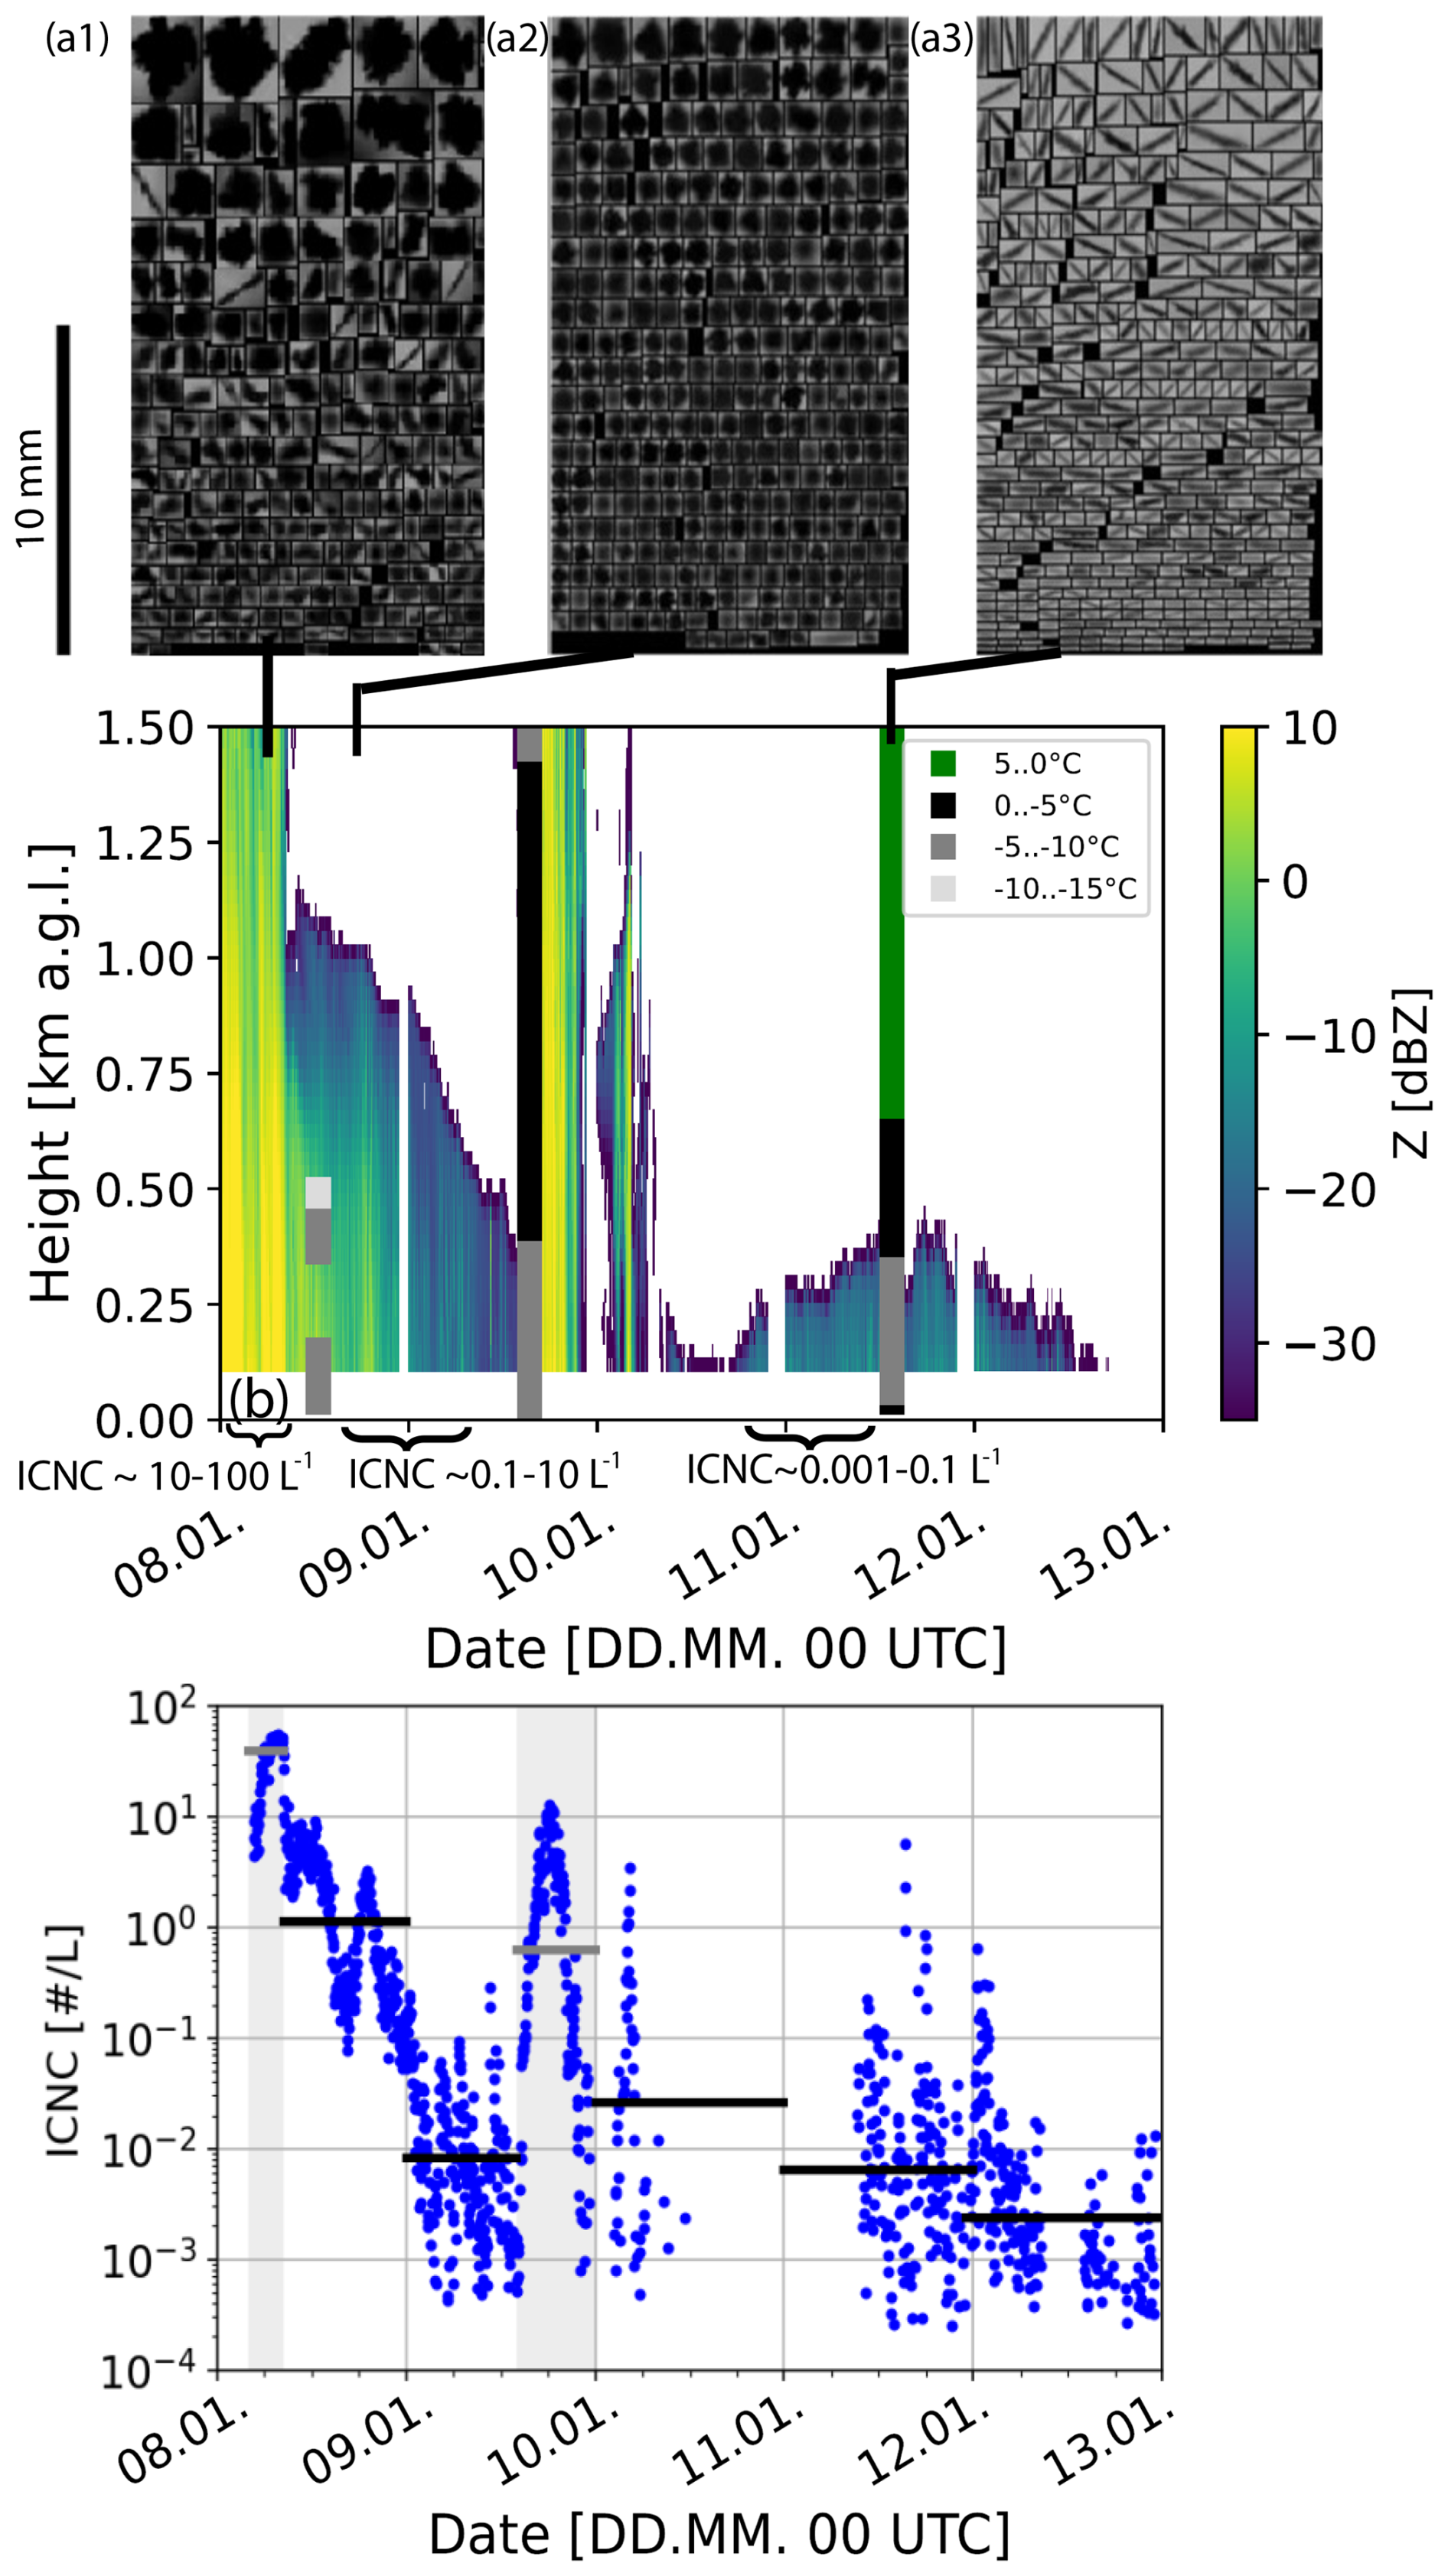
Figure 6VISSS ice crystals for (a1) 8 January 2024, 03:23–03:59 UTC (a2) 8 January 2024, 13:42–14:42 UTC, and (a3) 11 January 2024, 13:00–14:57 UTC. (b) RPG94 cloud radar reflectivity overview between 8 and 13 January 2024. Radiosonde data is shown as colored vertical bars in addition. (c) ICNC between 8 and 13 January 2024 at Eri measured with the 2DVD. The gray and black horizontal lines are average ICNC during time periods with seeding and no seeding (typically 24 h averages), respectively.
The VISSS particle images (Fig. 6a1–a3) illustrate three periods of observations. The first period (Fig. 6a1, 8 January 2024, 03:23–03:59 UTC) shows ice crystals influenced by strong seeding from higher-altitude clouds, resulting in a diverse mixture of ice crystal shapes. Rimed particles, needles and aggregates are visible. The ice crystal number concentration (ICNC) at the surface observed by the 2DVD is around 10–100 L−1. During the second period (Fig. 6a2, 8 January 2024, 13:42–14:42 UTC), heavily rimed dendrites are observed. These particles initially form at cloud-top temperatures slightly colder than −10 °C and become heavily rimed as they fell through the approximately 1 km thick cloud layer, so they appear almost spherical. The ICNC was around 0.1 L−1 during this period. In the third period (Fig. 6a3, 11 January 2024, 13:00–14:57 UTC), ice crystals form at cloud-top temperatures around −5 °C, resulting in needle-shaped particles observed at ground level. The ICNC is around 0.01 L−1 during this period.
The ICNC at Eri between 8 and 12 January 2024 measured with 2DVD is shown in Fig. 6c. In the first half of 8 January 2024, seeder-feeder events caused the highest values in the entire period of around 1 to 100 L−1. Without seeding, the ICNC decreased from 1 to between 0.001 and 0.1 L−1. In the evening of 9 January 2024 another seeding event caused increased ICNC of up to 10 L−1. On 11 and 12 January 2024 the values were typically between 0.0001 and 1 L−1. In general, a clear trend of decreasing ICNC during times without seeding is visible, from around 1 to 0.003. At the same time the Bise cloud thickness decreased from 1000 to 300–400 m and the temperatures in the cloud increased from around −10 to around −5 °C.
The evolution of the observed ice crystals presented in Fig. 6 illustrates that light precipitation was recorded by VISSS and the 2DVD throughout the observation period of the cold Bise situation, indicating continuous availability of at least a few INPs. However, from the remote-sensing and in situ measurements at Eri it can be seen, that concentrations of ice crystals on ground were higher than the available INP concentrations at Eri. At this site, measurable INP concentrations are only recorded at temperatures below the cloud minimum temperatures of around −7 °C (compare with Fig. 2 and the cold Bise INP measurements in Fig. 5b, c) that prevail during the period of observation. Specifically, mean ICNC were between 10−3 and 10−2 L−1 from 11 through 12 January 2024, when cloud-minimum temperatures were about −7 °C. It is, however, remarkable that the INP observations of around 10−3 L−1 at HPB, when this site was above the PBL (Fig. 5e, f), were on a similar order as the ICNC concentrations observed during the same period at Eri. This supports the hypothesis that INPs are entrained from the free troposphere via turbulence and afterwards immediately removed as they interact with the Bise cloud layer, leading to reduced availability of INPs downwind. However, it must be noted that an ICNC concentration which is higher than the observed INP concentration can in principle also be a result of secondary ice formation processes (Korolev and Leisner, 2020). Nevertheless, secondary ice formation processes generally lead to orders of magnitudes of increase in ICNC, which was, besides occasional peaks in the ICNC, not observed in the average ICNC values during the investigated time periods.
In this study, it was shown that the INP concentration is generally very low in cold Bise-clouds in the PBL in the case of a cold Bise situation with stratus cloud cover. Under these conditions, both stations of Eri and HPB showed similar INP spectra and generally a comparably low biological INP fraction when compared to the warm Bise situation. Corresponding INP spectra from MEL showed much higher INP concentrations. For the case of a warm Bise, both stations showed similar INP characteristics, as well. However, the INP spectra were shifted towards higher temperatures and showed a larger fraction of heat-labile, potentially biological INPs. With that, they resembled corresponding INP spectra from MEL. This general observation supports our hypothesis that INPs were removed from the PBL only during the cold Bise period. Interestingly, during the end of the cold period, HPB was located in the free troposphere while Eri was still located in the boundary layer. While Eri showed a decrease of INP concentrations, the INP spectrum at HPB showed higher INP concentrations and overall a strong similarity with the corresponding INP spectrum from MEL and also with the situation during the warm Bise period. Indeed, the INP concentration at Eri at the observed cloud-top temperatures would be too low in order to explain the sporadically but almost continuously observed ice crystals at the ground in Eri throughout the period. In the free troposphere, however, as it was measured in HPB, there are still INPs available. These INP could have been mixed into the supercooled stratus cloud in the boundary layer via turbulence and form ice sporadically, analogously to the so-called dusty cirrus mechanism (Seifert et al., 2023) which support our hypothesis. The dusty cirrus mechanism describes mixing of a separated dusty air layer with a clear moist air layer. At the interface, mixing of these layers supports cloud formation. Analogously, during Bise conditions, the PBL is the moist layer with limited INP availability, separated from the free tropospheric air that can act as a source of INPs, supported by our measurements.
During the cold period when both stations were located in the boundary layer, we did not see significant differences in the INP spectra between HPB and Eri. This does not support the second part of our hypothesis that INPs are lost on the way from HPB towards Eri. More likely, the INPs are activated and removed quite fast once they are within the supercooled stratus cloud. However, within days, at Eri the INP spectrum during the cold Bise was still shifted towards lower temperatures. This could be a hint for ongoing INP removal. However, also a change in air mass, as indicated by the trajectories (see Figs. S4, S5, S6, and S7) may be responsible for this change in INP concentrations. But in any case, the lack of INPs at Eri could explain the observation that not much ice is contained in the supercooled Bise clouds. Interestingly, the measurements in MEL are in contrast to the measurements in HPB and Eri because for MEL, where PBL-coupled stratus clouds were absent in the investigated time period on 8 January 2024 (see Supplement), there was no major difference in the observed INP concentrations between the examined periods of the cold and warm Bise.
In retrospective, not all atmospheric scenarios, which would have been required to thoroughly answer the question if the Bise clouds are responsible for the INP removal, could be observed during the campaign periods in winter 2023/2024. The observations did only allow for measurements in a cold Bise (cloudy, PBL and free troposphere) and warm Bise (cloudy). However, it would be interesting to have measurements in the case of a cold cloud-free Bise that goes along with clear sky in the PBL. It would allow to draw conclusions on the duration of the INP removal once the interaction with a supercooled cloud starts. In our study, we used INP measurements from the site of MEL to obtain a guess about how INP conditions might look like in absence of PBL-coupled supercooled stratus clouds. Nevertheless, we see high potential in conducting a future longer-lasting field experiment to evaluate the different INP and cloud scenarios in more detail, in order to answer whether short-scale INP removal in a limited reservoir can lead to an observable lack of ice formation in supercooled liquid clouds. This would be of high relevance for increasing the understanding of the longevity of wintertime stratiform boundary layer cloud situations, such as the Bise.
Temperature profiles for HPB for the cold and warm periods are represented by München-Oberschleißheim data (CDC, 2024, https://www.dwd.de/DE/klimaumwelt/cdc/cdc_node.html). HPB profile data are from University of Wyoming (2024, https://weather.uwyo.edu/upperair/sounding.shtml). Eri data are observed by LACROS instrumentation at the field site in Eri. The data can be found in Ohneiser et al. (2025b, https://doi.org/10.5281/zenodo.15721531). The dataset includes windsonde launches in Eri, surface temperature data from the HATPRO, 2DVD data, and radar reflectivity data from the RPG94. Details on the filter sample data and the INP data for HPB, Eri and MEL can be found in Ohneiser et al. (2025b) as well.
The supplement related to this article is available online at https://doi.org/10.5194/acp-26-3223-2026-supplement.
The measurements with LACROS in the frame PolarCAP were collected by KO, PS, AM, TG, VE, WS, and HG. The INP sampling at HPB was done by MH, KB and WT. The measurements in the frame of the CLOUDLAB project were done by AM and JH. The filter samples were analyzed by AH, supported by MH and HW. The 2DVD data was analyzed by TG and KO. The manuscript was written by KO, MH, HW, and PS with support by all co-authors.
The contact author has declared that none of the authors has any competing interests.
Publisher's note: Copernicus Publications remains neutral with regard to jurisdictional claims made in the text, published maps, institutional affiliations, or any other geographical representation in this paper. The authors bear the ultimate responsibility for providing appropriate place names. Views expressed in the text are those of the authors and do not necessarily reflect the views of the publisher.
We acknowledge Matthias Bauer from Metek company for the great support with the Mira35 MBR5 and MBR7 cloud radars. The authors gratefully acknowledge the NOAA Air Resources Laboratory (ARL) for the provision of the HYSPLIT transport and dispersion model and/or READY website (https://www.ready.noaa.gov, last access: 18 February 2026) used in this publication.
Funding for this study was provided by the Deutsche Forschungsgemeinschaft (DFG, German Research Foundation) within the priority program SPP 2115 PROM via project numbers 408027490 (PolarCAP) and 408008112 (PICNICC, CORSIPP), by the European Union's Horizon Europe projects CleanCloud (grant no. 101137639), the European Union's Horizon 2020 research and innovation program (CLOUDLAB, grant agreement no. 101021272), the European Union's EU‐HORIZON-WIDERA-2021 twinning program (BRACE‐MY, grant no. 101079385) and the DFG project EMPOS (project number 516261703). The LACROS infrastructure received financial support via ACTRIS-D, which is funded by the Federal Ministry of Education and Research of Germany under the funding code 01LK2001A.
This paper was edited by Ari Laaksonen and reviewed by two anonymous referees.
Agresti, A. and Coull, B. A.: Approximate is Better than “Exact” for Interval Estimation of Binomial Proportions, The American Statistician, 52, 119–126, https://doi.org/10.1080/00031305.1998.10480550, 1998. a
Ávila, E. E., Castellano, N. E., Saunders, C. P. R., Bürgesser, R. E., and Aguirre Varela, G. G.: Initial stages of the riming process on ice crystals, Geophysical Research Letters, 36, https://doi.org/10.1029/2009GL037723, 2009. a
Bailey, M. P. and Hallett, J.: A Comprehensive Habit Diagram for Atmospheric Ice Crystals: Confirmation from the Laboratory, AIRS II, and Other Field Studies, Journal of the Atmospheric Sciences, 66, 2888–2899, https://doi.org/10.1175/2009JAS2883.1, 2009. a
Bergeron, T.: On the physics of clouds and precipitation, Proc. Fifth Assembly of the Int. Union of Geodesy and Geophysics, Lisbon, Portugal, IUGG, 156–178, 1935. a
Bessardon, G. E. Q., Fosu-Amankwah, K., Petersson, A., and Brooks, B. J.: Evaluation of Windsond S1H2 performance in Kumasi during the 2016 DACCIWA field campaign, Atmospheric Measurement Techniques, 12, 1311–1324, https://doi.org/10.5194/amt-12-1311-2019, 2019. a
CDC: Climate Data Center (CDC) from DWD (Deutscher Wetterdienst), CDC [data set], https://www.dwd.de/DE/klimaumwelt/cdc/cdc_node.html, last access: 23 October 2024. a, b, c, d
Christner, B. C., Cai, R., Morris, C. E., McCarter, K. S., Foreman, C. M., Skidmore, M. L., Montross, S. N., and Sands, D. C.: Geographic, seasonal, and precipitation chemistry influence on the abundance and activity of biological ice nucleators in rain and snow, Proceedings of the National Academy of Sciences, 105, 18854–18859, https://doi.org/10.1073/pnas.0809816105, 2008. a
David, R. O., Cascajo-Castresana, M., Brennan, K. P., Rösch, M., Els, N., Werz, J., Weichlinger, V., Boynton, L. S., Bogler, S., Borduas-Dedekind, N., Marcolli, C., and Kanji, Z. A.: Development of the DRoplet Ice Nuclei Counter Zurich (DRINCZ): validation and application to field-collected snow samples, Atmospheric Measurement Techniques, 12, 6865–6888, https://doi.org/10.5194/amt-12-6865-2019, 2019. a
Findeisen, W.: Kolloid-meteorologische Vorgänge bei Niederschlagsbildung, Meteor. Z., 55, 121–133, 1938. a
Gong, X., Radenz, M., Wex, H., Seifert, P., Ataei, F., Henning, S., Baars, H., Barja, B., Ansmann, A., and Stratmann, F.: Significant continental source of ice-nucleating particles at the tip of Chile's southernmost Patagonia region, Atmospheric Chemistry and Physics, 22, 10505–10525, https://doi.org/10.5194/acp-22-10505-2022, 2022. a
Granwehr, T.: In Eriswil beobachten Forschende den Hochnebel, https://ethz.ch/content/dam/ethz/special-interest/usys/iac/iac-dam/documents/group/wolke/lohmann/Cloudlab-ETH-Medienberichte-20220228.pdf, last access: 23 October 2022. a
Griesche, H. J., Ohneiser, K., Seifert, P., Radenz, M., Engelmann, R., and Ansmann, A.: Contrasting ice formation in Arctic clouds: surface-coupled vs. surface-decoupled clouds, Atmospheric Chemistry and Physics, 21, 10357–10374, https://doi.org/10.5194/acp-21-10357-2021, 2021. a, b
Hallet, J. and Mossop, S. C.: Production of secondary ice particles during the riming process, Nature, 249, 26–28, 1974. a
Hartmann, M., Blunier, T., Brügger, S., Schmale, J., Schwikowski, M., Vogel, A., Wex, H., and Stratmann, F.: Variation of Ice Nucleating Particles in the European Arctic Over the Last Centuries, Geophysical Research Letters, 46, 4007–4016, https://doi.org/10.1029/2019GL082311, 2019. a, b
Hartmann, S., Niedermeier, D., Voigtländer, J., Clauss, T., Shaw, R. A., Wex, H., Kiselev, A., and Stratmann, F.: Homogeneous and heterogeneous ice nucleation at LACIS: operating principle and theoretical studies, Atmospheric Chemistry and Physics, 11, 1753–1767, https://doi.org/10.5194/acp-11-1753-2011, 2011. a
Henneberger, J., Ramelli, F., Spirig, R., Omanovic, N., Miller, A. J., Fuchs, C., Zhang, H., Bühl, J., Hervo, M., Kanji, Z. A., Ohneiser, K., Radenz, M., Rösch, M., Seifert, P., and Lohmann, U.: Seeding of Supercooled Low Stratus Clouds with a UAV to Study Microphysical Ice Processes: An Introduction to the CLOUDLAB Project, Bulletin of the American Meteorological Society, 104, E1962–E1979, https://doi.org/10.1175/BAMS-D-22-0178.1, 2023. a, b, c
Holden, M. A., Campbell, J. M., Meldrum, F. C., Murray, B. J., and Christenson, H. K.: Active sites for ice nucleation differ depending on nucleation mode, Proceedings of the National Academy of Sciences, 118, e2022859118, https://doi.org/10.1073/pnas.2022859118, 2021. a
Hoose, C. and Möhler, O.: Heterogeneous ice nucleation on atmospheric aerosols: a review of results from laboratory experiments, Atmospheric Chemistry and Physics, 12, 9817–9854, https://doi.org/10.5194/acp-12-9817-2012, 2012. a, b, c
HYSPLIT: HYSPLIT trajectory model, https://www.ready.noaa.gov/HYSPLIT.php, last access: 29 July 2025. a
Kanitz, T., Seifert, P., Ansmann, A., Engelmann, R., Althausen, D., Casiccia, C., and Rohwer, E. G.: Contrasting the impact of aerosols at northern and southern midlatitudes on heterogeneous ice formation, Geophysical Research Letters, 38, https://doi.org/10.1029/2011GL048532, 2011. a
Kanji, Z. A., Ladino, L. A., Wex, H., Boose, Y., Kohn, M., Cziczo, D., and Krämer, M.: Chapter 1: Overview of Ice Nucleating Particles, Meteor. Monogr., 58, 1.1–1.33,, https://doi.org/10.1175/AMSMONOGRAPHS-D-16-0006.1, 2017. a
Korolev, A. and Leisner, T.: Review of experimental studies of secondary ice production, Atmospheric Chemistry and Physics, 20, 11767–11797, https://doi.org/10.5194/acp-20-11767-2020, 2020. a
Lacher, L., Adams, M. P., Barry, K., Bertozzi, B., Bingemer, H., Boffo, C., Bras, Y., Büttner, N., Castarede, D., Cziczo, D. J., DeMott, P. J., Fösig, R., Goodell, M., Höhler, K., Hill, T. C. J., Jentzsch, C., Ladino, L. A., Levin, E. J. T., Mertes, S., Möhler, O., Moore, K. A., Murray, B. J., Nadolny, J., Pfeuffer, T., Picard, D., Ramírez-Romero, C., Ribeiro, M., Richter, S., Schrod, J., Sellegri, K., Stratmann, F., Swanson, B. E., Thomson, E. S., Wex, H., Wolf, M. J., and Freney, E.: The Puy de Dôme ICe Nucleation Intercomparison Campaign (PICNIC): comparison between online and offline methods in ambient air, Atmospheric Chemistry and Physics, 24, 2651–2678, https://doi.org/10.5194/acp-24-2651-2024, 2024. a
Libbrecht, K.: Crystal Growth in the Presence of Surface Melting and Impurities: An Explanation of Snow Crystal Growth Morphologies, arXiv, https://doi.org/10.48550/arXiv.0810.0689, 2008. a
Maahn, M., Moisseev, D., Steinke, I., Maherndl, N., and Shupe, M. D.: Introducing the Video In Situ Snowfall Sensor (VISSS), Atmospheric Measurement Techniques, 17, 899–919, https://doi.org/10.5194/amt-17-899-2024, 2024. a, b
Marcolli, C., Nagare, B., Welti, A., and Lohmann, U.: Ice nucleation efficiency of AgI: review and new insights, Atmospheric Chemistry and Physics, 16, 8915–8937, https://doi.org/10.5194/acp-16-8915-2016, 2016. a
Mülmenstädt, J., Sourdeval, O., Delanoë, J., and Quaas, J.: Frequency of occurrence of rain from liquid-, mixed-, and ice-phase clouds derived from A-Train satellite retrievals, Geophysical Research Letters, 42, 6502–6509, https://doi.org/10.1002/2015GL064604, 2015. a, b
Ohneiser, K., Seifert, P., Schimmel, W., Senf, F., Gaudek, T., Radenz, M., Teisseire, A., Ettrichrätz, V., Vogl, T., Maherndl, N., Pfeifer, N., Henneberger, J., Miller, A. J., Omanovic, N., Fuchs, C., Zhang, H., Ramelli, F., Spirig, R., Kötsche, A., Kalesse-Los, H., Maahn, M., Corden, H., Berne, A., Hajipour, M., Griesche, H., Hofer, J., Engelmann, R., Skupin, A., Ansmann, A., and Baars, H.: Impact of seeder-feeder cloud interaction on precipitation formation: a case study based on extensive remote-sensing, in situ and model data, Atmospheric Chemistry and Physics, 25, 17363–17386, https://doi.org/10.5194/acp-25-17363-2025, 2025a. a, b, c, d, e
Ohneiser, K., Hartmann, M., Wex, H., Seifert, P., Hardt, A., Miller, A., Baudrexl, K., Thomas, W., Ettrichrätz, V., Maahn, M., Gaudek, T., Schimmel, W., Senf, F., Griesche, H., Radenz, M., and Henneberger, J.: Dataset: PolarCAP/CLOUDLAB campaign in Eriswil, Switzerland, data from the INP contrast study in January and February 2024 used in the publication in ACP: Ice-nucleating particle depletion in the wintertime boundary layer in the pre-Alpine region during stratus cloud conditions, Zenodo [data set], https://doi.org/10.5281/zenodo.15721531, 2025b. a, b, c
Petters, M. D. and Wright, T. P.: Revisiting ice nucleation from precipitation samples, Geophysical Research Letters, 42, 8758–8766, https://doi.org/10.1002/2015gl065733, 2015. a
Pummer, B. G., Budke, C., Augustin-Bauditz, S., Niedermeier, D., Felgitsch, L., Kampf, C. J., Huber, R. G., Liedl, K. R., Loerting, T., Moschen, T., Schauperl, M., Tollinger, M., Morris, C. E., Wex, H., Grothe, H., Pöschl, U., Koop, T., and Fröhlich-Nowoisky, J.: Ice nucleation by water-soluble macromolecules, Atmospheric Chemistry and Physics, 15, 4077–4091, https://doi.org/10.5194/acp-15-4077-2015, 2015. a, b
Radenz, M., Bühl, J., Seifert, P., Baars, H., Engelmann, R., Barja González, B., Mamouri, R.-E., Zamorano, F., and Ansmann, A.: Hemispheric contrasts in ice formation in stratiform mixed-phase clouds: disentangling the role of aerosol and dynamics with ground-based remote sensing, Atmospheric Chemistry and Physics, 21, 17969–17994, https://doi.org/10.5194/acp-21-17969-2021, 2021. a, b, c, d
Rose, T., Crewell, S., Löhnert, U., and Simmer, C.: A network suitable microwave radiometer for operational monitoring of the cloudy atmosphere, Atmospheric Research, 75, 183–200, https://doi.org/10.1016/j.atmosres.2004.12.005, 2005. a
RPG: RPG94 measurement instrument, https://www.radiometer-physics.de/products/microwave-remote-sensing-instruments/fmcw-doppler-cloud-radar/, last access: 17 December 2024. a
Scherrer, S. C. and Appenzeller, C.: Fog and low stratus over the Swiss Plateau – a climatological study, International Journal of Climatology, 34, 678–686, https://doi.org/10.1002/joc.3714, 2014. a
Schönhuber, M., Lammer, G., and Randeu, W. L.: The 2D-Video-Distrometer, 3–31, Springer Berlin Heidelberg, Berlin, Heidelberg, ISBN 978-3-540-77655-0, https://doi.org/10.1007/978-3-540-77655-0_1, 2008. a
Seifert, A., Bachmann, V., Filipitsch, F., Förstner, J., Grams, C. M., Hoshyaripour, G. A., Quinting, J., Rohde, A., Vogel, H., Wagner, A., and Vogel, B.: Aerosol–cloud–radiation interaction during Saharan dust episodes: the dusty cirrus puzzle, Atmospheric Chemistry and Physics, 23, 6409–6430, https://doi.org/10.5194/acp-23-6409-2023, 2023. a
Stein, A. F., Draxler, R. R., Rolph, G. D., Stunder, B. J. B., Cohen, M. D., and Ngan, F.: NOAA's HYSPLIT Atmospheric Transport and Dispersion Modeling System, Bulletin of the American Meteorological Society, 96, 2059–2077, https://doi.org/10.1175/BAMS-D-14-00110.1, 2015. a
Sze, K. C. H., Wex, H., Hartmann, M., Skov, H., Massling, A., Villanueva, D., and Stratmann, F.: Ice-nucleating particles in northern Greenland: annual cycles, biological contribution and parameterizations, Atmospheric Chemistry and Physics, 23, 4741–4761, https://doi.org/10.5194/acp-23-4741-2023, 2023. a
Tobo, Y., Adachi, K., Kawai, K., Matsui, H., Ohata, S., Oshima, N., Kondo, Y., Hermansen, O., Uchida, M., Inoue, J., and Koike, M.: Surface warming in Svalbard may have led to increases in highly active ice-nucleating particles, Communications Earth & Environment, 5, 516, https://doi.org/10.1038/s43247-024-01677-0, 2024. a
University of Wyoming: Radiosonde data university of Wyoming, Invercargill has station number 93844, University of Wyoming [data set], https://weather.uwyo.edu/upperair/sounding.shtml, last access: 23 October 2024. a, b, c
Vali, G.: Quantitative evaluation of experimental results on heterogeneous freezing nucleation of supercooled liquids, Journal of the Atmospheric Sciences, 28, 402–409, https://doi.org/10.1175/1520-0469(1971)028<0402:qeoera>2.0.co;2, 1971. a
Wanner, H. and Furger, M.: The Bise – Climatology of a regional wind north of the Alps, Meteorology and Atmospheric Physics, 43, 105–115, https://doi.org/10.1007/BF01028113, 1990. a
Wegener, A.: Thermodynamik der Atmosphäre, Leipzig, J. A. Barth, 331 pp., 1911. a
Wiegner, M. and Geiß, A.: Aerosol profiling with the Jenoptik ceilometer CHM15kx, Atmospheric Measurement Techniques, 5, 1953–1964, https://doi.org/10.5194/amt-5-1953-2012, 2012. a