the Creative Commons Attribution 4.0 License.
the Creative Commons Attribution 4.0 License.
 | 17 Feb 2026
Low and consistent asymmetry parameters in Arctic and mid-latitude cirrus
Franz Martin Schnaiter
Cirrus clouds play a critical role in the Earth's radiation budget, yet their shortwave optical properties remain poorly constrained. In particular, the short wave asymmetry parameter (g), which governs the angular distribution of scattered light, is particularly sensitive to ice crystal morphology, a property that varies widely in cirrus. To provide observational constraints on g and to investigate its relationship with ice microphysical properties, we analysed simultaneous in situ measurements of particle morphology and angular light scattering using the Particle Habit Imaging and Polar Scattering (PHIPS) probe. The measurements were obtained during the Cirrus in High Latitudes (CIRRUS-HL) campaign in June and July 2021, sampling both mid-latitude and Arctic cirrus across a range of cloud types and temperatures down to −63 °C. Across both regions, we found consistently low median asymmetry parameters, with a campaign-wide median of 0.738. The observed g values were largely insensitive to variations in temperature, humidity, and crystal aspect ratio, and showed only minor differences between ice habits. In contrast, a systematic decrease in g with increasing particle size was identified, median g ranging from 0.777 for sub-30 µm particles in mid-latitude cirrus to minimum values of 0.719 and 0.713 for 175 µm particles in mid-latitude and Arctic cirrus, respectively. The measured values are substantially lower than those commonly used in current radiative transfer schemes, suggesting that the shortwave warming effect of cirrus clouds may be overestimated in many climate models. These results provide improved observational constraints for the representation of ice cloud optical properties and support efforts to reduce uncertainties in cirrus cloud radiative forcing.
- Article
(7995 KB) - Full-text XML
-
Supplement
(38890 KB) - BibTeX
- EndNote


To improve the representation of cirrus cloud radiative effects in climate models and remote sensing algorithms, it is important to have a good understanding of the ice crystal single-scattering properties (Mishchenko et al., 1996; Zhang et al., 1999; Yang et al., 2001). Within commonly used two-stream radiative transfer frameworks, the key single-scattering properties are the extinction coefficient, single-scattering albedo and the asymmetry parameter (g). Among these, g exhibits a particularly complex dependence on ice crystal morphology in the solar spectrum. Ice crystal morphological properties, like crystal size, habit as well as degree and type of crystal complexity, are known to vary greatly with cloud type, in-cloud temperature, and geographical region (e.g. Heymsfield et al., 2017; Wolf et al., 2018; Woods et al., 2018; Lawson et al., 2019).
As a result of this high morphological variability, constraining the single-scattering properties of ice crystals in numerical simulations remains a major challenge. Numerical ray-tracing studies for the solar spectral range predict a wide variety of g values, typically spanning 0.74–0.94, with higher values associated with pristine hexagonal habits and lower values with complex particle shapes or surface roughness (e.g. Iaquinta et al., 1995; Macke et al., 1996b, 1998; Um and McFarquhar, 2007; Yang et al., 2008). Accurate quantification of g is therefore critical, as biases can lead to a significant uncertainty in estimations of the ice cloud radiative effect in climate models (Järvinen et al., 2018; Yi et al., 2013) and in retrieved cirrus microphysical properties from remote sensing observations (Yang et al., 2008; Yi et al., 2017a). Vogelmann and Ackerman (1995) showed that g must be constrained within approximately 2 %–5 % to limit errors in computed shortwave fluxes to about 5 %.
Observational studies are therefore essential for constraining the magnitude of g in radiative transfer simulations. Unlike numerical estimates, measurements indicate a more moderate variability in g. Early radiometric observations reported a low asymmetry parameter around 0.7 in a case study over the midwestern USA (Stephens et al., 1990), while subsequent satellite-based multi-angle retrievals consistently yielded values for the visible asymmetry parameter below 0.8 (van Diedenhoven et al., 2013, 2014b; Wang et al., 2014; Cole et al., 2014; van Diedenhoven, 2021). Similarly, lidar observations provide another means of retrieving the asymmetry parameter, with recent studies also reporting values around 0.76 (Gil-Díaz et al., 2025).
Estimating g from remote sensing observations is inherently limited by the underlying optical model. The retrieved values are constrained by the model assumptions and cannot fall below the minimum g permitted by the chosen model. Consequently, retrievals often converge near this lower bound (Järvinen et al., 2023b). For instance, studies that use a severely roughened hexagonal aggregate to represent ice crystals consistently report visible-wavelength g values around 0.75 (Cole et al., 2014; Järvinen et al., 2018; Wang et al., 2018; Forster and Mayer, 2022).
A more direct approach for determining g is provided by polar nephelometer measurements. To date, measurements from three airborne polar nephelometers have been reported in the literature: the Polar Nephelometer (PN; Gayet et al., 1998), the Cloud Integrating Nephelometer (CIN; Gerber et al., 2000), and the Particle Habit Imaging and Polar Scattering (PHIPS) probe (Schnaiter et al., 2018). These measurements have yielded median or mean asymmetry parameters typically ranging between 0.73–0.79 in cirrus clouds (Gerber et al., 2000; Auriol et al., 2001; Garrett et al., 2001, 2003; Gayet et al., 2004, 2006, 2012; Febvre et al., 2009; van Diedenhoven et al., 2013).
However, such direct measurements remain sparse and have been largely confined to a limited number of airborne campaigns, predominantly sampling tropical deep convective systems or mid-latitude cirrus. To date, only a single in situ observation has been reported for Arctic cirrus, based on a case study of a cirrus spissatus band with a cloud-top temperature of −46 °C (Garrett et al., 2001). Moreover, previous studies have primarily emphasized bulk optical properties, providing only limited insight into the relationship between g and the concurrently measured microphysical characteristics of the ice crystal population.
The objective of this study is to extend direct in situ observations of g by analyzing a comprehensive, multi-flight dataset obtained in both mid-latitude and Arctic cirrus during the CIRRUS in High Latitudes (CIRRUS-HL) campaign using the PHIPS instrument. This dataset enables a unique dual-regional comparison within the same season and includes single-particle measurements that allow for a direct linkage between ice crystal microphysical properties and their angular light-scattering characteristics. In addition to constraining the magnitude of g, we examine its dependence on key microphysical parameters, including effective radius, ice water content, habit, and aspect ratio. By combining bulk and particle-resolved analyses, the results provide new observational constraints for developing physically consistent optical parameterisations for radiative transfer applications.
2.1 The CIRRUS-HL airborne campaign
The CIRRUS-HL airborne campaign took place from 6 June to 28 July 2021 using the High Altitude and Long Range (HALO) research aircraft (Jurkat-Witschas et al., 2025). The original aim of the campaign was to investigate the microphysical and optical properties of Arctic cirrus using in situ and remote sensing instrumentation, with operations initially planned from Kiruna, Sweden. However, due to pandemic-related restrictions, the campaign base was relocated to Oberpfaffenhofen, Germany. This logistical change broadened the scientific scope to include both mid-latitude and Arctic cirrus (see Fig. 1), as Arctic flight operations now required long transit legs and refueling stops in Scandinavia or Iceland. The revised campaign strategy focused on contrasting cirrus clouds in different regions and meteorological conditions. Accordingly, flights were designed to sample natural mid-latitude cirrus in diverse weather regimes, including warm conveyor belt systems, high-pressure in situ cirrus, and convective outflow, as well as cirrus potentially influenced by aviation emissions. The time frame of the campaign coincided with pandemic air traffic restrictions, resulting in a 65 %–80 % reduction in daily commercial flight activity compared to the same time frame in 2019 (De La Torre Castro et al., 2023). The campaign period also overlapped with extreme rainfall events in central Europe, resulting in fatal flooding in Germany and Belgium (Lehmkuhl et al., 2022).
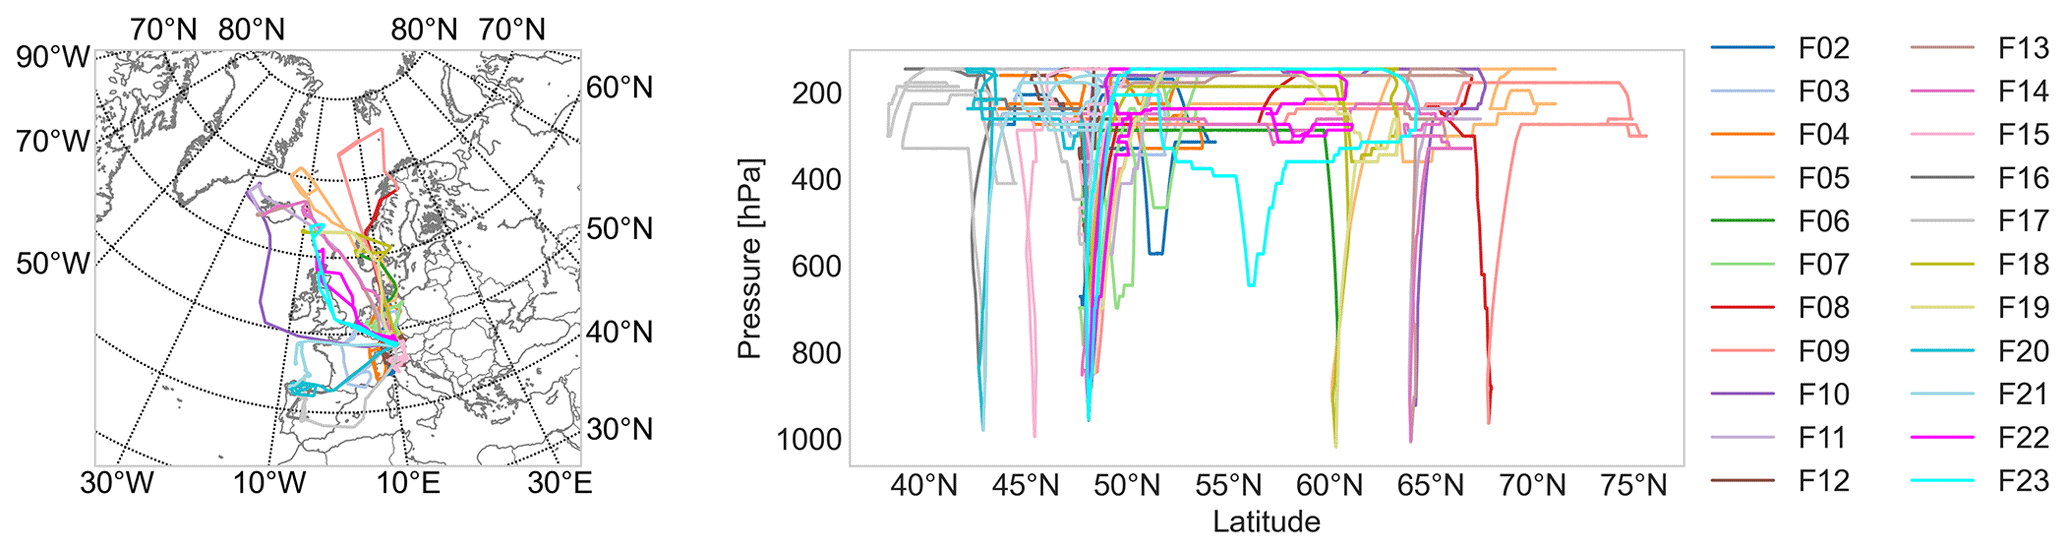
Figure 1Trajectories of CIRRUS-HL measurement flights (F02–F23) included to the analysis. Research flights targeting Arctic cirrus were performed as double flights with a refuelling stop. These were F05/F06, F08/F09, and F10/F11. In total, approximately 5625 km of mid-latitude cirrus and 1060 km of Arctic cirrus were sampled.
2.2 Microphysical and optical measurements
During CIRRUS-HL in situ measurements of the ice crystal microphysical and optical properties were conducted with the PHIPS airborne cloud instrument (Abdelmonem et al., 2016; Schnaiter et al., 2018). PHIPS is a combination of a single-particle stereo-microscopic imager and a polar nephelometer, which allow for a combined analysis of optical and microphysical properties at the level of individual ice crystals.
2.2.1 Derivation of microphysical properties from stereo-microscopic images
The PHIPS stereo-microscopic imager consists of two CCD camera and microscope assemblies with an angular viewing distance of 120° each acquiring 1360 by 1024 pixel bright field microscopic images of individual cloud particles at a maximum acquisition rate of 10 Hz. During CIRRUS-HL a magnification setting of 6× was used for both camera assemblies corresponding to an optical resolution of about 6.2 µm and a field of view of approximately 1.1 mm×1.5 mm, limiting the maximum observable particle size to about 1.5 mm. For each image pair a set of microphysical parameters were retrieved using an algorithm discussed in Schön et al. (2011). These microphysical parameters include the maximum dimension (Dmax), area-equivalent diameter (i.e. equivalent diameter of a sphere having the same cross-sectional area, Deq), projected area (Aproj), and the aspect ratio (AR). In this study the AR is defined as the ratio between the maximum dimension that is perpendicular with respect to Dmax and Dmax, and thus is always equal or below 1.
The stereo-microscopic images were also manually visually inspected and assigned to a habit class. A detailed description of the habit classification scheme can be found in the Supplement of Järvinen et al. (2023a). While the original habit classification scheme includes 18 categories, for the purposes of this study we reduced the habit classes to 9 cirrus-relevant classes. These include: plate (encompassing also sectored and skeleton plates), column, frozen droplet, side plane, bullet rosette, mixed rosette, capped column, and other category, which contains crystals that could not be confidently assigned to a specific habit. Additionally, we introduced an aggregate class to account for particles composed of multiple crystals, even though it does not represent a single-crystal habit in the traditional sense.
To account for measurement artefacts, a separate shattered class was introduced for particles identified as fragments from shattering events. Particles were classified as shattered when multiple small fragments (typically <100 µm) were observed within a single image frame, which has a size of approximately 1.1 mm×1.5 mm. The likelihood of multiple unconnected ice particles naturally occurring within such a small field of view is considered low for cirrus conditions, where particle concentrations and clustering tendencies are limited. Additionally, larger crystals were classified as shattered if they exhibited broken edges, truncated branches, or jagged outlines inconsistent with physically intact ice crystal habits. These particles were excluded from further analysis (see Sect. 2.2.2 and 2.2.4). Representative stereo-images for each habit class and the shattered class are provided in the Supplement.
2.2.2 Calculation of particle size distribution and bulk microphysical properties
Although the stereo-microscopic imager is limited to a maximum acquisition rate of 10 Hz, the PHIPS trigger system detects particles at rates up to 13 kHz. The sensitive area of the instrument is defined by the overlap of the trigger system field of view and the scattering laser intensity distribution and varies between approximately 0.3–0.9 mm2, depending on particle size (Waitz et al., 2021). This size-dependent sensitive area, together with the aircraft's true air speed, is used to calculate the sampling volume. Owing to the high velocity of a jet aircraft, compression of air occurs near probe and wing edges. To obtain the true ambient sampling volume, a thermodynamic correction described by Weigel et al. (2016) is applied.
Particle sizing is primarily based on the stereo-microscopic images. Images of the same particle acquired from two viewing angles are used to derive the mean Deq and Aproj for each particle. For trigger events that did not produce stereo images due to the limited imaging rate, Deq and Aproj were estimated using the relationship between the particle geometrical size and partial scattering cross section measured by the nephelometer as discussed in Waitz et al. (2021). The corresponding calibration curves for the CIRRUS-HL campaign are shown in Figs. S1 and S2 in the Supplement. During most CIRRUS-HL flights, typically 70 %–80 % of the particle triggers also produced stereo-images, so particle sizing was predominantly image based. In four flights, however, fewer than 50 % of triggers produced images, and sizing relied mainly on nephelometer-derived estimates.
Particle size distributions were derived by grouping particles into logarithmically spaced bins between 15–700 µm in Deq. Number concentrations were calculated by dividing the particle counts in each bin by the corresponding sampling volume. Using the particle-resolved projected area and size information, bulk microphysical properties including ice water content (IWC), extinction coefficient (βext), effective radius (reff), and mass-equivalent spherical radius (), were calculated.
The extinction coefficient was determined from the projected area concentration in each size bin. For each size bin i, the projected area concentration dAproj,i was determined as
where is the projected area of the kth particle in bin i, and Vi is the corresponding sampling volume for that bin. Summation is performed over all detected particles k within the bin. The total extinction coefficient was then obtained as
where the factor of 2 assumes randomly oriented particles in the geometrical optics regime (Bohren and Huffman, 1983).
The IWC was calculated analogously by summing the masses of individual particles within each size bin. Particle mass was estimated from the projected area using the empirical power-law relationship derived for mid-latitude ice crystals of Baker and Lawson (2006):
The mass concentration in each bin was then given by
and the total ice water content by
The effective radius reff was derived as
where ρice denotes the bulk density of ice.
The mass-equivalent spherical radius was calculated according to
where N is the total number concentration. The quantity represents the radius of a sphere with the average mass per particle of the ensemble, and is useful for linking two-moment microphysical schemes to bulk optical properties (Baran et al., 2025).
2.2.3 Removal of shattering events
Two particle size distributions (PSDs) were derived: a standard PSD including all detected trigger events, and a screened PSD including only particles classified as intact based on visual inspection of stereo-microscopic images. For the standard PSD, potential shattering events were filtered by applying an interarrival time threshold of 0.1 ms, based on the appearance of a distinct secondary mode in the interarrival time distribution (see Fig. S3).
We emphasize that a visual classification step is essential, as the inter-arrival time method alone cannot detect all shattering events due to the electronic dead time of the PHIPS detection system (12 µs), during which closely spaced fragments cannot be resolved as separate events. At typical aircraft speeds, this corresponds to a spatial separation of roughly 2 mm. However, these shattering events can be captured by the imager, which has a frame size of approximately 1.5 mm×1.1 mm.
Residual shattering artefacts were therefore removed through manual visual classification following the criteria described in Sect. 2.2.1. The impact of this additional screening is illustrated in Fig. 2, which compares the mean particle size and projected area distributions before and after removal of shattering artefacts for mid-latitude and Arctic cirrus. The largest differences occur for Deq<100 µm, where the interarrival time method alone overestimates the number concentration due to undetected fragments. After image-based screening, the number concentration decreases toward smaller sizes, producing a more physically consistent distribution.
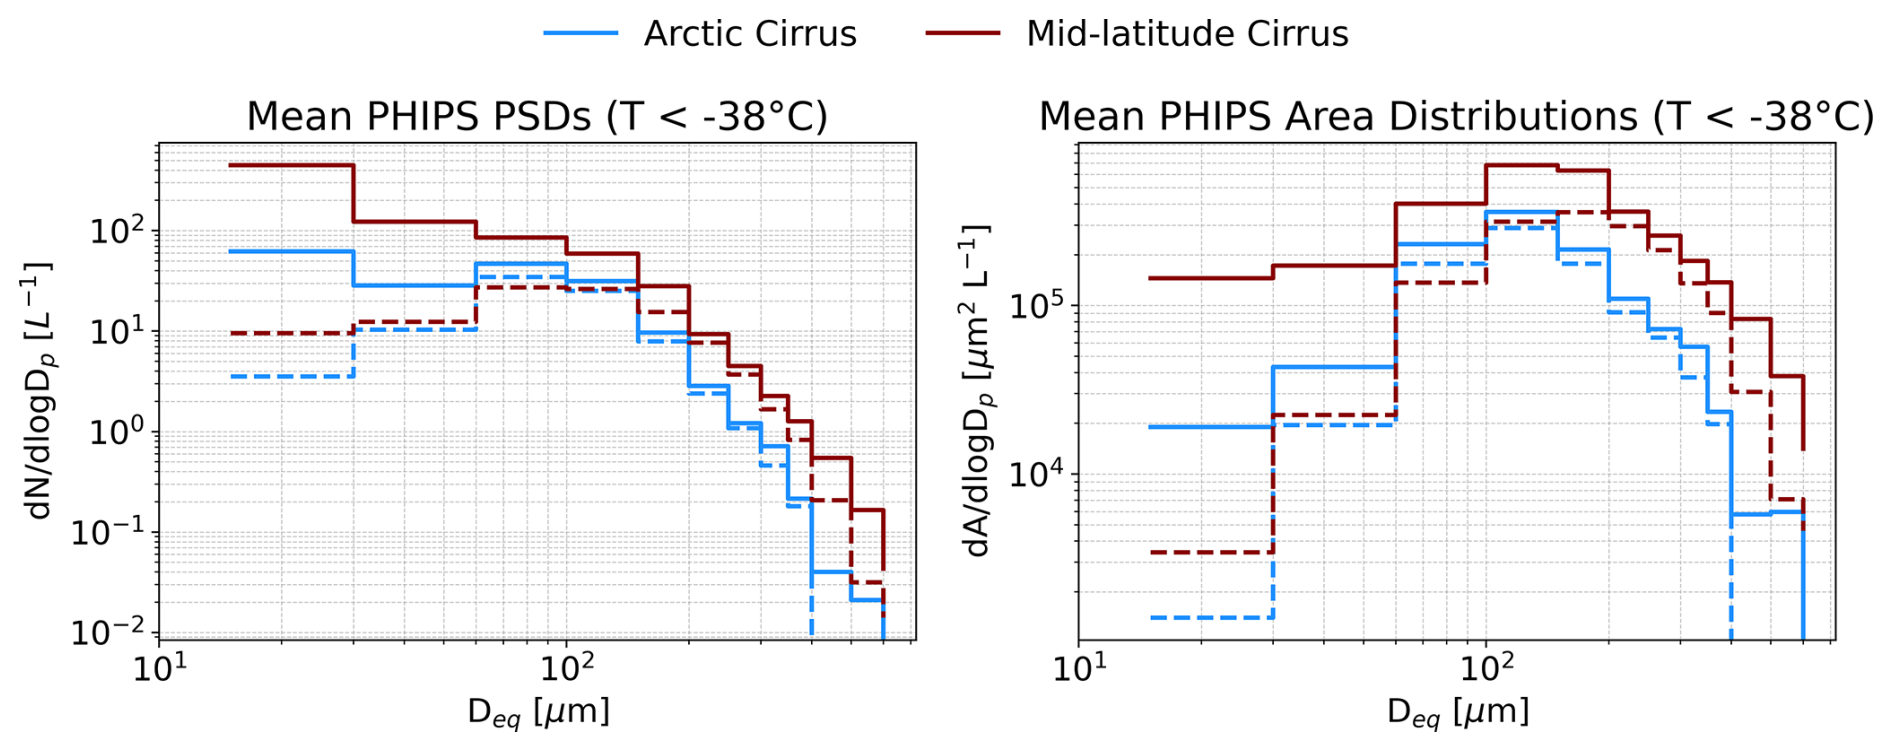
Figure 2The mean PHIPS particle size distribution (PSD) and projected area size distribution for mid-latitude and Arctic cirrus. The solid lines show the mean based on 1 Hz PHIPS data in cirrus conditions ( and g m−3) and the dashed lines the mean for only crystals with stereo-images that were manually classified as intact particles.
This refinement primarily affects microphysical parameters sensitive to small particles, such as the mean mass radius , whereas quantities weighted by projected area or extinction coefficient (e.g. reff) remain largely unchanged (see Fig. S5). The manually screened dataset thus provides a more physically realistic representation of the shape of the size distribution of the true ice particle population but is underestimating the number concentration and IWC as only a subset of the triggering events accompanied by a stereo-microscopic image are included in the analysis.
2.2.4 Retrieval of ice asymmetry parameter
The asymmetry parameter g was retrieved from PHIPS measurements following the framework of Xu et al. (2022), with methodological refinements and an updated uncertainty assessment as detailed in Appendix A. In this method, the measured angular scattering function between 18–170° is represented by a truncated series of Legendre polynomials. The underlying assumption of the method is that at scattering angles greater than 18°, the measured signal is dominated by geometrical-optics (GO) contributions – namely refraction and reflection – with only minor contributions from diffraction (Takano and Liou, 1989; Macke et al., 1996b). The unmeasured forward range below 18° is assumed to contain the bulk of the diffraction peak, which is estimated from the measured particle size using a parameterised function derived from scalar diffraction theory.
The GO component of the phase function is reconstructed over the full angular range by fitting the measured data with a truncated Legendre polynomial expansion. The Legendre coefficients are obtained using Gauss–Legendre quadrature, which ensures optimal numerical accuracy. To keep all quadrature nodes within the PHIPS angular range, the maximum degree of the Legendre expansion is restricted to seven. This truncation implies that the method is applicable only to smooth phase functions that can be adequately represented by a low-order polynomial expansion.
We evaluated this requirement for our dataset and found that 98 % of the measured angular scattering functions show no distinct features such as 22° halo peaks. An uncertainty analysis was performed using 1612 ray-tracing simulations of hexagonal ice crystals with varying aspect ratios, sizes, and surface roughness, generated with the Macke et al. (1996b) ray-tracing code. This closure study demonstrates that, under realistic mixtures of ice crystal morphologies, the retrieval uncertainty of g ranges from approximately −0.001 to +0.02 when halo features are absent from the phase functions. A detailed description of the underlying assumptions, validation tests, and uncertainty quantification is provided in Appendix A.
To analyse cirrus microphysical and optical properties by geographical region, the CIRRUS-HL observations were classified into mid-latitude and Arctic cirrus using a latitude threshold of 65° N. Cirrus clouds were defined based on a combination of in-cloud temperature below −38 °C and IWC greater than 10−5 g m−3, derived from the 1 Hz PHIPS data. The campaign covered a wide geographical range, from 38.2 to 75.6° N, with the highest cirrus cloud sampled at 14.5 km altitude and the coldest cirrus temperature recorded at −62.8 °C. In total, approximately 5625 km of mid-latitude cirrus and 1060 km of Arctic cirrus were sampled, reflecting the greater spatial extent and coverage of mid-latitude observations during the campaign.
3.1 Ice crystal habits in mid-latitudes and Arctic cirrus
Figure 3 shows the fraction of habits as a function of Deq for the mid-latitude and Arctic cirrus cases. The most frequently occurring ice crystal habit class in both regions was the “other” category, accounting for 45 % and 66 % of all classified particles in mid-latitudes and Arctic, respectively. The high occurrence is especially pronounced for crystals smaller than 100 µm, for which over half of the measured particles fell into this group. In such cases, the classification to the “other” category can be due to the limited optical resolution available for morphological identification. Beyond this technical limitation, the “other” category also reflects the inherent complexity and variability of cirrus ice crystals, which often do not conform to traditional habit classifications (see Fig. 4 for example PHIPS images).
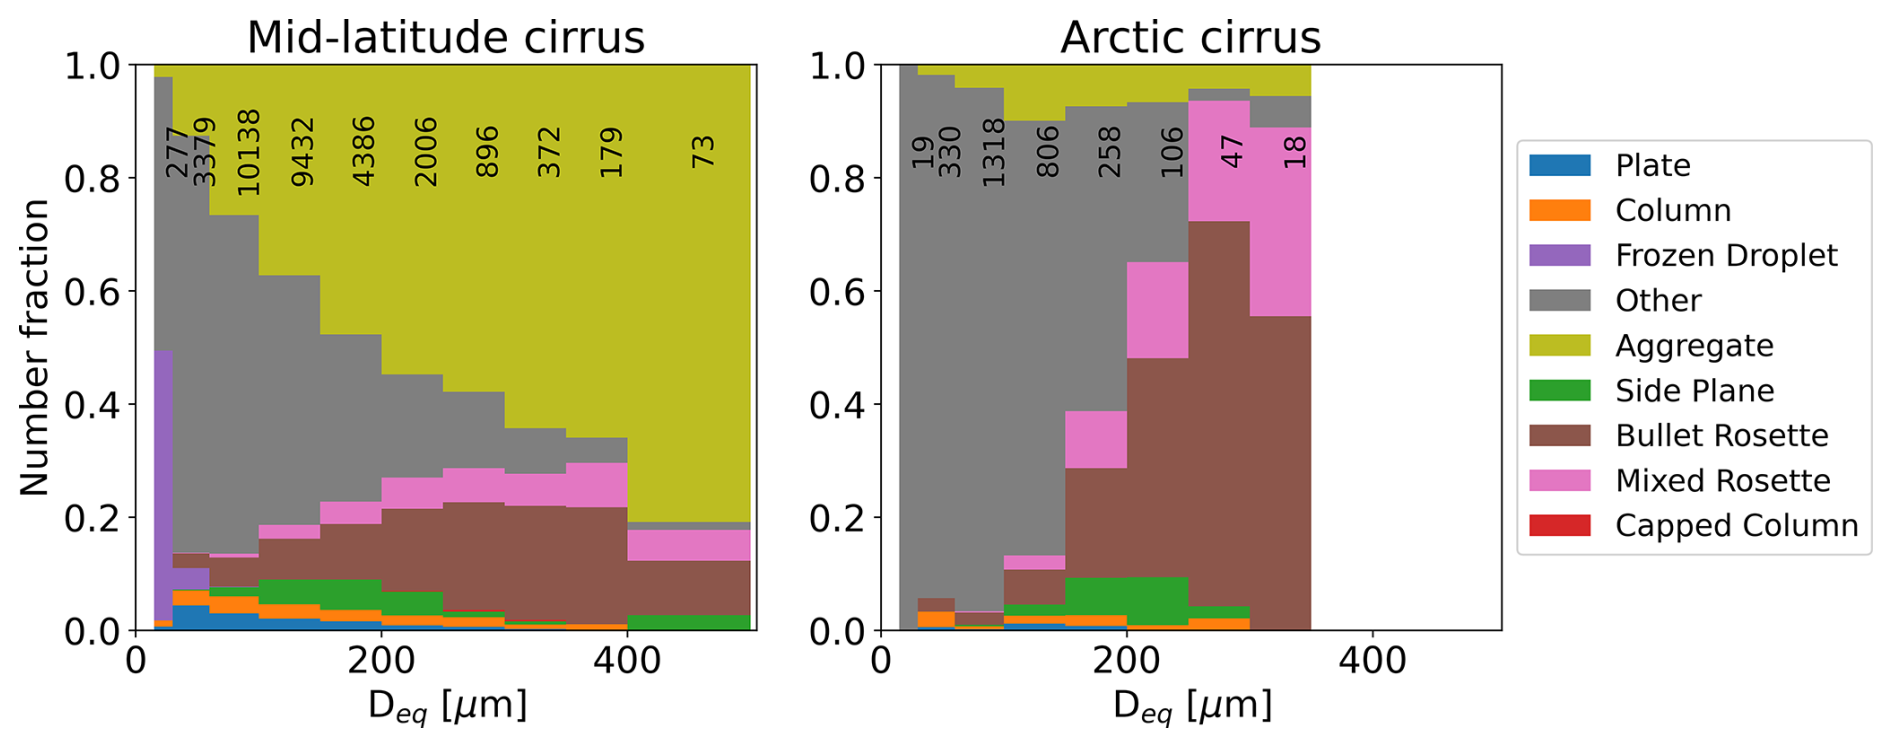
Figure 3Ice crystal habit distribution as a function of the area equivalent diameter (Deq) for mid-latitude and Arctic cirrus. The numbers indicate the number of ice crystal stereo-image pairs included in the habit analysis per size bin.
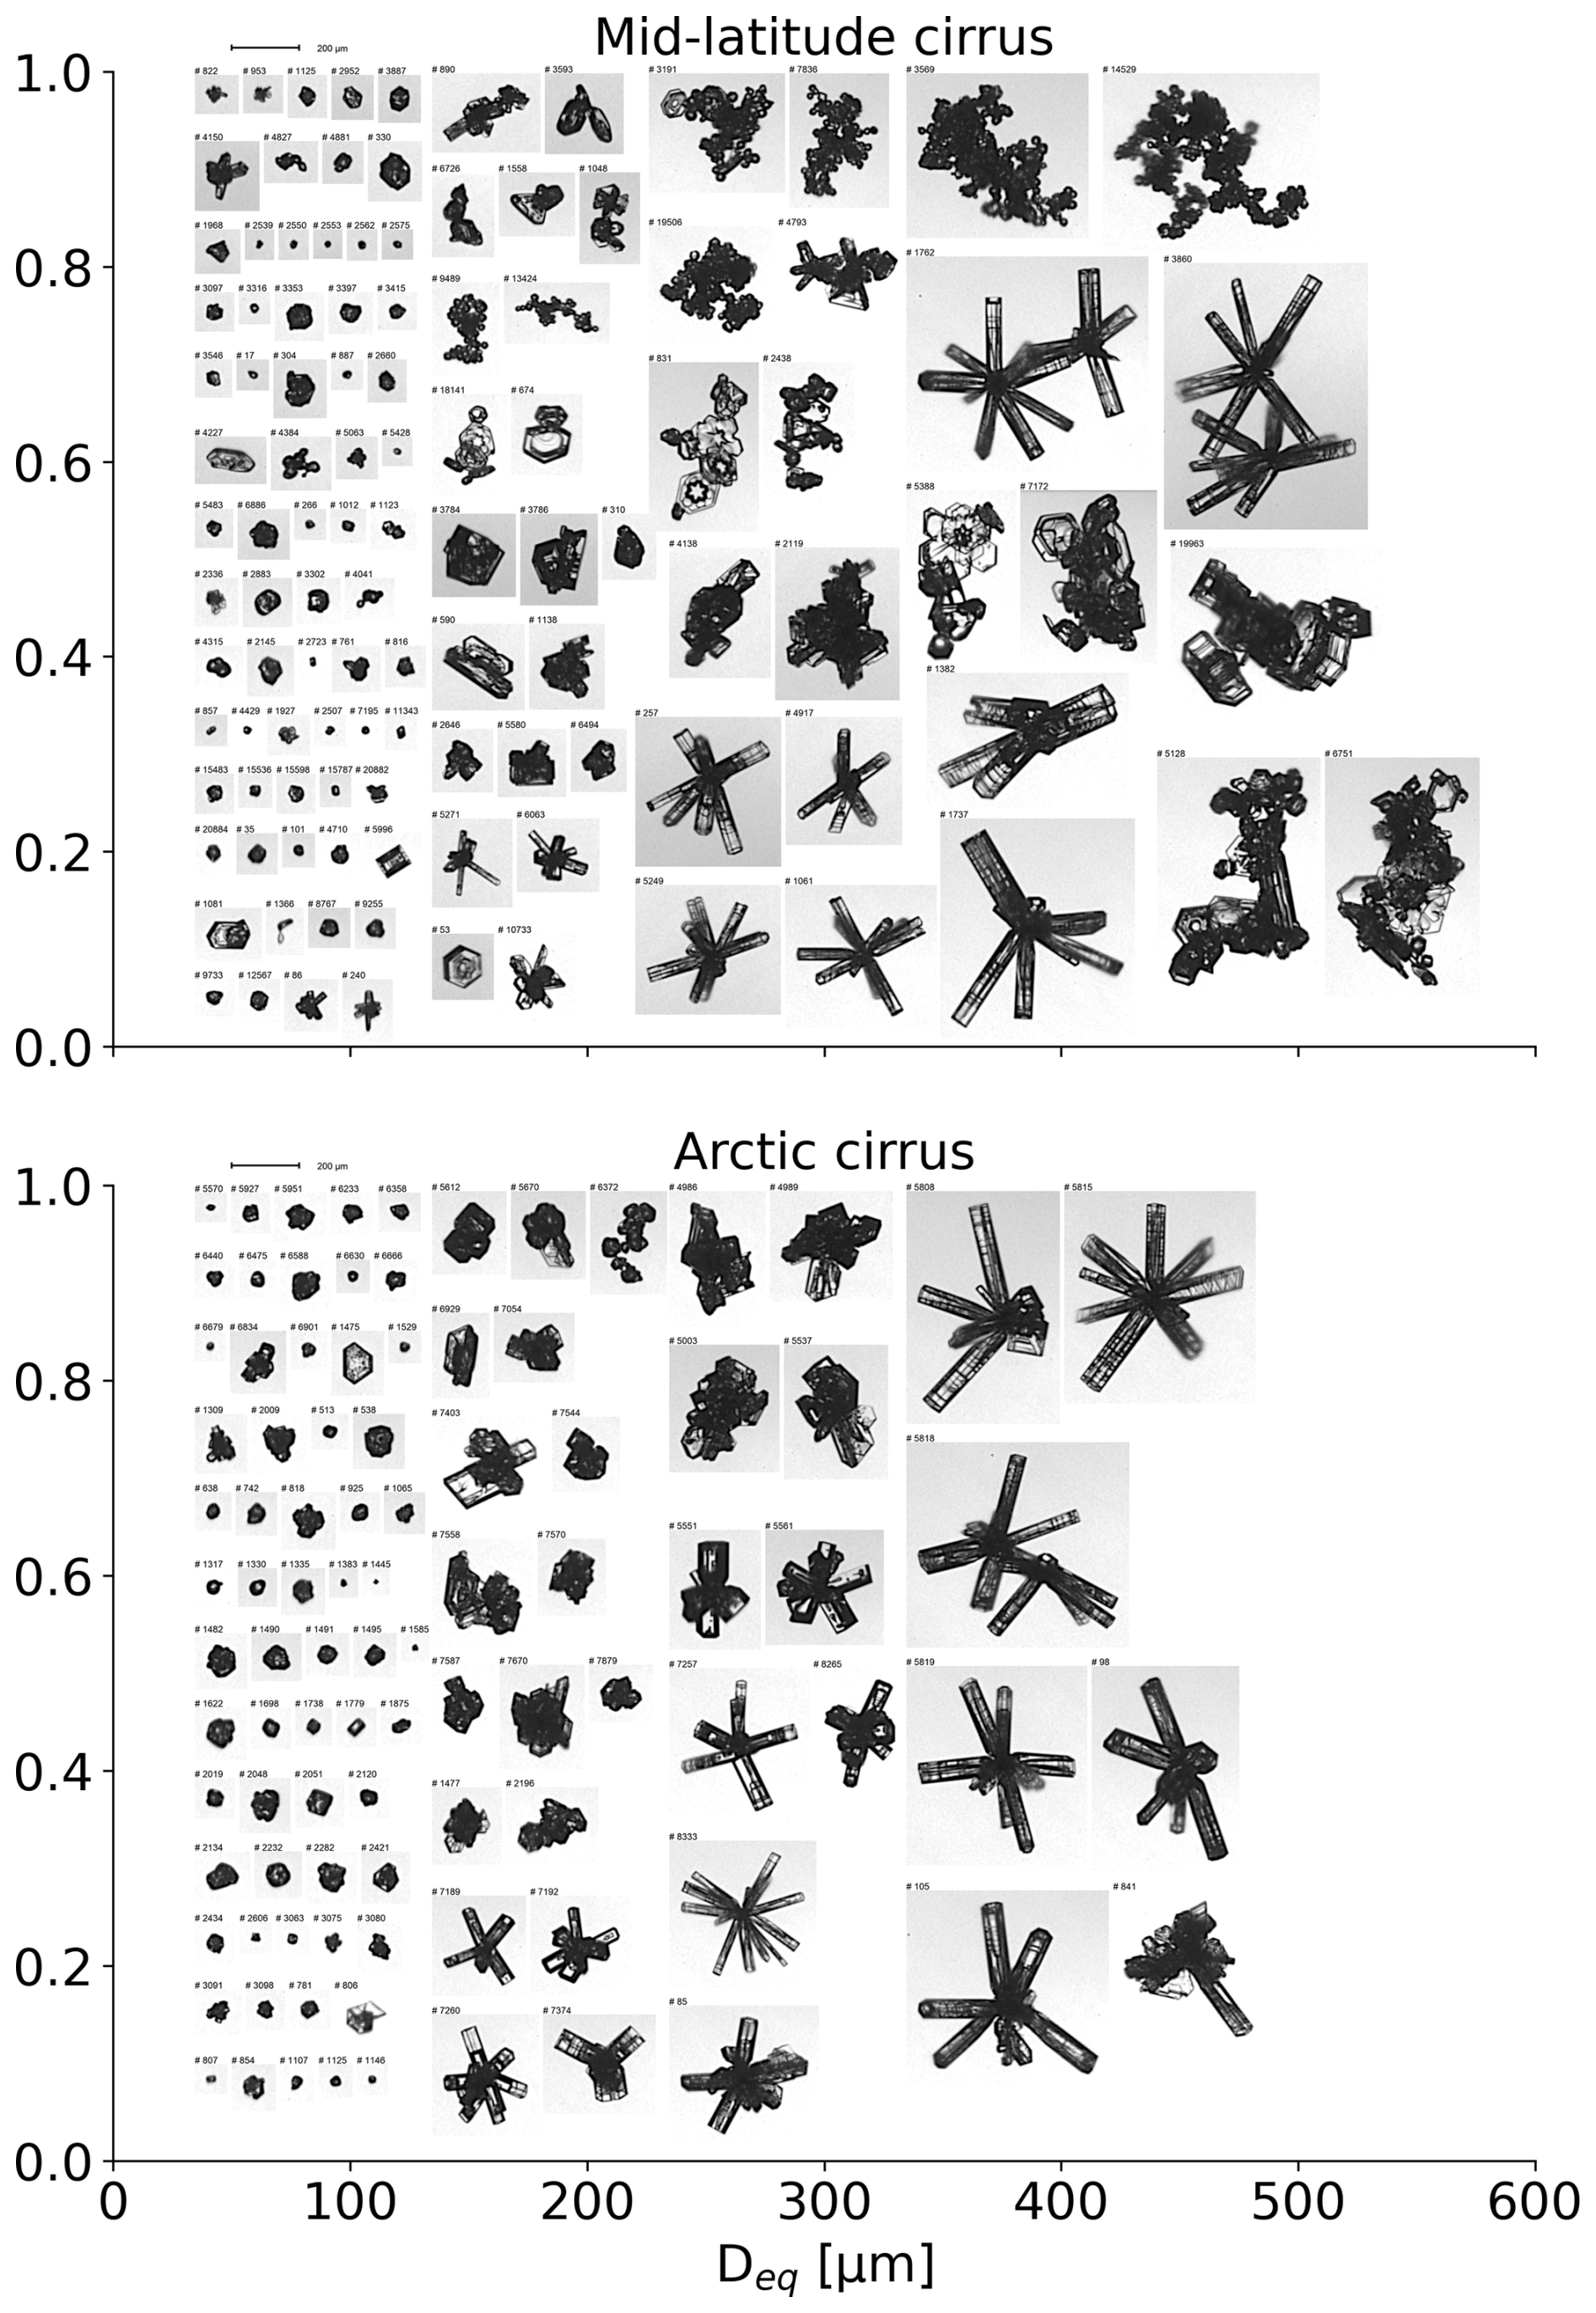
Figure 4Example ice crystal microscopic images recorded by PHIPS from mid-latitude and Arctic cirrus as a function of their area equivalent diameter (Deq). The number fractions of the different habits corresponds to Fig. 3.
Irregular and compact ice crystals, broadly corresponding to our “other” category, have frequently been reported as the dominant habit type in both mid-latitude and Arctic cirrus (Garrett et al., 2001; Lawson et al., 2019; Wolf et al., 2018). For example, Wolf et al. (2018) observed that compact or irregular habits accounted for 50 % and 90 % of the crystal populations in Arctic liquid-origin and in-situ cirrus, respectively. In addition to observations from high-resolution imaging instruments, scanning electron microscope analyses have also confirmed the dominance of irregular shapes in cirrus clouds, even among small ice crystals (Magee et al., 2021).
The most notable difference between mid-latitude and Arctic cirrus was a more frequent occurrence of aggregation in mid-latitudes compared to the Arctic. For mid-latitude cirrus aggregates was the second most frequent habit class, accounting for 32 % of all classified crystals, whereas in Arctic cirrus they accounted only for 7 % of all classified crystals. In mid-latitudes the fraction of aggregates was observed to clearly increase towards larger sizes with the highest fraction of 81 % found for the largest size group included in the analysis, between 400–500 µm. The more frequent occurrence of aggregates in mid-latitude cirrus can be explained through the more dynamic atmosphere at the lower latitudes (Barahona et al., 2017) and higher initial ice number concentration (Sourdeval et al., 2018), potentially promoting aggregation.
In mid-latitude cirrus most of the aggregates were consisting of plates (34 %), suggesting a convective origin, or of crystals classified as “other” (27 %). A large fraction of aggregates consisted of frozen droplets (25 %) but these, together with the simultaneously observed single frozen droplets, originated from research flight 12 targeting a strong overshooting convective system (see Schäfler and Rautenhaus, 2023). In contrast, frozen droplets and their aggregates were rarely detected in other mid-latitude cases, indicating that their occurrence was closely linked to specific convective conditions.
The second notable difference between the two regions was a higher occurrence of bullet and mixed rosettes in the Arctic. Bullet and mixed rosettes comprised 19 % of all classified crystals and dominated the population larger than 200 µm, comprising 56 %–89 % in that size range. This makes them the second most frequent habit type in Arctic cirrus. A similar dominance of bullet rosettes as the second most common habit was also reported in Arctic conditions by Wolf et al. (2018). For mid-latitude cirrus bullet and mixed rosettes were common but less frequent comprising 11 % of all crystals and reaching maximum occurrence frequencies of 25 %–28 % in the size range of 250–400 µm.
Other identified habits in both regions, each contributing between 2 %–9 % to the total population, included side planes, as well as single columns. In contrast, single plates were rare in Arctic cirrus (0.5 %) compared to 3.5 % in mid-latitude cirrus.
Figure 5 shows the ice crystal aspect ratios derived from the stereo-microscopic imager for different crystal sizes. The majority of the observed ice crystals exhibit median aspect ratios of approximately 0.8 for sub-100 µm particles and around 0.7 for larger crystals. Mid-latitude cirrus consistently shows lower aspect ratios than Arctic cirrus across all size bins. It should be noted, however, that the aspect ratios derived from the stereo-microscopic images represent the overall crystal geometry. Individual components of aggregates or polycrystals, such as the bullets forming bullet rosettes, can exhibit substantially higher aspect ratios. For example, Wagner et al. (2025) reported aspect ratios between 2–6 for individual bullets within bullet rosettes.
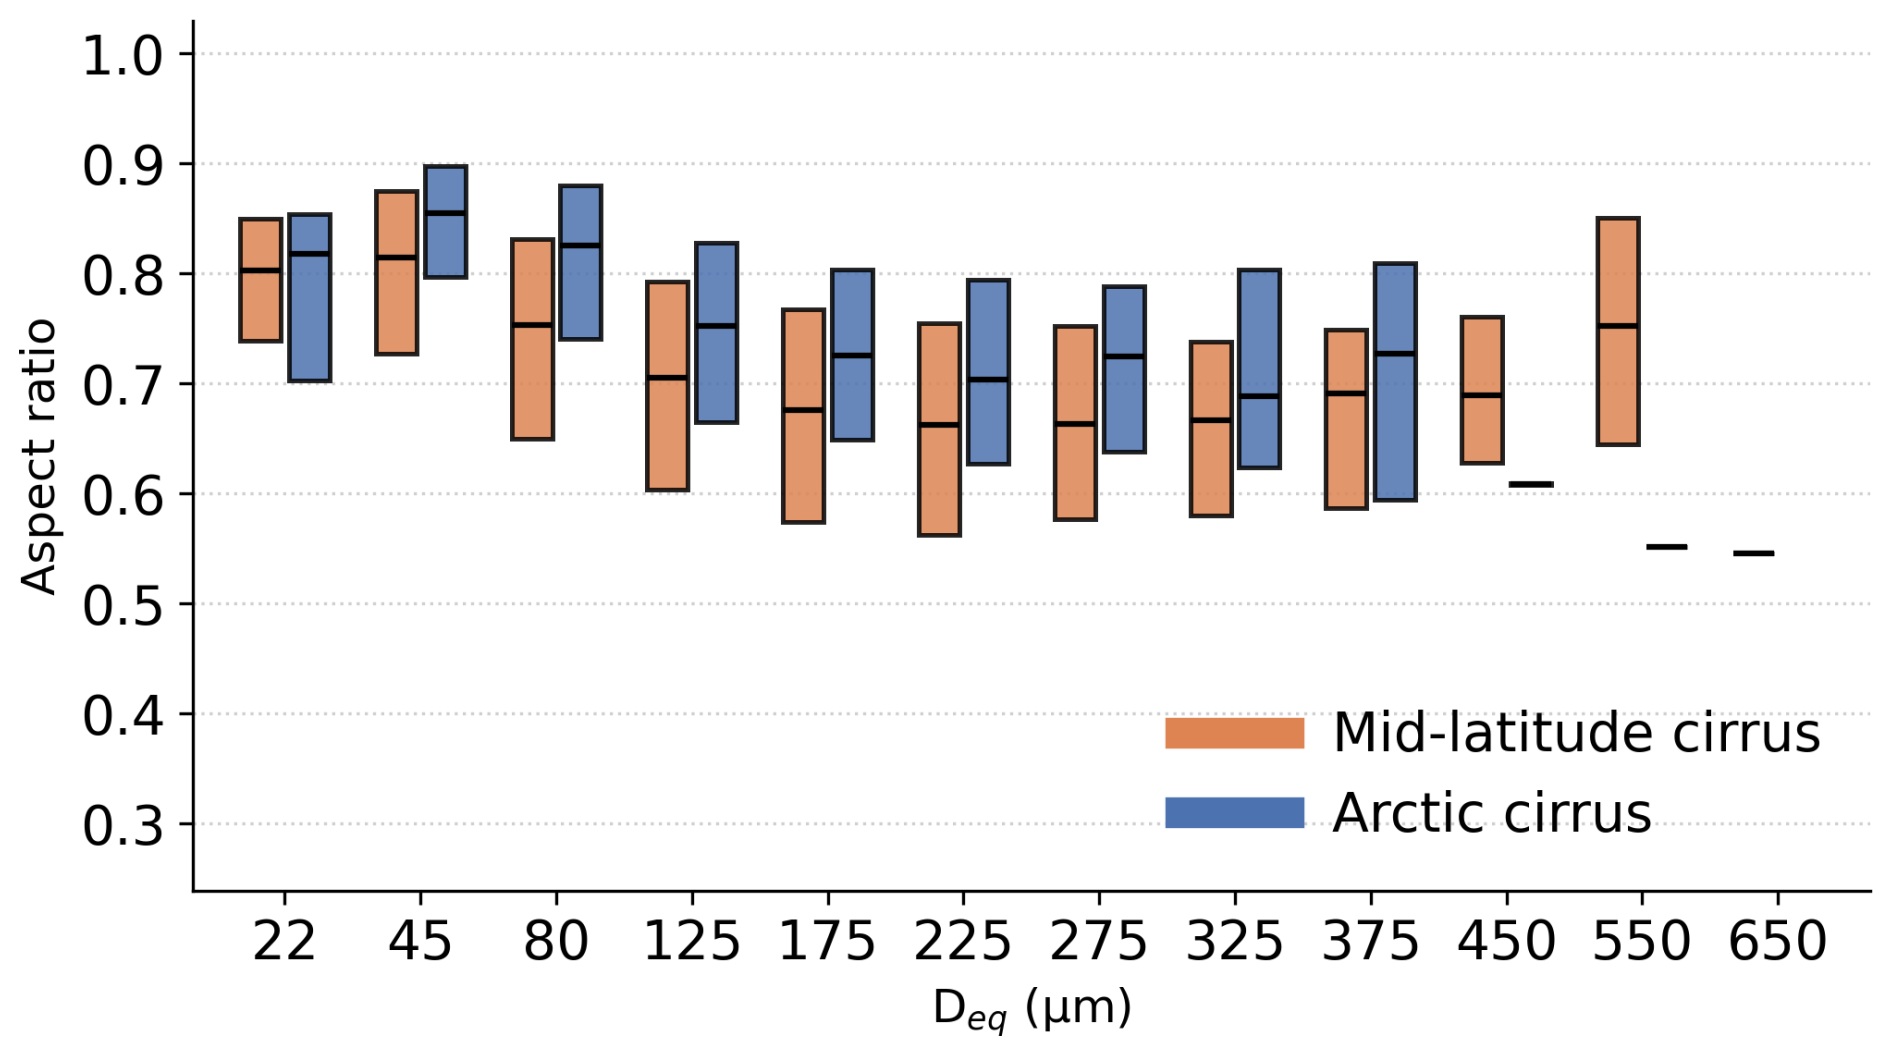
Figure 5Ice crystal aspect ratio for mid-latitude and Arctic cirrus using a latitude threshold of 65°. Aspect ratio is defined as the minimum of the two orthogonal aspect ratios derived from particle imaging. Boxes represent the interquartile range and the central line denotes the median.
3.2 Cirrus microphysical and optical properties in mid-latitudes and Arctic
Figure 6 presents the frequency distribution of key bulk microphysical properties of cirrus (N, IWC, βext, and reff) along with g as a function of latitude, derived from PHIPS observations for the Deq size range of 15–700 µm. The selected microphysical parameters are commonly used as input for radiative transfer schemes and were derived from 10 s averaged PHIPS particle size distributions. The asymmetry parameter was calculated from populations of 50 consecutive ice crystals and includes only manually inspected and classified intact (non-shattered) particles. Similarly, reff was derived using only non-shattered, imaged particles to ensure accurate representation of individual crystal morphology. In contrast, N, βext, and IWC were calculated using the full dataset, including particles without images, since applying the same shattering removal would lead to a systematic underestimation of these quantities. The minimum detection limits for the 10 s averages were approximately 0.5 L−1 for N, 0.005 km−1 for βext, and 0.05 mg m−3 for IWC, based on the instrument's sampling volume and estimated particle mass.
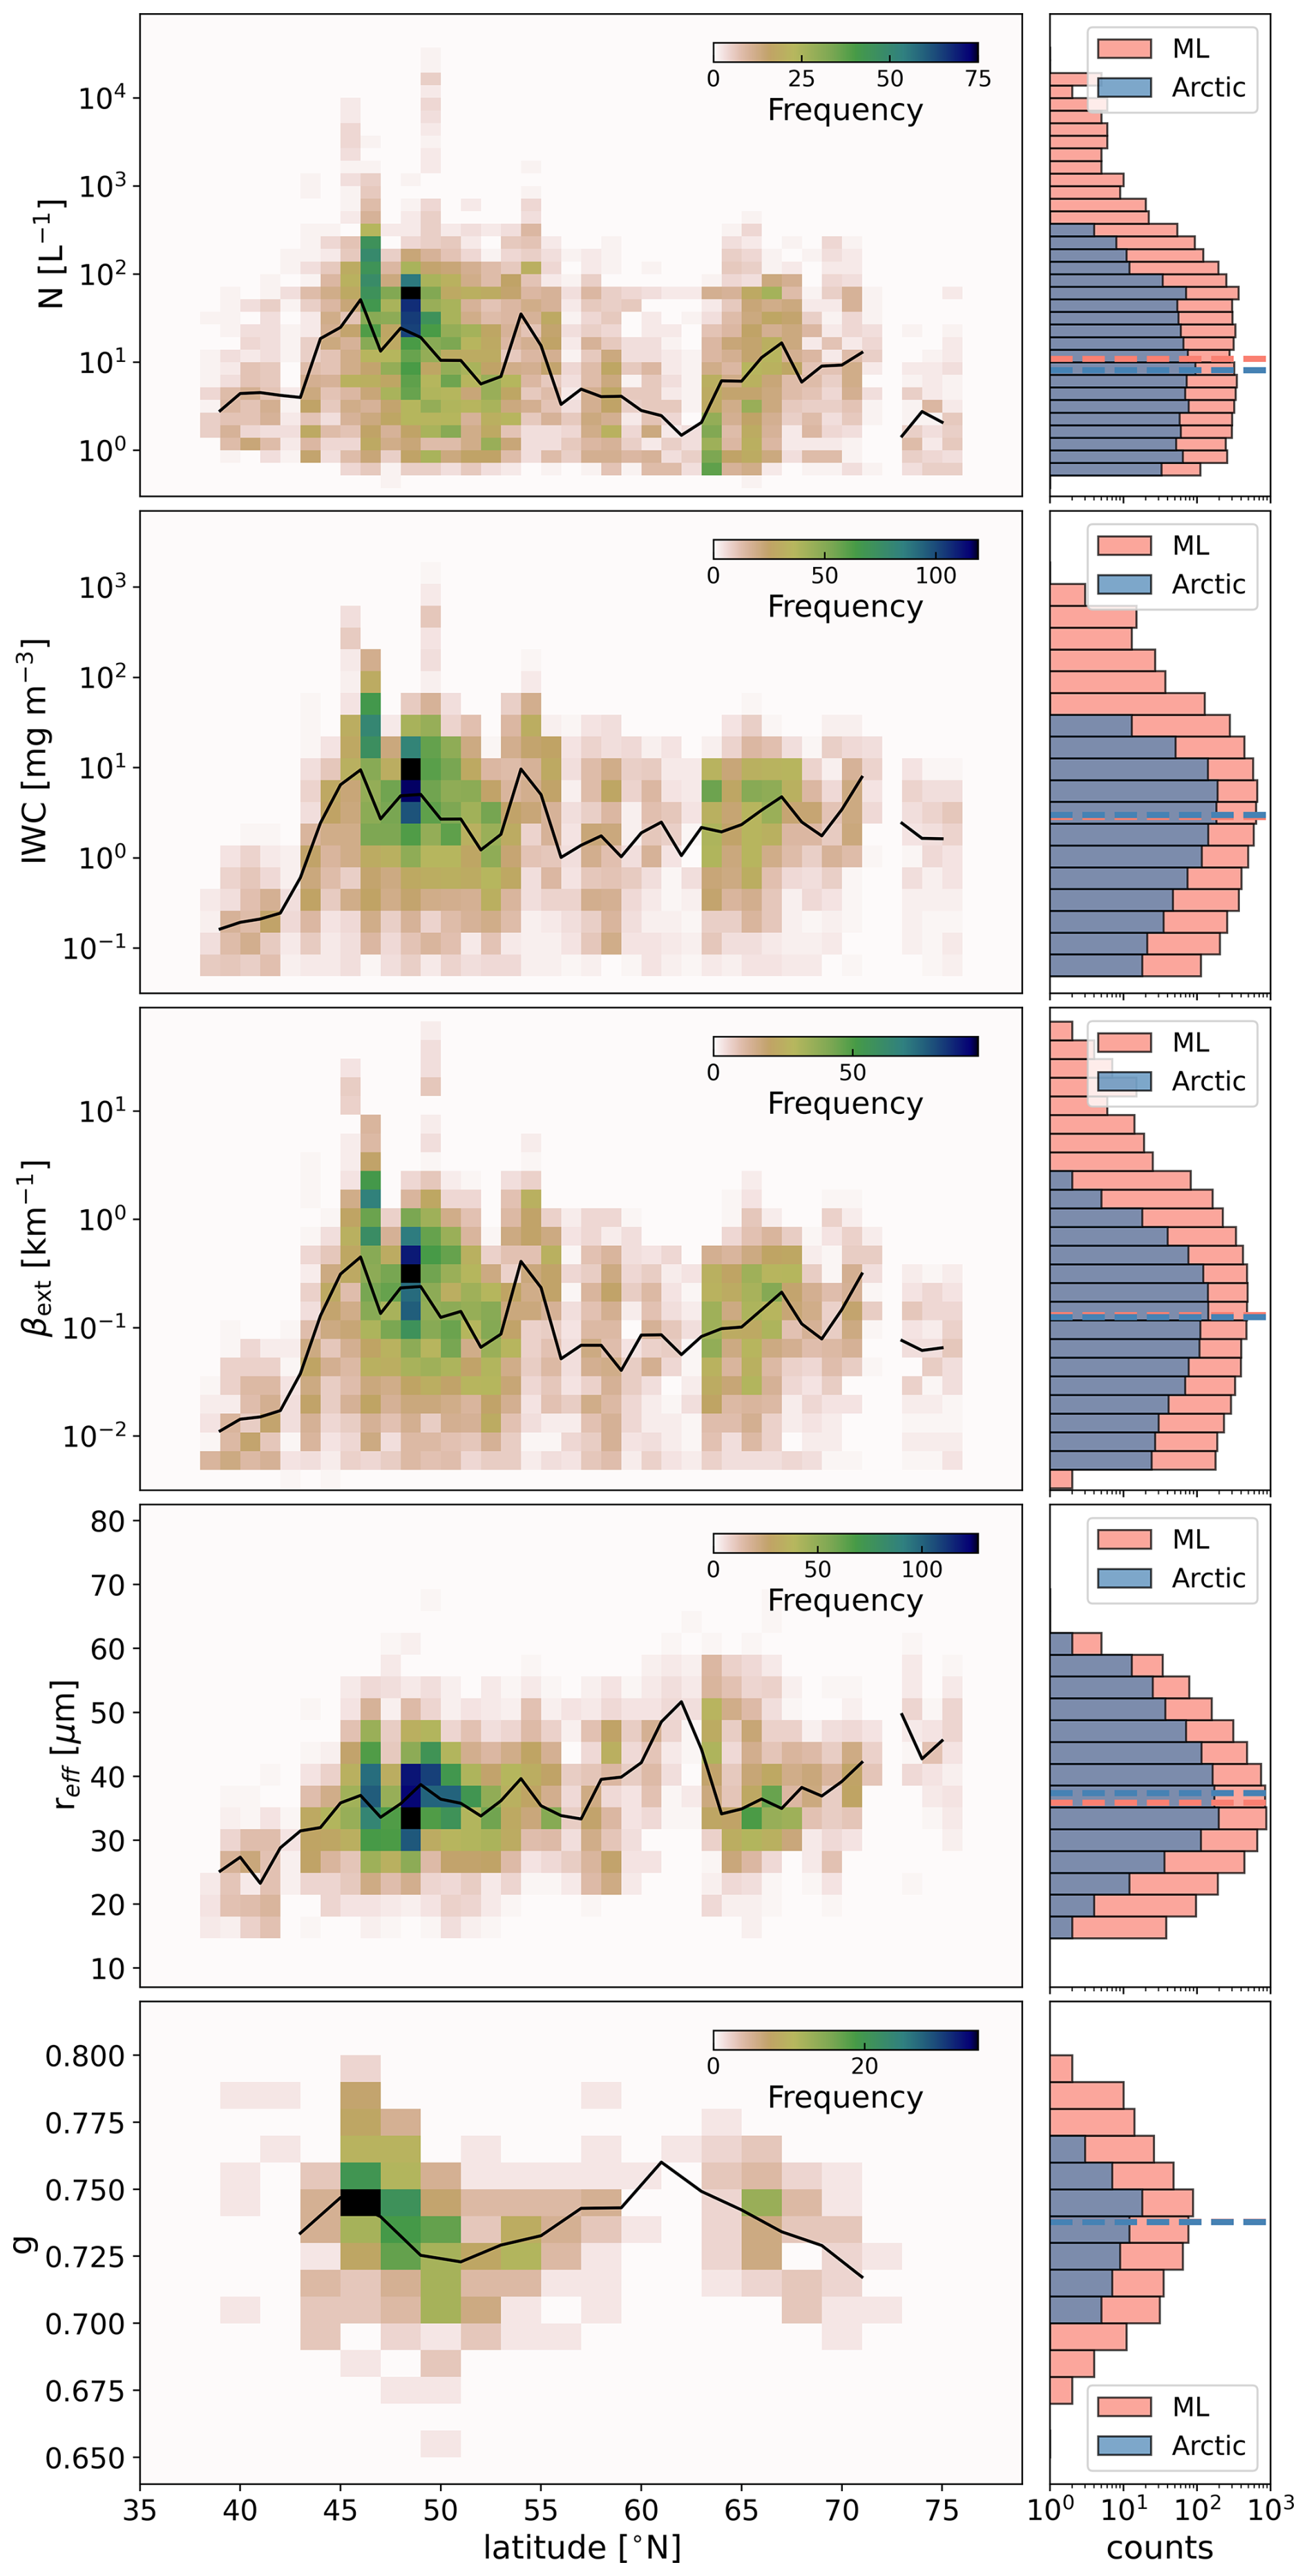
Figure 6Frequency distribution of total concentration (N), ice water content (IWC), extinction coefficient (βext), effective radius (reff) and asymmetry parameter (g) observations from the PHIPS as a function of latitude. Microphysical observations are 10 s average values and asymmetry parameter is retrieved for only particles with stereo-images where shattering artefacts are excluded. The black solid lines mark the median line. Latitude bin widths are 1° for microphysical observations and 2° for the asymmetry parameter observations. The histograms show the distribution of the values for all mid-latitude (ML) and Arctic cases using a latitude threshold of 65° N. The dashed line over the histograms indicate the median value.
The median total concentration of ice crystals in the 15–700 µm size range varied between 1–52 L−1 and showed no clear latitudinal trend. However, slightly higher overall median values were observed in mid-latitude cirrus (11 L−1) compared to Arctic cirrus (8 L−1) (Table 1). Mean values differed more noticeably, with 120 L−1 in the mid-latitudes and 8 L−1 in the Arctic. This difference was primarily driven by occasional high concentrations exceeding 100 L−1 in the mid-latitude dataset, which were not observed in the Arctic. However, these elevated concentrations are likely influenced by particle shattering effects.
Table 1Summary statistics (median, mean, and percentiles) of microphysical and optical properties derived from PHIPS measurements in mid-latitude (ML) and Arctic cirrus clouds. Shown are total number concentration (N), ice water content (IWC), effective radius (reff), and asymmetry parameter (g). The analysis includes particles in the PHIPS measurement range of 15–700 µm.
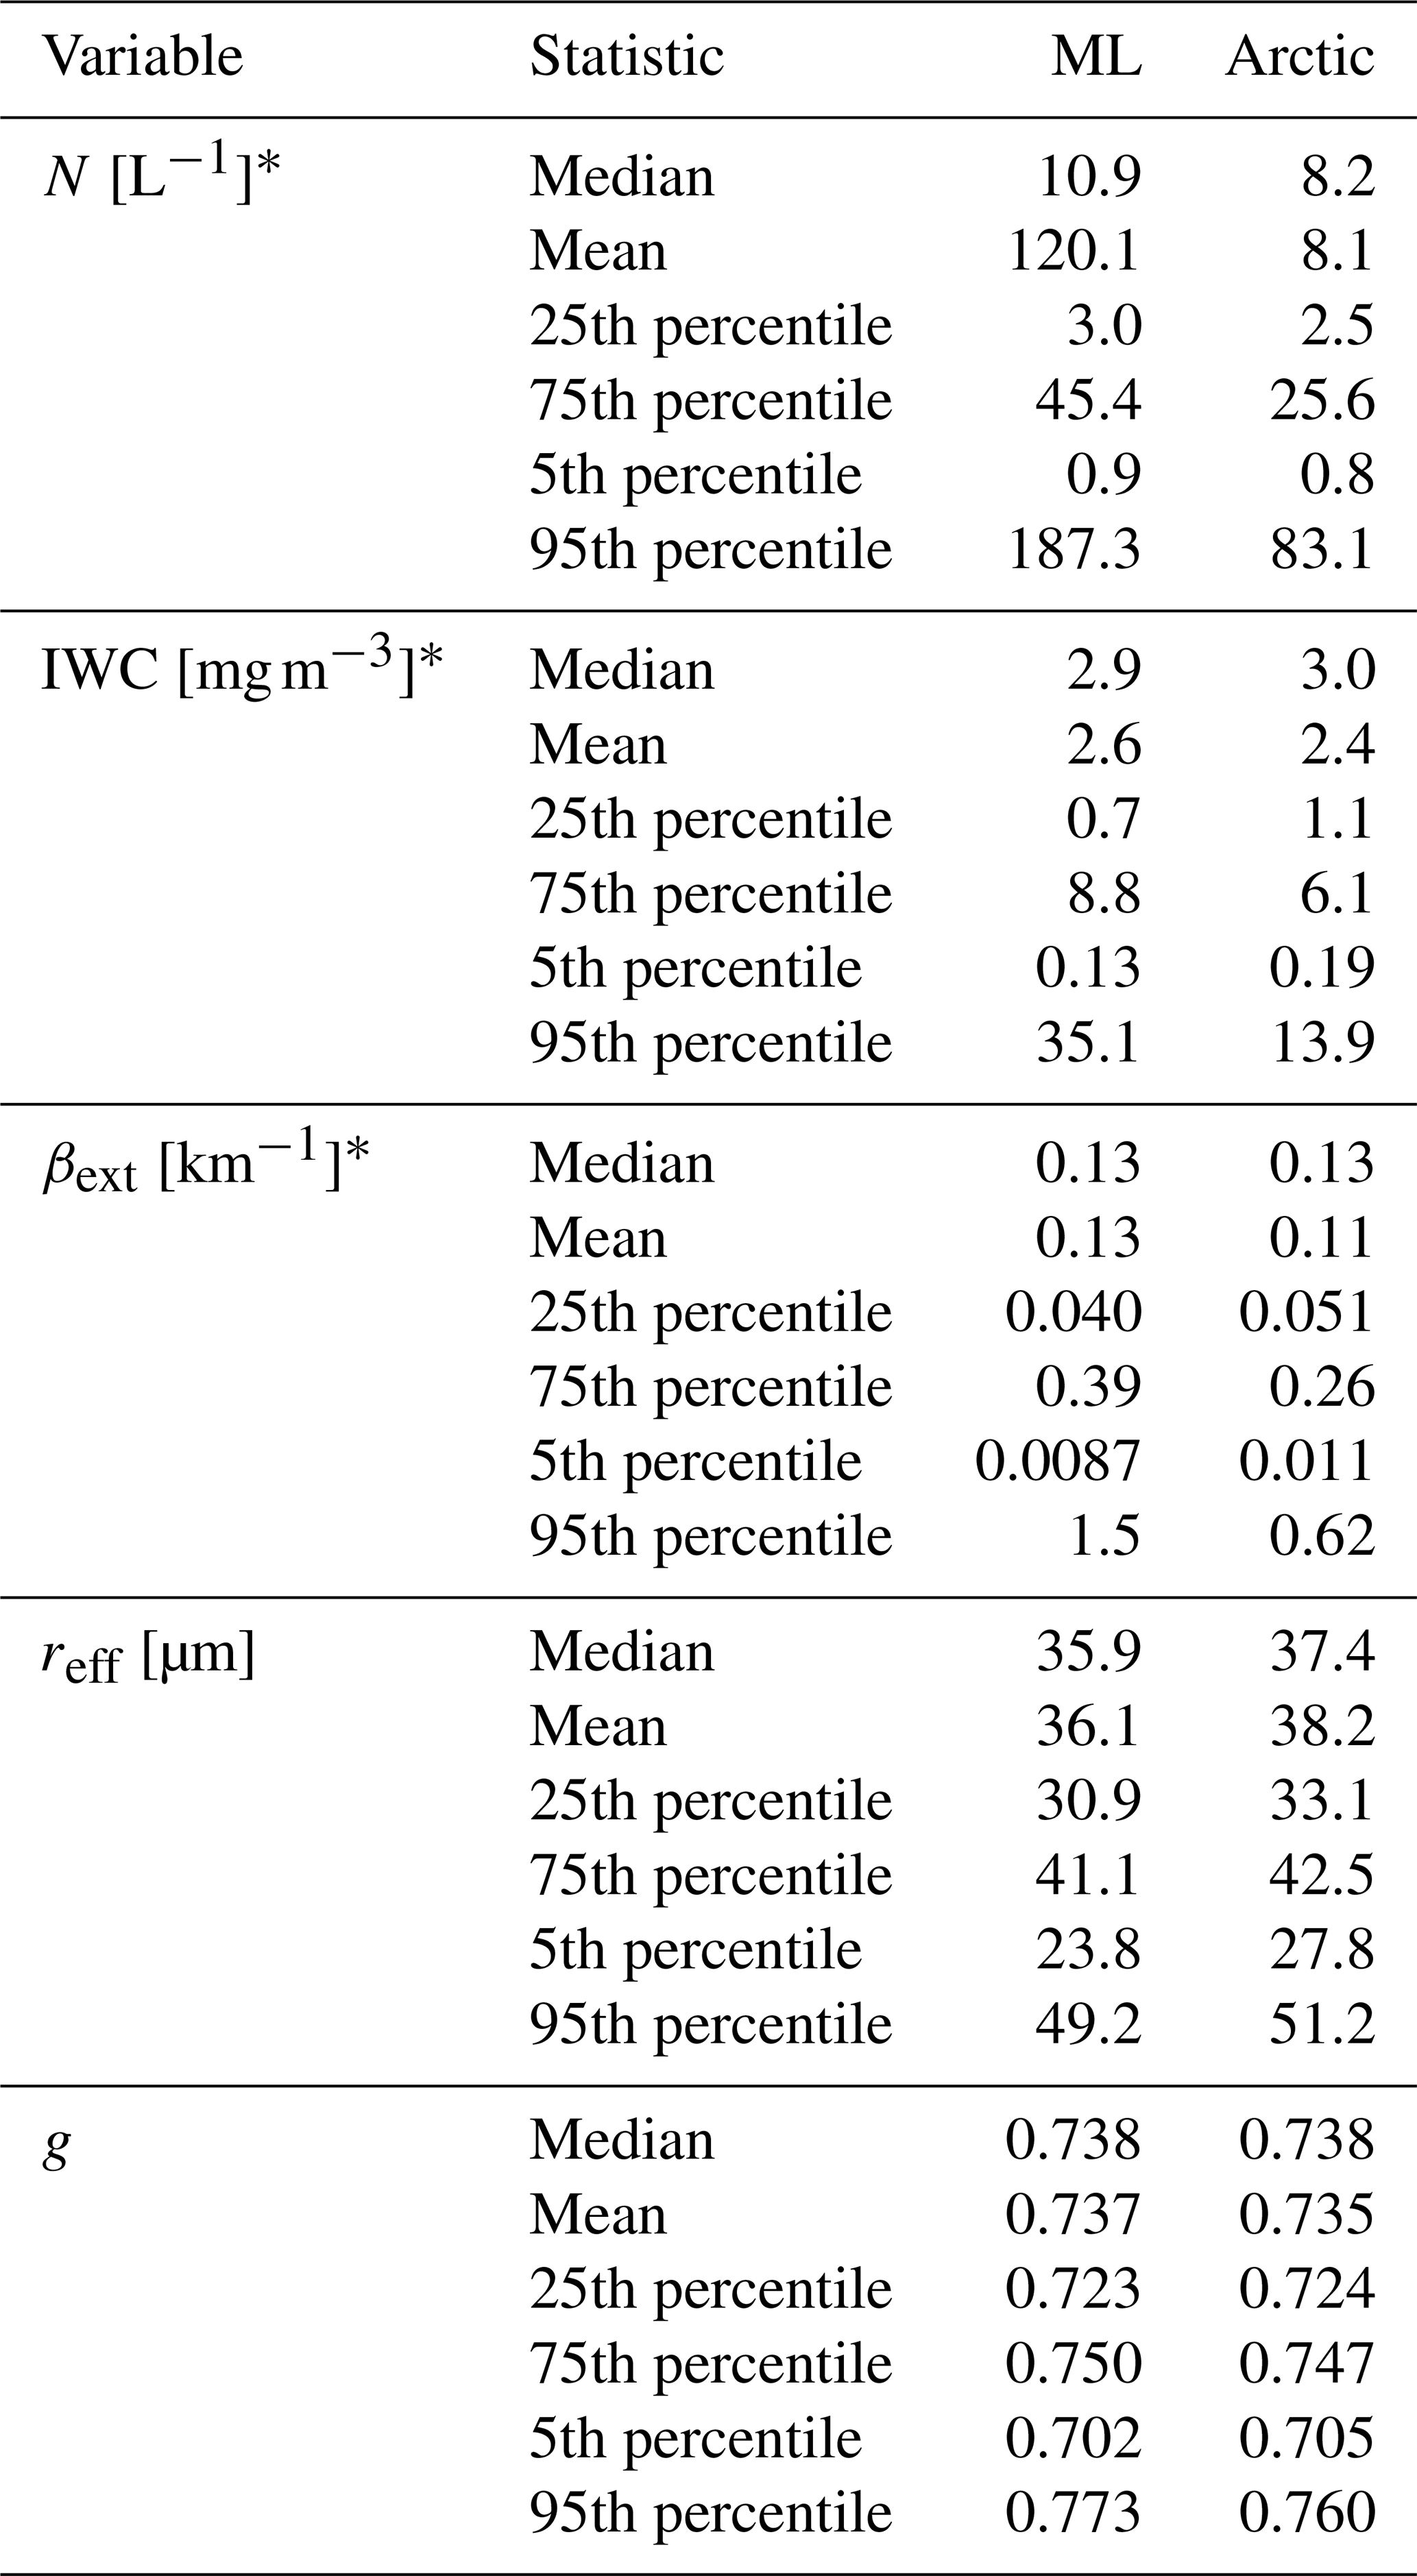
* Lower detection limits for 10 s averages are approximately 0.5 L−1 for N, 0.05 mg m−3 for IWC and 0.005 km−1 for βext.
Similar to the total ice number concentration, both the IWC and βext values did not exhibit a significant latitudinal trend between 42–75° N, where most observations were conducted. Median IWC values ranged from 0.2 to 10 mgm−3, with an overall median of 2.9 mgm−3 and 3.0 mgm−3 for mid-latitudes and Arctic cirrus, respectively. Also the mean values were similar for mid-latitude and Arctic cirrus, 2.6 and 2.4 mgm−3, respectively, which confirms that the higher number concentrations observed in the mid-latitudes are from small ice crystals that do not contribute significantly to the IWC. Median βext values ranged from 0.04 to 0.4 km−1, with the same overall median value for both mid-latitude and Arctic of 0.13 km−1.
The only microphysical parameter that shows a clear latitudinal dependence was reff, with median values increasing from approximately 24 µm within latitudes from 39 to 42° N to 45 µm within latitudes above 70° N. An exception to this trend was observed near 62° N, where median effective radii around 50 µm were recorded in a liquid-origin system sampled off the coast of Norway during the double flight F18/F19. A similar trend towards higher reff values in more pristine environments was observed by Gayet et al. (2004) during the Interhemispheric Differences in Cirrus Properties From Anthropogenic Emissions (INCA) field experiments, where the average northern hemispheric effective radius (36 µm) was smaller than that observed in the Southern Hemisphere (42 µm).
In contrast to the trend in reff, g showed no systematic latitudinal variation, with median values ranging from 0.717 to 0.777. Notably, the median asymmetry parameter was identical in both regions (0.738) indicating a remarkable similarity in the bulk optical scattering characteristics.
The mid-latitude cases covered a broader range of cirrus conditions, while Arctic sampling was limited to five predominantly liquid-origin cirrus systems north of 65° N. Due to pandemic-related base relocation to Germany, Arctic flights required long transits and thus targeted synoptic cirrus with predictable development: a warm frontal cirrus (F05), two liquid-origin systems (F08/F09), a jet-stream-associated liquid-origin cirrus (F10/F11), and a mix of liquid-origin and in-situ cirrus over Iceland (F13/F14, Fig. 1). This focus introduces a bias toward liquid-origin cirrus, which have been shown to exhibit higher IWC compared to in situ-formed cirrus (Luebke et al., 2016). This sampling bias should be taken into account when interpreting observed latitudinal trends in cirrus microphysical and optical properties.
To better account for thermodynamic influences on cirrus properties, it is useful to examine the observations as a function of in-cloud temperature rather than geographic location. Figure 7 shows the statistical distribution of N, IWC, βext, reff, and g, comparing mid-latitude (red) and Arctic (blue) observations. Median N was observed to be higher in the mid-latitudes for temperatures down to approximately −55 °C. At colder temperatures, Arctic values become comparable to, or even exceed, those in the mid-latitudes. However, the observed differences are not statistically significant at the coldest temperatures below −55 °C and between −44 and −48 °C (two-sample t test, p>0.05).
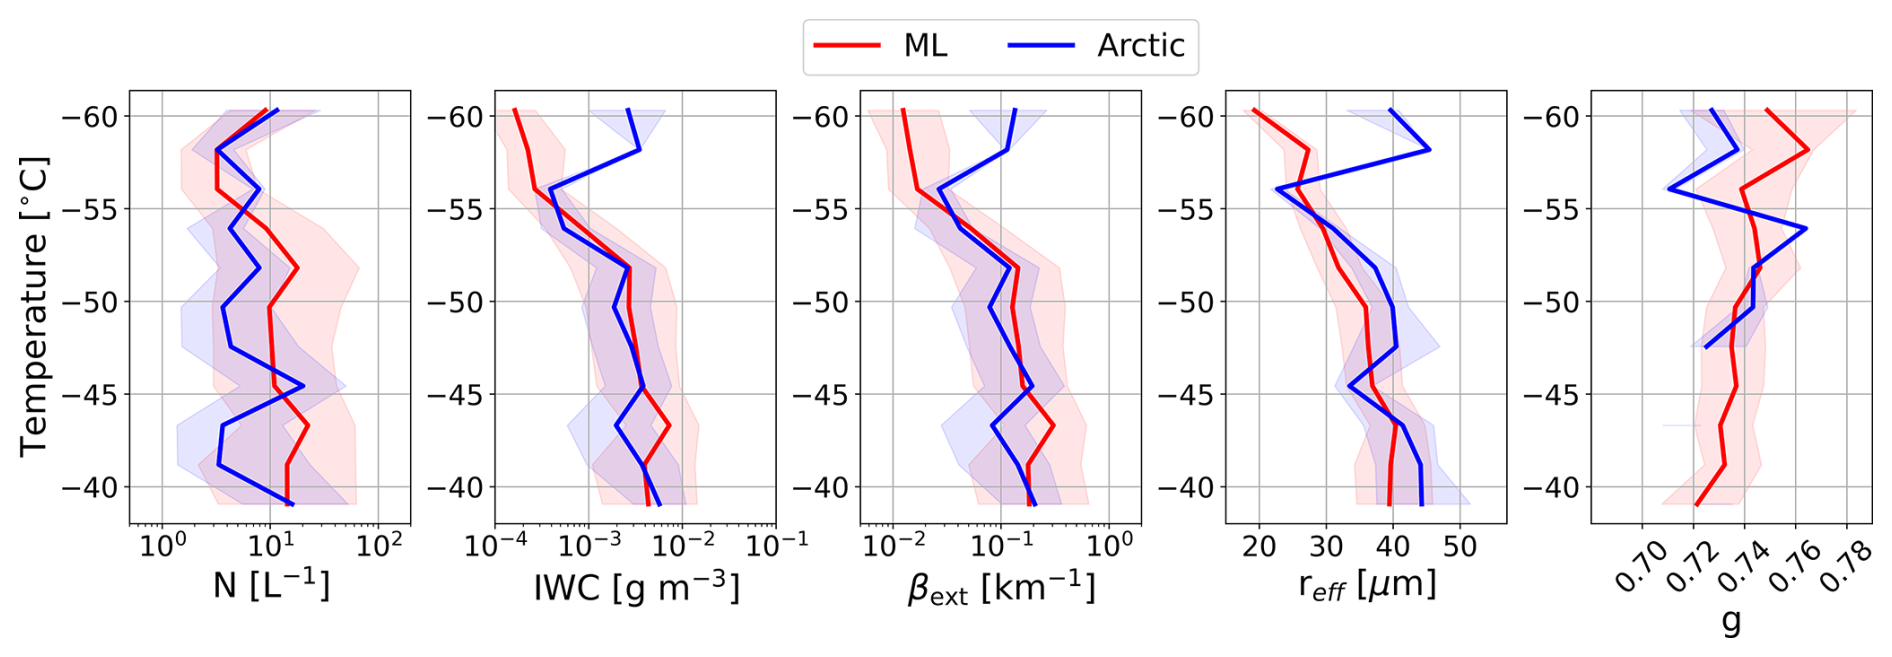
Figure 7Statistical analysis of the observed total number concentration (N), ice water content (IWC), extinction coefficient (βext), effective radius (reff), and asymmetry parameter (g) as a function of in-cloud temperature in degree Celsius. The solid line shows the median values and the shaded area the interquartile range for mid-latitude (ML; red) and Arctic (blue) observations using a latitude threshold of 65°.
Both IWC and βext values were generally similar in both regions at temperatures above −55 °C and showed a decreasing trend with decreasing temperature. At colder temperatures values observed in Arctic cirrus exceeded those observed in mid-latitude, however, due to the limited number of observations this difference is not statistically significant (p>0.05). The decreasing trend in IWC with decreasing temperature is well documented also in previous studies (Krämer et al., 2016; Jeggle et al., 2025).
The reff was mostly larger in the Arctic compared to the mid-latitudes with median values exceeding those in the mid-latitudes by 5 µm and showing a decreasing trend with temperature for temperatures down to −55 °C. At temperatures colder than −55 °C, the reff of Arctic cirrus increases again, showing up to twice as large reff. The observed differences were found to be statistically significant in the temperature ranges between −38 and −40 °C, and between −44 and −52 °C.
The asymmetry parameter showed a slight increasing trend towards colder temperatures with values around 0.72 measured at −40 °C and values between 0.75–0.76 at −60 °C observed in mid-latitudes. Lower values around 0.73 were observed in Arctic cirrus at temperatures below −55 °C, but as with the other parameters, the observed differences at colder temperatures are not statistically significant.
Inspection of Table 1 shows that the microphysical properties derived from the PHIPS instrument are in general agreement with previously reported values in the mid-latitudes and Arctic (Luebke et al., 2016; Heymsfield et al., 2017; Wolf et al., 2018). The median N values are systematically higher than those reported in the literature based on optical array probes with larger sampling volumes (Luebke et al., 2016; Heymsfield et al., 2017; De La Torre Castro et al., 2023). This discrepancy arises because low concentrations, below approximately 0.5 L−1, are not detected with PHIPS within the 10 s averaging period. Values of N and IWC obtained from optical array probe measurements during the CIRRUS-HL campaign are discussed in detail by De La Torre Castro et al. (2023) and Jurkat-Witschas et al. (2025). Furthermore, the observed reff in both regions are significantly lower than the values reported by De La Torre Castro et al. (2023) for the same study. This discrepancy is most likely due to their assumption of a simplified spherical ice particle shape to derive this quantity from the measured particle size distribution.
3.3 Sensitivity of g to ice microphysical and environmental factors
To assess how g varies with environmental conditions and ice microphysics, we analysed coincident measurements of in-cloud temperature, relative humidity over ice (RHi), and particle-resolved microphysical properties from PHIPS. The analysis was performed over the same averaging windows used for the g retrievals, each comprising 50 consecutive intact ice crystals. These correspond to averaging times of 44 s to 4 min (25th–75th percentile) and sampled air volumes of approximately 3–20 L.
Table 2 summarises the Pearson correlation coefficients between g and the investigated parameters. Among the tested parameters, the strongest correlation was observed with Deq (), followed by () and reff (), all indicating moderate negative correlations. These results suggest that g decreases with increasing particle size. Only weak correlations were found with temperature, RHi, AR, and N.
Table 2Pearson correlation coefficients (r) and p values for the relationship between g and various atmospheric and microphysical parameters. Moderate correlations are highlighted.
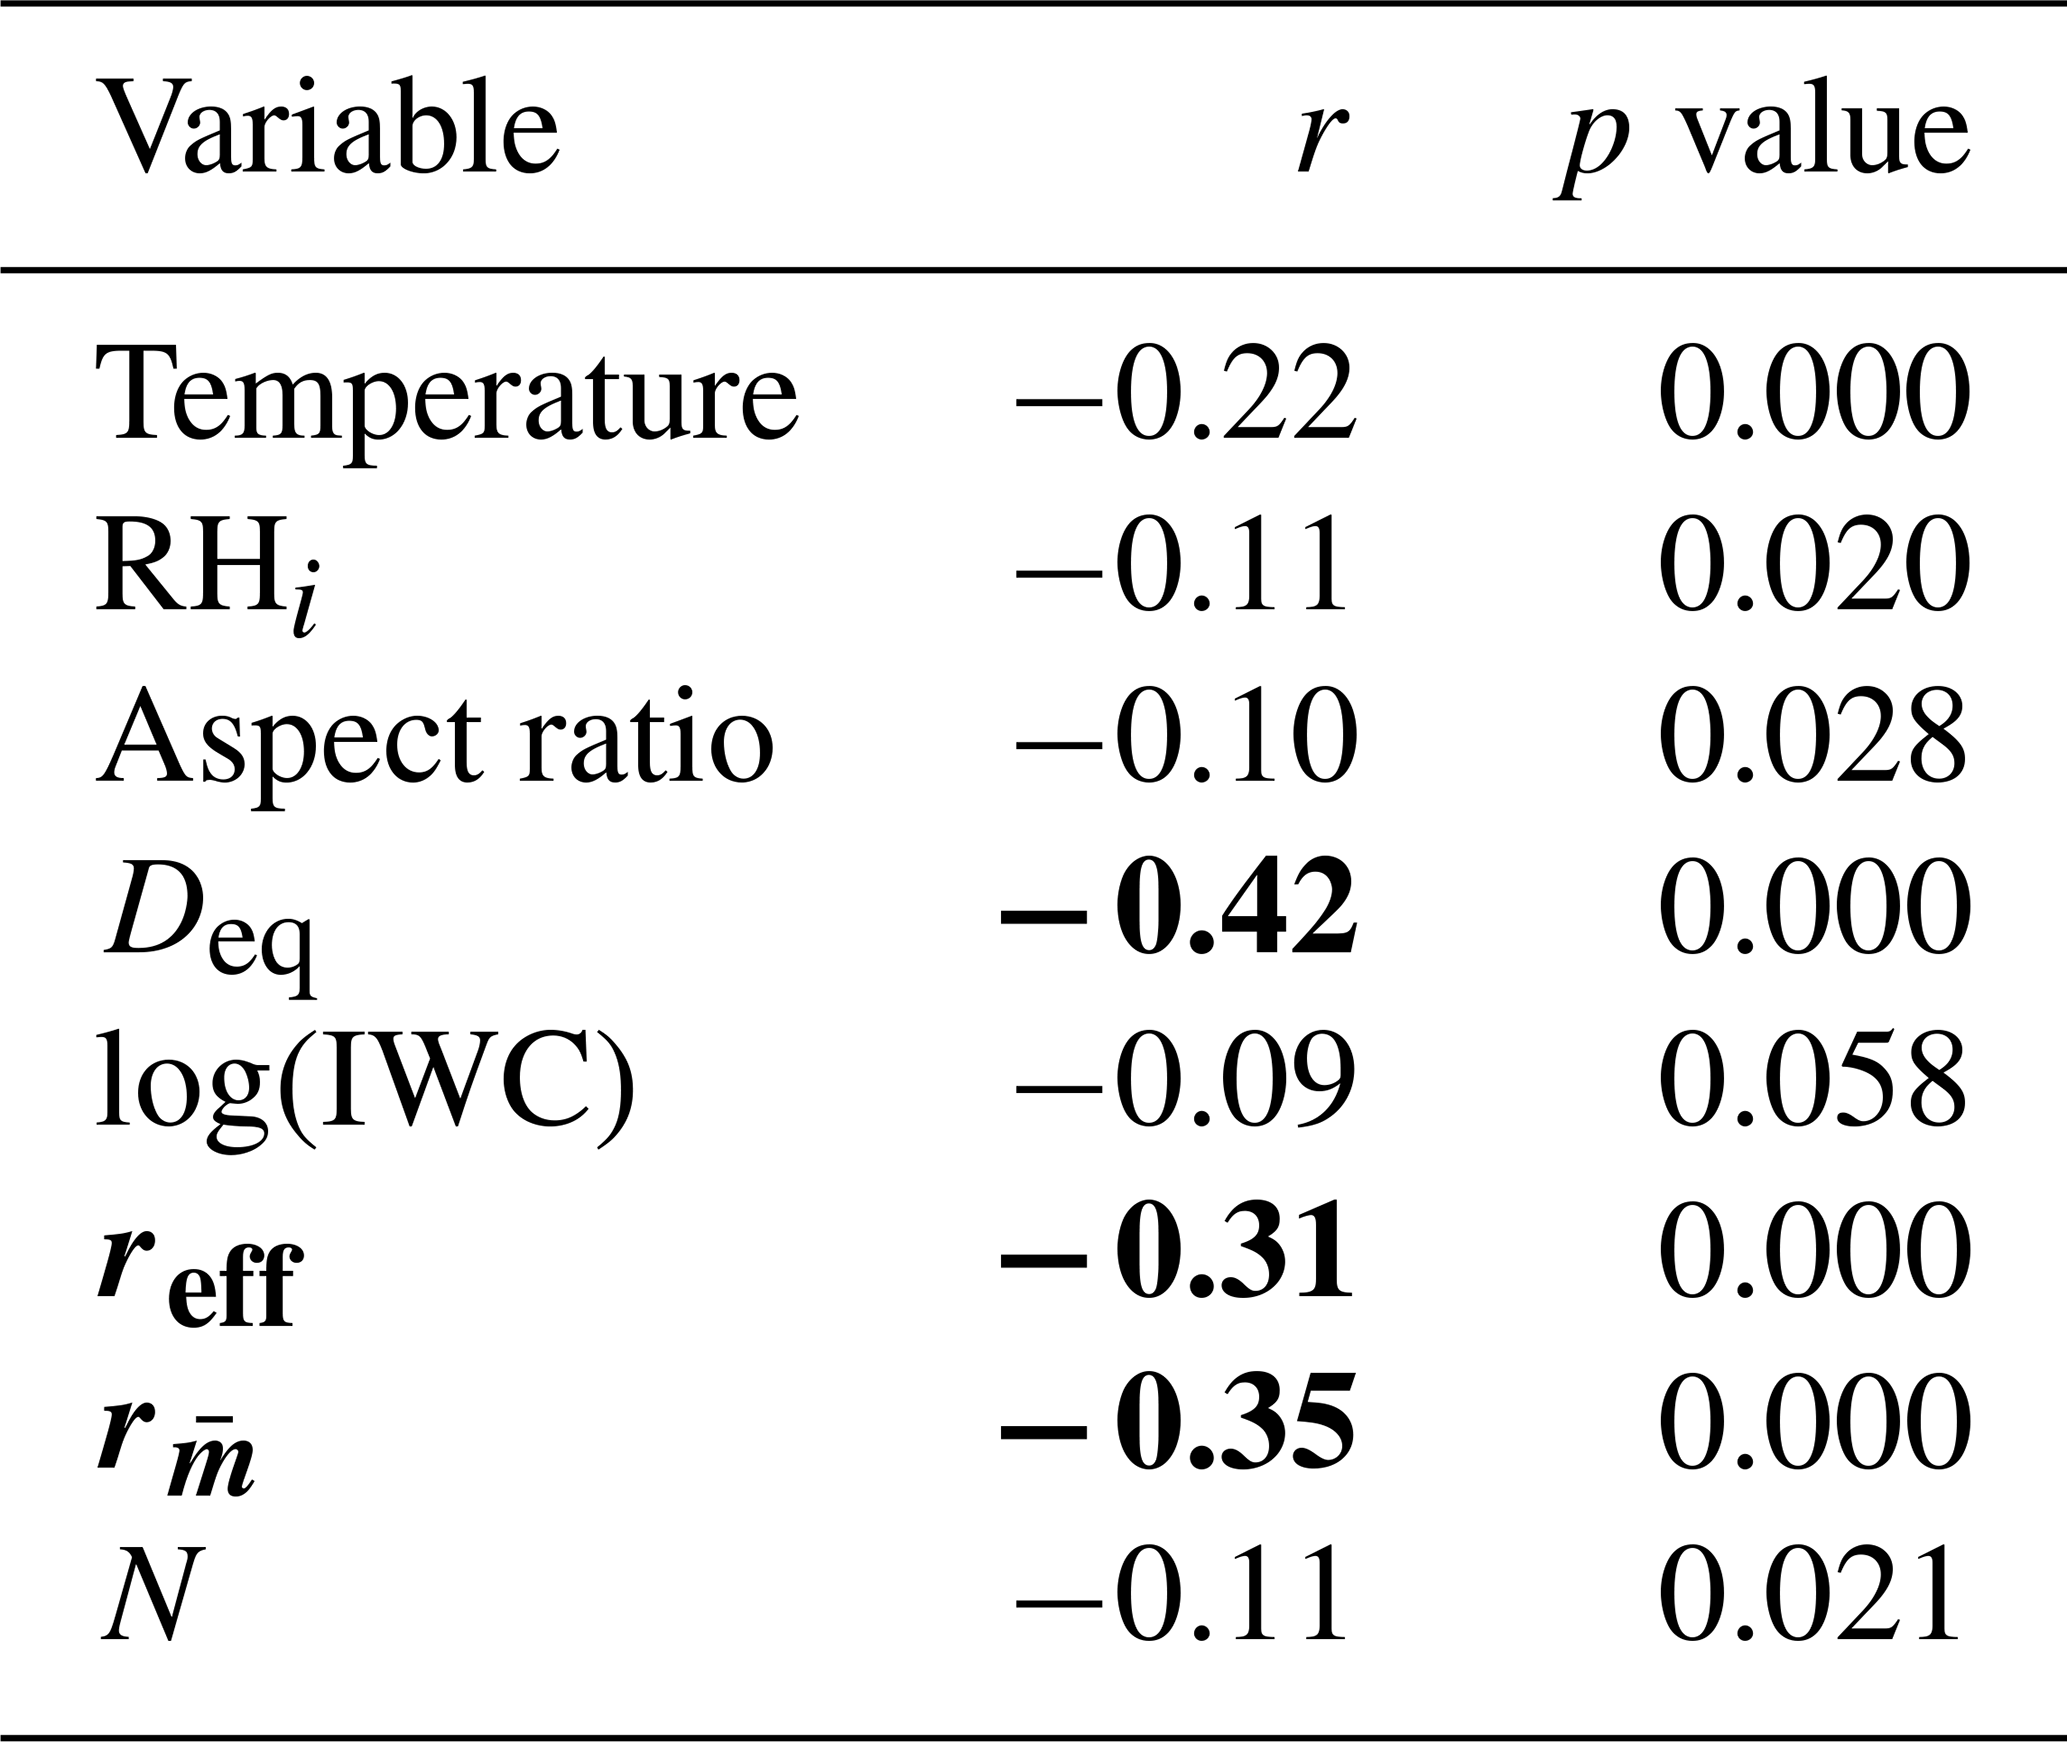
Figure 8 shows the frequency distribution of the measured g as a function of reff for ML and Arctic cirrus cases. The same figure for is shown in Fig. S15. It can be seen that g values vary between 0.65–0.79. In the ML dataset, the median g decreases from 0.749 to 0.730 with increasing reff up to approximately reff=40 µm, beyond which the trend reverses and the median g increases with particle size. However, this upward trend at larger sizes is not statistically robust due to the limited number of observations in that range. In Arctic cirrus, the data are more sparse overall, but a consistent decrease in the median g from 0.747 to 0.709 with increasing reff is observed across the measured range.
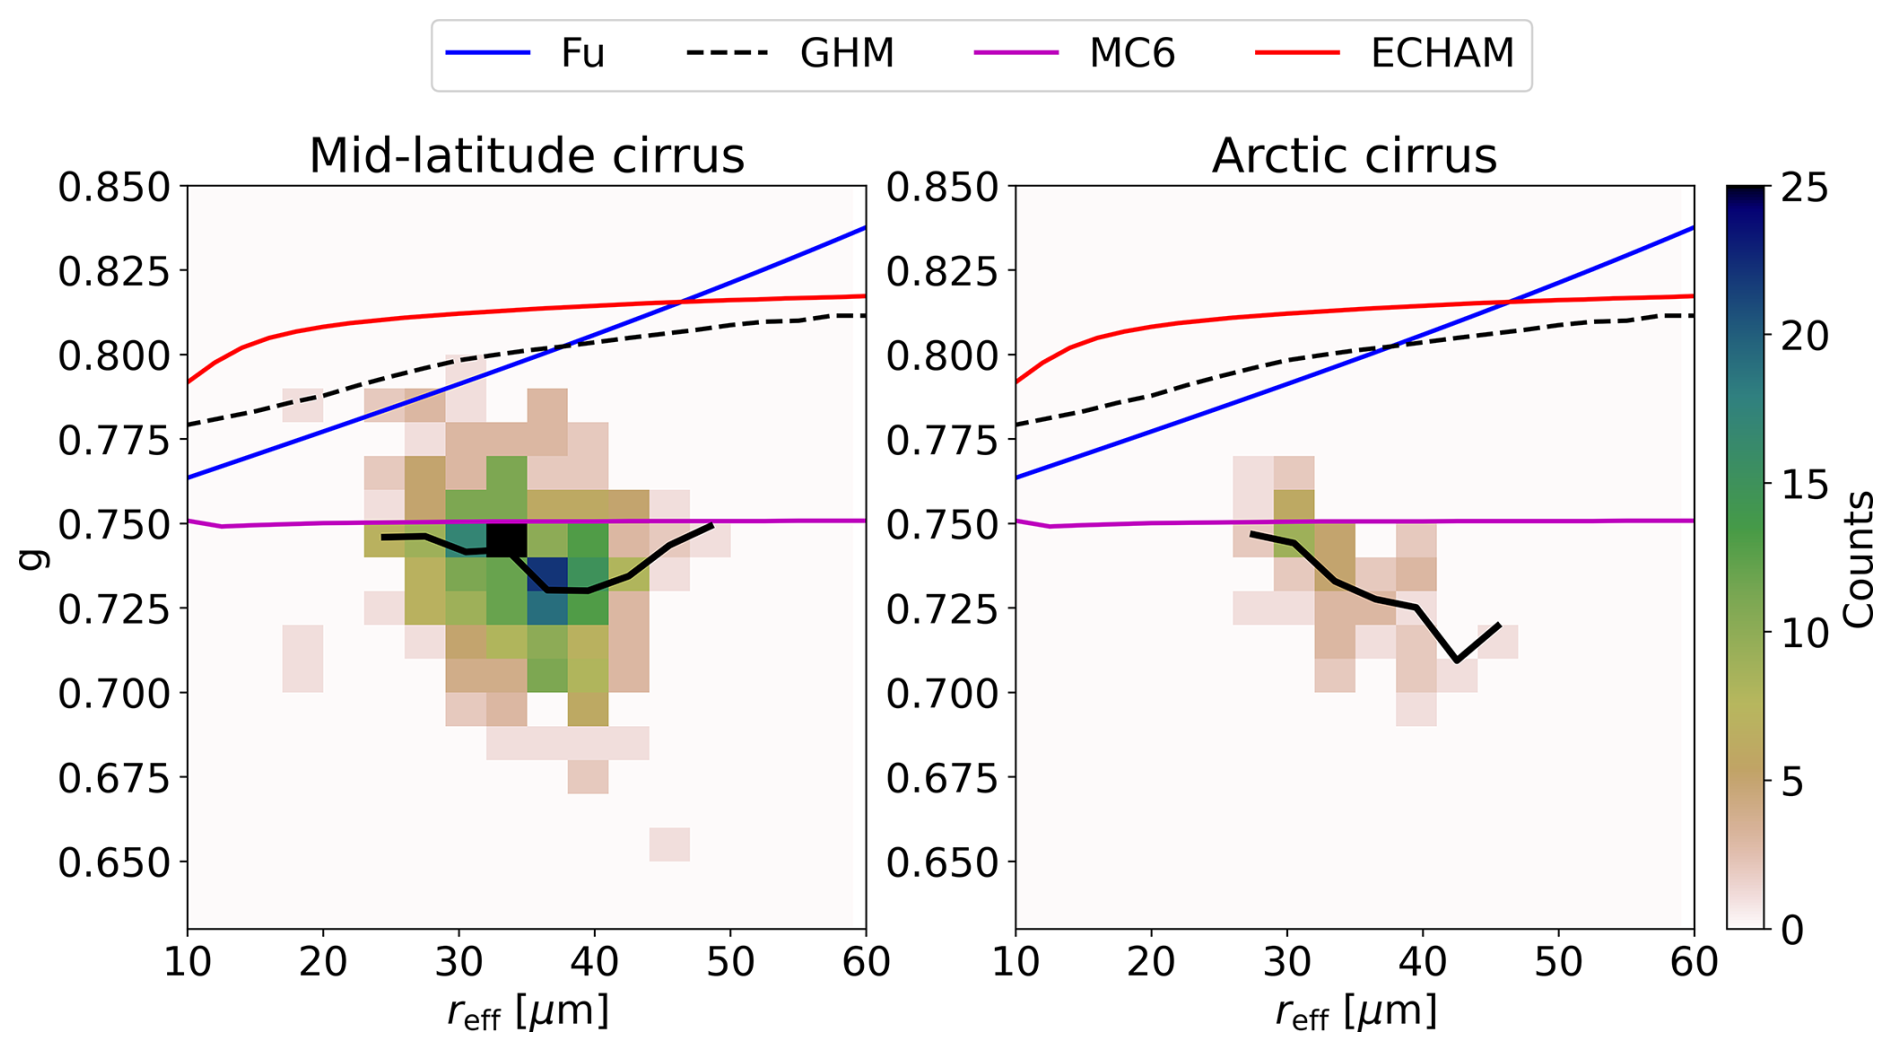
Figure 8Frequency distribution of asymmetry parameter (g) observations as a function of effective radius (reff). Both the asymmetry parameter and effective radius are retrieved only for particles with stereo-microscopic image that were not classified as shattering. The black line indicated the median value for the effective radius bins with a bin width of 3 µm. Existing short wave optical parameterisations are overlaid to the measurement data. These are the parameterisation by Fu (1996) (Fu; blue line), general habit mixture (GHM, dashed black line; Cole et al., 2013), the severely roughened column aggregate model used in MODIS Collection 6 retrievals (MC6; Platnick et al., 2016) and the optical parameterisation used in ECHAM6 general circulation model (ECHAM; Pincus and Stevens, 2013).
In radiative transfer simulations, ice optical properties are commonly parameterised as a function of reff. Figure 8 shows four commonly used parameterisations of g at a wavelength band centered at 532 nm, corresponding to the PHIPS scattering measurements. The first parameterisation, developed by Fu (1996), is based on columnar crystals with single scattering properties calculated using an improved geometric optics method. The asymmetry parameter is expressed as a function of a generalised effective size, which can be related to reff via Eq. (3.12) in Fu (1996). The second parameterisation represents the General Habit Mixture (GHM), which assumes a combination of nine crystal habits, all with severe surface roughness (σ=0.5) (Cole et al., 2013). The third is the MODIS Collection 6 (MC6) parameterisation, which represents ice particles as aggregates of severely roughened columns (Platnick et al., 2016). The fourth is the parameterisation implemented in the ECHAM6 general circulation model (Pincus and Stevens, 2013).
Among the four, only the MC6 parameterisation – assuming complex, severely roughened aggregates with a fixed asymmetry parameter of 0.75 – captures the upper range of the observed values, but does not capture the median values or the lower range. The remaining parameterisations overestimate g across the entire size range and fail to reproduce majority of the measured values. Moreover, three ou of four parameterisations predict an increasing trend in the g with increasing reff, which contrasts with the observational data showing a clear decreasing trend.
3.3.1 Analysis based on individual particle classes
A key advantage of PHIPS as a single particle polar nephelometer is its ability to directly link the microphysical and optical properties of individual ice crystals. This allows for the selection of particles with specific microphysical characteristics, such as size or aspect ratio, and enables the construction of “artificial” particle populations consisting of crystals with similar properties. This approach results in a very detailed investigation of how individual microphysical parameters influence g, isolated from the natural microphysical variability present in real cloud segments. This approach was recently used to retrieve the asymmetry parameter of bullet rosettes from PHIPS data captured during CIRRUS-HL (Wagner et al., 2025).
Figure 9 presents a statistical analysis of g for all intact ice crystals measured during CIRRUS-HL. The ice crystals were grouped based on their Deq (for bin definitions, see Waitz et al., 2021), AR (defined as the smaller of the two aspect ratios from the stereo images) using a bin width of 0.1, and simultaneously measured ice supersaturation (Sice), also using a bin width of 0.1. Each bin contains a minimum of 100 ice crystals. To retrieve g, the crystals within each bin were further divided into groups of 50 consecutive particles, and one g was calculated per group. The number of these groups is indicated in the figure. Additionally, a single g was retrieved for all crystals within each bin, with the corresponding value and uncertainty shown as markers.
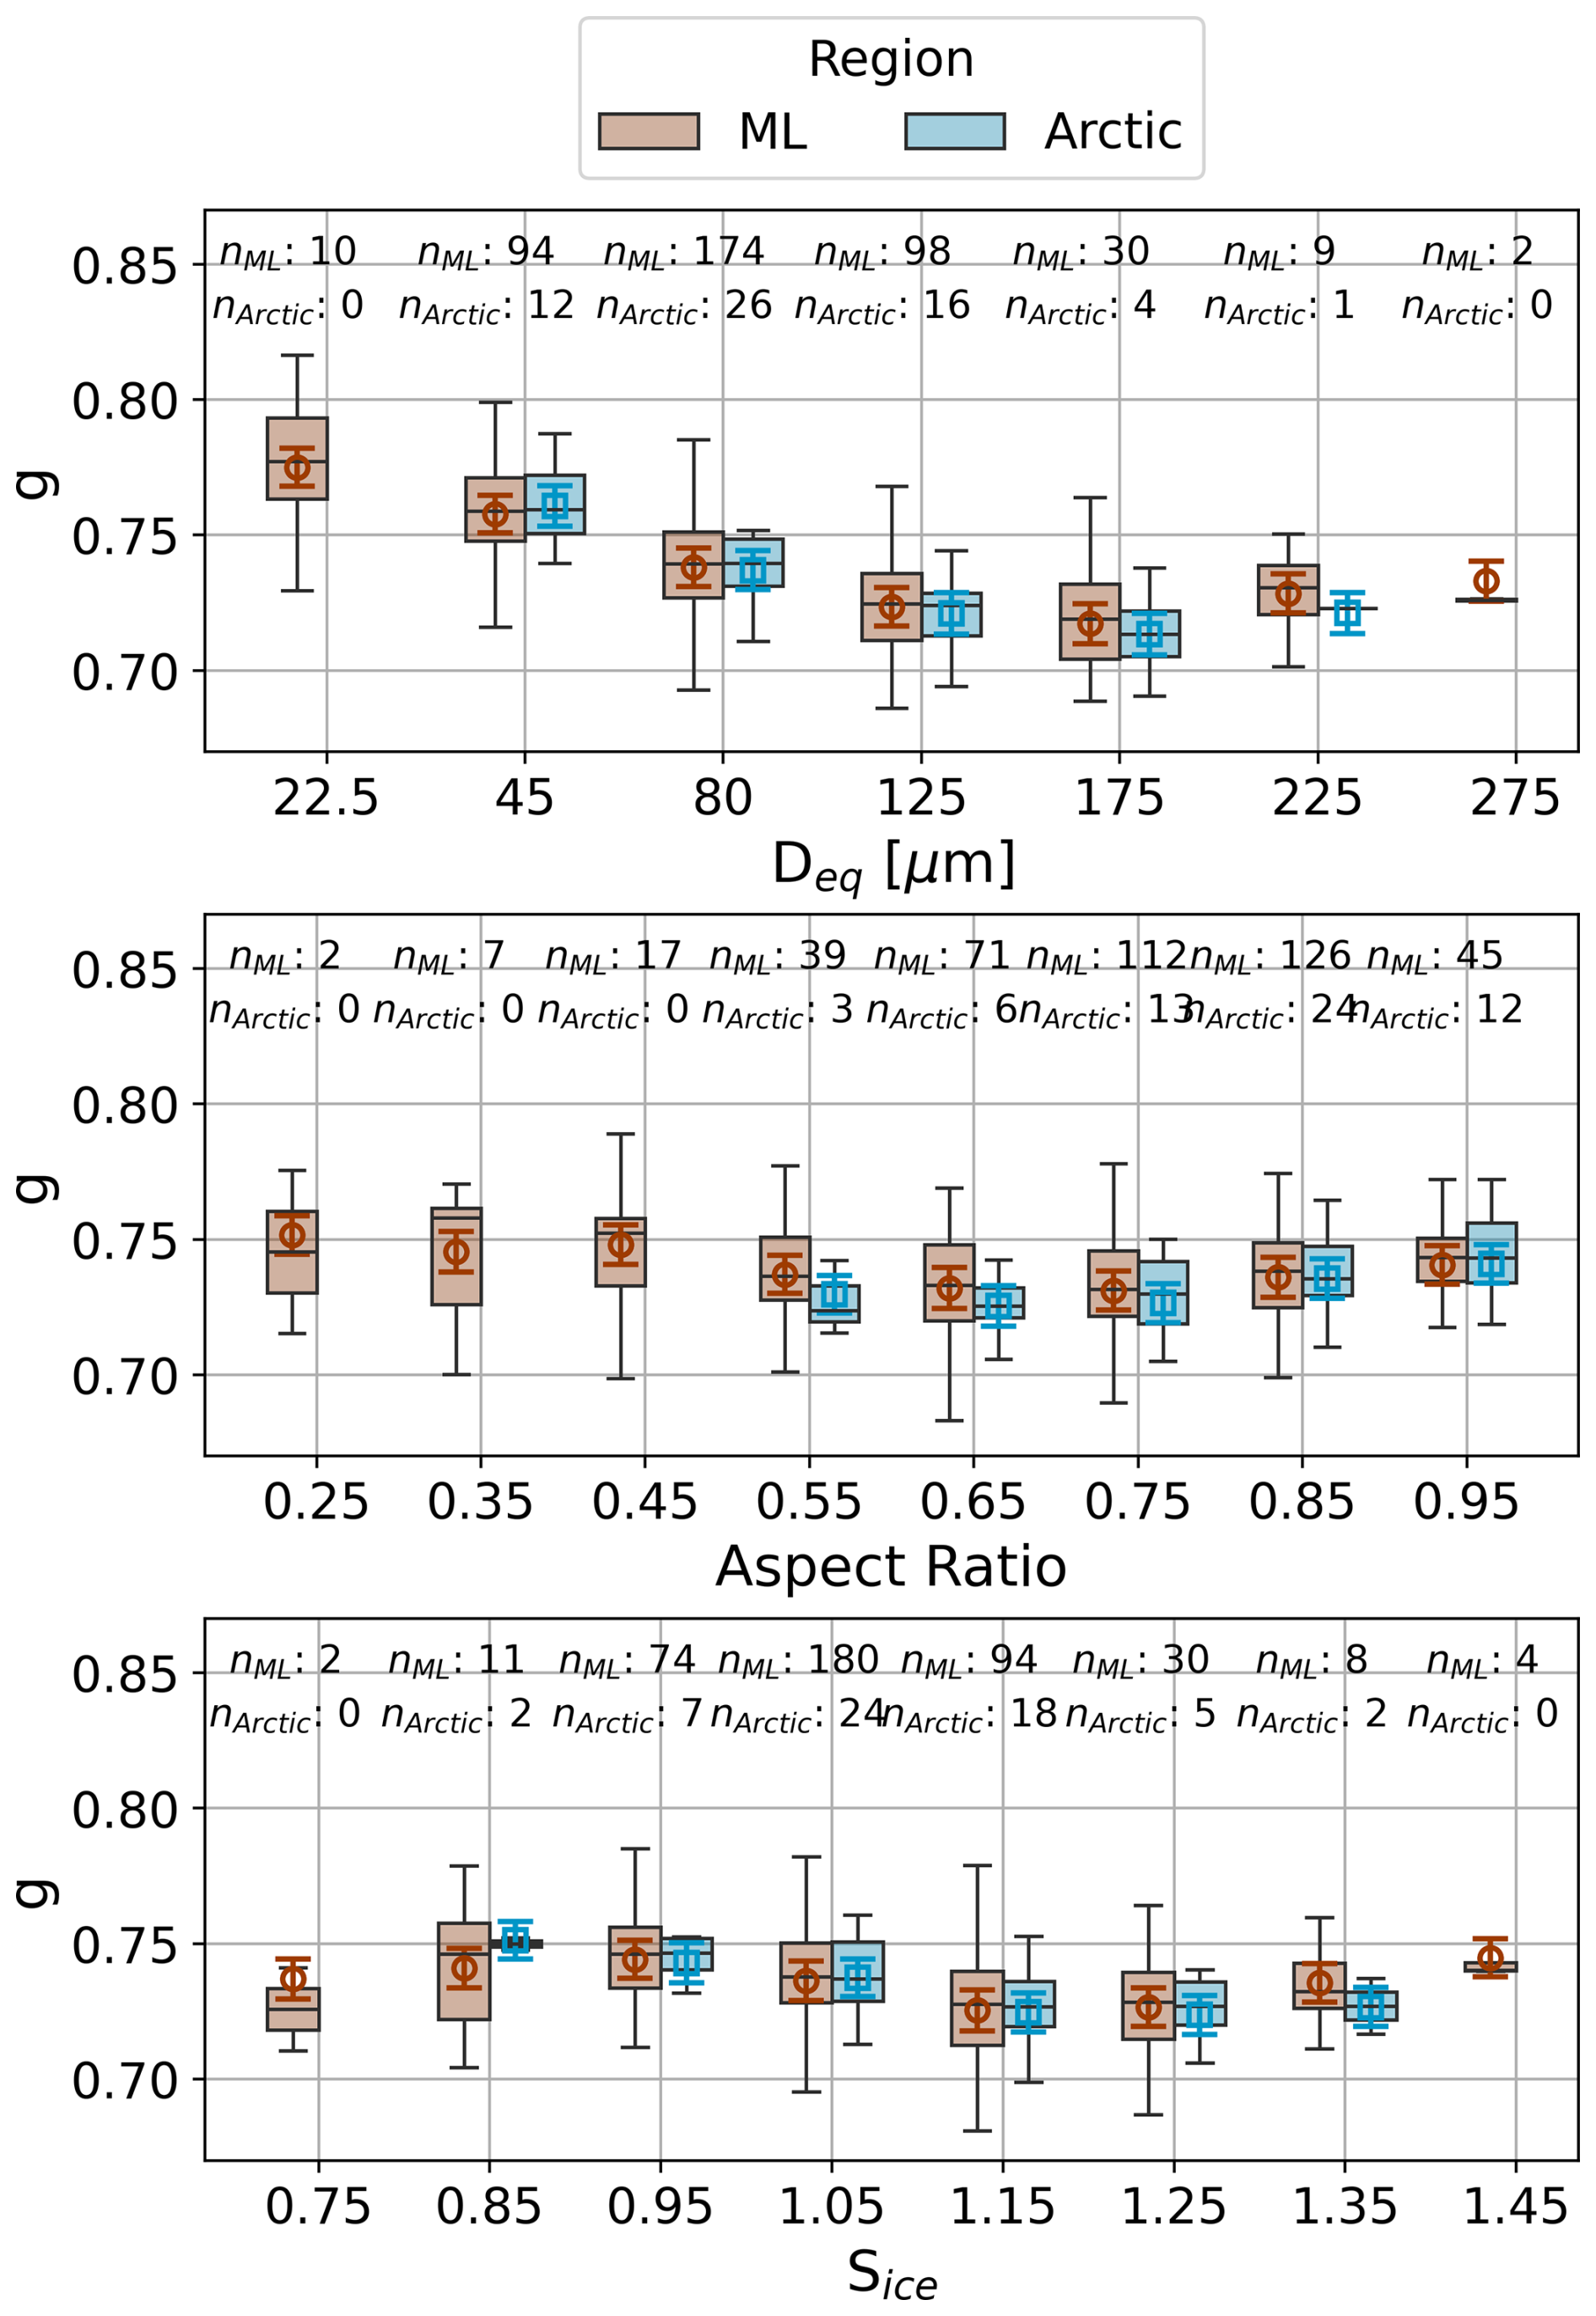
Figure 9Statistical analysis of the asymmetry parameter (g) for mid-latitude (ML) and Arctic cirrus as a function of (a) particle area equivalent diameter (Deq), (b) aspect ratio, and (c) ice supersaturation (Sice). The box indicates the 25th and 75th percentiles (quartiles), the line the 50th percentile (median) and the whiskers the 5th and 95th percentiles of the g values retrieved for samples of 50 crystals. The markers indicate the asymmetry parameter retrieval for all crystals within the bin with error bars denoting the retrieval uncertainty. Sample sizes corresponding the number of asymmetry parameter retrievals for groups of 50 particles for each category are annotated in the plots.
Among all variables considered, only Deq exhibits a clear decreasing trend with g, consistent with the cloud-scale analysis presented earlier. The highest median values (g=0.777), were measured for mid-latitude ice crystals with Deq between 15–30 µm, while the lowest median values (g=0.719) were observed for Deq between 150–200 µm. For larger particles, the g increases again, although this trend is not statistically robust due to fewer observations.
Figure 10 further examines this size dependence of g by separating the data according to ice crystal habit. The analysis was conducted for the seven most frequently occurring habit categories: aggregate, column, side plane, frozen droplet, bullet rosette, plate, and the “other” category. For each habit–size combination, a median g was retrieved for each size bin, provided that at least 50 intact crystals were available in the bin.
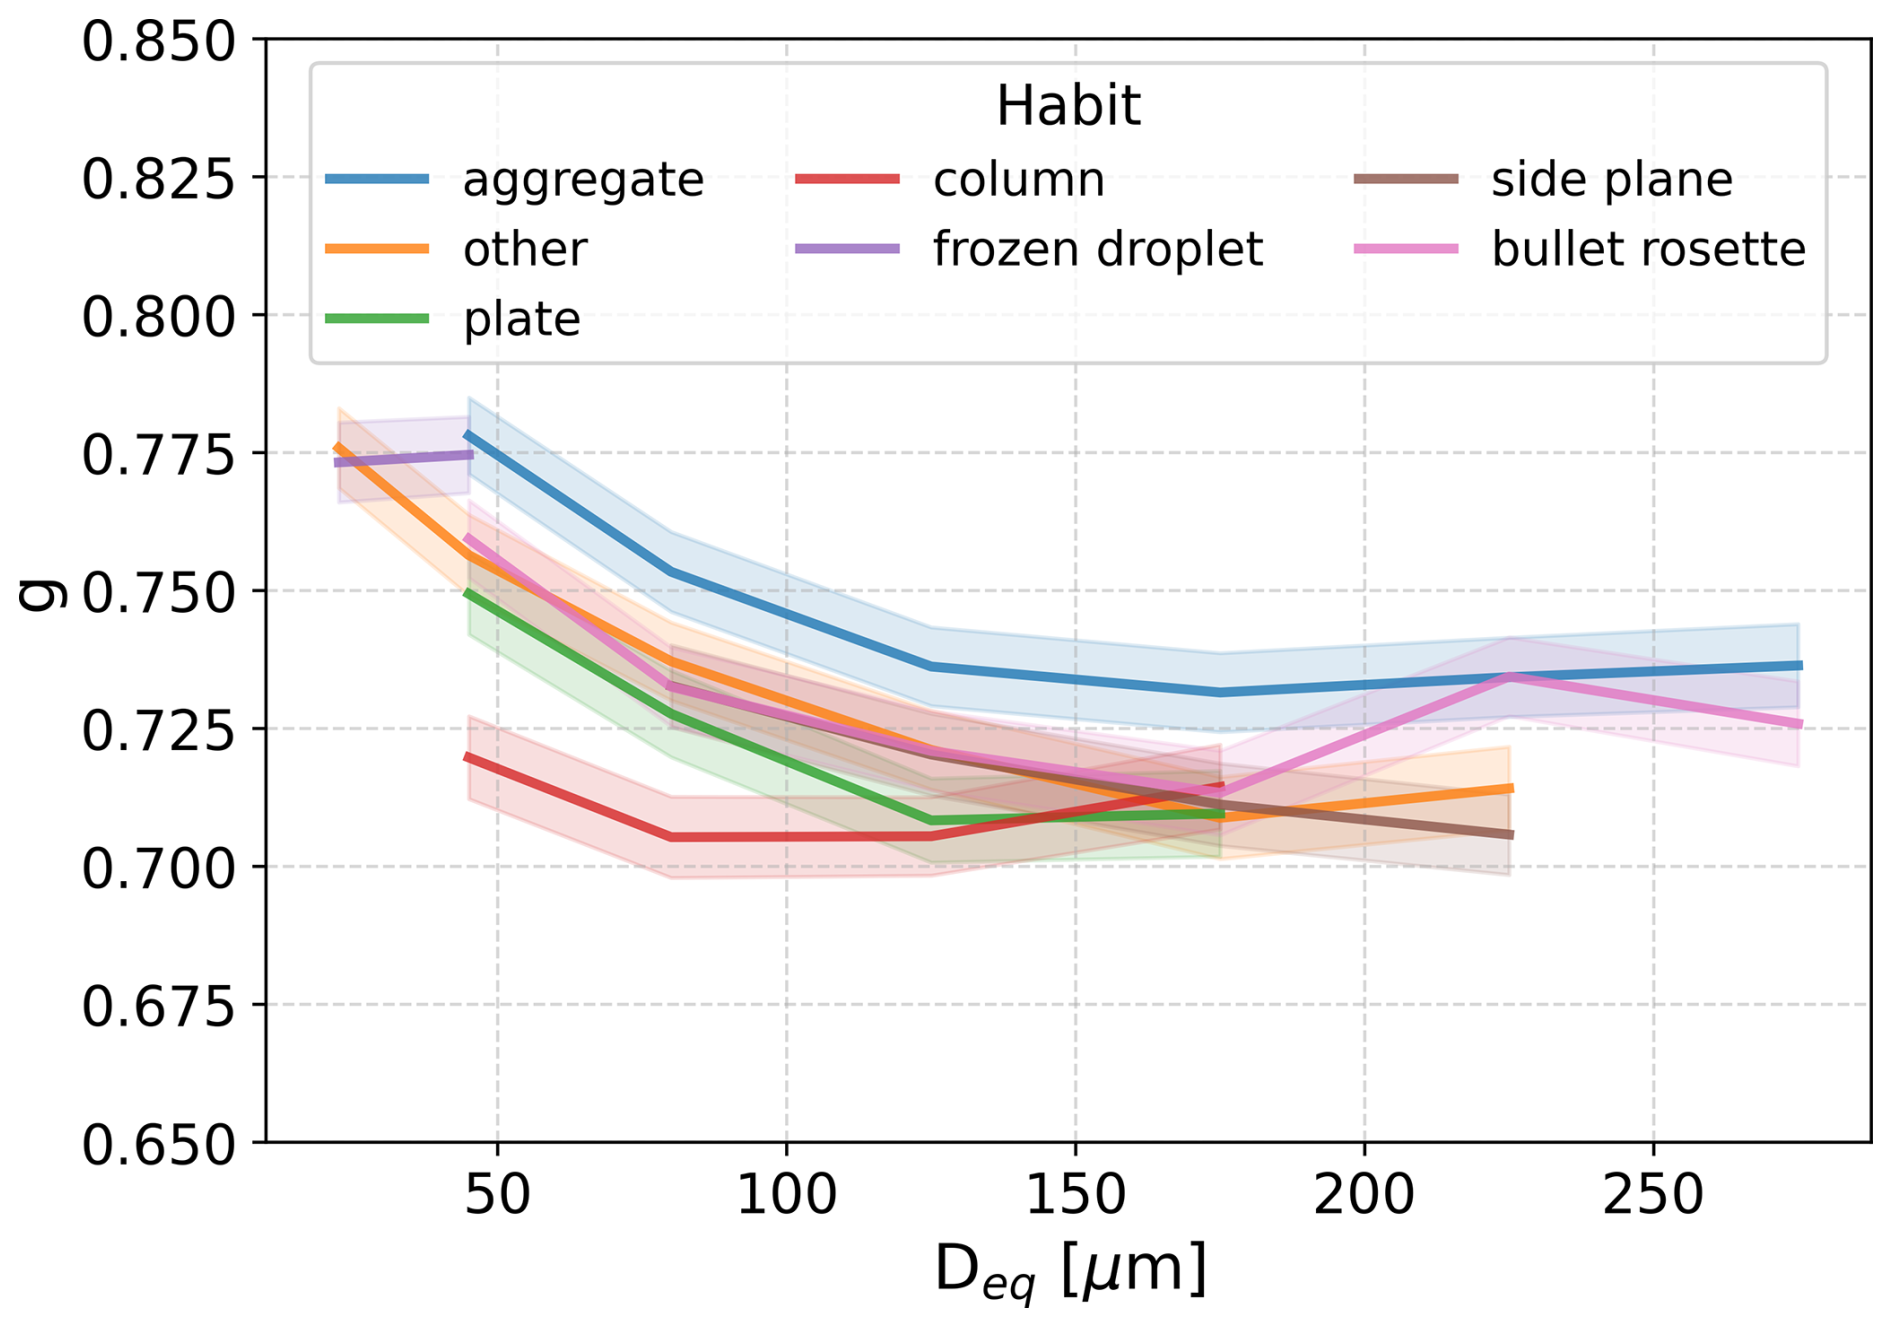
Figure 10Mean asymmetry parameter, g, as a function of particle diameter for various ice crystal habits, including aggregates, plates, columns, frozen droplets, side planes, and bullet rosettes. The shaded areas represent the retrieval uncertainty in asymmetry parameter for each habit.
The general decrease of g with increasing size is apparent across most habits, except for frozen droplets, which occur only in the smallest size bins. A maximum difference of 0.05 in g is found between columns, which show the lowest values, and aggregates, which exhibit the highest values. This difference exceeds the measurement uncertainty and is therefore considered to be significant. Side planes, bullet rosettes, plates, and crystals in the “other” category all show similar g values within the uncertainty range for sizes below 200 µm. For larger bullet rosettes, g increases and becomes comparable to that of aggregates of similar size.
No significant difference was found in the median g between mid-latitude and Arctic cirrus with median g between 0.723–0.758 observed for each AR and Sice category. In general, the variability in g was greater in the mid-latitudes across all categories (g varied between 0.686–0.816 for groups of 50 crystals) compared to the Arctic (g varied between 0.691–0.787). However, this may be partly attributed to the smaller sample size in the Arctic.
Despite differences in geographic location and the ice crystal habit distributions, no significant variation in g was observed between mid-latitude and Arctic cirrus, with consistently low median values in both environments. Similar low asymmetry parameters below 0.8 have been systematically reported by other airborne polar nephelometers in the visible spectral range. Measurements with the CIN instrument have shown g values around 0.74±0.03 for Arctic ice clouds (Gerber et al., 2000; Garrett et al., 2001) and values around 0.75±0.01 for tropical anvil cirrus (Garrett et al., 2003). In mid-latitudes, median g values between 0.769–0.79 have been measured using the PN instrument (Gayet et al., 2004, 2012; Febvre et al., 2009; Auriol et al., 2001).
Our results show that g is largely insensitive to variations in atmospheric conditions (temperature and relative humidity), as well as to most microphysical properties of ice crystals. This finding is consistent with several previous observational studies. For example, Febvre et al. (2009) reported comparable optical properties for natural cirrus and aged contrails, despite differences in their size distributions. Likewise, Garrett et al. (2001) found that g values were insensitive to habit variations in Arctic cirrus. During the INCA experiment, comparable g values were derived for the northern and Southern Hemispheres (Gayet et al., 2004, 2006), with only a weak temperature dependence noted by Gayet et al. (2006).
Here, the only parameter for which a moderate correlation with g was observed is particle size: we find that g values tend to decrease with increasing Deq, reff or . This behaviour differs from the results of Gayet et al. (2004), who reported an increase in g with effective diameter, whereas Garrett et al. (2003) observed no clear dependence between g and reff for small anvil ice crystals with reff<20 µm. Interestingly, the aspect ratio does not appear to influence g in our data, which stands in contradiction to theoretical studies predicting a strong dependence between g and AR, even for roughened crystals (Iaquinta et al., 1995; van Diedenhoven et al., 2014a).
The low median g value of 0.738 cannot be explained by pristine hexagonal shapes (Iaquinta et al., 1995; Schmitt et al., 2006). Rather, a significant degree of surface roughness or other deformations are needed in order to numerically reproduce our observations (Macke et al., 1996a; Yang et al., 2013; Wagner et al., 2025). Given that the 95th percentiles of the g distributions are 0.773 for mid-latitude and 0.760 for Arctic cirrus, we conclude that the majority of the measured ice crystals exhibit a significant degree of morphological complexity. These findings suggest that crystal complexity plays a more dominant role in determining g than any other microphysical property. The observed size dependence of g may also reflect an increasing degree of crystal complexity in larger ice particles.
In-situ measurements have reported g values above 0.8 only for a few cases. Garrett et al. (2001) documented g values of 0.81 for sublimating ice crystals at RHi around 87 %, and Gayet et al. (2012) found similar higher g values for RHi below 80 %. Febvre et al. (2009) observed g values of 0.827 for young contrails, with a mean RHi of 118 %. In our dataset, we did not observe an increase in g at lower RHi values. However, our observations included only a limited number of ice crystals at RHi below 80 %. Therefore, the effect of sublimation on g remains inconclusive and needs further investigation.
A limitation of this study is that g retrievals were restricted to ice crystals with Deq below 300 µm. This constraint arises because larger particles frequently saturated the first few measurement channels of our polar nephelometer, preventing a reliable retrieval of g. However, as shown in the particle size and area distributions in Fig. 2 and the cumulative distributions in Fig. S4, ice crystals smaller than 300 µm account for 97 % (99 %) of the total number and 83 % (94 %) of the total cross-sectional area in mid-latitude (Arctic) cirrus. Based on this, we consider our retrieved g values to be representative of the cirrus cloud populations sampled during the CIRRUS-HL campaign.
Our results show a substantial discrepancy between the parameterisations of g used in climate models and the values measured in this study (see Fig. 8). This difference has significant implications for inferred cloud reflectivity or albedo, which can be demonstrated using a simple approximation of the plane albedo for thin cirrus clouds (Meador and Weaver, 1980)
where ω0 is the single-scattering albedo, μ0 is the cosine of the solar zenith angle, and τ is the optical thickness. For constant optical thickness and solar zenith angle, the plane albedo is directly proportional to 1−g. Therefore, a decrease of g from 0.8 to the measured 0.738 corresponds to an increase in albedo of approximately 31 %, making cirrus clouds more reflective at solar wavelengths. This indicates that an overestimation of g can lead to a significant bias in the estimation of the radiative effect of cirrus clouds. Additionally, such an overestimation can introduce errors in the retrieval of cirrus optical depth from space-borne radiance measurements (Yang et al., 2008; Yi et al., 2017a).
Studies using general circulation models (GCMs) or Moderate Resolution Imaging Spectroradiometer (MODIS) retrievals to simulate top-of-the-atmosphere (TOA) fluxes have shown that incorporating optical parameterisations with lower g values in the visible spectrum leads to a closer agreement between these TOA flux simulations and TOA flux estimates from direct measurements of radiances using space-borne remote sensing (Kristjánsson et al., 2000; Yi et al., 2017b). However, Ren et al. (2023) found that optical parameterisations with low g values around and below 0.75 overestimated both shortwave (SW) and longwave (LW) fluxes at TOA compared to observations from the Clouds and the Earth's Radiant Energy System (CERES). Their study emphasised the need for further optimisation of the scattering phase function to achieve radiative closure. Yi et al. (2017b) also showed that lowering g (by changing the optical parameterisation from MC5 to MC6) significantly reduced the estimated TOA SW flux from MODIS observations. This reduction resulted from lower cloud optical thickness retrieved by the MC6 model, which was subsequently used as input to the radiative transfer simulations (Yi et al., 2017a).
Currently, cirrus and ice containing ice clouds have been estimated to exert a globally and annually averaged net warming effect of 2–5 W m−2 (Hong et al., 2016; Yi et al., 2017b; L'Ecuyer et al., 2019). Modelling studies using GCMs have shown that lowering the g values in visible from values around 0.8–0.75 will decrease the net ice CRE by 1–2 W m−2 (Järvinen et al., 2018; Yi et al., 2013; Yi, 2022). Our results suggest that an additional decrease of the g to values below 0.75 might be needed, which would lead to an even higher bias in CRE.
A potential bias in CRE estimates is highly significant in the context of the Earth's energy balance. The current estimate of the global radiative imbalance is on the order of 0.5–1 W m−2 (Loeb et al., 2021), meaning that even small biases in cirrus CRE can mask or amplify the signals of anthropogenic forcing. Cirrus clouds cover up to 30 % of the globe at any given time (Stubenrauch et al., 2013), and errors in their radiative properties can accumulate spatially and temporally, introducing systematic uncertainty into global climate models. For instance, an overestimation of the asymmetry parameter g leads to an underestimation of cirrus reflectivity, allowing more solar radiation to reach the surface. In global climate models, this can trigger dynamic feedbacks: increased surface heating may destabilize the atmosphere, enhance convection, and promote the formation of low-level clouds. In parallel, GCMs are often tuned to maintain top-of-atmosphere energy closure (Mauritsen et al., 2012). If cirrus reflectivity is systematically too low, the tuning can be made at the expense of physical realism. Improving the representation of cirrus optical properties, particularly g, is therefore essential for accurately quantifying cloud–radiation interactions and reducing uncertainty in climate projections.
We analysed ice crystal microphysical and correlated angular light scattering properties of mid-latitude and Arctic cirrus clouds using in situ measurements performed with the PHIPS airborne cloud probe during the CIRRUS-HL campaign. Ice crystal number concentration and ice water content showed no clear latitudinal trends, with similar median values of 11 L−1 and 2.8 mg m−3 for mid-latitude cirrus and 8 L−1 and 3.0 mg m−3 for Arctic cirrus. In contrast, the effective radius increased toward higher latitudes. Furthermore, clear regional differences in ice crystal habit distributions were observed: aggregates were the dominant habit in mid-latitude cirrus for crystals larger than 200 µm, while bullet and mixed rosettes dominated Arctic cirrus. Smaller crystals in both regions were primarily complex in shape and unclassifiable using standard habit categories.
Despite the differences in habits, both mid-latitude and Arctic cirrus exhibited nearly identical asymmetry parameter values, with the same median asymmetry parameter of 0.738 for both regions and observed values as low as 0.686 (1th percentile). The asymmetry parameter was largely insensitive to environmental conditions such as temperature and relative humidity, as well as to ice crystal aspect ratio and bulk microphysical parameters including IWC and number concentration. Moderate correlations were found only with particle size.
The relatively low asymmetry parameter values cannot be represented using optical models for idealised pristine crystals. Comparison with four commonly used radiative transfer parameterisations revealed that most overestimated asymmetry parameter by up to 0.1. Only the MODIS Collection 6 parameterisation, which assumes severely roughened columnar crystals, captured the upper range of the observed values. Given the inverse relationship between the asymmetry parameter and cloud reflectivity, overestimating asymmetry parameter from 0.738 to 0.800 can lead to an underestimation of cirrus albedo by up to 31 %, with implications for both radiative forcing estimates and satellite retrievals of optical depth. Such biases are particularly important because cirrus clouds have estimated to exert a net warming effect of 2–5 W m−2 globally, and reducing asymmetry parameter in climate models by just 0.05 has been shown to lower this warming by 1–2 W m−2. These discrepancies highlight the need for improved observational constraints and parameterisations of asymmetry parameter to better quantify the radiative role of cirrus clouds and reduce uncertainties in climate projections.
A1 Overview of the retrieval framework
Representing the scattering phase function as a series of Legendre polynomials is a common approach in atmospheric sciences and is widely used in radiative-transfer and remote-sensing applications (Wiscombe, 1977; Hu et al., 2000). This formulation is convenient because the Legendre polynomials are harmonic functions of cos θ and, thus, provide an efficient mathematical basis for describing the angular dependence of scattered light. As a general rule, the number of Legendre terms, N, required to accurately represent a phase function increases with the particle size parameter, x. For example, in case of large ice crystals (x>100) the narrow forward peak requires a high number of expansion terms, up to several thousands, to resolve the original phase function.
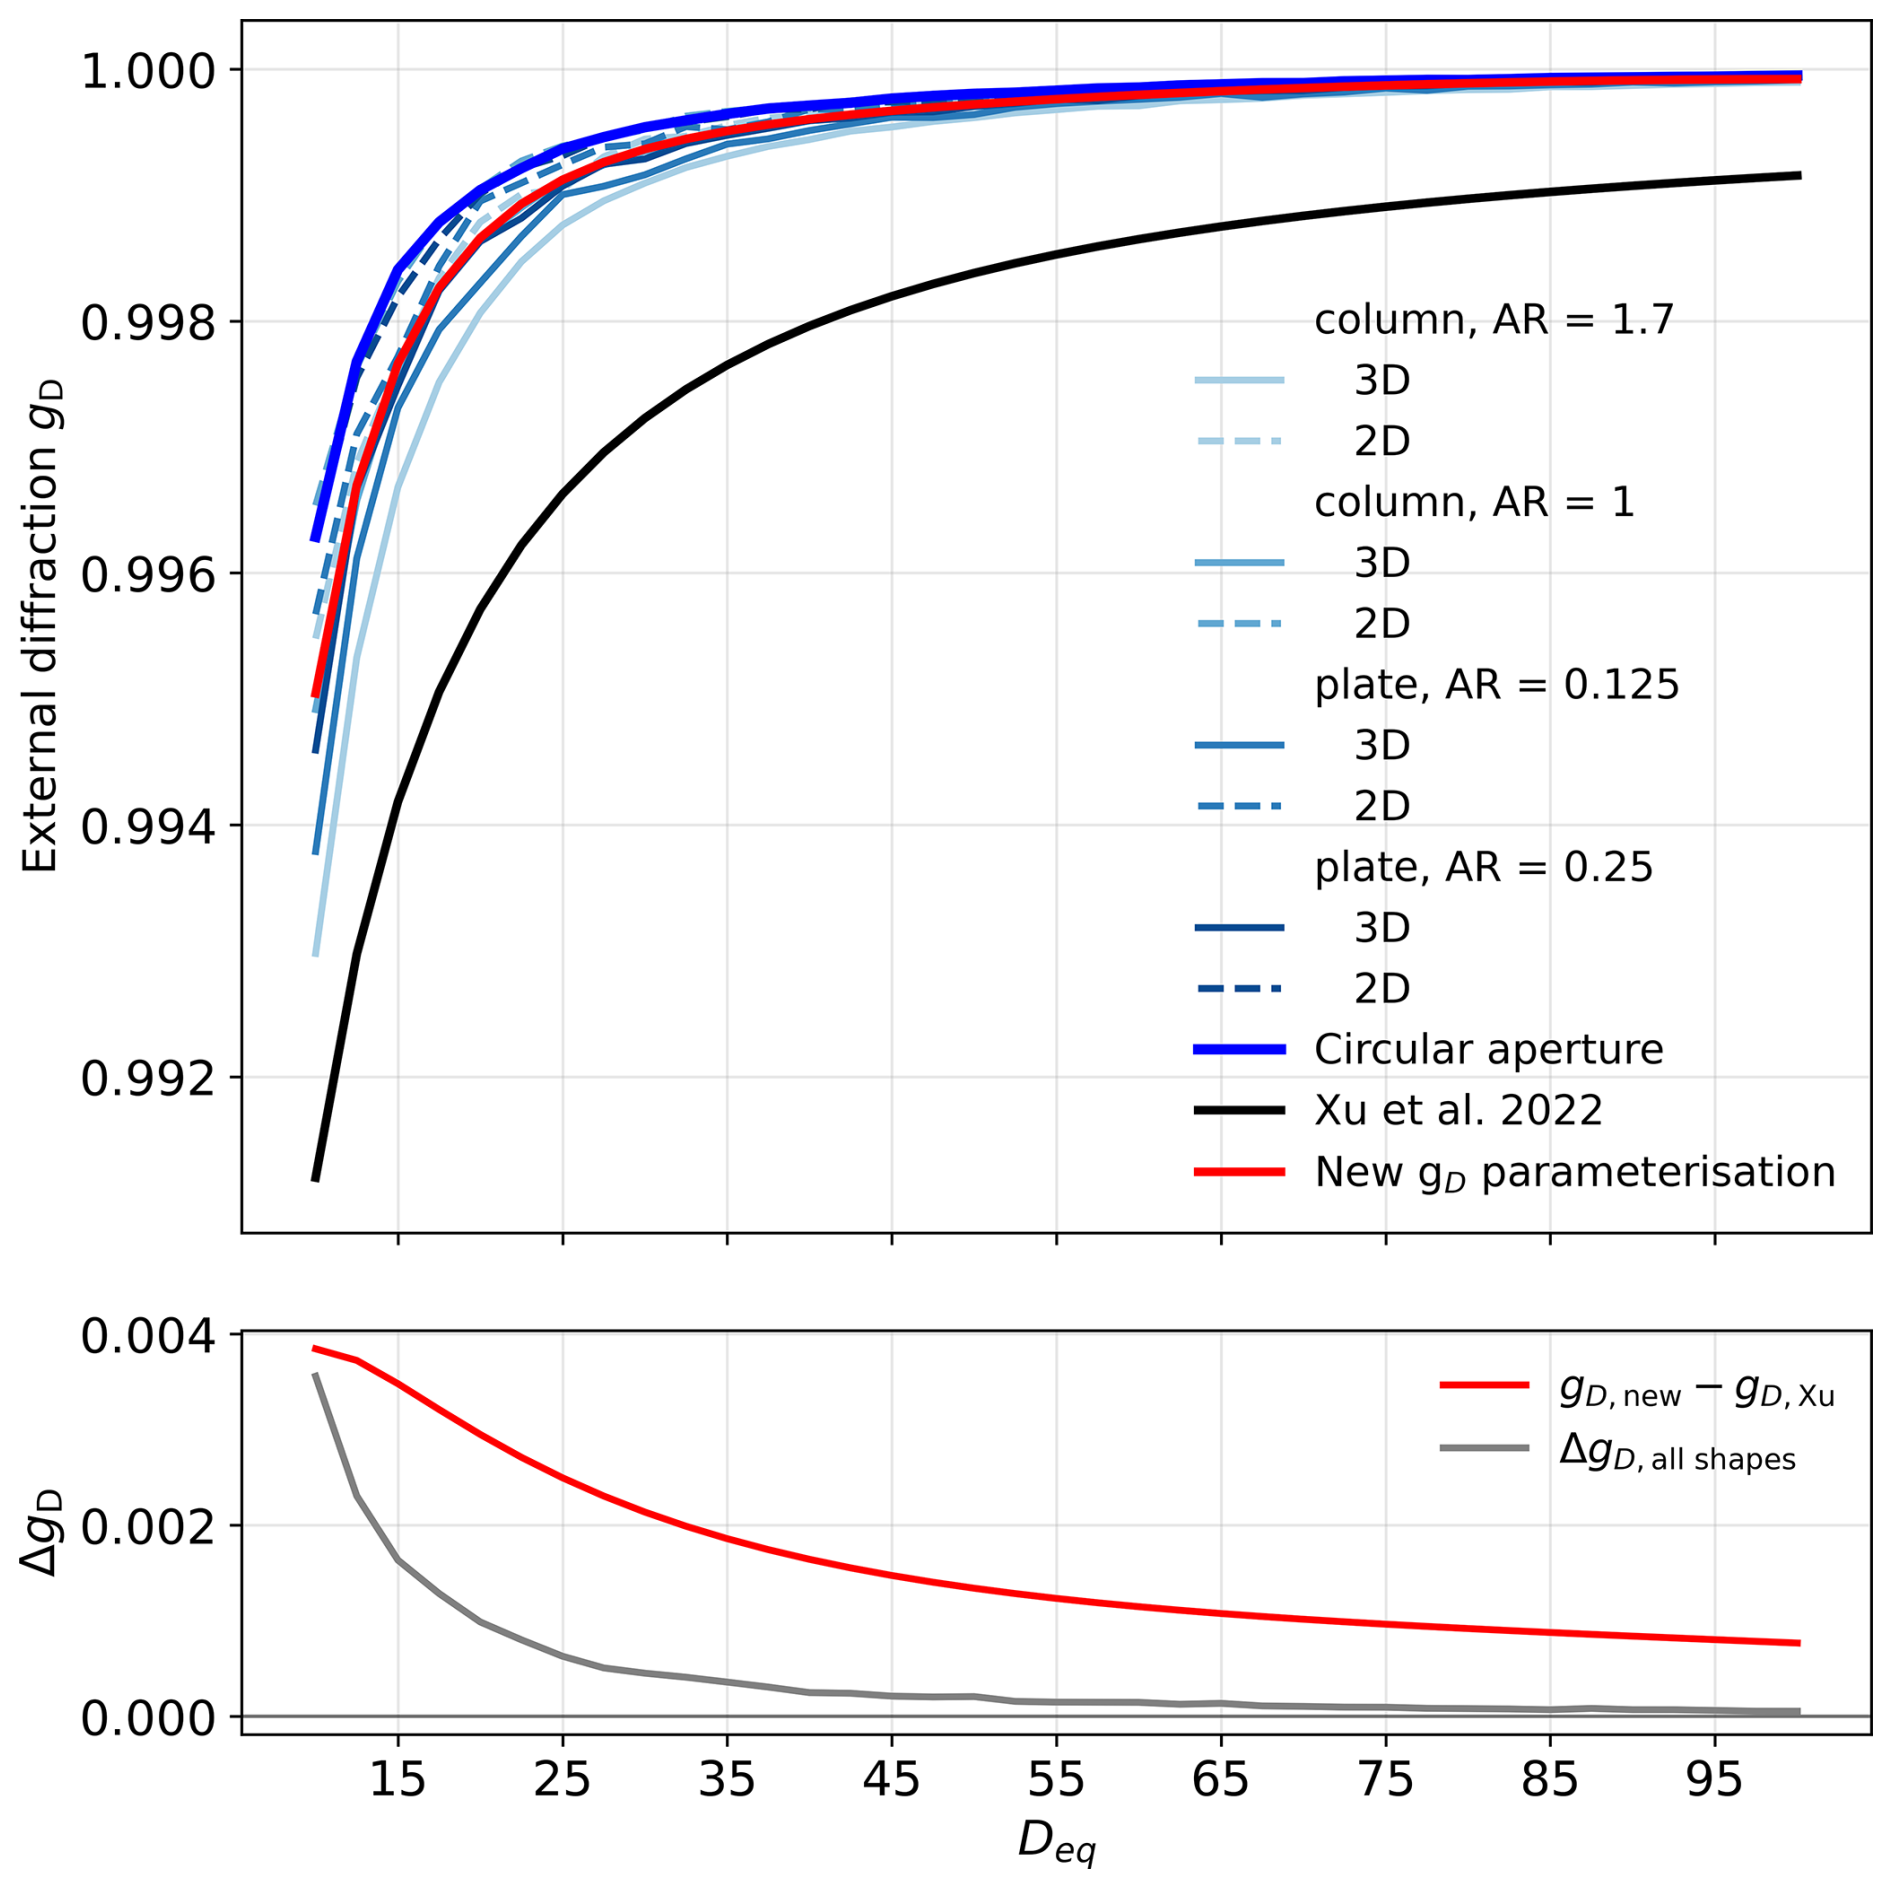
Figure A1Asymmetry parameter from external diffraction calculated for orientation averaged hexagonal columns with different aspect ratios (AR). Both 3D geometry and 2D projection were considered. The blue line shows calculation for orientation averaged circular aperture with the same projected area. The black line shows the parameterisation used in Xu et al. (2022) and red line the updated parameterisation.
To reduce some of this complexity, the first step in our retrieval framework is to separate the diffraction contribution from the geometrical-optics (GO) component of scattering. Although this decomposition is not fundamental from the electromagnetic perspective, it is a well-established and practical approximation for large atmospheric ice particles and widely used in conventional GO methods (e.g. Takano and Liou, 1989; Macke et al., 1996b). Studies using improved GO methods that avoid this artificial separation have shown convergence toward conventional ray-tracing results for the large size parameters relevant to our study (Yang and Liou, 1996).
This separation is also convenient because the diffraction contribution within the PHIPS measurement range (18–170°) can be considered negligible. This assumption is supported by theoretical studies showing that for large ice particles, the diffraction intensity decreases by more than three orders of magnitude beyond 18° (e.g. Hesse, 2008; Chunlei and Keya, 1996; Travis et al., 2002). Consequently, diffraction primarily affects the unmeasured forward-scattering region and can be parameterised to reconstruct the full phase function.
In earlier implementation by Xu et al. (2022), the diffraction contribution was approximated using scalar diffraction theory for circular apertures, which provides a computationally efficient first-order description. To further improve the physical consistency of the diffraction treatment, here we update the diffraction parameterisation to account for non-spherical particle shapes.
The diffraction calculations were carried out using a vector Fraunhofer integral. The external diffraction is computed by replacing the illuminated particle surface with a set of complementary apertures, in accordance with Babinet's principle. Three levels of geometric representation were considered: (i) a full three-dimensional hull, in which each illuminated facet is treated as an individual aperture and its diffracted field is computed accounting for relative position and orientation, with the total scattered field obtained from the coherent sum of all facets; (ii) a two-dimensional projection, where the illuminated facets are projected onto a plane normal to the incident light, reducing the problem for convex particles to a single effective aperture; and (iii) an area-equivalent circle, in which the 2D projected particle cross section is represented by a circular aperture of cross section-equivalent area. For all geometries, 100 random orientations were simulated, and the orientation-averaged one-dimensional scattering intensity as a function of angle was used to derive the diffraction asymmetry parameter gD.
The diffraction calculations shown in Fig. A1 confirm that, for orientation-averaged ice crystals, aperture shape and aspect ratio have only a minor influence on the diffraction phase function and the resulting diffraction asymmetry parameter gD. For particle sizes (d≥15 µm) and aspect ratios () relevant to this study, the spread in gD across the different geometric representations remains below 0.002 and decreases further with increasing size. On the other hand, the diffraction parameterisation adopted by Xu et al. (2022), which is based on a fixed circular aperture, yields systematically lower values of gD(d).
Motivated by this systematic bias, we derived an updated diffraction parameterisation by fitting a fourth-degree polynomial to the ensemble-mean gD obtained from all diffraction models. The underlying simulations span hexagonal ice crystals with aspect ratios between 0.25–1.7, consistent with the range observed by PHIPS. On a logarithmic size scale, the diffraction asymmetry parameter gD(d) is approximated by
where d denotes the particle area-equivalent diameter in micrometres.
The revised parameterisation reproduces the ensemble-mean diffraction behaviour to within 0.002 over the particle size and aspect ratio range relevant to this study and replaces the previous spherical-aperture-based formulation in the retrieval algorithm. Since diffraction contributes one half of the total asymmetry parameter, the remaining uncertainty associated with the diffraction treatment corresponds to a maximum uncertainty of approximately 0.001 in the retrieved total g.
After the diffraction phase function is parameterised, the measured PHIPS angular range can be treated as purely GO scattering. To obtain the GO contribution to g the measurement needs to be extrapolated to the missing forward and backscattering ranges. This is done by fitting a truncated Legendre polynomial expansion to the measured angular intensities. The GO scattering phase function PGO(θ) is expressed as a finite series of Legendre polynomials Pl(cos θ):
where are the Legendre expansion coefficients of degree l, and N is the maximum degree of the expansion. The factor 2l+1 follows the standard normalization of Legendre polynomials over the interval .
The coefficients are obtained through orthogonal projection of the measured phase function onto the Legendre basis. In practice, this integration is carried out numerically using Gauss–Legendre quadrature, which provides optimal accuracy by evaluating the integrand at specific quadrature nodes xi corresponding to the roots of PN+1(xi):
where wi are the Gauss–Legendre weights associated with each node and I(arccos (xi)) the measured intensity interpolated to the Gauss–Legendre quadrature nodes xi.
In our retrieval, the number of quadrature nodes is set to eight, corresponding to a Legendre expansion of eight terms (N=7). This truncation ensures that all quadrature nodes remain within the PHIPS angular coverage (18–170°) and avoids extrapolation into unmeasured regions.
Using eight terms implies that the fitted Legendre expansion can accurately represent only smooth angular scattering functions. Therefore, the retrieval method is not applicable to pristine ice crystals that exhibit sharp features in their phase functions. A preliminary uncertainty analysis of this approach was presented by Xu et al. (2022), where the authors compared the retrievals results to true g values using simulations of hexagonal ice crystals with varying degree of surface roughness and aspect ratio. However, the uncertainty analysis was based on a limited number of crystal geometries. In the present work, we extend this analysis using a substantially larger set of simulated ice crystal morphologies to refine the uncertainty estimate and confirm the validity of the truncation choice.
A2 Updated uncertainty analysis
To extend the analysis of Xu et al. (2022), we performed additional closure tests using the ray-tracing model of Macke et al. (1996b). The new simulations include 1612 orientation-averaged configurations of hexagonal ice crystals with sizes between 20–500 µm and aspect ratios ranging from 0.68 to 0.85, motivated by the PHIPS microphysical observations. Surface roughness was implemented using Gaussian tilted-facet perturbations with roughness parameters (σ) between 0–0.9 (interval of 0.1). In addition, internal air inclusions were simulated using the mean free path (MFP) approach (Macke et al., 1996a), with MFP values between 10–108 (no inclusions).
The purpose of this investigation was to evaluate how the retrieval error in g depends on the smoothness of the scattering phase function. To achieve this, the models were grouped according to their roughness parameter σ, which is directly related to the smoothness of the calculated scattering function (higher σ corresponds to smoother phase functions). Since natural cirrus clouds exhibit a diversity of shapes and aspect ratios, the simulations were averaged over ten different crystal configurations before calculating g. Although this ensemble size represents only a moderate level of morphological variability, sensitivity tests (not shown) confirmed that increasing the number of configurations had no effect on the results.
For each case, two values of g were computed: (i) the “true” value derived directly from the full simulated phase functions and (ii) the “retrieved” value obtained from the “true” phase function truncated to the PHIPS angular range (18–170°), corresponding to the angular coverage of the parabolic mirror detectors used in the PHIPS nephelometer. The truncation was carried out by integrating the simulated scattering intensity over the solid angle of each detector. Each detector covers an angular range around its central viewing angle with a half-angle acceptance of 3.5°, corresponding to a solid angle of 0.0117 sr. The simulated phase functions, computed with a 1° angular resolution, were integrated over each detector's acceptance using trapezoidal numerical integration.
Figure A2 illustrates the validation results for simulations with a low roughness parameter (σ=0.1). The simulated phase functions still contain a modest halo feature that is clearly visible even in the truncated phase function at the PHIPS angular resolution. It should be noted that the PHIPS measurements in panel c do not show a halo peak, even in the 1–99 percentile range, suggesting that higher roughness parameters are needed to model the measured phase functions. Panel b shows that the difference between the “true” and “retrieved” g can reach up to 0.08 but decreases rapidly with increasing complexity parameter Cp. The Cp parameter quantifies the decay rate of the Legendre expansion coefficients (Xu et al., 2022), with larger values corresponding to more featureless phase functions. While Xu et al. (2022) previously suggested that the retrieval is accurate within an absolute error of 0.001 for Cp≥0.4, our extended simulations reveal that for relatively pristine particles (σ=0.1), the retrieved Cp values derived from the truncated phase functions can exceed 0.4 (as shown in panel a), making the Cp parameter an unreliable quality indicator for assessing retrieval accuracy for lightly roughened crystals.
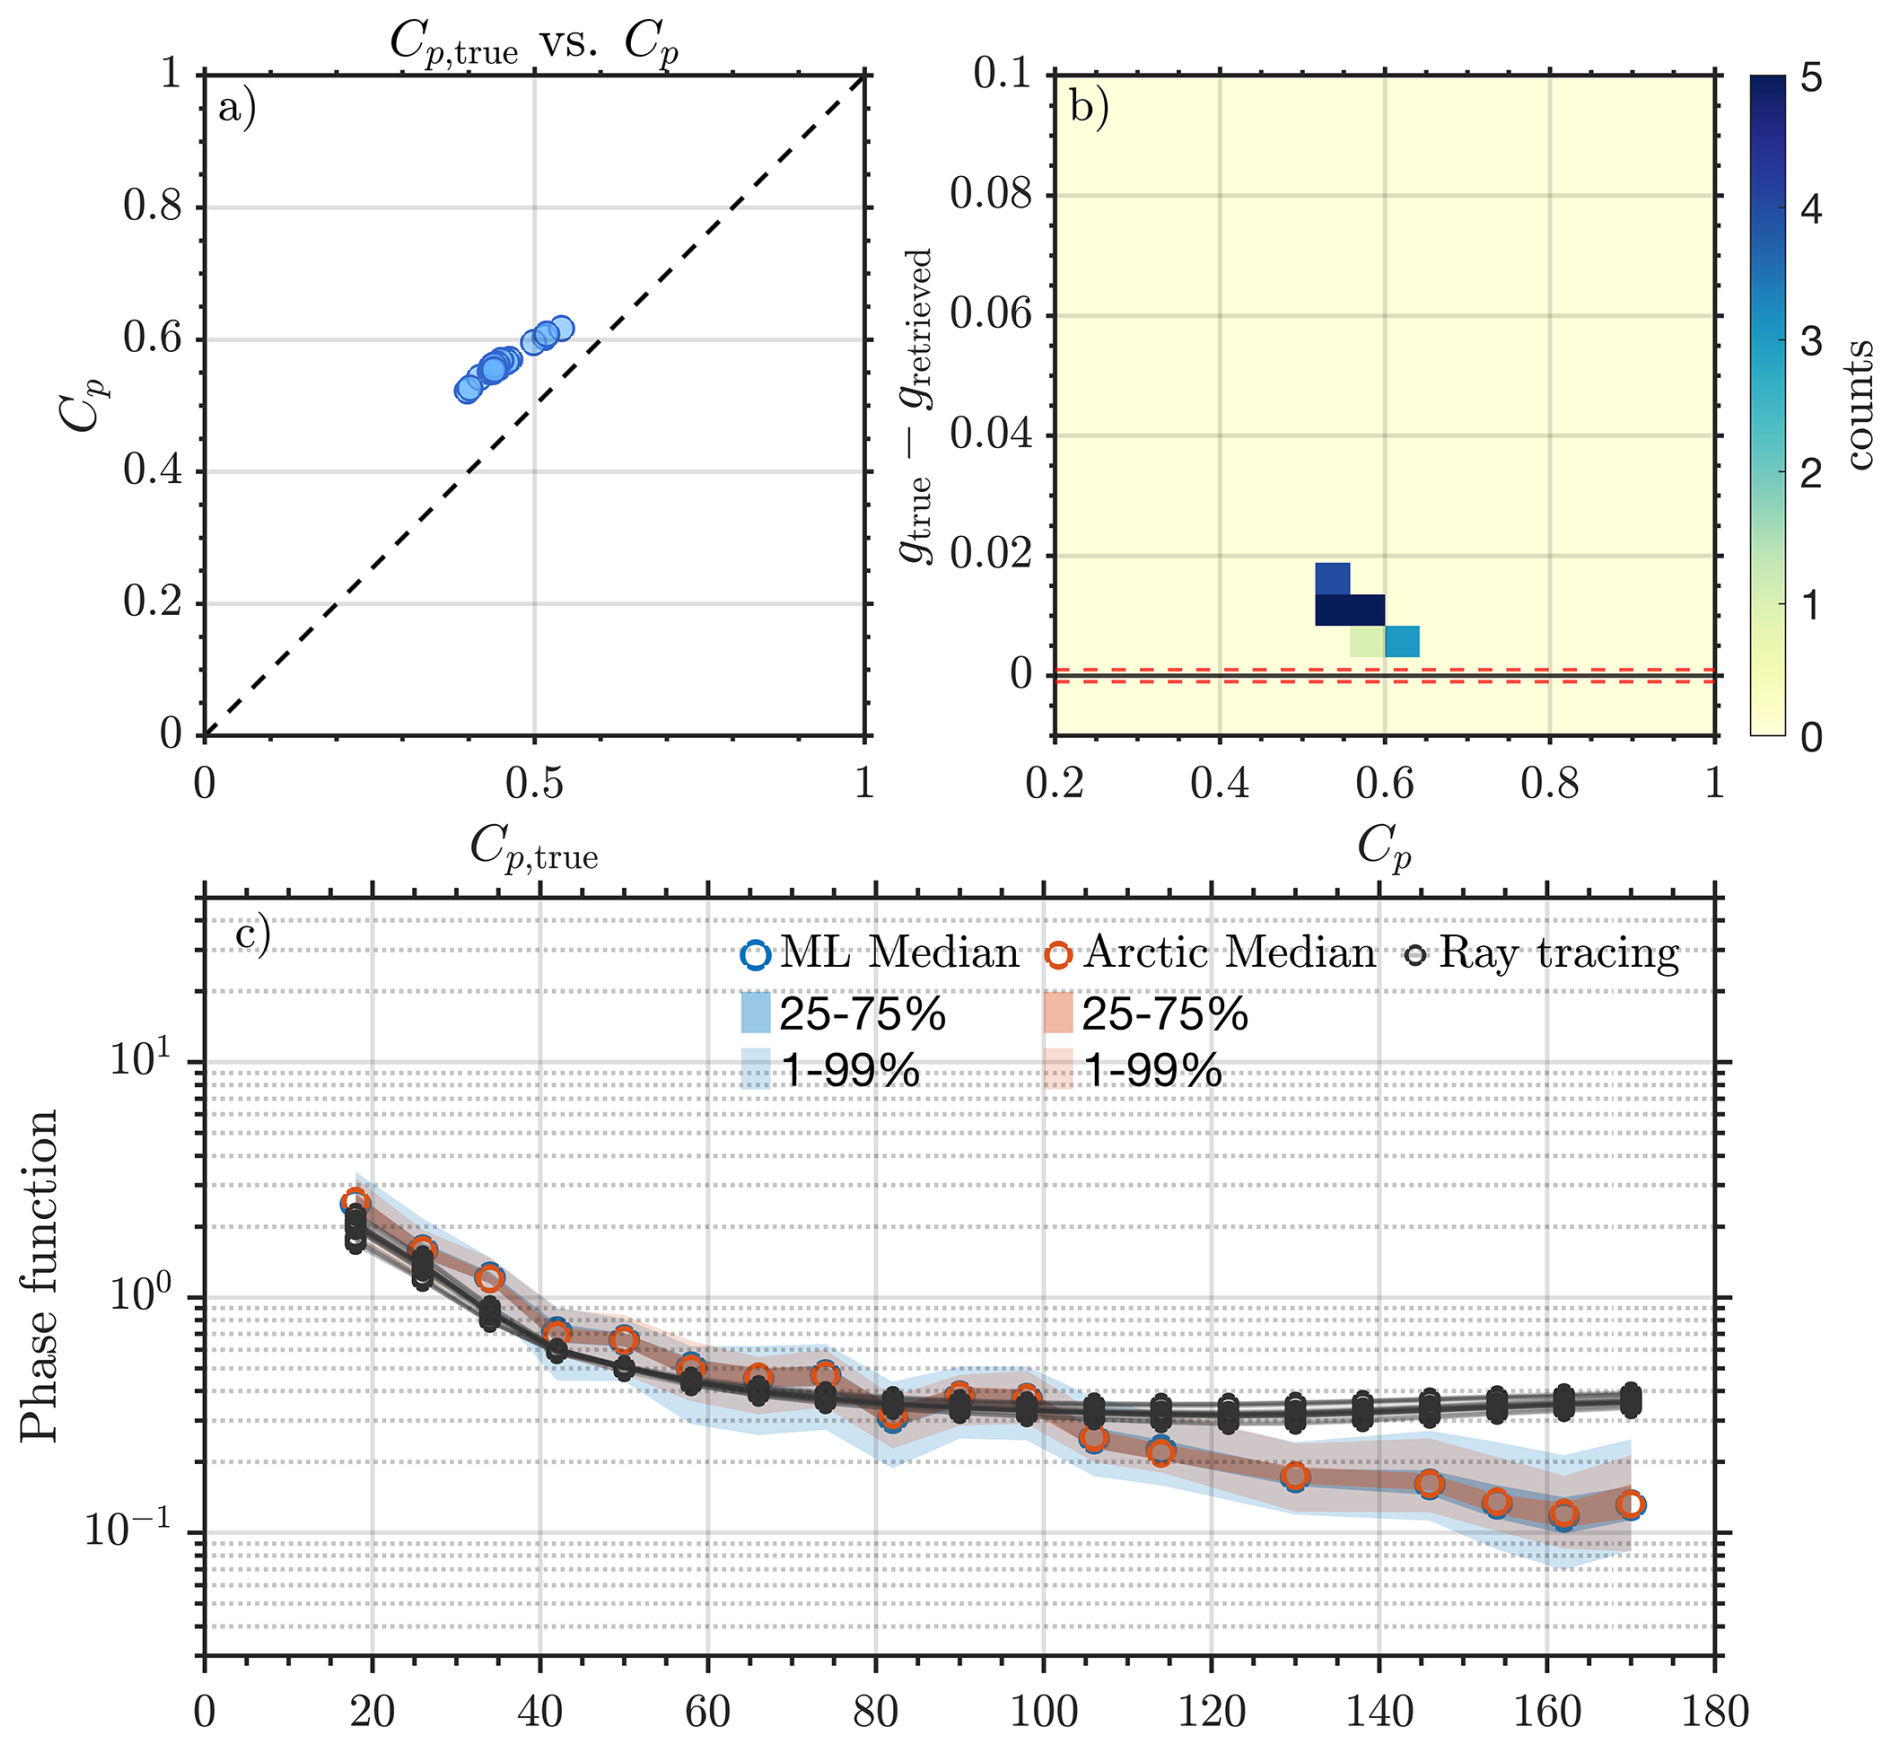
Figure A3 presents the corresponding results for σ=0.2. Increasing the surface roughness from 0.1 to 0.2 smooths out the halo feature in the simulations, yielding featureless phase functions that more closely resemble the measured data (Fig. A3c). The retrieval error in g is now below 0.02, although the retrieved values tend to be slightly biased toward lower g. Further increasing the roughness to σ=0.3 or higher values (not shown) reduces the retrieval error below 0.005 and also changes the bias sign, resulting in a slight overestimation of the true g.
These extended simulations confirm that the retrieval algorithm applied to the PHIPS angular range (18–170°) is reliable only for sufficiently smooth phase functions or sufficiently roughened ice crystals (in our simulations, σ≥0.2). We found that relatively pristine particles (σ=0.1) yield Cp values above the previously proposed Cp threshold of 0.4 (Xu et al., 2022), indicating that Cp cannot be used as a criterion for assessing retrieval accuracy. However, in all cases where the retrieval error exceeded 0.02, the simulated phase functions exhibited distinct halo features that would be clearly detectable at the angular resolution of PHIPS. Since such features are entirely absent from the measured phase functions (see panel c in Figs. A2 and A3), we conclude that the natural ice crystals in our dataset exhibit sufficient surface roughness for the retrieval method to remain valid. Based on these results, we adopt a more conservative uncertainty estimate of −0.001 to +0.02 for asymmetry parameter retrievals derived from PHIPS measurements compared to the value given in Xu et al. (2022).
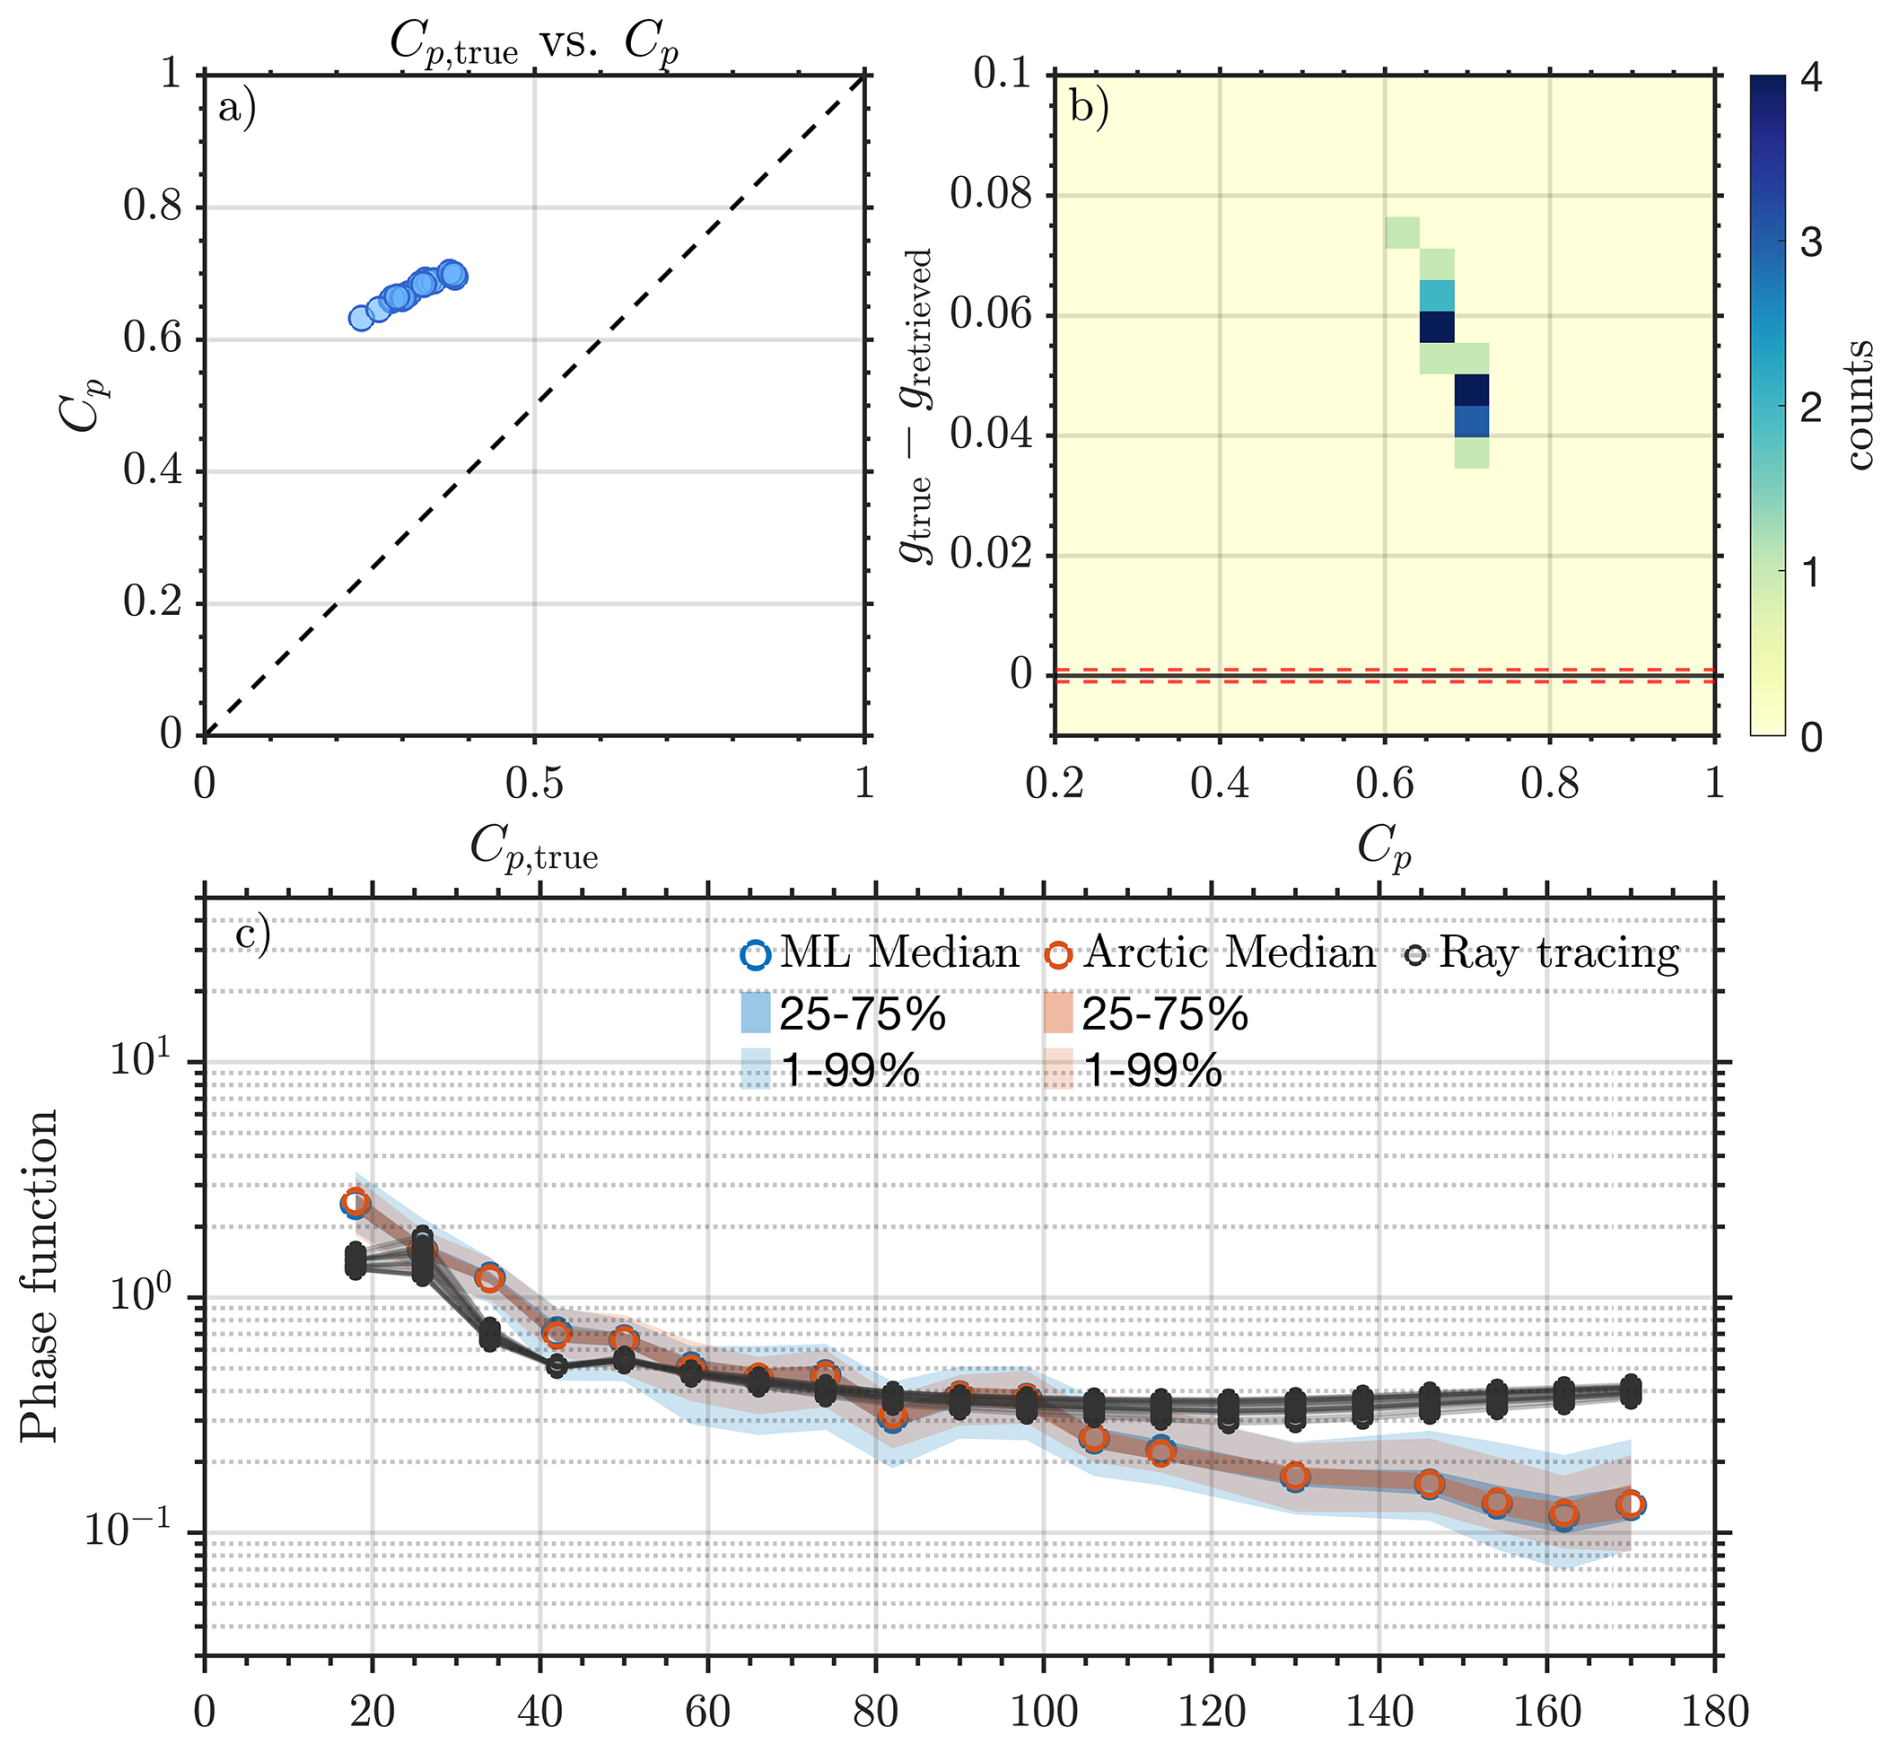
Figure A2Validation of the asymmetry parameter retrieval for simulations with a roughness parameter σ=0.1. The dataset includes 180 orientation-averaged crystal configurations, with g values retrieved for sets of 10 orientations each. Panel (a) compares the true complexity parameter Cp,true with the retrieved Cp, with the dashed line indicating the 1:1 relation. Panel (b) shows a heatmap of the retrieval error gtrue−gretrieved as a function of Cp, with red dashed lines marking ±0.001 error bounds. Panel (c) displays measured scattering phase functions for mid-latitude (blue) and Arctic (red) cirrus, including median, 25 %–75 %, and 1 %–99 % percentiles, with gray curves representing ray-tracing simulations of individual crystal configurations truncated to PHIPS measurement range.
Processed PHIPS microphysical data and single-particle light scattering data are available in the HALO database (https://halo-db.pa.op.dlr.de/mission/125, last access: 23 January 2026). The asymmetry parameters derived from the PHIPS measurements and used in this study are available via Zenodo (https://doi.org/10.5281/zenodo.18459504, Järvinen and Schnaiter, 2026). The stereo-microscopic images can be obtained from the authors upon request.
The supplement related to this article is available online at https://doi.org/10.5194/acp-26-2465-2026-supplement.
EJ conceptualised the study. FMS designed the measurement concept of PHIPS and led the instrument development. EJ and FMS collected the PHIPS data during the CIRRUS-HL campaign. EJ performed the data analysis and wrote the manuscript. FMS contributed to the interpretation of the results and provided comments on the manuscript.
Martin Schnaiter and Emma Järvinen are affiliated with schnaiTEC GmbH, the manufacturer of the PHIPS instrument. Martin Schnaiter is additionally employed part-time by schnaiTEC GmbH.
Publisher's note: Copernicus Publications remains neutral with regard to jurisdictional claims made in the text, published maps, institutional affiliations, or any other geographical representation in this paper. The authors bear the ultimate responsibility for providing appropriate place names. Views expressed in the text are those of the authors and do not necessarily reflect the views of the publisher.
The authors would like to thank the HALO crew for supporting the operations during the CIRRUS-HL campaign and the science and weather forecast teams for flight planning. Harry Ballington (Univ. Wuppertal) is acknowledged for providing the diffraction calculations. The authors would like to thank Timothy Garrett, Anthony Baran and the anonymous reviewer for their valuable comments that helped us to improve the manuscript.
This research has been supported by the Helmholtz Association (grant no. VH-NG-1531) and by the Deutsche Forschungsgemeinschaft (SPP 1294 HALO, grant nos. SCHN 1140/3-1, SCHN 1140/3-2).
This paper was edited by Martina Krämer and reviewed by Timothy Garrett, Anthony Baran, and one anonymous referee.
Abdelmonem, A., Järvinen, E., Duft, D., Hirst, E., Vogt, S., Leisner, T., and Schnaiter, M.: PHIPS–HALO: the airborne Particle Habit Imaging and Polar Scattering probe – Part 1: Design and operation, Atmos. Meas. Tech., 9, 3131–3144, https://doi.org/10.5194/amt-9-3131-2016, 2016. a
Auriol, F., Gayet, J.-F., Febvre, G., Jourdan, O., Labonnote, L., and Brogniez, G.: In situ observation of cirrus scattering phase functions with 22° and 46° halos: cloud field study on 19 February 1998, J. Atmos. Sci., 58, 3376–3390, https://doi.org/10.1175/1520-0469(2001)058<3376:ISOOCS>2.0.CO;2, 2001. a, b
Baker, B. and Lawson, R. P.: Improvement in determination of ice water content from two-dimensional particle imagery. Part I: Image-to-mass relationships, J. Appl. Meteorol., 45, 1282–1290, https://doi.org/10.1175/JAM2398.1, 2006. a
Barahona, D., Molod, A., and Kalesse, H.: Direct estimation of the global distribution of vertical velocity within cirrus clouds, Sci. Rep., 7, 6840, https://doi.org/10.1038/s41598-017-07038-6, 2017. a
Baran, A. J., Manners, J., Field, P. R., Furtado, K., and Hill, A.: A consistent coupling of two-moment microphysics and bulk ice optical properties, and its impact on radiation in a regional weather model, Q. J. Roy. Meteor. Soc., 151, e5025, https://doi.org/10.1002/qj.5025, 2025. a
Bohren, C. F. and Huffman, D. R.: Absorption and Scattering of Light by Small Particles, Wiley-VCH, Weinheim, Germany, ISBN 0-471-05772-X, 1983. a
Chunlei, L. and Keya, Y.: Calculation of ice crystal diffraction, Adv. Atmos. Sci., 13, 340–348, https://doi.org/10.1007/BF02656851, 1996. a
Cole, B. H., Yang, P., Baum, B. A., Riedi, J., C.-Labonnote, L., Thieuleux, F., and Platnick, S.: Comparison of PARASOL observations with polarized reflectances simulated using different ice habit mixtures, J. Appl. Meteorol., 52, 186–196, https://doi.org/10.1175/JAMC-D-12-097.1, 2013. a, b
Cole, B. H., Yang, P., Baum, B. A., Riedi, J., and C.-Labonnote, L.: Ice particle habit and surface roughness derived from PARASOL polarization measurements, Atmos. Chem. Phys., 14, 3739–3750, https://doi.org/10.5194/acp-14-3739-2014, 2014. a, b
De La Torre Castro, E., Jurkat-Witschas, T., Afchine, A., Grewe, V., Hahn, V., Kirschler, S., Krämer, M., Lucke, J., Spelten, N., Wernli, H., Zöger, M., and Voigt, C.: Differences in microphysical properties of cirrus at high and mid-latitudes, Atmos. Chem. Phys., 23, 13167–13189, https://doi.org/10.5194/acp-23-13167-2023, 2023. a, b, c, d
Febvre, G., Gayet, J.-F., Minikin, A., Schlager, H., Shcherbakov, V., Jourdan, O., Busen, R., Fiebig, M., Kärcher, B., and Schumann, U.: On optical and microphysical characteristics of contrails and cirrus, J. Geophys. Res.-Atmos., 114, https://doi.org/10.1029/2008JD010184, 2009. a, b, c, d
Forster, L. and Mayer, B.: Ice crystal characterization in cirrus clouds III: retrieval of ice crystal shape and roughness from observations of halo displays, Atmos. Chem. Phys., 22, 15179–15205, https://doi.org/10.5194/acp-22-15179-2022, 2022. a
Fu, Q.: An accurate parameterization of the solar radiative properties of cirrus clouds for climate models, J. Climate, 9, 2058–2082, https://doi.org/10.1175/1520-0442(1996)009<2058:AAPOTS>2.0.CO;2, 1996. a, b, c
Garrett, T. J., Hobbs, P. V., and Gerber, H.: Shortwave, single-scattering properties of arctic ice clouds, J. Geophys. Res.-Atmos., 106, 15155–15172, https://doi.org/10.1029/2000JD900195, 2001. a, b, c, d, e, f
Garrett, T. J., Gerber, H., Baumgardner, D. G., Twohy, C. H., and Weinstock, E. M.: Small, highly reflective ice crystals in low-latitude cirrus, Geophys. Res. Lett., 30, https://doi.org/10.1029/2003GL018153, 2003. a, b, c
Gayet, J.-F., Auriol, F., Oshchepkov, S., Schröder, F., Duroure, C., Febvre, G., Fournol, J.-F., Crépel, O., Personne, P., and Daugereon, D.: In situ measurements of the scattering phase function of stratocumulus, contrails and cirrus, Geophys. Res. Lett., 25, 971–974, https://doi.org/10.1029/98GL00541, 1998. a
Gayet, J.-F., Ovarlez, J., Shcherbakov, V., Ström, J., Schumann, U., Minikin, A., Auriol, F., Petzold, A., and Monier, M.: Cirrus cloud microphysical and optical properties at southern and northern midlatitudes during the INCA experiment, J. Geophys. Res.-Atmos., 109, https://doi.org/10.1029/2004JD004803, 2004. a, b, c, d, e
Gayet, J.-F., Shcherbakov, V., Mannstein, H., Minikin, A., Schumann, U., Ström, J., Petzold, A., Ovarlez, J., and Immler, F.: Microphysical and optical properties of midlatitude cirrus clouds observed in the southern hemisphere during INCA, Q. J. Roy. Meteor. Soc., 132, 2719–2748, https://doi.org/10.1256/qj.05.162, 2006. a, b, c
Gayet, J.-F., Mioche, G., Bugliaro, L., Protat, A., Minikin, A., Wirth, M., Dörnbrack, A., Shcherbakov, V., Mayer, B., Garnier, A., and Gourbeyre, C.: On the observation of unusual high concentration of small chain-like aggregate ice crystals and large ice water contents near the top of a deep convective cloud during the CIRCLE-2 experiment, Atmos. Chem. Phys., 12, 727–744, https://doi.org/10.5194/acp-12-727-2012, 2012. a, b, c
Gerber, H., Takano, Y., Garrett, T. J., and Hobbs, P. V.: Nephelometer measurements of the asymmetry parameter, volume extinction coefficient, and backscatter ratio in Arctic clouds, J. Atmos. Sci., 57, 3021–3034, https://doi.org/10.1175/1520-0469(2000)057<3021:NMOTAP>2.0.CO;2, 2000. a, b, c
Gil-Díaz, C., Sicard, M., Sourdeval, O., Saiprakash, A., Muñoz-Porcar, C., Comerón, A., Rodríguez-Gómez, A., and Oliveira, D. C. F. D. S.: Study of optical scattering properties and direct radiative effects of high-altitude cirrus clouds in Barcelona, Spain, with 4 years of lidar measurements, Atmos. Chem. Phys., 25, 3445–3464, https://doi.org/10.5194/acp-25-3445-2025, 2025. a
Hesse, E.: Modelling diffraction during ray tracing using the concept of energy flow lines, J. Quant. Spectrosc. Ra., 109, 1374–1383, https://doi.org/10.1016/j.jqsrt.2007.11.002, 2008. a
Heymsfield, A. J., Krämer, M., Luebke, A., Brown, P., Cziczo, D. J., Franklin, C., Lawson, P., Lohmann, U., McFarquhar, G., Ulanowski, Z., and Tricht, K. V.: Cirrus clouds, Meteor. Mon., 58, 2.1–2.26, https://doi.org/10.1175/AMSMONOGRAPHS-D-16-0010.1, 2017. a, b, c
Hong, Y., Liu, G., and Li, J.-L. F.: Assessing the radiative effects of global ice clouds based on CloudSat and CALIPSO measurements, J. Climate, 29, 7651–7674, https://doi.org/10.1175/JCLI-D-15-0799.1, 2016. a
Hu, Y.-X., Wielicki, B., Lin, B., Gibson, G., Tsay, S.-C., Stamnes, K., and Wong, T.: δ-Fit: a fast and accurate treatment of particle scattering phase functions with weighted singular-value decomposition least-squares fitting, J. Quant. Spectrosc. Ra., 65, 681–690, https://doi.org/10.1016/S0022-4073(99)00147-8, 2000. a
Iaquinta, J., Isaka, H., and Personne, P.: Scattering phase function of bullet rosette ice crystals, J. Atmos. Sci., 52, 1401–1413, https://doi.org/10.1175/1520-0469(1995)052<1401:SPFOBR>2.0.CO;2, 1995. a, b, c
Järvinen, E. and Schnaiter, M.: PHIPS Single-Particle and Bulk Optical Properties of Cirrus Ice Crystals from the CIRRUS-HL Campaign, in: Atmospheric Chemistry and Physics, Zenodo [data set], https://doi.org/10.5281/zenodo.18459504, 2026. a
Järvinen, E., Jourdan, O., Neubauer, D., Yao, B., Liu, C., Andreae, M. O., Lohmann, U., Wendisch, M., McFarquhar, G. M., Leisner, T., and Schnaiter, M.: Additional global climate cooling by clouds due to ice crystal complexity, Atmos. Chem. Phys., 18, 15767–15781, https://doi.org/10.5194/acp-18-15767-2018, 2018. a, b, c
Järvinen, E., Nehlert, F., Xu, G., Waitz, F., Mioche, G., Dupuy, R., Jourdan, O., and Schnaiter, M.: Investigating the vertical extent and short-wave radiative effects of the ice phase in Arctic summertime low-level clouds, Atmos. Chem. Phys., 23, 7611–7633, https://doi.org/10.5194/acp-23-7611-2023, 2023a. a
Järvinen, E., van Diedenhoven, B., Magee, N., Neshyba, S., Schnaiter, M., Xu, G., Jourdan, O., Delene, D., Waitz, F., Lolli, S., and Kato, S.: Ice Crystal Complexity and Link to the Cirrus Cloud Radiative Effect, Chap. 3, American Geophysical Union (AGU), https://doi.org/10.1002/9781119700357.ch3, 47–85, 2023b. a
Jeggle, K., Neubauer, D., Binder, H., and Lohmann, U.: Cirrus formation regimes – data-driven identification and quantification of mineral dust effect, Atmos. Chem. Phys., 25, 7227–7243, https://doi.org/10.5194/acp-25-7227-2025, 2025. a
Jurkat-Witschas, T., Voigt, C., Groß, S., Kaufmann, S., Sauer, D., De la Torre Castro, E., Krämer, M., Schäfler, A., Afchine, A., Attinger, R., Bartolome Garcia, I., Beer, C. G., Bugliaro, L., Clemen, H.-C., Dekoutsidis, G., Ehrlich, A., Grawe, S., Hahn, V., Hendricks, J., Järvinen, E., Klimach, T., Krüger, K., Krüger, O., Lucke, J., Luebke, A. E., Marsing, A., Mayer, B., Mayer, J., Mertes, S., Moser, M., Müller, H., Nenakhov, V., Pöhlker, M., Pöschl, U., Pörtge, V., Rautenhaus, M., Righi, M., Röttenbacher, J., Rubin-Zuzic, M., Schaefer, J., Schnaiter, M., Schneider, J., Schumann, U., Spelten, N., Stratmann, F., Tomsche, L., Wagner, S., Wang, Z., Weber, A., Wendisch, M., Wernli, H., Wetzel, B., Wirth, M., Zahn, A., Ziereis, H., and Zöger, M.: Picturing High- and Midlatitude Summer Cirrus and Contrail Cirrus above Europe with Airborne Measurements aboard the Research Aircraft HALO, B. Am. Meteorol. Soc., 106, E2300–E2327, https://doi.org/10.1175/BAMS-D-23-0270.1, 2025. a, b
Krämer, M., Rolf, C., Luebke, A., Afchine, A., Spelten, N., Costa, A., Meyer, J., Zöger, M., Smith, J., Herman, R. L., Buchholz, B., Ebert, V., Baumgardner, D., Borrmann, S., Klingebiel, M., and Avallone, L.: A microphysics guide to cirrus clouds – Part 1: Cirrus types, Atmos. Chem. Phys., 16, 3463–3483, https://doi.org/10.5194/acp-16-3463-2016, 2016. a
Kristjánsson, J. E., Edwards, J. M., and Mitchell, D. L.: Impact of a new scheme for optical properties of ice crystals on climates of two GCMs, J. Geophys. Res.-Atmos., 105, 10063–10079, https://doi.org/10.1029/2000JD900015, 2000. a
Lawson, R. P., Woods, S., Jensen, E., Erfani, E., Gurganus, C., Gallagher, M., Connolly, P., Whiteway, J., Baran, A. J., May, P., Heymsfield, A., Schmitt, C. G., McFarquhar, G., Um, J., Protat, A., Bailey, M., Lance, S., Muehlbauer, A., Stith, J., Korolev, A., Toon, O. B., and Krämer, M.: A review of ice particle shapes in cirrus formed in situ and in anvils, J. Geophys. Res.-Atmos., 124, 10049–10090, https://doi.org/10.1029/2018JD030122, 2019. a, b
Lehmkuhl, F., Schüttrumpf, H., Schwarzbauer, J., Brüll, C., Dietze, M., Letmathe, P., Völker, C., and Hollert, H.: Assessment of the 2021 summer flood in Central Europe, Environmental Sciences Europe, 34, 107, https://doi.org/10.1186/s12302-022-00685-1, 2022. a
Loeb, N. G., Johnson, G. C., Thorsen, T. J., Lyman, J. M., Rose, F. G., and Kato, S.: Satellite and ocean data reveal marked increase in Earth's heating rate, Geophys. Res. Lett., 48, e2021GL093047, https://doi.org/10.1029/2021GL093047, 2021. a
Luebke, A. E., Afchine, A., Costa, A., Grooß, J.-U., Meyer, J., Rolf, C., Spelten, N., Avallone, L. M., Baumgardner, D., and Krämer, M.: The origin of midlatitude ice clouds and the resulting influence on their microphysical properties, Atmos. Chem. Phys., 16, 5793–5809, https://doi.org/10.5194/acp-16-5793-2016, 2016. a, b, c
L'Ecuyer, T. S., Hang, Y., Matus, A. V., and Wang, Z.: Reassessing the effect of cloud type on Earth's energy balance in the age of active spaceborne observations. Part I: Top of atmosphere and surface, J. Climate, 32, 6197–6217, https://doi.org/10.1175/JCLI-D-18-0753.1, 2019. a
Macke, A., Mishchenko, M. I., and Cairns, B.: The influence of inclusions on light scattering by large ice particles, J. Geophys. Res.-Atmos., 101, 23311–23316, https://doi.org/10.1029/96JD02364, 1996a. a, b
Macke, A., Mueller, J., and Raschke, E.: Single scattering properties of atmospheric ice crystals, J. Atmos. Sci., 53, 2813–2825, 1996b. a, b, c, d, e
Macke, A., Francis, P. N., McFarquhar, G. M., and Kinne, S.: The role of ice particle shapes and size distributions in the single scattering properties of cirrus clouds, J. Atmos. Sci., 55, 2874–2883, https://doi.org/10.1175/1520-0469(1998)055<2874:TROIPS>2.0.CO;2, 1998. a
Magee, N., Boaggio, K., Staskiewicz, S., Lynn, A., Zhao, X., Tusay, N., Schuh, T., Bandamede, M., Bancroft, L., Connelly, D., Hurler, K., Miner, B., and Khoudary, E.: Captured cirrus ice particles in high definition, Atmos. Chem. Phys., 21, 7171–7185, https://doi.org/10.5194/acp-21-7171-2021, 2021. a
Mauritsen, T., Stevens, B., Roeckner, E., Crueger, T., Esch, M., Giorgetta, M., Haak, H., Jungclaus, J., Klocke, D., Matei, D., Mikolajewicz, U., Notz, D., Pincus, R., Schmidt, H., and Tomassini, L.: Tuning the climate of a global model, J. Adv. Model. Earth Sy., 4, https://doi.org/10.1029/2012MS000154, 2012. a
Meador, W. E. and Weaver, W. R.: Two-stream approximations to radiative transfer in planetary atmospheres: a unified description of existing methods and a new improvement, J. Atmos. Sci., 37, 630–643, https://doi.org/10.1175/1520-0469(1980)037<0630:TSATRT>2.0.CO;2, 1980. a
Mishchenko, M. I., Rossow, W. B., Macke, A., and Lacis, A. A.: Sensitivity of cirrus cloud albedo, bidirectional reflectance and optical thickness retrieval accuracy to ice particle shape, J. Geophys. Res.-Atmos., 101, 16973–16985, https://doi.org/10.1029/96JD01155, 1996. a
Pincus, R. and Stevens, B.: Paths to accuracy for radiation parameterizations in atmospheric models, J. Adv. Model. Earth Sy., 5, 225–233, https://doi.org/10.1002/jame.20027, 2013. a, b
Platnick, S., Meyer, K. G., King, M. D., Wind, G., Amarasinghe, N., Marchant, B., Arnold, G. T., Zhang, Z., Hubanks, P. A., Holz, R. E., Yang, P., Ridgway, W. L., and Riedi, J.: The MODIS cloud optical and microphysical products: collection 6 updates and examples from Terra and Aqua, IEEE T. Geosci. Remote, 55, 502–525, 2016. a, b
Ren, T., Yang, P., Loeb, N. G., Smith Jr., W. L., and Minnis, P.: On the consistency of ice cloud optical models for spaceborne remote sensing applications and broadband radiative transfer simulations, J. Geophys. Res.-Atmos., 128, e2023JD038747, https://doi.org/10.1029/2023JD038747, 2023. a
Schmitt, C. G., Iaquinta, J., and Heymsfield, A. J.: The asymmetry parameter of cirrus clouds composed of hollow bullet rosette–shaped ice crystals from ray-tracing calculations, J. Appl. Meteorol., 45, 973–981, https://doi.org/10.1175/JAM2384.1, 2006. a
Schnaiter, M., Järvinen, E., Abdelmonem, A., and Leisner, T.: PHIPS-HALO: the airborne particle habit imaging and polar scattering probe – Part 2: Characterization and first results, Atmos. Meas. Tech., 11, 341–357, https://doi.org/10.5194/amt-11-341-2018, 2018. a, b
Schäfler, A. and Rautenhaus, M.: Interactive 3D visual analysis of weather prediction data reveals midlatitude overshooting convection during the CIRRUS-HL field experiment, B. Am. Meteorol. Soc., 104, E1426 – E1434, https://doi.org/10.1175/BAMS-D-22-0103.1, 2023. a
Schön, R., Schnaiter, M., Ulanowski, Z., Schmitt, C., Benz, S., Möhler, O., Vogt, S., Wagner, R., and Schurath, U.: Particle habit imaging using incoherent light: a first step toward a novel instrument for cloud microphysics, J. Atmos. Ocean. Tech., 28, 493–512, https://doi.org/10.1175/2011JTECHA1445.1, 2011. a
Sourdeval, O., Gryspeerdt, E., Krämer, M., Goren, T., Delanoë, J., Afchine, A., Hemmer, F., and Quaas, J.: Ice crystal number concentration estimates from lidar–radar satellite remote sensing – Part 1: Method and evaluation, Atmos. Chem. Phys., 18, 14327–14350, https://doi.org/10.5194/acp-18-14327-2018, 2018. a
Stephens, G. L., Tsay, S.-C., Stackhouse, P. W., and Flatau, P. J.: The relevance of the microphysical and radiative properties of cirrus clouds to climate and climatic feedback, J. Atmos. Sci., 47, 1742–1754, https://doi.org/10.1175/1520-0469(1990)047<1742:TROTMA>2.0.CO;2, 1990. a
Stubenrauch, C. J., Rossow, W. B., Kinne, S., Ackerman, S., Cesana, G., Chepfer, H., Girolamo, L. D., Getzewich, B., Guignard, A., Heidinger, A., Maddux, B. C., Menzel, W. P., Minnis, P., Pearl, C., Platnick, S., Poulsen, C., Riedi, J., Sun-Mack, S., Walther, A., Winker, D., Zeng, S., and Zhao, G.: Assessment of global cloud datasets from satellites: project and database initiated by the GEWEX radiation panel, B. Am. Meteorol. Soc., 94, 1031–1049, https://doi.org/10.1175/BAMS-D-12-00117.1, 2013. a
Takano, Y. and Liou, K.-N.: Solar radiative transfer in cirrus clouds. Part I: Single-scattering and optical properties of hexagonal ice crystals, J. Atmos. Sci., 46, 3–19, https://doi.org/10.1175/1520-0469(1989)046<0003:SRTICC>2.0.CO;2, 1989. a, b
Travis, L., Mishchenko, M. I., and Lacis, A. A.: Scattering, Absorption, and Emission of Light by Small Particles, Cambridge University Press, 462 pp., ISBN-10 052178252X, 2002. a
Um, J. and McFarquhar, G. M.: Single-scattering properties of aggregates of bullet rosettes in cirrus, J. Appl. Meteorol., 46, 757–775, https://doi.org/10.1175/JAM2501.1, 2007. a
van Diedenhoven, B.: Variation of ice microphysical properties with temperature and humidity at tops of convective clouds, Geophys. Res. Lett., 48, e2021GL093673, https://doi.org/10.1029/2021GL093673, 2021. a
van Diedenhoven, B., Cairns, B., Fridlind, A. M., Ackerman, A. S., and Garrett, T. J.: Remote sensing of ice crystal asymmetry parameter using multi-directional polarization measurements – Part 2: Application to the Research Scanning Polarimeter, Atmos. Chem. Phys., 13, 3185–3203, https://doi.org/10.5194/acp-13-3185-2013, 2013. a, b
van Diedenhoven, B., Ackerman, A. S., Cairns, B., and Fridlind, A. M.: A flexible parameterization for shortwave optical properties of ice crystals, J. Atmos. Sci., 71, 1763–1782, https://doi.org/10.1175/JAS-D-13-0205.1, 2014a. a
van Diedenhoven, B., Fridlind, A. M., Cairns, B., and Ackerman, A. S.: Variation of ice crystal size, shape, and asymmetry parameter in tops of tropical deep convective clouds, J. Geophys. Res.-Atmos., 119, 11809–11825, https://doi.org/10.1002/2014JD022385, 2014b. a
Vogelmann, A. M. and Ackerman, T. P.: Relating cirrus cloud properties to observed fluxes: a critical assessment, J. Atmos. Sci., 52, 4285–4301, https://doi.org/10.1175/1520-0469(1995)052<4285:RCCPTO>2.0.CO;2, 1995. a
Wagner, S. W., Schnaiter, M., Xu, G., Rogge, F., and Järvinen, E.: Light scattering and microphysical properties of atmospheric bullet rosette ice crystals, Atmos. Chem. Phys., 25, 8785–8804, https://doi.org/10.5194/acp-25-8785-2025, 2025. a, b, c
Waitz, F., Schnaiter, M., Leisner, T., and Järvinen, E.: PHIPS-HALO: the airborne Particle Habit Imaging and Polar Scattering probe – Part 3: Single-particle phase discrimination and particle size distribution based on the angular-scattering function, Atmos. Meas. Tech., 14, 3049–3070, https://doi.org/10.5194/amt-14-3049-2021, 2021. a, b, c
Wang, C., Yang, P., Dessler, A., Baum, B. A., and Hu, Y.: Estimation of the cirrus cloud scattering phase function from satellite observations, J. Quant. Spectrosc. Ra., 138, 36–49, https://doi.org/10.1016/j.jqsrt.2014.02.001, 2014. a
Wang, Y., Hioki, S., Yang, P., King, M. D., Di Girolamo, L., Fu, D., and Baum, B. A.: Inference of an optimal ice particle model through latitudinal analysis of MISR and MODIS data, Remote Sens., 10, https://doi.org/10.3390/rs10121981, 2018. a
Weigel, R., Spichtinger, P., Mahnke, C., Klingebiel, M., Afchine, A., Petzold, A., Krämer, M., Costa, A., Molleker, S., Reutter, P., Szakáll, M., Port, M., Grulich, L., Jurkat, T., Minikin, A., and Borrmann, S.: Thermodynamic correction of particle concentrations measured by underwing probes on fast-flying aircraft, Atmos. Meas. Tech., 9, 5135–5162, https://doi.org/10.5194/amt-9-5135-2016, 2016. a
Wiscombe, W. J.: The Delta–M method: rapid yet accurate radiative flux calculations for strongly asymmetric phase functions, J. Atmos. Sci., 34, 1408–1422, https://doi.org/10.1175/1520-0469(1977)034<1408:TDMRYA>2.0.CO;2, 1977. a
Wolf, V., Kuhn, T., Milz, M., Voelger, P., Krämer, M., and Rolf, C.: Arctic ice clouds over northern Sweden: microphysical properties studied with the Balloon-borne Ice Cloud particle Imager B-ICI, Atmos. Chem. Phys., 18, 17371–17386, https://doi.org/10.5194/acp-18-17371-2018, 2018. a, b, c, d, e
Woods, S., Lawson, R. P., Jensen, E., Bui, T., Thornberry, T., Rollins, A., Pfister, L., and Avery, M.: Microphysical properties of tropical tropopause layer cirrus, J. Geophys. Res.-Atmos., 123, 6053–6069, 2018. a
Xu, G., Schnaiter, M., and Järvinen, E.: Accurate retrieval of asymmetry parameter for large and complex ice crystals from in situ polar nephelometer measurements, J. Geophys. Res.-Atmos., 127, 1–19, https://doi.org/10.1029/2021jd036071, 2022. a, b, c, d, e, f, g, h, i, j
Yang, P. and Liou, K. N.: Geometric-optics–integral-equation method for light scattering by nonspherical ice crystals, Appl. Optics, 35, 6568–6584, https://doi.org/10.1364/AO.35.006568, 1996. a
Yang, P., Gao, B.-C., Baum, B. A., Wiscombe, W. J., Hu, Y. X., Nasiri, S. L., Soulen, P. F., Heymsfield, A. J., McFarquhar, G. M., and Miloshevich, L. M.: Sensitivity of cirrus bidirectional reflectance to vertical inhomogeneity of ice crystal habits and size distributions for two Moderate-Resolution Imaging Spectroradiometer (MODIS) bands, J. Geophys. Res.-Atmos., 106, 17267–17291, https://doi.org/10.1029/2000JD900618, 2001. a
Yang, P., Zhang, Z., Kattawar, G. W., Warren, S. G., Baum, B. A., Huang, H.-L., Hu, Y. X., Winker, D., and Iaquinta, J.: Effect of cavities on the optical properties of bullet rosettes: implications for active and passive remote sensing of ice cloud properties, J. Appl. Meteorol., 47, 2311–2330, https://doi.org/10.1175/2008JAMC1905.1, 2008. a, b, c
Yang, P., Bi, L., Baum, B. A., Liou, K.-N., Kattawar, G. W., Mishchenko, M. I., and Cole, B.: Spectrally consistent scattering, absorption, and polarization properties of atmospheric ice crystals at wavelengths from 0.2 to 100 µm, J. Atmos. Sci., 70, 330–347, https://doi.org/10.1175/JAS-D-12-039.1, 2013. a
Yi, B.: Diverse cloud radiative effects and global surface temperature simulations induced by different ice cloud optical property parameterizations, Sci. Rep., 12, 10539, https://doi.org/10.1038/s41598-022-14608-w, 2022. a
Yi, B., Yang, P., Baum, B. A., L'Ecuyer, T., Oreopoulos, L., Mlawer, E. J., Heymsfield, A. J., and Liou, K.-N.: Influence of ice particle surface roughening on the global cloud radiative effect, J. Atmos. Sci., 70, 2794–2807, https://doi.org/10.1175/JAS-D-13-020.1, 2013. a, b
Yi, B., Rapp, A. D., Yang, P., Baum, B. A., and King, M. D.: A comparison of Aqua MODIS ice and liquid water cloud physical and optical properties between collection 6 and collection 5.1: pixel-to-pixel comparisons, J. Geophys. Res.-Atmos., 122, 4528–4549, https://doi.org/10.1002/2016JD025586, 2017a. a, b, c
Yi, B., Rapp, A. D., Yang, P., Baum, B. A., and King, M. D.: A comparison of Aqua MODIS ice and liquid water cloud physical and optical properties between collection 6 and collection 5.1: cloud radiative effects, J. Geophys. Res.-Atmos., 122, 4550–4564, https://doi.org/10.1002/2016JD025654, 2017b. a, b, c
Zhang, Y., Macke, A., and Albers, F.: Effect of crystal size spectrum and crystal shape on stratiform cirrus radiative forcing, Atmos. Res., 52, 59–75, https://doi.org/10.1016/S0169-8095(99)00026-5, 1999. a
Ice clouds in the Arctic and mid-latitudes were investigated using in situ aircraft observations combining single-particle imaging with simultaneous light-scattering measurements. The joint characterisation of ice particle size, shape, and optical response shows that these clouds reflect substantially more solar radiation than is typically represented in models. The observations provide an empirical basis for improving the physical realism of ice cloud optical properties in climate models.
Ice clouds in the Arctic and mid-latitudes were investigated using in situ aircraft observations...