the Creative Commons Attribution 4.0 License.
the Creative Commons Attribution 4.0 License.
 | 13 Feb 2026
Temperature–RH dependent viscosity of organic aerosols from 273 to 303 K: implications for global N2O5 uptake
Atta Ullah
Mijung Song
Organic aerosol (OA) viscosity and phase state govern multiphase diffusion and reactivity, yet systematic constraints across tropospheric temperature (T)–relative humidity (RH) space remain limited. We measured the viscosity of sucrose-H2O droplets (OA surrogate) over 273–303 K and ∼ 20 %–90 % RH using bead-mobility and poke-and-flow methods, with viscosity spanning ∼ 8 orders of magnitude across the investigated RH range at each temperature. A Vogel–Fulcher–Tammann fit with experimentally derived fragility (Df= 13 ± 1) extended the parameterization by ∼ 43 K beyond the measurement range, to 230–310 K and 0 %–100 % RH, with substantial uncertainty at low temperatures. When coupled with zonal-mean tropospheric T–RH fields (2020–2024), the parameterization was used to infer global distributions of viscosity and organic-phase mixing time (τmix,org) for 200 nm particles, suggesting predominantly liquid states below ∼ 2 km, semisolid regimes across ∼ 2–9 km (latitude dependent), and near-glassy conditions at higher altitudes; with τmix,org typically being < 1 h in the boundary layer but often exceeding 1 h aloft. The resulting global fields highlight the potential atmospheric implications of temperature- and RH-sensitive viscosity across the troposphere. Calculations indicated the N2O5 uptake coefficient was generally ≥ 10−2 for liquid particles in the boundary layer, decreased by ∼ 1–2 orders above ∼ 2–4 km as bulk diffusion became rate-limiting; with surface hydrolysis, N2O5 uptake coefficient leveled near ∼ 10−3.5 aloft, and without it can drop to 10−5–10−6 at viscosity 109 Pa s. These results provide evidence for the need for T- and RH-sensitive viscosity in next-generation air-quality and climate models.
- Article
(3191 KB) - Full-text XML
-
Supplement
(13998 KB) - BibTeX
- EndNote


Organic aerosols (OAs), including both primary (POA) and secondary organic aerosol (SOA), are ubiquitous in the Earth's atmosphere. These aerosols play vital roles in climate, air quality, and human health through their interactions with solar radiation, cloud microphysics, and heterogeneous atmospheric chemistry (Pandis et al., 1992; Pöschl, 2005; McNeill, 2017; Su et al., 2020; Nault et al., 2021; Zhang et al., 2021; Wall et al., 2022; El Haddad et al., 2024; Bei et al., 2025; Manavi et al., 2025; Sun et al., 2025). In the troposphere, OA is frequently exposed to a wide range of relative humidity (RH) and temperature conditions, which drive phase transitions that profoundly modify its physicochemical properties.
Depending on chemical composition, RH, and temperature, OA can exist in liquid, semi-solid, and solid (amorphous or glassy) phase states (Koop et al., 2011; Reid et al., 2018). Dynamic viscosity serves as a useful parameter for classifying these states: viscosity < 102 Pa s corresponds to a liquid phase, 102≤ viscosity ≤ 1012 Pa s to a semi-solid phase, and viscosity > 1012 Pa s to a glassy phase (Koop et al., 2011; Reid et al., 2018). Accurate determination of aerosol viscosity and of the resulting phase state is critical for predicting heterogeneous reaction kinetics (Zhou et al., 2013; Marshall et al., 2018; Li and Knopf, 2021), particle size distributions (Shiraiwa and Seinfeld, 2012; Shiraiwa et al., 2013; Zaveri et al., 2018; Song et al., 2022), and ice nucleation (Ladino et al., 2014; Lienhard et al., 2015; Knopf et al., 2018). Highly viscous SOA matrices impede molecular diffusion, suppress oxidant uptake, and finally can alter SOA yields (Kuwata and Martin, 2012; Gržinić et al., 2015).
Over the past two decades, laboratory and modeling studies have established RH as a primary control on OA viscosity at near-room temperature, transitioning from liquid to semi-solid or glassy as RH decreases (Saukko et al., 2012; Lienhard et al., 2015; Song et al., 2015; Grayson et al., 2016; Song et al., 2016; Grayson et al., 2017; Shiraiwa et al., 2017; Song et al., 2019; Song et al., 2021; Gregson et al., 2023; Kiland et al., 2023; Gerrebos et al., 2024; Nikkho et al., 2024; Song et al., 2025). The role of chemical compositions on OA viscosities has also been widely explored, showing that parameters such as oxygen-to-carbon ratio, molar mass, functional group, and volatility variations can significantly affect the phase state and viscosity of OA (Koop et al., 2011; Grayson et al., 2017; Rothfuss and Petters, 2017a; Shiraiwa et al., 2017; DeRieux et al., 2018; Champion et al., 2019; Li et al., 2020b; Knopf et al., 2024). However, despite substantial progress on RH- and composition-dependence, the explicit role of temperature across the tropospheric range (230–310 K) remains poorly constrained. While experimental measurements and modeling efforts have been used investigate viscosity changes with temperature, including parameterizations based on the fragility parameter and Vogel-Fulcher-Tammann (VFT) frameworks (Rothfuss and Petters, 2017b; Petters et al., 2019; Kasparoglu et al., 2021; Kiland et al., 2023; Gerrebos et al., 2024), experimental studies that directly probe temperature-dependent viscosity remain scarce.
This gap in temperature-dependent viscosity data has significant implications for heterogeneous chemistry. For instance, high viscosity can suppress reactive gas uptake by several orders of magnitude (Shiraiwa et al., 2011; Slade and Knopf, 2014; Marshall et al., 2016; Li et al., 2020a; Li and Knopf, 2021). Modeling and observations have indicated that the presence of viscous organic shells or surfactant-rich surface layers can reduce the N2O5 uptake coefficient compared to liquid particles (McNeill et al., 2006; Cosman et al., 2008; Gaston et al., 2014; Ryder et al., 2015; Song et al., 2025). Therefore, improving our understanding of OA viscosity depending on atmospheric conditions, including temperature variations, is critical for accurately representing heterogeneous processes in atmospheric models.
In light of these uncertainties, we conducted a systematic experimental investigation of OA viscosity under tropospherically relevant temperature and RH conditions. In this study, sucrose was used as a model compound that has been widely employed as a laboratory proxy for SOA, particularly in investigations of aerosol viscosity, diffusion, and phase state (Zobrist et al., 2011; Power et al., 2013; Bateman et al., 2015; Chenyakin et al., 2017; Maclean et al., 2017; Kiland et al., 2019; Song et al., 2021). Viscosity was measured at 273, 283, 293, and 303 K and 20 %–90 % RH using bead-mobility and poke-and-flow techniques. The measured viscosity data were parameterized to construct a T–RH phase diagram for sucrose-H2O droplets. Based on parameterized viscosity, we analyzed global zonal-mean profiles of viscosity and the corresponding τmix,org within 200 nm sucrose-H2O droplets. Finally, we predicted heterogeneous N2O5 uptake coefficient across tropospheric T–RH conditions using the viscosity fields in a mechanistic framework that accounts for bulk diffusion and surface hydrolysis.
2.1 Materials and aerosol generation
Sucrose (99.5 % purity, Sigma-Aldrich) was dissolved in high-purity water (18 MΩ cm, Merck Millipore Synergy, Germany) to prepare approximately 10 wt % aqueous solutions. In all experiments, sucrose-H2O droplets were generated by nebulizing an aqueous solution with a low-internal-volume glass nebulizer (Meinhard, USA) and depositing them onto a hydrophobic substrate (Hampton Research, Canada). Using the droplets, we systematically determined their viscosity across four temperatures (273, 283, 293, and 303 K) and a wide range of RH conditions (20 %–90 %) via bead-mobility and poke-and-flow.
2.2 Viscosity measurements by bead-mobility technique (η≈ 10−3–103 Pa s)
The bead-mobility technique has been described in detail elsewhere (Renbaum-Wolff et al., 2013b; Renbaum-Wolff et al., 2013a; Song et al., 2015; Jeong et al., 2022); here, we briefly summarize the procedure as applied in this work. Insoluble melamine beads (∼ 1 µm, Cat. No. 86296, Sigma-Aldrich) were nebulized into sucrose-H2O droplets deposited on a hydrophobic substrate in a flow-cell (TSA12Gi, INSTEC, USA). A total N2 H2O gas flow of 1.2 L min−1 generated a uniform shear stress on the droplet surfaces at high RH (60 %–90 %) and temperature (273–303 K).
Prior to each bead-mobility measurement, sucrose-H2O droplets (diameter ∼ 40–100 µm) were held at the target temperature and RH (> ∼ 60 %) with a conditioning time of ∼ 10 min at 303, 293, and 283 K, and ∼ 30 min at 273 K. At each temperature, RH was decreased in increments of ∼ 5 %, with droplets conditioned at each RH prior to measurement. Equilibration was further assessed using the characteristic mixing time of water within the droplet matrix (), calculated as described in Sect. S1 (Table S1 in the Supplement). The conditioning times were selected experimentally to be substantially longer than the , ensuring rapid homogenization of water within the sucrose-H2O droplets. We note, however, that rapid internal mixing does not necessarily imply instantaneous equilibration with the surrounding water vapor. The conditioning times were therefore chosen conservatively to allow droplets to approach equilibrium before measurement. During the experiment, the bead motion in a droplet was recorded with an optical microscope (Olympus CKX53 with 40× objective, Japan) and a CCD camera (Hamamatsu C11440-42U30, Japan). The bead speed was then converted to viscosity using a calibration curve (Fig. S1 in the Supplement). Figure S2 shows representative bead movements within sucrose-H2O droplets at different temperatures. The corresponding mean bead speeds as a function of temperature and RH are presented in Fig. S3a, and the derived viscosities obtained using the calibration curve (Fig. S1) are shown in Fig. S3b. When the bead movements were too slow to measure, the poke-and-flow technique was applied.
2.3 Viscosity measurements by poke-and-flow (η > ∼ 103 Pa s)
The poke-and-flow technique is widely used to determine the viscosity of highly viscous single droplets (Renbaum-Wolff et al., 2013b; Grayson et al., 2015; Song et al., 2015; Gerrebos et al., 2024). In this study, sucrose-H2O droplets with diameters ranging from ∼ 20 to ∼ 40 µm on a hydrophobic glass substrate were conditioned in the flow-cell. At each temperature (273, 283, 293, and 303 K), RH was systematically reduced from approximately 60 % to lower levels in discrete steps (typically ∼ 5 %), and the poke-and-flow method was applied until either viscous flow or particle fracture was observed. The required conditioning time of each droplet for the poke-and-flow experiment was determined for each RH-T setting and is described in Sect. S1 and Table S1. After equilibration, each droplet was poked using a fine needle (Jung Rim Medical Industrial, South Korea), mounted on a micromanipulator (Narishige, model MO-152, Japan). The morphological evolution of the droplets before, during, and after poking was monitored via optical microscopy (Olympus CKX53 with a 40× objective, Japan) and captured using a CCD camera (Hamamatsu, C11440-42U30, Japan).
The experimental flow time (τexp,flow) was defined as the time required for the diameter of the central cavity to reduce to 50 % of its value immediately after poking. Figure S4 presents representative optical images showing the morphological evolution of sucrose-H2O droplets at ∼ 50 % RH for 273–303 K during the experiment. Averaged τexp,flow, reflecting temperature, and RH dependence are summarized in Fig. S5a. These values of sucrose-H2O droplets were then converted to the viscosity using the equation proposed by Sellier et al. (2015) resulting viscosities shown in Fig. S5b. At lower RH, brittle cracking without relaxation after poking was observed as shown in Fig. S6. When restorative flow was not detected after more than 2 h, we assigned the viscosity as ∼ 1 × 10⁸ Pa s (Renbaum-Wolff et al., 2013b; Song et al., 2019; Maclean et al., 2021a; Song et al., 2021; Jeong et al., 2022).
2.4 Determination of fragility parameter and glassy phase transition
To determine the fragility parameter (Df), which describes how sensitively viscosity responds to temperature changes, we fitted our experimentally measured viscosity data, spanning a temperature range of 273–303 K and RH ∼ 20 %–90 %, to the VFT equation (Eq. 1).
where η(RH, T) is the viscosity at a given RH and temperature, η∞= 1 × 10⁻⁵ Pa s represents the high-temperature limiting viscosity in the VFT formulation (Angell, 1991). This parameter reflects the liquid-like behavior of the material at high temperature and should be distinguished from the glass-transition viscosity, typically ∼ 1012 Pa s. The parameter T0(RH) is the RH-dependent Vogel temperature, which can be obtained by rearranging Eq. (1):
where η(RH, 293 K) is the viscosity at 293 K, estimated using a mole-fraction-based Arrhenius mixing rule in which the organic mole fraction (xorg) is obtained from water activity (aw) via a mass-based hygroscopicity parameter kappa (κ) using Eq. (S2.3). Fitting this formulation to the measured viscosity–RH data at 293 K yields κ= 0.061 ± 0.0023 (Fig. S7); details of the parametrization are provided in Sect. S2. Figure S8 shows the resulting best-fit value for Df as 13 ± 1, which is derived directly from temperature-dependent viscosity measurements using a global fitting approach, as described in the Sect. S3. While prior studies often relied on assumed or literature-based Df values (generally ∼ 10) for various SOA types (DeRieux et al., 2018; Maclean et al., 2021b; Gregson et al., 2023; Kiland et al., 2023). This work provides, to our knowledge, the first experimentally constrained estimate of Df based on the temperature-dependent viscosity measurements of sucrose-H2O droplets, rather than relying on an assumed value.
2.5 Collection of global zonal RH and temperature
For the global analysis of aerosol phase state, we used the temperature and RH fields from the ECMWF ERA5 reanalysis (ERA5 monthly averaged data on pressure levels) obtained from the Copernicus Climate Data Store. (Hersbach et al., 2023). Monthly mean fields for 2020–2024 were retrieved, zonally averaged, and converted from pressure coordinates to geometric altitude using the hypsometric equation to derive latitude-altitude profiles of temperature and RH. The resulting latitude–altitude distributions of temperature and RH were then combined with the laboratory viscosity parameterization to construct zonal and global maps of viscosity and phase state. Additional details on data processing and zonal averaging are provided in Sect. S4. The ERA5 fields averaged over 2020–2024 were used to represent recent tropospheric temperature and RH conditions.
2.6 Estimation of N2O5 uptake coefficient
Estimates of the N2O5 uptake coefficient on sucrose-H2O droplets ( were obtained using a resistor-model framework (Ammann et al., 2013; Gržinić et al., 2015), following the same methods used in our previous study (Song et al., 2025). Here, we briefly summarize the approach, with full mathematical details provided in Sect. S5.
In this framework, the uptake coefficient is governed by resistances associated with surface accommodation, surface reaction, and bulk diffusion–reaction within the particle. For organic aerosols with elevated viscosity, bulk diffusion typically dominates the overall resistance, whereas surface-related terms contribute weakly to the RH dependence of .
Viscosity was first calculated as a function of temperature and RH using the VFT parametrization detailed in Sect. 2.4. The diffusion coefficient of N2O5 in the particle was then derived from this viscosity using a fractional Stokes–Einstein relationship, and the resulting diffusion coefficients were used to compute within the resistor-model framework. In this framework, the bulk hydrolysis of N2O5 was treated as a first-order process, with the intrinsic hydrolysis rate coefficient kI assumed to be temperature-independent and held constant across the applied temperature range. The surface reaction term was fixed at 2.5 × 10⁻⁴, and the intrinsic hydrolysis rate constant was set to 4.1 ns−1, following previous laboratory and modeling studies (Gržinić et al., 2015; Galib and Limmer, 2021).
The N2O5 uptake calculations presented here are intended to illustrate how the experimentally constrained viscosity parameterization influences reactive uptake across tropospheric RH and temperature conditions. These estimates should be interpreted in light of the limitations of this study, including the extrapolation of viscosity beyond the experimental temperature range (273–303 K).
3.1 Temperature and RH-dependent viscosities of sucrose-H2O droplets
Figure 1 illustrates the effect of temperature on the viscosity of sucrose-H2O droplets across a range of RH. In this study, we systematically investigated viscosity changes at four specific temperatures, 273, 283, 293, and 303 K, across a 30 K range and RH values from ∼ 20 % to ∼ 90 %. The results show that, across this combined temperature–RH space, the viscosity of sucrose-H2O droplets spans approximately eight orders of magnitude. At 293 K, the current result agrees with previous studies (Power et al., 2013; Renbaum-Wolff et al., 2013a; Grayson et al., 2015; Song et al., 2015; Song et al., 2016; Song et al., 2021; Jeong et al., 2022), confirming the robustness of our measurements. At other temperatures, however, viscosity data are scarce, and thus our study provides systematic experimental benchmarks across 273–303 K, filling a critical gap in the literature.
As the temperature increased from 273 to 303 K, viscosity consistently decreased, with the magnitude of reduction depending on RH. For example, at high RH (∼ 74 %–80 %), the mean viscosity decreased by approximately one order of magnitude, from ∼ 1.2 × 101 Pa s at 273 K to ∼ 1.9 × 100 Pa s at 303 K, corresponding to a liquid state (Fig. 1). At mid RH (∼ 50 %), increasing the temperature from 273 to 303 K reduced the viscosity from ∼ 2.1 × 10⁶ Pa s at 273 K to ∼ 1.4 × 10³ Pa s at 303 K, remaining within the semi-solid regime over the investigated temperature range. This behavior was directly observed in optical images recorded during poke-and-flow experiments (Fig. S4), which revealed contrasts in the τexp,flow, with faster recovery at higher temperatures and much slower relaxation at lower temperatures.
At lower RH, the droplets exhibited brittle cracking by poking at all temperatures. The cracking RH threshold decreased systematically with increasing temperature: ∼ 38 % RH at 273 K, ∼ 33 % at 283 K, ∼ 24 % at 293 K, and ∼ 18 % at 303 K (Fig. S6). Once a fracture occurred, no restorative flow was observed for more than two hours, indicating the lower-limit viscosity of ∼ 1 × 10⁸ Pa s, consistent with the particle behaving as a semisolid or solid (Renbaum-Wolff et al., 2013b; Grayson et al., 2015; Song et al., 2019). The viscosity difference associated with a 30 K temperature shift became increasingly pronounced at lower RH, indicating the combined sensitivity of OA phase behavior to both temperature and RH.
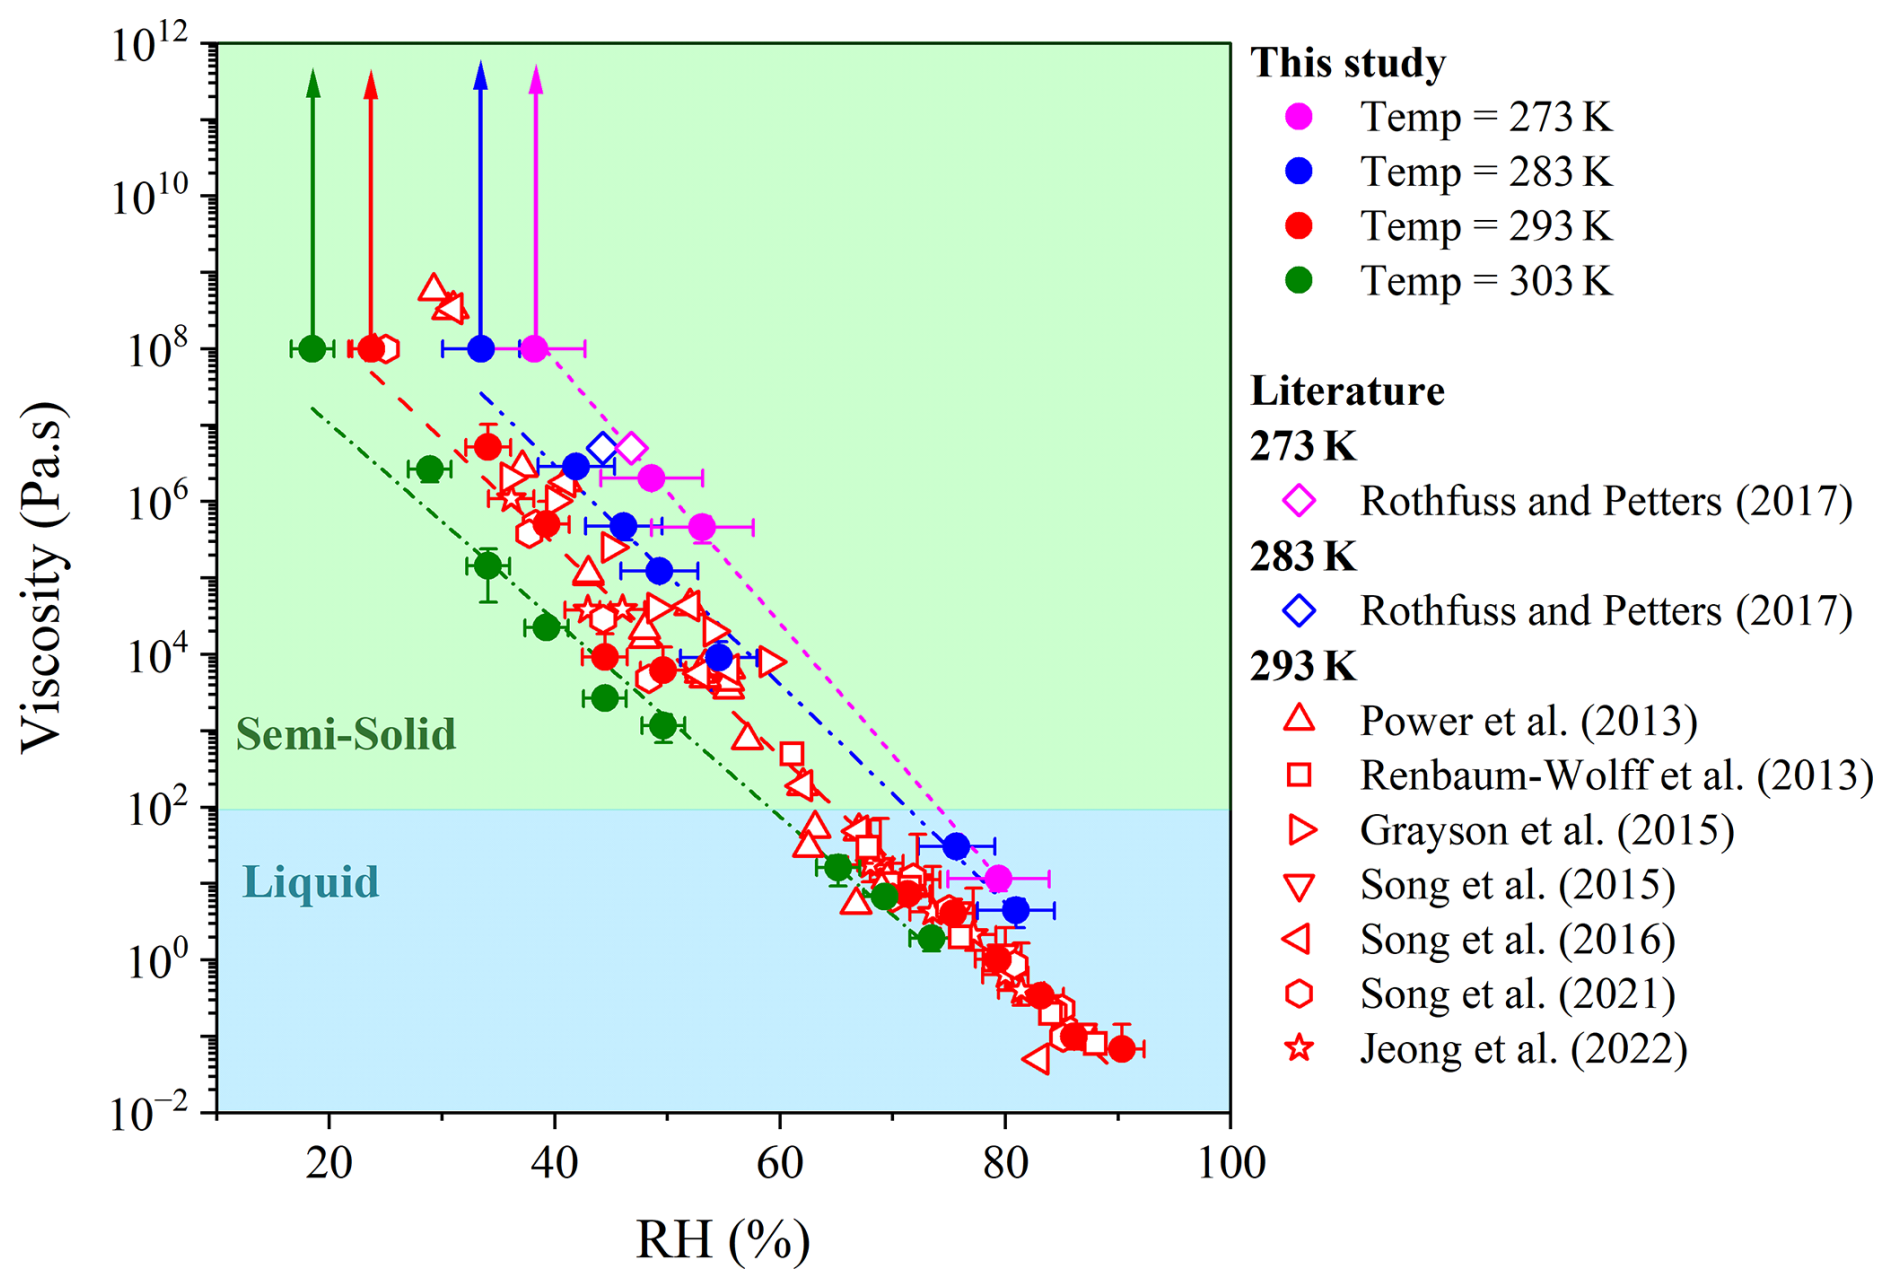
Figure 1Viscosity data for sucrose-H2O droplets obtained from bead mobility and poke-and-flow experiments at 273 ± 1 K (magenta circles), 283 ± 1 K (blue circles), 293 ± 1 K (red circles), and 303 ± 1 K (green circles) across a RH range of 20 %–90 %. The x-axis error bars represent the RH range in a given experiment and the uncertainty in RH measurements. the y-error bars show the standard deviation in the measured viscosity calculated from 3–5 beads across 2–5 particles. Dotted lines represent linear fits to the viscosity data obtained in this study at each temperature, with line colors matching the symbol colors for the corresponding temperatures. Experimental data from previous studies are included for comparison (Power et al., 2013; Renbaum-Wolff et al., 2013a; Grayson et al., 2015; Song et al., 2015; Song et al., 2016; Rothfuss and Petters, 2017b; Song et al., 2021; Jeong et al., 2022).
We then extended the results with the VFT equation (Eqs. 1 and 2) and the viscosity parameterization described in Sect. S2 (see Eq. S2.1 in the Supplement) to calculate viscosity across a wider range of RH (0 %–100 %) and temperature (230–310 K), using the fragility parameter (Df= 13 ± 1) directly derived from our experimental measurements. Figure 2 illustrates the resulting RH–temperature phase diagram, in which contour lines (isopleths) represent levels of constant viscosity.
The orientation of these isopleths varied systematically with temperature. At low temperatures (T < 240 K, representative of the upper troposphere, ∼ 8–12 km), the isopleths exhibited very steep slopes in RH–temperature space, indicating that viscosity was dominated by RH such that even small increases in RH lead to orders-of-magnitude decreases in viscosity. In this regime, the liquid–semi-solid phase boundary (black dashed line) likewise showed a steep slope, reflecting the strong RH sensitivity of the phase transition. Between 240 and 280 K (typical of the middle troposphere, ∼ 3–8 km), the isopleths displayed more moderate slopes, indicating a combined influence of both temperature and RH on viscosity and phase state. At higher temperatures (280–310 K, representative of the lower troposphere, ∼ 0–3 km), the isopleths and the phase boundary showed gentler slopes, consistent with reduced RH sensitivity and a comparatively stronger temperature control on viscosity. Although the phase diagram spanned the full 0 %–100 % RH range to illustrate potential behavior, its interpretation should be considered in the context of RH and temperature conditions encountered in the troposphere, which vary regionally and seasonally.
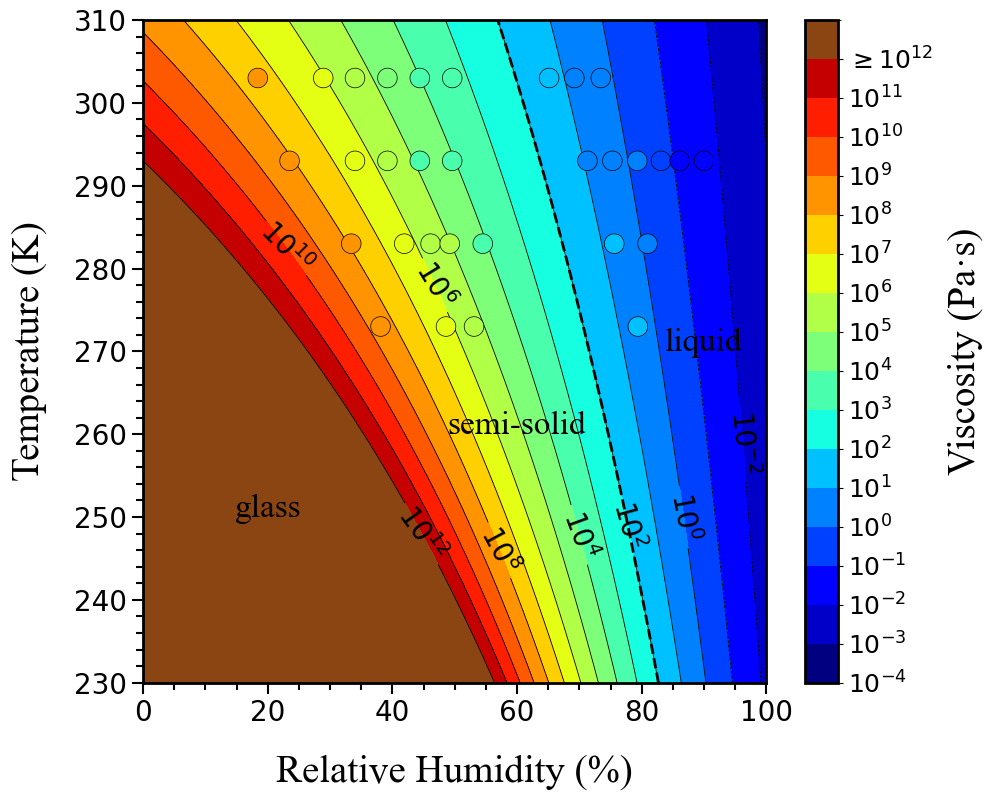
Figure 2Phase diagram showing viscosity isopleths for sucrose-H2O droplets as a function of temperature and RH. Viscosity isopleths were computed using the VFT parametrization, with the Df obtained by fitting the experimental viscosity data (Fig. S8). Overlaid circles show the experimental data points for viscosity measured at specific temperature and RH conditions as shown in Fig. 1. The black dash line indicates the transition from liquid to semi-solid of the sucrose-H2O droplet. The brown area represents the temperature and RH conditions where the sucrose-H2O droplets exhibit a glassy state.
3.2 Viscosity and mixing times of sucrose-H2O droplets and implications for global N2O5 uptake
Building on the phase diagram in Fig. 2, we applied the VFT equations (Eqs. 1 and 2), together with viscosity parameterization (Eq. S2.1), to reanalysis-based RH and temperature fields to derive global distributions of viscosity and mixing times under tropospheric conditions. For this purpose, ambient RH and temperature data from the ECMWF ERA5 reanalysis were used, employing multi-year monthly mean fields averaged from 2020 to 2024 to represent recent tropospheric conditions (Fig. S9 and Sects. 2.5 and S4). Figure 3 presents the zonal-mean distributions of (a) viscosity and (b) τmix,org within 200 nm of sucrose-H2O droplets as a function of latitude and altitude. The τmix,org was calculated from the viscosity values using the fractional Stokes–Einstein equation as described in Sect. S1 (Eq. S1.5).
In Fig. 3a, zonal-mean viscosity values of sucrose-H2O droplets revealed a clear vertical stratification: liquid phase states dominated below ∼ 2 km, semi-solid states existed between ∼ 2 and ∼ 9 km depending on latitude, and glassy states emerged above ∼ 9 km. At high southern latitudes (> 70° S), liquid phases extended to ∼ 3–4 km above the surface (Fig. 3a), higher than in the tropics and northern polar regions, where liquid states were typically confined below ∼ 2 km. This persistence was consistent with the high RH (> 80 %) observed in these regions (Fig. S9), which enhanced water uptake and plasticization of the organic matrix, thereby delaying the formation of highly viscous or glassy phase states. Semi-solid regimes likewise extended to higher altitudes in polar regions than in the midlatitudes, reflecting the moderating influence of RH on the transition to glassy states. Compared with global SOA phase-state fields derived using regionally resolved meteorology and chemically complex mixtures (Shiraiwa et al., 2017; Maclean et al., 2021b), our estimates based on zonal-mean T–RH fields and a single-component sucrose-H2O surrogate tended to yield lower Tg T values, reflecting both zonal averaging and the strong plasticization of sucrose-H2O droplets by water, and should be interpreted in light of additional uncertainty associated with extrapolation beyond the experimental temperature range.
Using the sucrose viscosity data, Fig. 3b shows the calculated τmix,org of organic molecules in 200 nm particles. The results indicated that τmix,org of sucrose-H2O droplets, was shorter than 1 h throughout the lower troposphere (< ∼ 2 km). Above ∼ 2–9 km, τmix,org of sucrose-H2O droplets frequently exceeded 1 h in the middle to upper troposphere. Under these conditions, sucrose-H2O droplets may not remain in equilibrium with ambient RH because slow water diffusion can prevent condensed-phase water activity from equilibrating with gas-phase RH, particularly at low temperatures and high viscosities (Berkemeier et al., 2014). This contrasts with the approach adopted in regional and global atmospheric models (e.g., EMAC, GEOS-Chem), which generally assume that semi-volatile organic compounds mix and equilibrate within particles on timescales comparable to the model time step (typically sub-hour to ∼ 1 h) (Maclean et al., 2017; Shiraiwa et al., 2017; Luu et al., 2025). Under conditions where our calculated mixing times substantially exceed these timescales, such models are therefore likely to underestimate kinetic limitations in the troposphere. Sensitivity tests using an alternative Df= 10, which is widely used as an assumed value in previous studies (Maclean et al., 2021b; Kiland et al., 2023; Gerrebos et al., 2025), produced broadly similar latitude–altitude patterns of viscosity and τmix,org (Fig. S12).
Viscosity-induced diffusion limitation has direct consequences for heterogeneous chemistry. For example, highly viscous sucrose matrices suppress the transport of N2O5 and water into particle bulk, potentially lowering reactive uptake coefficients by orders of magnitude. Conversely, under warm and humid conditions, liquefaction increases diffusivity, enhancing uptake. Using our parameterized viscosity fields, we estimated that in the midlatitude upper troposphere, suppressed uptake could extend over several short periods, particularly in winter. This aligns with recent field observations showing reduced N2O5 loss rates in cold conditions (Wagner et al., 2013; Zhang et al., 2025). While these results are presented here as a case study, they illustrate the strong temperature dependence of multiphase reactivity.
For liquid particles, the N2O5 uptake coefficient was generally higher than ∼ 10−2, and was most prevalent in the atmospheric boundary layer. When altitude exceeds ∼ 2–4 km depending on latitudes, N2O5 uptake coefficient decreased by 1–2 orders of magnitude, implying that the N2O5 uptake rates were limited by slow bulk diffusion within viscous particles, which may lead to decreased concentrations of particulate nitrates or increased gas-phase NO3 (You et al., 2012). On highly viscous or glassy particles, surface hydrolysis can dominate the uptake. As shown in Fig. 3c, N2O5 uptake coefficient was leveled off near ∼ 10−3.5 at higher altitudes, because the surface reaction term (Γs) was fixed at 2.5 × 10⁻⁴ in Eq. (S5.1). Sensitivity simulations excluding surface hydrolysis (Γs was set to be 0 in Eq. S5.1 decreased) to 10−5–10−6 when the viscosity was higher than ∼ 109 Pa s (Fig. S11), in which case N2O5 uptake is only limited by bulk diffusivity, and hence particle viscosity (Gržinić et al., 2015; Song et al., 2025).
By directly constraining temperature-dependent viscosity across a 30 K range and coupling it to global RH–temperature fields, this study could provide novel experimental datasets for assessing OA phase behavior under realistic tropospheric conditions. These results highlight the necessity of incorporating temperature- and RH- sensitive viscosity parameterizations into next-generation air quality and climate models to more accurately predict particle lifetimes, reactivity, and cloud interactions.
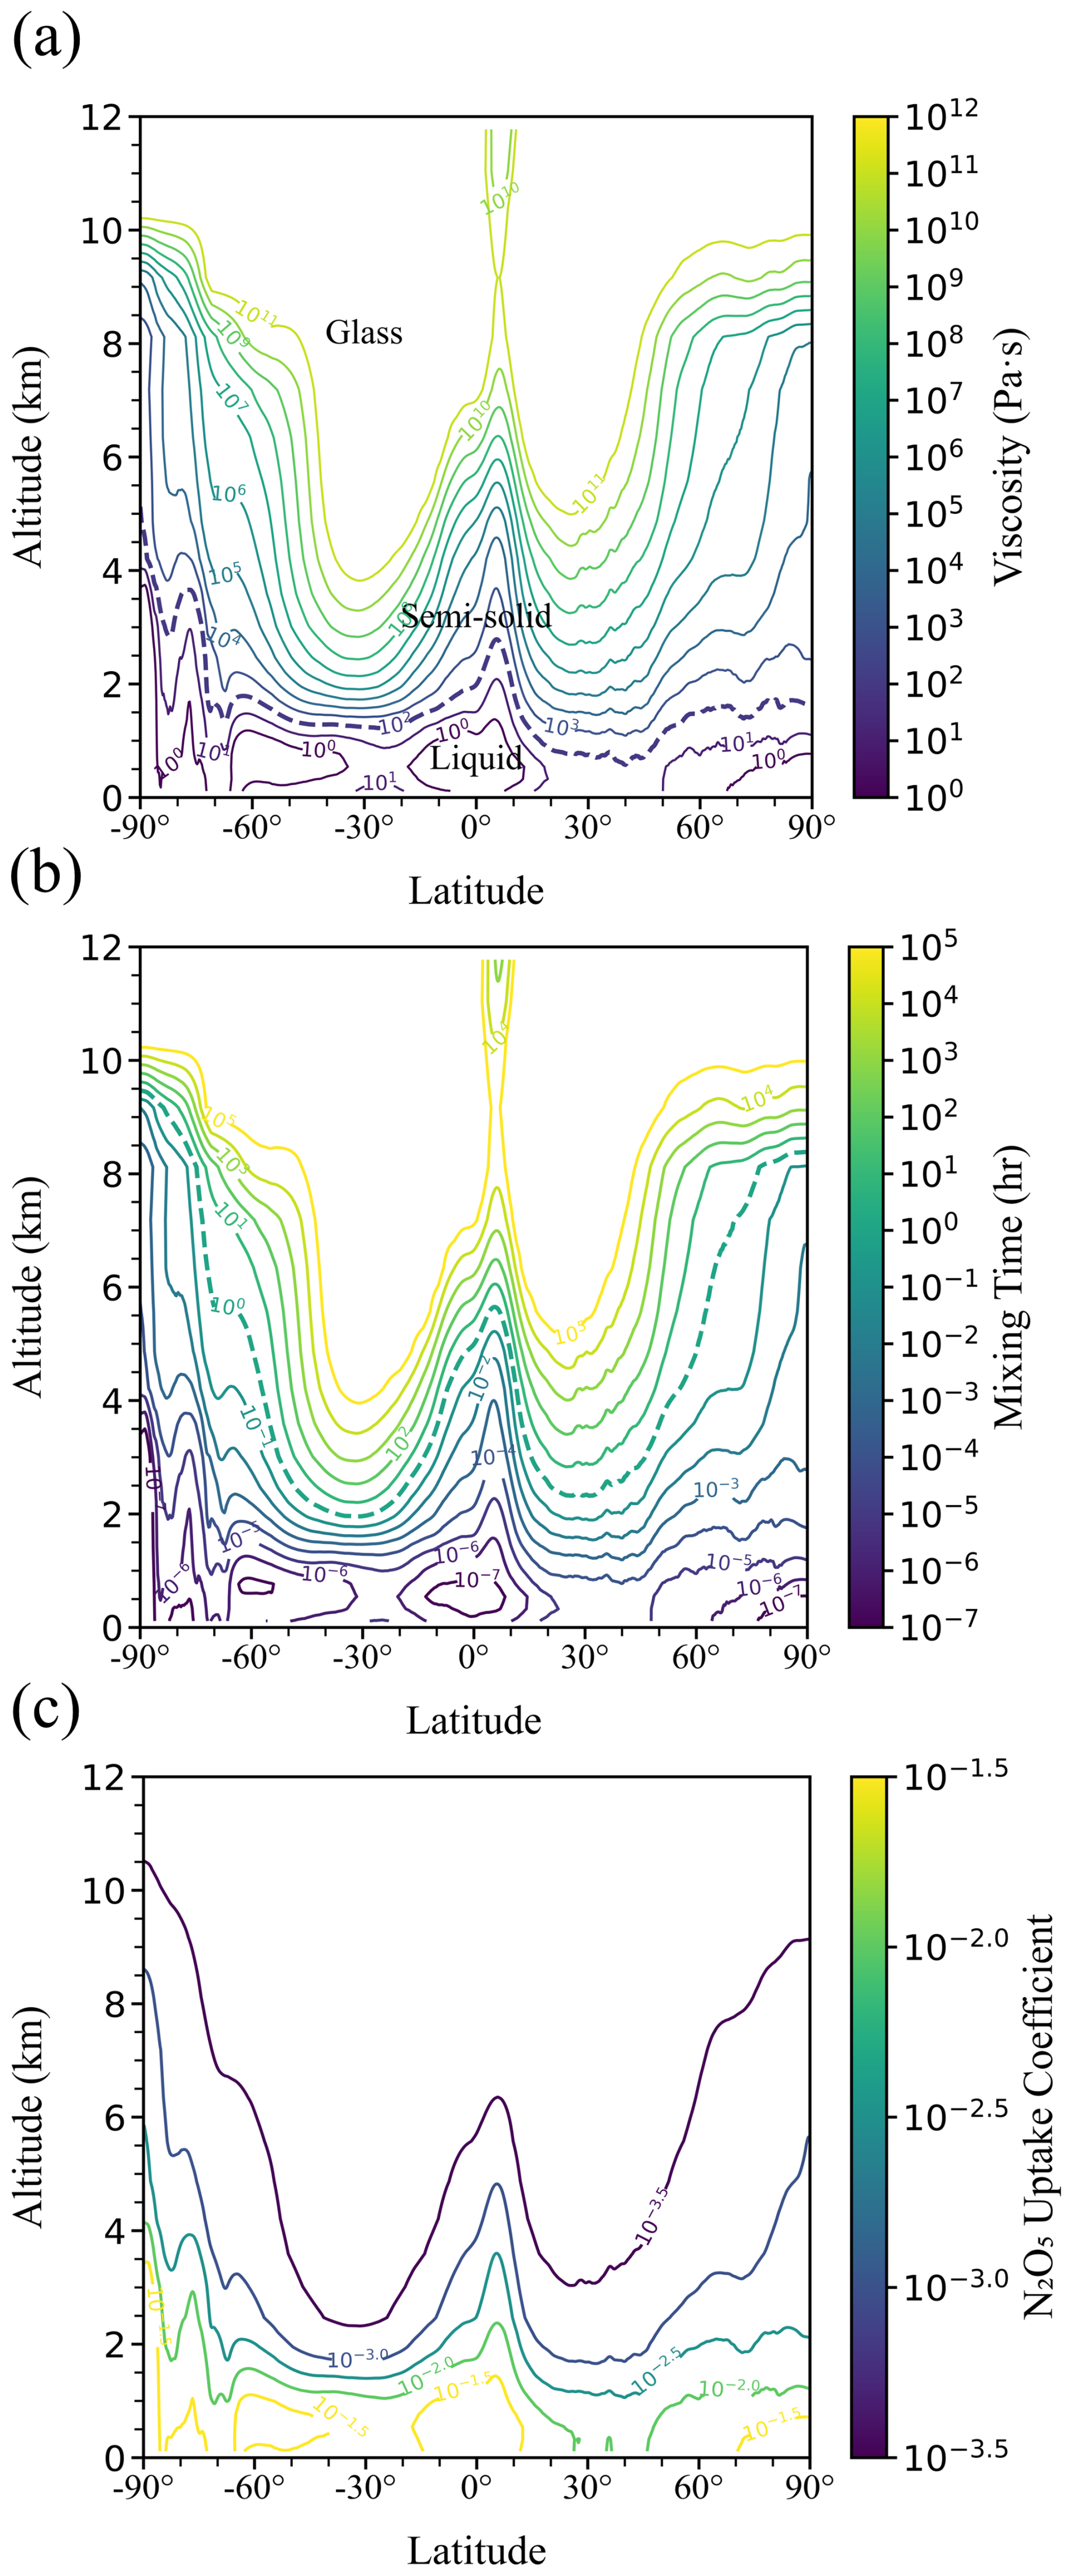
Figure 3Annual zonal-mean global profiles for (a) viscosity (b) mixing times of organic molecules, and (c) N2O5 uptake coefficient in 200 nm sucrose-H2O droplets as a function of altitude and latitude based on average annual RH and temperature fields for the years 2020 to 2024, obtained from Copernicus Climate Data Store (https://cds.climate.copernicus.eu/, last access: 14 May 2025). The purple dashed line in panel (a) shows the viscosity for 102 Pa s. The green dashed line in (b) shows the mixing time of 1 h. Seasonal variability of the viscosity and mixing times for sucrose-H2O droplets is shown in Fig. S10.
In this study, we experimentally measured the viscosity of sucrose–H2O droplets, used as a proxy for SOA, over a temperature range of 273–303 K and RH of ∼ 20 %–90 % using bead-mobility and poke-and-flow techniques. Across this combined temperature–RH space, viscosity spanned approximately eight orders of magnitude. At high RH (> ∼ 80 %), droplets exhibited liquid behavior across the investigated temperature range, with viscosity decreasing modestly as temperature increased from 273 to 303 K. At intermediate RH (∼ 50 %), increasing temperature from 273 to 303 K reduced viscosity by up to three orders of magnitude, while droplets remained highly viscous and exhibited semisolid behavior. At lower RH, droplets showed brittle cracking during poke-and-flow experiments. Notably, cracking occurred at higher RH at lower temperatures, whereas at higher temperatures cracking was observed only at lower RH, with no observable restorative flow once fracture occurred, consistent with viscosities reaching the experimental lower-limit values (∼ 108 Pa s).
Based on these experimentally constrained viscosity measurements, a VFT formulation with an experimentally derived fragility parameter (Df= 13 ± 1) was used to extend the viscosity parameterization across a broader tropospheric temperature–RH space. Specifically, the VFT-based viscosity parameterization was extrapolated by ∼ 43 K beyond the experimentally constrained temperature range to explore colder tropospheric conditions; however, this low-temperature extrapolation can introduce substantial uncertainty and should be interpreted qualitatively. Application of this framework to zonal-mean tropospheric temperature and RH fields suggested a vertically stratified aerosol phase state, with predominantly liquid behavior near the surface, a transition to semisolid states aloft, and increasingly diffusion-limited conditions toward the upper troposphere. Consistent with this stratification, τmix,org was inferred to remain shorter than ∼ 1 h in the boundary layer but to frequently exceed ∼ 1 h at higher altitudes, implying that equilibrium assumptions may not hold under cold and dry tropospheric conditions. As a result, diffusion-limited heterogeneous processes, such as N2O5 uptake, were inferred to be less efficient aloft than in the boundary layer.
While uncertainties remain due to extrapolation beyond the experimental temperature range, this study provides experimentally constrained temperature–RH-dependent viscosity data and a physically grounded framework for assessing aerosol phase state, mixing behavior, and diffusion-limited heterogeneous chemistry under tropospheric conditions. Future work should extend viscosity measurements to lower temperatures and RH, incorporate chemically complex organic–inorganic aerosol systems, and explicitly evaluate viscosity-dependent mixing and reactivity in atmospheric models to further reduce uncertainties in multiphase process representations.
Underlying material and related data for this paper are provided in the Supplement.
The supplement related to this article is available online at https://doi.org/10.5194/acp-26-2319-2026-supplement.
M.S. designed this study. A.U. and M.S. conducted viscosity experiments and analyzed the data. Y.L. calculated the reactive uptake of N2O5. A.U., Y.L., and M.S. wrote the manuscript.
The contact author has declared that none of the authors has any competing interests.
Publisher's note: Copernicus Publications remains neutral with regard to jurisdictional claims made in the text, published maps, institutional affiliations, or any other geographical representation in this paper. The authors bear the ultimate responsibility for providing appropriate place names. Views expressed in the text are those of the authors and do not necessarily reflect the views of the publisher.
We thank Gyoung Hee Go for technical support.
This work was supported by the National Research Foundation of Korea (NRF) grant funded by the Korea government (MSIT) (RS-2024-00335536), by Global – Learning & Academic research institution for Master's PhD students, and Postdocs (LAMP) Program of the NRF grant funded by the Ministry of Education (no. RS-2024-00443714), and by National Natural Science Foundation of China for funding (nos. 42330605 and 42475124).
This paper was edited by Markus Ammann and reviewed by two anonymous referees.
Ammann, M., Cox, R. A., Crowley, J. N., Jenkin, M. E., Mellouki, A., Rossi, M. J., Troe, J., and Wallington, T. J.: Evaluated kinetic and photochemical data for atmospheric chemistry: Volume VI – heterogeneous reactions with liquid substrates, Atmos. Chem. Phys., 13, 8045–8228, https://doi.org/10.5194/acp-13-8045-2013, 2013.
Angell, C. A.: Relaxation in liquids, polymers and plastic crystals – strong/fragile patterns and problems, J. Non-Cryst. Solids, 131–133, 13–31, https://doi.org/10.1016/0022-3093(91)90266-9, 1991.
Bateman, A. P., Bertram, A. K., and Martin, S. T.: Hygroscopic influence on the semisolid-to-liquid transition of secondary organic materials, J. Phys. Chem. A, 119, 4386–4395, https://doi.org/10.1021/jp508521c, 2015.
Bei, N., Xiao, B., Wang, R., Yang, Y., Liu, L., Han, Y., and Li, G.: Impacts of aerosol–radiation and aerosol–cloud interactions on a short-term heavy-rainfall event – a case study in the Guanzhong Basin, China, Atmos. Chem. Phys., 25, 10931–10948, https://doi.org/10.5194/acp-25-10931-2025, 2025.
Berkemeier, T., Shiraiwa, M., Pöschl, U., and Koop, T.: Competition between water uptake and ice nucleation by glassy organic aerosol particles, Atmos. Chem. Phys., 14, 12513–12531, https://doi.org/10.5194/acp-14-12513-2014, 2014.
Champion, W. M., Rothfuss, N. E., Petters, M. D., and Grieshop, A. P.: Volatility and viscosity are correlated in terpene secondary organic aerosol formed in a flow reactor, Environ. Sci. Technol. Lett., 6, 513–519, https://doi.org/10.1021/acs.estlett.9b00412, 2019.
Chenyakin, Y., Ullmann, D. A., Evoy, E., Renbaum-Wolff, L., Kamal, S., and Bertram, A. K.: Diffusion coefficients of organic molecules in sucrose–water solutions and comparison with Stokes–Einstein predictions, Atmos. Chem. Phys., 17, 2423–2435, https://doi.org/10.5194/acp-17-2423-2017, 2017.
Cosman, L. M., Knopf, D. A., and Bertram, A. K.: N2O5 reactive uptake on aqueous sulfuric acid solutions coated with branched and straight-chain insoluble organic surfactants, J. Phys. Chem. A, 112, 2386–2396, https://doi.org/10.1021/jp710685r, 2008.
DeRieux, W.-S. W., Li, Y., Lin, P., Laskin, J., Laskin, A., Bertram, A. K., Nizkorodov, S. A., and Shiraiwa, M.: Predicting the glass transition temperature and viscosity of secondary organic material using molecular composition, Atmos. Chem. Phys., 18, 6331–6351, https://doi.org/10.5194/acp-18-6331-2018, 2018.
El Haddad, I., Vienneau, D., Daellenbach, K. R., Modini, R., Slowik, J. G., Upadhyay, A., Vasilakos, P. N., Bell, D., de Hoogh, K., and Prevot, A. S. H.: Opinion: How will advances in aerosol science inform our understanding of the health impacts of outdoor particulate pollution?, Atmos. Chem. Phys., 24, 11981–12011, https://doi.org/10.5194/acp-24-11981-2024, 2024.
Galib, M. and Limmer, D. T.: Reactive uptake of N2O5 by atmospheric aerosol is dominated by interfacial processes, Science, 371, https://doi.org/10.1126/science.abd7716, 2021.
Gaston, C. J., Thornton, J. A., and Ng, N. L.: Reactive uptake of N2O5 to internally mixed inorganic and organic particles: the role of organic carbon oxidation state and inferred organic phase separations, Atmos. Chem. Phys., 14, 5693–5707, https://doi.org/10.5194/acp-14-5693-2014, 2014.
Gerrebos, N. G., Browning, L. P., Nikkho, S., Chartrand, E. R., Zaks, J., Wu, C., and Bertram, A. K.: Two-phase morphology and drastic viscosity changes in biomass burning organic aerosol after hydroxyl radical aging, Environ. Sci. Atmos., https://doi.org/10.1039/d5ea00084j, 2025.
Gerrebos, N. G. A., Zaks, J., Gregson, F. K. A., Walton-Raaby, M., Meeres, H., Zigg, I., Zandberg, W. F., and Bertram, A. K.: High viscosity and two phases observed over a range of relative humidities in biomass burning organic aerosol from canadian wildfires, Environ. Sci. Technol., 58, 21716–21728, https://doi.org/10.1021/acs.est.4c09148, 2024.
Grayson, J. W., Song, M., Sellier, M., and Bertram, A. K.: Validation of the poke-flow technique combined with simulations of fluid flow for determining viscosities in samples with small volumes and high viscosities, Atmos. Meas. Tech., 8, 2463–2472, https://doi.org/10.5194/amt-8-2463-2015, 2015.
Grayson, J. W., Zhang, Y., Mutzel, A., Renbaum-Wolff, L., Böge, O., Kamal, S., Herrmann, H., Martin, S. T., and Bertram, A. K.: Effect of varying experimental conditions on the viscosity of α-pinene derived secondary organic material, Atmos. Chem. Phys., 16, 6027–6040, https://doi.org/10.5194/acp-16-6027-2016, 2016.
Grayson, J. W., Evoy, E., Song, M., Chu, Y., Maclean, A., Nguyen, A., Upshur, M. A., Ebrahimi, M., Chan, C. K., Geiger, F. M., Thomson, R. J., and Bertram, A. K.: The effect of hydroxyl functional groups and molar mass on the viscosity of non-crystalline organic and organic–water particles, Atmos. Chem. Phys., 17, 8509–8524, https://doi.org/10.5194/acp-17-8509-2017, 2017.
Gregson, F. K. A., Gerrebos, N. G. A., Schervish, M., Nikkho, S., Schnitzler, E. G., Schwartz, C., Carlsten, C., Abbatt, J. P. D., Kamal, S., Shiraiwa, M., and Bertram, A. K.: Phase behavior and viscosity in biomass burning organic aerosol and climatic impacts, Environ. Sci. Technol., 57, 14548–14557, https://doi.org/10.1021/acs.est.3c03231, 2023.
Gržinić, G., Bartels-Rausch, T., Berkemeier, T., Türler, A., and Ammann, M.: Viscosity controls humidity dependence of N2O5 uptake to citric acid aerosol, Atmos. Chem. Phys., 15, 13615–13625, https://doi.org/10.5194/acp-15-13615-2015, 2015.
Hersbach, H., Bell, B., Berrisford, P., Biavati, G., Horányi, A., Muñoz Sabater, J., Nicolas, J., Peubey, C., Radu, R., and Rozum, I.: ERA5 monthly averaged data on pressure levels from 1940 to present, Copernicus Climate Change Service (C3S) [data set], https://doi.org/10.24381/cds.6860a573, 2023.
Jeong, R., Lilek, J., Zuend, A., Xu, R., Chan, M. N., Kim, D., Moon, H. G., and Song, M.: Viscosity and physical state of sucrose mixed with ammonium sulfate droplets, Atmos. Chem. Phys., 22, 8805–8817, https://doi.org/10.5194/acp-22-8805-2022, 2022.
Kasparoglu, S., Li, Y., Shiraiwa, M., and Petters, M. D.: Toward closure between predicted and observed particle viscosity over a wide range of temperatures and relative humidity, Atmos. Chem. Phys., 21, 1127–1141, https://doi.org/10.5194/acp-21-1127-2021, 2021.
Kiland, K. J., Maclean, A. M., Kamal, S., and Bertram, A. K.: Diffusion of organic molecules as a function of temperature in a sucrose matrix (a proxy for secondary organic aerosol), J. Phys. Chem. Lett., 10, 5902–5908, https://doi.org/10.1021/acs.jpclett.9b02182, 2019.
Kiland, K. J., Mahrt, F., Peng, L., Nikkho, S., Zaks, J., Crescenzo, G. V., and Bertram, A. K.: Viscosity, glass formation, and mixing times within secondary organic aerosol from biomass burning phenolics, ACS Earth and Space Chem., 7, 1388–1400, https://doi.org/10.1021/acsearthspacechem.3c00039, 2023.
Knopf, D. A., Alpert, P. A., and Wang, B.: The role of organic aerosol in atmospheric ice nucleation: a review, ACS Earth Space Chem., 2, 168–202, https://doi.org/10.1021/acsearthspacechem.7b00120, 2018.
Knopf, D. A., Ammann, M., Berkemeier, T., Pöschl, U., and Shiraiwa, M.: Desorption lifetimes and activation energies influencing gas–surface interactions and multiphase chemical kinetics, Atmos. Chem. Phys., 24, 3445–3528, https://doi.org/10.5194/acp-24-3445-2024, 2024.
Koop, T., Bookhold, J., Shiraiwa, M., and Pöschl, U.: Glass transition and phase state of organic compounds: dependency on molecular properties and implications for secondary organic aerosols in the atmosphere, Phys. Chem. Chem. Phys., 13, 19238–19255, https://doi.org/10.1039/c1cp22617g, 2011.
Kuwata, M. and Martin, S. T.: Phase of atmospheric secondary organic material affects its reactivity, Proc. Natl. Acad. Sci. U.S.A., 109, 17354–17359, https://doi.org/10.1073/pnas.1209071109, 2012.
Ladino, L. A., Zhou, S., Yakobi-Hancock, J. D., Aljawhary, D., and Abbatt, J.: Factors controlling the ice nucleating abilities of α-pinene SOA particles, J. Geophys. Res. Atmos., 119, 9041–9051, https://doi.org/10.1002/2014jd021578, 2014.
Li, J., Forrester, S. M., and Knopf, D. A.: Heterogeneous oxidation of amorphous organic aerosol surrogates by O3, NO3, and OH at typical tropospheric temperatures, Atmos. Chem. Phys., 20, 6055–6080, https://doi.org/10.5194/acp-20-6055-2020, 2020a.
Li, J. N. and Knopf, D. A.: Representation of multiphase OH oxidation of amorphous organic aerosol for tropospheric conditions, Environ. Sci. Technol., 55, 7266–7275, https://doi.org/10.1021/acs.est.0c07668, 2021.
Li, Y., Day, D. A., Stark, H., Jimenez, J. L., and Shiraiwa, M.: Predictions of the glass transition temperature and viscosity of organic aerosols from volatility distributions, Atmos. Chem. Phys., 20, 8103–8122, https://doi.org/10.5194/acp-20-8103-2020, 2020b.
Lienhard, D. M., Huisman, A. J., Krieger, U. K., Rudich, Y., Marcolli, C., Luo, B. P., Bones, D. L., Reid, J. P., Lambe, A. T., Canagaratna, M. R., Davidovits, P., Onasch, T. B., Worsnop, D. R., Steimer, S. S., Koop, T., and Peter, T.: Viscous organic aerosol particles in the upper troposphere: diffusivity-controlled water uptake and ice nucleation?, Atmos. Chem. Phys., 15, 13599–13613, https://doi.org/10.5194/acp-15-13599-2015, 2015.
Luu, R., Schervish, M., June, N. A., O'Donnell, S. E., Jathar, S. H., Pierce, J. R., and Shiraiwa, M.: Global simulations of phase state and equilibration time scales of secondary organic aerosols with GEOS-Chem, ACS Earth Space Chem., 9, 288–302, https://doi.org/10.1021/acsearthspacechem.4c00281, 2025.
Maclean, A. M., Butenhoff, C. L., Grayson, J. W., Barsanti, K., Jimenez, J. L., and Bertram, A. K.: Mixing times of organic molecules within secondary organic aerosol particles: a global planetary boundary layer perspective, Atmos. Chem. Phys., 17, 13037–13048, https://doi.org/10.5194/acp-17-13037-2017, 2017.
Maclean, A. M., Smith, N. R., Li, Y., Huang, Y., Hettiyadura, A. P. S., Crescenzo, G. V., Shiraiwa, M., Laskin, A., Nizkorodov, S. A., and Bertram, A. K.: Humidity-dependent viscosity of secondary organic aerosol from ozonolysis of β-caryophyllene: measurements, predictions, and implications, ACS Earth and Space Chem., 5, 305–318, https://doi.org/10.1021/acsearthspacechem.0c00296, 2021a.
Maclean, A. M., Li, Y., Crescenzo, G. V., Smith, N. R., Karydis, V. A., Tsimpidi, A. P., Butenhoff, C. L., Faiola, C. L., Lelieveld, J., Nizkorodov, S. A., Shiraiwa, M., and Bertram, A. K.: Global distribution of the phase state and mixing times within secondary organic aerosol particles in the troposphere based on room-temperature viscosity measurements, ACS Earth and Space Chem., 5, 3458–3473, https://doi.org/10.1021/acsearthspacechem.1c00296, 2021b.
Manavi, S. E. I., Aktypis, A., Siouti, E., Skyllakou, K., Myriokefalitakis, S., Kanakidou, M., and Pandis, S. N.: Atmospheric aerosol spatial variability: Impacts on air quality and climate change, One Earth, 8, https://doi.org/10.1016/j.oneear.2025.101237, 2025.
Marshall, F., Berkemeier, T., Shiraiwa, M., Nandy, L., Ohm, P., Dutcher, C. S., and Reid, J. P.: Influence of particle viscosity on mass transfer and heterogeneous ozonolysis kinetics in aqueous–sucrose–maleic acid aerosol, Phys. Chem. Chem. Phys., 20, 15560–15573, https://doi.org/10.1039/c8cp01666f, 2018.
Marshall, F. H., Miles, R. E. H., Song, Y.-C., Ohm, P. B., Power, R. M., Reid, J. P., and Dutcher, C. S.: Diffusion and reactivity in ultraviscous aerosol and the correlation with particle viscosity, Chem. Sci., 7, 1298–1308, https://doi.org/10.1039/C5SC03223G, 2016.
McNeill, V. F.: Atmospheric aerosols: clouds, chemistry, and climate, Annu. Rev. Chem. Biomol. Eng., 8, 427–444, https://doi.org/10.1146/annurev-chembioeng-060816-101538, 2017.
McNeill, V. F., Patterson, J., Wolfe, G. M., and Thornton, J. A.: The effect of varying levels of surfactant on the reactive uptake of N2O5 to aqueous aerosol, Atmos. Chem. Phys., 6, 1635–1644, https://doi.org/10.5194/acp-6-1635-2006, 2006.
Nault, B. A., Jo, D. S., McDonald, B. C., Campuzano-Jost, P., Day, D. A., Hu, W., Schroder, J. C., Allan, J., Blake, D. R., Canagaratna, M. R., Coe, H., Coggon, M. M., DeCarlo, P. F., Diskin, G. S., Dunmore, R., Flocke, F., Fried, A., Gilman, J. B., Gkatzelis, G., Hamilton, J. F., Hanisco, T. F., Hayes, P. L., Henze, D. K., Hodzic, A., Hopkins, J., Hu, M., Huey, L. G., Jobson, B. T., Kuster, W. C., Lewis, A., Li, M., Liao, J., Nawaz, M. O., Pollack, I. B., Peischl, J., Rappenglück, B., Reeves, C. E., Richter, D., Roberts, J. M., Ryerson, T. B., Shao, M., Sommers, J. M., Walega, J., Warneke, C., Weibring, P., Wolfe, G. M., Young, D. E., Yuan, B., Zhang, Q., de Gouw, J. A., and Jimenez, J. L.: Secondary organic aerosols from anthropogenic volatile organic compounds contribute substantially to air pollution mortality, Atmos. Chem. Phys., 21, 11201–11224, https://doi.org/10.5194/acp-21-11201-2021, 2021.
Nikkho, S., Bai, B., Mahrt, F., Zaks, J., Peng, L., Kiland, K. J., Liu, P. F., and Bertram, A. K.: Secondary organic aerosol from biomass burning phenolic compounds and nitrate radicals can be highly viscous over a wide relative humidity range, Environ. Sci. Technol., 58, 21702–21715, https://doi.org/10.1021/acs.est.4c06235, 2024.
Pandis, S. N., Harley, R. A., Cass, G. R., and Seinfeld, J. H.: Secondary organic aerosol formation and transport, Atmos. Environ. Part A. General Topics, 26, 2269–2282, https://doi.org/10.1016/0960-1686(92)90358-r, 1992.
Petters, S. S., Kreidenweis, S. M., Grieshop, A. P., Ziemann, P. J., and Petters, M. D.: Temperature- and humidity-dependent phase states of secondary organic aerosols, Geophys. Res. Lett., 46, 1005–1013, https://doi.org/10.1029/2018GL080563, 2019.
Pöschl, U.: Atmospheric aerosols: composition, transformation, climate and health effects, Angew. Chem.-Int. Ed., 44, 7520–7540, https://doi.org/10.1002/anie.200501122, 2005.
Power, R. M., Simpson, S. H., Reid, J. P., and Hudson, A. J.: The transition from liquid to solid-like behaviour in ultrahigh viscosity aerosol particles, Chem. Sci., 4, 2597–2604, https://doi.org/10.1039/c3sc50682g, 2013.
Reid, J. P., Bertram, A. K., Topping, D., Laskin, A., Martin, S. T., Petters, M. D., Pope, F. D., and Rovelli, G.: The viscosity of atmospherically relevant organic particles, Nat. Commun., 9, 956–956, https://doi.org/10.1038/s41467-018-03027-z, 2018.
Renbaum-Wolff, L., Grayson, J. W., and Bertram, A. K.: Technical Note: New methodology for measuring viscosities in small volumes characteristic of environmental chamber particle samples, Atmos. Chem. Phys., 13, 791–802, https://doi.org/10.5194/acp-13-791-2013, 2013a.
Renbaum-Wolff, L., Grayson, J. W., Bateman, A. P., Kuwata, M., Sellier, M., Murray, B. J., Shilling, J. E., Martin, S. T., and Bertram, A. K.: Viscosity of α-pinene secondary organic material and implications for particle growth and reactivity, Proc. Natl. Acad. Sci. U.S.A., 110, 8014–8019, https://doi.org/10.1073/pnas.1219548110, 2013b.
Rothfuss, N. E. and Petters, M. D.: Influence of functional groups on the viscosity of organic aerosol, Environ. Sci. Technol., 51, 271–279, https://doi.org/10.1021/acs.est.6b04478, 2017a.
Rothfuss, N. E. and Petters, M. D.: Characterization of the temperature and humidity-dependent phase diagram of amorphous nanoscale organic aerosols, Phys. Chem. Chem. Phys., 19, 6532–6545, https://doi.org/10.1039/c6cp08593h, 2017b.
Ryder, O. S., Campbell, N. R., Morris, H., Forestieri, S., Ruppel, M. J., Cappa, C., Tivanski, A., Prather, K., and Bertram, T. H.: Role of organic coatings in regulating N2O5 reactive uptake to sea spray aerosol, J. Phys. Chem. A, 119, 11683–11692, https://doi.org/10.1021/acs.jpca.5b08892, 2015.
Saukko, E., Lambe, A. T., Massoli, P., Koop, T., Wright, J. P., Croasdale, D. R., Pedernera, D. A., Onasch, T. B., Laaksonen, A., Davidovits, P., Worsnop, D. R., and Virtanen, A.: Humidity-dependent phase state of SOA particles from biogenic and anthropogenic precursors, Atmos. Chem. Phys., 12, 7517–7529, https://doi.org/10.5194/acp-12-7517-2012, 2012.
Sellier, M., Grayson, J. W., Renbaum-Wolff, L., Song, M., and Bertram, A. K.: Estimating the viscosity of a highly viscous liquid droplet through the relaxation time of a dry spot, J. Rheol., 59, 733–750, https://doi.org/10.1122/1.4917240, 2015.
Shiraiwa, M. and Seinfeld, J. H.: Equilibration timescale of atmospheric secondary organic aerosol partitioning, Geophys. Res. Lett., 39, https://doi.org/10.1029/2012gl054008, 2012.
Shiraiwa, M., Ammann, M., Koop, T., and Pöschl, U.: Gas uptake and chemical aging of semisolid organic aerosol particles, Proc. Natl. Acad. Sci. U.S.A., 108, 11003–11008, https://doi.org/10.1073/pnas.1103045108, 2011.
Shiraiwa, M., Yee, L. D., Schilling, K. A., Loza, C. L., Craven, J. S., Zuend, A., Ziemann, P. J., and Seinfeld, J. H.: Size distribution dynamics reveal particle-phase chemistry in organic aerosol formation, Proc. Natl. Acad. Sci. U.S.A., 110, 11746–11750, https://doi.org/10.1073/pnas.1307501110, 2013.
Shiraiwa, M., Li, Y., Tsimpidi, A. P., Karydis, V. A., Berkemeier, T., Pandis, S. N., Lelieveld, J., Koop, T., and Pöschl, U.: Global distribution of particle phase state in atmospheric secondary organic aerosols, Nat. Commun., 8, 15002–15002, https://doi.org/10.1038/ncomms15002, 2017.
Slade, J. H. and Knopf, D. A.: Multiphase OH oxidation kinetics of organic aerosol: The role of particle phase state and relative humidity, Geophys. Res. Lett., 41, 5297–5306, https://doi.org/10.1002/2014gl060582, 2014.
Song, M., Liu, P. F., Hanna, S. J., Li, Y. J., Martin, S. T., and Bertram, A. K.: Relative humidity-dependent viscosities of isoprene-derived secondary organic material and atmospheric implications for isoprene-dominant forests, Atmos. Chem. Phys., 15, 5145–5159, https://doi.org/10.5194/acp-15-5145-2015, 2015.
Song, M., Liu, P. F., Hanna, S. J., Zaveri, R. A., Potter, K., You, Y., Martin, S. T., and Bertram, A. K.: Relative humidity-dependent viscosity of secondary organic material from toluene photo-oxidation and possible implications for organic particulate matter over megacities, Atmos. Chem. Phys., 16, 8817–8830, https://doi.org/10.5194/acp-16-8817-2016, 2016.
Song, M., Li, Y., Seong, C., Yang, H., Jang, K.-S., Wu, Z., Lee, J. Y., Matsuki, A., and Ahn, J.: Direct observation of liquid–liquid phase separation and core–shell morphology of PM2.5 collected from three northeast Asian cities and implications for N2O5 hydrolysis, ACS ES&T Air, 2, 1079–1088, https://doi.org/10.1021/acsestair.5c00043, 2025.
Song, M., Maclean, A. M., Huang, Y., Smith, N. R., Blair, S. L., Laskin, J., Laskin, A., DeRieux, W.-S. W., Li, Y., Shiraiwa, M., Nizkorodov, S. A., and Bertram, A. K.: Liquid–liquid phase separation and viscosity within secondary organic aerosol generated from diesel fuel vapors, Atmos. Chem. Phys., 19, 12515–12529, https://doi.org/10.5194/acp-19-12515-2019, 2019.
Song, M., Jeong, R., Kim, D., Qiu, Y., Meng, X., Wu, Z., Zuend, A., Ha, Y., Kim, C., Kim, H., Gaikwad, S., Jang, K.-S., Lee, J. Y., and Ahn, J.: Comparison of phase states of PM2.5 over megacities, Seoul and Beijing, and their implications on particle size distribution, Environ. Sci. Technol., 56, 17581–17590, https://doi.org/10.1021/acs.est.2c06377, 2022.
Song, Y.-C., Lilek, J., Lee, J. B., Chan, M. N., Wu, Z., Zuend, A., and Song, M.: Viscosity and phase state of aerosol particles consisting of sucrose mixed with inorganic salts, Atmos. Chem. Phys., 21, 10215–10228, https://doi.org/10.5194/acp-21-10215-2021, 2021.
Su, H., Cheng, Y. F., and Pöschl, U.: New multiphase chemical processes influencing atmospheric aerosols, air quality, and climate in the Anthropocene, Acc. Chem. Res., 53, 2034–2043, https://doi.org/10.1021/acs.accounts.0c00246, 2020.
Sun, Y. L., Luo, H., Li, Y., Zhou, W., Xu, W. Q., Fu, P. Q., and Zhao, D. F.: Atmospheric organic aerosols: online molecular characterization and environmental impacts, npj Clim. Atmos. Sci., 8, https://doi.org/10.1038/s41612-025-01199-2, 2025.
Wagner, N. L., Riedel, T. P., Young, C. J., Bahreini, R., Brock, C. A., Dubé, W. P., Kim, S., Middlebrook, A. M., Öztürk, F., Roberts, J. M., Russo, R., Sive, B., Swarthout, R., Thornton, J. A., VandenBoer, T. C., Zhou, Y., and Brown, S. S.: N2O5 uptake coefficients and nocturnal NO2 removal rates determined from ambient wintertime measurements, J. Geophys. Res. Atmos., 118, 9331–9350, https://doi.org/10.1002/jgrd.50653, 2013.
Wall, C. J., Norris, J. R., Possner, A., Mccoy, D. T., Mccoy, I. L., and Lutsko, N. J.: Assessing effective radiative forcing from aerosol-cloud interactions over the global ocean, Proc. Natl. Acad. Sci. U.S.A., 119, https://doi.org/10.1073/pnas.2210481119, 2022.
You, Y., Renbaum-Wolff, L., Carreras-Sospedra, M., Hanna, S. J., Hiranuma, N., Kamal, S., Smith, M. L., Zhang, X., Weber, R. J., and Shilling, J. E.: Images reveal that atmospheric particles can undergo liquid–liquid phase separations, Proc. Natl. Acad. Sci. U.S.A., 109, 13188–13193, https://doi.org/10.1073/pnas.1206414109, 2012.
Zaveri, R. A., Shilling, J. E., Zelenyuk, A., Liu, J., Bell, D. M., D'Ambro, E. L., Gaston, C. J., Thornton, J. A., Laskin, A., Lin, P., Wilson, J. M., Easter, R. C., Wang, J., Bertram, A. K., Martin, S. T., Seinfeld, J. H., and Worsnop, D. R.: Growth kinetics and size distribution dynamics of viscous secondary organic aerosol, Environ. Sci. Technol., 52, 1191–1199, https://doi.org/10.1021/acs.est.7b04623, 2018.
Zhang, T., Zuo, P., Chen, Y., Liu, T., Zeng, L., Lin, W., and Ye, C.: Measurement report: Variations and environmental impacts of atmospheric N2O5 concentrations in urban Beijing during the 2022 Winter Olympics, EGUsphere, 2025, https://doi.org/10.5194/egusphere-2025-2210, 2025.
Zhang, Y., Liu, P., Han, Y., Li, Y., Chen, Q., Kuwata, M., and Martin, S. T.: Aerosols in Atmospheric Chemistry, ACS In Focus, American Chemical Society, https://doi.org/10.1021/acsinfocus.7e5020, 2021.
Zhou, S., Shiraiwa, M., McWhinney, R. D., Pöschl, U., and Abbatt, J. P. D.: Kinetic limitations in gas-particle reactions arising from slow diffusion in secondary organic aerosol, Faraday Discuss., 165, 391–406, https://doi.org/10.1039/c3fd00030c, 2013.
Zobrist, B., Soonsin, V., Luo, B. P., Krieger, U. K., Marcolli, C., Peter, T., and Koop, T.: Ultra-slow water diffusion in aqueous sucrose glasses, Phys. Chem. Chem. Phys., 13, 3514–3526, https://doi.org/10.1039/c0cp01273d, 2011.