the Creative Commons Attribution 4.0 License.
the Creative Commons Attribution 4.0 License.
 | 06 Feb 2026
Why observed and modelled ozone production rates and sensitives differ, a case study at rural site in China
Bin Jiang
Bowen Zhong
Tao Zhang
Duohong Chen
Yuhong Zhai
Li Zhong
Zhijiong Huang
Junqing Luo
Minhui Deng
Mao Xiao
Jianhui Jiang
Jing Li
Min Shao
Ground-level ozone (O3) pollution has recently become of increasing concern in China. Studies have shown that conventional models often fail to predict accurately the net O3 production rate (P(O3)net) due to the absence of certain mechanisms, particularly the kinetics from missing reactive volatile organic compounds (VOCs) species, and hence affects the reliability of evaluation for O3 formation sensitivity (OFS). Therefore, we conducted a field observation of P(O3)net and OFS using a P(O3)net (NPOPR) detection system based on a dual-channel reaction chamber technique at the Guangdong Atmospheric Supersite of China in Heshan, Pearl River Delta (PRD) in autumn of 2023. The in-situ monitoring data were then compared with results from a zero-dimensional model incorporating the Master Chemical Mechanism (MCM v3.3.1). We tested the model performance by incorporating parameterization for 4 processes including HO2 uptake by ambient aerosols, dry deposition, N2O5 uptake, and ClNO2 photolysis, and found that the discrepancies between the modelled P(O3)net (P(O3)net_Mod) and measured data (P(O3)net_Mea) did not change evidently, the maximum daily P(O3)net differed by ∼ 44.8 %. Meanwhile, we found that the agreement of OFS assessment results between the direct measurements and the modelling study was lower in the P(O3)net rising phase (08:00–09:00 LT, 63.6 %) than in the P(O3)net stable phase (10:00–12:00 LT, 72.7 %) and P(O3)net declining phase (13:00–17:00 LT, 72.7 %). The results in this study reflected that unmeasured oxygenated VOCs (OVOCs) were the most effective compensating factor for the discrepancies between observed and computed P(O3)net and OFS, hinting clearly at the importance of quantitative understanding the total reactivity of VOCs in O3 chemistry.
- Article
(4157 KB) - Full-text XML
-
Supplement
(3268 KB) - BibTeX
- EndNote


Ground-level ozone (O3) pollution has garnered widespread attention due to its adverse effects on human health (Chen et al., 2023), vegetation growth (Wang et al., 2017b), and climate change (Li et al., 2016). Since the implementation of the Air Pollution Prevention and Control Action Plan by the State Council in 2013, particulate matter pollution in China has significantly decreased. However, ground-level O3 pollution remains severe, and O3 has become the primary pollutant affecting air quality in China (China Environmental Status Bulletin, 2013–2024). The variation in ground-level O3 concentration is influenced by local photochemical production, surface deposition, and transport processes, which the following equation can express:
In Eq. (1), represents the change in O3 concentration, P(O3)net denotes the net O3 photochemical production rate, ud is the O3 deposition rate, H stands for the mixed layer height, and υ represents the wind speed. The in-situ photochemical production of ground-level O3 primarily results from the photochemical reactions of precursors volatile organic compounds (VOCs) and nitrogen oxides (NOx: NO + NO2) under sunlight. The sensitivity of O3 formation to its precursors is defined as the O3 formation sensitivity (OFS), which can be classified into three regimes: NOx-limited, VOC-limited, or mixed sensitivity (Seinfeld and Pandis, 2016; Sillman, 1999). In an NOx-limited regime, the VOC NOx ratio is high and O3 production is controlled primarily by changes in NOx. In a VOC-limited regime, the VOC NOx ratio is low, so O3 decreases with additional NOx and increases with higher VOCs. In the mixed-sensitivity regime, O3 rises when either NOx or VOC emissions increase (Wang et al., 2019). The P(O3)net is a critical indicator for evaluating local photochemical formation. The budget analysis of ground-level O3 production (P(O3)) and consumption (D(O3)) can be calculated using the following equations:
Equations (2)–(4) illustrate the nonlinear dependence of the P(O3)net on the oxidation of precursors generating HOx (= OH + HO2) (Tong et al., 2025). Here, the P(O3)net is the difference between P(O3) and D(O3), kM+N is the reaction rate constant between two molecules, φi represents the amount of NO2 generated from the reaction of RO2,i with NO2, and i denotes different RO2 species. Currently, mainstream model simulation methods for calculating the P(O3)net primarily involve indirectly solving radical concentrations. However, existing models cannot fully characterize the complex radical cycling processes in the real atmosphere (Wei et al., 2023). Specifically, the incomplete mechanisms of ROx (= OH + HO2 + RO2) sources are particularly prominent, and these missing mechanisms affect the accuracy of RO2 and HO2 radical estimations to varying degrees. These include the neglect of contributions from carbonyl compounds, HONO, and OVOCs (Xu et al., 2022), as well as incomplete mechanisms for heterogeneous reactions on aerosol surfaces (Yang et al., 2022), dry deposition (Zhang et al., 2003), nitrosyl chloride photolysis (Whalley et al., 2021), and isomerization of isoprene peroxy radicals (Kanaya et al., 2012) remain inadequately understood. These gaps lead to systematic biases in the simulated P(O3)net (Woodward-Massey et al., 2023; Tan et al., 2017, 2019), thereby affecting the accurate determination of OFS.
It is noteworthy that there is a strong causal relationship between the aforementioned mechanistic biases and the misjudgment of OFS. Studies by Baier et al. (2017) and Tan et al. (2019) found that the observation-based model (OBM) significantly underestimates P(O3)net under high NOx conditions, leading to misjudgment of OFS. They pointed out that the unresolved VOC species and unspecified chemical mechanisms in the model are the primary causes of these biases. Similarly, Whalley et al. (2021) demonstrated that the zero-dimensional (box) model exhibits deviations in simulating P(O3)net under high VOCs concentrations. Further research by Wang et al. (2024b) highlighted that the contribution of unidentified VOCs reactivity in anthropogenic emissions to O3 formation is severely underestimated, and the missing VOC species and chemical mechanisms in existing models lead to biases in the determination of OFS. Such diagnostic biases in OFS may result in misjudgment of precursor emission reduction measures, thereby affecting the effectiveness of O3 pollution control.
Direct measurement of P(O3)net based on the dual-reaction chamber technique can address the aforementioned challenges. This concept was first proposed by Jeffries (1971), who suggested determining the real value of the P(O3)net in ambient air by comparing the difference in Ox (= O3 + NO2) between a photochemical reaction chamber and a reference chamber. To date, several P(O3)net detection systems based on the dual-reaction chamber technique have been developed, referred to as measurement of O3 production sensor (MOPS), O3 production rate measurement system (O3PR), O3 production rates instrument (OPRs), net photochemical O3 production rate detection system (NPOPR), Mea-OPR, or O3 production rate-cavity ring-down spectroscopy system (OPR-CRDS) (Baier et al., 2015; Cazorla and Brune, 2010; Cazorla et al., 2012; Sadanaga et al., 2017; Sklaveniti et al., 2018; Hao et al., 2023; Wang et al., 2024c; Tong et al., 2025). Through practical applications in field observations, scholars generally agree that these detection systems offer rapid stability and high precision, with measurement uncertainties ranged from 10 %–30 %. Comparative studies have revealed that the underestimation of the simulated P(O3)net can reach up to 50 % (Cazorla et al., 2012), highlighting the limitations of existing models in characterizing radical chemistry.
More importantly, the P(O3)net detection system can diagnose OFS by quantifying changes in the measured P(O3)net induced by different precursors through precursor addition experiments. Sklaveniti et al. (2018) first detected OFS in Indiana by adding NO to the sampling line of P(O3)net detection systems, demonstrating the feasibility of directly measuring OFS with this device. Morino et al. (2023) combined a smog chamber with the P(O3)net detection systems to directly measure OFS under baseline environmental conditions in Tokyo during summer. Chen et al. (2024) proposed the OPR_Adj parameter based on the P(O3)net detection systems, which, through normalization of photolysis rates, diagnosed that O3 photochemistry in Beijing is under VOCs control. These advancements indicate that the direct measurement method of OFS based on the P(O3)net not only measures the actual OFS in ambient air but also quantifies the discrepancies between models and measurements.
In this study, we employed the developed NPOPR detection system based on the dual-reaction chamber technique to measure the P(O3)net and OFS at the Guangdong Atmospheric Supersite of China in Heshan City, Pearl River Delta (PRD), in October 2023. Based on the observational data, we used the box model equipped with the Master Chemical Mechanism (MCM v3.3.1) to simulate the radical chemistry during the observation period. We compared and investigated the differences and influencing factors between the model-simulated values (abbreviated as P(O3)net_Mod) and the directly measured values (abbreviated as P(O3)net_Mea) in calculating the P(O3)net and assessing OFS.
2.1 Field measurements
Field observations were continuously conducted from 4–26 October 2023 at the Guangdong Atmospheric Supersite of China in Heshan City, located in northern Jiangmen, Guangdong Province (112.93° E, 22.73° N). The supersite is situated in the downwind area of Guangzhou, Foshan, and Dongguan, a region characterized by active secondary reactions and serving as a receptor for pollution transported from the industrial and urban centers (Luo et al., 2025; Huang et al., 2020). The surrounding area is primarily composed of farmland conservation zones and forested regions, with no major industrial sources. The supersite sits on a small mountain ∼ 3 km from the nearest area heavy traffic corridor; at the observed mean wind speed of 2.8 m s−1, the air mass from the corridor takes ∼ 17 min to arrive. This separation limits spatial heterogeneity in both emissions and chemical composition, making the site well-suited for comprehensive monitoring and research on complex regional air pollution in the PRD (Mazaheri et al., 2019). The geographical location is shown in Fig. S1 in the Supplement.
The P(O3)net detection system (NPOPR), based on the dual-reaction chamber technique, was used to monitor the P(O3)net and OFS. This system has been successfully applied in multiple field observation campaigns (Hao et al., 2023; Zhou et al., 2024a, b). The detection system consists of a sampling unit, a monitoring unit, and a data acquisition unit. Ambient air passes through a Teflon particulate filter (7592-104, Whatman, UK) to remove particles larger than 2 µm before entering the dual chambers. The reaction chamber and the reference chamber are made of two identical quartz tubes (inner diameter: 190.5 mm, length: 700 mm, wall thickness: 5 mm). Unlike the reaction chamber, which allows ultraviolet light to penetrate and initiate photochemical reactions, the reference chamber is covered with an ultraviolet protective film (SH2CLAR, 3M, Japan) to block light with wavelengths below 390 nm, thereby preventing O3 formation in the reference chamber. A custom circuit control system alternates the gas flow between the reaction chamber and the reference chamber into the NO reaction tube every 2 min, where the O3 is converted to NO2, which is then introduced into a Cavity Attenuated Phase Shift (CAPS)-NO2 analyzer (Aerodyne Research, Inc., Billerica MA, USA). The gas not introduced into the NO reaction tube is expelled through an auxiliary pump. The data acquisition system detects NO2, including both ambient NO2 and NO2 converted from O3. By combining the average residence time (τ) of the gas in the chambers and the difference in Ox (Ox = (O3 + NO2)) between the two chambers, the P(O3)net_Mea can be calculated as Eq. (5):
The mean residence time in the reaction chamber is 0.15 h at the air flow rate of 2.1 L min−1, and the limit of detection (LOD) of the NPOPR detection system is 0.86 ppbv h−1 at the sampling air flow rate of 2.1 L min−1, which is obtained as three times the measurement error of P(O3)net (Hao et al., 2023). The time resolution of the P(O3)net measurement is 4 min. Our previous study demonstrated that P(O3)net more directly reflects the photochemical O3 formation potential from local precursors and is less affected by transport processes compared to O3 concentrations (Zhou et al., 2024b). The measurement error of P(O3)net is determined by the uncertainty in the Ox mixing ratio estimated for both the reaction and reference chambers. This uncertainty combines (i) the measurement uncertainty of the CAPS-NO2 monitor used to derive Ox and (ii) the error induced by light-enhanced O3 loss inside the chambers. Taken together, these contributions define the measurement precision of the NPOPR detection system. In addition, the measurement accuracy of the NPOPR detection system is 13.9 %, corresponding to the maximum systematic error arising from photochemical O3 production in the reference chamber (Hao et al., 2023; Zhou et al., 2024b); details are given in Sect. S1 in the Supplement.
An additional system for the addition of NO or VOCs was added to the NPOPR sampling unit to assess OFS. The OFS was assessed by measuring the changes in P(O3)net induced by the addition of NO or VOCs, enabling the direct measurement of OFS. A schematic diagram of the detection system is shown in Fig. S2. In the experiments for determining OFS through direct measurements (conducted daily from 08:00–18:00 LT), each cycle lasted 1 hour. The first 20 min involved the addition of NO (denoted as P(O3)net_Mea+NO), the next 20 min measured the ambient baseline (P(O3)net_Mea), and the final 20 min involved the addition of VOCs (denoted as P(O3)net_Mea+VOCs). Following Carter et al. (1995) and Wu et al. (2022), we select VOCs surrogates for the OFS measurement on the basis of ambient measurements previous to the measurements. From 4–11 October, the tracer mixture was formulated from the average daytime total VOC reactivity measured during 20 September–3 October 2023, and isopentane served as the alkane surrogate, ethylene and isoprene as the alkene surrogates, and toluene as the aromatic surrogate. For 13–26 October 2023, we used the average daytime total VOC reactivity obtained during 4–11 October 2023; ethylene represented non-methane hydrocarbons (NMHCs) and formaldehyde represented oxygenated VOCs (OVOCs). Each surrogate was mixed in proportion to its category's share of the ambient reactivity, and the effective precursor strength (NO or VOCs) should increase by 20 % relative to the original ambient level. For data treatment, we first interpolated P(O3)net_Mea+NO, P(O3)net_Mea, and P(O3)net_Mea+VOCs to 4 min resolution and then averaged them over 1 h to suppress data fluctuations. We caution that this 1 h averaging may smooth out transient responses in the measured P(O3)net. The sensitivity of O3 production to precursor changes was quantified using the measured OFS, derived from the incremental reactivity (IR) index. IR is defined as the change in P(O3)net per unit change in precursor concentration (ΔS(X)): a negative IR value indicates that reducing the precursor concentration increases O3 production (e.g., decrease NOx would increase O3 through OH mediate effect), while a larger absolute IR value suggests higher sensitivity of O3 production to changes in the precursor. The IR was calculated as:
where X represents VOCs or NO, ΔP(O3) represents the P(O3)net values measured during the NO or VOCs addition period minus the P(O3)net values measured when only injecting ambient air. ΔS(X) represents the concentration of the NO or VOCs precursor changed during the corresponding measurement period. We define the transition regime as the region over which the IR shows a simultaneous increase or decrease upon addition of both VOCs and NO.
In addition to P(O3)net and OFS, hourly data such as PM2.5, O3, NO, NO2, SO2, carbon monoxide (CO), photolysis rates (, , , , , jHONO, jHCHO_M, jHCHO_R), HONO, and VOCs concentrations were monitored (more details about the measurements are shown in Table S1). Hourly observations of conventional meteorological parameters, such as temperature, pressure, relative humidity, wind direction, and wind speed, were sourced from the European Centre for Medium-Range Weather Forecasts (ECMWF). The planetary boundary layer height (PBLH) data used in the model here was obtained from the web portal of the Real-time Environmental Applications and Display sYstem (READY) of the National Oceanic and Atmospheric Administration (NOAA) Air Resource Laboratory (https://ready.arl.noaa.gov/READYamet.php, last access: 26 June 2024).
2.2 Box model simulation
This study employed an observation-constrained zero-dimensional photochemical reaction model (Observed 0-D box model) to simulate atmospheric photochemical processes. The chemical mechanism module is the core of the box model, and most mainstream studies use the Master Chemical Mechanism (MCM) nested within the model, incorporating processes such as solar radiation, boundary layer height, atmospheric photochemistry, and dry deposition (Zhang et al., 2022). The OBM model used in this study is AtChem2 (https://atchem.york.ac.uk/, last assess: 18 July 2024), which is equipped with the Master Chemical Mechanism (MCM v3.3.1: https://mcm.york.ac.uk/MCM, lase assess: 18 August 2024) to simulate O3 and radical chemistry and analyze their budgets (Wang et al., 2022a; Sommariva et al., 2020). The model includes approximately 143 VOCs, 6700 chemical species, and over 17 000 reactions. Hourly resolution observational data of O3, NO, NO2, CO, SO2, HONO, VOCs (in total 82 species), meteorological parameters (e.g., temperature, relative humidity, pressure, and boundary layer height), and photolysis rates were used as model constraints. The constraints are applied to the model every 1 h, with no free concentration evolution in between. Photolysis rates for unmeasured species were calculated using the Tropospheric Ultraviolet and Visible Radiation Model (TUV v5.3) (Table S2). Additionally, to avoid unreasonable increases in the concentrations of constrained species, a dilution rate of 1 86 400 s−1 was applied. Before the simulation, the model underwent a 48 h pre-run to stabilize unmeasured species (e.g., radicals).
The configuration of model mechanisms was informed by previous research, with a particular focus on the dry deposition processes of key species (e.g., O3, NO2, SO2, H2O2, HNO3, PAN, and HCHO), the heterogeneous uptake reactions of HO2 and N2O5, and the Cl• chemistry mechanism. Dry deposition is a critical pathway for the transfer of atmospheric pollutants from the gas phase to the Earth's surface, significantly influencing the concentration distribution and removal of regional pollutants. Many models have already incorporated this atmospheric physical process (Ma et al., 2022; Chen et al., 2020a). Although the heterogeneous uptake of HO2 is not the dominant loss pathway of HO2, it accounts for approximately 10 %–40 % of global HO2 loss (Li et al., 2019); as a termination reaction, its direct impact on photochemical O3 production is non-negligible. Studies have shown that including the heterogeneous uptake mechanism of HO2 in simulations reduces P(O3)net concentration and alters the sensitivity to VOCs (Zhou et al., 2021; Dyson et al., 2023). Additionally, Cl• enhances atmospheric oxidation, accelerating the OH-HO2-RO2 reaction cycle (Ma et al., 2023). By incorporating these mechanisms, this study aims to more accurately simulate the atmospheric chemical processes and their impacts on pollutant concentrations in the PRD region (Zhou et al., 2024a). The configurations of each scenario are as follows: Case A considers only the simplified chemical reaction mechanism from the MCM, excluding dry deposition and heterogeneous reactions; Case B incorporates the HO2 uptake by ambient aerosols based on Case A; Case C further includes the dry deposition processes of key species on top of Case B; and Case D1 extends Case C by adding the N2O5 uptake mechanism and Cl• related photochemical reactions. Detailed simulation parameter settings can be found in our previous study (Zhou et al., 2024a) and the Supplement (Table S3).
2.3 Model performance evaluation
The Index of Agreement (IOA) was used to evaluate the simulation performance (Li et al., 2021).
where Oi and Si represent the observed and simulated values, respectively, denote the mean of the observed values, and n is the number of samples. The IOA ranges from 0 to 1, with higher values indicating better agreement between observed and simulated values. In addition to the IOA, the Pearson correlation coefficient (R), mean bias (MB), normalized mean bias (NMB), root mean square error (RMSE), mean fractional bias (MFB) and mean fractional error (MFE) were used to evaluate the consistency between observed and simulated values (Table S7).
2.4 kOH
Total OH reactivity (kOH) is a crucial indicator of atmospheric chemical cycling and oxidative capacity (Gilman et al., 2009). kOH is defined as the sum of the products of the concentrations of all reactive species Xi that can react with OH radicals and their respective reaction rate constants, calculated as follows:
where Xi includes CO, NOx, and VOCs, among others, and kOH+Xi is the reaction rate constant (s−1) between reactive species Xi and OH radicals.
2.5 OFP
O3 Formation Potential (OFP) is an indicator used to measure the relative contribution of different VOC species to ground-level O3 formation (Wu et al., 2020). The formula for OFP is as follows:
where [VOCs]i represents the concentration of a specific VOC species i (µg m−3), and MIR represents the maximum incremental reactivity of the VOC species i (g g). MIR is used to characterize the increase in O3 production per unit increase in VOCs under conditions where O3 formation is most sensitive to VOCs.
2.6 Absolute P(O3)net sensitivity
We calculated the modelled OFS using the absolute P(O3)net sensitivity, adapted from the logarithmic derivative approach of Sakamoto et al. (2019). It is defined as the change in P(O3)net with respect to the natural logarithm of O3 precursor concentrations. This method facilitates the quantitative assessment of how reductions in O3 precursors contribute to the overall reduction of P(O3)net over a period or within a region. The formula is as follows:
In the equation, [X] represents NOx or VOCs. A positive absolute P(O3)net sensitivity indicates that reducing the precursor will lead to a decrease in the P(O3)net. In contrast, a negative value indicates that reducing the precursor will lead to an increase in the P(O3)net (Dyson et al., 2023). In this study, the analysis of absolute P(O3)net sensitivity was conducted using the box model through an analytical calculation approach that does not involve artificial perturbation of precursor concentrations.
3.1 Overview of observation campaign
The Supplement (Figs. S3, S4, and Tables S4, S5) provides the time series plots, diurnal variation, and daytime averages (daytime: 06:00–18:00 LT) of meteorological parameters, conventional pollutants, photolysis rate constants, NO, P(O3)net and hourly VOCs concentrations from 4–26 October 2023, at the Guangdong Atmospheric Supersite of China. The site was located downwind of the Guangzhou-Foshan area, with atmospheric pollutants primarily originating from the northeast. To access daily O3 pollution levels, the maximum daily 8 h average O3 concentration (MDA8) was employed, in accordance with the Technical Specification for Ambient Air Quality Evaluation (Trial) (HJ 663-2013). In this study, days with MDA8-O3 concentration exceeding the Class II limit stipulated by the Ambient Air Quality Standards (GB3095-2012) were defined as O3 pollution days (with MDA8-O3 concentration limit of 160 µg m−3 (equivalent to approximately 81.6 ppbv at 25 °C), while others were defined as normal days.
During the whole observation period, there were 6 O3 pollution days (15–17 and 24–26 October 2023). The maximum O3 mixing ratio (136.5 ppbv) occurred at 15:00 LT on 25 October 2023, while the maximum P(O3)net (53.7 ppbv h−1) occurred at 10:00 LT on 24 October 2023. Diurnal variation plots show that O3 and P(O3)net exhibited single-peak patterns, with O3 peaking at 15:00 LT and P(O3)net peaking between 09:00–10:00 LT. On O3 pollution days, the daytime average mixing ratios concentrations of O3 and P(O3)net during the observation period were 63.2 ± 37.6 and 14.4 ± 13.8 ppbv h−1, respectively, both approximately twice as high as on normal days (daytime average O3: 30.9 ± 22.9 ppbv; daytime average P(O3)net: 7.2 ± 9.4 ppbv h−1). The maximum values of directly measured P(O3)net in different ambient environments in previous studies are listed in Table S6, ranging from 10.5 to 100 ppbv h−1, and the measured P(O3)net values in this study fall within this range, demonstrating the reasonableness of the values measured in this study.
As shown in Fig. S4, the diurnal variation of parameters on O3 pollution days and normal days indicates that the nighttime background concentrations/mixing ratios of O3 precursors (TVOC and NOx) are higher on O3 pollution days. However, during the period of strongest sunlight (11:00–14:00 LT), the concentrations/mixing ratios of TVOC and NOx on O3 pollution days are lower than those on normal days. Specifically, on O3 pollution days, the TVOC concentration is 11.4 µg m−3, and the NOx concentration is 13.5 ppbv, while on normal days, the TVOC concentration is 13.7 µg m−3, and the NOx concentration is 14.8 ppbv. As the PBLH on O3 pollution days and normal days does not differ statistically during the period of strongest solar radiation (11:00–14:00 LT, t-test, p = 0.45, see Fig. S4k), the lower daytime concentrations mixing ratios of O3 precursors on O3 pollution days than on normal days may be due to higher photolysis rates on O3 pollution days (see Fig. S4a). The diurnal variation of NO concentration on O3 pollution days showed an early morning peak at 08:00 LT, rising to 12.2 ppbv and then decreasing to 1.6 ppbv. By comparing the diurnal variation data between O3 pollution days and normal days, we found that both O3 mixing ratios and P(O3)net values were significantly higher on O3 pollution days, particularly during the daytime (06:00–18:00 LT). This phenomenon aligns with the conclusion that high temperatures, low humidity, strong radiation, and stable weather conditions favor O3 pollution formation.
3.2 Characteristics of VOC concentrations and composition
This study analyzed 110 VOC species, examining the contributions of different categories to TVOC concentrations, kOH, and daily OFP. We also identified the top 10 VOC species contributing to these three indicators (Fig. S5), aiming to explore the atmospheric presence, chemical reactivity, and environmental impact of VOCs. Additionally, this study used two classification methods to group VOC species. Method 1 divided VOCs into alkynes (1 species), alkanes (27 species), alkenes (11 species), aromatic hydrocarbons (17 species), OVOCs (20 species), halogenated hydrocarbons (33 species), and sulfur-containing VOCs (1 species). Method 2 categorized VOCs into BVOC (Biogenic Volatile Organic Compounds), OVOCs (Oxygenated Volatile Organic Compounds), and AVOCs/NMHC (Anthropogenic Volatile Organic Compounds), with specific classifications shown in Table S4.
During the observation period, the daily average TVOC concentration ranged from 7.2 to 28.9 µg m−3. OVOCs contributed the most (40.8 %), followed by halogenated hydrocarbons (20.8 %), aromatic hydrocarbons (18.3 %), alkanes (17.9 %), alkenes (1.7 %), and alkynes (0.5 %). The kOH average value was 12.1 ± 3.9 s−1, primarily contributed by OVOCs (62.9 %), followed by halogenated hydrocarbons (10.8 %), alkenes (10.4 %), aromatic hydrocarbons (9.8 %), alkanes (6.0 %), and alkynes (0.1 %). Among the alkenes in the known MCM mechanism, ethylene, as an indicator of VOCs, had the highest proportion, accounting for 10.7 % of alkeneskOH and 2.8 % of NMHC kOH. Formaldehyde, another VOCs indicator, was the most dominant species in OVOCskOH, contributing about 13.3 %. Among VOC species, OVOCs contributed the most to OFP (51.6 %), followed by aromatic hydrocarbons (32.9 %), alkenes (8.0 %), alkanes (6.9 %), halogenated hydrocarbons (0.5 %), and alkynes (0.2 %). The analysis results show that although halogenated hydrocarbons dominate VOCs concentration emissions, their contribution to O3 pollution is low. In contrast, alkenes, despite their lower contribution to VOCs concentration emissions, are important precursors for O3 formation. Based on the comprehensive analysis of VOCs concentration, kOH, and OFP, OVOCs and aromatic hydrocarbons significantly contribute to O3 formation and should be prioritized as key VOC species for O3 pollution control in the PRD region. This result aligns with other related studies in the PRD, such as those in Shenzhen (Yu et al., 2020), Guangzhou (Pei et al., 2022), and Jiangmen (Jing et al., 2024), which indicate that OVOCs and aromatic hydrocarbons are key VOC species for O3 formation. As OVOCs arise from both direct (anthropogenic and natural) emissions and secondary atmospheric formation (Lyu et al., 2024; Yuan et al., 2012), precluding a direct quantification of their respective contributions to O3 formation. Nevertheless, our previous work showed that anthropogenic primary VOCs correlate most closely with instantaneous P(O3)net on O3 pollution days, and urban anthropogenic OVOC emissions markedly enhance both oxidative capacity and O3 production (Qian et al., 2025; Wang et al., 2024b).
Overall, toluene, m/p-xylene, formaldehyde, 2-hexanone, ethyl acetate, and tetrahydrofuran consistently ranked in the top 10 VOC species in terms of concentration, kOH and OFP contribution. These VOC species mainly originate from human activities, such as industrial production, solvent use, traffic emissions, and fuel combustion, highlighting the significant impact of anthropogenic sources on O3 pollution (Cai et al., 2010; Yang et al., 2023; Zheng et al., 2019).
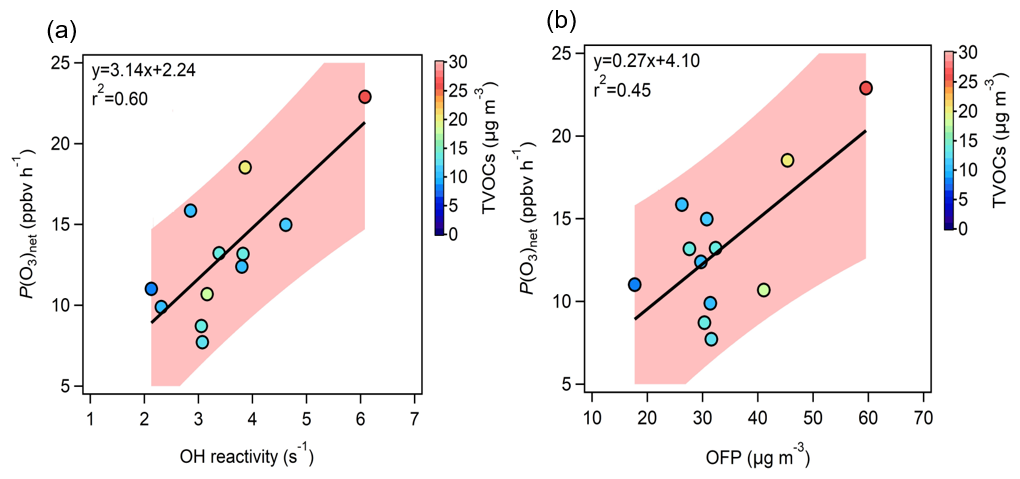
Figure 1Correlation between measured P(O3)net (P(O3)net_Mea) and (a) total OH reactivity (kOH) and (b) O3 Formation Potential (OFP). The shaded area in the figure represents the confidence interval (90 %) of the fitting line between P(O3)net and kOH, and between P(O3)net and OFP.
Figure 1 shows the correlation between P(O3)net_Mea and kOH and OFP (calculated using the daytime average data during the observation period). Data outside the confidence interval may be due to the fact that the calculation of kOH and OFP did not fully consider the environmental conditions and atmospheric chemistry complexity at the observation site (Zhang et al., 2024; Yadav et al., 2024). The color of the scatter points represents the TVOC concentration. The r2 values between P(O3)net measurements and kOH and OFP are 0.6 and 0.5, respectively, indicating that VOCs with higher kOH and OFP significantly enhance the P(O3)net.
3.3 Comparison and optimization of simulated and measured P(O3)net values
Based on our previous research (Zhou et al., 2024a), we named the scenario considering only the current chemical reaction mechanism from the MCM v3.3.1 in the box model as Case A. Subsequently, we gradually incorporated the HO2 uptake by ambient aerosols, dry deposition, N2O5 uptake, and ClNO2 photolysis mechanisms into the MCM mechanism in the box model, implemented as modelling scenarios labeled Case B, Case C, and Case D1. The specific parameter settings for each scenario are shown in Table S3. The time series and diurnal variations of the P(O3)net_Mea and P(O3)net_Mod for Cases A–D1 are shown in Fig. S7. To evaluate the model's performance, P(O3)net_Mea and P(O3)net_Mod data were used to calculate IOA, R, MB, NMB, RMSE, MFB and MFE values under different scenarios (Table S7). The IOA values between P(O3)net_Mod and P(O3)net_Mea was > 0.86 for all cases, and R ranged from 0.84 to 0.98, indicating that the model can reasonably reproduce the variations in P(O3)net. However, MB and NMB were −3.0 to −2.4 ppbv h−1 and −30.5 % to −24.9 %, respectively, revealing a systematic underestimation of P(O3)net. RMSE ranged from 7.0 to 7.2 ppbv h−1, while MFB and MFE ranged from −3.1 % to −1.7 % and 53.8 % to 55.5 %, respectively. These results suggest that, although the model captures the overall trends well, there is room to reduce simulation biases.
In all modelling scenarios from Case A–Case D1, P(O3)net_Mod values were generally lower than P(O3)net_Mea (see Fig. 3). Although the correlation between P(O3)net_Mea and P(O3)net_Mod was good (Fig. S9, r2 = 0.73), even after incorporating mechanisms that may affect O3 production simulation biases into to the box model (labeled as Case D1), the simulated daytime average P(O3)net_Mod was still 3.4 ppbv h−1 lower than P(O3)net_Mea (26.3 % bias), with a peak deviation of up to 13.3 ppbv h−1 (44.8 %), as shown in Fig. 2. We defined the difference between P(O3)net_Mea and P(O3)net_Mod as P(O3)net_Missing, and its distribution of each day is shown in Fig. S10. Due to the measurement error of HONO by MARGA in this study, the modelled P(O3)net tends to be underestimated (as shown in Sect. S2); thus, we define the P(O3)net_Missing obtained from all simulation cases as the upper-limit values. During the observation period, 7–10 and 18–22 October were rainy days, with a median P(O3)net_Missing < 1.1 ppbv h−1; therefore, these days were excluded when calculating the diurnal variations of different O3 production and consumption pathways. On non-rainy days, the averaged daytime P(O3)net_Missing reached 4.5 ± 7.6 ppbv h−1, accounting for 31 % of the total measured P(O3)net. Furthermore, the enlarged days in Fig. 3 reveal day-to-day variations in P(O3)net_Mod across the different cases, underscoring that the overall diurnal pattern described above does not resolve this variability. The averaged daytime P(O3)net_Missing values on O3 pollution days were statistically higher than those on normal days (t-test, p < 0.05), suggesting that while the supplementary mechanisms explored in the model may contribute to some extent, they are unlikely to be the dominant cause of the P(O3)net_Missing.
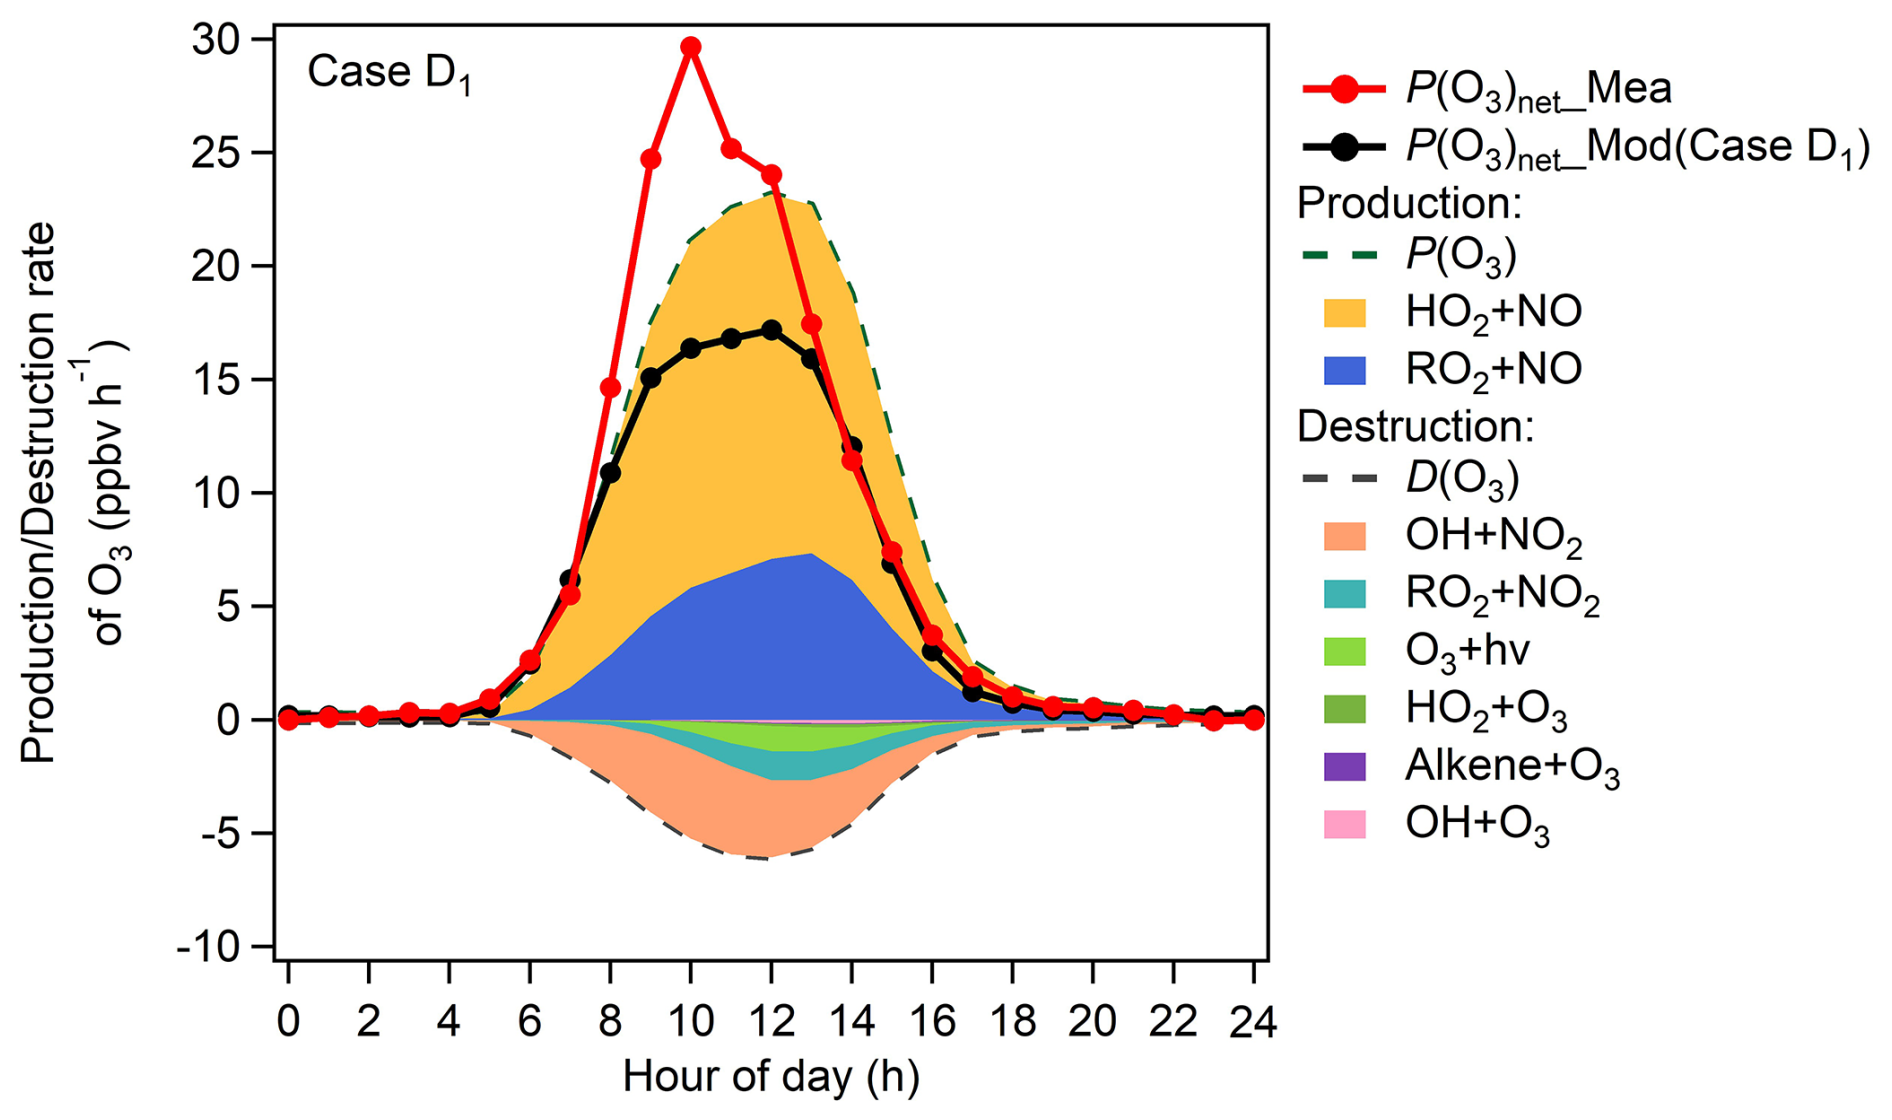
Figure 2Diurnal variations (excludes rainy days) of O3 production and destruction rates modelled in Case D1, and measured (P(O3)net_Mea) and modelled (P(O3)net_Mod) P(O3)net.
We further explore the possible reasons for the discrepancies between P(O3)net_Mea and P(O3)net_Mod using the modelling results of Case D1. The ratio of cumulative P(O3)net_Mea and P(O3)net_Mod derived from Case D1 was 1.4, calculated by summing the daytime data with 1 h resolution during the observation period. This result is consistent with previous findings: Cazorla and Brune (2010) reported a ratio of 1.3, and Ren et al. (2013) and Hao et al. (2023) both reported 1.4. As shown in Fig. 2, the HO2 + NO reaction dominates O3 production, accounting for 71.4 % of total O3 production pathways. In contrast, the main O3 loss pathways were OH + NO2 and RO2 + NO2, accounting for 67.9 % and 16.5 % of total O3 consumption pathways, respectively. The importance of the HO2 RO2 reaction pathways indicates that simulation biases in HO2 or RO2 will propagate into P(O3)net_Mod.
To explore the possible drivers of P(O3)net_Missing, we correlated it with TVOC, NOx, , T, and Ox separately for O3 pollution days and normal days (Fig. S11). On O3 pollution days, P(O3)net_Missing exhibited a moderate positive correlation with VOCs (r2 = 0.4, R = 0.2, t = 2.9) and NOx (r2 = 0.5, R = 0.2, t = 3.8), confirming that the P(O3)net_Missing is larger at higher precursor concentrations/mixing ratios (both t > critical 2.0, p < 0.05), consistent with earlier box-model studies (Whalley et al., 2021; Ren et al., 2013; Zhou et al., 2024a). A moderate positive correlation is also found with on both O3 pollution days and normal days, with r2 values of 0.5 and 0.4, respectively. On normal days all correlations collapse (r2 < 0.2, p > 0.1), implying that the model deficit is not tied to the measured precursors under low-NOx conditions and may instead related to the missing mechanisms for unmeasured photolabile VOCs. Wang et al. (2022b) indicates that constraining OVOCs in the model is crucial for the accuracy of P(O3)net_Mod, and photochemical models without OVOCs constraints significantly underestimate P(O3)net. In our previous study on the industrial city of Dongguan (Zhou et al., 2024a), we used parameter equations developed by Wang et al. (2024a, b) to quantify the impact of missing kOH on P(O3)net_Missing and qualitatively tested the potential compensating effects of unmeasured OVOCs on P(O3)net_Missing. This study measured more VOC species compared to the Dongguan campaign (Table S4). Therefore, we further compensate for the Case D1 scenario by constraining more measured VOC species compared to the study in Dongguan (e.g., OVOCs, halogenated hydrocarbons) to explore their impact on P(O3)net_Mod. The specific simulation scenario settings are described in Table S3.
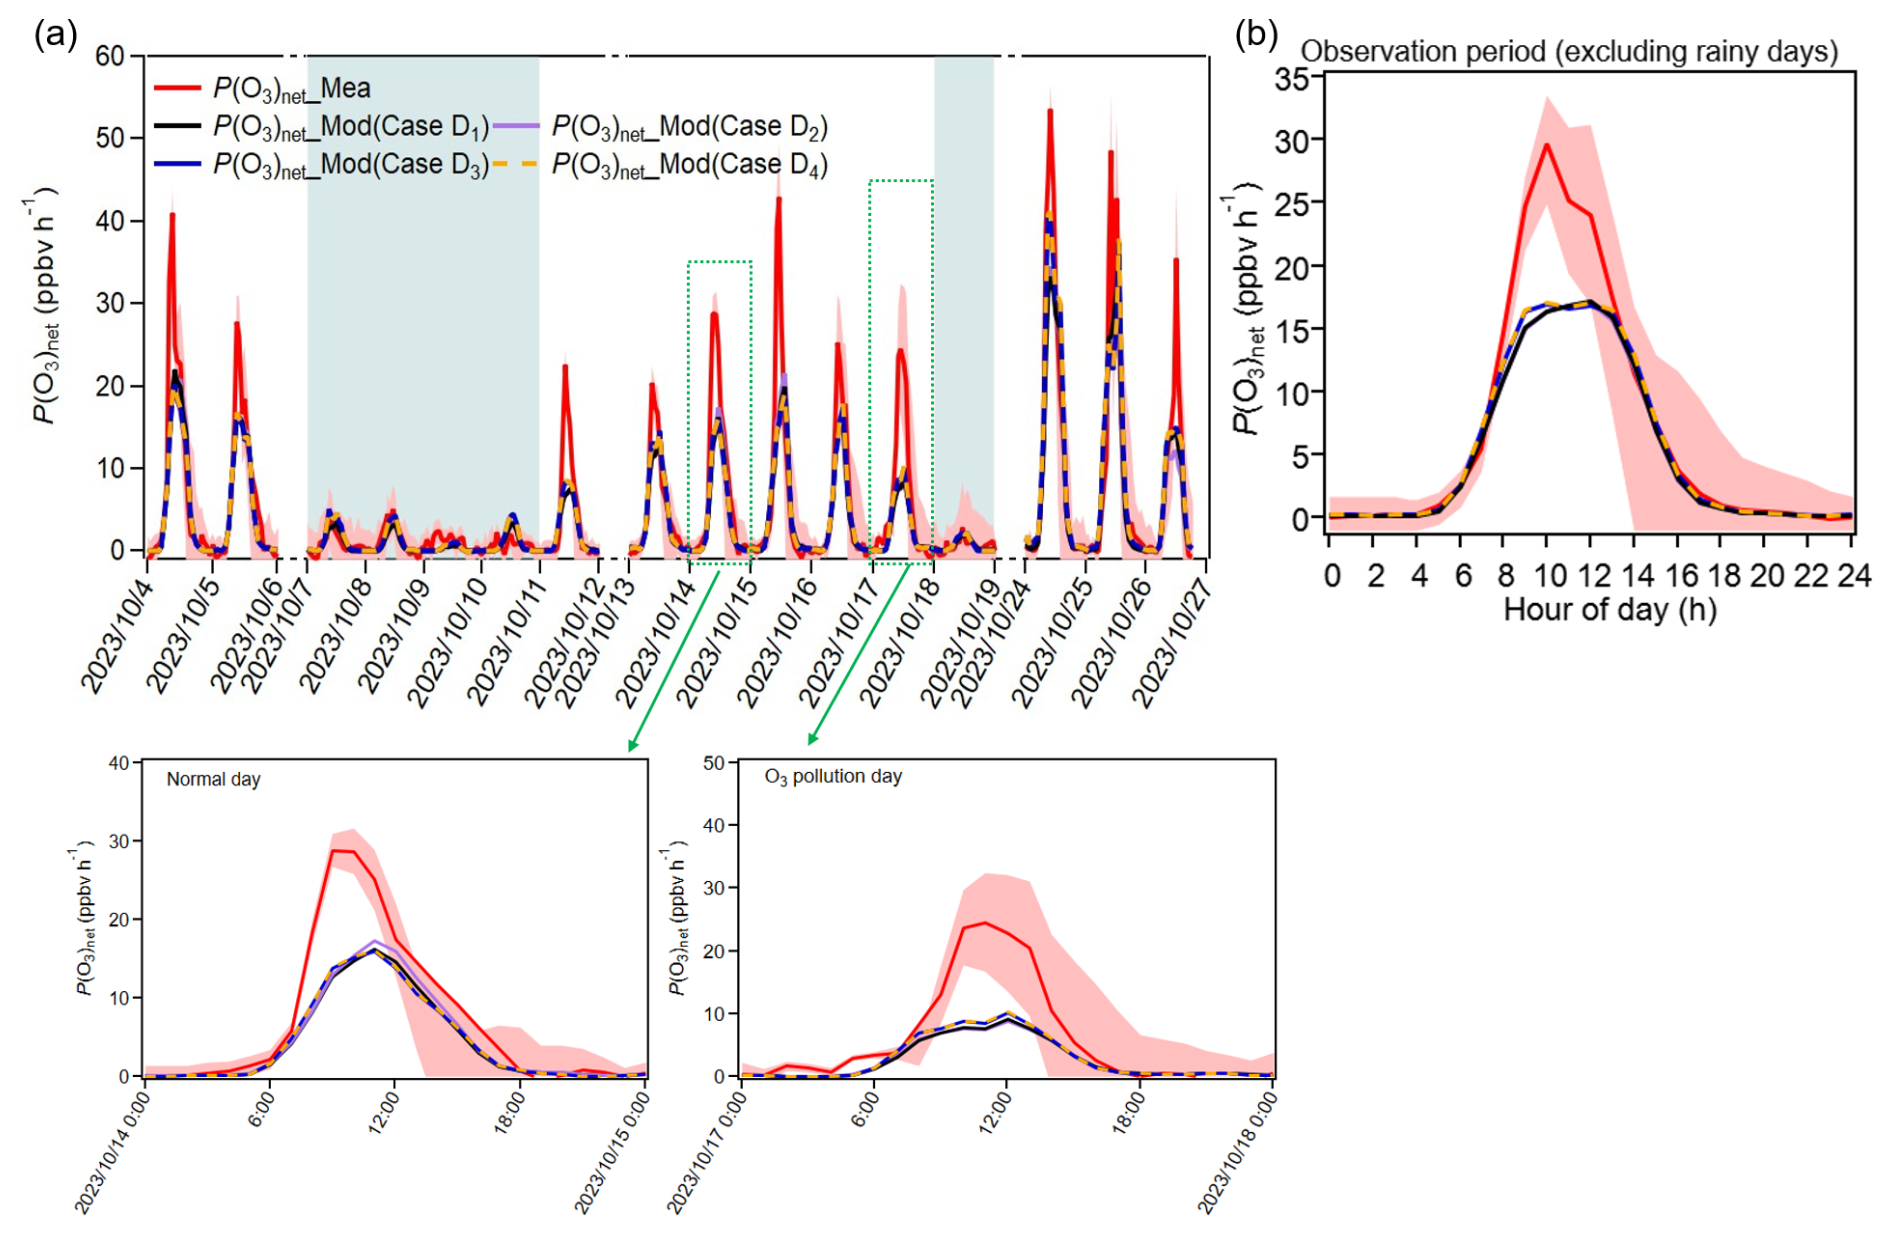
Figure 3The time series and diurnal variations of P(O3)net_Mea and P(O3)net_Mod (Case D1–D4) during the observation period, with an enlarged view for an O3 pollution day (26 October 2023) and a normal (O3 non-pollution) day (14 October 2023); The shaded areas in panel (a) represent rainy days.
Figure 3 shows the time series and diurnal variations of P(O3)net_Mea and P(O3)net_Mod (under Case D1–D4) during the observation period. Specifically, we added constraints for measured acetaldehyde, acrolein, acetone, and butanone (OVOCs, which were considered as potential contributors for P(O3)net_Missing in Dongguan) to the model based on Case D1, which is labeled as Case D2. However, the daytime mean P(O3)net_Mod in Case D2 decreased by 0.5 % compared with Case D1, indicating that the dominant OVOC species responsible for P(O3)net_Missing may differ between Heshan and Dongguan. We further constrained all measured OVOC species in Heshan (which included additional OVOCs species compared to that added to Case D2, such as propionaldehyde, butyraldehyde, and valeraldehyde) that could be input into the box model in the Case D3 simulation scenario (more details can be found in Table S8). The results showed that the averaged daytime P(O3)net_Mod from Case D3 increased by 4.4 % compared to that in Case D2. Notably, in Case D3, constraining all OVOC species significantly improved P(O3)net_Mod during the morning period (08:00–09:00 LT), with an increasing rate of approximately 10.2 % (∼ 1.3 ppbv h−1). Additionally, Case D4 scenario added constraints for chlorine-containing VOCs (i.e., all measured VOC species listed in Table S8 that could be input into the OBM model were constrained). The daytime average P(O3)net_Mod values from Case D4 changed by only 1.1 % compared to those derived from Case D3, indicating that the potential contribution of OVOCs to compensating P(O3)net_Missing is greater than that of chlorine-containing VOCs. The negligible (or even negative) change in P(O3)net_Mod when OVOCs are constrained in Cases D1-D4 may arise because the OVOC constraint masks deficiencies in the model's chemical mechanism and artificially suppresses diagnostic signals of missing secondary formation pathways. Until the underlying chemical mechanisms are improved, observational nudging of OVOCs offers a practical compromise – it helps maintain concentration accuracy while limiting unrealistic chemical feedbacks (more details can be found in Sect. S5). However, in modelling scenario Case D4, the daytime average P(O3)net_Mod still showed a 22.2 % underestimation compared to the measured values. Accurate quantification of P(O3)net missing is possible here because the diurnal patterns of measurement uncertainty and the modelling bias responsible for the P(O3)net missing do not co-vary; consequently, measurement uncertainty is much smaller than modelling bias for most of the daytime, especially around noon.
The diurnal variations of O3 production pathways in Case D4 are shown in Fig. S12. Compared to Case D1, the RO2 + NO reaction rate in Case D4 was higher by 0–2.1 ppbv h−1 in the diurnal variations during the whole measurement period (excluded the rainy days). The RO2 species with higher contributions to this pathway included CH3O2, HO2C4O2, HO13C4O2, HOCH2CH2O2, HO3C4O2, CH3COCH2O2, and COCCOH2CO2. This indicates that the constraints on additional OVOCs in Case D4 (such as aldehyde and ketone compounds with specific functional groups, e.g., carbonyl and hydroxyl) increased the intermediate RO2 products, leading to a significant enhancement in the RO2 + NO reaction rate. This suggests their large potential to contribute to P(O3)net_Missing.
The modelling results of scenarios Case D1–D4 show that although constraining the measured VOC species in the box model mechanism can reduce P(O3)net_Missing to some extent, there is still a significant gap between the simulated and measured P(O3)net values. Previous studies have shown that the RO2 isomerization (Crounse et al., 2012), autoxidation (Wang et al., 2017a), and the accretion reactions (Berndt et al., 2018) can also effect modelled P(O3)net, but these processes have not been investigated here. Also, the potential contribution of unmeasured VOC species to compensating P(O3)net_Missing in the box model mechanism cannot be ignored. Yang et al. (2017) and Tan et al. (2019) conducted radical measurements at the Guangdong Atmospheric Supersite of China in autumn of 2014, revealing missing kOH contributions of approximately 32 % and 50 %, respectively. Yang et al. (2017) pointed out that the missing kOH contributions in the Heshan region may originate from OVOCs such as aldehydes, acids, and dicarbonyls. Tan et al. (2019) indicated that about 60 % of the O3 produced in the Heshan region was contributed by unmeasured VOCs. We hypothesize that the remaining P(O3)net_Missing is caused by unknown VOCs that are not constrained in the box model.
The method of estimating missing VOC concentrations through the empirical linear relationship between OH reactivity (kOH) and P(O3)net is used in this study, the scientific basis lies in the fact that P(O3)net is closely related to the production rate of ROx radicals (P(ROx)), which are primarily formed through the reaction of OH with VOCs. Since P(ROx) is directly influenced by the OH reactivity (kOH), P(O3)net is consequently correlated with kOH. Previous study has shown that P(O3)net exhibits a linear relationship with both P(HOx) and kOH when O3 formation is located in VOCs-limited regime (Baier et al., 2017), and this approach reflects nearly actual atmospheric chemistry if P(O3)net missing is driven by VOCs reactivity missing (Wang et al., 2024b). Furthermore, we examined whether unconstrained secondary products affect P(O3)net missing – and thus the linear relationship between P(O3)net missing and kOH – by analysing its dependence on the ethylbenzene/m,p-xylene ratio. Because this ratio increases with the degree of air-mass aging (de Gouw et al., 2005; Yuan et al., 2013), the observed decrease in the P(O3)net missing with increasing ratio (Fig. S11f) indicates that the P(O3)net missing is not likely caused by unaccounted secondary production. By quantifying the relationship between kOH and P(O3)net, the contribution of missing kOH (kOH_Missing) to P(O3)net_Missing can be assessed, and compensating for kOH_Missing in the box model can help reduce P(O3)net_Missing. Figure 4 shows the relationship between kOH and P(O3)net_Mod calculated under the Case D1 scenario, which can be expressed as:
where P(O3)net_Missing and kOH_Missing in the equation represent the daytime averaged values for each day. Based on this relationship, we calculated kOH_Missing according to calculated P(O3)net_Missing for each day. This value was then used to compensate for the unmeasured VOCs in the model (with a daytime kOH compensation range of 1.2–2.4 s−1, approximately 27.6 %–45.1 % of missing values). Based on the significant contribution of OVOCs to P(O3)net_Missing mentioned earlier, we designed three modelling scenarios to compensate for kOH_Missing, with the specific multiples varying each day. We note that these scenarios are idealized sensitivity tests to explore potential bounds of OVOCs' contribution to P(O3)net_Missing compensation, rather than realistic emission assumptions. Specifically, we tested how much the P(O3)net_Missing could be accounted for if the kOH were attributed to different VOCs categories. The specific scenarios include: (1) Case E1: by expanding the constrained overall VOCs concentrations in Case D1 (daily mean compensation range for TVOCs: 0.5–2.8 µg m−3) the daily TVOC concentration was increased by 1.1 to 1.7 times; (2) Case E2: according to kOH ratio of NMHC to OVOCs in the constrained VOCs of Case D1, the concentrations of ethylene (a representative NMHC species) and formaldehyde (OVOCs indicator) were expanded separately. The ethylene concentration (daily mean compensation range for TVOCs: 0.5–2.8 µg m−3) was increased by 5.9 to 85.6 times, and the formaldehyde concentration (daily mean compensation range for TVOCs: 0.0–0.5 µg m−3) was increased by 1.4 to 2.0 times; (3) Case E3: by expanding only the formaldehyde concentration to compensate for kOH_Missing, in this case, the daily formaldehyde concentration (daily mean compensation range for TVOCs: 0.6–1.4 µg m−3) was increased by 1.8 to 9.2 times, to verify the role of OVOCs in compensating for P(O3)net_Missing. The time series and overall diurnal variations of modelled Cases E1-E3 are presented alongside Case D1 in Fig. 5.
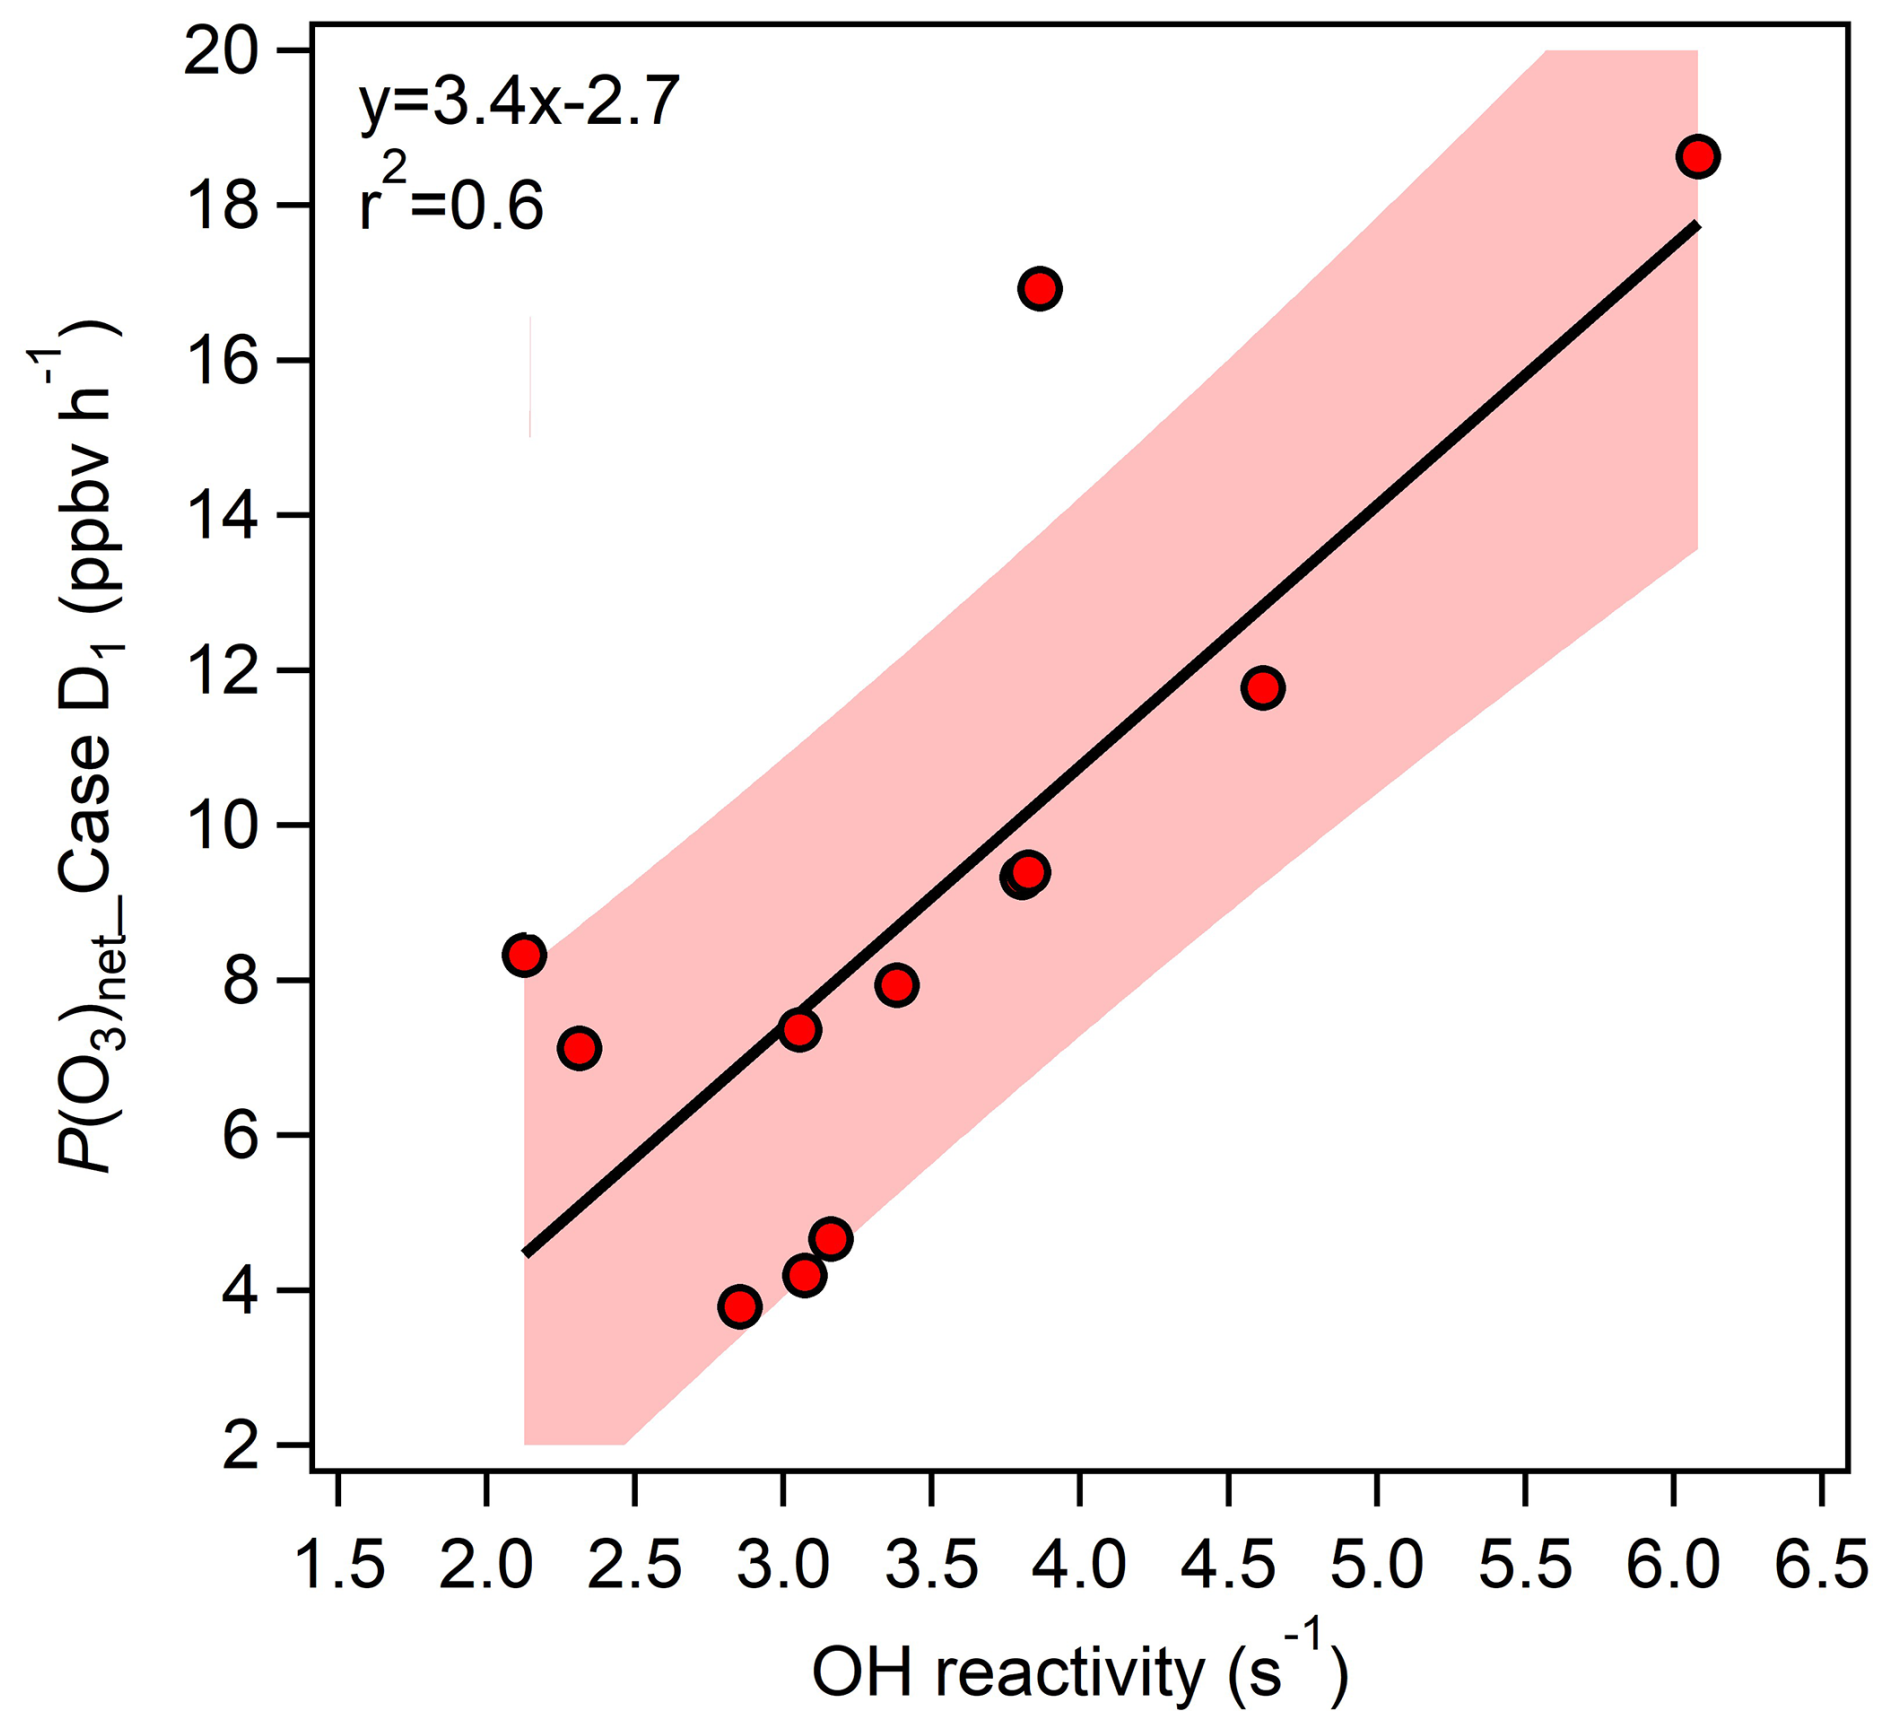
Figure 4The relationship between kOH and P(O3)net_Mod calculated under the Case D1 scenario (using the daily daytime average values during the observation period).
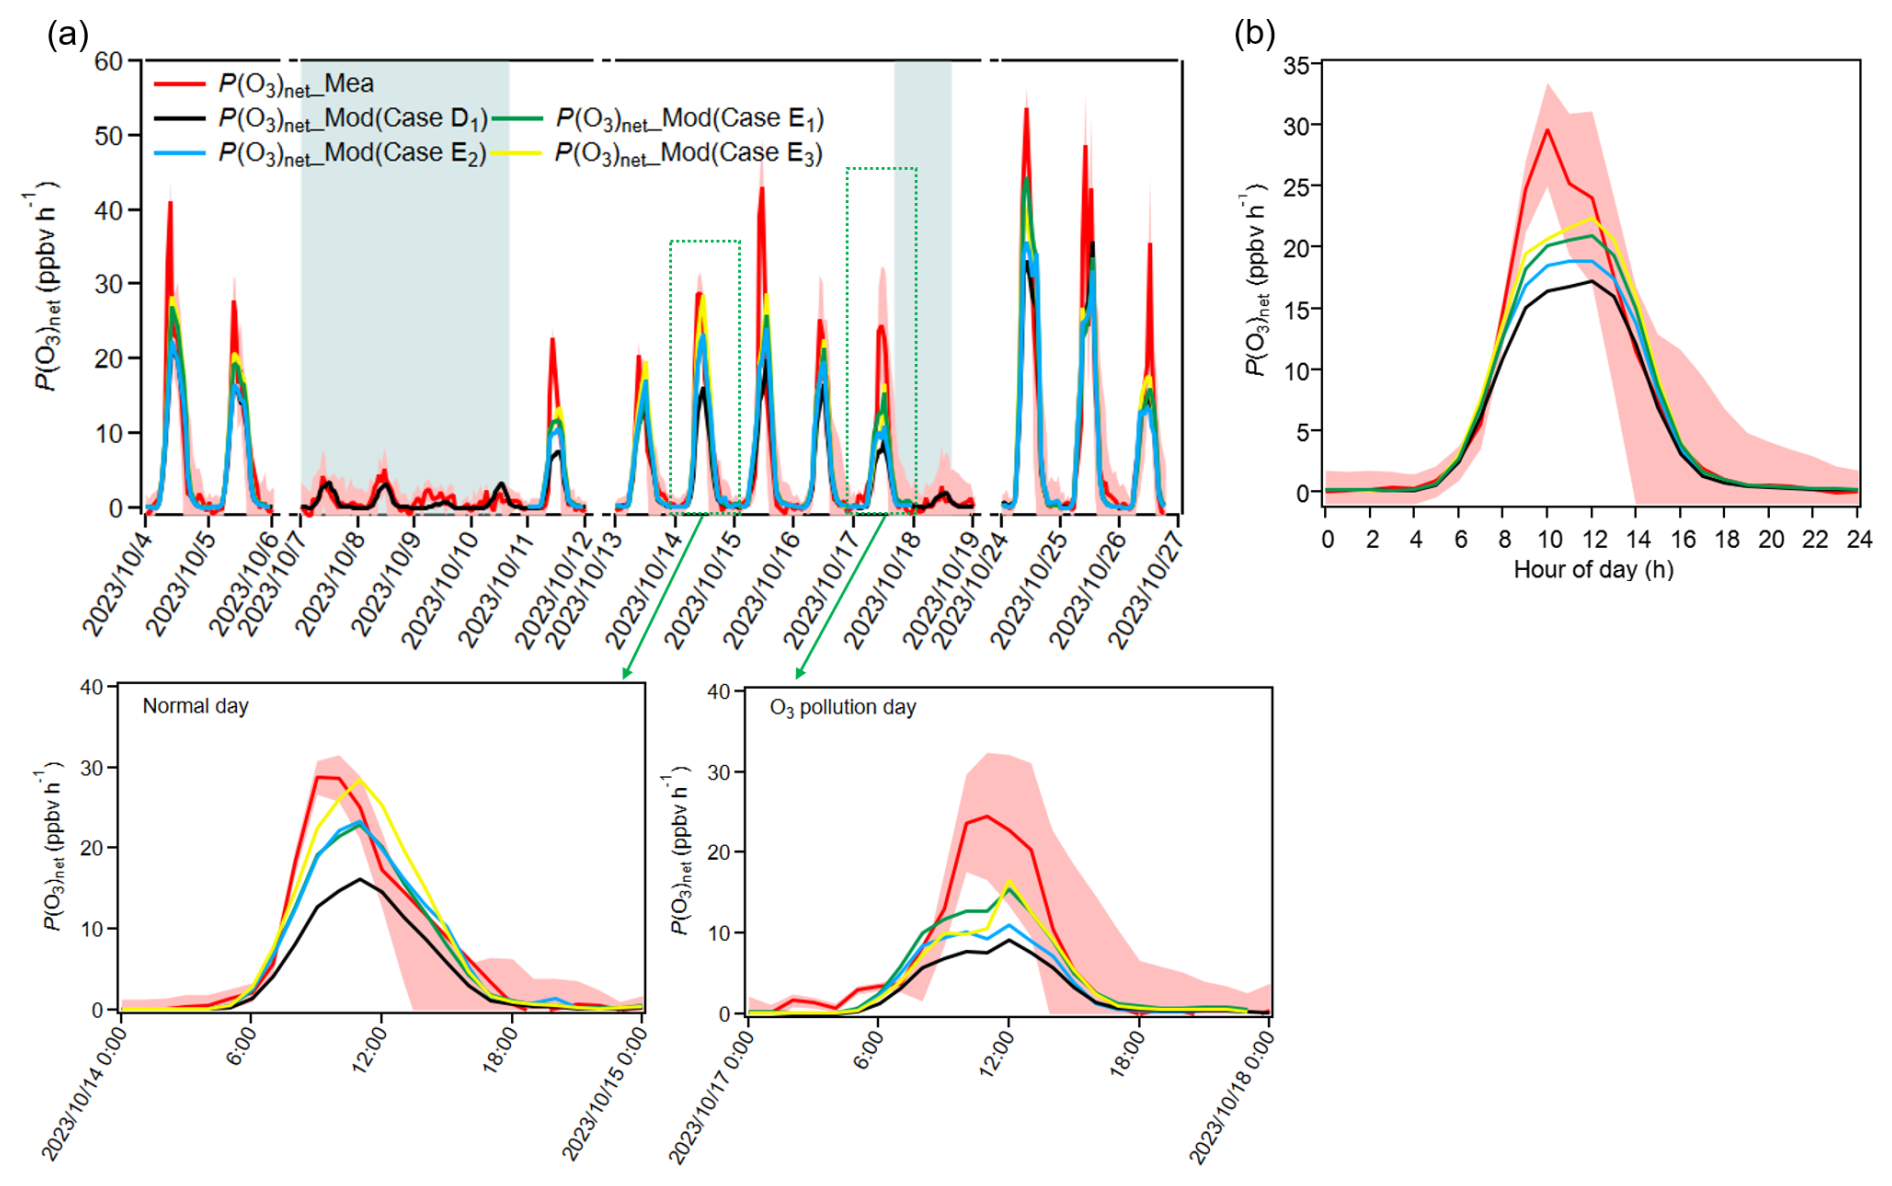
Figure 5(a) Time series and (b) diurnal variations of P(O3)net_Mea and P(O3)net_Mod (Case D1–E3) during the observation period, with an enlarged view for an O3 pollution day (26 October 2023) and a normal (O3 non-pollution) day (14 October 2023); (b) diurnal variations excluding rainy days. The shaded areas in panel (a) represent rainy days.
In Case E1, where the overall TVOC concentration was increased to compensate for kOH_Missing without distinguishing VOCs categories, the compensation effect was limited due to the dilution effect of low-reactivity VOCs, resulting in a reduction of the daytime average P(O3)net_Missing proportion from 26.3 % (calculated as P(O3)net_Missing P(O3)net_Mea) to 10.3 %. In Case E2, where the concentrations of ethylene and formaldehyde were expanded to compensate for kOH_Missing, the daytime average P(O3)net_Missing proportion reduced from 26.3 % to 17.2 %. This proportion is higher than that obtained from Case E1, which may be due to the relatively low reactivity of ethylene limited the overall compensation effect. In contrast, Case E3 compensated for kOH_Missing solely by expanding the formaldehyde concentration. More details concerning the cases settings are shown in Table S3. Since formaldehyde, as a representative high-reactivity OVOC species, contributes more directly and significantly to O3 generation through photochemical pathways (Mousavinezhad et al., 2021), it achieved the best compensation effect, reducing the daytime average of P(O3)net_Missing from 26.3 % to 5.1 %. However, P(O3)net_Missing during the peak period of diurnal variation remained at 9.0 ppbv h−1. This result confirms the critical role of high-reactivity OVOCs (especially those with the same photochemical reaction characteristics as formaldehyde) in compensating for P(O3)net_Missing. Further, it suggests the potential presence of other unmeasured high-reactivity VOC species in the ambient atmosphere. Constraining these species could help further improve the model's simulation accuracy (Lyu et al., 2024; Wang et al., 2024b). Overall, the degree of compensation for P(O3)net_Missing follows the order Case E3 > Case E1 > Case E2, which may be related to the reactivity of the selected VOCs. However, we observe a slight difference in the diurnal trends of P(O3)net across different days (enlarged view in Fig. 5); this depicts the overall pattern for the observation period described above does not capture day-to-day variability.
This study systematically estimated OFS during the observation period (4–5, 11, 13–17, and 24–26 October 2023) using measured OFS (see Sect. 2.1) and modelled OFS (see Sect. 2.6). The time series of measured P(O3)net_Mea, P(O3) and P(O3) based on sensitivity experiments using the NPOPR detection system are shown in Fig. S13. We see the measurement uncertainty decreased with increasing P(O3)net values: it reaches approximately 23 % when P(O3)net is around 0 ppbv h−1, but falls below 3 % when P(O3)net is around 50 ppbv h−1. Figure S14 shows the diurnal variation of the directly measured IR index compiled from all 11 days of OFS experiments, together with the absolute P(O3)net sensitivity to NOx and VOCs calculated with the box model (Case D1, Eq. 10). It therefore depicts the overall trend across the observation period and does not reflect the day-to-day variability. We see that both measured OFS and modelled OFS captured the same diurnal OFS trend: an early morning (08:00–12:00 LT) VOCs-limited/transition regime shifting to a NOx-limited regime around midday (13:00 LT), followed by a return to VOCs-limited/transition conditions in the afternoon (14:00–18:00 LT). This midday transition to NOx-limited conditions is chemically reasonable, where intensified NO2 photolysis boosts Ox production while persistent photochemistry consumption without replenishment (Wang et al., 2023). The overall OFS classification (mainly VOCs-limited and transition regimes) aligns with previous studies in Guangdong in autumn (Song et al., 2022; Chen et al., 2020b; Wu et al., 2020; Jing et al., 2024). However, the OFS assessment results from measured and modelling methods showed only 60 % agreement in hourly OFS variations (see Fig. S14).
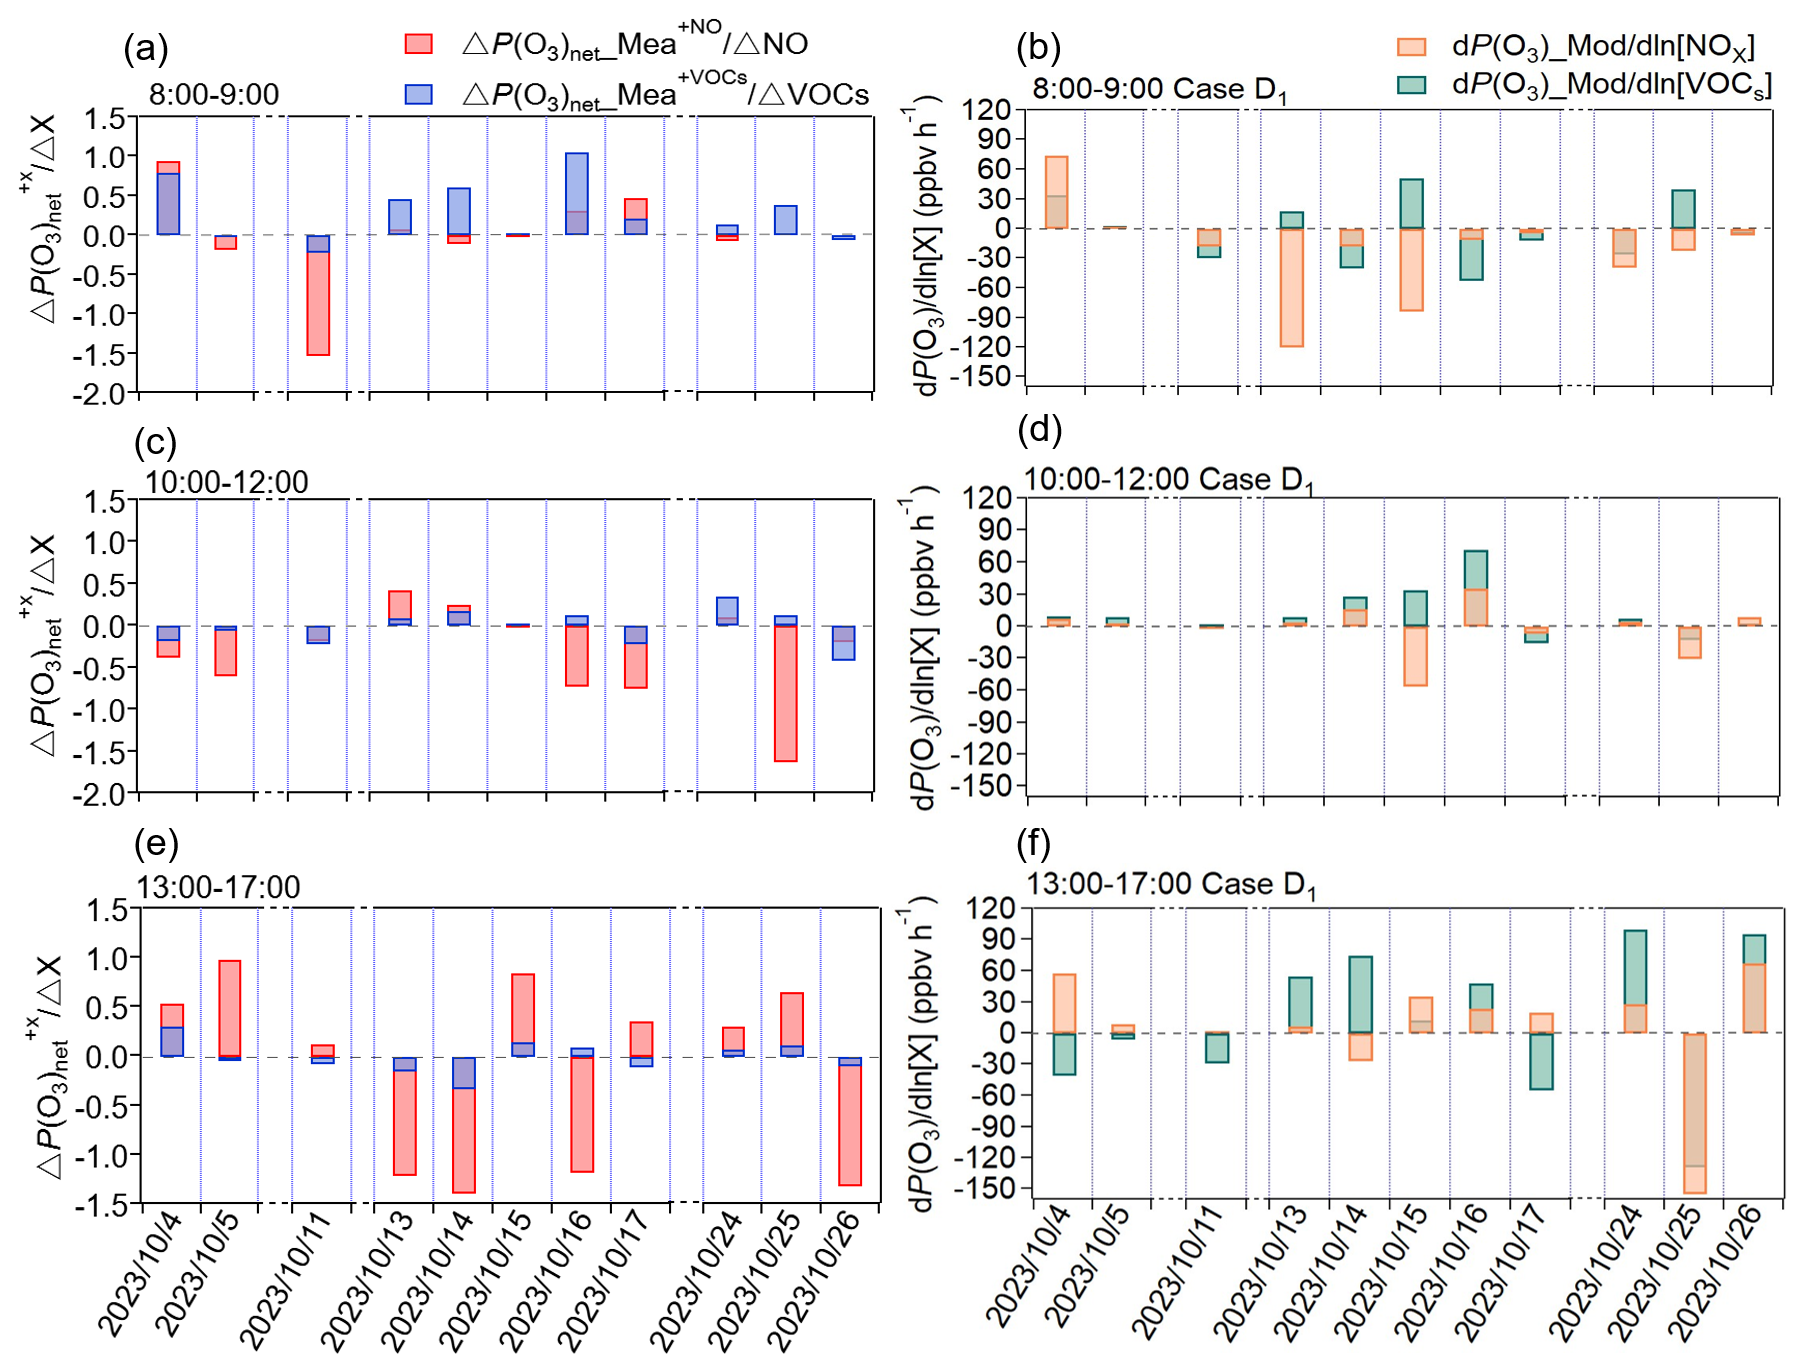
Figure 6Average values of IR derived from the direct measurement data using the NPOPR detection system (e.g., ΔP(O3) and ΔP(O3)) and absolute P(O3)net sensitivity from the box model during (a–b) P(O3)net rising phase (08:00–09:00 LT); (c–d) P(O3)net stable phase (10:00–12:00 LT); (e–f) P(O3)net declining phase (13:00–17:00 LT).
In order to gain a deeper understanding of the similarities and differences between the direct measurement and the model simulation methods in diagnosing OFS, we divided the daytime observation period into three characteristic phases: the P(O3)net rising phase (08:00–09:00 LT), the P(O3)net stable phase (10:00–12:00 LT), and the P(O3)net declining phase (13:00–17:00 LT). Figure 6a, c, and e present the diurnal cumulative average results of IR derived from direct measurements of ΔP(O3) and ΔP(O3) using the NPOPR detection system for each phase. Figure 6b, d, and f show the diurnal cumulative average results of the absolute P(O3)net sensitivity calculated from the box model (Case D1) for each phase. We found that during the P(O3)net rising phase, both the direct measurement and the model simulation methods identified the OFS as being in either the transition regime or VOCs-limited regime. However, the agreement between these two methods was only 63.6 %. During the P(O3)net stable phase, the consistency between these two methods improved significantly, reaching 72.7 %, with the OFS predominantly located in the transition regime. This higher consistency occurred during periods of higher solar radiation intensity, when photochemical reactions were more stable, leading to improved model simulation accuracy. During the P(O3)net declining phase, the two methods achieved an agreement of 72.7 % in the OFS assessment; both predominantly identified the OFS as being in either the transition regime or NOx-limited regime. This relatively high agreement may be attributed to the reduced intensity of solar radiation and the decreased complexity of photochemical reactions in the afternoon. As Chen et al. (2025) showed that lower solar radiation simplifies reaction pathways, thereby enhancing model simulation accuracy. To illustrate that the diurnal shift in OFS depicted in Fig. 6 is not random noise but reflects the general rule, we grouped the 11 d of direct measurements by their initial O3-formation regime, calculated their average diurnal variations, and thus reproduced the “morning-transition” phenomenon in Fig. S13c–d.
The absolute P(O3)net sensitivity for scenarios Case E1–Case E3 are shown in Fig. S15. The agreement between these scenarios and the direct measurement results changes across different periods, with consistency levels of 54.5 %–63.6 %, 45.5 %–72.7 %, and 63.6 %–72.7 % during P(O3)net rising phase, P(O3)net stable phase, and P(O3)net declining phase, respectively. In cases where P(O3)net_Missing was reduced (Case E1–Case E3), the OFS sometimes shifted to NOx-limited conditions during certain periods, such as in Case E2 during the P(O3)net rising phase and Case E3 during the P(O3)net stable phase on 4 October 2023. This contradictory phenomenon may be related to the model's incomplete representation of unknown high-reactivity VOCs chemical mechanisms (e.g., aldehyde and ketone). Additionally, previous studies have pointed out that the diagnostic method based on the box model tends to overestimate the sensitivity to VOCs in certain regions of China due to neglecting the reactivity of unidentified VOCs in anthropogenic emissions (Xu et al., 2022; Lu et al., 2010) and the missing peroxy radical source (Tan et al., 2018). To more accurately simulate O3 formation and precursor sensitivity, Xu et al. (2022) incorporated formaldehyde as input data in the box model, and found that this improvement significantly reduced the model's bias in diagnosing OFS, particularly in misjudging the VOCs-limited regime. These results demonstrate that the bias between measured and modeled OFS arises chiefly from missing VOCs or shortcomings in the model's chemical mechanism.
It is noteworthy that there are differences in the precursor sensitivity response mechanisms between the absolute P(O3)net sensitivity assessment method based on the box model and the IR method based on the direct measurement method. For example, during the P(O3)net stable phase (10:00–12:00 LT period) on 4–5 October, although both methods identified the OFS as being in the transition regime, the direct measurement showed that an increase in precursor concentrations suppressed P(O3)net, while the model simulations indicated that a reduction in precursor concentrations led to a decrease in P(O3)net. However, these findings only explain regional differences in sensitivity determinations, and the underlying reasons for the differing precursor sensitivity response mechanisms between the two methods may require further investigation.
Understanding ozone (O3) production mechanisms is critical for accurate O3 pollution assessment and control, as photochemical production directly effects O3 concentration levels. Due to the absence of certain mechanisms in conventional models, particularly the kinetics from missing reactive volatile organic compounds (VOCs) species, the reliability of net photochemical O3 production rates (P(O3)net) and O3 formation sensitivity (OFS) evaluation is compromised. To address this issue, we employed the custom-made online O3 production rate (NPOPR) detection system based on the dual-reaction chamber technique to measure the P(O3)net and OFS. The system was applied in field observations at the Guangdong Atmospheric Supersite of China in Heshan, Pearl River Delta during the autumn of 2023. By combining the NPOPR detection system and the box model, a systematic investigation of P(O3)net and OFS was carried out. During the observation period (4–26 October 2023), a total of 6 O3 pollution days were recorded, with the maximum O3 mixing ratio reaching 136.5 ppbv. The P(O3)net levels on O3 pollution days were significantly higher than those on normal days, indicating that high temperatures, low humidity, strong solar radiation, and stagnant weather conditions favor the O3 pollution formation. The observational results show that oxygenated volatile organic compounds (OVOCs) and aromatic hydrocarbons contributing 51.6 % and 32.9 % to OFP, respectively, which are the primary contributors to O3 formation.
Systematic underestimation of modelled P(O3)net (P(O3)net_Mod) was found when compared to the measured P(O3)net (P(O3)net_Mea); this difference is defined as upper-limit P(O3)net_Missing due to the overestimation of HONO by MARGA in this study. When gradually incorporating mechanisms such as HO2 uptake by ambient aerosols, dry deposition, N2O5 uptake, and ClNO2 photolysis (Case D1), the daytime average P(O3)net_Missing was 3.4 ppbv h−1 (26.3 % underestimation). After adding constraints for VOC species such as acetaldehyde, acrolein, acetone, and butanone compared to Case D1 (defined as Case D2), the P(O3)net_Mod decreased by 0.5 % compared with Case D1. However, after further constraining all measurable OVOC species (Case D3), P(O3)net_Mod values increased by 4.4 % compared with Case D2, with a notable improvement of 10.2 % (approximately 1.3 ppbv h−1) during the P(O3)net rising phase (08:00–09:00 LT). This indicates that OVOCs play a particularly significant role in O3 formation during the morning. Additionally, after adding chlorine-containing VOCs (Case D4), P(O3)net_Mod increased by only 1.1 % compared with Case D3, further confirming the dominant role of OVOCs in compensating for P(O3)net_Missing. These results also demonstrate that incorporating the aforementioned missing mechanisms and measured VOC species cannot fully eliminate simulation bias. Other processes, i.e., the RO2, autoxidation, and the accretion reactions can also affect modelled P(O3)net, but they have not been examined here. The negative correlation of P(O3)net_Missing with the air mass aging indicates that the P(O3)net missing is not likely caused by unaccounted secondary production.
To quantify the effect of unmeasured VOCs and their related reactions, especially those involving OVOCs, we developed a compensation approach based on the observed relationship between daytime averaged P(O3)net_Missing andkOH_Missing. This approach hypothesizes that upscaling measured VOCs can compensate for thekOH_Missing attributed to unmeasured species, thereby reducing P(O3)net_Missing. Building upon Case D1, we designed three modelling scenarios (Case E1: expanded TVOC; Case E2: expanded ethylene and formaldehyde; Case E3: expanded formaldehyde) to compensate for P(O3)net_Missing. Among these modelling scenarios, the daytime averaged P(O3)net_Missing was reduced to 10.3 %, 17.2 %, and 5.1 % for Case E1, Case E2, and Case E3, respectively. Notably, Case E3 achieved the greatest reduction solely by increasing formaldehyde concentrations, validating the critical role of highly reactive OVOCs (particularly formaldehyde) in compensating for P(O3)net_Missing. This suggests that there other unmeasured highly reactive VOC species may exist in the ambient atmosphere, and constraining them in the model could further improve the simulation accuracy.
Additionally, the sensitivity assessment results derived from the different measured and modelled OFS approaches were compared: (1) in direct measurement using the NPOPR detection system, NO or VOCs were added to quantify changes in P(O3)net, with OFS determined through the incremental reactivity (IR) index (IR = ΔP(O3) ΔS(X), where X = NOx or VOCs and ΔS(X) represents the added concentration); (2) in model simulations, where the box model calculated P(O3)net and derived absolute P(O3)net sensitivity (dP(O3)net d[X], where X = NOx or VOCs). Meanwhile we found that the agreement of OFS assessment results between the direct measurements and the model results was lower in the P(O3)net rising phase (08:00–09:00 LT, 63.6 %) than those in the P(O3)net stable phase (10:00–12:00 LT, 72.7 %) and P(O3)net declining phase (13:00–17:00 LT, 72.7 %). This again highlights the importance of highly reactive OVOCs in improving the accuracy of OFS assessment. These results indicate that reducing P(O3)net_Missing can enhance the accuracy of OFS assessment to some extent, but fully eliminating the discrepancies still requires further constraints on unmeasured VOC species and further research.
In conclusion, we quantitatively assessed the P(O3)net simulation deficits and their impact on OFS diagnosis by comparing the measured and modelled P(O3)net, and found that the unmeasured VOCs – rather than the secondary atmospheric formation – are the primary causative factor of P(O3)net_Missing. Furthermore, both direct measurements and model results reveal a diurnal OFS shift dominated by the morning regime; transition and VOC-limited conditions prevailed, so prioritizing VOCs while co-controlling NOx is the most effective approach to O3 pollution control in PRD region. Our results also demonstrate that the persistent model biases risk under-estimating the local photochemical formation contribution to O3 pollution, thereby has weakening its perceived impact relative to physical transportation. Future studies should expanded VOCs measurements and combine direct P(O3)net observations with regional transport model to separate local production from up-wind advection.
The datasets supporting this research are included in this paper and its Supplement. The data for this study are also publicly available at https://doi.org/10.5281/zenodo.18337922 (Zhou and Shao, 2026). Meteorological data were sourced from the European Centre for Medium-Range Weather Forecasts (ECMWF; https://www.ecmwf.int/, last access: 10 October 2024). Box model simulations were conducted using the AtChem2 model (https://atchem.leeds.ac.uk/webapp/, last access: 12 April 2024) with the Master Chemical Mechanism (MCM v3.3.1; https://mcm.york.ac.uk/MCM, last access: 26 April 2024). Figures in this study were created using Igor Pro 6.7. Additional data or materials related to this study can be made available upon reasonable request to the corresponding author (junzhou@jnu.edu.cn), subject to restrictions on data resources.
The supplement related to this article is available online at https://doi.org/10.5194/acp-26-1889-2026-supplement.
JZ and MS designed this study. JZ and BZ wrote the manuscript with contributions from all co-authors. JZ, BJ, BZ, TZ, DC, YZ, ZH, J. Li, MD, MX, JHJ, and J. Luo collected and analyzed the data. All authors reviewed and revised the manuscript.
The contact author has declared that none of the authors has any competing interests.
Publisher's note: Copernicus Publications remains neutral with regard to jurisdictional claims made in the text, published maps, institutional affiliations, or any other geographical representation in this paper. The authors bear the ultimate responsibility for providing appropriate place names. Views expressed in the text are those of the authors and do not necessarily reflect the views of the publisher.
Many thanks to the Guangdong Ecological and Environmental Monitoring Center.
This research has been supported by the National Natural Science Foundation of China (grant no. 42305096), the National Foreign Experts Program (Individual Category) Plan (grant no. H20250956), the Special Support Plan for High-Level Talents of Guangdong Province (grant no. 2023JC07L057), the Natural Science Foundation of Guangdong Province (grant no. 2024A1515011494), the National Key Research and Development Program of China (grant no. 2023YFC3706204), the Guangdong Provincial Basic and Applied Basic Research Fund (the Youth Doctoral “Launch” Project) for the Year 2025 (grant no. SL2024A04J00396), the Guangdong Provincial General Colleges and Universities Innovation Team Project (Natural Science) (grant no. 2024KCXTD004), and the National Natural Science Foundation of China (grant no. 42207122).
This paper was edited by Frank Keutsch and reviewed by two anonymous referees.
Baier, B. C., Brune, W. H., Lefer, B. L., Miller, D. O., and Martins, D. K.: Direct ozone production rate measurements and their use in assessing ozone source and receptor regions for Houston in 2013, Atmos. Environ., 114, 83–91, https://doi.org/10.1016/j.atmosenv.2015.05.033, 2015.
Baier, B. C., Brune, W. H., Miller, D. O., Blake, D., Long, R., Wisthaler, A., Cantrell, C., Fried, A., Heikes, B., Brown, S., McDuffie, E., Flocke, F., Apel, E., Kaser, L., and Weinheimer, A.: Higher measured than modeled ozone production at increased NOx levels in the Colorado Front Range, Atmos. Chem. Phys., 17, 11273–11292, https://doi.org/10.5194/acp-17-11273-2017, 2017.
Berndt, T., Mentler, B., Scholz, W., Fischer, L., Herrmann, H., Kulmala, M., and Hansel A.: Accretion product formation from Ozonolysis and OH radical reaction of α-Pinene: mechanistic insight and the influence of isoprene and ethylene, Environmental Science & Technology, 52, 11069–11077, https://doi.org/10.1021/acs.est.8b02210, 2018.
Cai, C., Geng, F., Tie, X., Yu, Q., and An, J.: Characteristics and source apportionment of VOCs measured in Shanghai, China, Atmos. Environ., 44, 5005–5014, https://doi.org/10.1016/j.atmosenv.2010.07.059, 2010.
Carter, W. P. L., A. Pierce J. A., Luo, D., and Malkina, I. L.: Environmental chamber study of maximum incremental reactivities of volatile organic-compounds, Atmos. Environ., 29, 2499, https://doi.org/10.1016/1352-2310(95)00149-S, 1995.
Cazorla, M. and Brune, W. H.: Measurement of Ozone Production Sensor, Atmos. Meas. Tech., 3, 545–555, https://doi.org/10.5194/amt-3-545-2010, 2010.
Cazorla, M., Brune, W. H., Ren, X., and Lefer, B.: Direct measurement of ozone production rates in Houston in 2009 and comparison with two estimation methods, Atmos. Chem. Phys., 12, 1203–1212, https://doi.org/10.5194/acp-12-1203-2012, 2012.
Chen, L., Liao, H., Zhu, J., Li, K., Bai, Y., Yue, X., Yang, Y., Hu, J., and Zhang, M.: Increases in ozone-related mortality in China over 2013–2030 attributed to historical ozone deterioration and future population aging, Science of The Total Environment, 858, 159972, https://doi.org/10.1016/j.scitotenv.2022.159972, 2023.
Chen, S., Wei, W., Wang, C., Wang, X., Zhou, C., and Cheng, S.: A modeling approach to dynamically estimating local photochemistry process and its contribution to surface O3 pollution, Journal of Environmental Management, 373, 123450, https://doi.org/10.1016/j.jenvman.2024.123450, 2025.
Chen, T., Xue, L., Zheng, P., Zhang, Y., Liu, Y., Sun, J., Han, G., Li, H., Zhang, X., Li, Y., Li, H., Dong, C., Xu, F., Zhang, Q., and Wang, W.: Volatile organic compounds and ozone air pollution in an oil production region in northern China, Atmos. Chem. Phys., 20, 7069–7086, https://doi.org/10.5194/acp-20-7069-2020, 2020a.
Chen, Y., Chi, S., Wang, Y., Guo, S., Zhang, C., Ye, C., and Lin, W.: Ozone production sensitivity in the highland city of Lhasa: a comparative analysis with Beijing, Air Quality, Atmosphere & Health, 1–11, https://doi.org/10.1007/s11869-024-01604-4, 2024.
Chen, Y., Yan, H., Yao, Y., Zeng, C., Gao, P., Zhuang, L., Fan, L., and Ye, D.: Relationships of ozone formation sensitivity with precursors emissions, meteorology and land use types, in Guangdong-Hong Kong-Macao Greater Bay Area, China, Journal of Environmental Sciences, 94, 1–13, https://doi.org/10.1016/j.jes.2020.04.005, 2020b.
Crounse, J. D., Knap, H. C., Ørnsø, K. B., Jørgensen, S., Paulot, F., Kjaergaard, H. G., and Wennberg, P. O.: Atmospheric Fate of Methacrolein. 1. Peroxy Radical Isomerization Following Addition of OH and O2, The Journal of Physical Chemistry A, 116, 5756–5762, https://doi.org/10.1021/jp211560u, 2012.
de Gouw, J., Middlebrook, A., Warneke, C., Goldan, P., Kuster, W., Roberts, J., Fehsenfeld, F., Worsnop, D., Canagaratna, M., and Pszenny, A.: Budget of organic carbon in a polluted atmosphere: Results from the New England Air Quality Study in 2002, Journal of Geophysical Research-Atmospheres, 110, D16305, https://doi.org/10.1029/2004JD005623, 2005.
Dyson, J. E., Whalley, L. K., Slater, E. J., Woodward-Massey, R., Ye, C., Lee, J. D., Squires, F., Hopkins, J. R., Dunmore, R. E., Shaw, M., Hamilton, J. F., Lewis, A. C., Worrall, S. D., Bacak, A., Mehra, A., Bannan, T. J., Coe, H., Percival, C. J., Ouyang, B., Hewitt, C. N., Jones, R. L., Crilley, L. R., Kramer, L. J., Acton, W. J. F., Bloss, W. J., Saksakulkrai, S., Xu, J., Shi, Z., Harrison, R. M., Kotthaus, S., Grimmond, S., Sun, Y., Xu, W., Yue, S., Wei, L., Fu, P., Wang, X., Arnold, S. R., and Heard, D. E.: Impact of HO2 aerosol uptake on radical levels and O3 production during summertime in Beijing, Atmos. Chem. Phys., 23, 5679–5697, https://doi.org/10.5194/acp-23-5679-2023, 2023.
Gilman, J. B., Kuster, W. C., Goldan, P. D., Herndon, S. C., Zahniser, M. S., Tucker, S. C., Brewer, W. A., Lerner, B. M., Williams, E. J., and Harley, R. A.: Measurements of volatile organic compounds during the 2006 TexAQS/GoMACCS campaign: Industrial influences, regional characteristics, and diurnal dependencies of the OH reactivity, Journal of Geophysical Research: Atmospheres, 114, https://doi.org/10.1029/2008jd011525, 2009.
Hao, Y., Zhou, J., Zhou, J.-P., Wang, Y., Yang, S., Huangfu, Y., Li, X.-B., Zhang, C., Liu, A., Wu, Y., Zhou, Y., Yang, S., Peng, Y., Qi, J., He, X., Song, X., Chen, Y., Yuan, B., and Shao, M.: Measuring and modeling investigation of the net photochemical ozone production rate via an improved dual-channel reaction chamber technique, Atmos. Chem. Phys., 23, 9891–9910, https://doi.org/10.5194/acp-23-9891-2023, 2023.
Huang, B., Gan, T., Pei, C., Li, M., Cheng, P., Chen, D., Cai, R., Wang, Y., Li, L., Huang, Z., Gao, W., Fu, Z., and Zhou, Z.: Size-segregated Characteristics and Formation Mechanisms of Water-soluble Inorganic Ions during Different Seasons in Heshan of Guangdong, China, Aerosol and Air Quality Research, 20, 1961–1973, https://doi.org/10.4209/aaqr.2019.11.0582, 2020.
Jeffries, H.: An experimental method for measuring the rate of synthesis, destruction, and transport of ozone in the lower atmosphere, PhD Thesis, Department of Environmental Science and Engineering, University of North Carolina at Chapel Hill, publication no. E.S.E. 285, 1971.
Jing, S., Duohong, C., Wang, C., Ridong, C., Yu-jun, L., Yongxi, H., Xin, Z., and Yan, Z.: Study on the Characteristics and Causes of Ozone Severe Pollution Days in Jiangmen City, China Environmental Science, 1–19, https://doi.org/10.19674/j.cnki.issn1000-6923.20241212.002, 2024.
Kanaya, Y., Hofzumahaus, A., Dorn, H.-P., Brauers, T., Fuchs, H., Holland, F., Rohrer, F., Bohn, B., Tillmann, R., Wegener, R., Wahner, A., Kajii, Y., Miyamoto, K., Nishida, S., Watanabe, K., Yoshino, A., Kubistin, D., Martinez, M., Rudolf, M., Harder, H., Berresheim, H., Elste, T., Plass-Dülmer, C., Stange, G., Kleffmann, J., Elshorbany, Y., and Schurath, U.: Comparisons of observed and modeled OH and HO2 concentrations during the ambient measurement period of the HOxComp field campaign, Atmos. Chem. Phys., 12, 2567–2585, https://doi.org/10.5194/acp-12-2567-2012, 2012.
Li, B., Gasser, T., Ciais, P., Piao, S., Tao, S., Balkanski, Y., Hauglustaine, D., Boisier, J.-P., Chen, Z., and Huang, M.: The contribution of China's emissions to global climate forcing, Nature, 531, 357–361, https://doi.org/10.1038/nature17165, 2016.
Li, K., Jacob, D. J., Liao, H., Shen, L., Zhang, Q., and Bates, K. H.: Anthropogenic drivers of 2013–2017 trends in summer surface ozone in China, Proceedings of the National Academy of Sciences, 116, 422–427, https://doi.org/10.1073/pnas.1812168116, 2019.
Li, K., Wang, X., Li, L., Wang, J., Liu, Y., Cheng, X., Xu, B., Wang, X., Yan, P., and Li, S.: Large variability of O3-precursor relationship during severe ozone polluted period in an industry-driven cluster city (Zibo) of North China Plain, Journal of Cleaner Production, 316, 128252, https://doi.org/10.1016/j.jclepro.2021.128252, 2021.
Lu, K., Zhang, Y., Su, H., Brauers, T., Chou, C. C., Hofzumahaus, A., Liu, S. C., Kita, K., Kondo, Y., and Shao, M.: Oxidant (O3 + NO2) production processes and formation regimes in Beijing, Journal of Geophysical Research: Atmospheres, 115, https://doi.org/10.1029/2009JD012714, 2010.
Luo, J., Zhang, T., Zhou, J., Jiang, B., Wang, Y., Zhai, Y., Tang, J., Wang, W., Liu, Y., Liu, Y., Chen, D., and Shao, M.: Source-specific ozone formation in the Pearl River Delta: Insights from direct measurement at two sites with distinct environmental characteristics, Environmental Pollution, 383, 126774, https://doi.org/10.1016/j.envpol.2025.126774, 2025.
Lyu, Y., Gao, Y., Pang, X., Sun, S., Luo, P., Cai, D., Qin, K., Wu, Z., and Wang, B.: Elucidating contributions of volatile organic compounds to ozone formation using random forest during COVID-19 pandemic: A case study in China, Environmental Pollution, 346, 123532, https://doi.org/10.1016/j.envpol.2024.123532, 2024.
Ma, W., Feng, Z., Zhan, J., Liu, Y., Liu, P., Liu, C., Ma, Q., Yang, K., Wang, Y., He, H., Kulmala, M., Mu, Y., and Liu, J.: Influence of photochemical loss of volatile organic compounds on understanding ozone formation mechanism, Atmos. Chem. Phys., 22, 4841–4851, https://doi.org/10.5194/acp-22-4841-2022, 2022.
Ma, W., Chen, X., Xia, M., Liu, Y., Wang, Y., Zhang, Y., Zheng, F., Zhan, J., Hua, C., and Wang, Z.: Reactive Chlorine Species Advancing the Atmospheric Oxidation Capacities of Inland Urban Environments, Environmental Science & Technology, 57, 14638-1-4647, https://doi.org/10.1021/acs.est.3c05169, 2023.
Mazaheri, M., Lin, W., Clifford, S., Yue, D., Zhai, Y., Xu, M., Rizza, V., and Morawska, L.: Characteristics of school children's personal exposure to ultrafine particles in Heshan, Pearl River Delta, China – A pilot study, Environment International, 132, 105134, https://doi.org/10.1016/j.envint.2019.105134, 2019.
Morino, Y., Sadanaga, Y., Sato, K., Sakamoto, Y., Muraoka, T., Miyatake, K., Li, J., and Kajii, Y.: Direct evaluation of the ozone production regime in smog chamber experiments, Atmos. Environ., 309, 119889, https://doi.org/10.1016/j.atmosenv.2023.119889, 2023.
Mousavinezhad, S., Choi, Y., Pouyaei, A., Ghahremanloo, M., and Nelson, D. L.: A comprehensive investigation of surface ozone pollution in China, 2015–2019: Separating the contributions from meteorology and precursor emissions, Atmospheric Research, 257, 105599, https://doi.org/10.1016/j.atmosres.2021.105599, 2021.
Pei, C. L., Xie, Y. T., Chen, X., Zhang, T., Qiu, X. N., Wang, Y., Wang, Z. H., and Li, M.: Analysis of a Typical Ozone Pollution Process in Guangzhou in Winter, Environmental Science, 43, 4305–4315, https://doi.org/10.13227/j.hjkx.202110168, 2022.
Qian, H., Xu, B., Xu, Z., Zou, Q., Zi, Q., Zuo, H., Zhang, F., Wei, J., Pei, X., and Zhou, W.: Anthropogenic Oxygenated Volatile Organic Compounds Dominate Atmospheric Oxidation Capacity and Ozone Production via Secondary Formation of Formaldehyde in the Urban Atmosphere, ACS ES&T Air, https://doi.org/10.1021/acsestair.4c00317, 2025.
Ren, X., Van Duin, D., Cazorla, M., Chen, S., Mao, J., Zhang, L., Brune, W. H., Flynn, J. H., Grossberg, N., and Lefer, B. L.: Atmospheric oxidation chemistry and ozone production: Results from SHARP 2009 in Houston, Texas, Journal of Geophysical Research: Atmospheres, 118, 5770–5780, https://doi.org/10.1002/jgrd.50342, 2013.
Sadanaga, Y., Kawasaki, S., Tanaka, Y., Kajii, Y., and Bandow, H.: New system for measuring the photochemical ozone production rate in the atmosphere, Environmental Science & Technology, 51, 2871–2878, https://doi.org/10.1021/acs.est.6b04639, 2017.
Sakamoto, Y., Sadanaga, Y., Li, J., Matsuoka, K., Takemura, M., Fujii, T., Nakagawa, M., Kohno, N., Nakashima, Y., and Sato, K.: Relative and absolute sensitivity analysis on ozone production in Tsukuba, a city in Japan, Environmental Science & Technology, 53, 13629–13635, https://doi.org/10.1021/acs.est.9b03542, 2019.
Seinfeld, J. H. and Pandis, S. N. (Eds.): Atmospheric Chemistry and Physics: From Air Pollution to Climate Change, John Wiley & Sons, Hoboken, ISBN 978-1-118-94740-1, 2016.
Sillman, S.: The relation between ozone, NOx and hydrocarbons in urban and polluted rural environments, Atmos. Environ., 33, 1821–1845, https://doi.org/10.1016/S1352-2310(98)00345-8, 1999.
Sklaveniti, S., Locoge, N., Stevens, P. S., Wood, E., Kundu, S., and Dusanter, S.: Development of an instrument for direct ozone production rate measurements: measurement reliability and current limitations, Atmos. Meas. Tech., 11, 741–761, https://doi.org/10.5194/amt-11-741-2018, 2018.
Sommariva, R., Cox, S., Martin, C., Borońska, K., Young, J., Jimack, P. K., Pilling, M. J., Matthaios, V. N., Nelson, B. S., Newland, M. J., Panagi, M., Bloss, W. J., Monks, P. S., and Rickard, A. R.: AtChem (version 1), an open-source box model for the Master Chemical Mechanism, Geosci. Model Dev., 13, 169–183, https://doi.org/10.5194/gmd-13-169-2020, 2020.
Song, K., Liu, R., Wang, Y., Liu, T., Wei, L., Wu, Y., Zheng, J., Wang, B., and Liu, S. C.: Observation-based analysis of ozone production sensitivity for two persistent ozone episodes in Guangdong, China, Atmos. Chem. Phys., 22, 8403–8416, https://doi.org/10.5194/acp-22-8403-2022, 2022.
Tan, Z., Fuchs, H., Lu, K., Hofzumahaus, A., Bohn, B., Broch, S., Dong, H., Gomm, S., Häseler, R., He, L., Holland, F., Li, X., Liu, Y., Lu, S., Rohrer, F., Shao, M., Wang, B., Wang, M., Wu, Y., Zeng, L., Zhang, Y., Wahner, A., and Zhang, Y.: Radical chemistry at a rural site (Wangdu) in the North China Plain: observation and model calculations of OH, HO2 and RO2 radicals, Atmos. Chem. Phys., 17, 663–690, https://doi.org/10.5194/acp-17-663-2017, 2017.
Tan, Z., Lu, K., Dong, H., Hu, M., Li, X., Liu, Y., Lu, S., Shao, M., Su, R., and Wang, H.: Explicit diagnosis of the local ozone production rate and the ozone-NOx-VOC sensitivities, Science Bulletin, 63, 1067–1076, https://doi.org/10.1016/j.scib.2018.07.001, 2018.
Tan, Z., Lu, K., Hofzumahaus, A., Fuchs, H., Bohn, B., Holland, F., Liu, Y., Rohrer, F., Shao, M., Sun, K., Wu, Y., Zeng, L., Zhang, Y., Zou, Q., Kiendler-Scharr, A., Wahner, A., and Zhang, Y.: Experimental budgets of OH, HO2, and RO2 radicals and implications for ozone formation in the Pearl River Delta in China 2014, Atmos. Chem. Phys., 19, 7129–7150, https://doi.org/10.5194/acp-19-7129-2019, 2019.
Tong, J., Hu, R., Hu, C., Liu, X., Cai, H., Lin, C., Zhong, L., Wang, J., and Xie, P.: Development of a net ozone production rate detection system based on dual-channel cavity ring-down spectroscopy, Journal of Environmental Sciences, 149, 419–430, https://doi.org/10.1016/j.jes.2024.01.035, 2025.
Wang, J., Zhang, Y., Wu, Z., Luo, S., Song, W., and Wang, X.: Ozone episodes during and after the 2018 Chinese National Day holidays in Guangzhou: Implications for the control of precursor VOCs, Journal of Environmental Sciences, 114, 322–333, https://doi.org/10.1016/j.jes.2021.09.009, 2022a.
Wang, P., Chen, Y., Hu, J., Zhang, H., and Ying, Q.: Attribution of tropospheric ozone to NOx and VOC emissions: considering ozone formation in the transition regime, Environmental Science & Technology, 53, 1404–1412, https://doi.org/10.1021/acs.est.8b05981, 2019.
Wang, R., Wang, L., Sun, J., Zhang, L., Li, Y., Li, K., Liu, B., Zhang, J., and Wang, Y.: Maximizing ozone control by spatial sensitivity-oriented mitigation strategy in the Pearl River Delta Region, China, Science of The Total Environment, 905, 166987, https://doi.org/10.1016/j.scitotenv.2023.166987, 2023.
Wang, S., Wu, R., Berndt, T., Ehn, M., and Wang, L.: Formation of highly oxidized radicals and multifunctional products from the atmospheric oxidation of Alkylbenzenes, Environmental Science & Technology, 51, 8442–8449, https://doi.org/10.1021/acs.est.7b02374, 2017a.
Wang, T., Xue, L., Brimblecombe, P., Lam, Y. F., Li, L., and Zhang, L.: Ozone pollution in China: A review of concentrations, meteorological influences, chemical precursors, and effects, Science of the Total Environment, 575, 1582–1596, https://doi.org/10.1016/j.scitotenv.2016.10.081, 2017b.
Wang, W., Yuan, B., Peng, Y., Su, H., Cheng, Y., Yang, S., Wu, C., Qi, J., Bao, F., Huangfu, Y., Wang, C., Ye, C., Wang, Z., Wang, B., Wang, X., Song, W., Hu, W., Cheng, P., Zhu, M., Zheng, J., and Shao, M.: Direct observations indicate photodegradable oxygenated volatile organic compounds (OVOCs) as larger contributors to radicals and ozone production in the atmosphere, Atmos. Chem. Phys., 22, 4117–4128, https://doi.org/10.5194/acp-22-4117-2022, 2022b.
Wang, W., Li, X., Cheng, Y., Parrish, D. D., Ni, R., Tan, Z., Liu, Y., Lu, S., Wu, Y., and Chen, S.: Ozone pollution mitigation strategy informed by long-term trends of atmospheric oxidation capacity, Nature Geoscience, 17, 20–25, https://doi.org/10.1038/s41561-023-01334-9, 2024a.
Wang, W., Yuan, B., Su, H., Cheng, Y., Qi, J., Wang, S., Song, W., Wang, X., Xue, C., Ma, C., Bao, F., Wang, H., Lou, S., and Shao, M.: A large role of missing volatile organic compound reactivity from anthropogenic emissions in ozone pollution regulation, Atmos. Chem. Phys., 24, 4017–4027, https://doi.org/10.5194/acp-24-4017-2024, 2024b.
Wang, Y., Chen, Y., Chi, S., Wang, J., Zhang, C., Lin, W., Zhao, W., and Ye, C.: Optimizing a twin-chamber system for direct ozone production rate measurement, Environmental Pollution, 348, 123837, https://doi.org/10.1016/j.envpol.2024.123837, 2024c.
Wei, N., Zhao, W., Yao, Y., Wang, H., Liu, Z., Xu, X., Rahman, M., Zhang, C., Fittschen, C., and Zhang, W.: Peroxy radical chemistry during ozone photochemical pollution season at a suburban site in the boundary of Jiangsu–Anhui–Shandong–Henan region, China, Science of the Total Environment, 904, 166355, https://doi.org/10.1016/j.scitotenv.2023.166355, 2023.
Whalley, L. K., Slater, E. J., Woodward-Massey, R., Ye, C., Lee, J. D., Squires, F., Hopkins, J. R., Dunmore, R. E., Shaw, M., Hamilton, J. F., Lewis, A. C., Mehra, A., Worrall, S. D., Bacak, A., Bannan, T. J., Coe, H., Percival, C. J., Ouyang, B., Jones, R. L., Crilley, L. R., Kramer, L. J., Bloss, W. J., Vu, T., Kotthaus, S., Grimmond, S., Sun, Y., Xu, W., Yue, S., Ren, L., Acton, W. J. F., Hewitt, C. N., Wang, X., Fu, P., and Heard, D. E.: Evaluating the sensitivity of radical chemistry and ozone formation to ambient VOCs and NOx in Beijing, Atmos. Chem. Phys., 21, 2125–2147, https://doi.org/10.5194/acp-21-2125-2021, 2021.
Woodward-Massey, R., Sommariva, R., Whalley, L. K., Cryer, D. R., Ingham, T., Bloss, W. J., Ball, S. M., Cox, S., Lee, J. D., Reed, C. P., Crilley, L. R., Kramer, L. J., Bandy, B. J., Forster, G. L., Reeves, C. E., Monks, P. S., and Heard, D. E.: Radical chemistry and ozone production at a UK coastal receptor site, Atmos. Chem. Phys., 23, 14393–14424, https://doi.org/10.5194/acp-23-14393-2023, 2023.
Wu, C., Wang, C., Wang, S., Wang, W., Yuan, B., Qi, J., Wang, B., Wang, H., Wang, C., Song, W., Wang, X., Hu, W., Lou, S., Ye, C., Peng, Y., Wang, Z., Huangfu, Y., Xie, Y., Zhu, M., Zheng, J., Wang, X., Jiang, B., Zhang, Z., and Shao, M.: Measurement report: Important contributions of oxygenated compounds to emissions and chemistry of volatile organic compounds in urban air, Atmos. Chem. Phys., 20, 14769–14785, https://doi.org/10.5194/acp-20-14769-2020, 2020.
Wu, S., Lee, H. J., Anderson, A., Liu, S., Kuwayama, T., Seinfeld, J. H., and Kleeman, M. J.: Direct measurements of ozone response to emissions perturbations in California, Atmos. Chem. Phys., 22, 4929–4949, https://doi.org/10.5194/acp-22-4929-2022, 2022.
Xu, D., Yuan, Z., Wang, M., Zhao, K., Liu, X., Duan, Y., Fu, Q., Wang, Q., Jing, S., and Wang, H.: Multi-factor reconciliation of discrepancies in ozone-precursor sensitivity retrieved from observation-and emission-based models, Environment International, 158, 106952, https://doi.org/10.1016/j.envint.2021.106952, 2022.
Yadav, P., Lal, S., Tripathi, S. N., Jain, V., and Mandal, T. K.: Role of sources of NMVOCs in O3, OH reactivity, and secondary organic aerosol formation over Delhi, Atmospheric Pollution Research, 15, 102082, https://doi.org/10.1016/j.apr.2024.102082, 2024.
Yang, M., Li, F., Huang, C., Tong, L., Dai, X., and Xiao, H.: VOC characteristics and their source apportionment in a coastal industrial area in the Yangtze River Delta, China, Journal of Environmental Sciences, 127, 483–494, https://doi.org/10.1016/j.jes.2022.05.041, 2023.
Yang, X., Lu, K., Ma, X., Gao, Y., Tan, Z., Wang, H., Chen, X., Li, X., Huang, X., He, L., Tang, M., Zhu, B., Chen, S., Dong, H., Zeng, L., and Zhang, Y.: Radical chemistry in the Pearl River Delta: observations and modeling of OH and HO2 radicals in Shenzhen in 2018, Atmos. Chem. Phys., 22, 12525–12542, https://doi.org/10.5194/acp-22-12525-2022, 2022.
Yang, Y., Shao, M., Keßel, S., Li, Y., Lu, K., Lu, S., Williams, J., Zhang, Y., Zeng, L., Nölscher, A. C., Wu, Y., Wang, X., and Zheng, J.: How the OH reactivity affects the ozone production efficiency: case studies in Beijing and Heshan, China, Atmos. Chem. Phys., 17, 7127–7142, https://doi.org/10.5194/acp-17-7127-2017, 2017.
Yu, D., Tan, Z., Lu, K., Ma, X., Li, X., Chen, S., Zhu, B., Lin, L., Li, Y., and Qiu, P.: An explicit study of local ozone budget and NOx-VOCs sensitivity in Shenzhen China, Atmos. Environ., 224, 117304, https://doi.org/10.1016/j.atmosenv.2020.117304, 2020.
Yuan, B., Shao, M., De Gouw, J., Parrish, D. D., Lu, S., Wang, M., Zeng, L., Zhang, Q., Song, Y., and Zhang, J.: Volatile organic compounds (VOCs) in urban air: How chemistry affects the interpretation of positive matrix factorization (PMF) analysis, Journal of Geophysical Research: Atmospheres, 117, https://doi.org/10.1029/2012jd018236, 2012.
Yuan, B., Hu, W. W., Shao, M., Wang, M., Chen, W. T., Lu, S. H., Zeng, L. M., and Hu, M.: VOC emissions, evolutions and contributions to SOA formation at a receptor site in eastern China, Atmos. Chem. Phys., 13, 8815–8832, https://doi.org/10.5194/acp-13-8815-2013, 2013.
Zhang, G., Yu, X., Yin, H., Feng, C., Ma, C., Sun, S., Cheng, H., Wang, S., Shang, K., and Liu, X.: Heatwave-amplified atmospheric oxidation in a multi-province border area in Xuzhou, China, Frontiers in Environmental Science, 12, 1496584, https://doi.org/10.3389/fenvs.2024.1496584, 2024.
Zhang, L., Brook, J. R., and Vet, R.: A revised parameterization for gaseous dry deposition in air-quality models, Atmos. Chem. Phys., 3, 2067–2082, https://doi.org/10.5194/acp-3-2067-2003, 2003.
Zhang, Y., Xue, L., Chen, T., Shen, H., Li, H., and Wang, W.: Development history of Observation-Based Model (OBM) and its application and prospect in atmospheric chemistry studies in China, Res. Environ. Sci, 35, 621–632, https://doi.org/10.13198/j.issn.1001-6929.2022.01.05, 2022.
Zheng, S., Xu, X., Zhang, Y., Wang, L., Yang, Y., Jin, S., and Yang, X.: Characteristics and sources of VOCs in urban and suburban environments in Shanghai, China, during the 2016 G20 summit, Atmospheric Pollution Research, 10, 1766–1779, https://doi.org/10.1016/j.apr.2019.07.008, 2019.
Zhou, J. and Shao, M.: junner15/Why observed and modelled ozone production rates and sensitives differ, a case study at a regional site in China (Data), Zenodo [data set], https://doi.org/10.5281/zenodo.18337922, 2026.
Zhou, J., Sato, K., Bai, Y., Fukusaki, Y., Kousa, Y., Ramasamy, S., Takami, A., Yoshino, A., Nakayama, T., Sadanaga, Y., Nakashima, Y., Li, J., Murano, K., Kohno, N., Sakamoto, Y., and Kajii, Y.: Kinetics and impacting factors of HO2 uptake onto submicron atmospheric aerosols during the 2019 Air QUAlity Study (AQUAS) in Yokohama, Japan , Atmos. Chem. Phys., 21, 12243–12260, https://doi.org/10.5194/acp-21-12243-2021, 2021.
Zhou, J., Wang, W., Wang, Y., Zhou, Z., Lv, X., Zhong, M., Zhong, B., Deng, M., Jiang, B., and Luo, J.: Intercomparison of measured and modelled photochemical ozone production rates: Suggestion of chemistry hypothesis regarding unmeasured VOCs, Science of The Total Environment, 951, 175290, https://doi.org/10.1016/j.scitotenv.2024.175290, 2024a.
Zhou, J., Zhang, C., Liu, A., Yuan, B., Wang, Y., Wang, W., Zhou, J.-P., Hao, Y., Li, X.-B., He, X., Song, X., Chen, Y., Yang, S., Yang, S., Wu, Y., Jiang, B., Huang, S., Liu, J., Peng, Y., Qi, J., Deng, M., Zhong, B., Huangfu, Y., and Shao, M.: Measurement report: Vertical and temporal variability in the near-surface ozone production rate and sensitivity in an urban area in the Pearl River Delta region, China, Atmos. Chem. Phys., 24, 9805–9826, https://doi.org/10.5194/acp-24-9805-2024, 2024b.