
the Creative Commons Attribution 4.0 License.
the Creative Commons Attribution 4.0 License.
 | 13 Nov 2026
Process-level contributions to uncertainty in aerosol effective radiative forcing: a perturbed parameter ensemble with ICON–HAM

David Neubauer
Yusuf Bhatti
Duncan Watson-Parris
Philip Stier
Johannes Quaas
Daniel Partridge
Ardit Arifi
Anne Kubin
Athanasios Nenes
Muhammed Irfan
Carl Svenhag
Nick Schutgens
Bastiaan van Diedenhoven
Sylvaine Ferrachat
Ulrike Lohmann
Ina Tegen
Alice Henkes
Guangliang Fu
Otto Hasekamp
Changes in aerosols since the preindustrial era have altered the top-of-the-atmosphere radiation balance by scattering and absorbing solar radiation (aerosol–radiation interactions, ARI) and indirectly interacting with clouds (aerosol–cloud interactions, ACI), known as aerosol effective radiative forcing (ERFaer). ERFaer persistently remains one of the most uncertain components in climate projections, due to imperfect representations of aerosol and cloud processes in climate models. Here, we construct a perturbed parameter ensemble (PPE) with the aerosol–climate model ICON2.6.4–A–HAM2.3 (hereafter ICON–HAM) to quantify key sources of ERFaer uncertainty. We perturb 42 aerosol and cloud parameters over 383 PPE members. Parametric uncertainties in aerosol and cloud processes yield a 90 % credible range of −1.42 to −0.65 W m−2 for ERFaer (mean: −1.04 W m−2) for the period 2024–2025. The parameters related to emissions (anthropogenic sulfur dioxide, natural dimethyl sulfide, and emitted particle size) dominate ACI uncertainty and hence ERFaer uncertainty (80 %), while absorption-related parameters (anthropogenic black carbon emissions and aerosol refractive indices) drive ARI uncertainty (60 %). Cloud parameters account for 13 % of ERFaer uncertainty, mainly via convection and entrainment processes. The sensitivity analysis of model diagnostics to parameters reveals that many present-day aerosol and cloud observables share dominant causes of uncertainty with ACI and ARI forcing, highlighting the potential for constraining ERFaer using existing space- and ground-based measurements. Notably, model biases against SPEXone and MODIS observations coincide spatially with parametric uncertainties, suggesting that much of these biases may be mitigated through appropriate constraint with observations, while the remainder requires structural model developments in combination with improved observations.
- Article
(18261 KB) - Full-text XML
-
Supplement
(34295 KB) - BibTeX
- EndNote


Earth's climate system is modulated by atmospheric aerosols, which perturb the radiative energy balance both directly through scattering and absorption of radiation (aerosol–radiation interactions, ARI) and indirectly by acting as cloud condensation nuclei (CCN) and ice-nucleating particle (INP) that modify cloud microphysical and radiative properties (aerosol–cloud interactions, ACI). Since the industrial era, human activities have significantly increased aerosols and altered their composition, leading to an effective radiative forcing from aerosols (ERFaer) that arises from both ARI (ERFari) and ACI (ERFaci) (Bellouin et al., 2020; Forster et al., 2021). The latest assessment by the Intergovernmental Panel on Climate Change (IPCC) provided an ERFaer estimate of −1.1 W m−2 over 1750–2019, with a 90 % credible range of −1.7 to −0.4 W m−2 (Forster et al., 2021). This aerosol-induced cooling partly offsets the warming driven by anthropogenic greenhouse gases (Szopa et al., 2021).
Despite sustained advances in observations, modeling, and process understanding over recent decades, the estimate of ERFaer remains highly uncertain, with particularly large uncertainty in ERFaci (Seinfeld et al., 2016; Kahn et al., 2023; Rosenfeld et al., 2023; Im et al., 2026). Since IPCC AR5, the observational estimation of ERFaer has substantially progressed along several axes (Boucher et al., 2013; Forster et al., 2021), leading to improved estimates with reduced uncertainty (Hasekamp et al., 2019b; Bellouin et al., 2020; Jia et al., 2026). In contrast, progress on the modeling side has been more limited: from phase 5 to phase 6 of the Coupled Model Intercomparison Project (CMIP), the spread in simulated ERFaer has narrowed only marginally (Forster et al., 2021). This implies that advances in our fundamental understanding have not yet been translated meaningfully into reduced model uncertainty and reliable climate projections, despite increases in model complexity and resolution (Carslaw et al., 2026).
Multi-model ensembles (MMEs) have often been used to assess model spread and thereby prediction reliability (i.e., the consistency and robustness of model results across different scenarios and application contexts) in model intercomparison projects (MIP) such as AeroCom (Myhre et al., 2013a; Gliß et al., 2021) and CMIP (Durack et al., 2025). However, the model spread in an MME reflects a complex mixture of structural uncertainty (differences in model equations and process representations), parametric uncertainty (uncertainty in parameter values within a fixed model structure), and internal variability (natural fluctuations of the climate system) (Knutti et al., 2010). This makes it difficult to pinpoint the processes driving model uncertainty, prioritise future model development, and ultimately narrow the uncertainty in climate predictions and projections (Carslaw et al., 2026).
Perturbed parameter ensembles (PPEs) provide a complementary approach that disentangles structural and parametric origins of model-observation discrepancies and attributes model uncertainty to specific physical processes (Allen, 1999; Carslaw et al., 2013; Regayre et al., 2026). A PPE comprises a suite of simulations from a single model in which multiple physical parameters are simultaneously varied to sample parametric uncertainty (Murphy et al., 2004). PPEs have been widely applied to atmospheric science, and more recently adopted to aerosol–climate modeling. Many modeling centres have developed PPE infrastructures, including CAM5 (Zhao et al., 2013), CAM6 (Eidhammer et al., 2024; Gettelman et al., 2024), E3SM (Qian et al., 2018; Nugent et al., 2026), ECHAM–HAM (Bhatti et al., 2026), GISS ModelE (Elsaesser et al., 2025), HadGEM (Regayre et al., 2018; Yoshioka et al., 2019), and UKESM1 (Regayre et al., 2023), through which important sources of ERFaer uncertainty have been identified and constrained in individual models (Watson-Parris et al., 2020; Johnson et al., 2020; Song et al., 2025; Regayre et al., 2026). Most PPEs typically perturb a relatively limited number of parameters (∼ 25) or focus primarily on either aerosol or cloud processes, potentially limiting their ability to capture complex nonlinear interactions among processes. Another important aspect of PPE design is the simulations-to-parameters ratio (rsp), which typically ranges from about 5 to 10 and governs the trade-off between emulator accuracy and computational cost. Yet, optimal values of rsp that balance this trade-off remains uncertain. This poses a practical challenge for future PPE MIPs, given their substantial demands on computational resources and data storage; for example, a single model PPE can generate ∼ 47 TB of data (Eidhammer et al., 2024).
Building on the prior knowledge of parameter importance, we construct a comprehensive aerosol–cloud PPE using the ICON-HAM model to systematically investigate parametric uncertainty in ERFaer and key aerosol and cloud properties. As a relatively new aerosol–climate model, ICON-HAM particularly benefits from the PPE framework that supports parameter optimisation and targeted model development. Our PPE comprises 383 simulations in which 42 parameters are perturbed, spanning 13 categories that include emissions, aerosol/cloud properties, and aerosol/cloud processes. To move beyond the discrete PPE simulations, we use machine-learning statistical emulation (Gaussian Process) to continuously sample the 42-dimensional parameter space, enabling quantitative assessment of parametric uncertainty in ERFaer and aerosol-cloud properties. We further evaluate model performance against satellite observations (SPEXone and MODIS) and identify potential causes of both model uncertainty and model-observation bias.
This study aims to address the following questions. (i) Which properties and processes drive uncertainties in ERFaer and in key aerosol and cloud properties? (ii) What present day (PD) observable quantities can best constrain the preindustrial (PI) to PD forcing? (iii) To what extent can model-observation bias be reduced through parametric optimisation? In addition, we also examine a technical aspect of the PPE experimental design: what is the optimal rsp value that balances computational cost, data-storage demands, and emulator accuracy?
This paper is organised as follows. We first describe the model configuration, PPE setup, emulator, and satellite observations in Sect. 2. Section 3.1 presents the emulator performance and the determination of the optimal rsp. Section 3.2 and 3.3 quantify and attribute parametric uncertainties in ERFaer and key aerosol and cloud properties. Section 3.4 presents the sensitivity of model outputs to perturbed parameters, while Sect. 3.5 evaluates model against satellite observations and relates model biases to parametric uncertainties. In Sect. 4, we discuss the main findings and their implications.
2.1 Model description
The global aerosol–climate model ICON2.6.4–A–HAM2.3 is a combination of the icosahedral non-hydrostatic global atmosphere model ICON–A version 2.6.4 (Giorgetta et al., 2018), with the aerosol microphysics module HAM version 2.3 (Stier et al., 2005; Tegen et al., 2019). The coupling of ICON-A and HAM models is described in Salzmann et al. (2022). For brevity, we refer to ICON2.6.4–A–HAM2.3 as ICON–HAM throughout this paper. The model can be configured for different resolutions. In this study, we use the triangular R2B4 horizontal grid (approximately 160 km resolution) with 47 hybrid-sigma vertical layers extending to 80 km.
ICON–HAM employs the Max Planck Institute physics package inherited from the ECHAM6 model (Stevens et al., 2013; Giorgetta et al., 2018; Mauritsen et al., 2019). Radiative transfer calculations are performed using the PSrad scheme (Pincus and Stevens, 2009), an adaptation of the Rapid Radiative Transfer Model (RRTM; Mlawer et al., 1997) optimised for general circulation models (Iacono et al., 2008; Morcrette et al., 2008). Moist convection is parameterised using a mass-flux scheme (Tiedtke, 1989; Nordeng, 1994), allowing either shallow, mid-level, or deep convection to develop within the atmospheric column. Entrainment rates for different convection regimes and for downdrafts are prescribed as model parameters. The turbulent diffusion is parametrised using a total turbulent energy (TTE) scheme (Mauritsen et al., 2007; Pithan et al., 2015), where TTE is the sum of turbulent potential energy and turbulent kinetic energy (TKE), with TKE used to compute the vertical velocity for cloud droplet activation. An overly strong vertical diffusion was identified (Franke and Giorgetta, 2024) and subsequently corrected in our version, through three bug fixes related to the total turbulent energy, the vertical interpolation of variables from full to half levels, and the maximum mixing length scale (Klamt et al., 2025). The land surface model is a simplified version of JSBACH4 (Raddatz et al., 2007) – JSBACH4-lite (Salzmann et al., 2022), providing only static fields of land surface properties. Following Sundqvist et al. (1989), stratiform cloud cover is parameterised as a function of relative humidity (RH). Cloud droplet and ice crystal mass and number concentrations are treated prognostically using a two-moment cloud microphysics scheme (Lohmann et al., 2007; Lohmann and Neubauer, 2018). Droplet activation is computed based on a recent modified version of the Abdul-Razzak and Ghan (2000) activation scheme (Ghosh et al., 2025). To account for the absence of nitrate aerosols and the underestimation of secondary organic aerosols, a lower bound of 10 cm−3 for cloud droplet number concentration (CDNC) was imposed; see Lohmann and Neubauer (2018) and Neubauer et al. (2019) for discussion.
The HAM2.3 module simulates a range of aerosol processes, including emission, nucleation, transport, transformation and removal (Stier et al., 2005; Tegen et al., 2019). Aerosol size distributions and composition are represented by the modal M7 aerosol model (Vignati et al., 2004), with major aerosol species (sulfate, organic carbon, black carbon, sea-salt, and mineral dust) treated as internally mixed particles in seven log-normal modes. The seven modes cover four size ranges (nucleation, Aitken, accumulation and coarse) and two hygroscopic states (hydrophilic and hydrophobic). Aerosol size distribution, hygroscopicity, and optical properties evolve throughout their life cycle, hence influencing interactions with radiation and clouds (Salzmann et al., 2022).
Cloud properties derived directly from model outputs can differ markedly from those obtained using a satellite simulator, potentially misleading model evaluation, constraint, and thus development (Saponaro et al., 2020). To enable a better model-satellite comparison, the Cloud Feedback Model Intercomparison Project (CFMIP) Observation Simulator Package (COSP) version 2.0 (Bodas-Salcedo et al., 2011; Swales et al., 2018) was recently implemented into the ICON–HAM model to derive MODIS-style cloud diagnostics (Henkes et al., 2025) and is used here. By accounting for the characteristics and limitations of the MODIS instrument (i.e. variable definitions, retrieval assumptions, sensor limitations, spatial resolution), COSP-simulated fields can be meaningfully compared to MODIS cloud retrievals.
2.2 Experimental setup
2.2.1 Simulations
To diagnose aerosol forcing and associated parametric uncertainty, we conducted two PPEs for PD and PI aerosol conditions. Each PPE consists of 383 simulations with different parameter combinations (Sect. 2.2.2). We selected the earliest 12-month period (1 August 2024 to 31 July 2025) for which new observations from both the PACE and EarthCARE satellites are available. The PD and PI ensembles differ only in prescribed anthropogenic and biomass burning aerosol emissions. Hence, the PI and PD simulations are driven by the same boundary conditions over the simulating period, including the greenhouse gases and atmospheric oxidants concentration from the Shared Socioeconomic Pathways SSP245 scenario as well as monthly sea surface temperature and sea ice cover from the ERA5 reanalysis. Both PI and PD horizontal winds throughout the atmospheric column are nudged towards ERA5 winds in the PD period, with a relaxation timescale of 6 h. To our knowledge, this is the first study applying nudging in ICON-A-(HAM). Evaluation of the nudging setup indicates that it achieves a nudging strength similar to that used in ECHAM–HAM. We also compared the aerosol forcing in twin simulations with full-column and above-2 km nudging and found that the global-mean ERFaer is insensitive to nudging extent (Fig. S1 in the Supplement), consistent with previous studies (Kooperman et al., 2012), while over regions with strong biomass-burning emissions, allowing the lower atmosphere to respond to aerosol absorption leads to a slightly more positive ERFari.
The PD ensemble uses anthropogenic emissions from the Community Emissions Data System (CEDS v2025_04_18) (Hoesly et al., 2018) and biomass burning emissions from the Global Fire Assimilation System (GFAS) for the simulation period, whereas the PI ensemble uses CMIP6 emissions for the year 1850. Since CEDS data are only available through 2023, emissions from 2022–2023 are assumed to represent also the 2024–2025 period in the PD simulations. This approximation is not expected to substantially affect the results, because emissions are unlikely to change significantly over two years based on recent rates of change in anthropogenic emissions (Hoesly et al., 2018), and moreover our PPE framework is able to scale emissions accordingly.
Prior to the main PPE simulations, a 1-year run with the default model setup (CTRL) was performed to spin up the model. The PPE runs were then initialized from the end of the 1-year CTRL run. Each PPE member underwent an additional 3-month spin-up followed by a 12-month run used for the final analysis.
ERFaer is calculated as the difference in net radiative flux at the top-of-atmosphere (TOA) between the PD and PI simulations. Following Ghan (2013), ERFaer is further decomposed into ERFaci and ERFari, through double calls to the radiation calculation with and without aerosols.
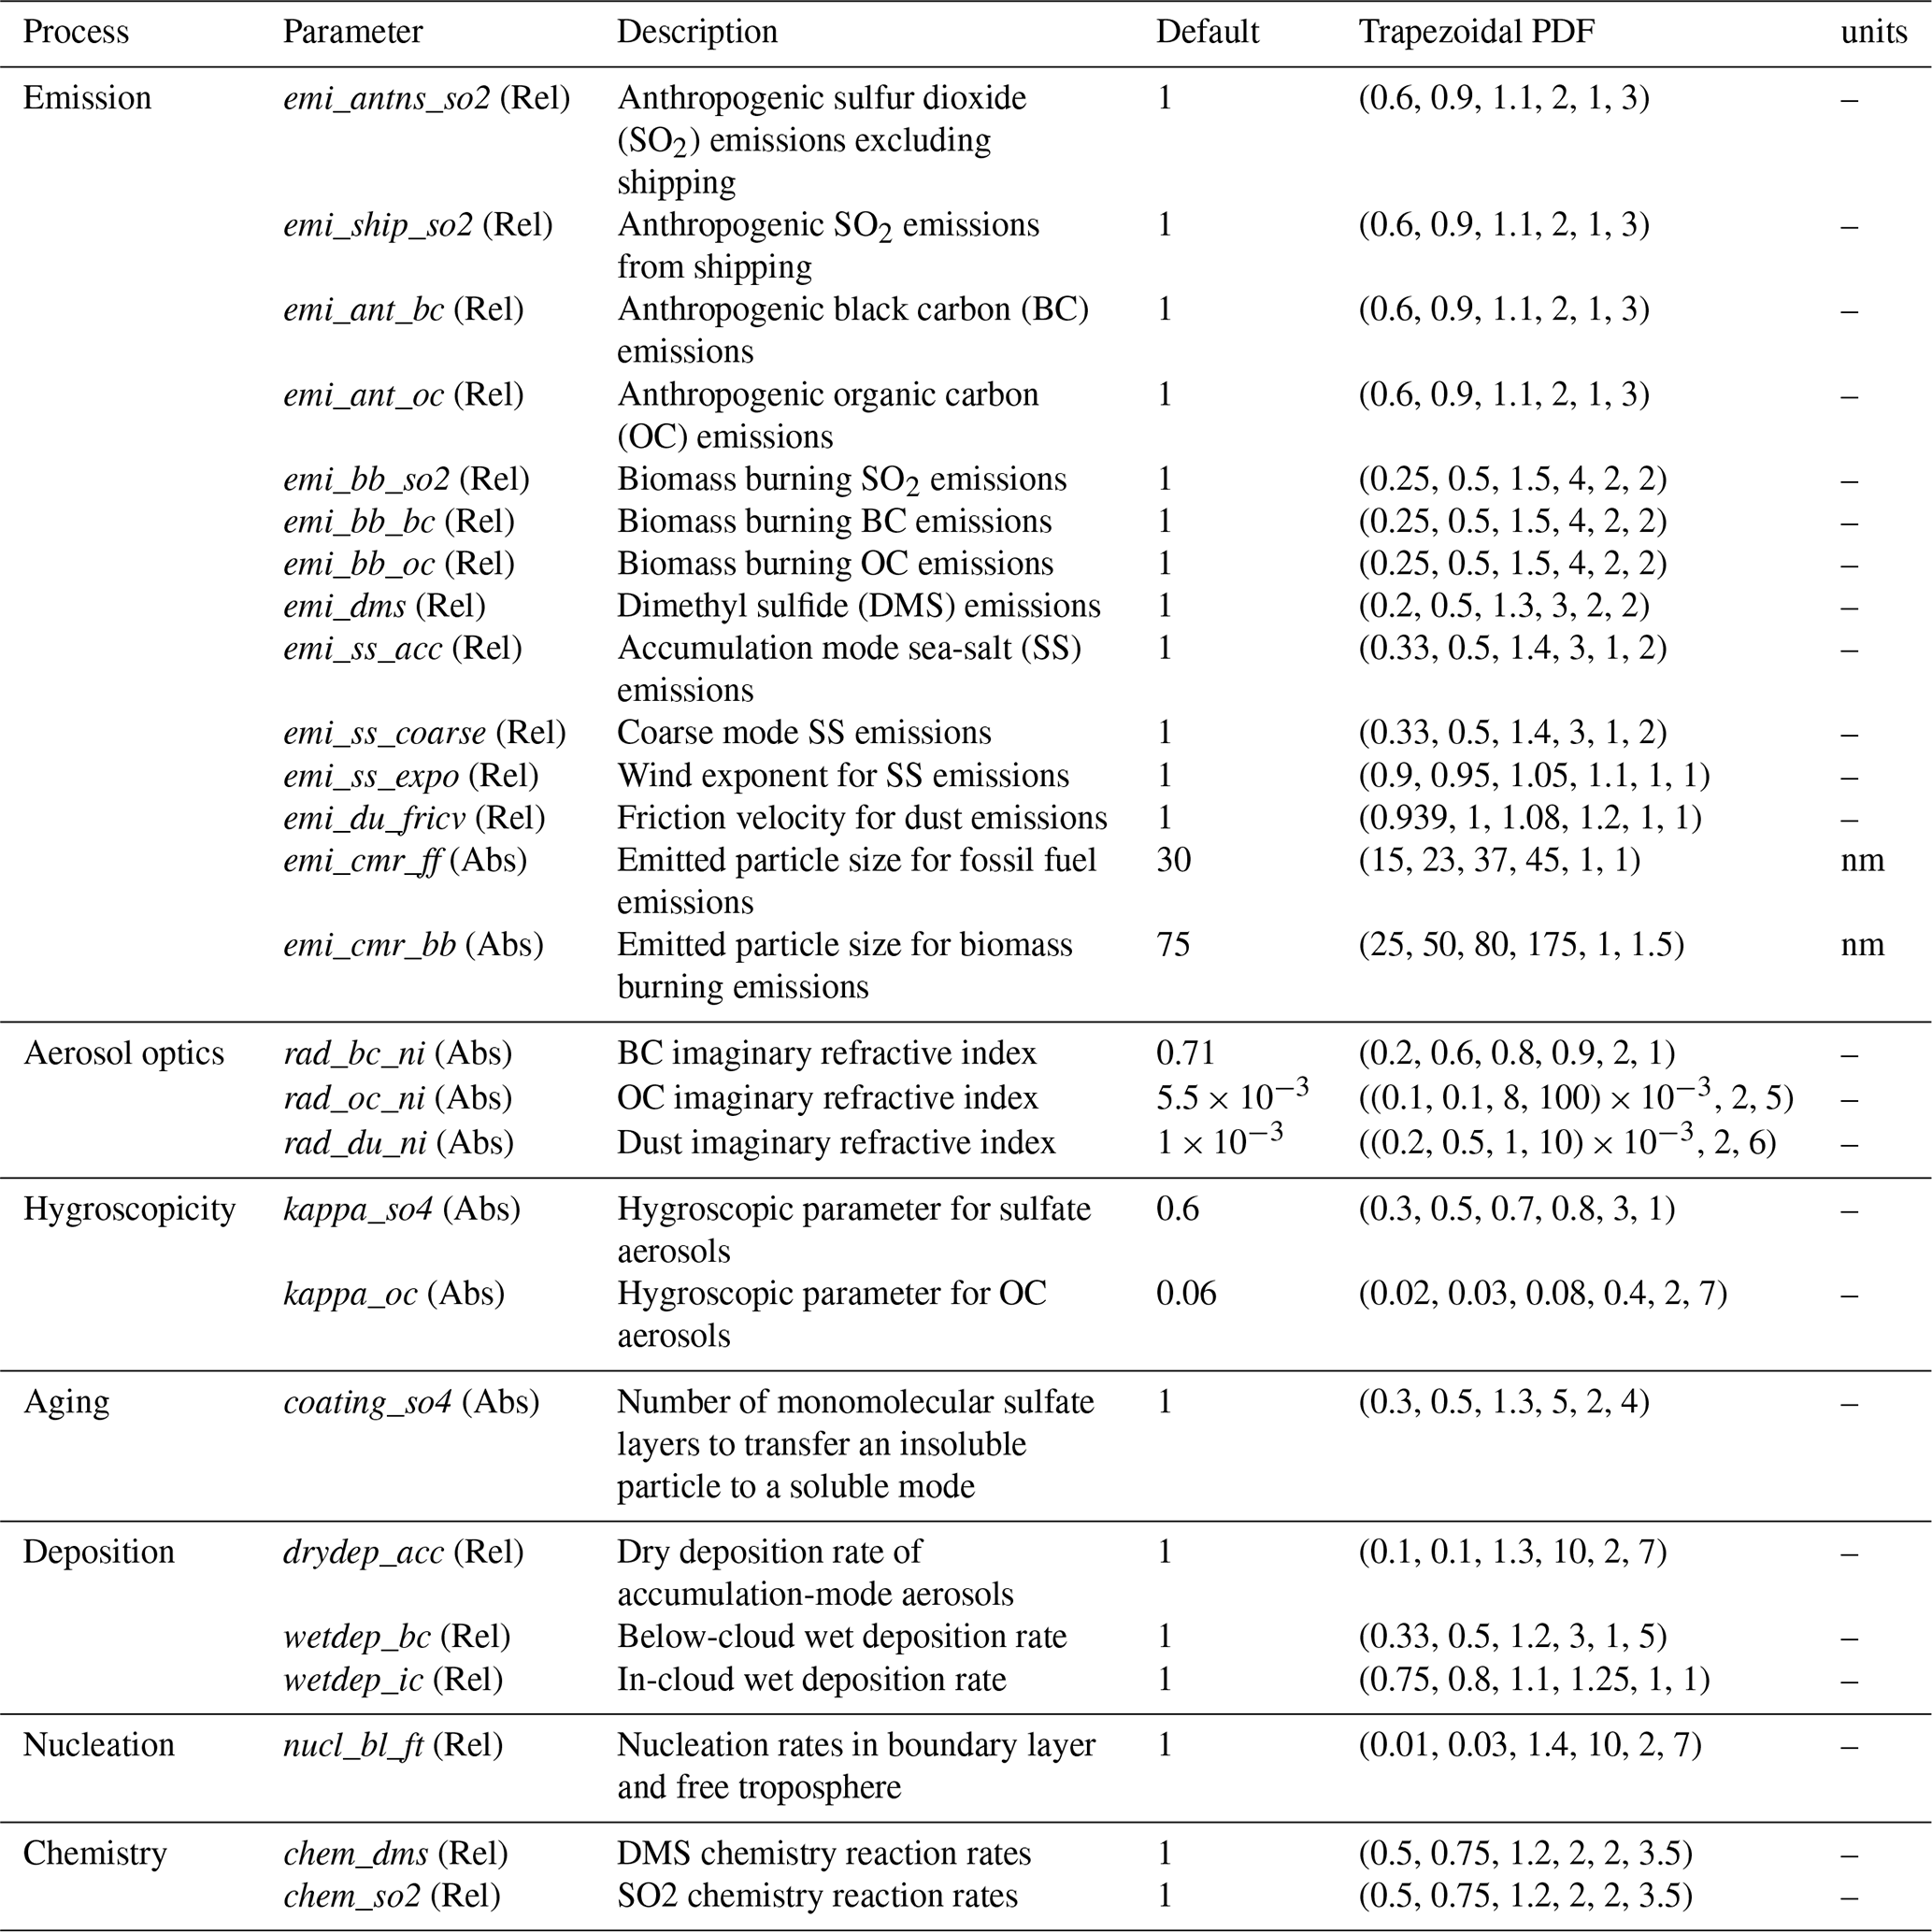
Table 1Descriptions of the 26 aerosol parameters and their distributions used in the emulations, grouped by physical process. “Default” denotes the baseline values used in the default run (CTRL). Parameters labeled “Rel” are scaling factors applied to modelled variables produced by the original parameterisation, also known as tuning parameters, whereas those labeled “Abs” represent absolute parameter values. Generalized trapezoidal distributions are parameterised in the form (a, b, c, d, κl, κr), with a, b, c, and d specifying the lower bound, start of plateau, end of plateau, and upper bound, respectively, and κl, κr governing the curvature of the left and right boundary slopes, respectively. A value of κ = 1 yields linear slopes, while κ > 1 (κ < 1) produces concave (convex) curvature.
2.2.2 Perturbed parameters
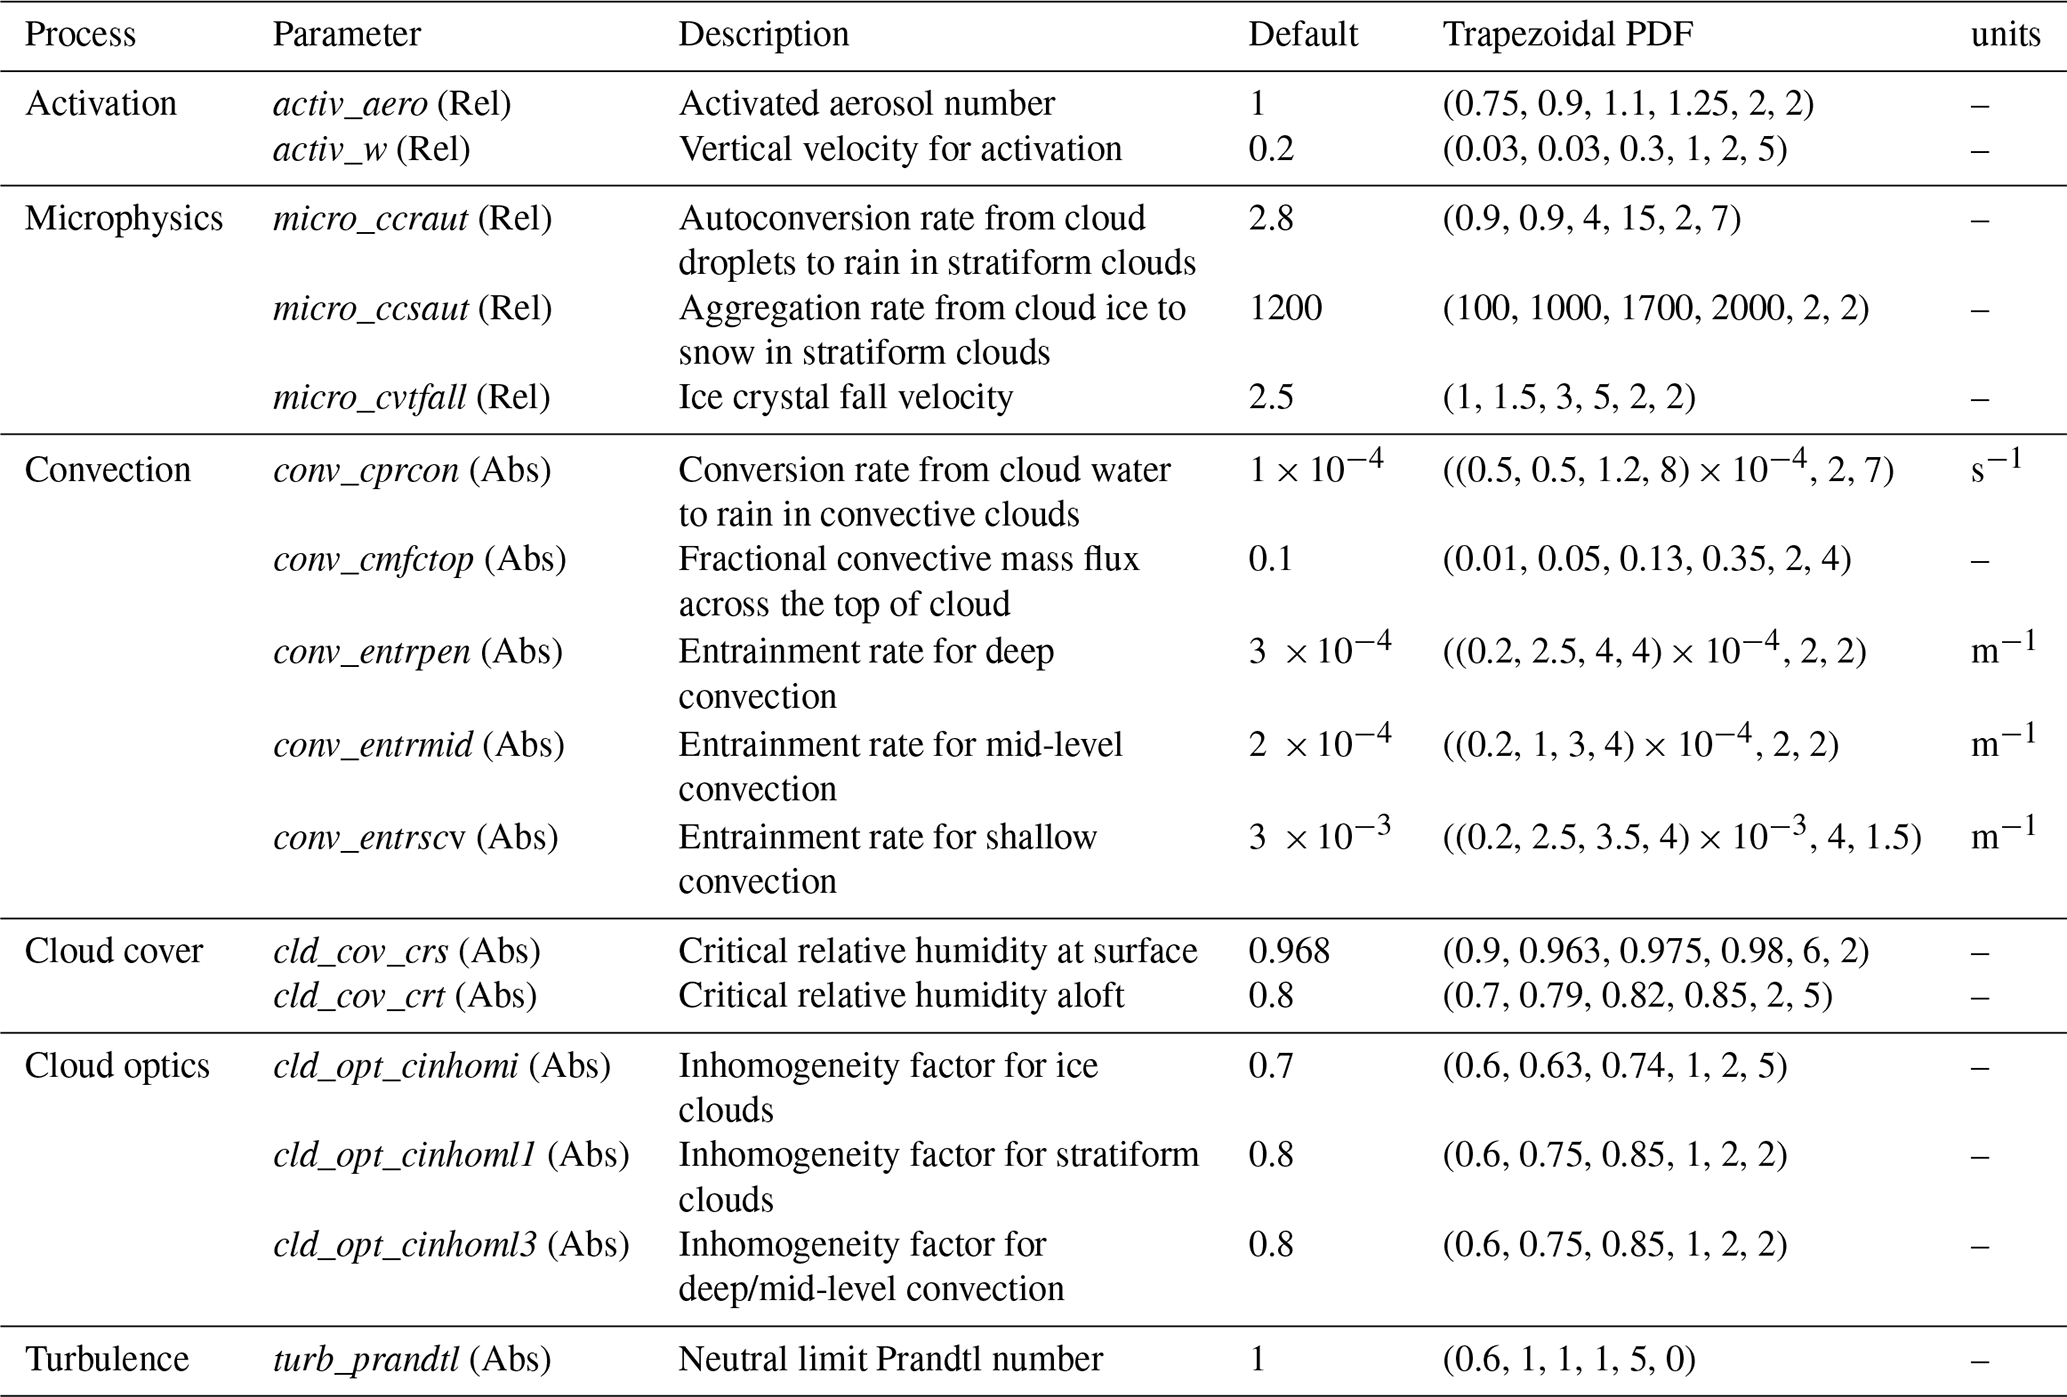
Perturbed parameters, their ranges, and probability distribution functions (PDFs) were initially determined based on the elicitation of model domain experts and prior PPE studies (Regayre et al., 2018; Yoshioka et al., 2019; Eidhammer et al., 2024; Bhatti et al., 2026), and subsequently refined through preliminary screening tests. First, we conducted 3-month one-at-a-time perturbation experiments to screen out parameters with little impact on key aerosol and cloud properties and hence ERFaer (not shown). Then, we perform a 3 d PPE to make sure that the parameter combinations from the initial ranges would not lead to a large fraction of failed simulations. The screening revealed that failures occur when conv_cmfctop and conv_entrscv are simultaneously high; their upper bounds were therefore reduced. Following this screening procedure, a total of 42 parameters and their ranges were determined for perturbation in the PPEs, including 26 aerosol-related parameters (Table 1) and 16 cloud-related parameters (Table 2).
The aerosol-related parameters represent processes/properties such as aerosol emissions, nucleation, aging, deposition, chemistry, and optical and hygroscopic properties (Table 1). These parameters are largely consistent with those used in the ECHAM–HAM aerosol PPE by Bhatti et al. (2026), but we extend the perturbations to better represent size- and species-dependent effects. Specifically, aerosol emissions are perturbed by sector (anthropogenic and biomass burning) and by species (SO2, BC, and OC), and sea-salt emissions are perturbed by mode (accumulation and coarse). In addition to scaling overall emission fluxes, we perturb key parameters in the sea-salt and dust emission parameterisations (emi_ss_expo and emi_du_fricv), which control not only the emission flux but also the size of emitted particles. The perturbed aerosol parameters affect aerosol sources and sinks, as well as their ability to absorb and scatter radiation and to serve as CCN. Cloud-related parameters describe processes/properties such as droplet activation, cloud microphysics, convection, cloud cover, cloud optical properties, and turbulence (Table 2). These parameters influence cloud properties and the boundary-layer humidity distribution, and are key controls on the model's radiation balance. Together, the aerosol and cloud parameters are expected to modulate ERFaer through ARI and ACI pathways, or both.
Maximin Latin Hypercube Sampling (LHS) was employed to create parameter combinations spanning the 42-dimensional parameter space (McKay et al., 1979). In this study, two parameter distributions are input to LHS for different purposes: one to generate the original PPEs to train emulators (Fig. S2) and another to construct the emulated PPEs (Fig. S3). For the original PPEs, most parameters are sampled from uniform distributions, while a subset follows trapezoidal distributions with a uniform central region and sloped edges representing relatively unlikely parameter ranges (Fig. S2). This design preserves dense, uniform-like sampling in likely parameter space while efficiently extending the parameter ranges with minimal additional computational cost. For the emulated PPEs that are used for quantifying the parametric uncertainty, the trapezoidal distributions are adopted (Tables 1 and 2, Fig. S3). Compared to Gaussian distributions, this approach applies less tight expert-elicited constraints, avoids central oversampling, thereby preserving a broader uncertainty range. Note that the ranges displayed in Figs. S2 and S3 are the physical values, whereas the LHS operates on normalized ranges to determine the parameter combinations.
In total 400 parameter combinations were designed using LHS of the 42 perturbed parameters. Of these, 383 full-year ensemble members were successfully produced for both PI and PD periods: one corresponds to the default ICON–HAM configuration (CTRL), while the remaining 382 reflect the sampled parameter combinations. This yields a simulations-to-parameters ratio (rsp) of approximately 9, which is relatively high compared to previous PPE studies. For instance, Regayre et al. (2018), Yoshioka et al. (2019), and Eidhammer et al. (2024) used rsp values of around 6, while Bhatti et al. (2026) and Nugent et al. (2026) adopted a higher value of 10. The choice of rsp is crucial because it directly affects both computational cost and emulator accuracy, yet its optimal values, balancing accuracy, computational cost, storage requirements, remain unclear. This question will be addressed in Sect. 3.1.
2.3 Gaussian process emulator
The Gaussian Process (GP) emulator provides a flexible, non-parametric statistical framework that can efficiently approximate complex, nonlinear relationships between model parameters and outputs (O'Hagan, 2006), and has been applied extensively in studies of climate model uncertainty (Lee et al., 2011; Yoshioka et al., 2019; Bhatti et al., 2026; Regayre et al., 2026; Prévost et al., 2026). To enable continuous sampling of the 42-dimensional parameter space, we constructed GP emulators trained on the original PPEs with 383 ensemble members using the toolkit Earth System Emulator package (ESEm; Watson-Parris et al., 2021a), with the 42 perturbed parameters as predictors and selected diagnostics (aerosol, cloud and radiation properties) as targets. Here, the emulators are trained for each model grid using monthly mean data. Once trained, the GP emulators can provide rapid predictions at previously unsampled parameter combinations within the defined parameter bounds.
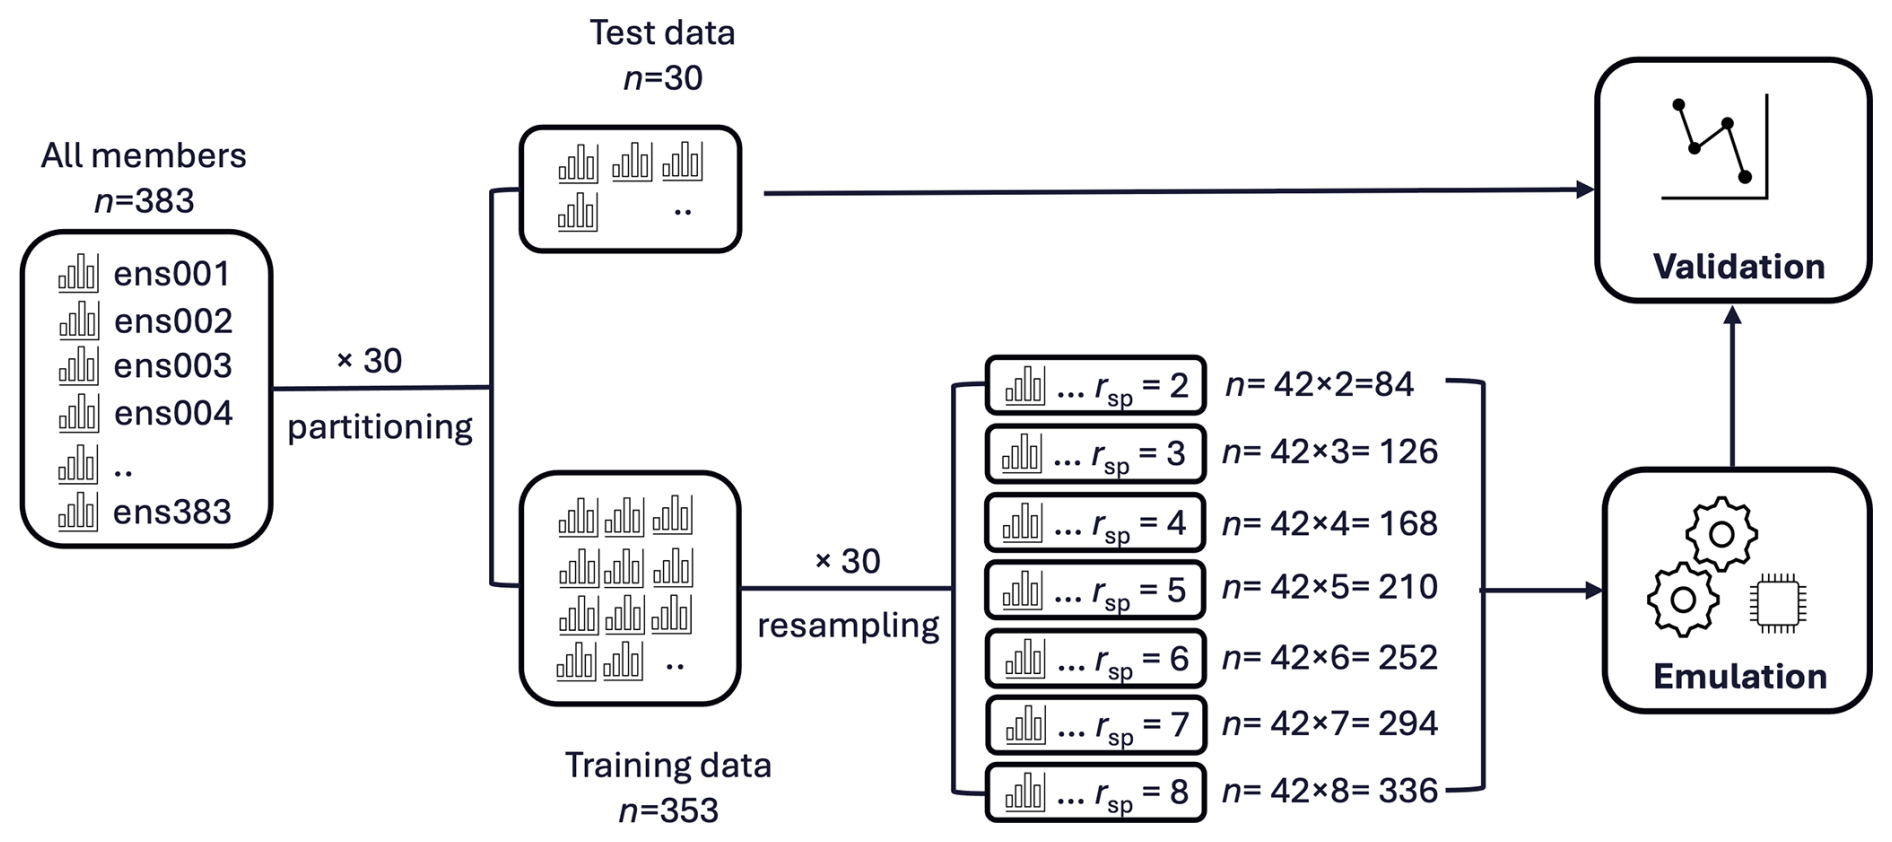
Figure 1Workflow for evaluating emulator performance for different simulations-to-parameters ratios (rsp), based on repeated partitioning and resampling of 383 PPE members. Here, n denotes the number of PPE members in each resampled subset and is determined as n = 42 × rsp, where 42 is the number of perturbed parameters.
Using the trained emulators together with the parameter distributions defined in Tables 1 and 2, we generated the emulated PPEs for PI and PD, each containing 200 000 model variants. We also tested a larger size of 2 million variants and found no change in conclusions on uncertainty quantification and attribution. The resulting ensembles were then used for variance-based decomposition of parametric uncertainty (see Lee et al. (2012) for details of the method) in Sect. 3.3 and sensitivity analysis in Sect. 3.4.
2.4 Workflow for determining the optimal rsp
The high rsp (∼ 9) in our PPE provides a testbed to assess emulator performance as a function of rsp, as illustrated in Fig. 1. The full PPE ensemble (n = 383) is first partitioned into training and test datasets, with 30 members reserved for testing. To ensure representative sampling, this partitioning is randomly repeated 30 times. For each partition, the training dataset is further resampled to generate subsets corresponding to rsp ranging from 2 (n = 84 members) to 8 (n = 336 members). The resampling procedure preserves the marginal distribution of each parameter so that the resulting subsets remain statistically consistent with the original ensemble. To ensure statistical robustness, each resampling process is also randomly repeated 30 times. The resulting subsets are used to train the emulators, and their predictions are evaluated against the independent test dataset. The 30 × 30 repetitions capture the uncertainty associated with the partitioning and resampling procedures.
2.5 Observations
Aerosol properties are obtained from SPEXone aboard NASA's PACE mission, launched in February 2024 (Werdell et al., 2019). The SPEXone instrument is a multi-angle polarimeter developed by SRON for high-accuracy aerosol retrievals (Hasekamp et al., 2019a; van Amerongen et al., 2019). It measures both polarization and intensity at five viewing angles over the spectral range 385–770 nm. Aerosol retrievals from the Remote sensing of Trace gas and Aerosol Products (RemoTAP) algorithm (Fu et al., 2020; Lu et al., 2022; Hasekamp et al., 2024), produced by the SRON SPEXone scientific processing line (Fu et al., 2025), are employed. Daily level-2 retrieval products are aggregated onto a 1° × 1° resolution for analyses. From these data, we use aerosol optical depth (AOD) and absorption AOD (AAOD) at 550 nm, and Ångström exponent (AE) calculated from AOD at 440 and 670 nm. The same wavelengths are also used for the corresponding model outputs for comparison in Sect. 3.5.1. All quantities have been validated against AErosol RObotic NETwork (AERONET) observations and show good agreements, with root mean square errors of 0.05 (0.04) for AOD, 0.021 (0.015) for AAOD, and 0.366 (0.329) for AE over land (ocean) (Fu et al., 2026).
Cloud properties are derived from the MODIS COSP daily level-3 dataset (MCD06COSP; Pincus et al., 2023). This product relies on the MODIS Collection 6.1 processing stream (Platnick et al., 2017) and is specifically designed to facilitate comparison of MODIS cloud retrievals with climate models, in this study, the cloud diagnostics from ICON–HAM with the MODIS COSP simulator (see Sect. 2.1). From this dataset, we use cloud optical thickness (COT), cloud droplet effective radius (CER), liquid water path (LWP) and liquid cloud fraction (CFliq), where CER and COT are used to compute CDNC based on the adiabatic approximation (Quaas et al., 2006).
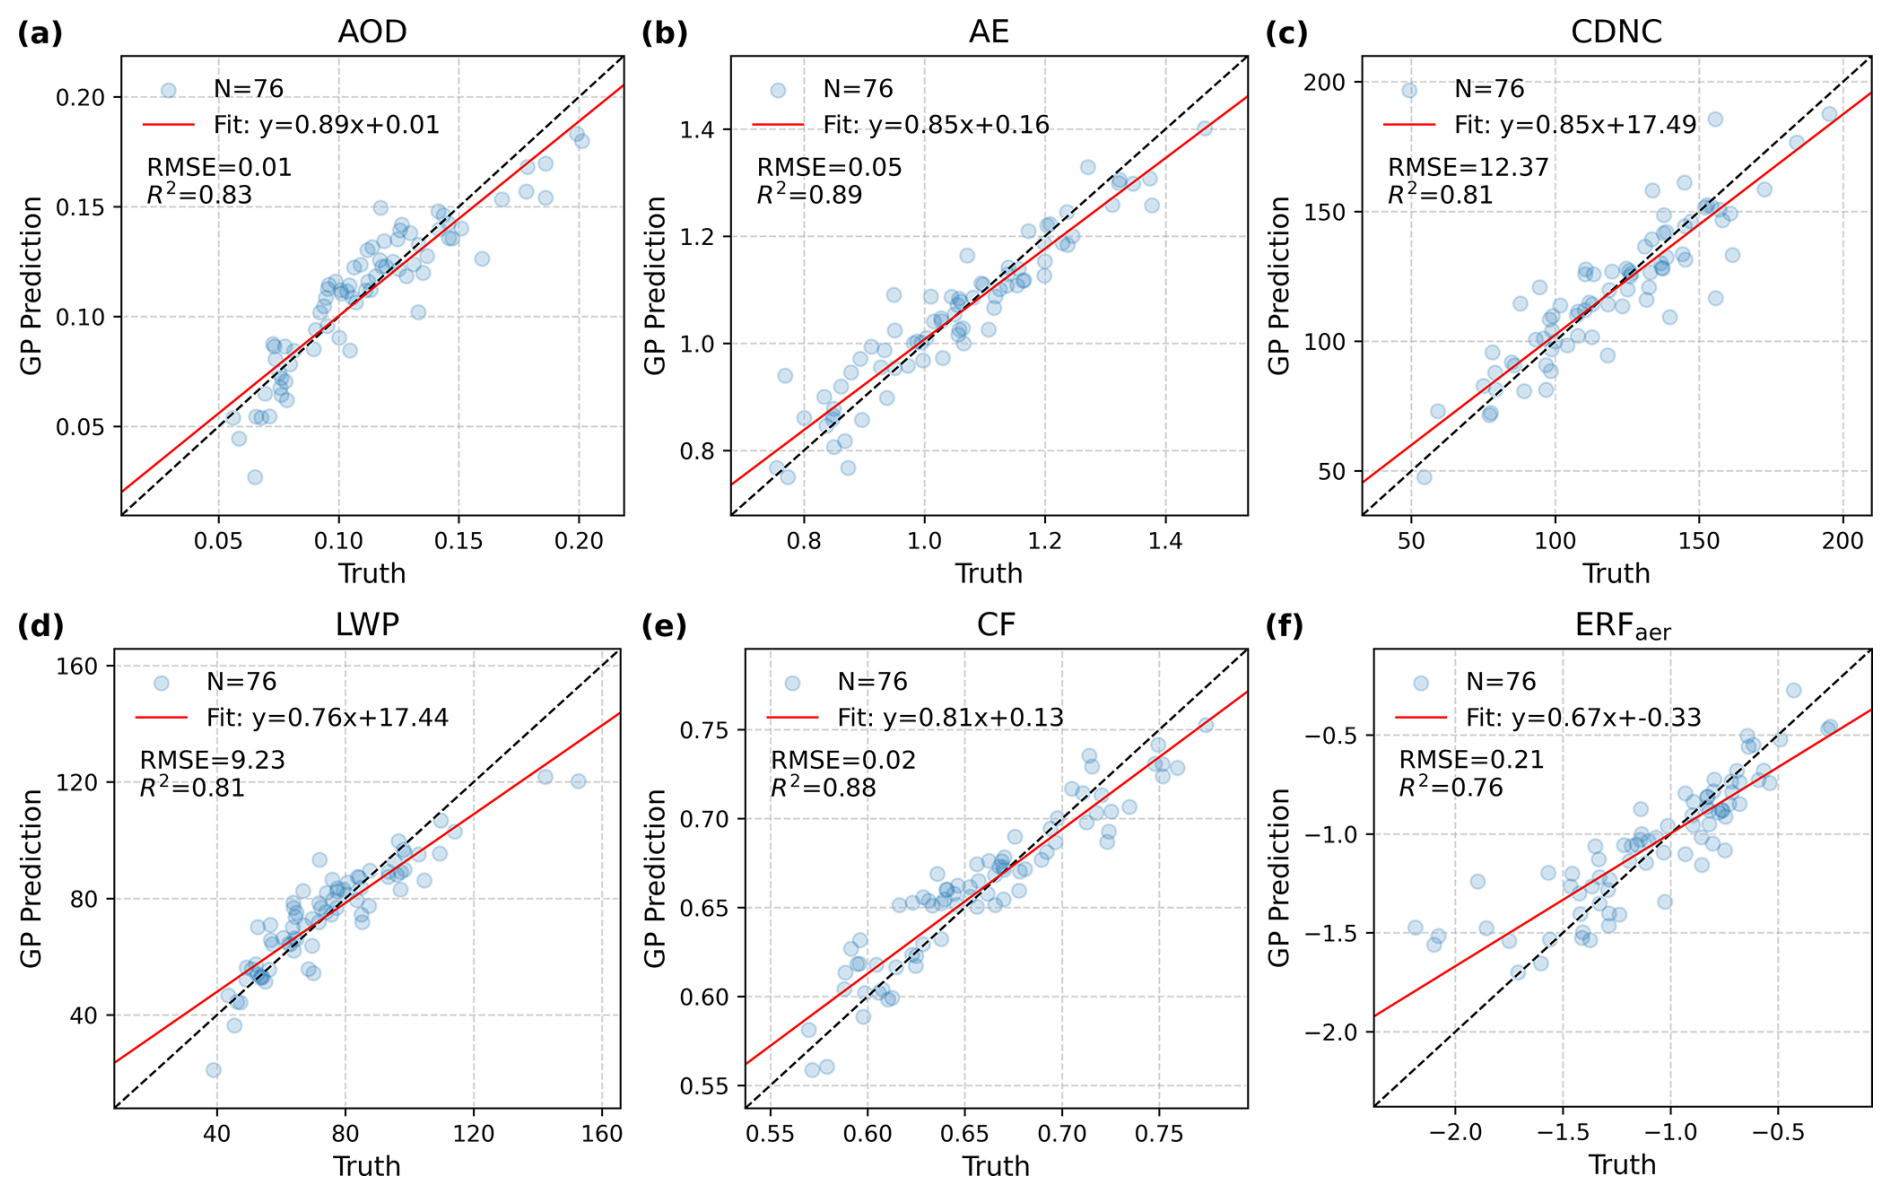
Figure 2Comparison of globally averaged GP emulator predictions with test data (truth) for (a) AOD, (b) AE, (c) CDNC, (d) LWP, (e) CF, and (f) ERFaer. Red lines indicate linear regression fits, and the black line denotes the 1:1 reference. The number of data points (N), root mean square error (RMSE), and coefficient of determination (R2) are also shown. Similar comparisons for ERFaer by component (ACI and ARI) are shown in Fig. S4.
To facilitate meaningful model–observation comparison, the 3 h ICON–HAM outputs are co-located with SPEXone and MODIS COSP observations in space and time, such that each comparison pairs the satellite footprint and overpass time with the nearest model grid cell and closest model time step. The collocation is efficiently handled by Community Intercomparison Suite (CIS) – a tool designed for model-observation comparisons (Watson-Parris et al., 2016). CIS supports various model and observational datasets, but lacks native support for MODIS COSP and SPEXone; we therefore implemented custom plugins to enable their collocation within the CIS workflow.
3.1 Emulator results
Comprehensive quantification and attribution of model uncertainties rely on statistical emulators, which rapidly predict outputs for any parameter combinations within the defined ranges, without the need for further computationally expensive model runs. The emulator skill is evaluated prior to subsequent analyses.
3.1.1 Emulator performance
Emulator performance is assessed using a split-sample validation, with 80 % of simulations (307) used for training and 20 % (76) for testing. Figure 2 shows globally averaged comparisons of GP predictions against truth, for key aerosol (AOD and AE) and cloud (CDNC, LWP, and cloud fraction (CF)) properties governing ARI and ACI, as well as ERFaer. Overall, the GP predictions closely follow the 1:1 reference line. The best performance is found for aerosol properties, with slopes of 0.89 for AOD and 0.85 for AE. Cloud properties show slightly lower slopes (< 0.85), while ERFaer deviates most strongly from the 1:1 line, with a slope of 0.67. The coefficients of determination (R2) follow a similar behaviour. Root mean square error (RMSE) is small relative to the magnitude of each variable, demonstrating good absolute accuracy. The progressive degradation in emulator performance from aerosol properties to cloud properties and ultimately to ERFaer likely reflects the increasing influence of nonlinear processes. For ERFaer in particular, spatial differences between PI and PD emissions further complicate the response because global parameter perturbations cannot capture this structure. Nevertheless, even for ERFaer, an R2 of 0.76 still indicates robust predictive skill.

Figure 3Comparison of emulated and reference AOD averaged over 76 test members. Shown are 2-D maps of (a) “truth”, (b) absolute bias, (c) relative bias (%), and (d) coefficient of determination (R2) between predictions and test data.
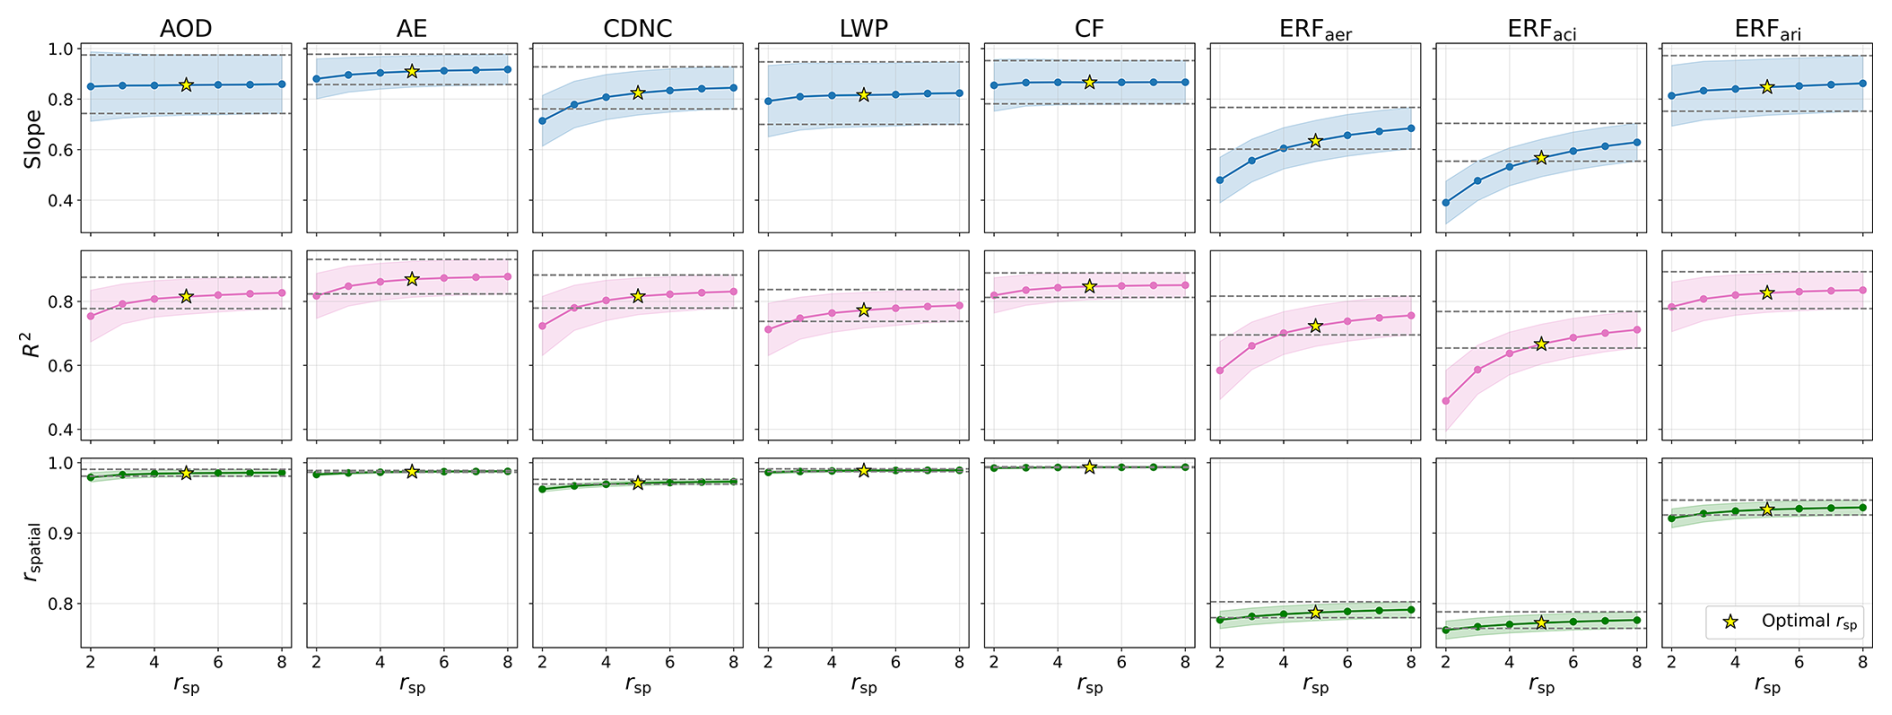
Figure 4Emulator performance as a function of the simulations-to-parameters ratio (rsp), measured using regression slope, coefficient of determination (R2), and spatial correlation (rspatial) between emulator predictions and truth for AOD, AE, CDNC, LWP, CF, ERFaer, ERFaci and ERFari. Lines show means across the 30 × 30 emulation experiments illustrated in Fig. 1, and shading indicates corresponding standard deviations, representing the uncertainty in partitioning and resampling procedures. Two grey dashed lines denote the uncertainty range at rsp=8, and the yellow star marks the identified optimal ratio.
Figure 3 shows 2-D maps of comparison between predicted and reference AOD as an example; similar behaviour is found for other variables (not shown). Overall, the emulator faithfully reproduces the spatial patterns of all quantities. Despite visible regional variations of absolute and relative differences, the overall biases remain very small, with global-mean relative biases below 1.5 % and local maxima under 4 %, which are substantially smaller than typical model and observational uncertainties (Gliß et al., 2021). It is interesting to note that regions with lower R2 align closely with areas of strong convective precipitation, particularly over the tropical oceans near the Intertropical Convergence Zone, the Amazon, southern Africa, and South Asia over land. The association between reduced emulator performance and strong convective precipitation implies that the emulator may struggle to capture the strong nonlinear interactions among processes, such as emissions, convection, and wet scavenging. Nevertheless, this has only a limited impact on the overall emulator performance, with the minimum R2 remaining high (> 0.7).
3.1.2 Optimal simulations-to-parameters ratio
The excellent emulator performance of our PPEs is not surprising given the relatively high simulations-to-parameters ratio in our PPE (rsp ∼ 9). However, such a large rsp also implies substantial computational cost and data-storage demands, posing challenges for large PPEs or multi-model PPE (MMPPE) intercomparison project. Identifying the optimal rsp, defined as the minimum value that yields acceptable performance (within the uncertainty range of metrics at rsp=8), is therefore essential for guiding future PPE design.
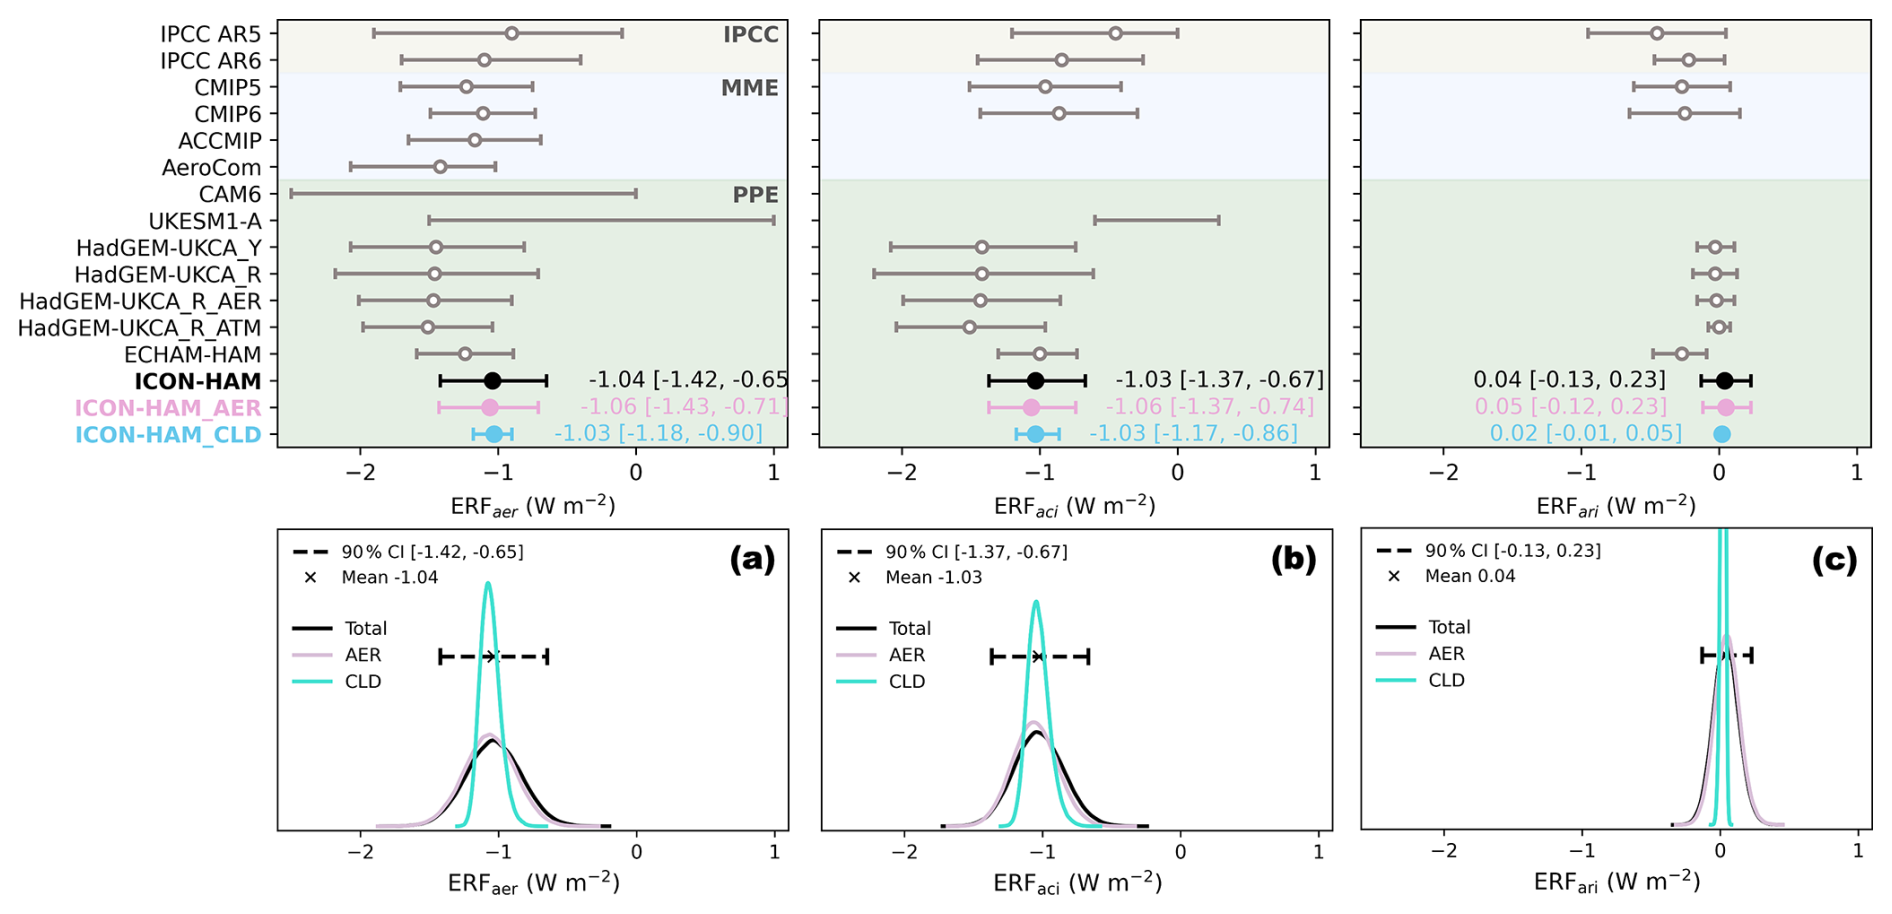
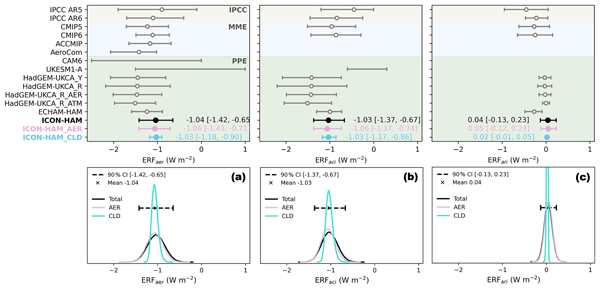
Figure 5Probability density functions (PDFs) of global mean ERFaer, ERFaci and ERFari for 1850–2025 from ICON–HAM PPE, together with forcing ranges from this study and other PPE studies, multi-model ensembles (MME), and IPCC assessments. The ICON–HAM estimates (black) are based on 200 000 emulated model variants sampled based on the expert-elicited prior PDFs of parameter values shown in Fig. S3. AER (pink) and CLD (blue) denote ICON–HAM variants with perturbations applied only to aerosol (Table 1) or cloud (Table 2) parameters, respectively, while all other parameters are fixed at their prior medians. The 90 % credible ranges of three ICON–HAM experiments are shown with filled circles marking the means, with numerical values shown alongside. The 90 % credible ranges of other studies are displayed in gray (full range for CAM6), with means (or medians) indicated by open circles, including IPCC AR5 (Myhre et al., 2013b; 1750–2011), AR6 (Forster et al., 2021; 1750–2019), CMIP5 (Zelinka et al., 2014; 1860–2000), CMIP6 (Smith et al., 2020; 1850–2014), ACCMIP (Shindell et al., 2013; 1850–2000), AeroCom IND3 (Gryspeerdt et al., 2020; 1850–2010), and PPE studies from CAM6 (Eidhammer et al., 2024), UKESM1–A (Regayre et al., 2023; 1850–2014), HadGEM–UKCA (Regayre et al., 2018; Yoshioka et al., 2019; 1850–2008), and ECHAM–HAM (Bhatti et al., 2026; 1850–2010). HadGEM–UKCA with suffixes Y and R correspond to Yoshioka et al. (2019) and Regayre et al. (2018), respectively; R_AER and R_ATM denote HadGEM–UKCA_R variants with only aerosol or atmospheric parameters perturbed. Means or medians were not reported in the CAM6 and UKESM1–A studies.
Following the procedure illustrated in Fig. 1, we assess emulator performance as a function of rsp for key aerosol and cloud properties, as well as aerosol forcing (Fig. 4). Consistent with Fig. 2, the emulator performs best for aerosol quantities (AOD and AE), followed by cloud quantities (CF, LWP, and CDNC), with lower skill for aerosol forcing. This ranking is robust across different rsp choices and performance metrics. Note that the relatively limited performance of ERFaer mainly stems from ACI. Emulating ERFaer is challenging because it highly depends on spatial differences between PI and PD emissions, as well as on the minimum CDNC (CDNCmin) imposed in the model (Hoose et al., 2009). This CDNCmin sets a hard bound on several processes (activation, autoconversion, entrainment mixing, etc.), thereby introducing pronounced nonlinear interactions between model parameters and outputs that are difficult to capture in a PPE (Bhatti et al., 2026).
Overall, the performance metrics (particularly the slope and R2) first increase with rsp and then begin to level off beyond a certain threshold. This threshold is around 5 for aerosol and cloud properties and ERFari, but higher (∼ 8) for ERFaer and ERFaci. Nevertheless, even for ERFaer and ERFaci, the metric values at rsp=5 (yellow star) remain within the uncertainty range of those at rsp=8, and the emulator bias and RMSE decrease by only 0.01 and 0.02 W m−2 when increasing rsp from 5 to 8 (Fig. S5). This indicates that rsp=5 already achieves near-optimal emulator performance while substantially reducing computational cost by 40 %. We therefore consider rsp=5 as a compromise between accuracy and efficiency, even for ACI-related analyses. Further improvements in emulator performance should therefore focus on refining the machine-learning model (e.g., kernel tuning) rather than simply increasing the ensemble size.
3.2 Uncertainty in aerosol radiative forcing
3.2.1 Global mean
Figure 5 shows probability density functions (PDFs) of global mean ERFaer, ERFaci and ERFari over 1850–2025, derived from 200 000 emulated variants generated based on the expert-elicited parameter distributions shown in Fig. S3. The mean ERFaer is −1.04 W m−2, with a 5–95th percentile spanning −1.42 to −0.65 W m−2 (Fig. 5a). The ACI component, ERFaci, shows a very similar estimate of −1.03 [−1.37 to −0.67] W m−2 with a slightly narrower range (Fig. 5b), indicating that most of the uncertainty in ERFaer stems from ACI. In contrast, the ARI component ERFari is small with a mean of 0.04 W m−2 but a somewhat wide range of −0.13 to 0.23 W m−2 spanning both negative and positive values (Fig. 5c). Unlike ERFaci, which is uncertain only in magnitude, ERFari is uncertain in both magnitude and sign.
To isolate the contributions from the aerosol and cloud parameter groups, we use the emulator to vary the parameters in one group over their uncertainty ranges while fixing all parameters in the other group at their prior medians (Fig. 5). Perturbing aerosol parameters only (AER; pink) results in a 5–95th percentile range of [−1.43 to −0.71] W m−2, close to the total uncertainty range, whilst perturbing cloud parameters only (CLD; blue) yields a narrower range of [−1.18 to −0.9] W m−2, with the width reduced by 64 % relative to total range, suggesting that aerosol parameters dominate the overall uncertainty. Comparing ACI and ARI (Fig. 5b,c) shows that cloud parameters influence ACI more strongly, although their effect remains weaker than that of aerosol parameters. The specific process-level sources of uncertainty will be identified in Sect. 3.3.
Figure 5 also compares the ICON–HAM PPE results with other PPEs using different climate models, multi-model ensembles (MMEs), and IPCC assessments. Comparison with different PPE studies shows that forcing estimates may vary across models depending on model structure, parameter perturbations considered, experimental setup (e.g., nudged versus free runs and the simulation period). For ECHAM–HAM, which perturbs a similar set of parameters (but only aerosol parameters) within a comparable parameterisation design (both using the HAM aerosol module) and utilises same nudging strategy (the whole column wind nudging), the resulting forcing range is very similar to that of our PPE but slightly narrower (Bhatti et al., 2026). This is partly because cloud-related uncertainty is not sampled, and also because the ECHAM–HAM PPE adopts Gaussian parameter distributions, which sample the central region more densely than the trapezoidal distributions used in our study, leading to a narrower range. The somewhat weaker ERFari in our PPE may result from the inclusion of above-cloud aerosols in the forcing calculation, which influences the balance between ACI and ARI (Ghan, 2013).
Models with greater structural differences from ICON–HAM show larger discrepancies in forcing estimates. Four PPE experiments with HadGEM–UKCA (Regayre et al., 2018; Yoshioka et al., 2019) show similar magnitudes and uncertainty ranges but yield more negative ERFaer than the ICON–HAM PPE. In addition to differences in model structure and parameter perturbations, the stronger forcing may also arise from the different PD reference period used, as a more polluted year (2008) was adopted in those experiments. According to the IPCC AR6 (Forster et al., 2021), ERFari was 50 % stronger in 2008 than in 2019, and ERFaci was 21 % stronger. Although all uncertainties shown here are from PPEs that are not yet constrained using observations, different parameter sampling strategies applied to the emulator implicitly lead to different levels of expert elicitation. ICON–HAM, HadGEM–UKCA, and ECHAM–HAM use expert-elicited parameter distributions (trapezoidal for ICON–HAM and HadGEM–UKCA, Gaussian for ECHAM–HAM), which represent prior expert beliefs about parameter likelihoods. In contrast, CAM6 and UKESM1–A use uniform distributions based only on expert-specified parameter ranges, which sample the full parameter space uniformly and therefore produce much wider uncertainty ranges. Note that the winds in ICON–HAM and ECHAM–HAM PPEs are more tightly nudged compared with the free-running (CAM6) and above-boundary-layer nudging (UKESM1-A and HadGEM–UKCA) PPEs, thereby limiting atmospheric adjustments and resulting in weaker forcing (particularly for ACI). Comparisons among PPEs suggest that different PPEs are not readily comparable. This highlights the need for a coordinated multi-model PPE (MMPPE) with a standardized protocol across models, including common perturbed parameters, parameter distributions, and experimental setups, to better disentangle structural and parametric uncertainties (Carslaw et al., 2026).
The spread in MMEs (CMIP5, CMIP6, ACCMIP and AeroCom) mainly reflects structural diversity and internal variability, because each model uses its own tuned parameter set without sampling parameter uncertainty within the model. Interestingly, the ERFaer uncertainty ranges from MMEs and PPEs are of similar magnitude, possibly implying a comparable contribution from structural uncertainty and internal variability versus from parametric uncertainty. A more robust attribution, however, would require further coordinated MMPPE efforts. IPCC assessments consider a broader range of evidence than MMEs alone, including individual model studies, uncertainties from missing or poorly represented processes, independent observational, and energy-balance constraints (Myhre et al., 2013b; Forster et al., 2021), thus resulting in broader ERFaer uncertainty ranges.
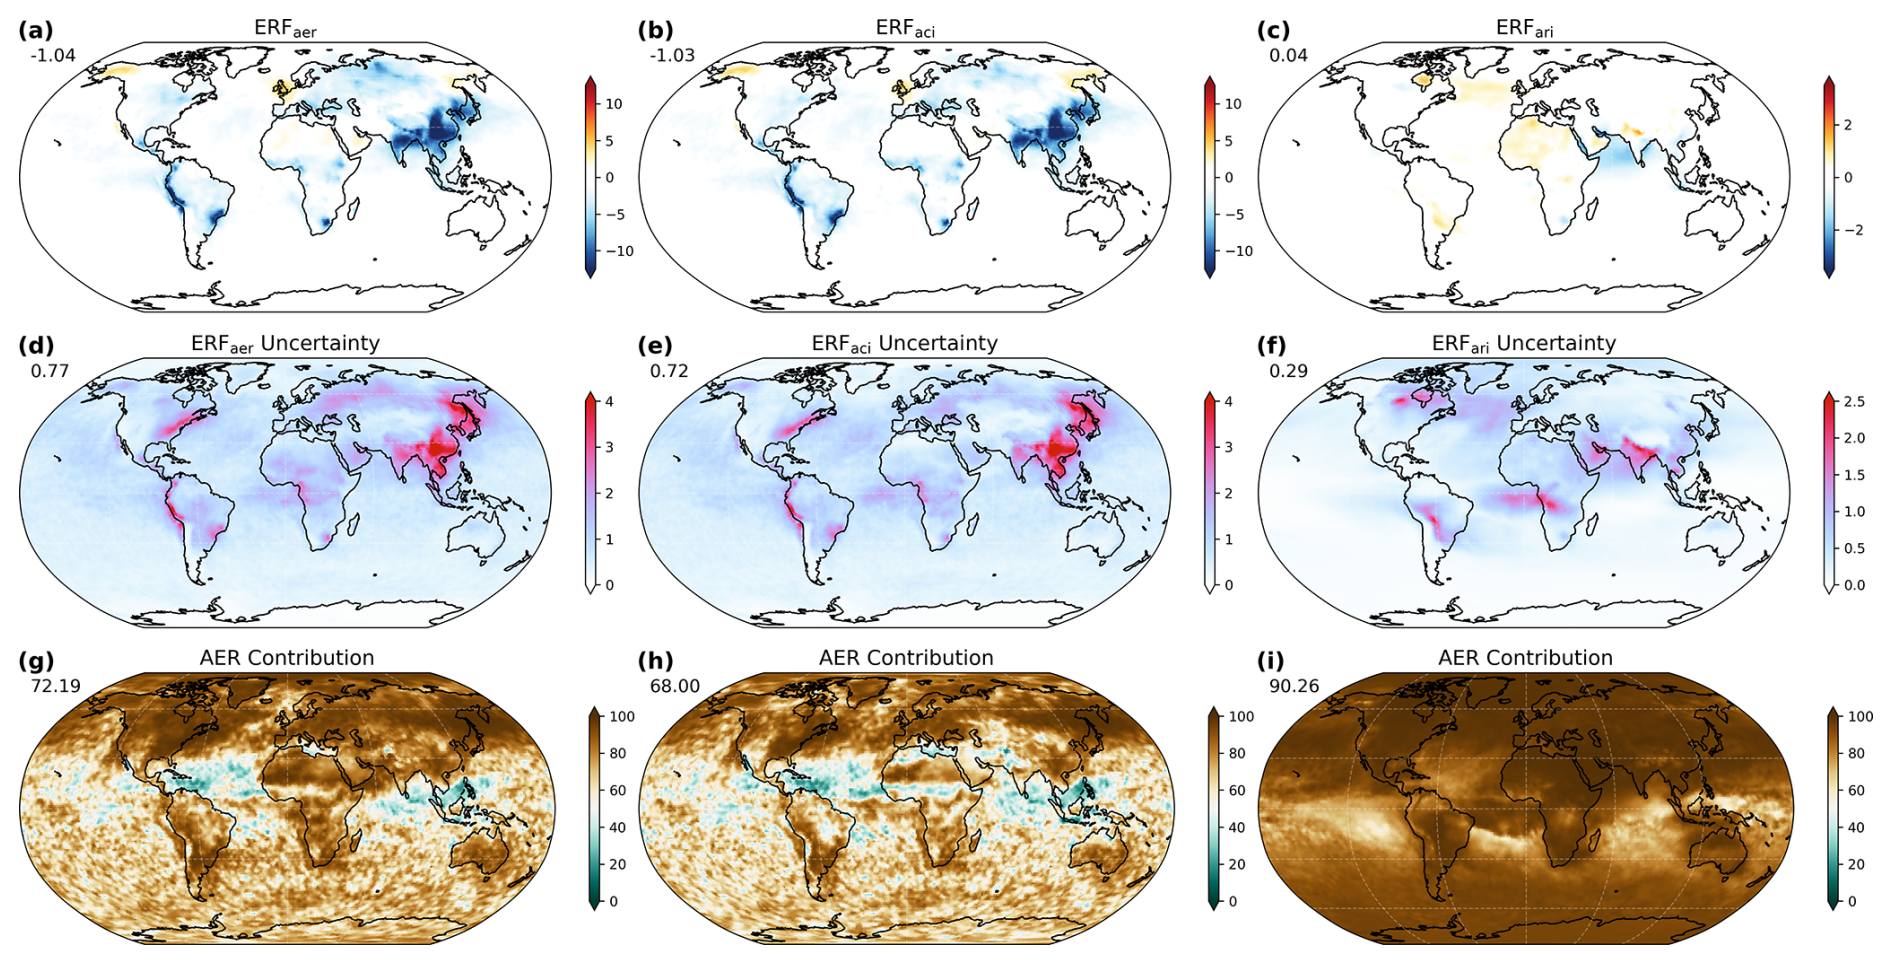
Figure 6(a–c) Mean and (d–f) parametric uncertainty (2σ across the ensemble members) of ERFaer (left), ERFaci (middle), and ERFari (right) over 1850–2025, derived from 200 000 emulated model variants. Panels (g)–(i) show the percentage contribution of aerosol parameters to the total uncertainty (%), with cloud parameters accounting for the remainder. These model variants are sampled according to the expert-elicited parameter distributions shown in Fig. S3. Top-left numbers indicate global mean values.
3.2.2 Spatial distributions
Figure 6 shows the spatial distributions of ERFaer, ERFaci, and ERFari and their corresponding uncertainties, along with the relative contributions of aerosol parameters to these uncertainties. Similar to the global-mean results (Fig. 5), ERFaer and ERFaci exhibit very similar spatial patterns, indicating ERFaer is primarily driven by ACI. The strongest forcings (< −5 W m−2) are located in industrialized continental regions, particularly Asia, Europe, and North America, followed by marine stratocumulus regions over the Atlantic, North Pacific, and the southeastern Pacific off the west coast of South America. The spatial patterns of ERFaer and ERFaci broadly agree with those from the previous ECHAM–HAM PPE (Bhatti et al., 2026), which uses similar aerosol and cloud parameterisations and comparable aerosol parameter perturbations. Our results, however, show weaker forcing over China and stronger forcing over India, likely due to anthropogenic emission reductions in China and increases in India between the respective simulation years (2010 for ECHAM–HAM and 2024–2025 for ICON–HAM). Notably, ERFaer and ERFaci turn positive over the UK because its anthropogenic aerosol emissions in 2024–2025 have dropped below 1850 levels (Fig. S6). Overall, regions exhibiting strong ERFaer and ERFaci also tend to show larger associated uncertainties (Fig. 6d and e).
The near-zero global mean ERFari is a result of the compensation of negative and positive regional contributions (Fig. 6c). Negative ERFari is prominent over the northern Indian Ocean, influenced by the transport of light-scattering sulfate aerosols from India. Positive ERFari occurs primarily where absorbing carbonaceous aerosols are densely emitted, or where they are transported over high-albedo cloud decks, including the northern India, South America, and North Atlantic. Similar effects of the above-cloud aerosols on ERFari were also identified in the HadGEM PPE (Regayre et al., 2018), albeit with different spatial patterns. Additionally, a positive ERFari is also seen over the Saharan region but through a different mechanism, namely a reduction in dust aerosols resulting from their interactions with sulfate (Neubauer et al., 2019). Sulfate can coat dust particles, transferring them from insoluble to soluble modes and thereby enhancing their wet deposition, which more strongly reduces PD dust. At the same time, dust provides surfaces for sulfate condensation, suppressing new particle formation. Together, these processes contribute to a positive ERFari over dust-dominated regions. Similar positive ERFari induced by sulfate–dust interactions has been reported in other models, including GFDL (Fan et al., 2004), GISS (Bauer et al., 2007), and ECHAM–HAM (Neubauer et al., 2019). The weak ERFari over China likely results from the partial cancellation between warming from absorbing BC aerosols and cooling from scattering sulfate aerosols, both of which have substantial anthropogenic emissions in this region (Wu et al., 2024). This is further supported by the sensitivity analysis presented later (Fig. S19), where ERFari shows comparable but opposite sensitivities to their emission parameters over land (−2.6 to emi_antns_so2 and +2.4 to emi_ant_bc). Substantial uncertainty is found in regions strongly influenced by industrial and biomass-burning emissions, including Asia, the boreal regions of North America and their downwind oceans, as well as parts of South America and Africa (Fig. 6f).
The lower panels of Fig. 6g–i illustrates the relative contribution of aerosol parameters to total uncertainty, with cloud parameters accounting for the remainder. Brownish colors denote aerosol control of uncertainty, and greenish colors cloud control. For ERFaer and ERFaci, aerosol parameters dominate over land and across the Northern Hemisphere, where aerosol loadings are higher, whereas the contribution of cloud parameters is limited to tropical regions characterized by intense convection. In contrast, ERFari is largely aerosol-dominated across the globe, with only a modest contribution from cloud parameters in convective regions, likely linked to wet scavenging. A detailed process-level attribution is provided in the next section.
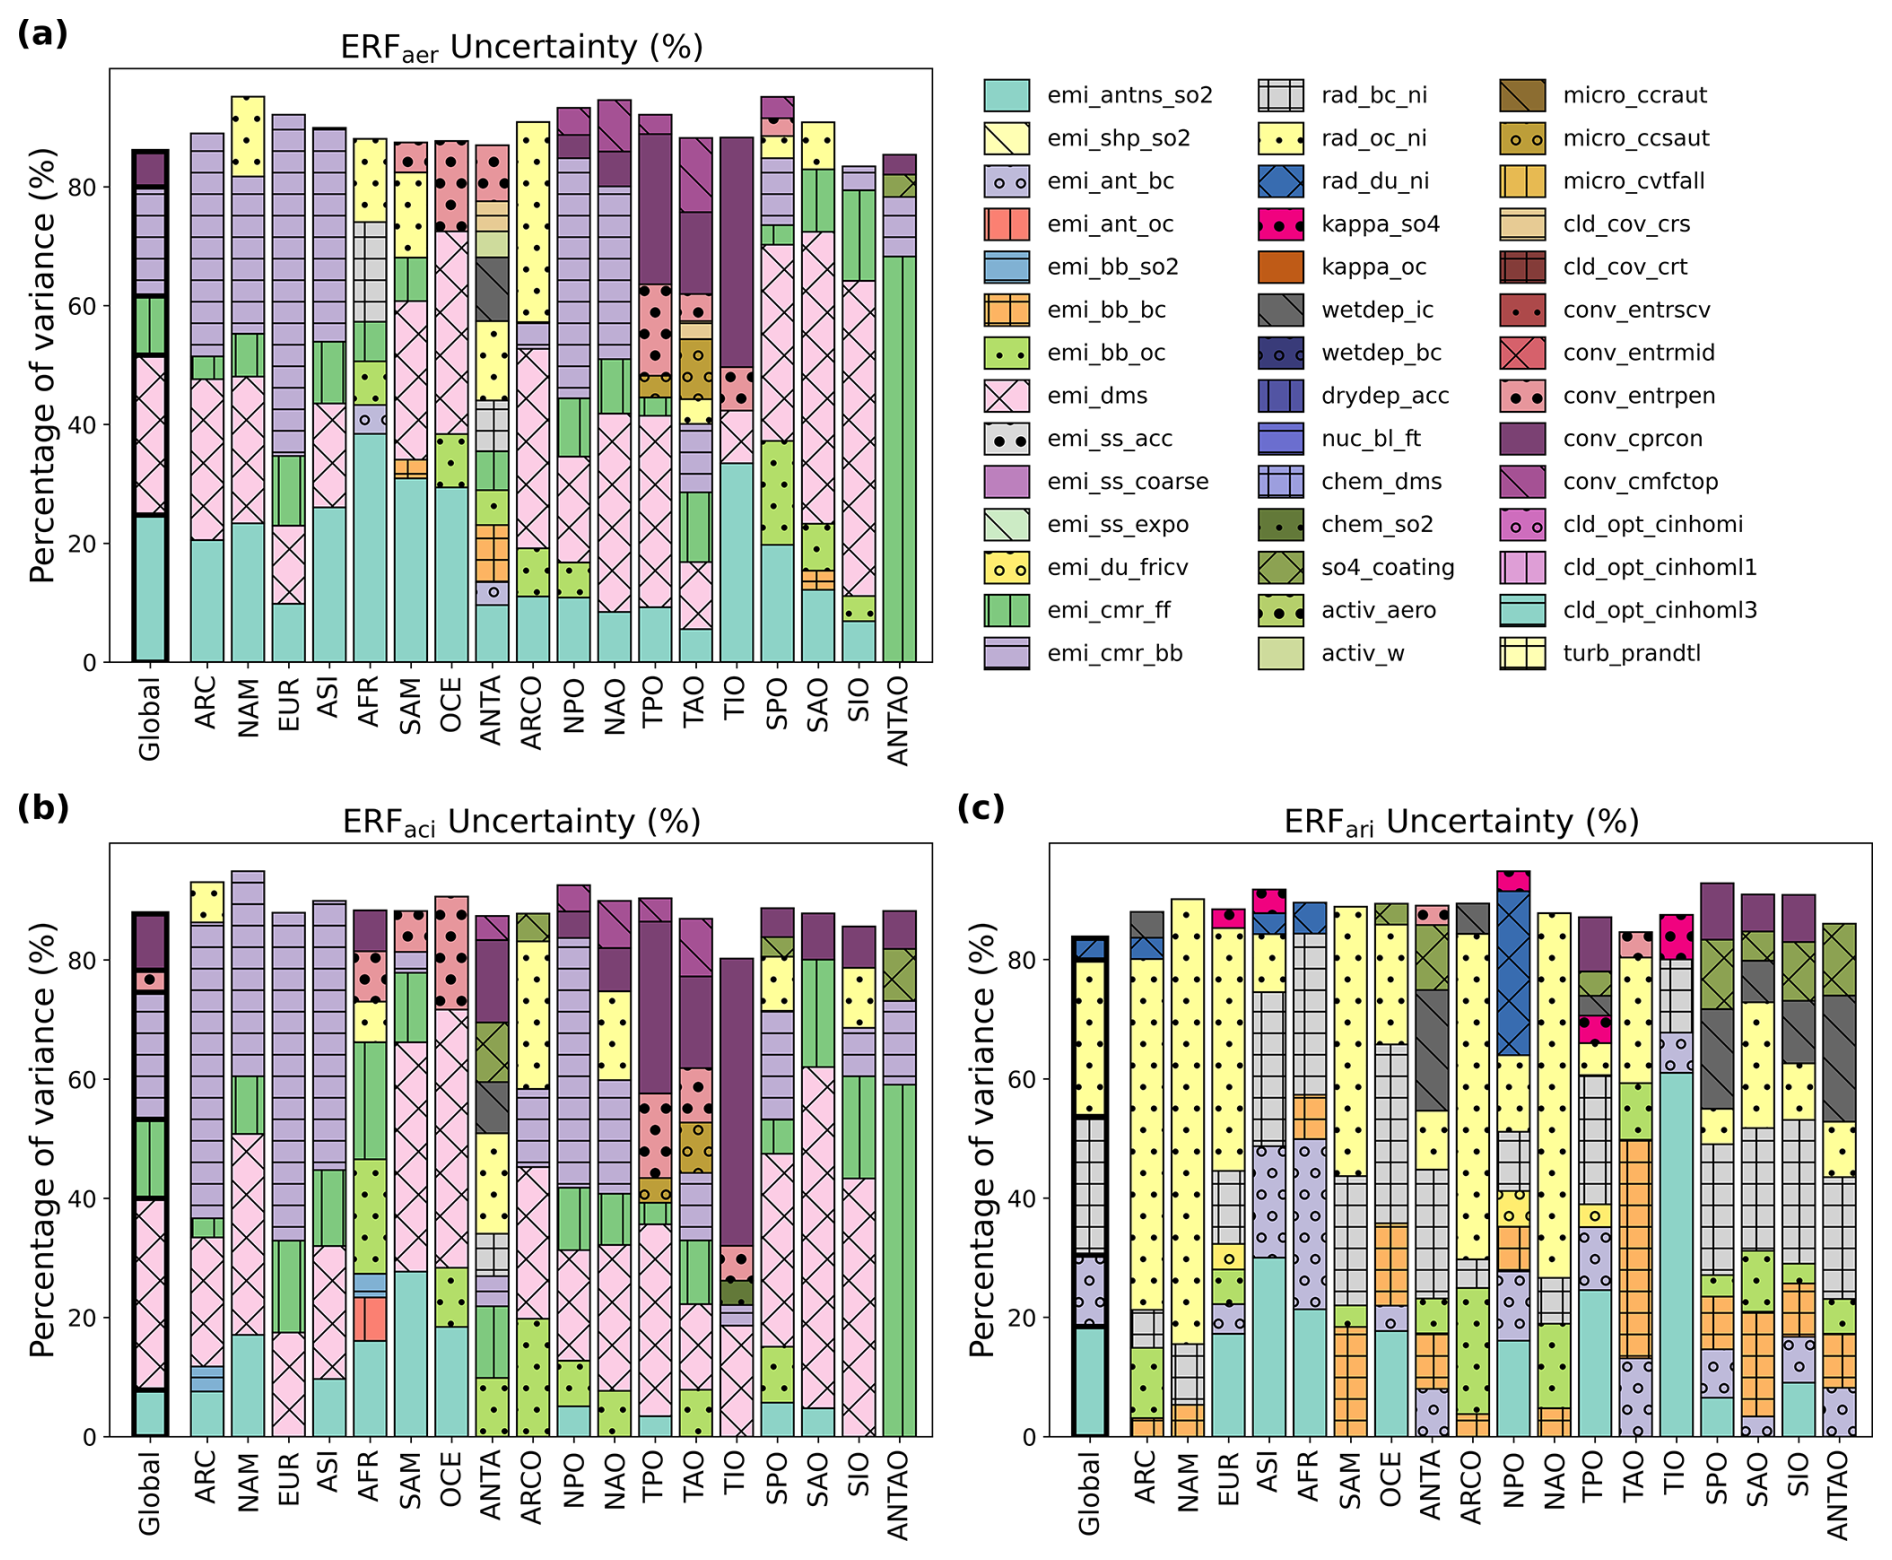
Figure 7Percentage contributions of individual parameters to uncertainties in (a) ERFaer, (b) ERFaci, (c) ERFari over globe and eighteen climatic regions as shown Fig. A1, derived from 200 000 emulated variants. Regions are ordered from north to south, separately for land (left) and ocean (right): Arctic (ARC), North America (NAM), Europe (EUR), Asia (ASI), Africa (AFR), South America (SAM), Oceania (OCE), Antarctica (ANTA); Arctic Ocean (ARCO), North Pacific Ocean (NPO), North Atlantic Ocean (NAO), Tropical Pacific Ocean (TPO), Tropical Atlantic Ocean (TAO), Tropical Indian Ocean (TIO), South Pacific Ocean (SPO), South Atlantic Ocean (SAO), Southern Indian Ocean (SIO), and Antarctic Ocean (ANTAO). Parameters contributing less than 3 % of the total uncertainty are not shown. The corresponding spatial maps of uncertainty caused by individual parameters are shown in Figs. S7–S9. Parameters in the legend are ordered from aerosol- to cloud-related processes (reading top-down, then left-to-right), and the stacked colors mirror this sequence from bottom to top.
3.3 Sources of uncertainty
3.3.1 Aerosol radiative forcing
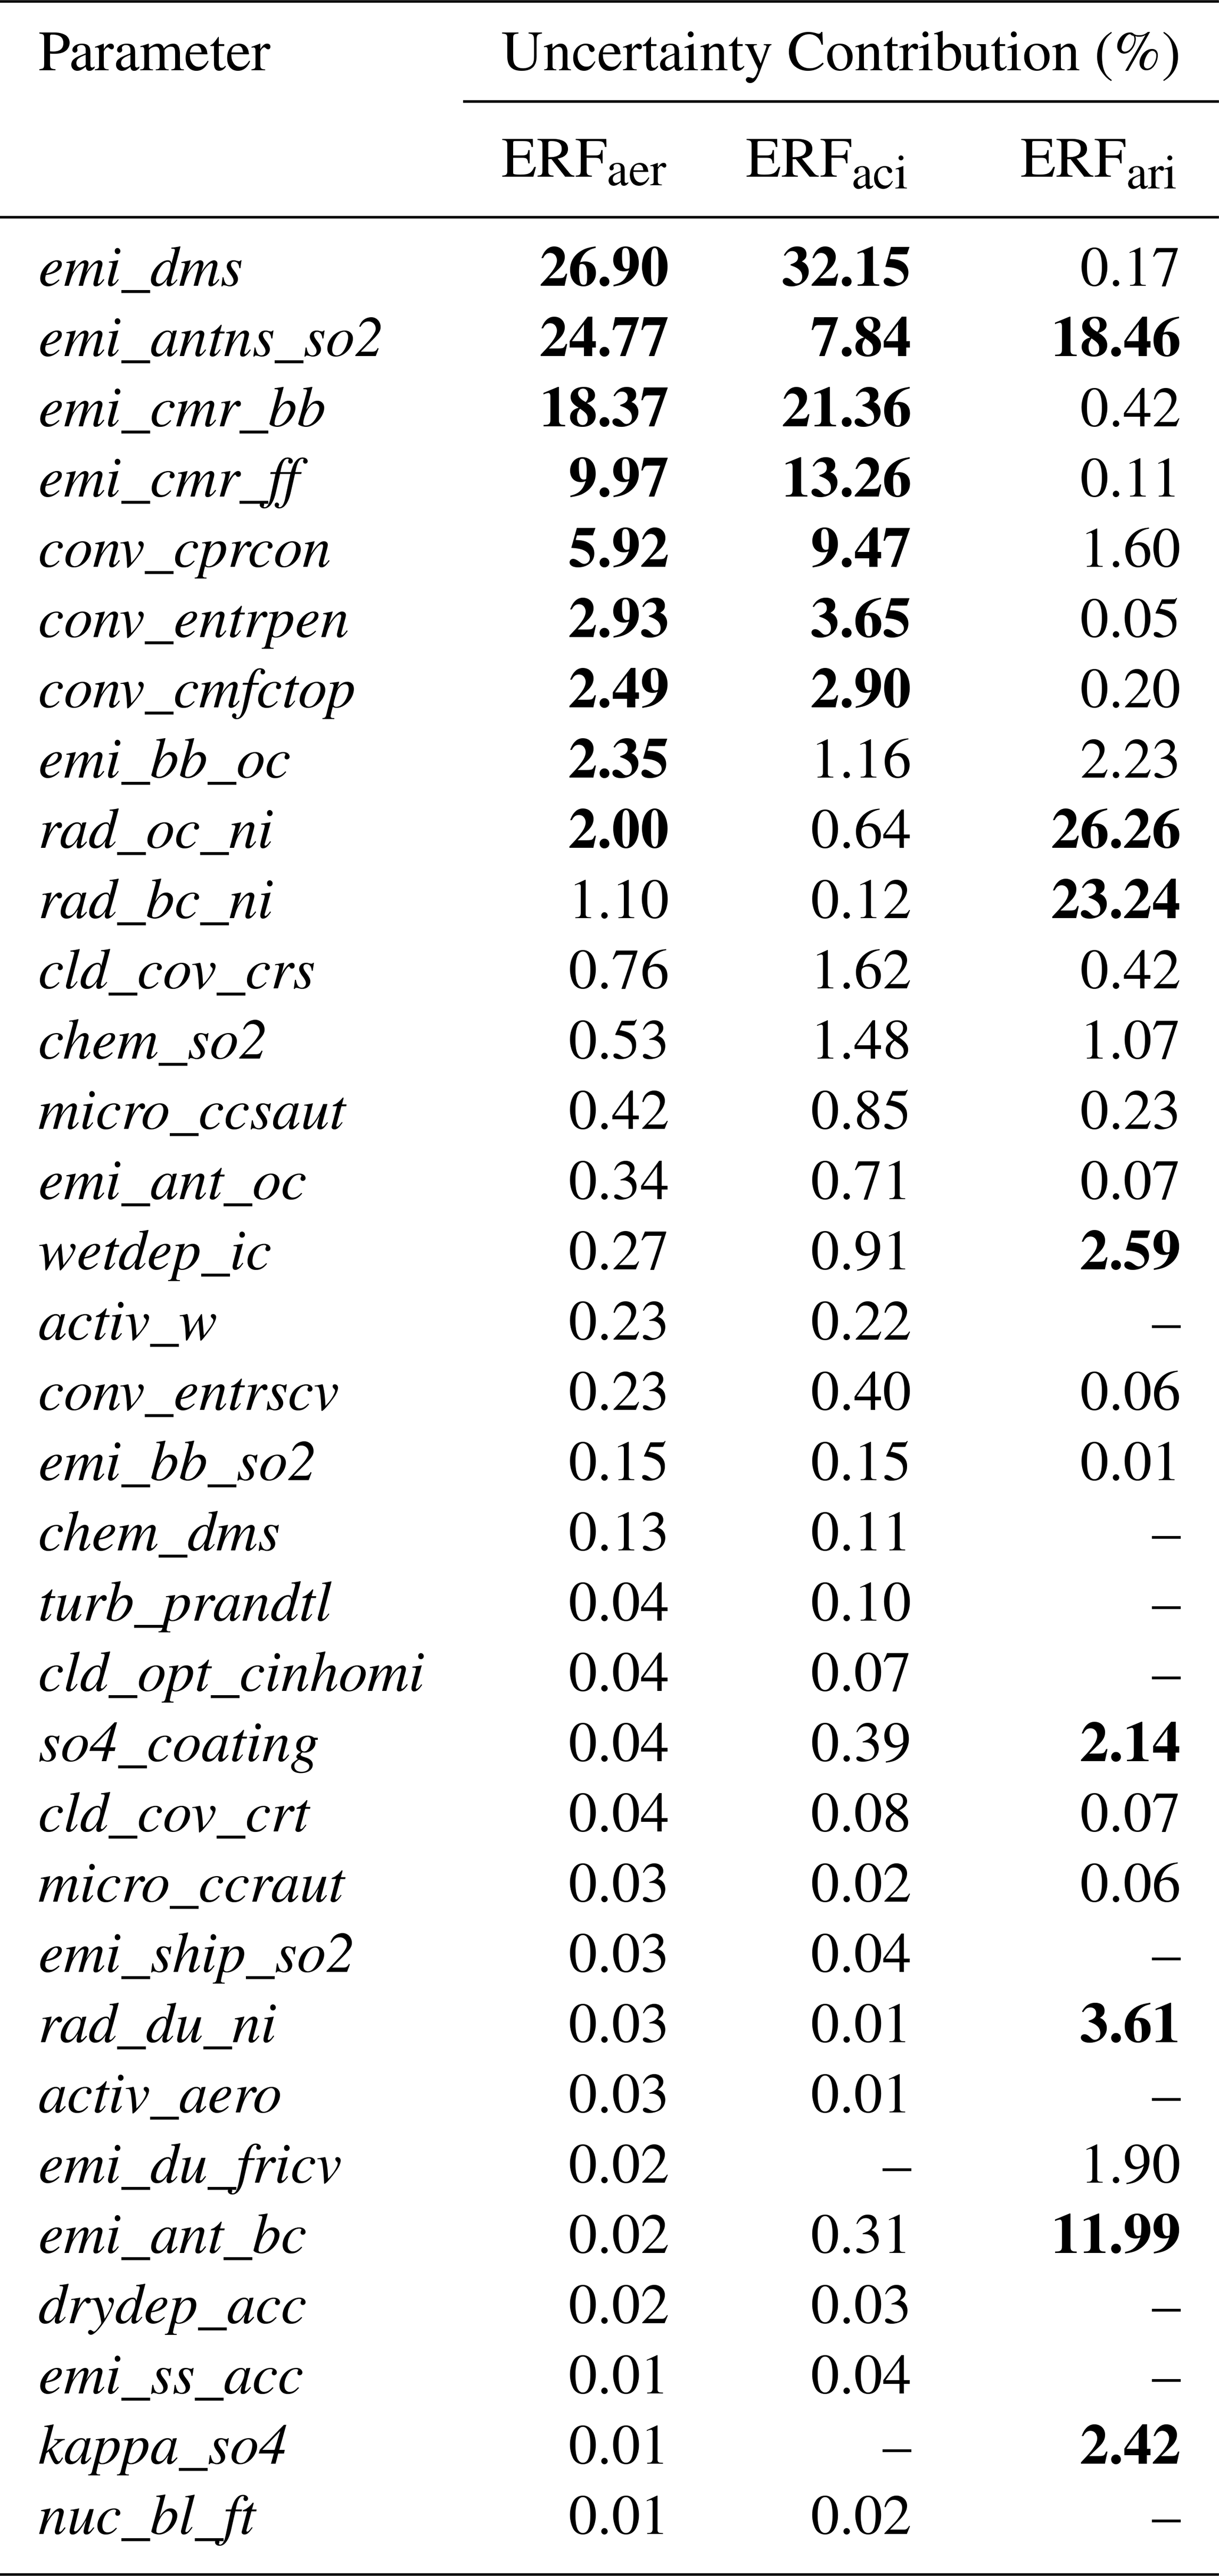
Figure 7 presents the global and regional percentage contributions of individual parameters to uncertainties in ERFaer, ERFaci, and ERFari, with region abbreviations defined in the caption and Fig. A1. The corresponding contributions to uncertainties in global-mean forcing are provided in Table 3.
Table 3Percentage contributions to global annual mean forcing uncertainties by individual parameters over 200 000 model variants, corresponding to Fig. 7. Parameters contributing more than 2 % are highlighted in bold, while those contributing less than 0.01 % to ERFaer are omitted.
ERFaer
Globally, the ERFaer uncertainty is dominated by emission parameters. Anthropogenic SO2 (emi_antns_so2), natural DMS (emi_dms), and emitted particle size from biomass burning and fossil fuel sources (emi_cmr_bb and emi_cmr_ff) contribute similarly (25 %, 27 %, and 28 %), together accounting for nearly 80 % of the total uncertainty. This agrees with results from HadGEM (Regayre et al., 2018) and ECHAM–HAM (Bhatti et al., 2026) PPEs, but shows a larger influence of emitted-size parameters, particularly for biomass burning, likely due to stronger boreal fires in our simulation year (Zhong et al., 2024). It should also be noted that a key difference in the representation of ACI between this study and previous studies lies in the droplet activation. The HadGEM (Regayre et al., 2018) and ECHAM–HAM (Bhatti et al., 2026) PPEs employed the default ARG scheme (Abdul-Razzak and Ghan, 2000), whereas we uses a modified version by Ghosh et al. (2025). The higher sensitivity of the revised ARG to Aitken mode (Ghosh et al., 2025) could also help explain the increased sensitivity to particle size found here. The parameters emi_antns_so2 and emi_dms cause the uncertainty by controlling the magnitude of the PI–PD aerosol change. In particular, the role of DMS highlights the importance of the PI aerosol background. Similarly, uncertainties in biogenic volatile organic compound (VOC) emissions and processing may affect the PI aerosol background, too, but are not explored here because full chemistry is not activated in the current model configuration. For a given emitted mass, emi_cmr_bb and emi_cmr_ff determine the emitted particle number, thereby influencing CCN concentrations and cloud properties, and hence ACI. In comparison, the convection parameter conv_cprcon, controlling the conversion of convective cloud water to rain, contributes a smaller fraction of 6 % (Table 3). It does not directly influence the anthropogenic aerosol perturbation but modifies the cloud radiative state by altering cloud amount, which sets the background cloud state for aerosol–cloud interactions.
It is unsurprising that the emission parameters dominate the ERFaer uncertainty, given their first-order control on PD–PI aerosol differences. Once anthropogenic, biomass burning, and DMS emissions are fixed at their prior medians, cloud parameters dominate the remaining uncertainty (76 %; Fig. S10), primarily through convection (conv_cprcon, conv_entrpen, and conv_cmfctop), cloud cover (cld_cov_crs), and auto-conversion (micro_ccsaut). The remaining uncertainty mainly from aerosol properties (refractive indices) and processes (SO2 chemistry and wet deposition).
Because of the short lifetime of tropospheric aerosols, the contributions of these parameters to ERFaer uncertainty vary substantially across regions. In the main industrial regions (NAM, EUR, and ASI) and their outflow regions (ARC, NPO, and NAO), where the influence of biomass burning aerosols is also present, emi_cmr_bb appears to play a dominant role (Figs. 7a and S7), with contributions ranging from about 25 % in NAM to as high as 55 % in EUR. In contrast, in biomass-burning affected regions (AFR, SAM, TAO and SPO) in the Southern Hemisphere, where anthropogenic sulfate is less abundant, emi_cmr_bb's contribution is much smaller (< 10 %). This contrast reflects the role of aerosol aging: abundant soluble materials (e.g., sulfate) can coat insoluble biomass-burning particles, transforming them into more hygroscopic particles with higher CCN efficiency and thereby modulating ACI forcing. Anthropogenic SO2 emissions (emi_antns_so2) affect ERFaer uncertainty in most regions, except in the very pristine Antarctic Ocean. Its contribution is generally larger over land (10 %–40 %). Over the oceans, however, other processes dominate: natural DMS emissions (emi_dms) exert a stronger influence over the pristine Southern Ocean (SPO, SAO, and SIO), contributing about 30 %–55 %; while convection and entrainment parameters (conv_entrpen, conv_cprcon, and conv_cmfctop) contribute more substantially over tropical oceans (TPO, TAO, and TIO) where deep convection is active, accounting for 30 %–47 %.
ERFaci
ERFaci exhibits a similar uncertainty structure to ERFaer (Fig. 7b) in most regions, although the relative contributions differ slightly. Compared with ERFaer, uncertainty in ERFaci is more strongly influenced by natural emissions (emi_dms; 32 %) and emitted particle size (emi_cmr_bb and emi_cmr_ff; 34 %), while the contribution from anthropogenic SO2 emissions (emi_antns_so2) is smaller (8 %). Convection parameters (conv_cprcon and conv_entrpen) also contribute more strongly to ERFaci uncertainty than to ERFari. Sea-salt emissions were found to be the dominant natural aerosol source of ERFaci uncertainty in the HadGEM (Regayre et al., 2018) and UKESM1–A (Regayre et al., 2023) PPEs, whereas they show almost no influence in our PPE and only a similarly weak effect in the ECHAM–HAM PPE (Bhatti et al., 2026). This difference may be partially explained by an underestimation of marine stratocumulus clouds in ICON–HAM and ECHAM–HAM (Neubauer et al., 2019), where sea-salt is expected to exert an influence. These discrepancies highlight the need for MMPPE efforts to better separate parametric and structural uncertainties across models with substantially different structures.
ERFari
In contrast, ERFari shows a distinctly different uncertainty pattern (Fig. 7c). Besides anthropogenic SO2 emissions (emi_antns_so2; 18 %), most of the uncertainty stems from parameters controlling aerosol absorption, including anthropogenic BC emissions (emi_ant_bb; 12 %) and refractive indices of BC (rad_bc_ni; 23 %), OC (rad_oc_ni; 26 %), and dust (rad_du_ni; 5 %). The stronger role of absorption compared with other PPE studies likely results from enhanced biomass-burning emissions and lower SO2 levels in our simulation year 2024–2025 (Jia and Quaas, 2023; Zhong et al., 2024), as well as the inclusion of above-cloud aerosol effects (Ghan, 2013), which are not included in all PPEs, together increasing the relative importance of aerosol absorption.
ERFari shows substantial regional variations in parameter contributions (Fig. 7c). The parameter emi_antns_so2 contributes strongly to ERFari uncertainty in regions with strongly negative ERFari (Figs. 6c and S9), including the industrial regions EUR, ASI, and AFR and their outflow oceans (NPO, TPO, and TIO). Strong sulfate transport from India leads to the largest emi_antns_so2 contribution in TIO, reaching about 60 %. In biomass-burning source regions (NAM, ARC, and SAM) and their downwind regions (EUR, ARCO, and NAO), uncertainty is primarily driven by the refractive index of OC (rad_oc_ni), contributing 23 %–70 %. The refractive index of BC (rad_bc_ni) contributes to ERFari uncertainty in nearly all regions, reflecting the efficient long-range transport of small BC to remote areas. Associated with this transport, the coating (so4_coating) and in-cloud wet deposition (wetdep_ic) parameters also contribute to the uncertainty over the Southern Ocean (SAO, SPO, and SIO), by changing the absorption efficiency and by controlling the removal of BC from the atmosphere, accounting for about 10 % and 20 %, respectively. Other parameters related to hygroscopicity (kappa_so4) and chemistry (chem_so4), although identified as major contributors in the ECHAM–HAM PPE, do not appear to be important here.
In addition to the parametric uncertainty, another source of the ERFaer uncertainty arises from the prescribed PI emission baseline. In existing PPEs, the spatial pattern and reference period of PI emissions are fixed, while the emission scaling parameters are perturbed in the same way as in the PD runs. Different assumptions about PI biomass-burning emissions and the choice of PI period could substantially alter the PI aerosol background and consequently the magnitude and regional pattern of PI-to-PD aerosol forcing (Hamilton et al., 2018; Brown et al., 2026). The PI baseline may further affect the relative contributions of individual parameters presented here. For example, an emission perturbation may exert a stronger effect under a cleaner PI background than under a more polluted background because of the nonlinear response of clouds and radiation to aerosol perturbations (Jia and Quaas, 2023). Although scaling natural aerosol emissions provides some means of constraining the PI aerosol background, uncertainties associated with the prescribed PI emissions are not captured by the current PPE design and cannot be constrained by PD observations alone.
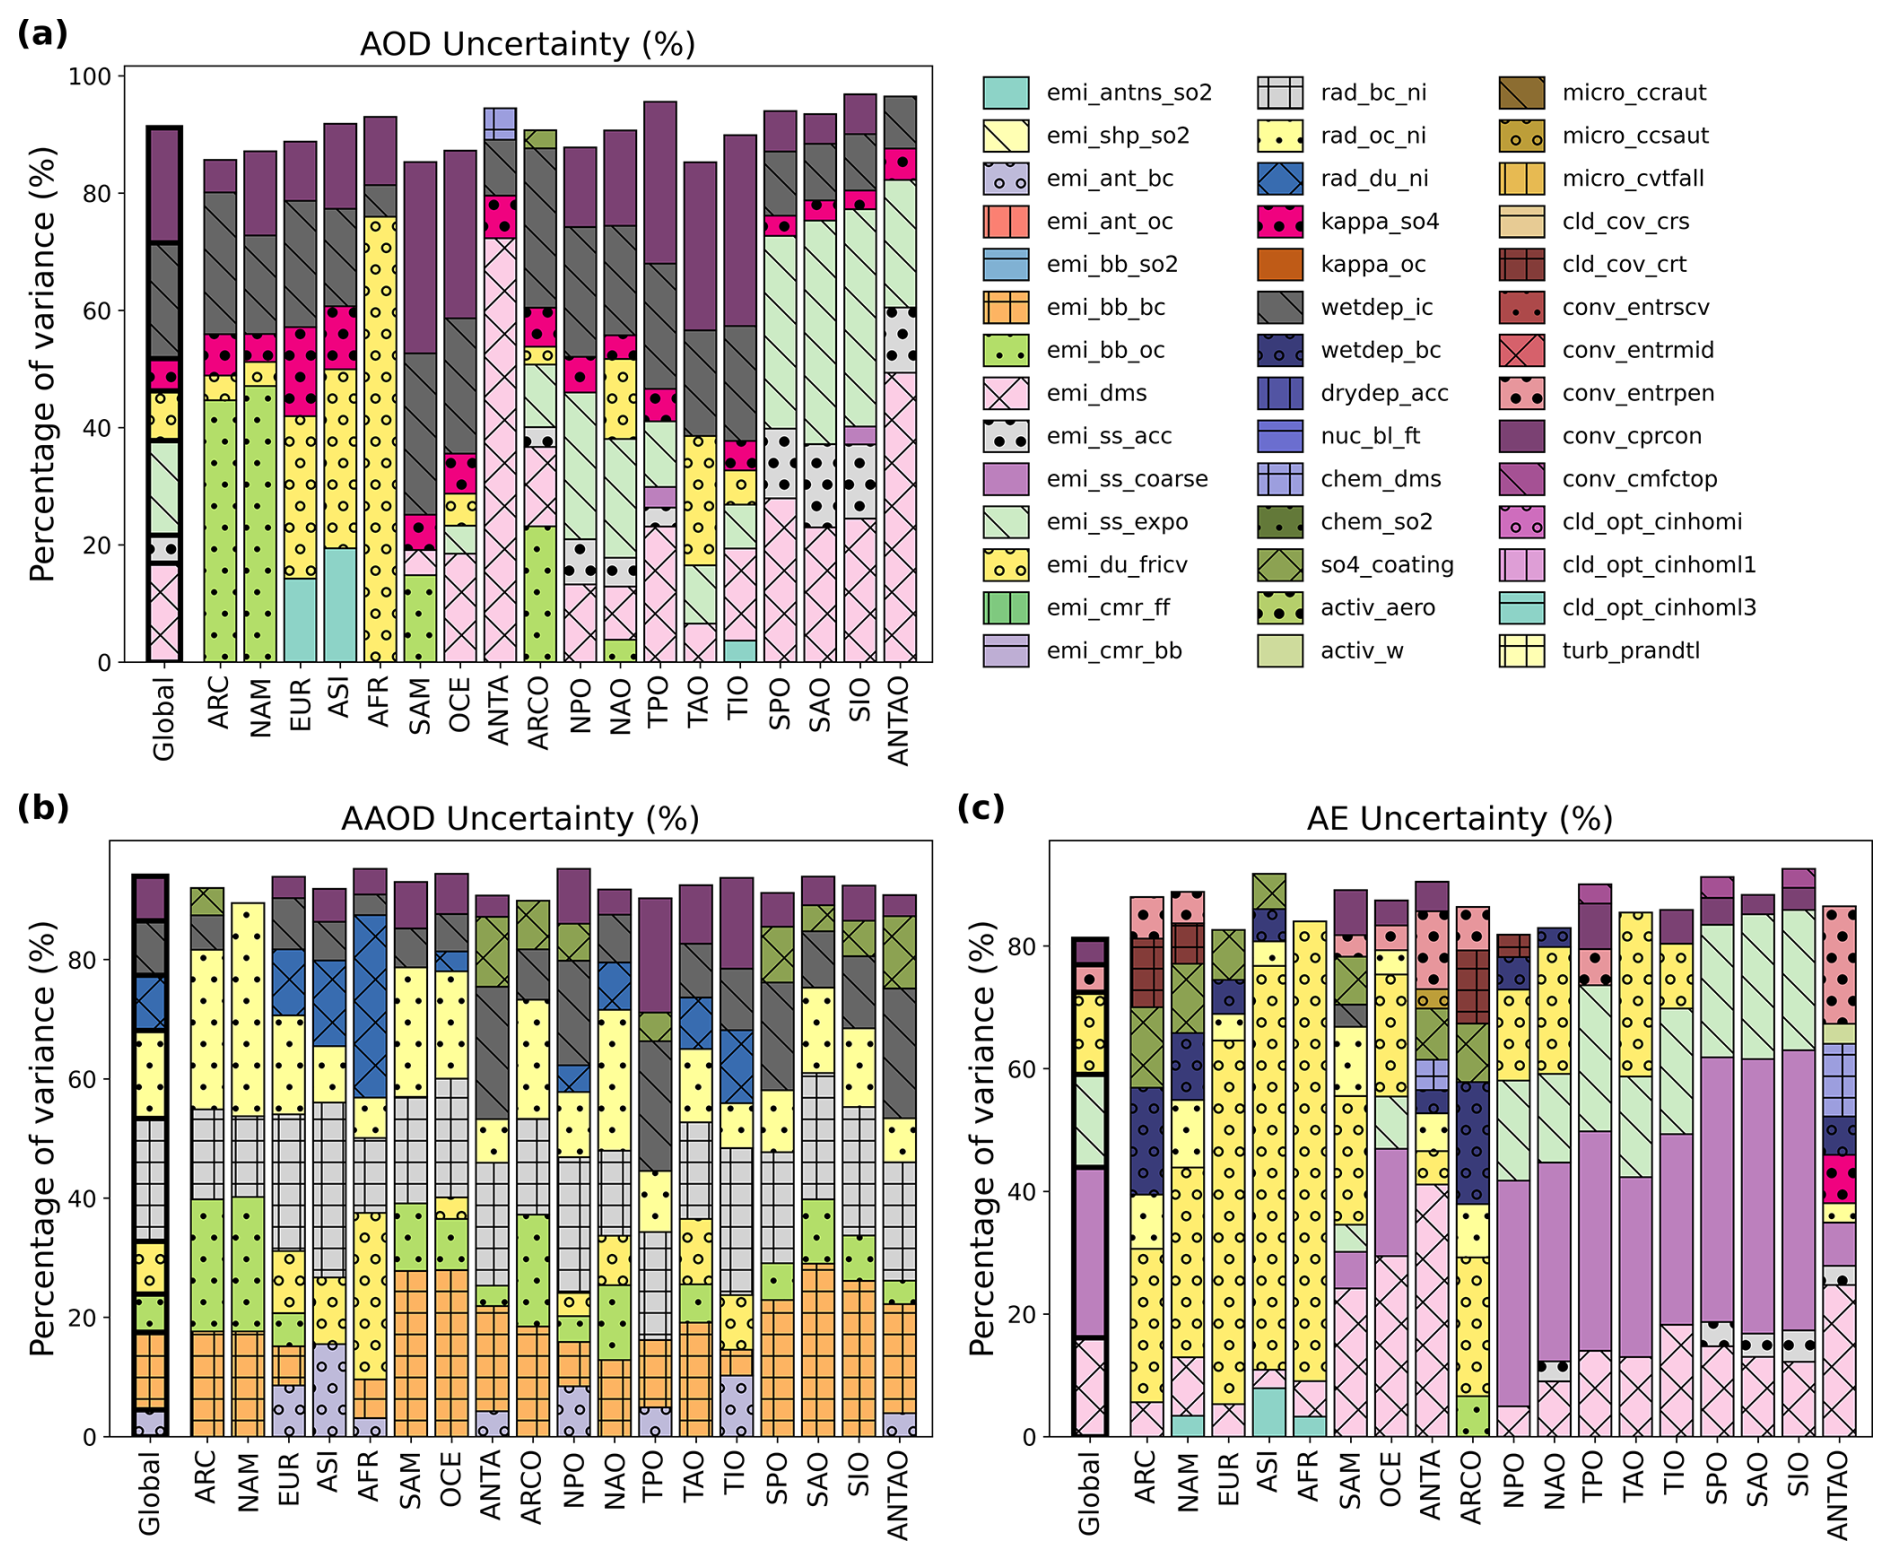
Figure 8As in Fig. 7, but for (a) AOD, (b) AAOD, and (c) AE. The corresponding spatial maps of uncertainty caused by individual parameters are shown in Figs. S11–S13.
3.3.2 Present-day aerosol properties
Because the PI atmosphere is not directly observable, constraints on PI–PD aerosol forcing must rely on PD observations (Carslaw et al., 2013; McCoy et al., 2020). Identifying the processes controlling key PD aerosol and cloud properties helps elucidate whether and how these quantities can constrain the forcing uncertainty. Here, we focus on three aerosol properties observable from space (Fig. 8), including AOD (total aerosol amount), AE (aerosol size) and AAOD (aerosol absorption), which are closely linked to aerosol extinction and CCN activity. The role of cloud properties (CDNC, LWP, and CFliq; Fig. 9) is discussed separately in the following Sect. 3.3.3.
AOD
Figure 8a indicates that natural emission parameters dominate global AOD uncertainty, accounting for nearly 50 % of the variance. The main contributors include DMS emissions (emi_dms; 17 %), sea-salt emissions (emi_ss_expo and emi_ss_acc; 21 %), and dust emissions (emi_du_fricv; 8 %). Their influence, however, varies strongly by region (Figs. 8a and S11). DMS and sea-salt parameters primarily affect oceanic regions but also influence nearby continents such as OCE and ANTA, with contributions increasing toward the Southern Ocean. Although dust emissions contribute less than 10 % to global AOD uncertainty, they exert a substantial influence in the regions where its has a significant source (77 % in AFR and 35 % in ASI) and in downwind regions (20 % in TAO and 30 % in EUR). Similarly, despite their small global contributions, biomass burning OC emissions (emi_bb_oc) can explain around 45 % of the uncertainty in NAM and ARC due to boreal fires, and up to 20 % in SAM due to tropical fires, while anthropogenic SO2 emissions (emi_ant_so2) and sulfate hygroscopicity (kappa_so4) collectively contribute around 30 % of the uncertainties in EUR and ASI due to intense human activities. These strong regional variations suggest that observational constraints should be applied on a regional basis, as different regions are characterised by distinct processes driving the uncertainty (Regayre et al., 2026). In addition, parameters affecting aerosol removal, e.g., conversion of convective cloud water to rain (conv_cprcon) and in-cloud wet deposition (wetdep_ic), contribute relatively uniformly to global AOD uncertainty (40 %), with slightly weaker influence over the Southern Ocean (Figs. 8a and S11).
AAOD
As a component of total AOD, absorbing aerosol optical depth (AAOD) shares three common sources of uncertainty with AOD (emi_du_fricv, wedep_ic, conv_cprcon; Fig. 8a and b). Overall, AAOD uncertainty is dominated by absorption-related parameters, which together explain about 80 % of the variance, in which emission parameters for absorbing aerosols (BC, OC, and dust) account for about 33 %, while their optical property parameters (rad_bc_ni, rad_oc_ni, and rad_du_ni) play an even larger role, contributing ∼ 45 %. These optical property parameters control the imaginary refractive index of BC, OC, and dust, directly governing the absorption efficiency and influencing AAOD, and were also identified as key contributors to single-scattering albedo in the ECHAM–HAM PPE (Bhatti et al., 2026). Although so4_coating has little impact on global AAOD uncertainty, it can affect regions where both coating material (sulfate) and coating cores (biomass-burning or dust particles) are abundant (Fig. S12), by enhancing aerosol absorption through internal mixing of strongly and negligibly absorbing compositions (Bond and Bergstrom, 2006).
AE
Similar to AOD, the Ångström exponent (AE) uncertainty is also dominated by natural emission parameters, explaining an even larger fraction of the variance (about 74 %) than for AOD (Fig. 8c). Parameters associated with coarse-mode emissions (emi_ss_coarse and emi_du_fricv) play a particularly important role. Over land, dust emissions dominate the uncertainty, accounting for about 60 %–70 % in dust-influenced regions (EUR, ASI, and AFR) and ∼ 20 % elsewhere. In oceanic regions, coarse-mode sea-salt emissions dominate the uncertainty (∼ 35 %), with dust additionally contributing in the Northern Hemisphere through long-range transport (Figs. 8b and S13) . Although the wind-exponent parameter in the sea-salt emission scheme (emi_ss_expo) is not directly linked to coarse-mode production, stronger winds preferentially generate coarse sea-salt particles, shifting the emitted size distribution toward larger particles (Gong, 2003; May et al., 2016) and thus influencing AE.
In comparison, fine-mode emission parameters have only a limited influence on AE uncertainty. DMS emissions cause the AE uncertainty through sulfate formation in most regions (∼ 16 % globally), while anthropogenic SO2 mainly affect their source regions contributing < 5 % globally and < 10 % regionally. Of course, other parameters controlling aerosol sink contribute to AE uncertainty, too, but through different mechanisms. For example, in dust-rich regions, wetdep_bc and so4_coating each contribute about 10 % of the AE variance by modifying precipitation scavenging and dust hygroscopicity through aerosol aging, respectively. Moreover, convection-related parameters (conv_entrpen and conv_cprcon) together cause ∼ 9 % of global uncertainty, by affecting wet removal and aerosol growth through cloud processing (Hoose et al., 2008).
Overall, our uncertainty attribution reveals that present-day aerosol properties share several driving parameters with aerosol forcing, indicating their potential to constrain forcing. For example, emi_dms and conv_cprcon influence AOD, AE, and ERFaci, while rad_bc_ni, rad_oc_ni, rad_du_ni, and emi_ant_bc affect both AAOD and ERFari. The utility of different observations to constrain aerosol forcing is discussed further in Sect. 3.4.
In comparison with the ECHAM–HAM PPE (Bhatti et al., 2026), we identify several common parameters related to aerosol emissions, deposition, and optical properties, but their contributions differ substantially. These differences partly reflect the different expert-elicited parameter distributions used in the two studies, and likely also the inclusion of cloud-related parameters in our PPE, on top of structural differences. By perturbing both aerosol and cloud processes simultaneously, our PPE allows stronger interactions among parameters, which alter the relative contributions of individual parameters. For instance, the convection parameter conv_cprcon alone explains about 20 % of the global AOD uncertainty and causes regional uncertainty of up to ± 0.03 in subtropical regions (Fig. S11), by affecting aerosol removal and regeneration from cloud processing. This highlights the importance of including cloud perturbations even in an aerosol-focused PPE study.
3.3.3 Present-day cloud properties
CDNC
Cloud droplet number concentration (CDNC) is central to aerosol–cloud interactions, linking aerosol perturbations to responses of cloud microphysical (LWP) and macrophysical (CFliq) properties. In climate models, CDNC is primarily determined by CCN concentrations, updraft velocity, and activation treatment. The activation treatment governs how efficiently aerosol particles activate into cloud droplets for a given updraft. Its uncertainty in our PPE is represented by the parameter activ_aero, whose range reflects the diversity among commonly used activation schemes (Ghosh et al., 2025).
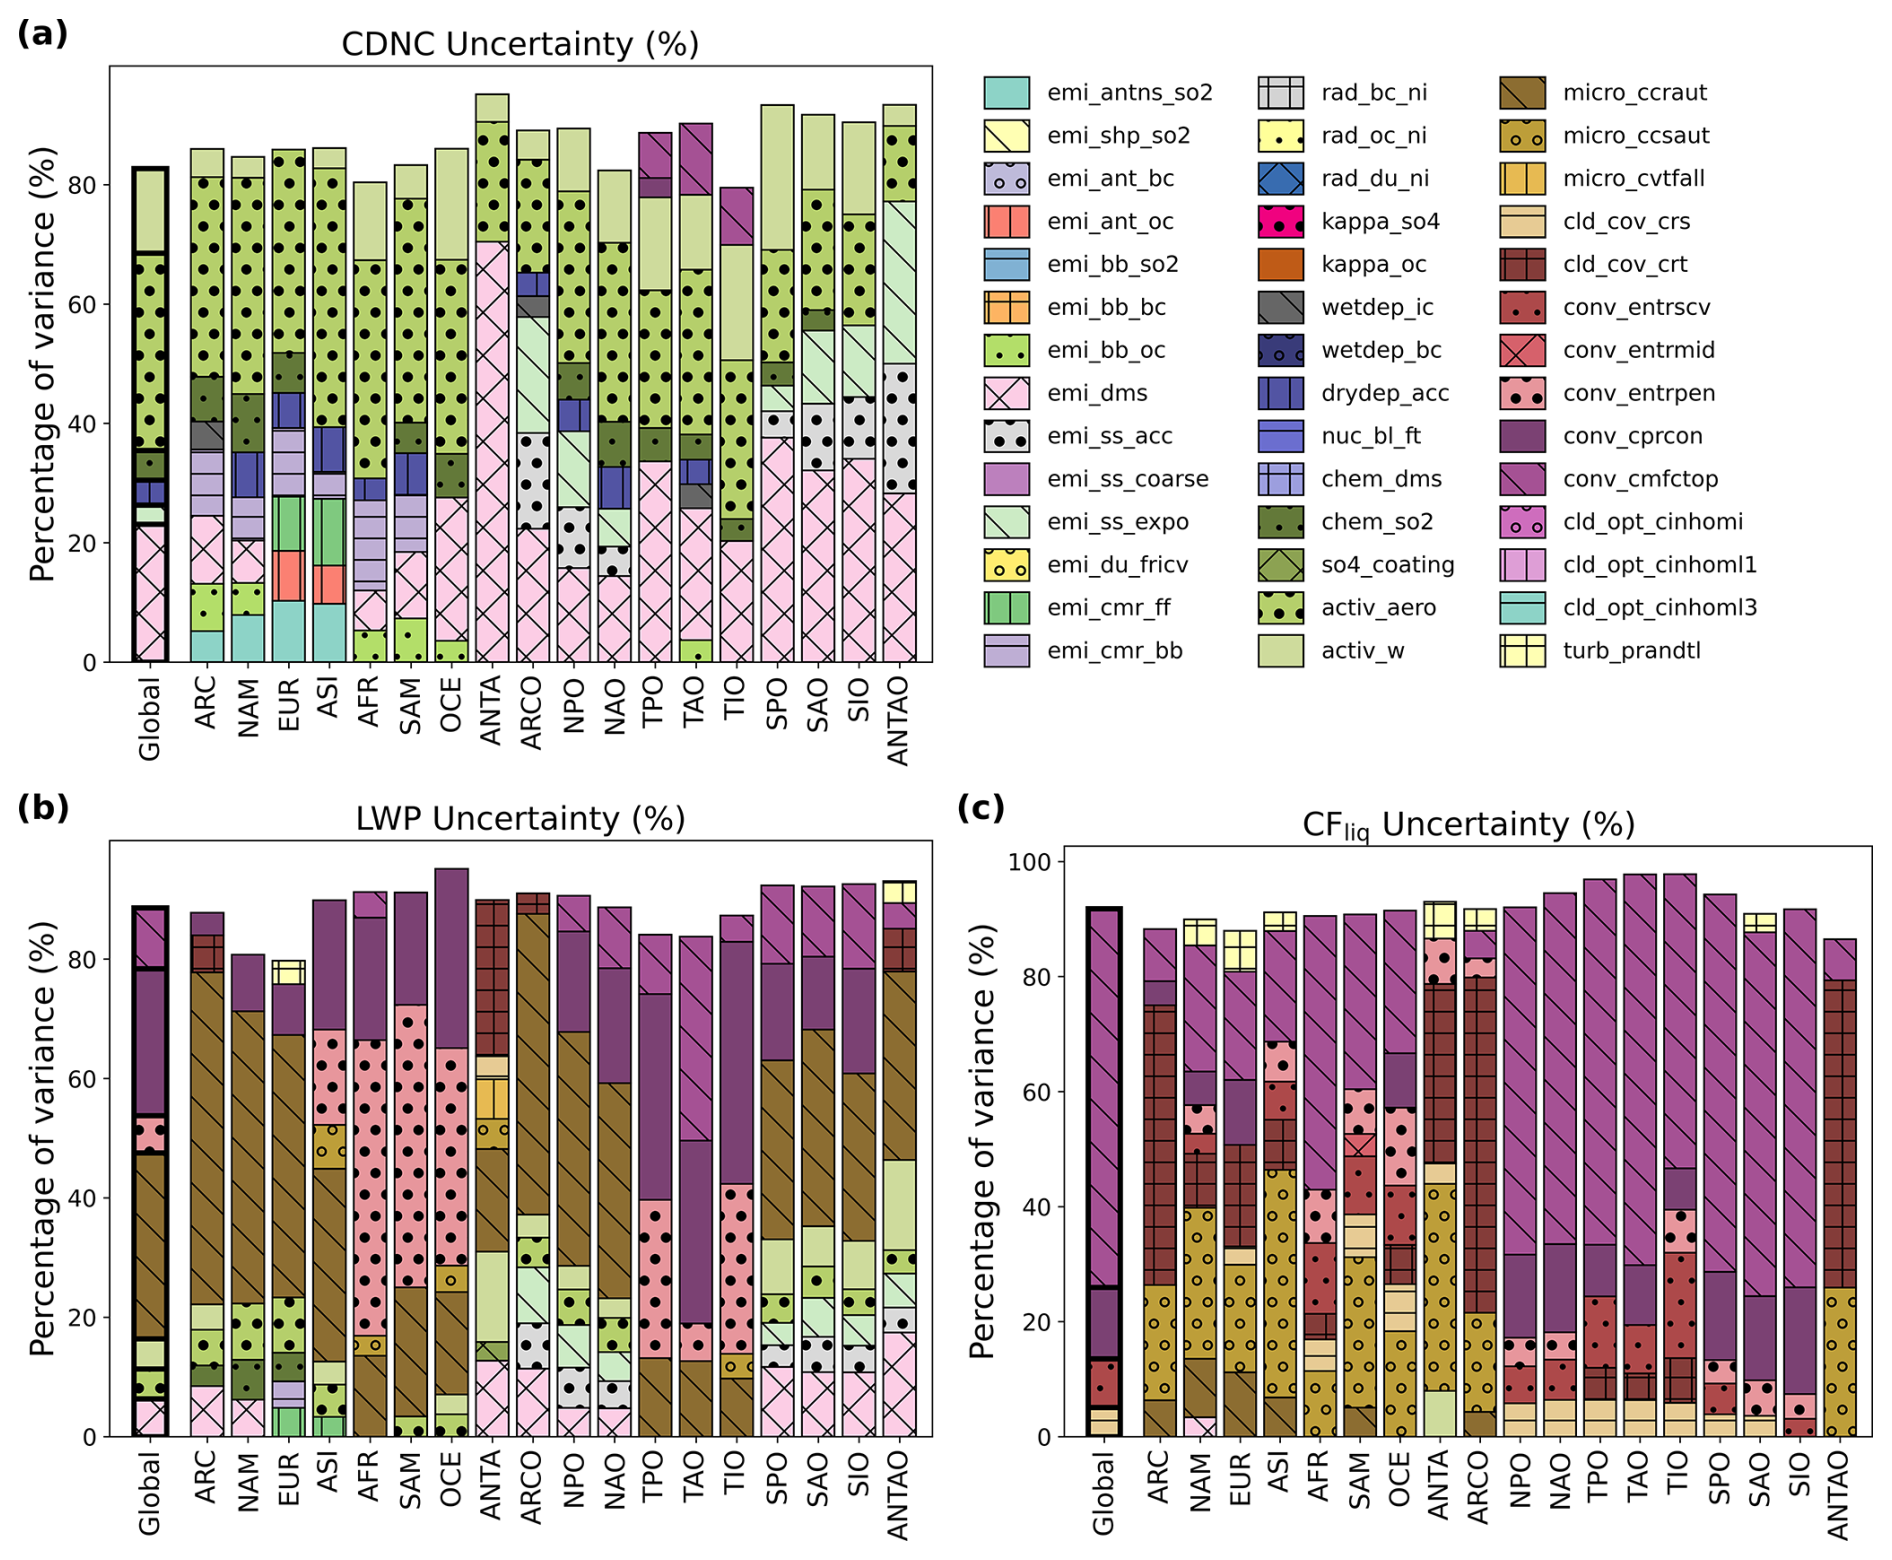
Figure 9a shows that global CDNC uncertainty arises almost equally from parameters controlling CCN concentrations (35 %; emi_dms, emi_ss_expo, drydep_acc, and chem_so2) and activation scheme (33 %; activ_aero), followed by updraft velocity (14 %; activ_w), with activ_aero being the largest single contributor. For CCN-related parameters, DMS emissions dominate globally; however, the relative importance of individual parameters varies strongly by region (Figs. 9a and S15). For example, anthropogenic (emi_antns_so2, emi_ant_oc, and emi_cmr_ff) and biomass-burning (emi_bb_oc and emi_cmr_bb) emission parameters dominate over land and also contribute substantially to ERFaer uncertainty (Fig. 7), implying strong potential for CDNC observations to constrain ERFaer, while over oceans the uncertainty is mainly driven by natural emissions (emi_dms, emi_ss_acc, and emi_ss_expo). The parameters drydep_acc and chem_so2 each cause about ∼ 5 % uncertainty in most regions (except for the Southern Ocean) by altering aerosol lifetime through dry deposition and sulfate production through SO2 oxidation, respectively.
Comparing the three parameter categories (CCN, updraft, and activation), it is interesting to see that CCN-related parameters play a larger role in the cleaner, aerosol-limited Southern Ocean than in the more polluted, updraft-limited Northern Hemisphere. This suggests that ICON–HAM reasonably captures the regime-dependent activation behaviour reported in previous studies using cloud parcel models (Reutter et al., 2009) and satellite observations (Jia and Quaas, 2023). Beyond these three categories, the convection parameter conv_cmfctop contributes about 17 % uncertainty, but only in tropical regions (TPO, TNO, and TIO), by influencing moisture transport and thus cloud formation (Mauritsen et al., 2012).
LWP
The parameters dominating CDNC uncertainty also influence LWP uncertainty, but with much smaller contributions, decreasing from 82 % for CDNC to only 18 % for LWP (Fig. 9b). Instead, LWP uncertainty is dominated by parameters related to cloud microphysics and convection. Globally, auto-conversion rates from cloud water to rain in stratocumulus (micro_ccraut) and convective (conv_cprcon) clouds explain 31 % and 24 % of the LWP uncertainty, respectively. Although convective mass-flux transport (conv_cmfctop) and entrainment mixing (conv_entrpen) account for only 10 % and 6 % of the global uncertainty, they can have a strong impact in tropical regions (AFR, SAM, OCE, TPO, TAO, and TIO), where deep convection is more active. The parameter conv_cmfctop regulates the strength of convective mass-flux transport that redistributes moisture vertically, whereas conv_entrpen controls entrainment mixing between convective updrafts and surrounding air, both affecting the amount of condensed cloud water and thus LWP (also CFliq; Fig. 9b and c).
CFliq
The model diagnoses CFliq solely from relative humidity (Sundqvist et al., 1989); therefore, the parameters dominating CDNC have little influence on CFliq (Fig. 9c). Uncertainty attribution shows that convection-related parameters (conv_cmfctop, conv_cprcon, and conv_entrscv) account for most of the uncertainty (about 90 %), with the remainder associated with the cloud-cover scheme (cld_cov_crs). Among these, conv_cmfctop is the largest contributor, explaining around 66 % of the CFliq uncertainty by regulating convective mass-flux upward transport and thereby modifying the moisture available in the boundary layer where liquid clouds form (Mauritsen et al., 2012). conv_entrscv contributes about 8 % by influencing the mass-flux transport more indirectly through entrainment in shallow convection, which modifies the buoyancy of convective updrafts. In addition, conv_cprcon explains about 12 % of the variance by altering convective precipitation efficiency via auto-conversion and thus the persistence of liquid clouds. Only 5 % of the uncertainty arises from the non-convection parameter cld_cov_crs, which determines the critical RH threshold for cloud formation. These parameters produce similar levels of uncertainty across oceanic regions, where liquid clouds are most prevalent (Figs. 9c and S17).
Beyond these parameters, stratiform cloud microphysics parameters controlling phase transitions between cloud water components and precipitation cause the CFliq uncertainty over land, accounting for about ∼ 10 % from micro_ccraut and about ∼ 30 % from micro_ccsaut. The parameter micro_ccraut affects liquid cloud formation directly by altering rain formation via auto-conversion. In contrast, micro_ccsaut (snow formation via aggregation) affects the CFliq mainly by changing the partitioning of liquid and ice water in mixed phase clouds through the Wegener-Bergeron-Findeisen process, in which cloud ice grows through the depletion of liquid droplets (Korolev, 2007). This parameter has an even stronger influence on ice and total cloud cover (figure not shown).
To conclude, cloud properties are predominantly controlled by cloud-related parameters (80 % for LWP and 90 % for CFliq), except for CDNC, for which aerosol and cloud parameters contribute roughly equally. This uncertainty attribution also provides insight into the processes governing aerosol–cloud interactions. The much smaller aerosol contribution to macrophysical properties implies lower LWP and CF susceptibilities to aerosol perturbation compared to CDNC, consistent with the relatively weak adjustments in LWP and CFliq relative to the Twomey effect reported in climate models (Gryspeerdt et al., 2020; Duran et al., 2025). This, however, contrasts with observational evidence that suggests that cloud adjustments (particularly CF adjustment) can be comparable to or even stronger than the Twomey effect (Rosenfeld et al., 2019; Chen et al., 2022; Yuan et al., 2023; Wall et al., 2023). Such discrepancies may point to structural deficiencies in the model, i.e., missing or poorly represented processes, such as aerosol effects in cloud fraction parameterisation (Sundqvist et al., 1989) and turbulence–microphysics interactions in cloud-top entrainment (Mülmenstädt et al., 2024).
3.4 Sensitivity of model outputs to model parameters
Sensitivity of model outputs to perturbed parameters captures not only the magnitude but also the direction of parameter effects, complementing the variance-based analysis presented above. Following Eidhammer et al. (2024), it is defined as the linear regression slope of standardized outputs against normalized parameter values, allowing direct comparison across parameters and variables. More importantly, the sensitivity analysis helps identify which PD observations with the greatest potential to constrain PI-to-PD aerosol forcing. Specifically, if a PD observable is strongly sensitive to the same parameters that drive uncertainty in PI-to-PD forcing, it has a strong potential to serve as an effective observational constraint.
A wide range of PD observations from both remote sensing and in situ measurements have been used to constrain ERFaer in PPEs, including AOD (Johnson et al., 2020; Watson-Parris et al., 2020; Prévost et al., 2026), aerosol index (AI) (Regayre et al., 2023), aerosol and precursor gas concentrations (Johnson et al., 2020; Prévost et al., 2026), CCN (Song et al., 2025), CDNC (Regayre et al., 2023, 2026; Mikkelsen et al., 2025; Song et al., 2025), COT (Regayre et al., 2023, 2026), CER (Regayre et al., 2023, 2026), LWP (Regayre et al., 2023, 2026; Eidhammer et al., 2024; Mikkelsen et al., 2025), CFliq (Regayre et al., 2023, 2026), precipitation rate (Mikkelsen et al., 2025), radiative fluxes (Regayre et al., 2023, 2026; Eidhammer et al., 2024), and cloud radiative effects (Eidhammer et al., 2024), among others. However, how effectively these observations constrain ERFaer remains unclear and may vary across models due to structural differences.
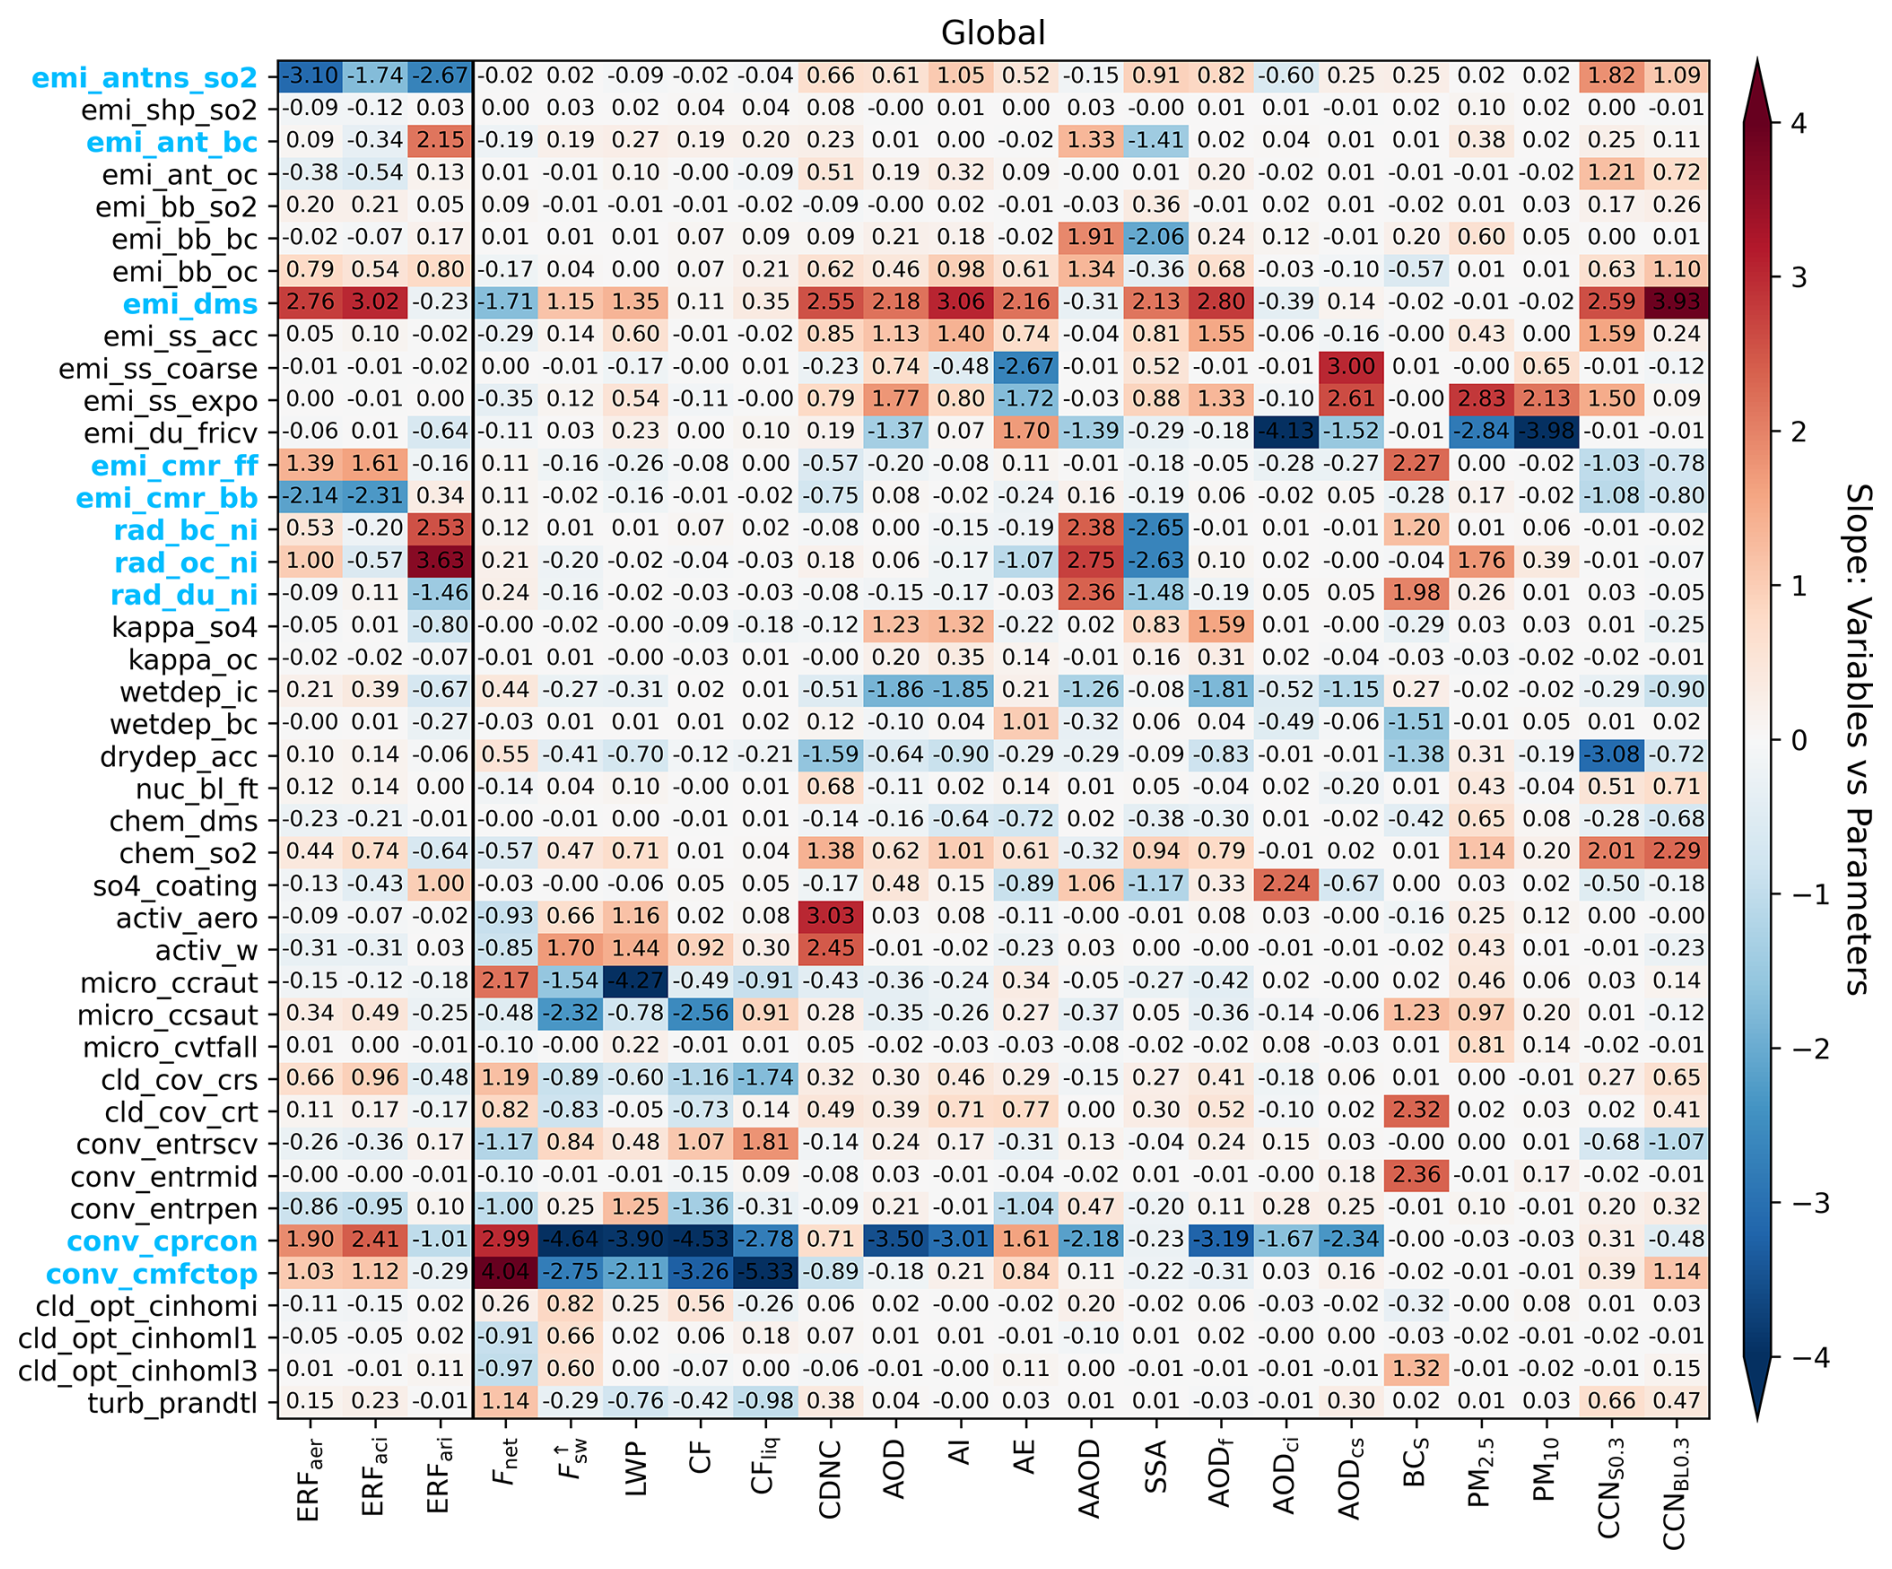
Figure 10Linear regression slopes of standardized global-mean outputs against normalized parameter values for 20 variables. The output variables are divided into PI-to-PD forcing (left) and present-day (PD) observables (right), separated by a dashed line. The parameter order follows Tables 1 and 2. Parameters identified as key drivers of ERFaer uncertainty are highlighted in bold blue. A positive correlation means that the model diagnostic increases with the parameter value, whereas a negative correlation indicates the opposite. The slope values are also shown in each grid cell for quantitative comparison. Similar results for land and ocean are presented in Figs. S19 and S20, respectively.
Here, we systematically evaluate the constraint potential of commonly observed aerosol and cloud properties from both space- and ground-based measurements. Figure 10 shows the sensitivities of global-mean outputs to parameter changes, with PI-to-PD forcing on the left and PD observables on the right. Given the level of detail in the figure, we focus on the global-mean results in the main text, while corresponding land and ocean results are provided in Figs. S19 and S20. Red colours represent increases in the output with increasing parameter values, whereas blue colours represent decreases. In the following, we focus on parameters whose slopes exceed 1, indicating strong influence on the outputs (a slope of 1 corresponds to one standard deviation across the full parameter range), and discuss them in top-to-bottom order in Fig. 10.
As shown in Fig. 10, the sensitivity analysis identifies the same driving parameters as the uncertainty attribution in Sect. 3.3, i.e., emi_antns_so2, emi_dms, emi_cmr_ff, emi_cmr_bb, conv_cprcon, and conv_cmfctop for ACI and emi_antns_so2, emi_ant_bc, rad_bc_ni, rad_oc_ni, rad_du_ni, so4_coating and conv_cprcon for ARI. Encouragingly, for each of these parameters driving aerosol forcing, at least one PD observable shows strong sensitivity, indicating potential for constraining ERFaer using existing measurements.
Anthropogenic SO2 emissions (emi_antns_so2) exhibit a strong negative slope with respect to both ERFaci and ERFari, consistent with enhanced PD–PI aerosol contrast under higher anthropogenic emissions. Three PD diagnostics related to fine-mode aerosol concentrations also show strong sensitivities to emi_antns_so2, including AI (AOD multiplied by AE) and CCN number concentrations at the surface (CCNS0.3) and at the top of boundary layer (CCNBL0.3). Compared with AOD or AE alone, AI better represents fine-mode aerosol abundance by combining aerosol loading and size information (Nakajima et al., 2001), and is thus more closely related to SO2 emissions.
Anthropogenic BC emissions (emi_ant_bc) show a positive correlation with ERFari, reflecting increased atmospheric absorption by human-emitted BC since the industrial era. This parameter is also positively correlated with PD AAOD and negatively with single scattering albedo (SSA) because of its strong link to atmospheric absorption.
DMS emissions (emi_dms) influence aerosol forcing primarily through ACI by acting as a source of CCN. The parameter emi_dms shows a strong positive correlation with ERFaci, suggesting that increasing DMS emissions enhances the natural background CCN concentration, thereby reducing the PD–PI contrast and leading to a more positive forcing. Notably, more than half of the PD observables closely linked to CCN concentrations are highly sensitive to emi_dms. These are primarily commonly used CCN proxies, with stronger sensitivities generally observed for better proxies, i.e., CCNBL0.3 > AI > fine-mode AOD (AODf) > AOD (Gryspeerdt et al., 2017; Jia et al., 2026), implying that sulfate from DMS oxidation is an important source of CCN, particularly over the oceans (Fig. S20). Although not directly related to CCN, PD AE, CDNC, LWP, and even TOA net radiative flux (Fnet) and outgoing shortwave radiative flux () also show sensitivity to emi_dms, reflecting the broad influence of DMS-derived marine secondary aerosols on global clouds and radiation by acting as CCN.
Emitted particle sizes from fossil fuel (emi_cmr_ff) and biomass burning (emi_cmr_bb) are also correlated with ERFaciby modulating particle number for a given emitted mass. However, only surface-level PD observables (CCNS0.3 and BCS) show notable sensitivity (with a slope close to 1) to these parameters, likely due to their closer association with emission sources. These observations are spatially sparse compared to satellite-retrieved quantities. Nevertheless, ground-based CCN and BC measurements, particularly at sites close to emission source regions, would provide valuable constraints.
Refractive indices related to anthropogenic aerosols (rad_bc_ni and rad_oc_ni) exhibit strong positive correlations with ERFari, indicating that the more absorbing the anthropogenic aerosols, the more positive the ARI forcing. Refractive index of dust (rad_du_ni), in contrast, is negatively correlated to ERFari, likely because dust provides a strongly absorbing background that dampens the anthropogenic radiative perturbation of other aerosols. Importantly, several PD diagnostics are also strongly linked to these parameters, including AAOD, SSA, surface BC mass concentration (BCS), PM2.5 and AE.
The conversion rate from cloud water to rain in convective clouds (conv_cprcon) correlates positively with ERFaci but negatively with ERFari, owing to its different effects on cloud and aerosol processes. A higher conv_cprcon reduces the LWP and CFliq baseline, weakening the PD-PI contrast in cloud radiative effect (CRE) and thereby shifting ERFaci towards a more positive value. In contrast, the reduced cloud amount diminishes above-cloud aerosol absorption (Ghan, 2013), resulting in a more negative ERFari. The parameter conv_cprcon is very promising to be constrained, as many PD observables show strong sensitivity to it, including Fnet, , LWP, CFliq, AOD, AI, AE, AAOD, AODf, and coarse-mode insoluble and soluble AOD (AODci and AODcs).
Similar to conv_cprcon, conv_cmfctop is also positively correlated with ERFaci through its influence on cloud properties. A larger conv_cmfctop enhances the convective moisture transport from the boundary layer into the free troposphere, thereby suppressing cloud formation and reducing the baseline LWP, CFliq, and CRE, which in turn leads to a more positive ERFaci. This parameter is also readily constrained by observations, as most PD cloud (LWP and CFliq) and radiation (Fnet and ) diagnostics show strong sensitivity to it.
To summarise, for each of the key parameters driving ERFaer uncertainty, at least one–and often multiple–PD observables are sensitive to it. This underscores the considerable potential to constrain ERFaer using existing in situ and remote sensing measurements. For parameters that can be readily constrained by multiple PD observations, a key challenge thus becomes to prioritise observed variables during the constraint process, favouring those with lower measurement errors and, potentially, those less affected by model internal inconsistencies that may lead to failed constraints (Regayre et al., 2023; Prévost et al., 2026). This could be achieved using well-defined constraint measures, e.g., the implausibility metric (Johnson et al., 2020), which weights constraint variables according to their associated uncertainties across different aspects. In addition, several parameters (particularly cloud parameters related to activation, auto-conversion, aggregation, and entrainment) while not directly driving aerosol forcing, exert strong control on cloud states (CDNC, LWP, and CFliq) and thus would be crucial for cloud feedbacks, too (Duffy et al., 2024; Gettelman et al., 2024). Although our PPE is not designed to explicitly explore climate feedbacks, constraining simulations that resemble PD clouds is expected to improve the representation of cloud feedbacks as a by-product, thereby equipping the model with improved capability for climate projections.
3.5 Comparison to observations
This section evaluates aerosol and cloud properties from the ICON–HAM default run against SPEXone and MODIS-COSP observations. The 3 h model outputs are co-located with the observations in time and space to mitigate spatiotemporal representation uncertainties (Schutgens et al., 2016a, b). Comparison of spatial patterns between model bias and parametric uncertainty is also presented, which would inform whether the model bias is correlated with parametric uncertainty. To aid process-level attribution of the bias, global maps of uncertainty contributions from individual parameters are provided in Figs. S11–S13 and S15–S17.
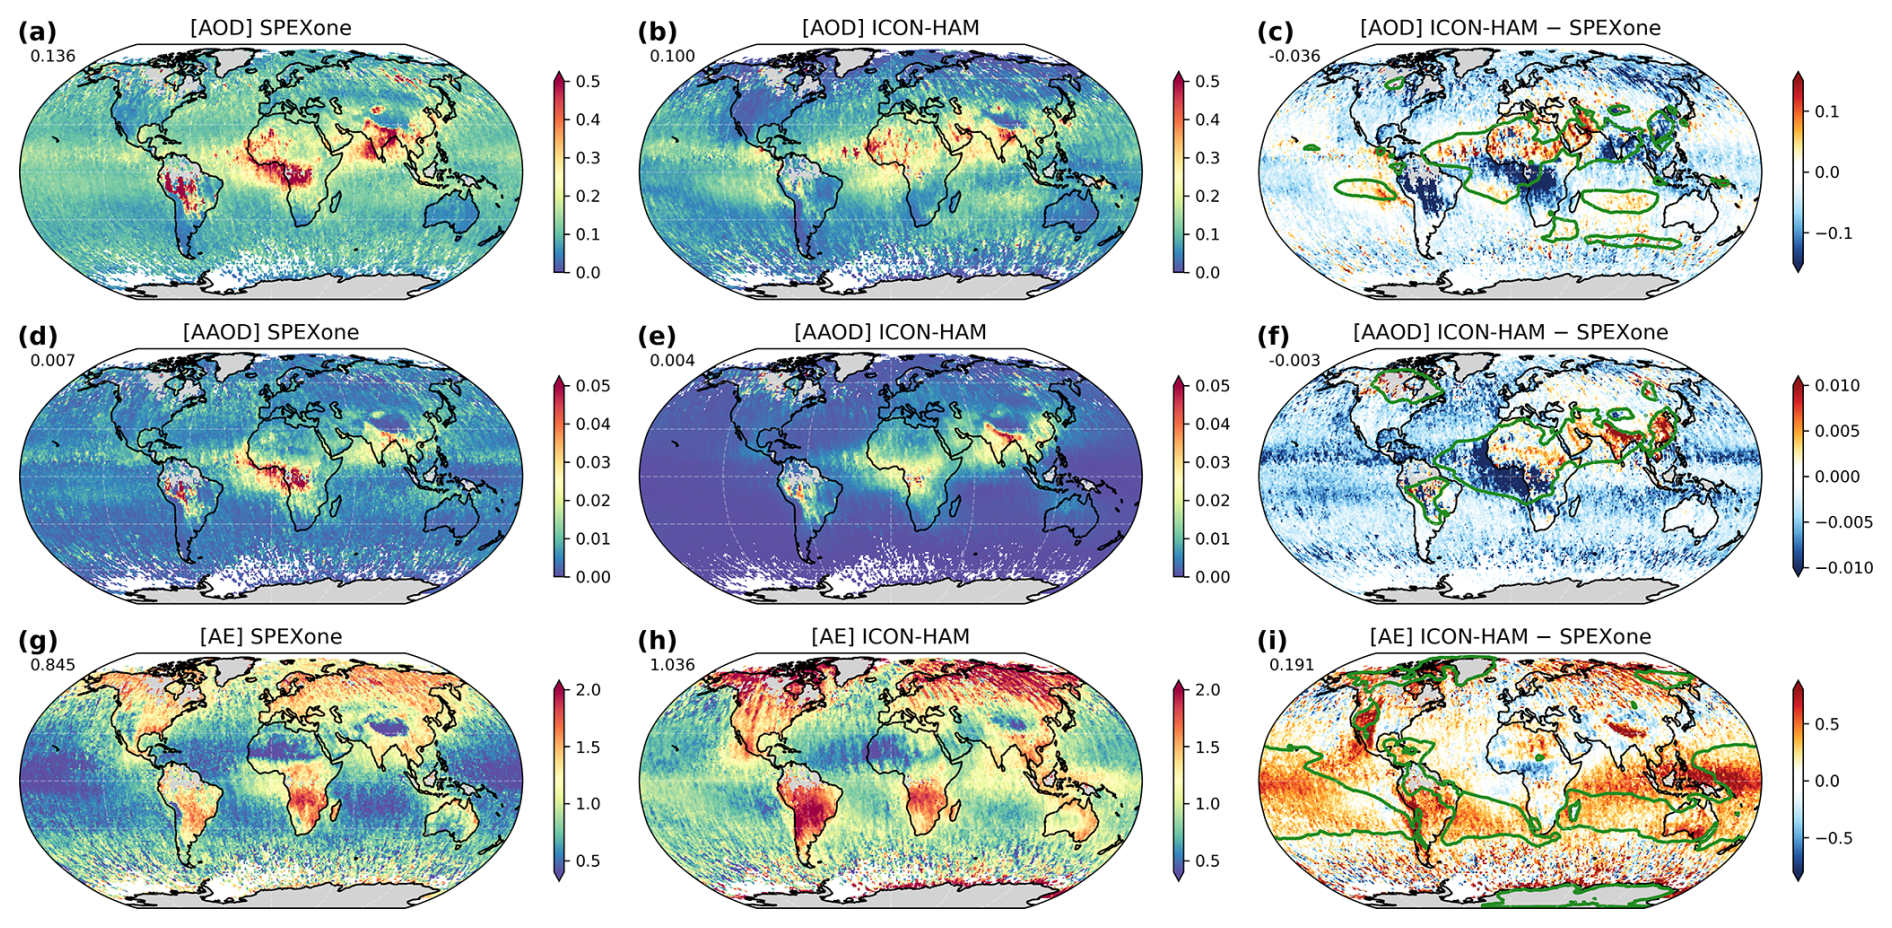
Figure 11Global annual-mean AOD (top), AAOD (middle), and AE (bottom) from SPEXone retrievals (left), the ICON–HAM CTRL simulation (middle), and their difference (ICON–HAM minus SPEXone; right). The 3 h ICON–HAM outputs are co-located with SPEXone observations in space and time. Green isolines enclose regions with parametric uncertainty in the highest 10 % globally. Top-left numbers indicate global mean values.
3.5.1 Aerosol properties
Figure 11 shows annual mean AOD, AAOD, and AE from the ICON–HAM default run against SPEXone retrievals. Overall, the model appears to underestimate AOD compared to observations (Fig. 11a–c), with a global mean bias of −0.036. The underestimation of AOD is also common in other AeroCom models (Kinne et al., 2006; Gliß et al., 2021). Spatially, the largest differences are primarily found over land, particularly in biomass burning regions over Southern America and Africa tropical rain forests, where the model exhibits pronounced negative biases (Fig. 11c). A similar, though weaker, negative bias occurs in northern boreal regions. Similar bias patterns have also been reported in ECHAM-HAM and an earlier version of ICON–HAM, and have been attributed to too low biomass burning emissions and too strong wet deposition by convective clouds (Tegen et al., 2019; Salzmann et al., 2022). With the PPE, we suggest the dominant role of biomass-burning emissions, as the spatial pattern of the negative bias closely aligns with the parametric uncertainty caused by emi_bb_oc (Fig. S11). In-cloud wet deposition (wetdep_ic) and convective cloud-to-rain conversion rate (conv_cprcon) also contribute to the bias in these regions, albeit to a lesser extent (Fig. S11). In addition, negative biases of AOD are evident in major industrial regions (e.g., China and India) as well. These biases are likely linked to the high uncertainty associated with emissions of anthropogenic aerosols (emi_antns_so2) and their hygroscopicity (kappa_so4) in these regions (Fig. S11). The positive biases, in contrast, occur primarily in the Sahara and its outflow regions, whose spatial pattern is fairly compatible with that of the uncertainty related to dust emissions (emi_du_fricv; Fig. S11). Consistent with its sister model ECHAM–HAM (Bhatti et al., 2026), ICON–HAM overestimates AOD over subtropical oceans, but less strongly (Salzmann et al., 2022). This bias may be explained by relatively large parametric uncertainties caused by both sources (emi_dms, emi_ss_acc, emi_ss_coarse, emi_ss_expo) and sinks (wetdep_ic and conv_cprcon) of natural aerosols (Fig. S11). Overall, regions with larger biases often coincide with high parametric uncertainty (green isolines; Fig. 11c), implying that part of these biases may be reduced through parameter optimisation.
AAOD largely mirrors the AOD bias map, with a global mean bias of −0.003 (Fig. 11d–f). There are, however, two notable exceptions. First, the positive bias over subtropical oceans seen in AOD disappears in AAOD, as these regions are dominated by scattering aerosols (DMS-derived sulfate and sea-salt). Second, the negative AOD bias over China and India shifts to a positive bias in AAOD, likely reflecting large uncertainties in atmospheric absorption, e.g., anthropogenic emissions of BC (emi_ant_bc) and its refractive index (rad_bc_ni) (Fig. S12). Figure 11f illustrates that virtually all regions with large biases closely correspond to areas of high parametric uncertainty, suggesting that parameter optimisation offers also an effective pathway to reduce the AAOD bias.
AE exhibits an overall positive bias relative to SPEXone observations (Fig. 11g–i), with a mean bias of 0.19, pointing to too small particle sizes in ICON–HAM. Over land, the largest positive biases occur in dust source regions in the western US, where the model fails to reproduce the lower AE compared to the eastern US observed in the data. A similarly strong positive bias is found over the Tibetan Plateau, likely attributed to limitations in simulating aerosol transport over complex terrain at high altitudes, as well as reduced retrieval accuracy under complex terrain and low aerosol. Such issues are also seen in AeroCom models (Kinne et al., 2006; Gliß et al., 2021). Another continental region showing positive bias is South America. As shown in Fig. S13, the origin of the AE bias over land is complex due to the interplay between fine- and coarse-mode aerosols across multiple processes, including emissions (emi_dms and emi_du_fricv), particle aging (so4_coating), and wet deposition (wetdep_ic and wetdep_bc). Although rad_oc_ni also contributes to AE uncertainty over land, this does not reflect changes in particle size. Instead, changes in the OC absorption can alter aerosol extinction differently across wavelengths and thereby affect AE (Schuster et al., 2006).
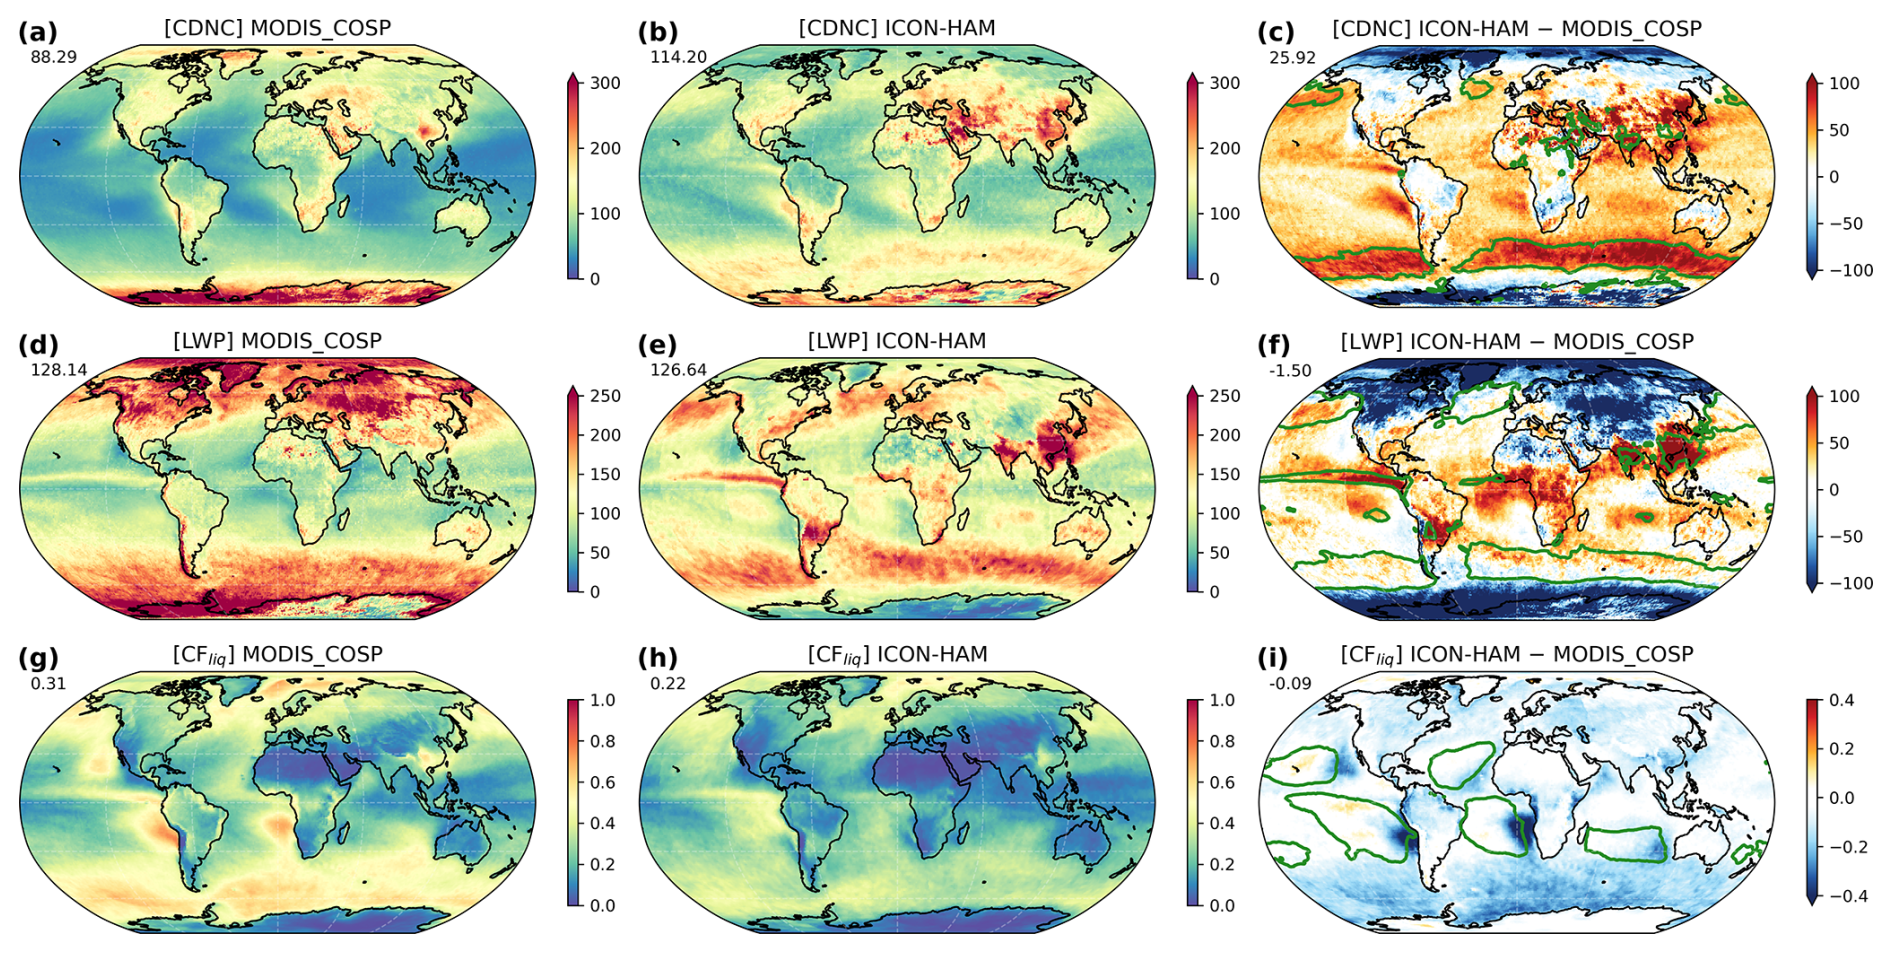
Figure 12As in Fig. 11, but for comparisons of CDNC (top), LWP (middle), and CFliq (bottom) between the ICON–HAM MODIS COSP simulator and the MODIS COSP product.
Strong positive AE biases are broadly found over oceans, particularly over large-scale convergence zones, including the Intertropical Convergence Zone (ITCZ), the South Pacific Convergence Zone (SPCZ), the Indian Ocean Convergence Zone (IOCZ), and the South Atlantic Convergence Zone (SACZ) (Fig. 11i). These regions are characterised by intense moisture transport, active convective cloud formation, and strong precipitation, where precipitation is often biased in models (Giorgetta et al., 2018; Neubauer et al., 2019). Notably, the spatial patten of the positive bias agrees well with that of the parametric uncertainties associated with emissions of DMS (emi_dms) and sea-salt (emi_ss_coarse and emi_ss_expo), as well as convective processes such as cloud-to-rain conversion (conv_cprcon) and entrainment in deep convection (conv_entrpen) (Fig. S13). This coincidence, together with the AOD underestimation over oceans (Fig. 11c), suggests that insufficient coarse-mode sea-salt emissions and overly strong wet scavenging in convective clouds contribute to the AE overestimation. Comparing model bias with parametric uncertainty (Fig. 11i), the green isolines largely enclose regions of high parametric uncertainty, highlighting the potential for reducing AE bias through parameter optimisation in most areas. Nonetheless, part of the convergence zones has a positive bias that cannot be explained by the parametric uncertainty alone, pointing to possible structural deficiencies in the convection parameterisation.
To provide a more direct overview of the parameters driving uncertainty in regions with both large biases and high parametric uncertainty, we repeat the analyses of Fig. 8 considering only locations within the green isolines (Fig. S14). It is shown that the dominant parameters are overall consistent with those inferred from the spatial patterns discussed above, although regional averaging can obscure subregional signals, such as the role of emi_bb_oc over central Africa. These results can inform which parameters may be most useful to constrain observationally for reducing model biases in each region.
3.5.2 Cloud properties
Before comparing the model with MODIS, it is worth noting that MODIS retrievals of cloud microphysics (CDNC and LWP) are less reliable over polar regions and land than over mid-to-low-latitude oceanic regions (Grosvenor et al., 2018).
Figure 12 compares model diagnostics and MODIS observations processed consistently using the COSP simulator. ICON–HAM exhibits positive CDNC biases in most regions, except in polar and some land areas where MODIS cloud retrievals are subject to larger errors (Grosvenor et al., 2018). Over oceans, the largest positive biases occur in high-latitude regions, followed by subtropical eastern ocean stratocumulus decks (Fig. 12a–c). This bias pattern is very similar to the spatial distribution of parametric uncertainties associated with natural emissions of DMS (emi_dms) and sea-salt (emi_ss_acc and emi_ss_expo), as well as activation (activ_aero) and vertical velocity (activ_cwtrub), as shown in Fig. S15. Over land, a pronounced CDNC overestimation is found in China and India, despite an underestimation of AOD (Fig. 11c). This positive bias may be thus attributed to too many fine particles from anthropogenic emissions (emi_cmr_ff) and/or too efficient activation (activ_aero) in the model (Fig. S15). Moreover, the good spatial consistency between mode bias and parametric uncertainty (Fig. 12c), suggests that most of the CDNC bias would be reduced by constraining these uncertain parameters.
For LWP, ICON–HAM shows a large negative bias over high-latitude continents (Fig. 12d–f), yet no parameters can explain this bias patten (Fig. S16). This is most likely attributable to large retrieval errors caused by high solar zenith angles and the presence of mixed-phase clouds (Khanal and Wang, 2018). In contrast, in the remaining regions where LWP retrievals are considered more reliable, the model generally overestimates LWP, particularly in the ITCZ. As shown in Fig. S16, processes of auto-conversion in both stratocumulus and convective clouds and entrainment in deep convection, might be responsible for this bias. Again, most regions with large biases coincide with areas of high parametric uncertainty, whereas the remaining regions are likely influenced by retrieval biases and/or model structural uncertainties. For the locations within the green isolines, the parameter contributions to LWP and CDNC to uncertainties in each region (Fig. S18) are broadly consistent with the spatial correspondence discussed above.
CFliq is underestimated globally by around 25 % (Fig. 12g–i), which is particularly pronounced in regions with persistent low-level cloud decks over subtropical and polar oceans. This may partly explain the weaker ERFaci in offshore stratocumulus regions in ICON–HAM than in other AeroCom and CMIP6 models (Gryspeerdt et al., 2020; Kalisoras et al., 2024). Unlike other properties, the CFliq bias cannot be associated to parametric uncertainty, as evidenced by the little spatial overlap between regions of large bias and those of high uncertainty (Fig. 12i). Instead, structural improvements in cloud parameterisation are required, for example, moving from a RH-based scheme (Sundqvist et al., 1989) to a prognostic cloud cover scheme (Muench and Lohmann, 2020). The underestimation of cloud cover in stratocumulus region has been identified as an inherent issue in ICON 2.6.4 (Grundner et al., 2025), and is expected to be addressed in upcoming versions.
In this study, we constructed a perturbed parameter ensemble (PPE) using the ICON–HAM model, with a focus on aerosol effective radiative forcing. A total of 42 aerosol and cloud parameters were perturbed across 13 parameter categories, including aerosol emissions, optical and hygroscopic properties, deposition, chemistry, activation, cloud microphysics, convection, and turbulence, resulting in an ensemble of 383 members. Gaussian Process emulators were then trained on these 383 members to continuously sample the full parameter space. This work aims to quantify and attribute parametric uncertainties in aerosol effective radiative forcing, to identify observable state variables that have the potential to constrain these uncertainties, and to assess the extent to which model biases can be explained by parametric uncertainty. These insights provide a foundation for subsequent observational constraints.
Prior to the main analyses, we first evaluated the performance of the Gaussian process emulators. The coefficients of determination between predicted and reference global means exceed 0.8 for AOD, AE, CDNC, LWP, and CF, and are only slightly lower for ERFaer (0.76). We note that the emulator shows a positive bias for strongly negative ERFaer, which arises primarily from ACI. Spatial patterns are also very well captured, with relative biases of all properties below 4 % across most regions globally. Overall, our emulator provides a robust representation of the reference simulations in terms of both global mean and spatial distribution. Furthermore, we illustrated that the emulator performance improves with increasing simulations-to-parameters ratio (rsp) but levels off around 8–9. A rsp of 5 is identified as near-optimal because it provides a great balance between accuracy and computational cost, with only marginal improvements at higher values. This result thus offers important guidance for future PPE design, particularly for MMPPE frameworks that involve substantial computational and data storage demands, and suggests that further improvements in emulation accuracy are more likely to come from advances in emulator design rather than increasing ensemble size. For PPEs sampling comparable parameter spaces, and thus subject to similar levels of non-linearity arising from parameter interactions, we would not expect the near-optimal rsp to vary substantially across models. Nevertheless, this assumption will be interesting to test with the upcoming MMPPE.
Parametric uncertainty in aerosol and cloud processes within our emulated PPE leads to 5–95th percentile ranges of [−1.42 to −0.65] W m−2 for ERFaer, [−1.37 to −0.67] W m−2 for ERFaci, and [−0.13 to 0.23] W m−2 for ERFari. ERFaci is uncertain only in magnitude, whereas ERFari is uncertain in both magnitude and sign. Aerosol parameters, particularly those related to emissions, dominate the overall ERFaer uncertainty (80 %). Anthropogenic SO2, natural DMS, and emitted particle size from biomass burning and fossil fuel contribute equally of around 25 % for each. This underscores the central role of PI-to-PD aerosol perturbations in shaping aerosol forcing. Although cloud parameters play a minor role (13 %) globally, convection and entrainment parameters together account for up to ∼ 50 % of the uncertainty in tropical oceans, where deep convection is prominent. As ERFaer is largely driven by ACI, the parameters governing ERFaci uncertainty are similar, but with relatively stronger contributions from DMS emissions and emitted particle size than from anthropogenic SO2 emissions. In contrast, ERFari is largely controlled by absorption-related parameters (60 %), including anthropogenic BC emissions and the refractive indices of BC, OC, and dust, while aerosol scattering associated with anthropogenic SO2 emissions contributes only less than 20 %. Although shipping emissions are an important target for reductions, e.g., through the IMO 2020 regulations (Diamond, 2023), they contribute only a small ERFaer uncertainty (0.01 W m−2) here, mainly due to their smaller magnitude compared with other anthropogenic emission sectors and the underestimated marine cloud cover limiting their effect through ACI in our model.
Our PPE suggests that aerosol parameters contribute much more strongly than cloud parameters to the ERFaer uncertainty. Nevertheless, this conclusion is expected to depend on the choice of perturbed parameters. Regayre et al. (2018) and Yoshioka et al. (2019) likewise found a stronger influence of aerosol parameters on ERFaer than cloud parameters in HadGEM. In contrast, studies using CAM6 (Gettelman et al., 2024) and E3SM (Nugent et al., 2026) reported that cloud parameters contribute more strongly than aerosol parameters. This is partly because our PPE scales the autoconversion rate itself, whereas the CAM6 and E3SM PPEs scale the exponent. In addition, we included a relatively large number of aerosol parameters associated with anthropogenic and natural emissions, which exert a first-order control on PD–PI aerosol changes. These contrasting results again highlight the need for MMPPE experiments, in which different models perturb a consistent set of parameters.
When comparing ERFaer uncertainties across different PPE studies (Fig. 5), it is also important to recognise that these uncertainties are often defined in different contexts and are therefore not directly comparable. These contexts include (i) unconstrained ranges derived from uniform parameter distributions within expert-elicited bounds, (ii) expert-constrained ranges based on prior knowledge of parameter probability distributions, and (iii) observation-constrained ranges obtained by sub-selecting plausible members from an initial unconstrained ensemble in (i) using observational data. In this study, we compare our PPE only with estimates not yet constrained by observations.
As for present-day properties, the global AOD uncertainty is driven by natural emissions (DMS, sea-salt, and dust) (50 %) and aerosol removal processes (conversion of convective cloud water to rain and in-cloud wet deposition) (40 %). The effect of anthropogenic emissions is only visible in major industrial regions (EUR and ASI), with little global influence. Natural aerosol emissions account for more than 70 % of the AE uncertainty, with coarse-mode sea-salt being the largest contributor (about 30 %), while absorption-related parameters collectively explain about 80 % of AAOD uncertainty. The dominance of natural aerosols in AOD and AE uncertainty is partly due to the wide spatial extent of sea-salt and DMS emissions. Notably, there are common drivers of PD aerosol properties and aerosol forcing, indicating some potential for constraining ERFaer. For example, AOD and AE share the parameters related to DMS emissions (emi_dms) and convective cloud water-to-rain conversion (conv_cprcon) with ERFaci, while AAOD shares the parameters related to refractive indices of BC (rad_bc_ni), OC (rad_oc_ni), and dust (rad_du_ni), and anthropogenic BC emissions (emi_ant_bc) with ERFari. Through modulating aerosol removal and regeneration from cloud processing, convection parameters can exert a considerable effect on aerosol properties, highlighting the importance of simultaneously perturbing aerosol and cloud parameters to account for their strong interactions.
Uncertainty in CDNC arises from both aerosol and cloud parameters, including those controlling CCN concentrations (natural aerosol emissions, deposition, and chemistry; 35 %), the activation scheme (33 %), and updraft velocity (14 %). In contrast, LWP and CFliq are dominated by cloud parameters controlling microphysics, convection, and entrainment, with aerosol parameters accounting for merely 5 % of LWP uncertainty and virtually zero for CFliq. These three cloud properties collectively share three driving parameters with aerosol forcing (emi_dms, conv_cprcon, and conv_cmfctop), underscoring their value for constraining the ERFaer uncertainty.
To further clarify which PD observations can best constrain PI-to-PD forcing, we systematically assessed the constraint potential of commonly observed aerosol and cloud properties from both satellite and ground-based measurements. The sensitivity of model outputs to parameters revealed that many PD observables share dominant causes of uncertainty with ACI and ARI forcing, mainly through the processes of natural and anthropogenic emissions, aerosol absorption, and cloud convection, suggesting a strong potential for constraint by existing measurements. Specifically, the uncertain parameters dominating ERFari could be constrained using the observations of aerosol absorption (e.g., AAOD, SSA) and fine-mode aerosol amount (e.g., AI, CCNBL0.3 and CCNS0.3). For ERFaci, most controlling parameters can likewise be constrained by a range of aerosol and cloud observations that are readily obtained from space with global coverage (e.g., Fnet, , LWP, CFliq, AOD, AI, AE, AAOD, AODf, AODci, and AODcs). An exception is emitted particle size that particularly requires surface-level measurements of CCN and BC concentrations. With multiple PD observables showing constraint potential, the key challenge lies in prioritising those with lower measurement errors, denser spatial and temporal sampling, and, potentially, those less affected by model internal inconsistencies that may result in failed constraints (Regayre et al., 2023). On the other hand, knowledge on conflicting constraints from diverse PD observables characterising different physical processes, are also valuable in a way that helps expose potential model deficiencies (Prévost et al., 2026).
Comparison against SPEXone and MODIS–COSP observations shows a strong spatial correspondence between model biases and parametric uncertainties in key aerosol and cloud quantities. This suggests that much of the detected biases in our model could be mitigated through appropriate parameter optimisation (observational constraints). However, notable exceptions remain in regions where model biases cannot be attributed to parametric uncertainty. For example, the strong underestimation of LWP over high-latitude continents may partly reflect less reliable satellite retrievals in these regions, while the widespread negative CFliq biases in stratocumulus regions are more likely linked to deficiencies in cloud cover parameterisation in the current ICON–HAM version. The current RH-based cloud cover scheme is a simplification (Sundqvist et al., 1989) and a prognostic cloud cover scheme may help reduce these biases (Muench and Lohmann, 2020).
Overall, the range of behaviour captured by the ICON–HAM PPE underscores the value of PPE framework for investigating complex interactions among aerosol, cloud and radiation by tracking back their driving processes. Although observational constraints are beyond the scope of this study, the systematic identification of common causes in uncertainties of PD observables and PI-to-PD state changes provides a pathway toward more causally robust constraints on ERFaer. Our PPE also offers a foundation for future ICON–HAM development, particularly in refining uncertain aerosol and cloud representations, and the outcomes are likely applicable to higher-resolution model configurations with similar microphysics schemes (Weiss et al., 2025).
Improving model skill in simulating aerosol forcing and predicting future climate requires a better understanding of both parametric and structural uncertainties, which calls for coordinated progress across observational and modeling communities:
-
Additional measurement types are needed, especially those directly linked to emitted particle size (Regayre et al., 2018; Zhong et al., 2024; Bhatti et al., 2026), which remains weakly constrained by existing observations. Moreover, robust estimates of observational uncertainty are essential for appropriately weighting diverse observations in the constraint process, and for disentangling structural model deficiencies from observational errors (Regayre et al., 2023; Prévost et al., 2026). Such pixel-level uncertainty information is, however, available for only a few observational products, for example SPEXone (Fu et al., 2025), highlighting a clear need for systematic and consistent uncertainty reporting by the observational community.
-
Accordingly, more elaborate constraint frameworks are required to explicitly account for these observational uncertainties that differ in different products, which would help reduce inconsistencies as additional measurements are included (Johnson et al., 2020; Regayre et al., 2026) and yield more robust constraints on ERFaer through maximal use of existing observations.
-
ERFaer uncertainties from different PPEs are not readily comparable due to differences in experimental setup (Fig. 5), making it difficult to separate parametric and structural model uncertainties. To tackle this issue, a coordinated multi-model PPE framework is needed (Carslaw et al., 2026) and is currently being developed within CMIP7 and AeroCom Phase 4 under the ACI-PPEMIP initiative (https://wcrp-cmip.org/mips/, last access: July 2026), largely building on the ICON–HAM protocol presented here. Such a framework would enable significant advances in climate projection skill beyond what can be achieved with single-model PPEs.
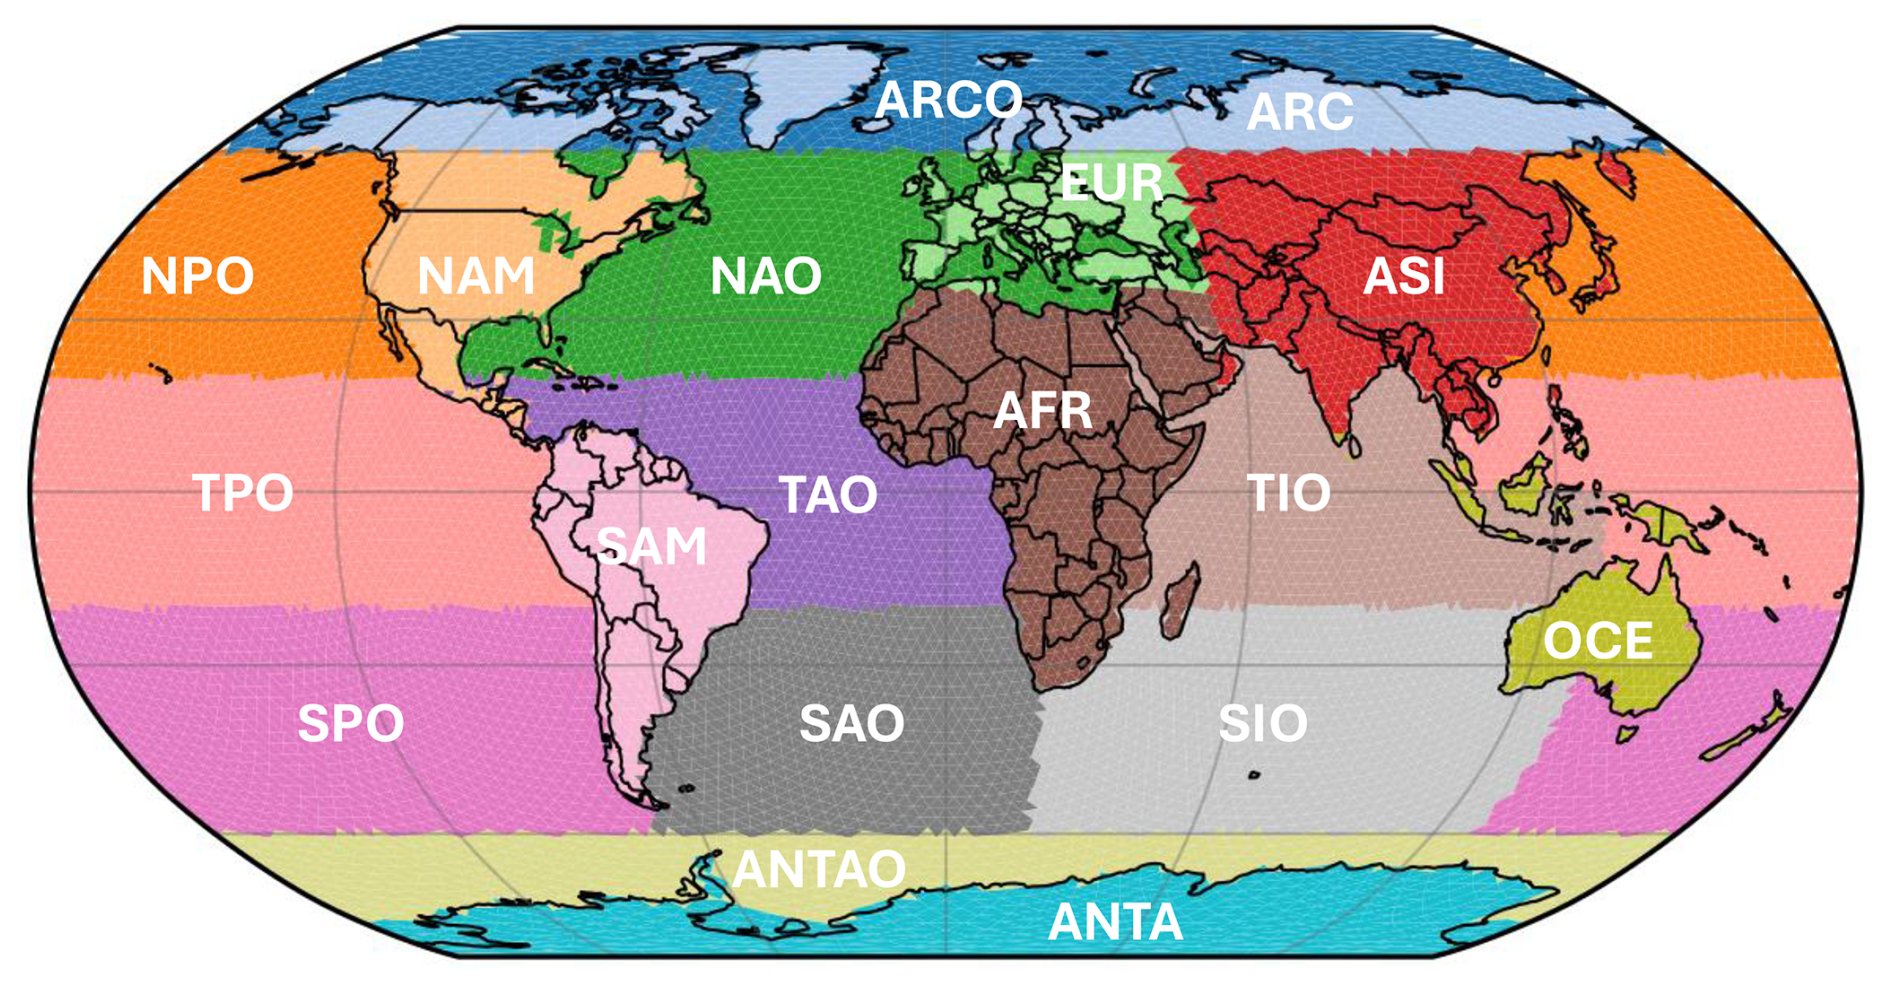
Figure A1Definition of the 18 regions adopted from Jia et al. (2021).
The official remote repository for the ICON–HAM code is hosted on a GitLab server at ETHZ (see https://redmine.hammoz.ethz.ch/, last access: February 2026). The trained Gaussian Process emulators, together with the auxiliary files and example code required to run them, are publicly available on Zenodo: https://doi.org/10.5281/zenodo.22780345 (Jia, 2026). The emulators can be used directly to generate predictions without the need for retraining.
The SPEXone observations can be found at https://public.spider.surfsara.nl/project/spexone/RemoTAP-SPEXone-GRIDDED/ (Fu et al., 2025). The MODIS COSP daily level-3 dataset (MCD06COSP) is available from the Atmosphere Archive and Distribution System (LAADS) Distributed Active Archive Center (DAAC): https://ladsweb.modaps.eosdis.nasa.gov/archive/allData/62/MCD06COSP_D3_MODIS/ (last access: February 2026; Pincus et al., 2023). The ESEm code used to emulate the simulations is available at https://doi.org/10.5281/zenodo.5466563 (Watson-Parris et al., 2021b; Watson-Parris et al., 2021a). The CIS source code used to collocate the model outputs and observations is available at GitHub at https://github.com/cedadev/cis (last access: July 2026; Watson-Parris et al., 2016). The full PPE dataset (∼ 90 TB) is too large for public repository hosting and is available upon reasonable request from the corresponding author.
The supplement related to this article is available online at https://doi.org/10.5194/acp-26-16067-2026-supplement.
HJ implemented the PPE framework into ICON–HAM, carried out the simulations and analyses, and wrote the manuscript with inputs from all co-authors. DN implemented and evaluated the nudging in ICON–HAM. YB, DWP, PS, and OH assisted with the PPE configuration and the use of satellite data. DP helped to implement the revised ARG activation scheme. AK and AA prepared the model input data. All co-authors contributed their expertise to defining parameter perturbations.
At least one of the (co-)authors is a member of the editorial board of Atmospheric Chemistry and Physics. The peer-review process was guided by an independent editor, and the authors also have no other competing interests to declare.
Publisher's note: Copernicus Publications remains neutral with regard to jurisdictional claims made in the text, published maps, institutional affiliations, or any other geographical representation in this paper. The authors bear the ultimate responsibility for providing appropriate place names. Views expressed in the text are those of the authors and do not necessarily reflect the views of the publisher.
This research was funded by the Horizon Europe program through the project CleanCloud (GA 101137639), by the European Space Agency through the project AIRSENSE (ESA Contract No. 4000142902/23/I-NS), and by the Dutch Research Council (NWO) through the project ACIaction (file no. OCENW.M.24.024; https://doi.org/10.61686/OZRJI30024). The PPE simulations were supported by the Dutch national e-infrastructure, with computing resources provided by the SURF Cooperative under the project “Constraining uncertainty in aerosols and their radiative forcing in climate models” (file no. NWO-2025.001; https://doi.org/10.61686/GFDZV21958). The ICON-HAM model is developed by a consortium composed of ETH Zurich, the Center for Climate Systems Modeling (C2SM), Max Planck Institut für Meteorologie, Forschungszentrum Jülich, University of Oxford, the Finnish Meteorological Institute and the Leibniz Institute for Tropospheric Research (TROPOS), and managed by TROPOS.
This research has been supported by the HORIZON EUROPE Climate, Energy and Mobility, HORIZON EUROPE Excellent Science (grant no. 101137639), the Nederlandse Organisatie voor Wetenschappelijk Onderzoek, Exacte en Natuurwetenschappen (grant nos. OCENW.M.24.024 and NWO-2025.001), and the European Space Agency (grant no. 4000142902/23/I-NS).
This paper was edited by Xiaohong Liu and reviewed by Michael Diamond and one anonymous referee.
Abdul-Razzak, H. and Ghan, S. J.: A parameterization of aerosol activation: 2. Multiple aerosol types, J. Geophys. Res.-Atmos., 105, 6837–6844, https://doi.org/10.1029/1999JD901161, 2000. a
Allen, M.: Do-it-yourself climate prediction, Nature, 401, 642–642, https://doi.org/10.1038/44266, 1999. a
Bauer, S. E., Mishchenko, M. I., Lacis, A. A., Zhang, S., Perlwitz, J., and Metzger, S. M.: Do sulfate and nitrate coatings on mineral dust have important effects on radiative properties and climate modeling?, J. Geophys. Res.-Atmos., 112, https://doi.org/10.1029/2005JD006977, 2007. a
Bellouin, N., Quaas, J., Gryspeerdt, E., Kinne, S., Stier, P., Watson-Parris, D., Boucher, O., Carslaw, K. S., Christensen, M., Daniau, A., Dufresne, J., Feingold, G., Fiedler, S., Forster, P., Gettelman, A., Haywood, J. M., Lohmann, U., Malavelle, F., Mauritsen, T., McCoy, D. T., Myhre, G., Mülmenstädt, J., Neubauer, D., Possner, A., Rugenstein, M., Sato, Y., Schulz, M., Schwartz, S. E., Sourdeval, O., Storelvmo, T., Toll, V., Winker, D., and Stevens, B.: Bounding Global Aerosol Radiative Forcing of Climate Change, Rev. Geophys., 58, e2019RG000660, https://doi.org/10.1029/2019RG000660, 2020. a, b
Bhatti, Y. A., Watson-Parris, D., Regayre, L. A., Jia, H., Neubauer, D., Im, U., Svenhag, C., Schutgens, N., Tsikerdekis, A., Nenes, A., Irfan, M., van Diedenhoven, B., Arifi, A., Fu, G., and Hasekamp, O. P.: Uncertainty in aerosol effective radiative forcing from anthropogenic and natural aerosol parameters in ECHAM6.3-HAM2.3, Atmos. Chem. Phys., 26, 269–293, https://doi.org/10.5194/acp-26-269-2026, 2026. a, b, c, d, e, f, g, h, i, j, k, l, m, n, o, p
Bodas-Salcedo, A., Webb, M. J., Bony, S., Chepfer, H., Dufresne, J.-L., Klein, S. A., Zhang, Y., Marchand, R., Haynes, J. M., Pincus, R., and John, V. O.: COSP: Satellite simulation software for model assessment, B. Am. Meteorol. Soc., 92, 1023–1043, https://doi.org/10.1175/2011BAMS2856.1, 2011. a
Bond, T. C. and Bergstrom, R. W.: Light Absorption by Carbonaceous Particles: An Investigative Review, Aerosol Sci. Technol., 40, 27–67, https://doi.org/10.1080/02786820500421521, 2006. a
Boucher, O., Randall, D., Artaxo, P., Bretherton, C., Feingold, G., Forster, P., Kerminen, V.-M., Kondo, Y., Liao, H., Lohmann, U., Rasch, P., Satheesh, S., Sherwood, S., Stevens, B., and Zhang, X.: Clouds and Aerosols, in: Climate Change 2013: The Physical Science Basis. Contribution of Working Group I to the Fifth Assessment Report of the Intergovernmental Panel on Climate Change, edited by: Stocker, T., Qin, D., Plattner, G.-K., Tignor, M., Allen, S., Boschung, J., Nauels, A., Xia, Y., Bex, V., and Midgley, P., chap. 7, Cambridge University Press, Cambridge, UK and New York, NY, USA, pp. 571–658, https://doi.org/10.1017/CBO9781107415324.016, 2013. a
Brown, H. Y., McCoy, D. T., Nugent, J. M., Wang, H., Wu, M., Zhang, K., and Burrows, S. M.: Sensitivity of Anthropogenic Cloud Droplet Number Change to Preindustrial Emission Inventories and Physics Parameterizations, Geophys. Res. Lett., 53, e2025GL121443, https://doi.org/10.1029/2025GL121443, 2026. a
Carslaw, K. S., Lee, L. A., Reddington, C. L., Pringle, K. J., Rap, A., Forster, P. M., Mann, G. W., Spracklen, D. V., Woodhouse, M. T., Regayre, L. A., and Pierce, J. R.: Large contribution of natural aerosols to uncertainty in indirect forcing, Nature, 503, 67–71, https://doi.org/10.1038/nature12674, 2013. a, b
Carslaw, K. S., Regayre, L. A., Proske, U., Gettelman, A., Sexton, D. M. H., Qian, Y., Marshall, L. R., Wild, O., van Lier-Walqui, M., Oertel, A., Peatier, S., Yang, B., Johnson, J. S., Li, S., McCoy, D. T., Sanderson, B. M., Williamson, C. J., Elsaesser, G. S., Yamazaki, K., and Booth, B. B. B.: Opinion: The importance and future development of perturbed parameter ensembles in climate and atmospheric science, Atmos. Chem. Phys., 26, 4651–4667, https://doi.org/10.5194/acp-26-4651-2026, 2026. a, b, c, d
Chen, Y., Haywood, J., Wang, Y., Malavelle, F., Jordan, G., Partridge, D., Fieldsend, J., De Leeuw, J., Schmidt, A., Cho, N., Oreopoulos, L., Platnick, S., Grosvenor, D., Field, P., and Lohmann, U.: Machine learning reveals climate forcing from aerosols is dominated by increased cloud cover, Nat. Geosci., 15, 609–614, https://doi.org/10.1038/s41561-022-00991-6, 2022. a
Diamond, M. S.: Detection of large-scale cloud microphysical changes within a major shipping corridor after implementation of the International Maritime Organization 2020 fuel sulfur regulations, Atmos. Chem. Phys., 23, 8259–8269, https://doi.org/10.5194/acp-23-8259-2023, 2023. a
Duffy, M. L., Medeiros, B., Gettelman, A., and Eidhammer, T.: Perturbing Parameters to Understand Cloud Contributions to Climate Change, J. Climate, 37, 213–227, https://doi.org/10.1175/JCLI-D-23-0250.1, 2024. a
Durack, P. J., Taylor, K. E., Gleckler, P. J., Meehl, G. A., Lawrence, B. N., Covey, C., Stouffer, R. J., Levavasseur, G., Ben-Nasser, A., Denvil, S., Stockhause, M., Gregory, J. M., Juckes, M., Ames, S. K., Antonio, F., Bader, D. C., Dunne, J. P., Ellis, D., Eyring, V., Fiore, S. L., Joussaume, S., Kershaw, P., Lamarque, J.-F., Lautenschlager, M., Lee, J., Mauzey, C. F., Mizielinski, M., Nassisi, P., Nuzzo, A., O’Rourke, E., Painter, J., Potter, G. L., Rodriguez, S., and Williams, D. N.: The Coupled Model Intercomparison Project (CMIP): Reviewing project history, evolution, infrastructure and implementation, EGUsphere [preprint], https://doi.org/10.5194/egusphere-2024-3729, 2025. a
Duran, B. M., Wall, C. J., Lutsko, N. J., Michibata, T., Ma, P.-L., Qin, Y., Duffy, M. L., Medeiros, B., and Debolskiy, M.: A new method for diagnosing effective radiative forcing from aerosol–cloud interactions in climate models, Atmos. Chem. Phys., 25, 2123–2146, https://doi.org/10.5194/acp-25-2123-2025, 2025. a
Eidhammer, T., Gettelman, A., Thayer-Calder, K., Watson-Parris, D., Elsaesser, G., Morrison, H., van Lier-Walqui, M., Song, C., and McCoy, D.: An extensible perturbed parameter ensemble for the Community Atmosphere Model version 6, Geosci. Model Dev., 17, 7835–7853, https://doi.org/10.5194/gmd-17-7835-2024, 2024. a, b, c, d, e, f, g, h, i
Elsaesser, G. S., van Lier-Walqui, M., Yang, Q., Kelley, M., Ackerman, A. S., Fridlind, A. M., Cesana, G. V., Schmidt, G. A., Wu, J., Behrangi, A., Camargo, S. J., De, B., Inoue, K., Leitmann-Niimi, N. M., and Strong, J. D. O.: Using Machine Learning to Generate a GISS ModelE Calibrated Physics Ensemble (CPE), J. Adv. Model. Earth Sy., 17, e2024MS004713, https://doi.org/10.1029/2024MS004713, 2025. a
Fan, S.-M., Horowitz, L. W., Levy II, H., and Moxim, W. J.: Impact of air pollution on wet deposition of mineral dust aerosols, Geophys. Res. Lett., 31, https://doi.org/10.1029/2003GL018501, 2004. a
Forster, P., Storelvmo, T., Armour, K., Collins, W., Dufresne, J.-L., Frame, D., Lunt, D., Mauritsen, T., Palmer, M., Watanabe, M., Wild, M., and Zhang, H.: The Earth's Energy Budget, Climate Feedbacks, and Climate Sensitivity, in: Climate Change 2021: The Physical Science Basis. Contribution of Working Group I to the Sixth Assessment Report of the Intergovernmental Panel on Climate Change, chap. 7, edited by: Masson-Delmotte, V., Zhai, P., Pirani, A., Connors, S., Péan, C., Berger, S., Caud, N., Chen, Y., Goldfarb, L., Gomis, M., Huang, M., Leitzell, K., Lonnoy, E., Matthews, J., Maycock, T., Waterfield, T., Yelekçi, O., Yu, R., and Zhou, B., Cambridge University Press, Cambridge, UK and New York, NY, USA, pp. 923–1054, https://doi.org/10.1017/9781009157896.009, 2021. a, b, c, d, e, f, g
Franke, H. and Giorgetta, M. A.: Toward the Direct Simulation of the Quasi-Biennial Oscillation in a Global Storm-Resolving Model, J. Adv. Model. Earth Sy., 16, e2024MS004381, https://doi.org/10.1029/2024MS004381, 2024. a
Fu, G., Hasekamp, O., Rietjens, J., Smit, M., Di Noia, A., Cairns, B., Wasilewski, A., Diner, D., Seidel, F., Xu, F., Knobelspiesse, K., Gao, M., da Silva, A., Burton, S., Hostetler, C., Hair, J., and Ferrare, R.: Aerosol retrievals from different polarimeters during the ACEPOL campaign using a common retrieval algorithm, Atmos. Meas. Tech., 13, 553–573, https://doi.org/10.5194/amt-13-553-2020, 2020. a
Fu, G., Rietjens, J., Laasner, R., van der Schaaf, L., van Hees, R., Yuan, Z., van Diedenhoven, B., Hannadige, N., Landgraf, J., Smit, M., Knobelspiesse, K., Cairns, B., Gao, M., Franz, B., Werdell, J., and Hasekamp, O.: Aerosol Retrievals From SPEXone on the NASA PACE Mission: First Results and Validation, Geophys. Res. Lett., 52, e2024GL113525, https://doi.org/10.1029/2024GL113525, 2025 (data available at: https://public.spider.surfsara.nl/project/spexone/RemoTAP-SPEXone-GRIDDED/, last access: February 2026). a, b, c
Fu, G., Lu, S., Gao, M., Rietjens, J., and Hasekamp, O.: Collaborative Neural Networks Significantly Improve Global Aerosol Retrievals From Multiangle Polarimeters, IEEE T. Geosci. Remote, 64, 4107019–4107019, https://doi.org/10.1109/TGRS.2026.3685881, 2026. a
Gettelman, A., Eidhammer, T., Duffy, M. L., McCoy, D. T., Song, C., and Watson-Parris, D.: The Interaction Between Climate Forcing and Feedbacks, J. Geophys. Res.-Atmos., 129, e2024JD040857, https://doi.org/10.1029/2024JD040857, 2024. a, b, c
Ghan, S. J.: Technical Note: Estimating aerosol effects on cloud radiative forcing, Atmos. Chem. Phys., 13, 9971–9974, https://doi.org/10.5194/acp-13-9971-2013, 2013. a, b, c, d
Ghosh, P., Evans, K. J., Grosvenor, D. P., Kang, H.-G., Mahajan, S., Xu, M., Zhang, W., and Gordon, H.: Assessing modifications to the Abdul-Razzak and Ghan aerosol activation parameterization (version ARG2000) to improve simulated aerosol–cloud radiative effects in the UK Met Office Unified Model (UM version 13.0), Geosci. Model Dev., 18, 4899–4913, https://doi.org/10.5194/gmd-18-4899-2025, 2025. a, b, c, d
Giorgetta, M. A., Brokopf, R., Crueger, T., Esch, M., Fiedler, S., Helmert, J., Hohenegger, C., Kornblueh, L., Köhler, M., Manzini, E., Mauritsen, T., Nam, C., Raddatz, T., Rast, S., Reinert, D., Sakradzija, M., Schmidt, H., Schneck, R., Schnur, R., Silvers, L., Wan, H., Zängl, G., and Stevens, B.: ICON-A, the Atmosphere Component of the ICON Earth System Model: I. Model Description, J. Adv. Model. Earth Sy., 10, 1613–1637, https://doi.org/10.1029/2017MS001242, 2018. a, b, c
Gliß, J., Mortier, A., Schulz, M., Andrews, E., Balkanski, Y., Bauer, S. E., Benedictow, A. M. K., Bian, H., Checa-Garcia, R., Chin, M., Ginoux, P., Griesfeller, J. J., Heckel, A., Kipling, Z., Kirkevåg, A., Kokkola, H., Laj, P., Le Sager, P., Lund, M. T., Lund Myhre, C., Matsui, H., Myhre, G., Neubauer, D., van Noije, T., North, P., Olivié, D. J. L., Rémy, S., Sogacheva, L., Takemura, T., Tsigaridis, K., and Tsyro, S. G.: AeroCom phase III multi-model evaluation of the aerosol life cycle and optical properties using ground- and space-based remote sensing as well as surface in situ observations, Atmos. Chem. Phys., 21, 87–128, https://doi.org/10.5194/acp-21-87-2021, 2021. a, b, c, d
Gong, S. L.: A parameterization of sea-salt aerosol source function for sub- and super-micron particles, Global Biogeochem. Cy., 17, https://doi.org/10.1029/2003GB002079, 2003. a
Grosvenor, D. P., Sourdeval, O., Zuidema, P., Ackerman, A., Alexandrov, M. D., Bennartz, R., Boers, R., Cairns, B., Chiu, J. C., Christensen, M., Deneke, H., Diamond, M., Feingold, G., Fridlind, A., Hünerbein, A., Knist, C., Kollias, P., Marshak, A., McCoy, D., Merk, D., Painemal, D., Rausch, J., Rosenfeld, D., Russchenberg, H., Seifert, P., Sinclair, K., Stier, P., van Diedenhoven, B., Wendisch, M., Werner, F., Wood, R., Zhang, Z., and Quaas, J.: Remote Sensing of Droplet Number Concentration in Warm Clouds: A Review of the Current State of Knowledge and Perspectives, Rev. Geophys., 56, 409–453, https://doi.org/10.1029/2017RG000593, 2018. a, b
Grundner, A., Beucler, T., Savre, J., Lauer, A., Schlund, M., and Eyring, V.: Reduced Cloud Cover Errors in a Hybrid AI-climate Model through Equation Discovery and Automatic Tuning, Sci. Rep., 15, 43836, https://doi.org/10.1038/s41598-025-29155-3, 2025. a
Gryspeerdt, E., Quaas, J., Ferrachat, S., Gettelman, A., Ghan, S., Lohmann, U., Morrison, H., Neubauer, D., Partridge, D. G., Stier, P., Takemura, T., Wang, H., Wang, M., and Zhang, K.: Constraining the instantaneous aerosol influence on cloud albedo, P. Natl. Acad. Sci. USA, 114, 4899–4904, https://doi.org/10.1073/pnas.1617765114, 2017. a
Gryspeerdt, E., Mülmenstädt, J., Gettelman, A., Malavelle, F. F., Morrison, H., Neubauer, D., Partridge, D. G., Stier, P., Takemura, T., Wang, H., Wang, M., and Zhang, K.: Surprising similarities in model and observational aerosol radiative forcing estimates, Atmos. Chem. Phys., 20, 613–623, https://doi.org/10.5194/acp-20-613-2020, 2020. a, b, c
Hamilton, D. S., Hantson, S., Scott, C. E., Kaplan, J. O., Pringle, K. J., Nieradzik, L. P., Rap, A., Folberth, G. A., Spracklen, D. V., and Carslaw, K. S.: Reassessment of pre-industrial fire emissions strongly affects anthropogenic aerosol forcing, Nat. Commun., 9, 3182, https://doi.org/10.1038/s41467-018-05592-9, 2018. a
Hasekamp, O., Litvinov, P., Fu, G., Chen, C., and Dubovik, O.: Algorithm evaluation for polarimetric remote sensing of atmospheric aerosols, Atmos. Meas. Tech., 17, 1497–1525, https://doi.org/10.5194/amt-17-1497-2024, 2024. a
Hasekamp, O. P., Fu, G., Rusli, S. P., Wu, L., Di Noia, A., aan de Brugh, J., Landgraf, J., Martijn Smit, J., Rietjens, J., and van Amerongen, A.: Aerosol measurements by SPEXone on the NASA PACE mission: expected retrieval capabilities, J. Quant. Spectrosc. Ra., 227, 170–184, https://doi.org/10.1016/j.jqsrt.2019.02.006, 2019a. a
Hasekamp, O. P., Gryspeerdt, E., and Quaas, J.: Analysis of polarimetric satellite measurements suggests stronger cooling due to aerosol-cloud interactions, Nat. Commun., 10, 5405, https://doi.org/10.1038/s41467-019-13372-2, 2019b. a
Henkes, A., Jia, H., Kretzschmar, J., Hörnig, S., and Quaas, J.: Hemispheric Contrast in Aerosol-Cloud Interactions: An Attempt for Detection and Attribution, Tellus B, https://doi.org/10.16993/tellusb.1886, 2025. a
Hoesly, R. M., Smith, S. J., Feng, L., Klimont, Z., Janssens-Maenhout, G., Pitkanen, T., Seibert, J. J., Vu, L., Andres, R. J., Bolt, R. M., Bond, T. C., Dawidowski, L., Kholod, N., Kurokawa, J.-I., Li, M., Liu, L., Lu, Z., Moura, M. C. P., O'Rourke, P. R., and Zhang, Q.: Historical (1750–2014) anthropogenic emissions of reactive gases and aerosols from the Community Emissions Data System (CEDS), Geosci. Model Dev., 11, 369–408, https://doi.org/10.5194/gmd-11-369-2018, 2018. a, b
Hoose, C., Lohmann, U., Bennartz, R., Croft, B., and Lesins, G.: Global simulations of aerosol processing in clouds, Atmos. Chem. Phys., 8, 6939–6963, https://doi.org/10.5194/acp-8-6939-2008, 2008. a
Hoose, C., Kristjánsson, J. E., Iversen, T., Kirkevåg, A., Seland, Ø., and Gettelman, A.: Constraining cloud droplet number concentration in GCMs suppresses the aerosol indirect effect, Geophys. Res. Lett., 36, https://doi.org/10.1029/2009GL038568, 2009. a
Iacono, M. J., Delamere, J. S., Mlawer, E. J., Shephard, M. W., Clough, S. A., and Collins, W. D.: Radiative forcing by long-lived greenhouse gases: Calculations with the AER radiative transfer models, J. Geophys. Res.-Atmos., 113, https://doi.org/10.1029/2008JD009944, 2008. a
Im, U., Samset, B. H., Nenes, A., Thomas, J. L., Kokkola, H., Dubovik, O., Amiridis, V., Arola, A., Bellouin, N., Benedetti, A., Bilde, M., Blichner, S., Decesari, S., Ekman, A. M. L., García-Pando, C. P., Gross, S., Gryspeerdt, E., Hasekamp, O., Kahn, R. A., Laakso, A., Lohmann, U., Marelle, L., Massling, A. H., Myhre, C. L., Pöhlker, M., Quaas, J., Raatikainen, T., Riipinen, I., Schmale, J., Seifert, P., Skov, H., Smith, C., Sporre, M. K., Stier, P., Storelvmo, T., Tsigaridis, K., van Diedenhoven, B., Virtanen, A., Wandinger, U., Wilcox, L. J., and Zieger, P.: Aerosol-Cloud Interactions: Overcoming a Barrier to Projecting Near-Term Climate Evolution and Risk, AGU Adv., 7, e2025AV001872, https://doi.org/10.1029/2025AV001872, 2026. a
Jia, H.: Trained Gaussian Process emulators for the ICON-HAM perturbed parameter ensemble (PPE), Zenodo [software], https://doi.org/10.5281/zenodo.22780345, 2026. a
Jia, H. and Quaas, J.: Nonlinearity of the cloud response postpones climate penalty of mitigating air pollutißon in polluted regions, Nat. Clim. Change, 13, 943–950, https://doi.org/10.1038/s41558-023-01775-5, 2023. a, b, c
Jia, H., Ma, X., Yu, F., and Quaas, J.: Significant underestimation of radiative forcing by aerosol–cloud interactions derived from satellite-based methods, Nat. Commun., 12, 3649, https://doi.org/10.1038/s41467-021-23888-1, 2021. a
Jia, H., Quaas, J., Kroese, W., van Diedenhoven, B., Gryspeerdt, E., Böhm, C., Block, K., and Hasekamp, O.: Optimal choice of proxy for cloud condensation nuclei reduces uncertainty in aerosol-cloud-climate forcing, Sci. Adv., 12, eaea4828, https://doi.org/10.1126/sciadv.aea4828, 2026. a, b
Johnson, J. S., Regayre, L. A., Yoshioka, M., Pringle, K. J., Turnock, S. T., Browse, J., Sexton, D. M. H., Rostron, J. W., Schutgens, N. A. J., Partridge, D. G., Liu, D., Allan, J. D., Coe, H., Ding, A., Cohen, D. D., Atanacio, A., Vakkari, V., Asmi, E., and Carslaw, K. S.: Robust observational constraint of uncertain aerosol processes and emissions in a climate model and the effect on aerosol radiative forcing, Atmos. Chem. Phys., 20, 9491–9524, https://doi.org/10.5194/acp-20-9491-2020, 2020. a, b, c, d, e
Kahn, R. A., Andrews, E., Brock, C. A., Chin, M., Feingold, G., Gettelman, A., Levy, R. C., Murphy, D. M., Nenes, A., Pierce, J. R., Popp, T., Redemann, J., Sayer, A. M., da Silva, A. M., Sogacheva, L., and Stier, P.: Reducing Aerosol Forcing Uncertainty by Combining Models With Satellite and Within-The-Atmosphere Observations: A Three-Way Street, Rev. Geophys., 61, e2022RG000796, https://doi.org/10.1029/2022RG000796, 2023. a
Kalisoras, A., Georgoulias, A. K., Akritidis, D., Allen, R. J., Naik, V., Kuo, C., Szopa, S., Nabat, P., Olivié, D., van Noije, T., Le Sager, P., Neubauer, D., Oshima, N., Mulcahy, J., Horowitz, L. W., and Zanis, P.: Decomposing the effective radiative forcing of anthropogenic aerosols based on CMIP6 Earth system models, Atmos. Chem. Phys., 24, 7837–7872, https://doi.org/10.5194/acp-24-7837-2024, 2024. a
Khanal, S. and Wang, Z.: Uncertainties in MODIS-Based Cloud Liquid Water Path Retrievals at High Latitudes Due to Mixed-Phase Clouds and Cloud Top Height Inhomogeneity, J. Geophys. Res.-Atmos., 123, 11,154–11,172, https://doi.org/10.1029/2018JD028558, 2018. a
Kinne, S., Schulz, M., Textor, C., Guibert, S., Balkanski, Y., Bauer, S. E., Berntsen, T., Berglen, T. F., Boucher, O., Chin, M., Collins, W., Dentener, F., Diehl, T., Easter, R., Feichter, J., Fillmore, D., Ghan, S., Ginoux, P., Gong, S., Grini, A., Hendricks, J., Herzog, M., Horowitz, L., Isaksen, I., Iversen, T., Kirkevåg, A., Kloster, S., Koch, D., Kristjansson, J. E., Krol, M., Lauer, A., Lamarque, J. F., Lesins, G., Liu, X., Lohmann, U., Montanaro, V., Myhre, G., Penner, J., Pitari, G., Reddy, S., Seland, O., Stier, P., Takemura, T., and Tie, X.: An AeroCom initial assessment – optical properties in aerosol component modules of global models, Atmos. Chem. Phys., 6, 1815–1834, https://doi.org/10.5194/acp-6-1815-2006, 2006. a, b
Klamt, J., Schwabe, M., Lauer, A., Giorgetta, M. A., Mauritsen, T., and Eyring, V.: A Machine Learning-based Planetary Boundary Layer Height Scheme for ICON-A Learned from Vertically Highly Resolved Simulations, ESS Open Archive, 2025, https://doi.org/10.22541/essoar.176676912.24375190/v1, 2025. a
Knutti, R., Furrer, R., Tebaldi, C., Cermak, J., and Meehl, G. A.: Challenges in Combining Projections from Multiple Climate Models, J. Climate, 23, 2739–2758, https://doi.org/10.1175/2009JCLI3361.1, 2010. a
Kooperman, G. J., Pritchard, M. S., Ghan, S. J., Wang, M., Somerville, R. C. J., and Russell, L. M.: Constraining the influence of natural variability to improve estimates of global aerosol indirect effects in a nudged version of the Community Atmosphere Model 5, J. Geophys. Res.-Atmos., 117, https://doi.org/10.1029/2012JD018588, 2012. a
Korolev, A.: Limitations of the Wegener–Bergeron–Findeisen Mechanism in the Evolution of Mixed-Phase Clouds, J. Atmos. Sci., 64, 3372–3375, https://doi.org/10.1175/JAS4035.1, 2007. a
Lee, L. A., Carslaw, K. S., Pringle, K. J., Mann, G. W., and Spracklen, D. V.: Emulation of a complex global aerosol model to quantify sensitivity to uncertain parameters, Atmos. Chem. Phys., 11, 12253–12273, https://doi.org/10.5194/acp-11-12253-2011, 2011. a
Lee, L. A., Carslaw, K. S., Pringle, K. J., and Mann, G. W.: Mapping the uncertainty in global CCN using emulation, Atmos. Chem. Phys., 12, 9739–9751, https://doi.org/10.5194/acp-12-9739-2012, 2012. a
Lohmann, U. and Neubauer, D.: The importance of mixed-phase and ice clouds for climate sensitivity in the global aerosol–climate model ECHAM6-HAM2, Atmos. Chem. Phys., 18, 8807–8828, https://doi.org/10.5194/acp-18-8807-2018, 2018. a, b
Lohmann, U., Stier, P., Hoose, C., Ferrachat, S., Kloster, S., Roeckner, E., and Zhang, J.: Cloud microphysics and aerosol indirect effects in the global climate model ECHAM5-HAM, Atmos. Chem. Phys., 7, 3425–3446, https://doi.org/10.5194/acp-7-3425-2007, 2007. a
Lu, S., Landgraf, J., Fu, G., van Diedenhoven, B., Wu, L., Rusli, S. P., and Hasekamp, O. P.: Simultaneous Retrieval of Trace Gases, Aerosols, and Cirrus Using RemoTAP—the Global Orbit Ensemble Study for the CO2M Mission, Frontiers in Remote Sensing, 3, https://doi.org/10.3389/frsen.2022.914378, 2022. a
Mauritsen, T., Svensson, G., Zilitinkevich, S. S., Esau, I., Enger, L., and Grisogono, B.: A Total Turbulent Energy Closure Model for Neutrally and Stably Stratified Atmospheric Boundary Layers, J. Atmos. Sci., 64, 4113–4126, https://doi.org/10.1175/2007JAS2294.1, 2007. a
Mauritsen, T., Stevens, B., Roeckner, E., Crueger, T., Esch, M., Giorgetta, M., Haak, H., Jungclaus, J., Klocke, D., Matei, D., Mikolajewicz, U., Notz, D., Pincus, R., Schmidt, H., and Tomassini, L.: Tuning the climate of a global model, J. Adv. Model. Earth Sy., 4, https://doi.org/10.1029/2012MS000154, 2012. a, b
Mauritsen, T., Bader, J., Becker, T., Behrens, J., Bittner, M., Brokopf, R., Brovkin, V., Claussen, M., Crueger, T., Esch, M., Fast, I., Fiedler, S., Fläschner, D., Gayler, V., Giorgetta, M., Goll, D. S., Haak, H., Hagemann, S., Hedemann, C., Hohenegger, C., Ilyina, T., Jahns, T., Jimenéz-de-la Cuesta, D., Jungclaus, J., Kleinen, T., Kloster, S., Kracher, D., Kinne, S., Kleberg, D., Lasslop, G., Kornblueh, L., Marotzke, J., Matei, D., Meraner, K., Mikolajewicz, U., Modali, K., Möbis, B., Müller, W. A., Nabel, J. E. M. S., Nam, C. C. W., Notz, D., Nyawira, S.-S., Paulsen, H., Peters, K., Pincus, R., Pohlmann, H., Pongratz, J., Popp, M., Raddatz, T. J., Rast, S., Redler, R., Reick, C. H., Rohrschneider, T., Schemann, V., Schmidt, H., Schnur, R., Schulzweida, U., Six, K. D., Stein, L., Stemmler, I., Stevens, B., von Storch, J.-S., Tian, F., Voigt, A., Vrese, P., Wieners, K.-H., Wilkenskjeld, S., Winkler, A., and Roeckner, E.: Developments in the MPI-M Earth System Model version 1.2 (MPI-ESM1.2) and Its Response to Increasing CO2, J. Adv. Model. Earth Sy., 11, 998–1038, https://doi.org/10.1029/2018MS001400, 2019. a
May, N. W., Quinn, P. K., McNamara, S. M., and Pratt, K. A.: Multiyear study of the dependence of sea salt aerosol on wind speed and sea ice conditions in the coastal Arctic, J. Geophys. Res.-Atmos., 121, 9208–9219, https://doi.org/10.1002/2016JD025273, 2016. a
McCoy, I. L., McCoy, D. T., Wood, R., Regayre, L., Watson-Parris, D., Grosvenor, D. P., Mulcahy, J. P., Hu, Y., Bender, F. A.-M., Field, P. R., Carslaw, K. S., and Gordon, H.: The hemispheric contrast in cloud microphysical properties constrains aerosol forcing, P. Natl. Acad. Sci. USA, 117, 18998–19006, https://doi.org/10.1073/pnas.1922502117, 2020. a
McKay, M. D., Beckman, R. J., and Conover, W. J.: Comparison of Three Methods for Selecting Values of Input Variables in the Analysis of Output from a Computer Code, Technometrics, 21, 239–245, https://doi.org/10.1080/00401706.1979.10489755, 1979. a
Mikkelsen, A., McCoy, D. T., Eidhammer, T., Gettelman, A., Song, C., Gordon, H., and McCoy, I. L.: Constraining aerosol–cloud adjustments by uniting surface observations with a perturbed parameter ensemble, Atmos. Chem. Phys., 25, 4547–4570, https://doi.org/10.5194/acp-25-4547-2025, 2025. a, b, c
Mlawer, E. J., Taubman, S. J., Brown, P. D., Iacono, M. J., and Clough, S. A.: Radiative transfer for inhomogeneous atmospheres: RRTM, a validated correlated-k model for the longwave, J. Geophys. Res.-Atmos., 102, 16663–16682, https://doi.org/10.1029/97JD00237, 1997. a
Morcrette, J.-J., Barker, H. W., Cole, J. N. S., Iacono, M. J., and Pincus, R.: Impact of a New Radiation Package, McRad, in the ECMWF Integrated Forecasting System, Mon. Weather Rev., 136, 4773–4798, https://doi.org/10.1175/2008MWR2363.1, 2008. a
Muench, S. and Lohmann, U.: Developing a Cloud Scheme With Prognostic Cloud Fraction and Two Moment Microphysics for ECHAM-HAM, J. Adv. Model. Earth Sy., 12, e2019MS001824, https://doi.org/10.1029/2019MS001824, 2020. a, b
Mülmenstädt, J., Gryspeerdt, E., Dipu, S., Quaas, J., Ackerman, A. S., Fridlind, A. M., Tornow, F., Bauer, S. E., Gettelman, A., Ming, Y., Zheng, Y., Ma, P.-L., Wang, H., Zhang, K., Christensen, M. W., Varble, A. C., Leung, L. R., Liu, X., Neubauer, D., Partridge, D. G., Stier, P., and Takemura, T.: General circulation models simulate negative liquid water path–droplet number correlations, but anthropogenic aerosols still increase simulated liquid water path, Atmos. Chem. Phys., 24, 7331–7345, https://doi.org/10.5194/acp-24-7331-2024, 2024. a
Murphy, J. M., Sexton, D. M. H., Barnett, D. N., Jones, G. S., Webb, M. J., Collins, M., and Stainforth, D. A.: Quantification of Modelling Uncertainties in a Large Ensemble of Climate Change Simulations, Nature, 430, 768–772, https://doi.org/10.1038/nature02771, 2004. a
Myhre, G., Samset, B. H., Schulz, M., Balkanski, Y., Bauer, S., Berntsen, T. K., Bian, H., Bellouin, N., Chin, M., Diehl, T., Easter, R. C., Feichter, J., Ghan, S. J., Hauglustaine, D., Iversen, T., Kinne, S., Kirkevåg, A., Lamarque, J.-F., Lin, G., Liu, X., Lund, M. T., Luo, G., Ma, X., van Noije, T., Penner, J. E., Rasch, P. J., Ruiz, A., Seland, Ø., Skeie, R. B., Stier, P., Takemura, T., Tsigaridis, K., Wang, P., Wang, Z., Xu, L., Yu, H., Yu, F., Yoon, J.-H., Zhang, K., Zhang, H., and Zhou, C.: Radiative forcing of the direct aerosol effect from AeroCom Phase II simulations, Atmos. Chem. Phys., 13, 1853–1877, https://doi.org/10.5194/acp-13-1853-2013, 2013a. a
Myhre, G., Shindell, D., Bréon, F. M., Collins, W., Fuglestvedt, J., Huang, J., Koch, D., Lamarque, J. F., Lee, D., Mendoza, B., Nakajima, T., Robock, A., Stephens, G., Takemura, T., and Zhang, H.: Anthropogenic and Natural Radiative Forcing, in: Climate Change 2013: The Physical Science Basis. Contribution of Working Group I to the Fifth Assessment Report of the Intergovernmental Panel on Climate Change, chap. 8, edited by: Stocker, T. F., Qin, D., Plattner, G. K., Tignor, M., Allen, S. K., Boschung, J., Nauels, A., Xia, Y., Bex, V., and Midgley, P. M., Cambridge University Press, Cambridge, UK and New York, NY, USA, pp. 659–740, https://doi.org/10.1017/CBO9781107415324.018, 2013b. a, b
Nakajima, T., Higurashi, A., Kawamoto, K., and Penner, J. E.: A possible correlation between satellite-derived cloud and aerosol microphysical parameters, Geophys. Res. Lett., 28, 1171–1174, https://doi.org/10.1029/2000GL012186, 2001. a
Neubauer, D., Ferrachat, S., Siegenthaler-Le Drian, C., Stier, P., Partridge, D. G., Tegen, I., Bey, I., Stanelle, T., Kokkola, H., and Lohmann, U.: The global aerosol–climate model ECHAM6.3–HAM2.3 – Part 2: Cloud evaluation, aerosol radiative forcing, and climate sensitivity, Geosci. Model Dev., 12, 3609–3639, https://doi.org/10.5194/gmd-12-3609-2019, 2019. a, b, c, d, e
Nordeng, T.-E.: Extended versions of the convective parametrization scheme at ECMWF and their impact on the mean and transient activity of the model in the tropics, ECMWF Technical Memoranda, 206, 41 pp., https://doi.org/10.21957/e34xwhysw, 1994. a
Nugent, J. M., Brown, H., Kirby, A., McCoy, D. T., Allen, G., Aerenson, T., Burrows, S. M., Caulton, D., Fan, J., Feng, Y., Gettelman, A., Griswold, J., Jones, D. B., Leung, L. R., Mahfouz, N., Mikkelsen, A., Mülmenstädt, J., Qian, Y., Shan, Y., Shpund, J., Silber, I., Song, C., Song, X., Wang, H., Wu, M., Xie, S., Zelinka, M. D., Zhang, D., Zhang, G. J., and Zhang, K.: Overview of the Nephele Perturbed Parameter Ensemble for Aerosol-Cloud Interactions in E3SMv3, J. Adv. Model. Earth Sy., 18, e2025MS004989, https://doi.org/10.1029/2025MS004989, 2026. a, b, c
O'Hagan, A.: Bayesian analysis of computer code outputs: A tutorial, Reliab. Eng. Syst. Safe., 91, 1290–1300, https://doi.org/10.1016/j.ress.2005.11.025, 2006. a
Pincus, R. and Stevens, B.: Monte Carlo Spectral Integration: a Consistent Approximation for Radiative Transfer in Large Eddy Simulations, J. Adv. Model. Earth Sy., 1, https://doi.org/10.3894/JAMES.2009.1.1, 2009. a
Pincus, R., Hubanks, P. A., Platnick, S., Meyer, K., Holz, R. E., Botambekov, D., and Wall, C. J.: Updated observations of clouds by MODIS for global model assessment, Earth Syst. Sci. Data, 15, 2483–2497, https://doi.org/10.5194/essd-15-2483-2023, 2023 (data available at: https://ladsweb.modaps.eosdis.nasa.gov/archive/allData/62/MCD06COSP_D3_MODIS/, last access: February 2026). a, b
Pithan, F., Angevine, W., and Mauritsen, T.: Improving a global model from the boundary layer: Total turbulent energy and the neutral limit Prandtl number, J. Adv. Model. Earth Sy., 7, 791–805, https://doi.org/10.1002/2014MS000382, 2015. a
Platnick, S., Meyer, K. G., King, M. D., Wind, G., Amarasinghe, N., Marchant, B., Arnold, G. T., Zhang, Z., Hubanks, P. A., Holz, R. E., Yang, P., Ridgway, W. L., and Riedi, J.: The MODIS Cloud Optical and Microphysical Products: Collection 6 Updates and Examples From Terra and Aqua, IEEE T. Geosci. Remote, 55, 502–525, https://doi.org/10.1109/TGRS.2016.2610522, 2017. a
Prévost, L. M. C., Regayre, L. A., Johnson, J. S., McNeall, D., Milton, S., and Carslaw, K. S.: Detection of potential structural deficiencies in a global aerosol model using a perturbed parameter ensemble, Atmos. Chem. Phys., 26, 2487–2530, https://doi.org/10.5194/acp-26-2487-2026, 2026. a, b, c, d, e, f
Qian, Y., Wan, H., Yang, B., Golaz, J.-C., Harrop, B., Hou, Z., Larson, V. E., Leung, L. R., Lin, G., Lin, W., Ma, P.-L., Ma, H.-Y., Rasch, P., Singh, B., Wang, H., Xie, S., and Zhang, K.: Parametric Sensitivity and Uncertainty Quantification in the Version 1 of E3SM Atmosphere Model Based on Short Perturbed Parameter Ensemble Simulations, J. Geophys. Res.-Atmos., 123, 13,046–13,073, https://doi.org/10.1029/2018JD028927, 2018. a
Quaas, J., Boucher, O., and Lohmann, U.: Constraining the total aerosol indirect effect in the LMDZ and ECHAM4 GCMs using MODIS satellite data, Atmos. Chem. Phys., 6, 947–955, https://doi.org/10.5194/acp-6-947-2006, 2006. a
Raddatz, T. J., Reick, C. H., Knorr, W., Kattge, J., Roeckner, E., Schnur, R., Schnitzler, K.-G., Wetzel, P., and Jungclaus, J.: Will the Tropical Land Biosphere Dominate the Climate–Carbon Cycle Feedback during the Twenty-First Century?, Clim. Dynam., 29, 565–574, https://doi.org/10.1007/s00382-007-0247-8, 2007. a
Regayre, L. A., Johnson, J. S., Yoshioka, M., Pringle, K. J., Sexton, D. M. H., Booth, B. B. B., Lee, L. A., Bellouin, N., and Carslaw, K. S.: Aerosol and physical atmosphere model parameters are both important sources of uncertainty in aerosol ERF, Atmos. Chem. Phys., 18, 9975–10006, https://doi.org/10.5194/acp-18-9975-2018, 2018. a, b, c, d, e, f, g, h, i, j, k, l
Regayre, L. A., Deaconu, L., Grosvenor, D. P., Sexton, D. M. H., Symonds, C., Langton, T., Watson-Paris, D., Mulcahy, J. P., Pringle, K. J., Richardson, M., Johnson, J. S., Rostron, J. W., Gordon, H., Lister, G., Stier, P., and Carslaw, K. S.: Identifying climate model structural inconsistencies allows for tight constraint of aerosol radiative forcing, Atmos. Chem. Phys., 23, 8749–8768, https://doi.org/10.5194/acp-23-8749-2023, 2023. a, b, c, d, e, f, g, h, i, j, k, l, m
Regayre, L. A., Prévost, L. M. C., Ghosh, K., Johnson, J. S., Oakley, J. E., Owen, J., Webb, I., and Carslaw, K. S.: Remaining aerosol forcing uncertainty after observational constraint and the processes that cause it, Atmos. Chem. Phys., 26, 2293–2317, https://doi.org/10.5194/acp-26-2293-2026, 2026. a, b, c, d, e, f, g, h, i, j, k
Reutter, P., Su, H., Trentmann, J., Simmel, M., Rose, D., Gunthe, S. S., Wernli, H., Andreae, M. O., and Pöschl, U.: Aerosol- and updraft-limited regimes of cloud droplet formation: influence of particle number, size and hygroscopicity on the activation of cloud condensation nuclei (CCN), Atmos. Chem. Phys., 9, 7067–7080, https://doi.org/10.5194/acp-9-7067-2009, 2009. a
Rosenfeld, D., Zhu, Y., Wang, M., Zheng, Y., Goren, T., and Yu, S.: Aerosol-driven droplet concentrations dominate coverage and water of oceanic low-level clouds, Science, 363, https://doi.org/10.1126/science.aav0566, 2019. a
Rosenfeld, D., Kokhanovsky, A., Goren, T., Gryspeerdt, E., Hasekamp, O., Jia, H., Lopatin, A., Quaas, J., Pan, Z., and Sourdeval, O.: Frontiers in Satellite-Based Estimates of Cloud-Mediated Aerosol Forcing, Rev. Geophys., 61, e2022RG000799, https://doi.org/10.1029/2022RG000799, 2023. a
Salzmann, M., Ferrachat, S., Tully, C., Münch, S., Watson-Parris, D., Neubauer, D., Siegenthaler-Le Drian, C., Rast, S., Heinold, B., Crueger, T., Brokopf, R., Mülmenstädt, J., Quaas, J., Wan, H., Zhang, K., Lohmann, U., Stier, P., and Tegen, I.: The Global Atmosphere-aerosol Model ICON-A-HAM2.3–Initial Model Evaluation and Effects of Radiation Balance Tuning on Aerosol Optical Thickness, J. Adv. Model. Earth Sy., 14, e2021MS002699, https://doi.org/10.1029/2021MS002699, 2022. a, b, c, d, e
Saponaro, G., Sporre, M. K., Neubauer, D., Kokkola, H., Kolmonen, P., Sogacheva, L., Arola, A., de Leeuw, G., Karset, I. H. H., Laaksonen, A., and Lohmann, U.: Evaluation of aerosol and cloud properties in three climate models using MODIS observations and its corresponding COSP simulator, as well as their application in aerosol–cloud interactions, Atmos. Chem. Phys., 20, 1607–1626, https://doi.org/10.5194/acp-20-1607-2020, 2020. a
Schuster, G. L., Dubovik, O., and Holben, B. N.: Angstrom exponent and bimodal aerosol size distributions, J. Geophys. Res.-Atmos., 111, https://doi.org/10.1029/2005JD006328, 2006. a
Schutgens, N. A. J., Gryspeerdt, E., Weigum, N., Tsyro, S., Goto, D., Schulz, M., and Stier, P.: Will a perfect model agree with perfect observations? The impact of spatial sampling, Atmos. Chem. Phys., 16, 6335–6353, https://doi.org/10.5194/acp-16-6335-2016, 2016a. a
Schutgens, N. A. J., Partridge, D. G., and Stier, P.: The importance of temporal collocation for the evaluation of aerosol models with observations, Atmos. Chem. Phys., 16, 1065–1079, https://doi.org/10.5194/acp-16-1065-2016, 2016b. a
Seinfeld, J. H., Bretherton, C., Carslaw, K. S., Coe, H., DeMott, P. J., Dunlea, E. J., Feingold, G., Ghan, S., Guenther, A. B., Kahn, R., Kraucunas, I., Kreidenweis, S. M., Molina, M. J., Nenes, A., Penner, J. E., Prather, K. A., Ramanathan, V., Ramaswamy, V., Rasch, P. J., Ravishankara, A. R., Rosenfeld, D., Stephens, G., and Wood, R.: Improving our fundamental understanding of the role of aerosol–cloud interactions in the climate system, P. Natl. Acad. Sci. USA, 113, 5781–5790, https://doi.org/10.1073/pnas.1514043113, 2016. a
Shindell, D. T., Lamarque, J.-F., Schulz, M., Flanner, M., Jiao, C., Chin, M., Young, P. J., Lee, Y. H., Rotstayn, L., Mahowald, N., Milly, G., Faluvegi, G., Balkanski, Y., Collins, W. J., Conley, A. J., Dalsoren, S., Easter, R., Ghan, S., Horowitz, L., Liu, X., Myhre, G., Nagashima, T., Naik, V., Rumbold, S. T., Skeie, R., Sudo, K., Szopa, S., Takemura, T., Voulgarakis, A., Yoon, J.-H., and Lo, F.: Radiative forcing in the ACCMIP historical and future climate simulations, Atmos. Chem. Phys., 13, 2939–2974, https://doi.org/10.5194/acp-13-2939-2013, 2013. a
Smith, C. J., Kramer, R. J., Myhre, G., Alterskjær, K., Collins, W., Sima, A., Boucher, O., Dufresne, J.-L., Nabat, P., Michou, M., Yukimoto, S., Cole, J., Paynter, D., Shiogama, H., O'Connor, F. M., Robertson, E., Wiltshire, A., Andrews, T., Hannay, C., Miller, R., Nazarenko, L., Kirkevåg, A., Olivié, D., Fiedler, S., Lewinschal, A., Mackallah, C., Dix, M., Pincus, R., and Forster, P. M.: Effective radiative forcing and adjustments in CMIP6 models, Atmos. Chem. Phys., 20, 9591–9618, https://doi.org/10.5194/acp-20-9591-2020, 2020. a
Song, C., McCoy, D. T., McCoy, I. L., Brown, H., Gettelman, A., Eidhammer, T., and Barahona, D.: Aircraft in-situ measurements from SOCRATES constrain the anthropogenic perturbations of cloud droplet number, Atmos. Chem. Phys., 25, 16063–16083, https://doi.org/10.5194/acp-25-16063-2025, 2025. a, b, c
Stevens, B., Giorgetta, M., Esch, M., Mauritsen, T., Crueger, T., Rast, S., Salzmann, M., Schmidt, H., Bader, J., Block, K., Brokopf, R., Fast, I., Kinne, S., Kornblueh, L., Lohmann, U., Pincus, R., Reichler, T., and Roeckner, E.: Atmospheric component of the MPI-M Earth System Model: ECHAM6, J. Adv. Model. Earth Sy., 5, 146–172, https://doi.org/10.1002/jame.20015, 2013. a
Stier, P., Feichter, J., Kinne, S., Kloster, S., Vignati, E., Wilson, J., Ganzeveld, L., Tegen, I., Werner, M., Balkanski, Y., Schulz, M., Boucher, O., Minikin, A., and Petzold, A.: The aerosol-climate model ECHAM5-HAM, Atmos. Chem. Phys., 5, 1125–1156, https://doi.org/10.5194/acp-5-1125-2005, 2005. a, b
Sundqvist, H., Berge, E., and Kristjánsson, J. E.: Condensation and Cloud Parameterization Studies with a Mesoscale Numerical Weather Prediction Model, Mon. Weather Rev., 117, 1641–1657, https://doi.org/10.1175/1520-0493(1989)117<1641:CACPSW>2.0.CO;2, 1989. a, b, c, d, e
Swales, D. J., Pincus, R., and Bodas-Salcedo, A.: The Cloud Feedback Model Intercomparison Project Observational Simulator Package: Version 2, Geosci. Model Dev., 11, 77–81, https://doi.org/10.5194/gmd-11-77-2018, 2018. a
Szopa, S., Naik, V., Adhikary, B., Artaxo, P., Berntsen, T., Collins, W., Fuzzi, S., Gallardo, L., Scharr, A. K., Klimont, Z., Liao, H., Unger, N., and Zanis, P.: Short-Lived Climate Forcers, in: Climate Change 2021: The Physical Science Basis. Contribution of Working Group I to the Sixth Assessment Report of the Intergovernmental Panel on Climate Change, edited by: Masson-Delmotte, V., Zhai, P., Pirani, A., Connors, S., Péan, C., Berger, S., Caud, N., Chen, Y., Goldfarb, L., Gomis, M., Huang, M., Leitzell, K., Lonnoy, E., Matthews, J., Maycock, T., Waterfield, T., Yelekçi, O., Yu, R., and Zhou, B., Cambridge University Press, Cambridge, UK and New York, NY, USA, pp. 817–922, https://doi.org/10.1017/9781009157896.008, 2021. a
Tegen, I., Neubauer, D., Ferrachat, S., Siegenthaler-Le Drian, C., Bey, I., Schutgens, N., Stier, P., Watson-Parris, D., Stanelle, T., Schmidt, H., Rast, S., Kokkola, H., Schultz, M., Schroeder, S., Daskalakis, N., Barthel, S., Heinold, B., and Lohmann, U.: The global aerosol–climate model ECHAM6.3–HAM2.3 – Part 1: Aerosol evaluation, Geosci. Model Dev., 12, 1643–1677, https://doi.org/10.5194/gmd-12-1643-2019, 2019. a, b, c
Tiedtke, M.: A Comprehensive Mass Flux Scheme for Cumulus Parameterization in Large-Scale Models, Mon. Weather Rev., 117, 1779–1800, https://doi.org/10.1175/1520-0493(1989)117<1779:ACMFSF>2.0.CO;2, 1989. a
van Amerongen, A., Rietjens, J., Campo, J., Dogan, E., Dingjan, J., Nalla, R., Caron, J., and Hasekamp, O.: SPEXone: a compact multi-angle polarimeter, in: International Conference on Space Optics – ICSO 2018, vol. 11180, edited by: Sodnik, Z., Karafolas, N., and Cugny, B., SPIE, https://doi.org/10.1117/12.2535940, 2019. a
Vignati, E., Wilson, J., and Stier, P.: M7: An efficient size-resolved aerosol microphysics module for large-scale aerosol transport models, J. Geophys. Res.-Atmos., 109, https://doi.org/10.1029/2003JD004485, 2004. a
Wall, C. J., Storelvmo, T., and Possner, A.: Global observations of aerosol indirect effects from marine liquid clouds, Atmos. Chem. Phys., 23, 13125–13141, https://doi.org/10.5194/acp-23-13125-2023, 2023. a
Watson-Parris, D., Schutgens, N., Cook, N., Kipling, Z., Kershaw, P., Gryspeerdt, E., Lawrence, B., and Stier, P.: Community Intercomparison Suite (CIS) v1.4.0: a tool for intercomparing models and observations, Geosci. Model Dev., 9, 3093–3110, https://doi.org/10.5194/gmd-9-3093-2016, 2016. a, b
Watson-Parris, D., Bellouin, N., Deaconu, L. T., Schutgens, N. A. J., Yoshioka, M., Regayre, L. A., Pringle, K. J., Johnson, J. S., Smith, C. J., Carslaw, K. S., and Stier, P.: Constraining Uncertainty in Aerosol Direct Forcing, Geophys. Res. Lett., 47, e2020GL087141, https://doi.org/10.1029/2020GL087141, 2020. a, b
Watson-Parris, D., Williams, A., Deaconu, L., and Stier, P.: Model calibration using ESEm v1.1.0 – an open, scalable Earth system emulator, Geosci. Model Dev., 14, 7659–7672, https://doi.org/10.5194/gmd-14-7659-2021, 2021a. a, b
Watson-Parris, D., Williams, A., and Monticone, P.: duncanwp/ESEm: v1.1.0 (Version v1.1.0), Zenodo [software], https://doi.org/10.5281/zenodo.5466563, 2021b. a
Weiss, P., Herbert, R., and Stier, P.: ICON-HAM-lite 1.0: simulating the Earth system with interactive aerosols at kilometer scales, Geosci. Model Dev., 18, 3877–3894, https://doi.org/10.5194/gmd-18-3877-2025, 2025. a
Werdell, P. J., Behrenfeld, M. J., Bontempi, P. S., Boss, E., Cairns, B., Davis, G. T., Franz, B. A., Gliese, U. B., Gorman, E. T., Hasekamp, O., Knobelspiesse, K. D., Mannino, A., Martins, J. V., McClain, C. R., Meister, G., and Remer, L. A.: The Plankton, Aerosol, Cloud, Ocean Ecosystem Mission: Status, Science, Advances, B. Am. Meteorol. Soc., 100, 1775–1794, https://doi.org/10.1175/BAMS-D-18-0056.1, 2019. a
Wu, N., Geng, G., Xu, R., Liu, S., Liu, X., Shi, Q., Zhou, Y., Zhao, Y., Liu, H., Song, Y., Zheng, J., Zhang, Q., and He, K.: Development of a high-resolution integrated emission inventory of air pollutants for China, Earth Syst. Sci. Data, 16, 2893–2915, https://doi.org/10.5194/essd-16-2893-2024, 2024. a
Yoshioka, M., Regayre, L. A., Pringle, K. J., Johnson, J. S., Mann, G. W., Partridge, D. G., Sexton, D. M. H., Lister, G. M. S., Schutgens, N., Stier, P., Kipling, Z., Bellouin, N., Browse, J., Booth, B. B. B., Johnson, C. E., Johnson, B., Mollard, J. D. P., Lee, L., and Carslaw, K. S.: Ensembles of Global Climate Model Variants Designed for the Quantification and Constraint of Uncertainty in Aerosols and Their Radiative Forcing, J. Adv. Model. Earth Sy., 11, 3728–3754, https://doi.org/10.1029/2019MS001628, 2019. a, b, c, d, e, f, g, h
Yuan, T., Song, H., Wood, R., Oreopoulos, L., Platnick, S., Wang, C., Yu, H., Meyer, K., and Wilcox, E.: Observational evidence of strong forcing from aerosol effect on low cloud coverage, Sci. Adv., 9, eadh7716, https://doi.org/10.1126/sciadv.adh7716, 2023. a
Zelinka, M. D., Andrews, T., Forster, P. M., and Taylor, K. E.: Quantifying components of aerosol-cloud-radiation interactions in climate models, J. Geophys. Res.-Atmos., 119, 7599–7615, https://doi.org/10.1002/2014JD021710, 2014. a
Zhao, C., Liu, X., Qian, Y., Yoon, J., Hou, Z., Lin, G., McFarlane, S., Wang, H., Yang, B., Ma, P.-L., Yan, H., and Bao, J.: A sensitivity study of radiative fluxes at the top of atmosphere to cloud-microphysics and aerosol parameters in the community atmosphere model CAM5, Atmos. Chem. Phys., 13, 10969–10987, https://doi.org/10.5194/acp-13-10969-2013, 2013. a
Zhong, Q., Schutgens, N., Veraverbeke, S., and van der Werf, G. R.: Increasing Aerosol Emissions from Boreal Biomass Burning Exacerbate Arctic Warming, Nat. Clim. Change, 14, 1275–1281, https://doi.org/10.1038/s41558-024-02176-y, 2024. a, b, c