
the Creative Commons Attribution 4.0 License.
the Creative Commons Attribution 4.0 License.
 | 06 Nov 2026
EarthCARE Observations of Vertical Motion and Cloud Microphysical Structure in Tropical Cyclones

Woosub Roh
Tomoki Miyakawa
Masaki Satoh
The Earth Cloud, Aerosol and Radiation Explorer (EarthCARE) provides the first spaceborne Doppler radar measurements. We construct a tropical cyclone (TC) dataset by collocating 16 months of EarthCARE observations with the International Best Track Archive for Climate Stewardship, comprising 96 intercepts of 27 TCs. The inner-core region exhibits enhanced reflectivity, stronger and more variable upward air motion, and a broader Doppler velocity distribution. Two independent inner-core intercepts show consistent Doppler and air velocity structures. In the rainband region, the Doppler velocity distribution shifts toward more negative values, accompanied by more negative particle terminal velocities and a bright band near the melting level. Particle classifications show small ice dominates the upper troposphere, whereas snow extends toward more negative Doppler velocities between 5 and 12 km. These results show that radial variations in Doppler velocity reflect differences in both air motion and particle sedimentation. We conduct a preliminary single-case comparison for Hurricane Humberto using the Nonhydrostatic Icosahedral Atmospheric Model with two common microphysical configurations. Both configurations underestimate TC intensity and produce narrower distributions than observed. Compared with the Kodama et al. (2021) configuration, the Takasuka et al. (2024) configuration more closely reproduces upper-level structure, with more gradual reflectivity and Doppler velocity changes and a broader cloud ice distribution. Because the comparison is limited to one case, it demonstrates sensitivity to the microphysical configurations rather than a general evaluation of model performance. Overall, EarthCARE provides complementary constraints on vertical air motion, condensate properties, and particle sedimentation for evaluating TC microphysics.
- Article
(6590 KB) - Full-text XML
-
Supplement
(1822 KB) - BibTeX
- EndNote


Understanding vertical motion in cloud systems is crucial for weather forecasting and climate projection, but it has been difficult to observe at fine resolution globally. The Earth Cloud, Aerosol and Radiation Explorer (EarthCARE; Illingworth et al., 2015; Wehr et al., 2023) satellite mission enables observation of cloud particle's Doppler velocity from space by carrying a 94 GHz nadir-pointing Cloud Profiling Radar (CPR), the first spaceborne Doppler radar to observe cloud and precipitation particles' vertical motion. EarthCARE also carries 355 nm ATmospheric LIDar (ATLID), with dual-polarization capability, providing information on particle shapes. The Doppler measurements from CPR enable the estimation of hydrometeor fall speed and the retrieval of vertical air motion across diverse cloud regimes (Roh et al., 2026), while ATLID observations support the identification of cloud particle types. EarthCARE sheds new light on studies of cloud dynamics and cloud microphysics, which were previously limited in their global observations.
Spaceborne observations have long supported the monitoring of tropical cyclones (TCs) and provided insights into their dynamics. A geostationary satellite image is used to estimate and forecast the TC intensity of a location (Dvorak, 1975, 1984). Combining cloud top temperature from the Moderate Resolution Imaging Spectroradiometer (MODIS) and cloud top height with CloudSat cloud profiles, Luo et al. (2008) developed a method to better estimate TC intensity. On the other hand, the CloudSat TC dataset (CSTC) has been released and is widely used to understand TC dynamics (Tourville et al., 2015). Using CSTC, Wu and Soden (2017) found that strengthening TCs have 20 % higher ice water content (IWC) than weakening TCs. Wu et al. (2020) then showed that the intensification rate is correlated with IWC in rapidly intensifying TCs, suggesting that enhanced IWC may be a precursor to rapid intensification. Lee and Wing (2024) investigated the role of cloud-radiative feedback in intensifying weak TCs and found that cloud-radiative processes can drive the secondary circulation and enhance TC intensity. These studies demonstrate the value of CloudSat radar observations for understanding TCs, although CloudSat provides radar reflectivity without Doppler velocity. The Doppler capability of EarthCARE CPR therefore provides new information for examining the relationship between vertical motion and cloud microphysics in TCs.
In addition to dynamical processes, cloud microphysics plays a crucial role in determining TC structure and evolution. The presence of supercooled liquid water affects riming, freezing, and hydrometeor growth in the upper levels. Project STORMFURY therefore attempted to modify TC structure and intensity by seeding supercooled water (Willoughby et al., 1985). However, they reported that the changes in TC intensities are limited because TCs contain less supercooled water than expected. Black and Hallett (1986, 1999) showed that supercooled water is hard to find when the temperature is below −5 °C due to the efficient depletion by riming and freezing processes. In contrast, aircraft observations of Hurricane Bonnie revealed the presence of large graupel particles at high altitudes, implying in situ growth supported by deeply supercooled cloud droplets within TC updrafts (Black et al., 2003). These contrasting findings highlight the large uncertainties in the occurrence and vertical distribution of supercooled water in TCs. This underscores the need for observational constraints on cloud phase and its coupling with dynamical processes. The cloud particle types retrieved from EarthCARE provide the opportunity to examine the relationship between vertical motion and cloud microphysical structure in TCs, although they do not directly quantify the amount of supercooled liquid water.
Recent advances in computational power have enabled the use of global storm-resolving models (GSRMs) to study atmospheric phenomena (Satoh et al., 2019; Stevens et al., 2019). By explicitly resolving deep convection without cumulus parameterization, GSRMs provide explicit representations of the structure and variability of storm systems, including TCs (Stevens et al., 2020). Judt et al. (2021) analyzed datasets from the nine GSRMs and showed that, while individual models can capture certain aspects of TC behavior, their representations vary across models. Baker et al. (2024) further demonstrated that GSRMs can simulate rapid intensification, which is hard to be represented in low-resolution conventional global climate models. GSRMs can also capture the sensitivity of the inner-core size to the intensification rate of TCs. These studies highlight the potential of GSRMs for simulating TCs, but also indicate the need for further evaluation and development. In particular, observational constraints on both dynamical and cloud microphysical processes of TCs remain limited. The radar reflectivity and Doppler velocity observed by EarthCARE provide a unique opportunity to jointly evaluate and constrain these processes in GSRMs. Roh et al. (2026) also argued that the combined analysis of EarthCARE observations and GSRMs can improve the understanding of cloud systems beyond what can be obtained from either observations or models alone.
This study uses EarthCARE observations to investigate the dynamical and cloud microphysical structures of TCs, with a particular focus on vertical motion. We collocate EarthCARE overpasses with TC tracks from the International Best Track Archive for Climate Stewardship (IBTrACS) to construct an EarthCARE TC dataset following Tourville et al. (2015). Using 16 months of observations, we examine differences among inner-core, rainband, and outer regions in radar reflectivity, Doppler velocity, retrieved air motion, and cloud particle types. We further investigate how air motion and particle sedimentation influence the Doppler velocity distributions across these regions. Finally, we conduct a preliminary single-case comparison with simulations from the Nonhydrostatic Icosahedral Atmospheric Model (NICAM; Tomita and Satoh, 2004; Satoh et al., 2008, 2014) to examine the sensitivity of the simulated cloud structure to two microphysical configurations with different hydrometeor fall-speed settings. The paper is organized as follows: Sect. 2 describes the data and method; Sect. 3 presents the results; Sect. 4 presents the preliminary comparison for Hurricane Humberto; and Sect. 5 summarizes the study.
2.1 Data
2.1.1 EarthCARE CPR and ATLID
The EarthCARE satellite is a joint mission developed by the European Space Agency (ESA) and the Japan Aerospace Exploration Agency (JAXA). In addition to CPR and ATLID, the EarthCARE satellite carries the Multi-Spectral Imager (MSI) and the Broadband Radiometer (BBR). CPR operates at 94 GHz (W-band) and provides the first spaceborne Doppler radar observation. ATLID is a 355-nm lidar equipped with dual-polarization capability, which enables the observation of particle shape. We primarily use the JAXA level-2 cloud and precipitation microphysics retrievals from CPR (CPR_CLP; Sato et al., 2025). We also adopt the cloud particle types from the JAXA level-2 CPR-ATLID Synergy Cloud Product (AC_CLP; Sato et al., 2025; Okamoto et al., 2024) to investigate the cloud microphysical structure in TCs and the relationship between vertical motion and cloud microphysics. Both CPR_CLP and AC_CLP products share the same horizontal (1 km) and vertical (0.1 km) resolutions. We adopt the period covered by both products from 1 August 2024 to 30 November 2025 for collocation with TC tracks.
We use radar reflectivity, Doppler velocity, air velocity, terminal velocity, cloud water content, and cloud ice content from the CPR_CLP product, together with cloud particle types from the CPR-ATLID synergy product. Radar reflectivity and Doppler velocity are directly obtained from observation with corrections following the JAXA processing algorithm (Sato et al., 2025). Basic physical corrections, including clutter-echo and gaseous-attenuation corrections for radar reflectivity and Doppler unfolding for Doppler velocity, are applied before the level-2 retrievals. The CPR Doppler Nyquist velocity is approximately ± 4.8 m s−1, so velocities exceeding this range are aliased in the raw measurements and subsequently corrected through Doppler unfolding in the Level-2 processing. In this study, all vertical velocities are defined as positive upward, so particle fall velocities are negative.
Cloud water content, cloud ice content, and air velocity are retrieved from the corrected CPR observations following the JAXA Level-2 retrieval algorithms (Sato et al., 2025). Cloud water and ice contents are calculated from radar reflectivity using empirical relationships (Sato et al., 2025). Air velocity is retrieved by estimating and removing the hydrometeor terminal velocity from the observed Doppler velocity (Sato et al., 2009, 2025). The measured Doppler velocity can be expressed as
where Vair is the air velocity, and Vtz is the radar reflectivity-weighted terminal velocity of particles. Vtz depends on particle size, shape, orientation, and atmospheric conditions. Cloud microphysical properties and vertical motion are retrieved consistently using the observed radar quantities and assumed particle properties. The product also provides retrieved particle terminal velocities based on inferred particle properties. These represent particle fall speeds and are distinct from Vtz, which represents the radar-weighted sedimentation contribution to the measured Doppler velocity. In addition, we estimate Vtz as VD−Vair in the following analysis. Finally, the cloud particle types are retrieved based on the combined use of CPR and ATLID observations. Cloud particles are categorized into 16 hydrometeor types: missing, clear, warm water, supercooled water, 3D-ice, 2D-plate, mixture of 3D-ice and 2D-plate, liquid drizzle, mixed-phase drizzle, rain, snow, water and liquid drizzle, water and rain, mixed phase, unknown, and melting layer (Okamoto et al., 2024).
These retrieved quantities are subject to uncertainties associated with assumptions regarding particle size, shape, and scattering properties. Retrievals of particle terminal velocity and vertical air motion can be particularly challenging when multiple hydrometeor populations coexist, especially in mixed-phase and melting regions. Strong precipitation can introduce additional uncertainties through radar attenuation and multiple scattering. Previous validation of a similar 95-GHz Doppler retrieval against wind profiler measurements showed vertical air velocity differences of approximately 0.1 m s−1 under ice-cloud conditions (Sato et al., 2009). Aoki et al. (2026) compared EarthCARE CPR_CLP air velocities with a CPR-DPR-based retrieval and found differences of approximately 0.3 m s−1 between the distribution peaks in snow layers, while the two methods showed comparable distributions in rain layers, including convective precipitation. These values indicate the approximate scale of retrieval differences rather than a formal uncertainty estimate, because the errors depend strongly on particle properties and precipitation conditions.
2.1.2 IBTrACS
The TC tracks and TC intensities are adopted from the International Best Track Archive for Climate Stewardship (IBTrACS; Knapp et al., 2010). IBTrACS provides the best-estimated dataset by merging TC records from multiple operational agencies. In this study, we use Version 4r01 of the IBTrACS dataset (Gahtan et al., 2024). The 3-hourly TC position, maximum sustained wind speed, and radius of maximum wind (RMW) are based on the USA agency records. These data are used to identify TC cases intercepted by EarthCARE and to calculate the radial distance from the storm center for composite analyses.
2.1.3 IMERG
Precipitation data are obtained from the Integrated Multi-satellite Retrievals for GPM (IMERG) Final Run product (GPM_3IMERGHH, Version 07; Huffman et al., 2020). IMERG provides global precipitation estimates by combining observations from multiple passive microwave sensors and infrared measurements, with gauge calibration applied in the Final Run product. The dataset has a temporal resolution of 30 min and a spatial resolution of 0.1° × 0.1°. In this study, IMERG data are used to characterize the precipitation structure associated with TCs.
2.2 Methodology
2.2.1 EarthCARE overpass of TCs
To construct a dataset of TC structures observed by EarthCARE, we first identify satellite overpasses that pass within 1000 km of a TC center, following Tourville et al. (2015). The TC position, maximum sustained wind, and RMW are interpolated from the 3-hourly IBTrACS data to the exact EarthCARE overpass time. For each EarthCARE radar profile, the distance from the interpolated TC center is calculated and normalized by the corresponding RMW to account for differences in storm size among individual TCs. The sampled TCs have a mean RMW of 25.6 km and an interquartile range of 18.5–31.5 km, providing a physical scale for the normalized radial distance (Fig. S1 in the Supplement). The statistical composites in this study are restricted to strong TCs of Category 3 intensity or higher (maximum sustained wind ≥ 96 kt). To focus the analysis on detectable cloud and precipitation signals, only grid points with reflectivity greater than −20 dBZ are retained for the composite and conditional sampling analyses. Radial-height bins with fewer than 100 valid samples are excluded from the composites.
After restricting the dataset to Category 3 or stronger TCs, the radial composite analysis includes 96 EarthCARE intercept events from 27 TCs in the Northern Hemisphere, providing 15 413 valid profiles within 15 RMW. Because the number of satellite intercepts differs substantially with radius, we examine both the number of independent intercept events and the number of valid profiles contributing to each radial bin (Fig. S2 in the Supplement). Because the number of EarthCARE samples decreases substantially toward the TC center, all profiles within 2 RMW are combined into one radial bin, whereas 1-RMW bins are used from 2 to 15 RMW in the subsequent analyses. Sampling is particularly limited within 2 RMW, so individual-event mean vertical profiles are compared to assess the robustness of the inner-core statistics (Fig. S3 in the Supplement). Although only two independent TC cases contribute to this region, they show consistent vertical structures in Doppler and air velocities and a similar vertical extent of radar echoes exceeding 0 dBZ, despite differences in radar reflectivity magnitude.
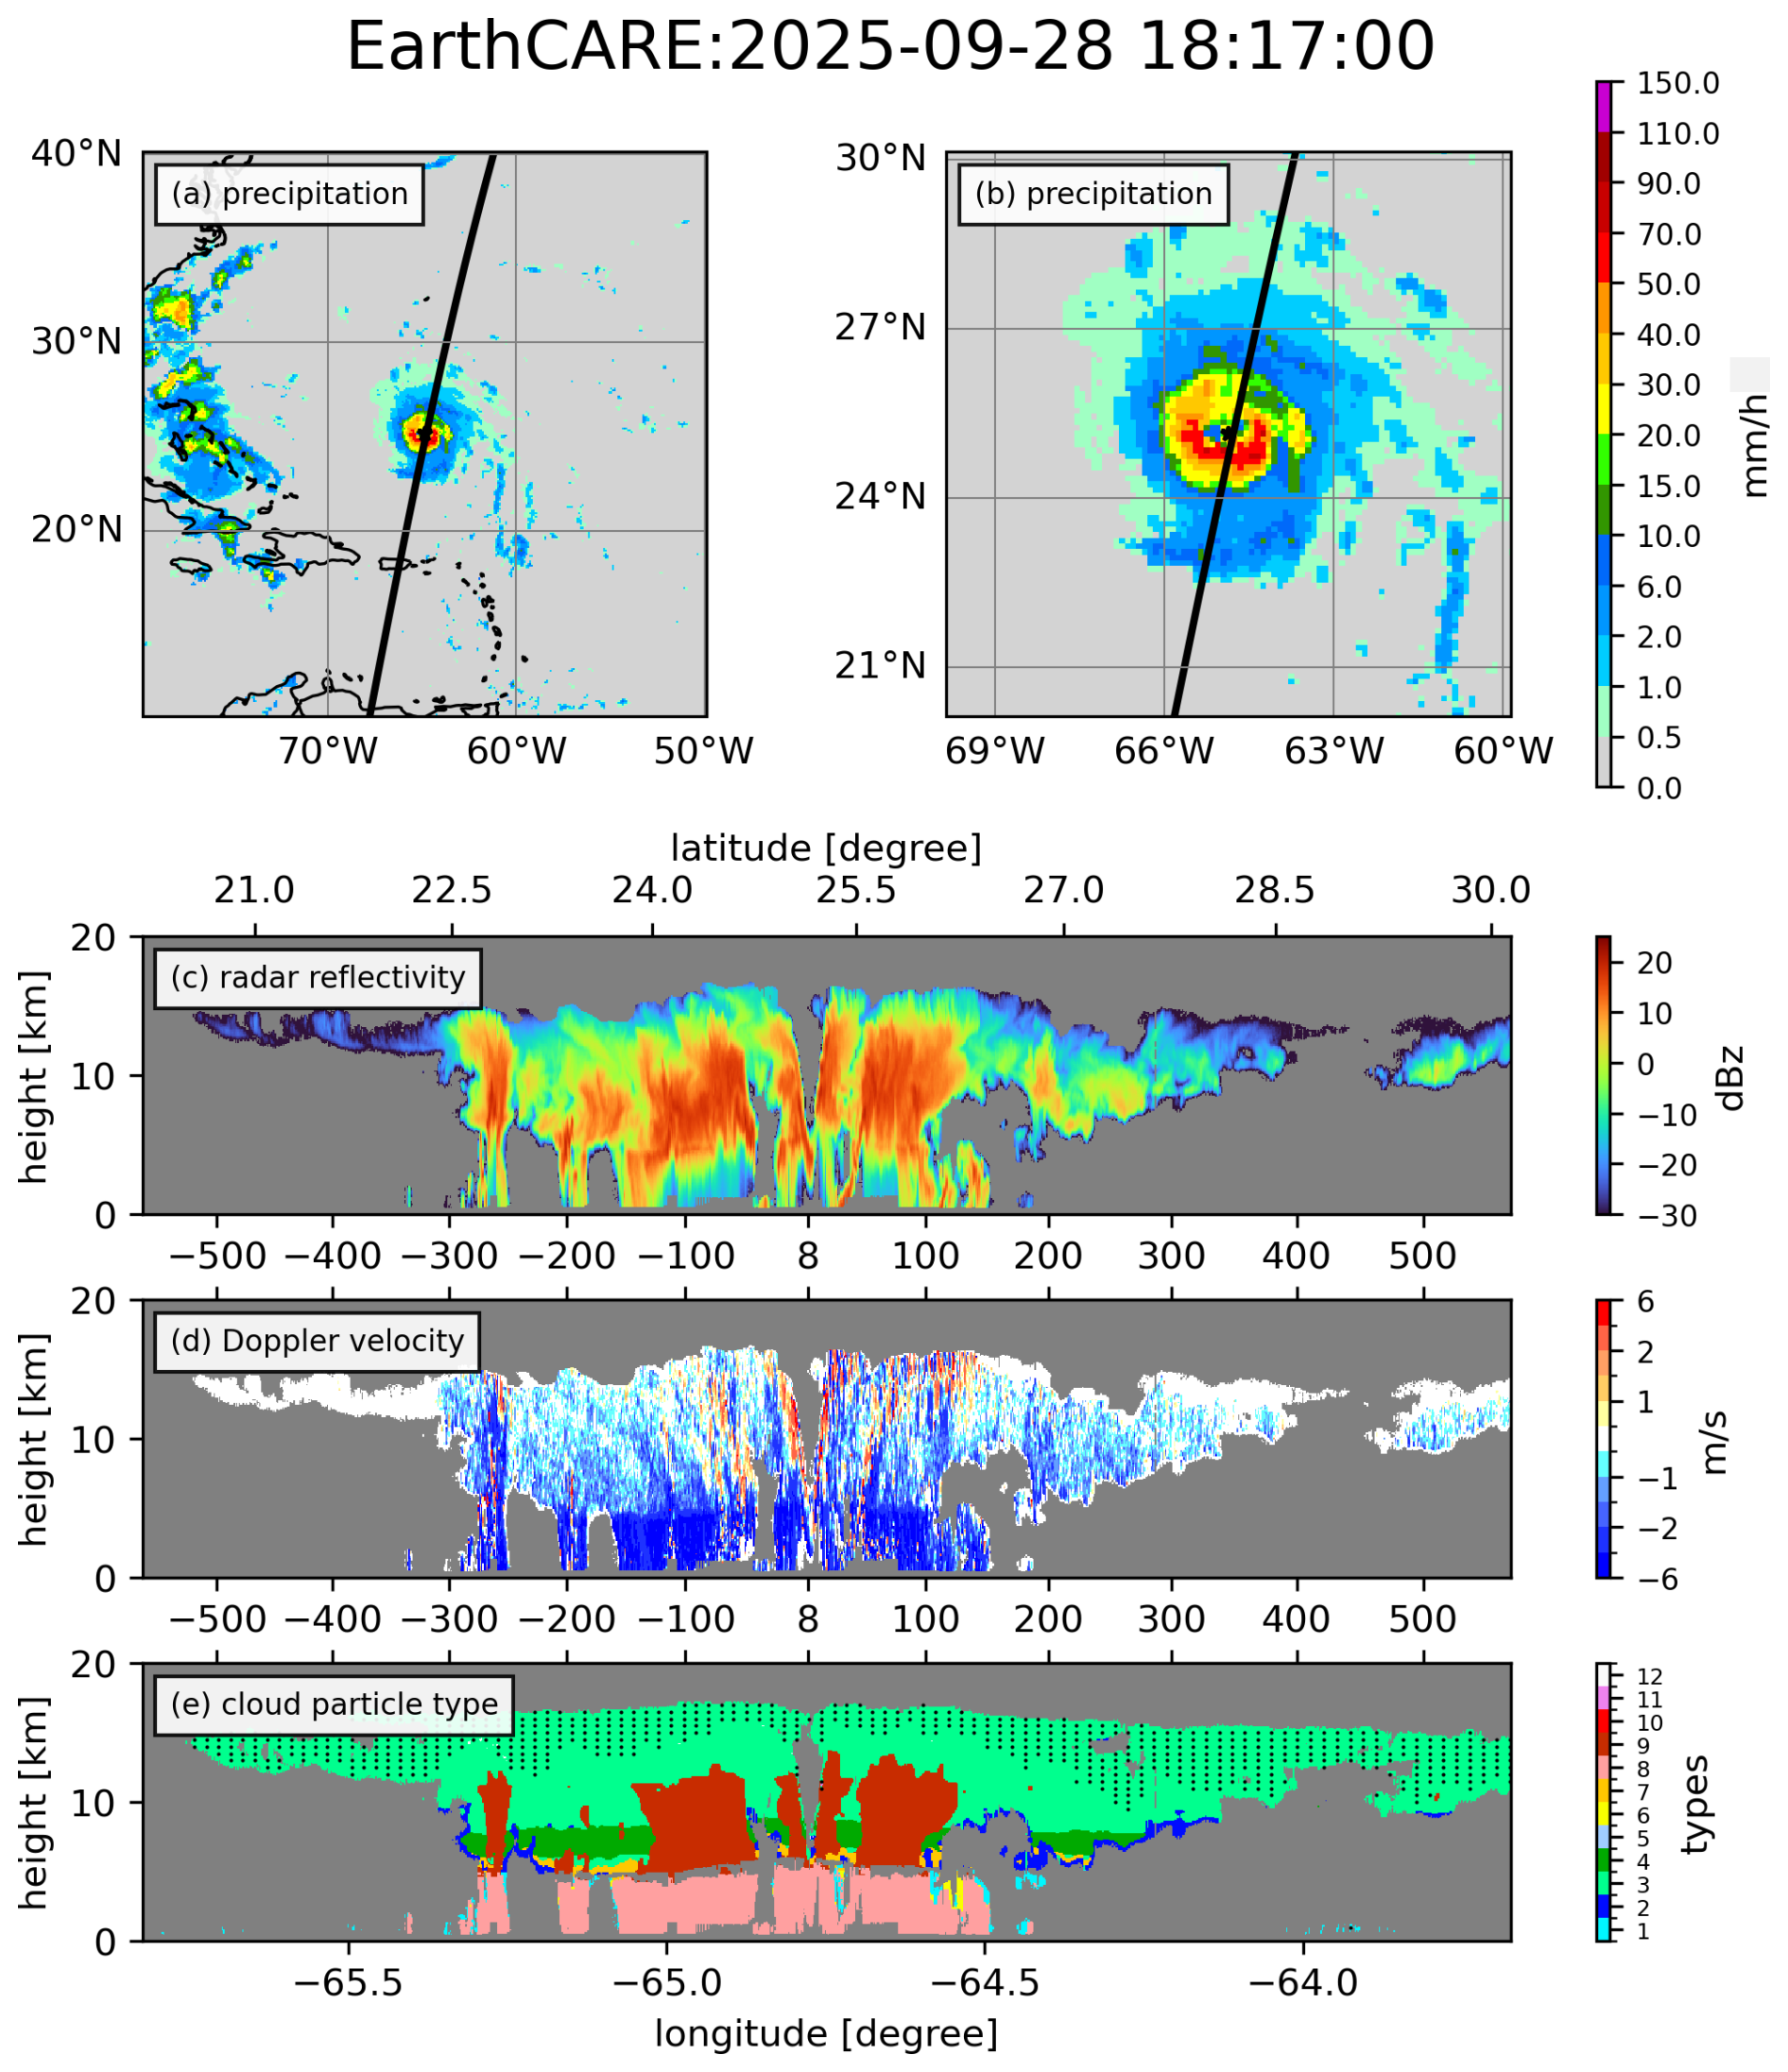
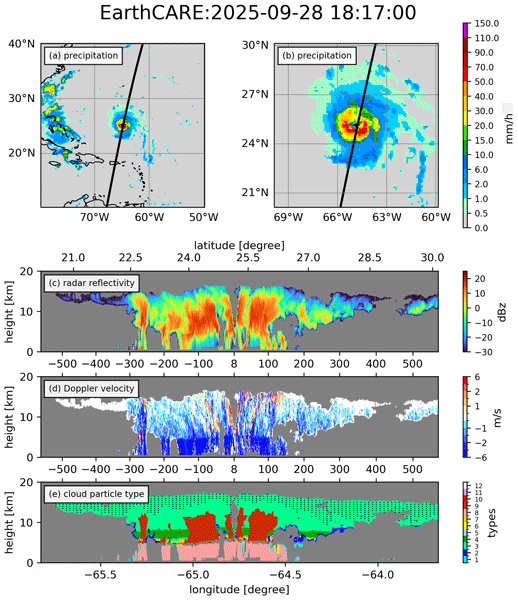
Figure 1(a) and (b) show IMERG precipitation accumulated from 18Z to 19Z for large and small domains, respectively. The black line indicates the track of the EarthCARE overpass. (c) demonstrates the cross-section of radar reflectivity along the track in (b). (d) is the same but for Doppler velocity. (e) shows the retrieved cloud particle types: 1, warm water; 2, supercooled water; 3, 3-D ice; 4, 2-D plate; 5, mixture of 3-D ice and 2-D plate; 6, liquid drizzle; 7, mixed-phase drizzle; 8, rain; 9, snow; 10, water and liquid drizzle; 11, water and rain; and 12, mixed phase. The types of clear, melting layer, and missing are not shown here. Distances (km) from the TC center are indicated between panels (c, d) and (d, e).
Figure 1 illustrates an example of the colocation for Hurricane Humberto on 28 September 2025 at 18:17 UTC. Humberto is an intense hurricane over the Atlantic Ocean, reaching Category 4 intensity (Fig. 1a). The EarthCARE ground track intersects Humberto's eye, sampling both the eyewall and outer regions (Fig. 1b). At the time of the overpass, Humberto was undergoing an eyewall replacement process. The cross section of radar reflectivity (Fig. 1c) shows strong signals within ± 100 km of the storm center, indicating substantial condensate in the eyewall and rainband regions. The Doppler velocity field (Fig. 1d) shows distinct structures associated with the inner and outer eyewalls, with the closest passage to the inner eyewall located approximately 8 km from the TC center and the outer eyewall sampled near ± 50 km. Doppler velocities are less negative and more concentrated in the inner eyewall than in the outer eyewall, suggesting a stronger contribution from upward air motion. Beyond ± 100 km, isolated convection and anvil cloud structures are observed in the outer region. Figure 1e shows the retrieved cloud particle types from the CPR-ATLID synergy product. Rain dominates below the freezing level, while snow particles are associated with regions of enhanced reflectivity. In the upper troposphere, 3-D ice particles are prevalent, particularly in the anvil region. These cross sections demonstrate the capability of EarthCARE to capture the vertical structure of clouds and Doppler velocity within a TC.
2.2.2 NICAM hindcast simulations
NICAM is used to perform hindcast simulations in this study. The model is configured with a horizontal resolution of approximately 3.5 km and 78 vertical levels using a terrain-following coordinate. The vertical grid spacing increases from 66 m near the surface to 400 m at 3.3 km, remains constant up to 18 km, and then increases toward the model top at 50 km. Cloud microphysical processes are represented using the NICAM Single-moment Water 6 (NSW6; Tomita, 2008; Roh and Satoh, 2014) scheme, which includes six prognostic hydrometeor species. The NICAM Double-moment Water 6 (NDW6; Seiki and Nakajima, 2014) can also be applied to simulate clouds and precipitation with additional microphysical degrees of freedom. Radiative transfer is calculated using the MSTRNX scheme based on the correlated k-distribution method (Sekiguchi and Nakajima, 2008). Surface processes are represented by the MATSIRO land surface model (Takata et al., 2003) and a slab ocean model, while subgrid-scale turbulence is parameterized using the Mellor–Yamada–Nakanishi–Niino level 2 scheme (MYNN2; Nakanishi and Niino, 2006; Noda et al., 2010).
The simulations are initialized at 00:00 UTC on 26 September 2025 using operational atmospheric analysis from the ECMWF Integrated Forecasting System (IFS) at approximately 9-km horizontal resolution, while sea surface temperature is nudged toward daily Optimum Interpolation Sea Surface Temperature (OISST; Reynolds et al., 2002) in the slab ocean model, with a 7 d relaxation time to prevent SST drift. Land initial conditions are taken from climatology derived from a low-resolution NICAM simulation. Each simulation is integrated for 6 d, with output frequencies of 6-hourly for three-dimensional variables and 1-hourly for two-dimensional fields. In this study, we use the Joint-Simulator for satellite sensors (J-Sim; Hashino et al., 2013; Roh et al., 2020) to generate the EarthCARE CPR-like radar reflectivity and Doppler velocity based on NICAM outputs, which can be directly compared to the EarthCARE signals.
We focus on the single-moment NSW6 scheme to isolate the sensitivity to different settings of terminal velocity, because the double-moment NDW6 scheme introduces additional microphysical differences that would make this sensitivity more difficult to isolate. Two commonly used configurations of the NSW6 are evaluated: the HighResMIP-tuned configuration (Kodama et al., 2021; hereafter K21) and the global K-scale climate configuration (Takasuka et al., 2024; hereafter T24). These configurations represent alternative parameter choices that have been adopted in recent NICAM applications, and we compare them to assess their representation of the observed TC cloud and precipitation structure. A primary difference between K21 and T24 lies in the coefficients used to parameterize the terminal velocities of hydrometeors. K21 applies larger coefficients for terminal velocities of snow and rain, while cloud ice is assumed to be non-falling. In contrast, T24 uses smaller parameters for snow and rain and assigns a small constant fall speed (0.1 m s−1) to cloud ice. Additionally, T24 incorporates lateral moisture mixing through the Leonard term. Comparison of these two NSW6 configurations provides a useful framework for examining how differences in hydrometeor terminal velocity settings influence the simulated radar reflectivity and Doppler velocity, and thus the representation of TC cloud and precipitation structure.
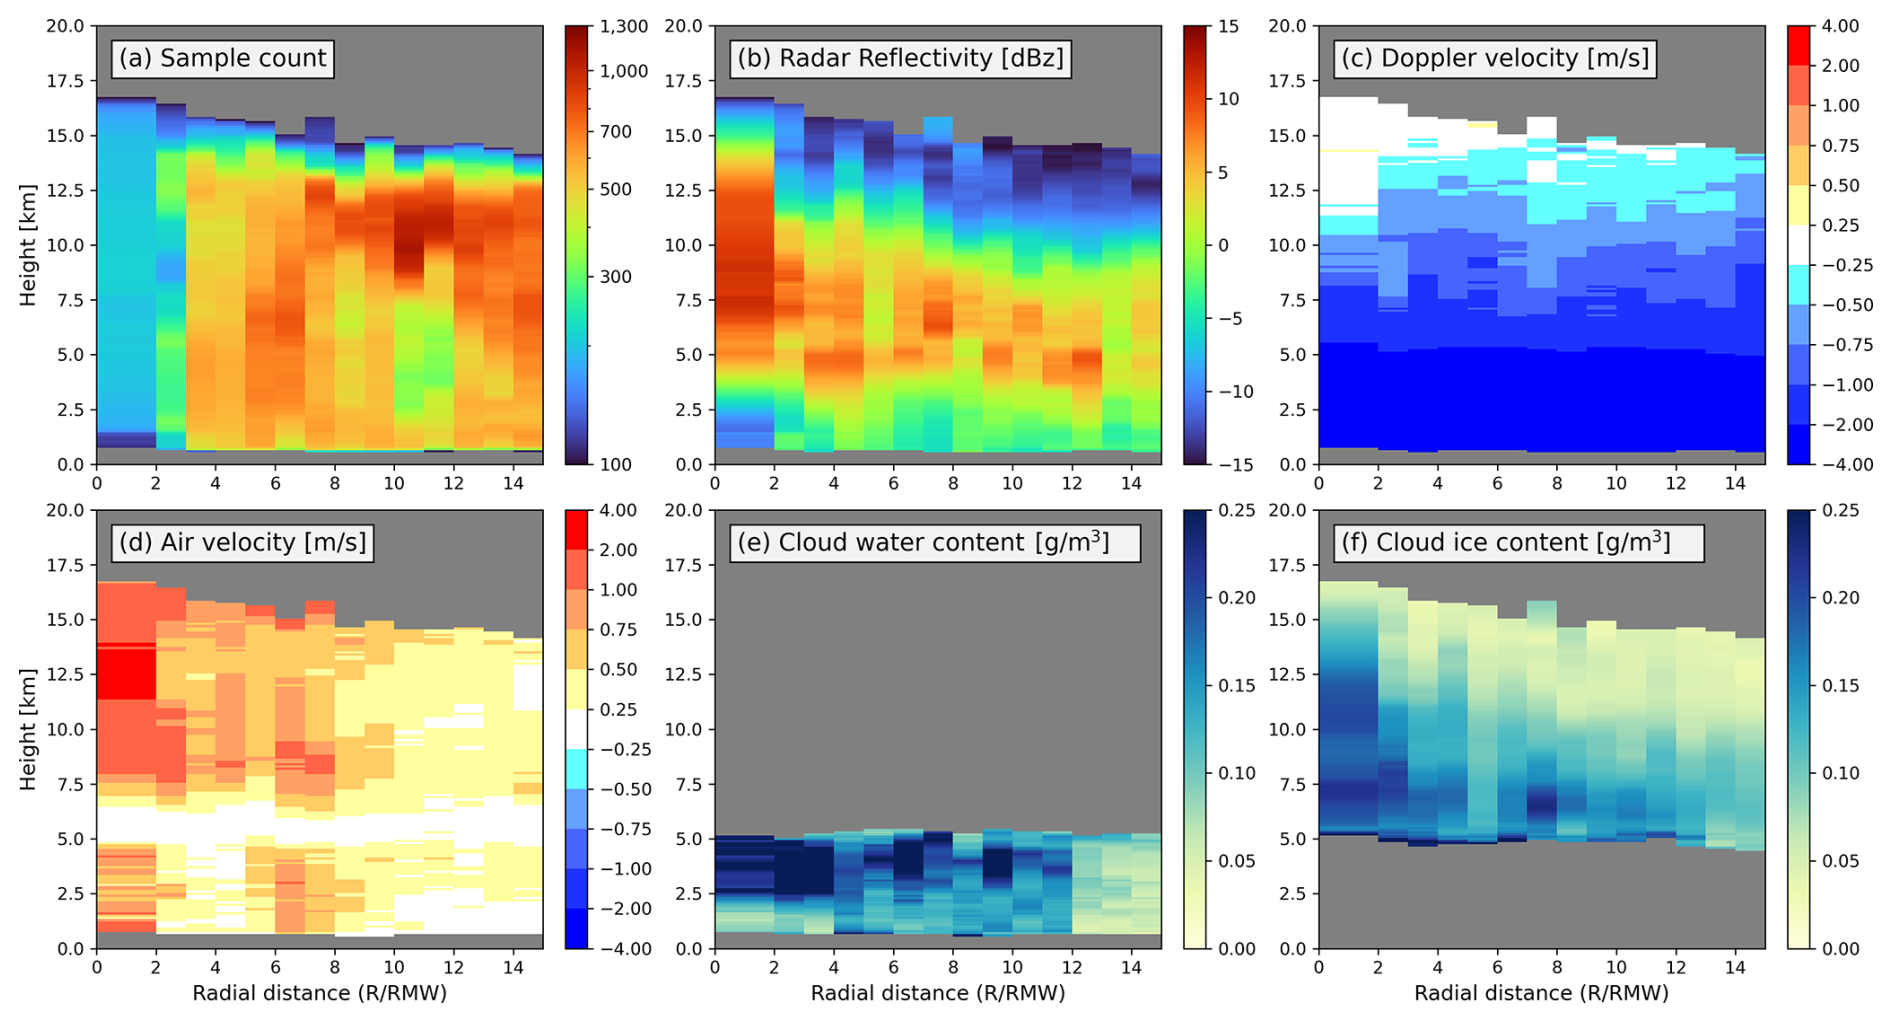
Figure 2Radial composites as a function of normalized radial distance (RMW) for (a) sample size [#], (b) radar reflectivity [dBZ], (c) Doppler velocity [m s−1], (d) air velocity [m s−1], (e) cloud water content [g m−3], and (f) cloud ice content [g m−3].
3.1 Radial Composites of Tropical Cyclones
Figure 2 presents the radial-height composite structures observed by EarthCARE. Because of the limited sampling in the inner-core region, all samples within 2 RMW are combined into a single radial bin, while 1-RMW bins are used farther outward. The sample count shows considerable observational coverage outside 2 RMW, with generally sufficient sampling throughout the 2–15 RMW range (Fig. 2a). Radar reflectivity (Fig. 2b) reveals a coherent vertical structure characterized by enhanced echoes in the inner-core region (R < 2 RMW), where strong reflectivity extends to 12.5 km. The upper extent of strong reflectivity decreases sharply outside 2 RMW, indicating the transition from the inner-core to the rainband region. In the rainband region (2 RMW ≤ R < 5 RMW), radar reflectivity above 5 km is slightly weaker than in the inner-core region, while a pronounced reflectivity layer near 5 km corresponds to the melting layer. Beyond 5 RMW, the vertical extent of reflectivity generally decreases with increasing distance from the TC center. Overall, the composite structure derived from the EarthCARE observations is consistent with the canonical organization of TCs, including a deep convective inner core and progressively weaker outer rainbands. Three radial regions are defined based on RMW: the inner region (R < 2 RMW), the rainband region (2 RMW ≤ R < 5 RMW), and the outer region (5 RMW ≤ R < 15 RMW). The 5-RMW boundary is used as a practical threshold for the regional analysis rather than as a strict physical boundary. Sensitivity tests using 4 and 6 RMW as the boundary produce qualitatively similar results (see Supplement for details). These definitions are used throughout the following analysis.
Doppler velocity shows predominantly negative values below 15 km (Fig. 2c), with a broadly similar vertical structure across radial regions. Above the freezing level (∼ 5 km), Doppler velocity increases from approximately −2 m s−1 to near 0 m s−1 with height. Below the freezing level, Doppler velocities become more negative, reaching around −4 m s−1, consistent with the contribution of liquid particle fall speeds in the lower troposphere. Vertical air velocity exhibits upward motion in the mid-to-upper troposphere (Fig. 2d). A layer of near-zero vertical velocity is observed around 5–7 km across all regions, in which the retrieval of vertical motion in mixed-phase conditions may be uncertain (see Sect. 2.1.1). Stronger upward motion is evident in the inner-core region (R < 2 RMW) between approximately 7.5 and 15 km height, while upward motion is more confined to 7.5–12.5 km height in the rainband region (2 RMW ≤ R < 5 RMW). Beyond 5 RMW, the magnitude of upward motion generally decreases. Notably, localized upward motion is also observed below the freezing layer in the inner-core region and in parts of the outer region between 6 and 8 RMW. The vertical structure of air motion in the inner-core and outer regions resembles convective updrafts, except for a gap that may be due to retrieval uncertainties in the mixed-phase layer. On the other hand, the rainband region shows a more stratiform structure, characterized by the bright band signal and top-heavy vertical motions.
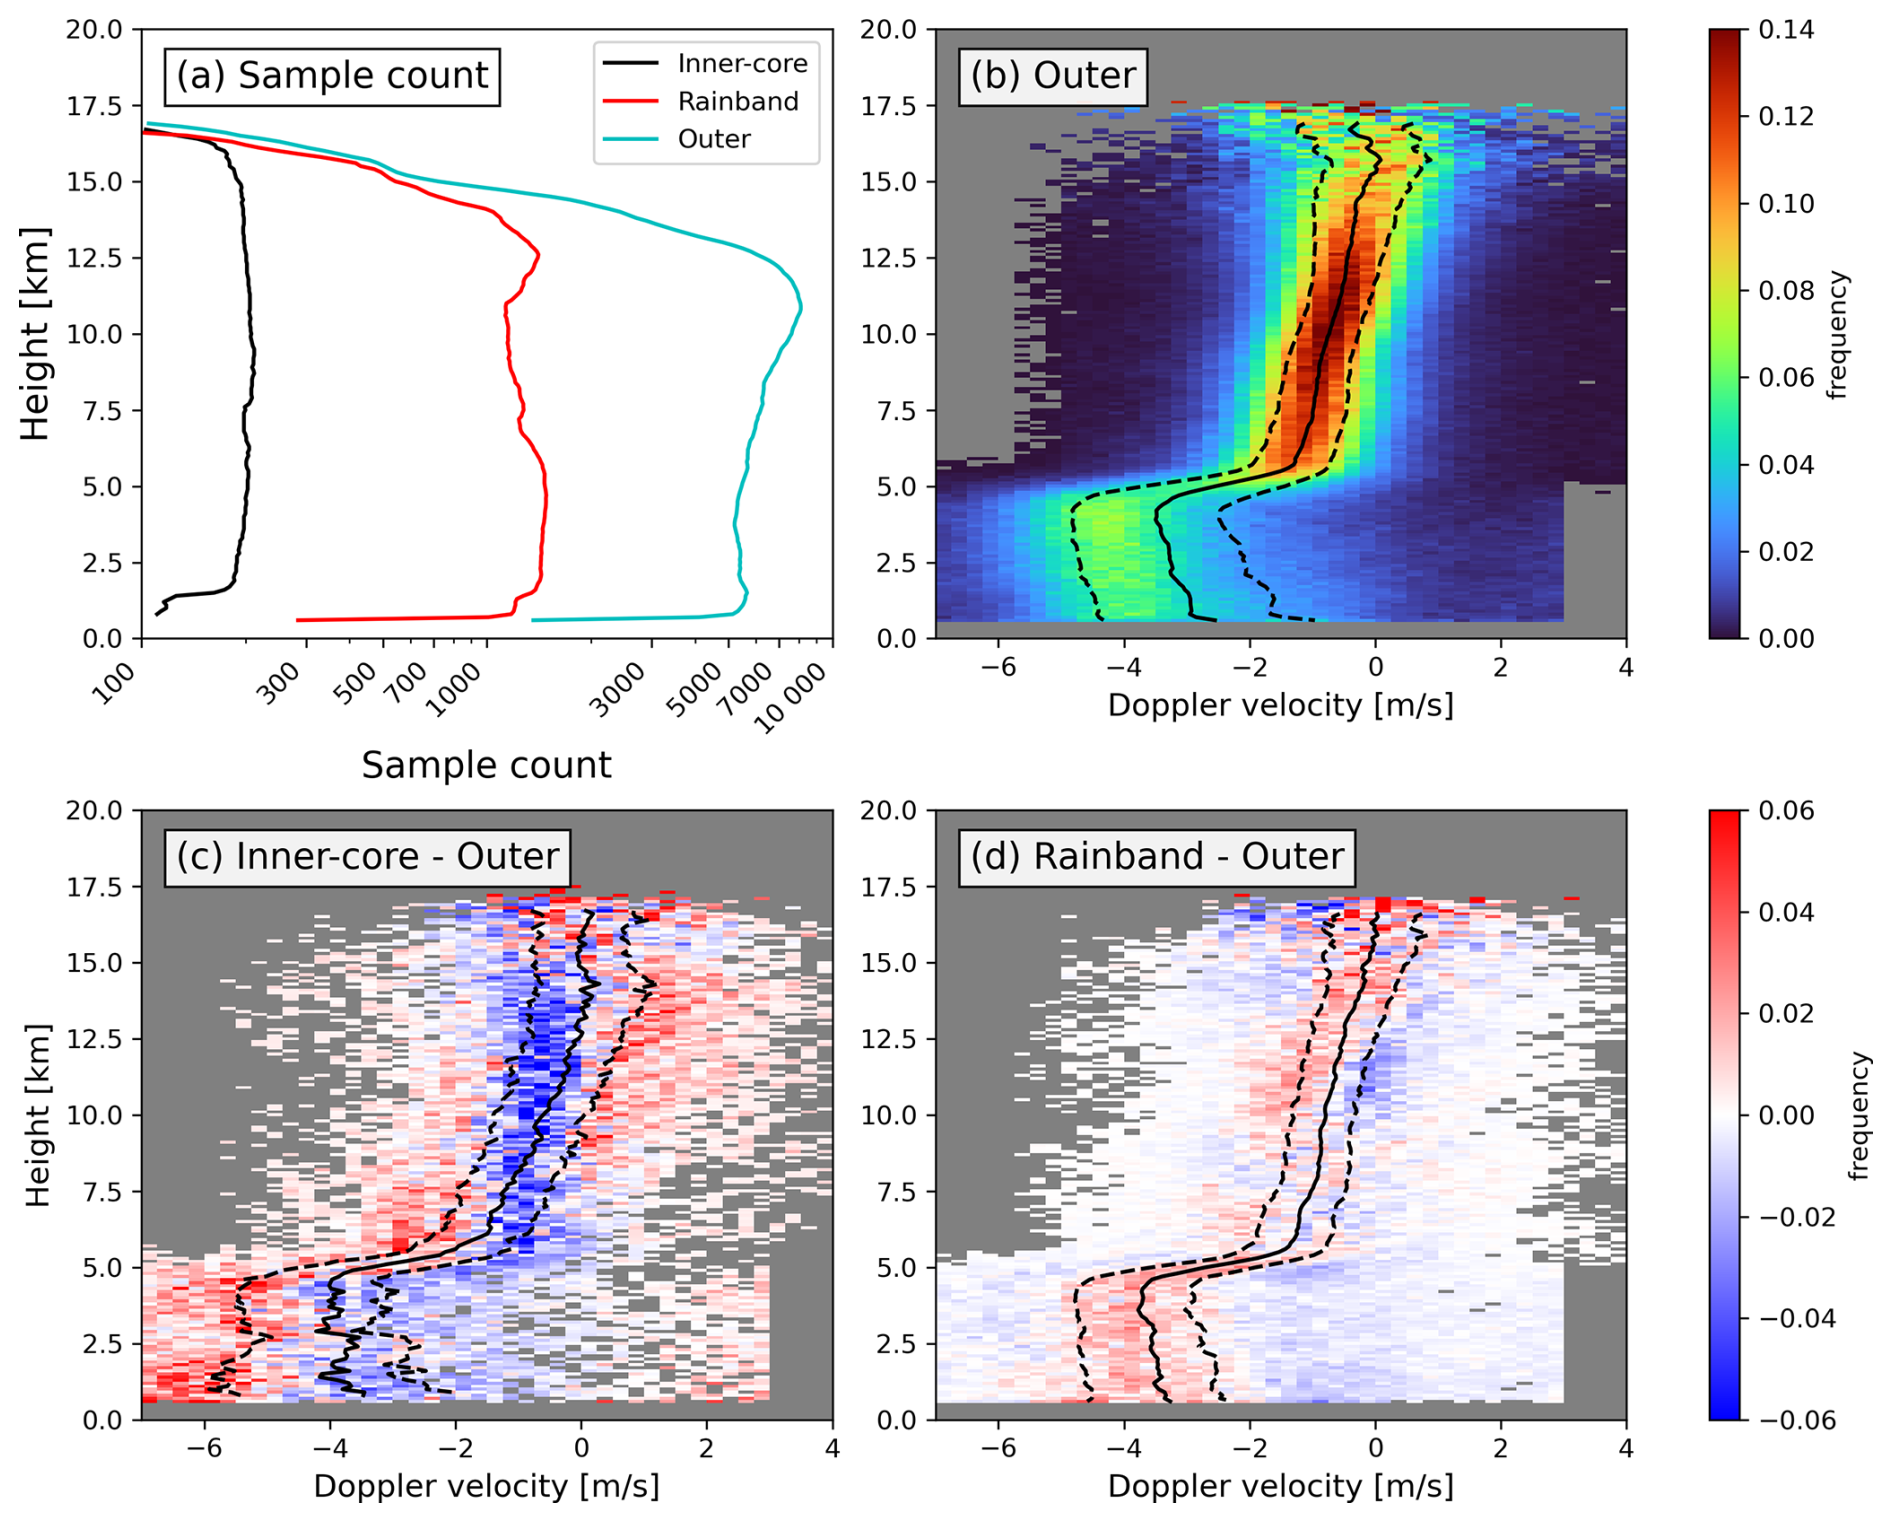
Figure 3(a) Sample sizes of three different regions. (b) PDF of Doppler velocity for the outer region (5 RMW ≤ R < 15 RMW). PDF differences for (c) inner-core and (d) rainband regions with respect to the outer region. Solid lines represent the mean of Doppler velocity, while dashed lines indicate the interquartile range. The PDFs are normalized independently at each level.
The distributions of the retrieved cloud water and cloud ice further illustrate the cloud microphysical structure of TCs (Fig. 2e and f). Cloud water is primarily confined to the lower troposphere below approximately 5 km, while cloud ice dominates the upper troposphere above this level. Within R < 8 RMW, cloud water is most pronounced between approximately 2.5 and 5 km, while the amount decreases below this layer. Below approximately 2.5 km, cloud water retrieval may be affected by attenuation, potentially leading to an underestimation of liquid water content near the surface. The radial-height structure of cloud ice generally matches that of radar reflectivity, with enhanced ice content in regions of stronger reflectivity. The distributions of cloud water and ice contents provide information on cloud microphysical structures in TCs for further model evaluations.
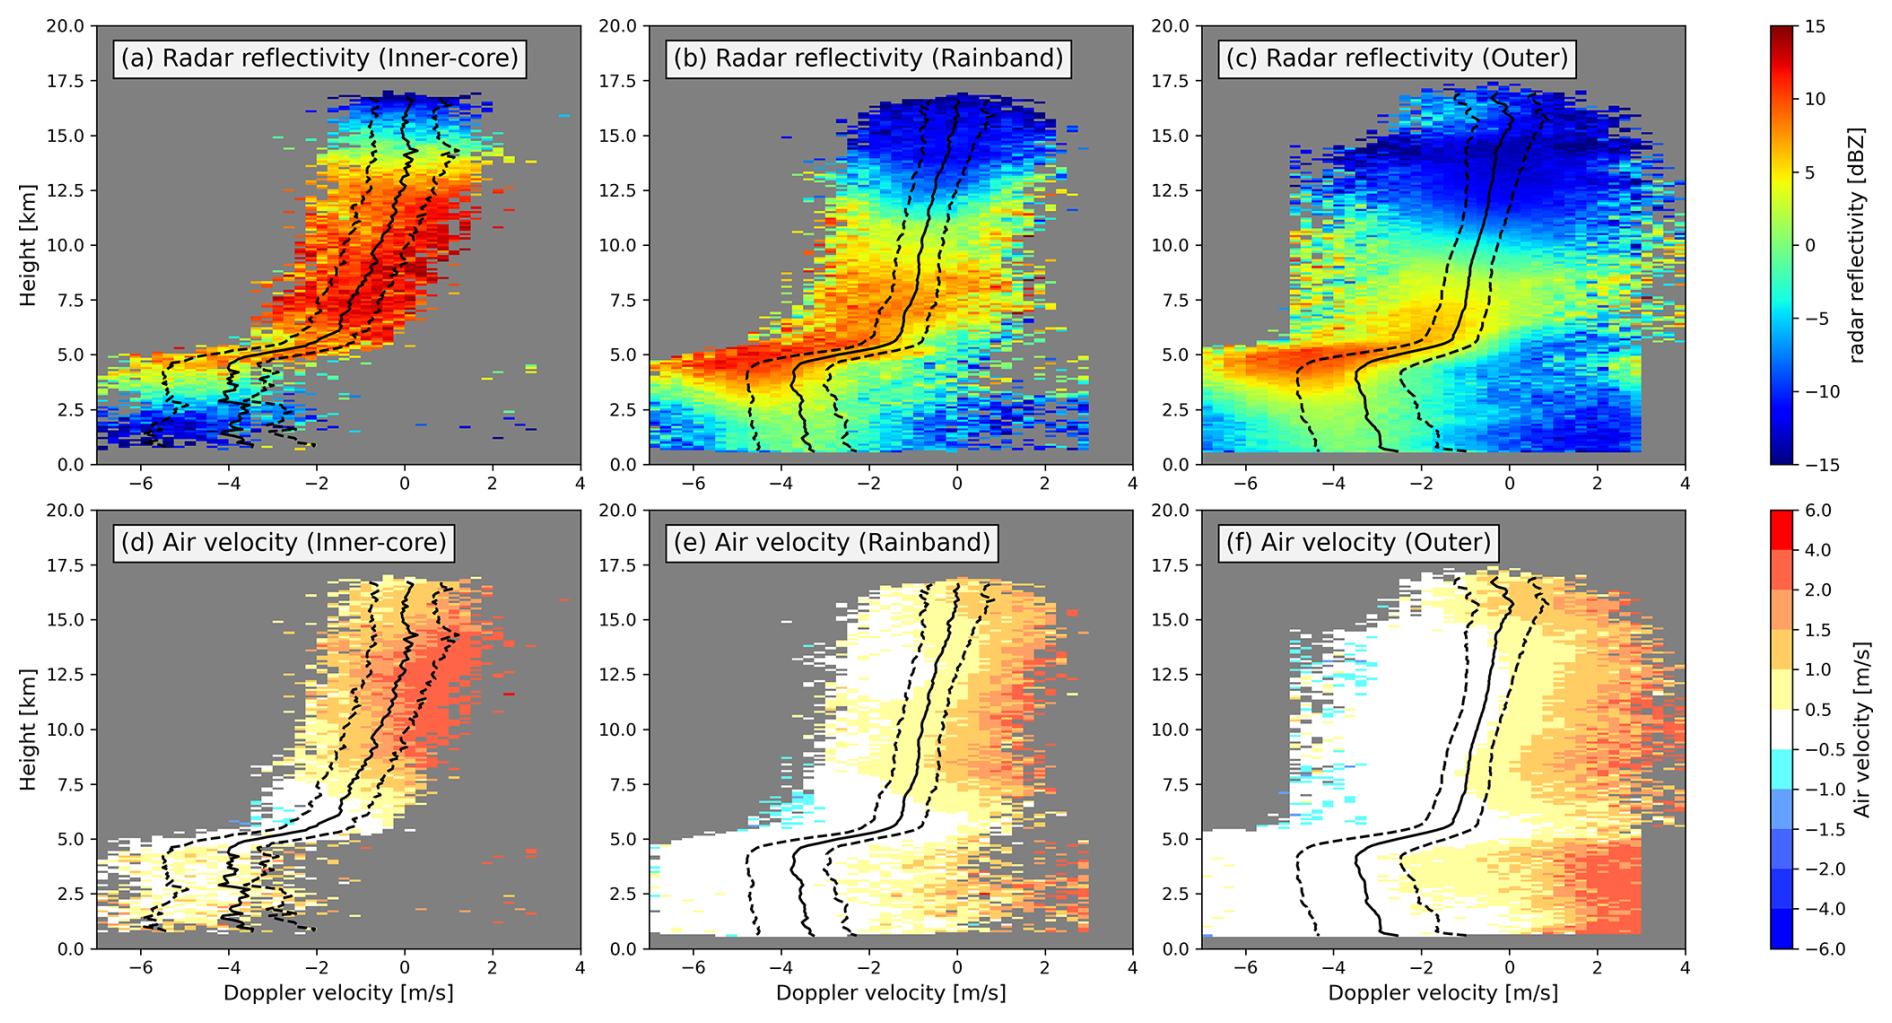
Figure 4Conditional composite of radar reflectivity (a–c) and air velocity (d–f) on the Doppler velocity bins for (a, d) inner-core, (b, e) rainband, and (c, f) outer regions. Solid lines represent the mean Doppler velocity, while dashed lines indicate the interquartile range. Shading is shown only for bins containing more than five samples.
3.2 Doppler and Vertical Air Velocity
Based on the structural differences identified in Fig. 2, the samples are divided into inner-core, rainband, and outer regions to examine the distribution of Doppler velocity in more detail. The sample size in each region exceeds 100 across most vertical levels (Fig. 3a), providing sufficient grid point-level coverage for examining distributions of Doppler velocity. However, the samples in the inner-core region are obtained from only two independent EarthCARE intercept events (Fig. S2). The two events exhibit similar Doppler velocity characteristics (Fig. S3), suggesting that the distributions capture consistent features of the sampled inner-core structures, although they should not be interpreted as statistically representative of TCs in general. At each height, the Doppler velocity PDF is normalized independently using the valid samples at that level, so that each vertical level represents its own Doppler velocity distribution. For Fig. 3c and d, the normalized PDF of the outer region is subtracted from the normalized PDFs of the inner-core and rainband regions, respectively. Positive values therefore indicate Doppler velocity ranges with higher frequency than in the outer region, while negative values indicate lower frequency. Sensitivity tests using 4 and 6 RMW as the rainband-outer-region boundary show similar Doppler velocity distributions (Figs. S4 and S5 in the Supplement), indicating that the main characteristics are insensitive to the exact choice of this boundary.
The Doppler velocity probability density function (PDF) in the outer region is used as a reference (Fig. 3b). A transition in Doppler velocity at around 5 km in height is consistent with the melting level and the transition between predominantly ice- and liquid-phase particle layers. Above the melting level, the PDF is relatively symmetric and concentrated within the interquartile range. In contrast, below the melting level, the PDF becomes broader and skewed toward negative velocities, with a mean around −3 m s−1 and a peak near −4 m s−1. The inner-core region exhibits a substantially broader distribution compared to the outer region (Fig. 3c). Below the melting level, the frequency increases toward more negative velocities, including values around −6 m s−1. Between 5 and 7.5 km, the PDF shifts to more negative values. Above 7.5 km, the frequency decreases within the interquartile range and increases toward less negative and more positive Doppler velocities, indicating greater variability in the observed hydrometeor Doppler velocities. In the rainband region (Fig. 3d), the Doppler velocity distribution is systematically shifted toward more negative values relative to the outer region. The frequency increases on the negative side and decreases on the positive side across most altitudes. To summarize, the Doppler velocity distributions exhibit distinct characteristics across radial regions: a broadened distribution in the sampled inner-core region, a negatively shifted distribution in the rainband region, and a relatively narrow distribution in the outer region.
We examine the conditional distributions of radar reflectivity and vertical air velocity (Fig. 4) to further understand the cloud and dynamical structures associated with different Doppler velocity ranges. In the inner-core region, enhanced radar reflectivity is primarily observed above the freezing level, while weaker signals below are likely influenced by attenuation from overlying dense clouds (Fig. 4a). Strong reflectivity is associated with Doppler velocities greater than the upper quartile, indicating that enhanced reflectivity tends to occur at more positive Doppler velocities. In the rainband region, strong reflectivity is mainly located at Doppler velocities smaller than the mean around the freezing level (Fig. 4b). Above 6 km, enhanced reflectivity occurs in the region where Doppler velocities are lower than the mean value. The significant signal near the freezing level indicates a radar-bright band, consistent with stratiform precipitation. In the outer region, reflectivity is generally weaker than in the rainband and is largely confined near the freezing level (Fig. 4c). The relatively enhanced reflectivity in the rainband may reflect larger particle sizes and/or greater particle concentrations compared with the outer region.
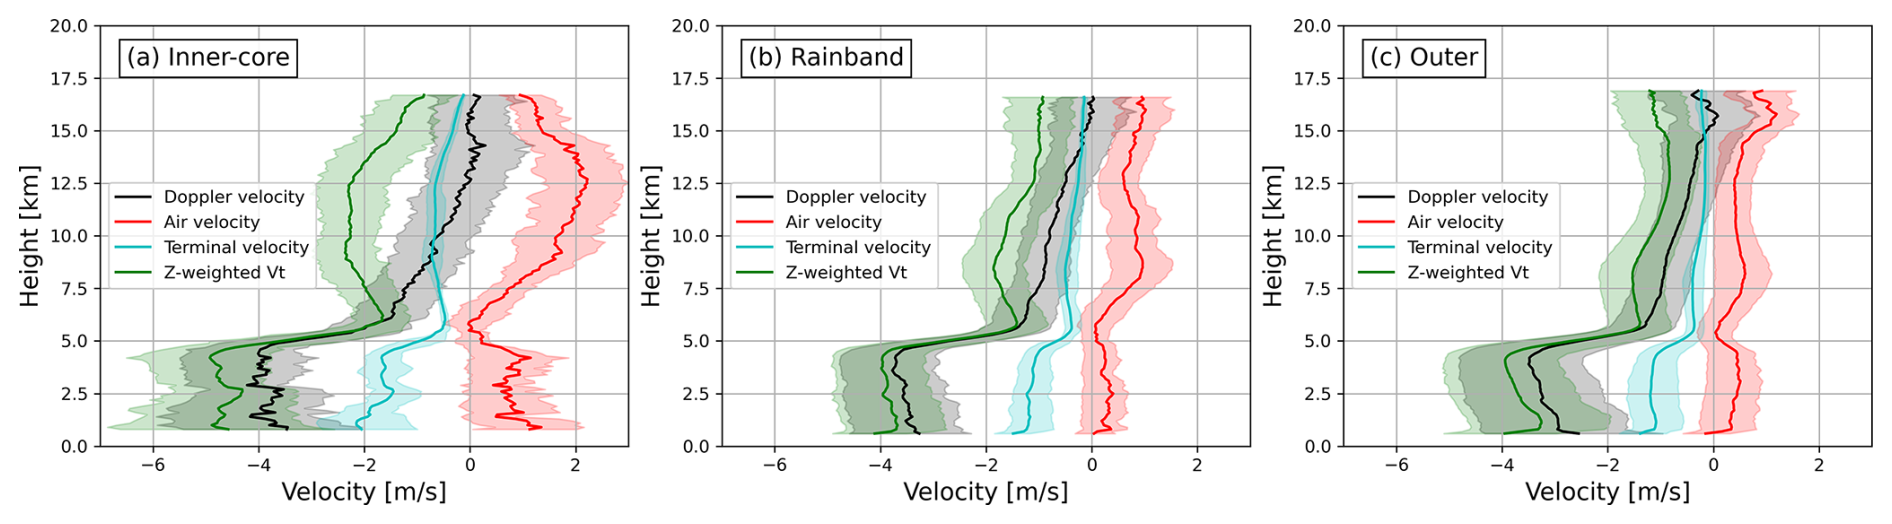
Figure 5The means and interquartile ranges of Doppler velocity, air velocity, terminal velocity, and radar reflectivity-weighted terminal velocity (Vtz) in (a) inner-core, (b) rainband, and (c) outer regions.
To further interpret the regional differences in Doppler velocity, we next examine the conditional distributions of retrieved vertical air velocity. Because Doppler velocity reflects the combined effects of air motion and particle fall speed, these differences cannot be attributed to either component from the Doppler velocity PDFs alone. In the inner-core region, upward motion above the freezing level within the interquartile range reaches approximately 1–2 m s−1, and stronger updrafts (> 2 m s−1) occur at Doppler velocities greater than the upper quartile (Fig. 4d). These updrafts coincide with regions of enhanced reflectivity, which is consistent with convective updraft structures. The more positive Doppler velocities in the sampled upper inner-core region coincide with stronger upward air motion, indicating that upward air motion is associated with the more positive side of the Doppler velocity distribution at these levels. In contrast, vertical air velocity in the rainband region is weaker (approximately 0.5 m s−1) over most of the interquartile range (Fig. 4e). In the outer region, vertical motion is generally weak across the Doppler velocity range (Fig. 4f). The retrieved air velocities in the rainband and outer regions are broadly similar over most of the Doppler velocity range, with noticeable differences mainly at Doppler velocities greater than the upper quartile. In addition, radar reflectivity is generally stronger within the interquartile range in the rainband region. These results suggest that the systematic negative shift of the rainband Doppler velocity distribution relative to the outer region is more closely related to differences in particle fall speed. Overall, these results indicate that regional differences in Doppler velocity arise from different combinations of air motion and particle fall speed. More positive Doppler velocities are associated with the stronger upward air motion in the upper inner-core region. In contrast, the negative shift in the rainband relative to the outer region is consistent with slightly faster particle sedimentation, while their vertical air motions remain similar.
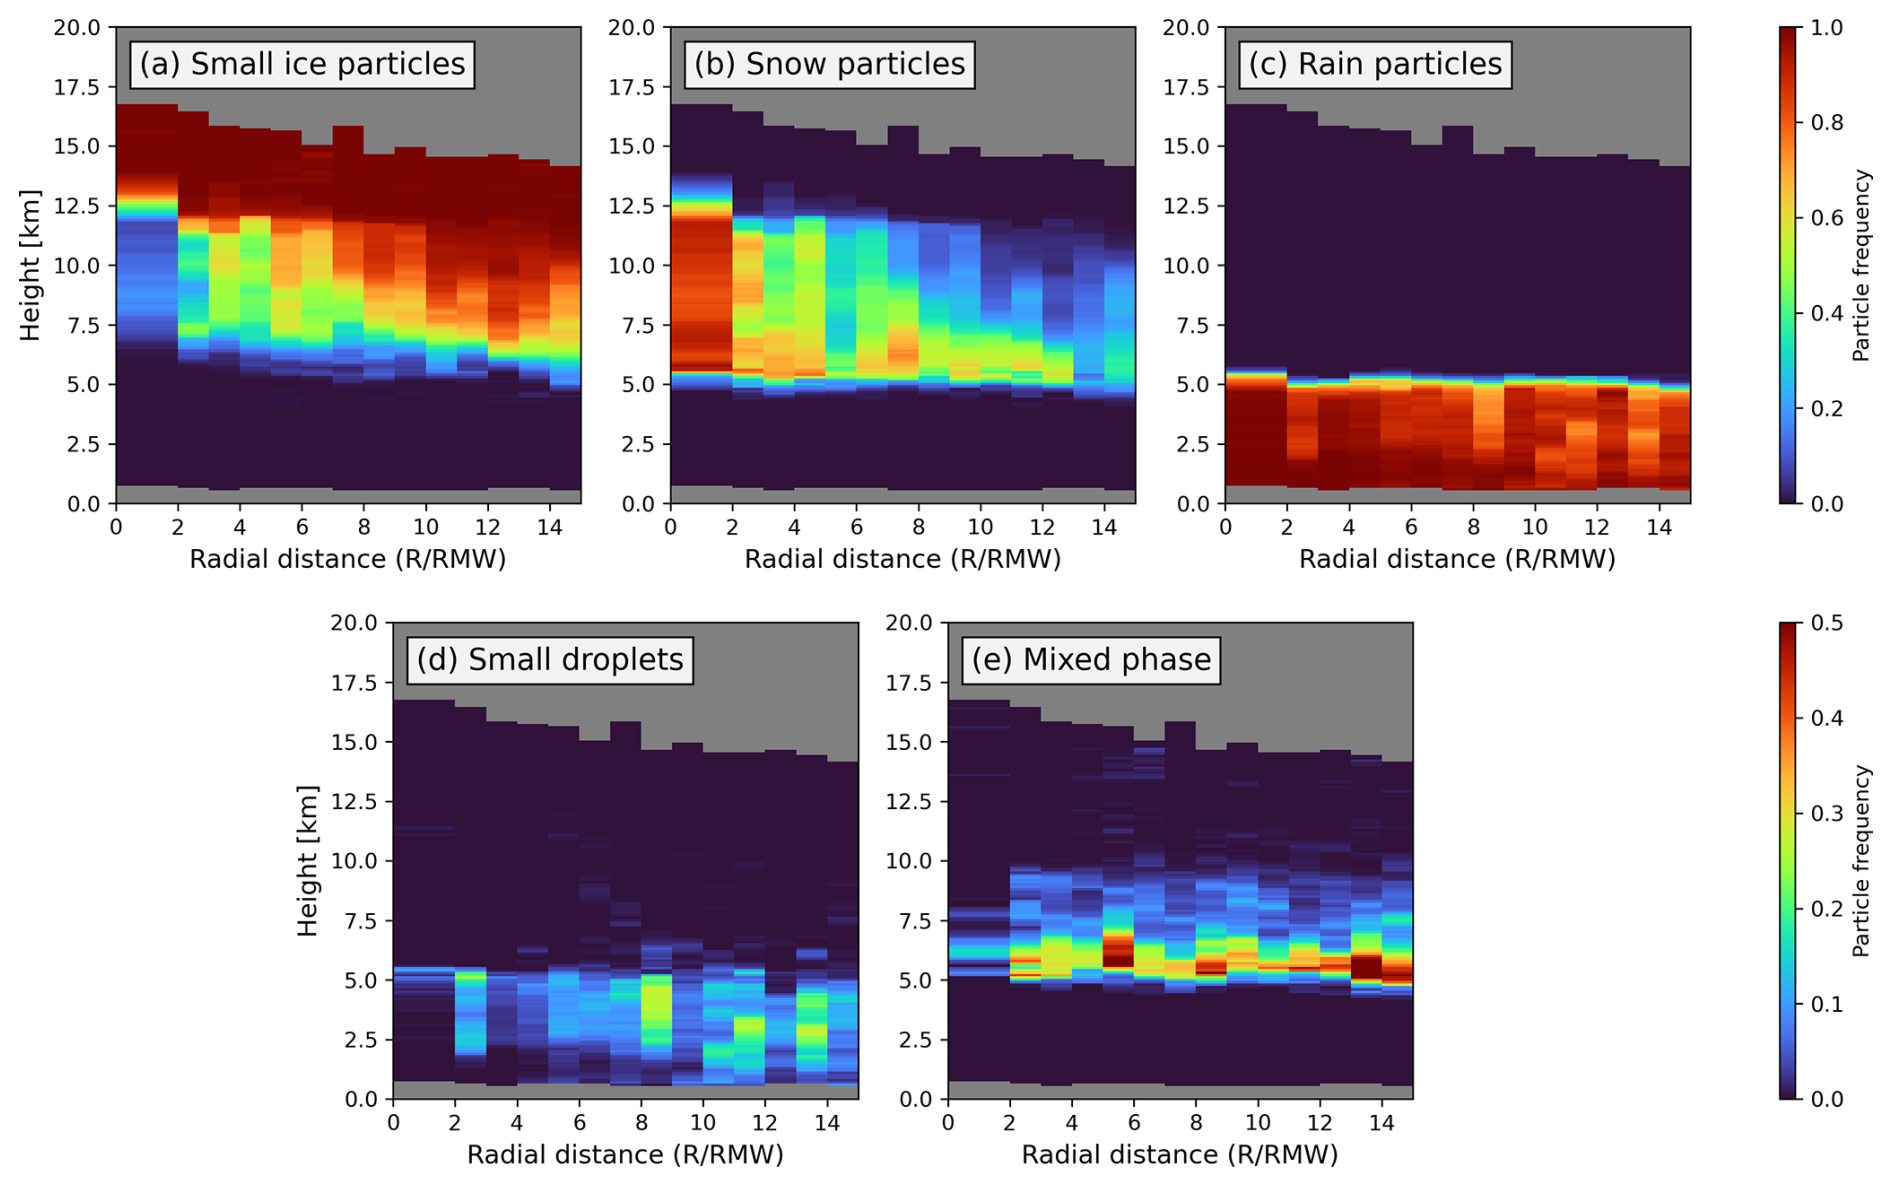
Figure 6Radial-height frequency diagram of (a) small ice particles, (b) snow particles, (c) rain particles, (d) small droplets, and (e) mixed-phase particles.
We further separate Doppler velocity into air velocity and radar reflectivity-weighted terminal velocity to examine the regional differences in more detail (Fig. 5). We also use the retrieved terminal velocity to interpret our results. The retrieved particle terminal velocity represents the estimated falling speed of particles, while the radar reflectivity-weighted terminal velocity represents the particle falling motion as reflected in the observed Doppler velocity. In the inner-core region, upward air motion above approximately 7 km is stronger and more variable than in the rainband and outer regions (Fig. 5a). The radar reflectivity-weighted terminal velocity is negative at these levels, but the stronger upward air motion partly offsets the particle falling motion, resulting in Doppler velocities closer to 0 m s−1. This is consistent with the enhanced frequency of more positive Doppler velocities in the upper inner-core region shown in Fig. 3c. In the rainband region, vertical air velocity is weaker than in the inner-core region and is similar to that in the outer region in the ice-phase layer (Fig. 5b and c). In contrast, the radar reflectivity-weighted terminal velocity is slightly more negative in the rainband than in the outer region. The retrieved particle terminal velocity also shows slightly more negative values in the rainband. Because the retrieved and radar reflectivity-weighted terminal velocities are not fully independent, their differences should be interpreted as being consistent with slightly faster particle sedimentation rather than as independent evidence. The differences between rainband and outer regions are small and are comparable to the magnitude of retrieval differences reported in previous studies, so these differences should be interpreted qualitatively. Because particle terminal velocity depends on particle size as well as shape, density, and other particle properties, the slightly faster terminal velocity may be associated with the presence of somewhat larger and/or denser particles. This result is also consistent with the stronger radar reflectivity in the rainband shown in Fig. 4b. These features are consistent with the systematic shift of the rainband Doppler velocity distribution toward more negative values compared to the outer region (Fig. 3d). Below the melting level, both radar reflectivity-weighted terminal velocity and retrieved particle terminal velocity become substantially more negative in all three regions, while regional differences in vertical air velocity are relatively small. Overall, the separation of Doppler velocity shows that the more positive Doppler velocities in the upper levels in the sampled inner-core region are associated with stronger upward air motion. In contrast, the negative shift in the rainband relative to the outer region is consistent with slightly faster particle sedimentation, while their vertical air motions remain similar.
Airborne and ground-based Doppler radar observations provide a useful context for the vertical air motions observed by EarthCARE. Black et al. (1996) found that more than 70 % of vertical velocities in eyewall, rainband, and stratiform regions of seven hurricanes were within −2 to 2 m s−1, while the eyewall exhibited the broadest distribution and approximately 5 % of the vertical velocities exceeded 5 m s−1. In our EarthCARE observations, vertical air velocities in the sampled inner-core region are mostly around 1–2 m s−1 above the freezing level, with stronger upward motions exceeding 2 m s−1 occurring on the more positive side of the Doppler velocity distribution. Thus, although the strongest updrafts reported by airborne radar are not well represented in the present EarthCARE composite, the broader distribution and stronger upward air motion in the inner-core region are qualitatively consistent with previous observations. Ground-based dual-Doppler observations of Hurricane Ike also identified localized eyewall updrafts with a mean peak upward velocity of approximately 8.3 m s−1 associated with mesovortices (Wingo and Knupp, 2016), further illustrating that localized eyewall updrafts can be substantially stronger than the composite values observed here.
For the rainband region, the EarthCARE composite is dominated by weaker upward motion of approximately 0.5 m s−1 and a pronounced bright band, indicating mainly stratiform-like characteristics in the sampled profiles. Airborne Doppler radar studies, however, have shown that localized convective updrafts can be embedded within TC rainbands (Hence and Houze, 2008; Barron et al., 2022). Barron et al. (2022) reported that the modal maximum velocity of identified rainband convective updrafts was approximately 1–2 m s−1, with 2–3 m s−1 updrafts also frequently observed at larger normalized radii. The weaker motions in our composite therefore should not be interpreted as evidence that convective elements are absent from rainbands. Instead, these elements are intermittent and occupy only part of the rainband area, while the limited number of independent EarthCARE intercepts and the narrow nadir sampling make them difficult to isolate in the present analysis. The EarthCARE composite therefore mainly represents the more frequently sampled stratiform component of the rainband, and additional observations will be needed to better characterize the embedded convective elements. Overall, the EarthCARE results are qualitatively consistent with previous Doppler radar observations, while differences in sampling should be considered when comparing the magnitude of vertical motion.
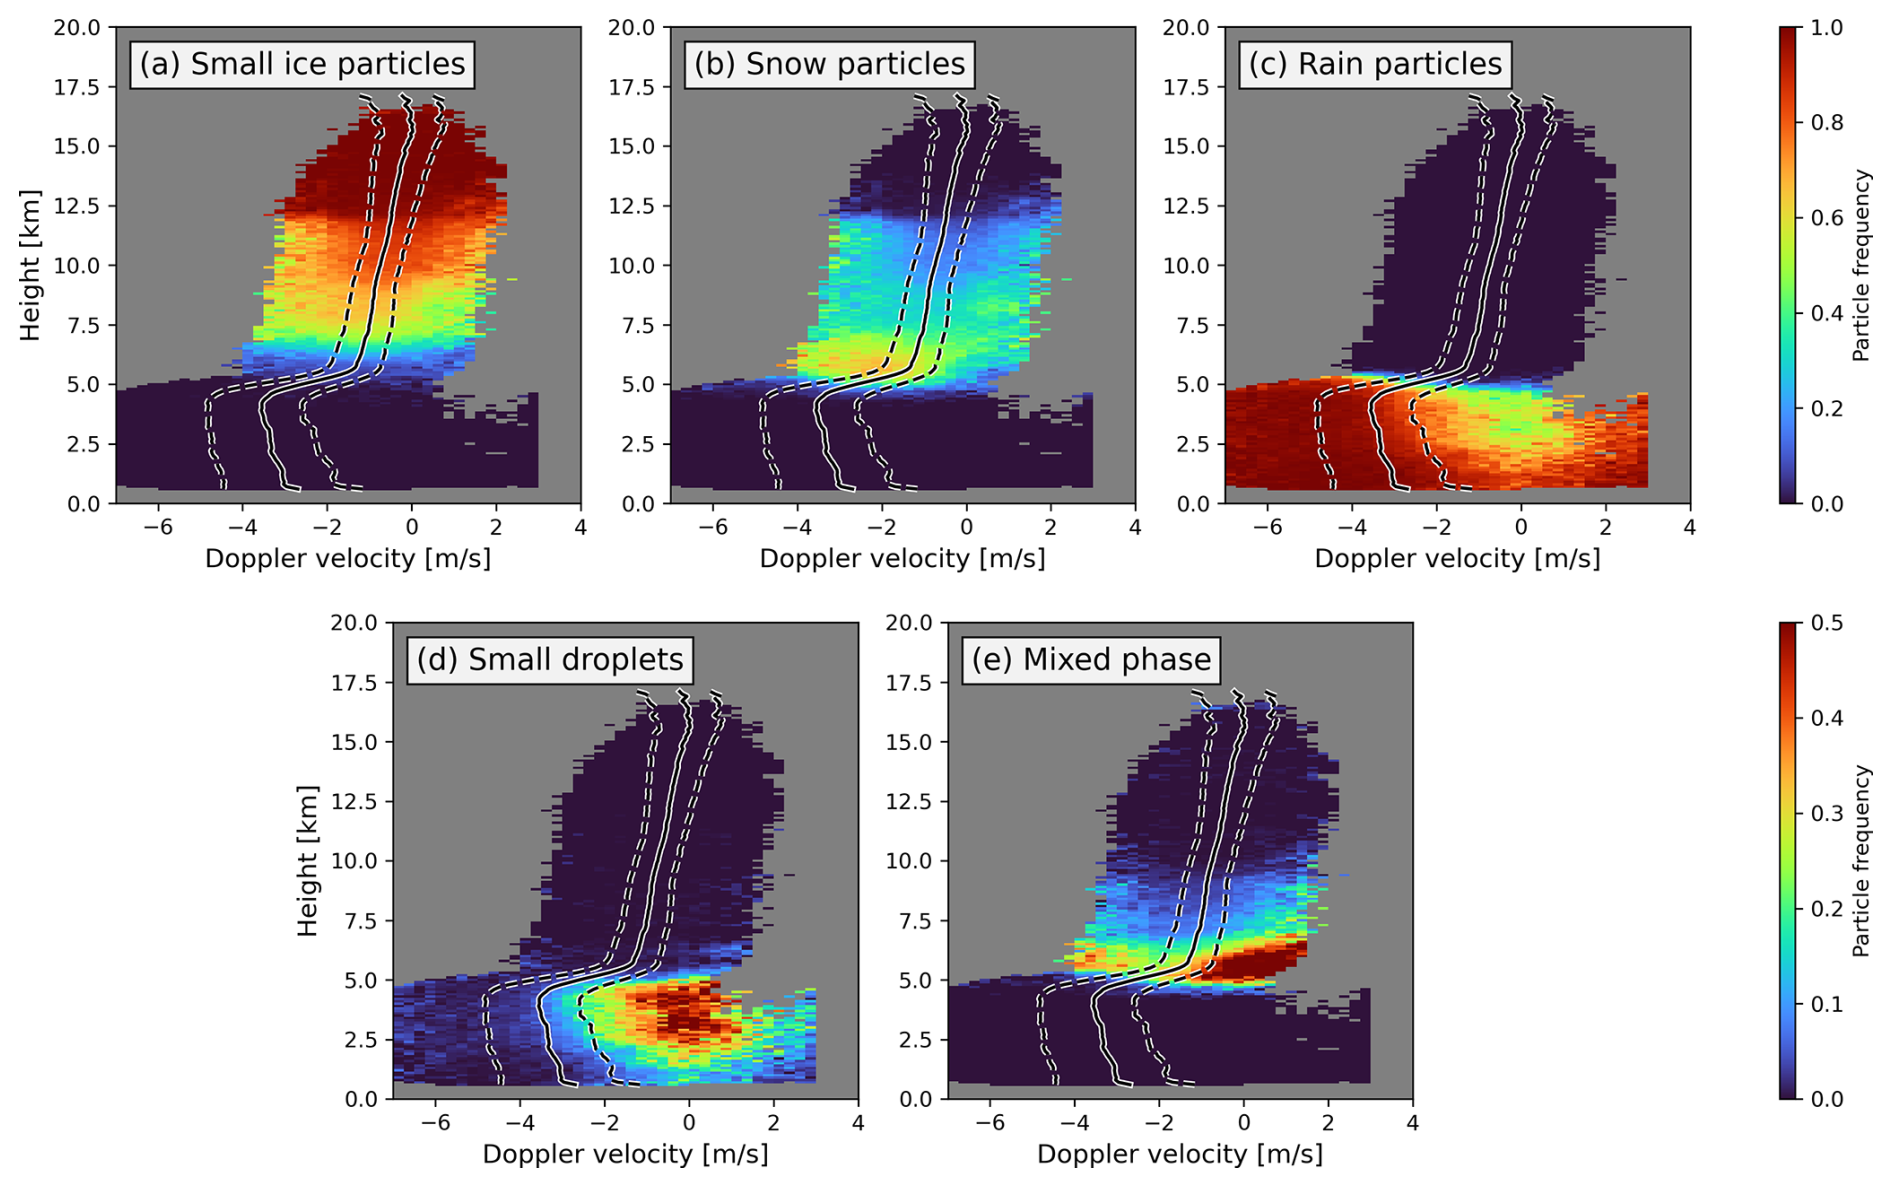
Figure 7Frequency diagrams of (a) small ice particles, (b) snow particles, (c) rain particles, (d) small droplets, (e) mixed-phase particles on the PDF of Doppler velocity. Solid lines indicate the mean Doppler velocity, while dashed lines indicate the interquartile range.
3.3 Cloud Particle Type
We investigate the distribution of cloud particle types retrieved from CPR and ATLID to further examine the cloud microphysical structures in TCs. The radial-height frequency diagrams of different particle types are shown in Fig. 6. We categorize the retrieved particle types into five groups: small ice particles, snow particles, rain particles, small droplets, and mixed-phase particles. Small ice particles include 3D ice, 2D plates, and mixtures of these types, while small droplets include warm water, liquid drizzle, water and liquid drizzle, and water and rain. The mixed phase group includes supercooled water, mixed-phase drizzle, and mixed-phase particles. At each radial-distance-height bin, particle frequency is calculated as the number of samples classified into each particle group divided by the total number of valid particle classifications in that bin. Therefore, the frequencies of the five groups sum to one in each bin. The distribution of cloud particle types exhibits a clear vertically stratified structure. Small ice particles dominate above 12 km across all regions (Fig. 6a). Between 5 and 12 km, snow particles are most prominent in the sampled inner-core region, whereas the rainband region contains a mixture of small ice particles and snow (Fig. 6b). The frequency of snow particles decreases toward the outer region and is largely confined below 10 km, while the frequency of small ice particles increases. This outward transition from snow to small ice particles is consistent with the slightly faster retrieved particle terminal velocities in the rainband compared with the outer region shown in Fig. 5. Below the freezing level (∼ 5 km), rain is the dominant hydrometeor type (Fig. 6c). Small droplets are rare within RMW < 5 but show an increase in occurrence in the outer region (Fig. 6d). Mixed-phase particle type mainly occurs between 5 and 7.5 km and is more frequently observed in the outer region (Fig. 6e). The outward shift from snow toward small ice particles provides additional evidence of regional differences in particle properties between the rainband and outer regions.
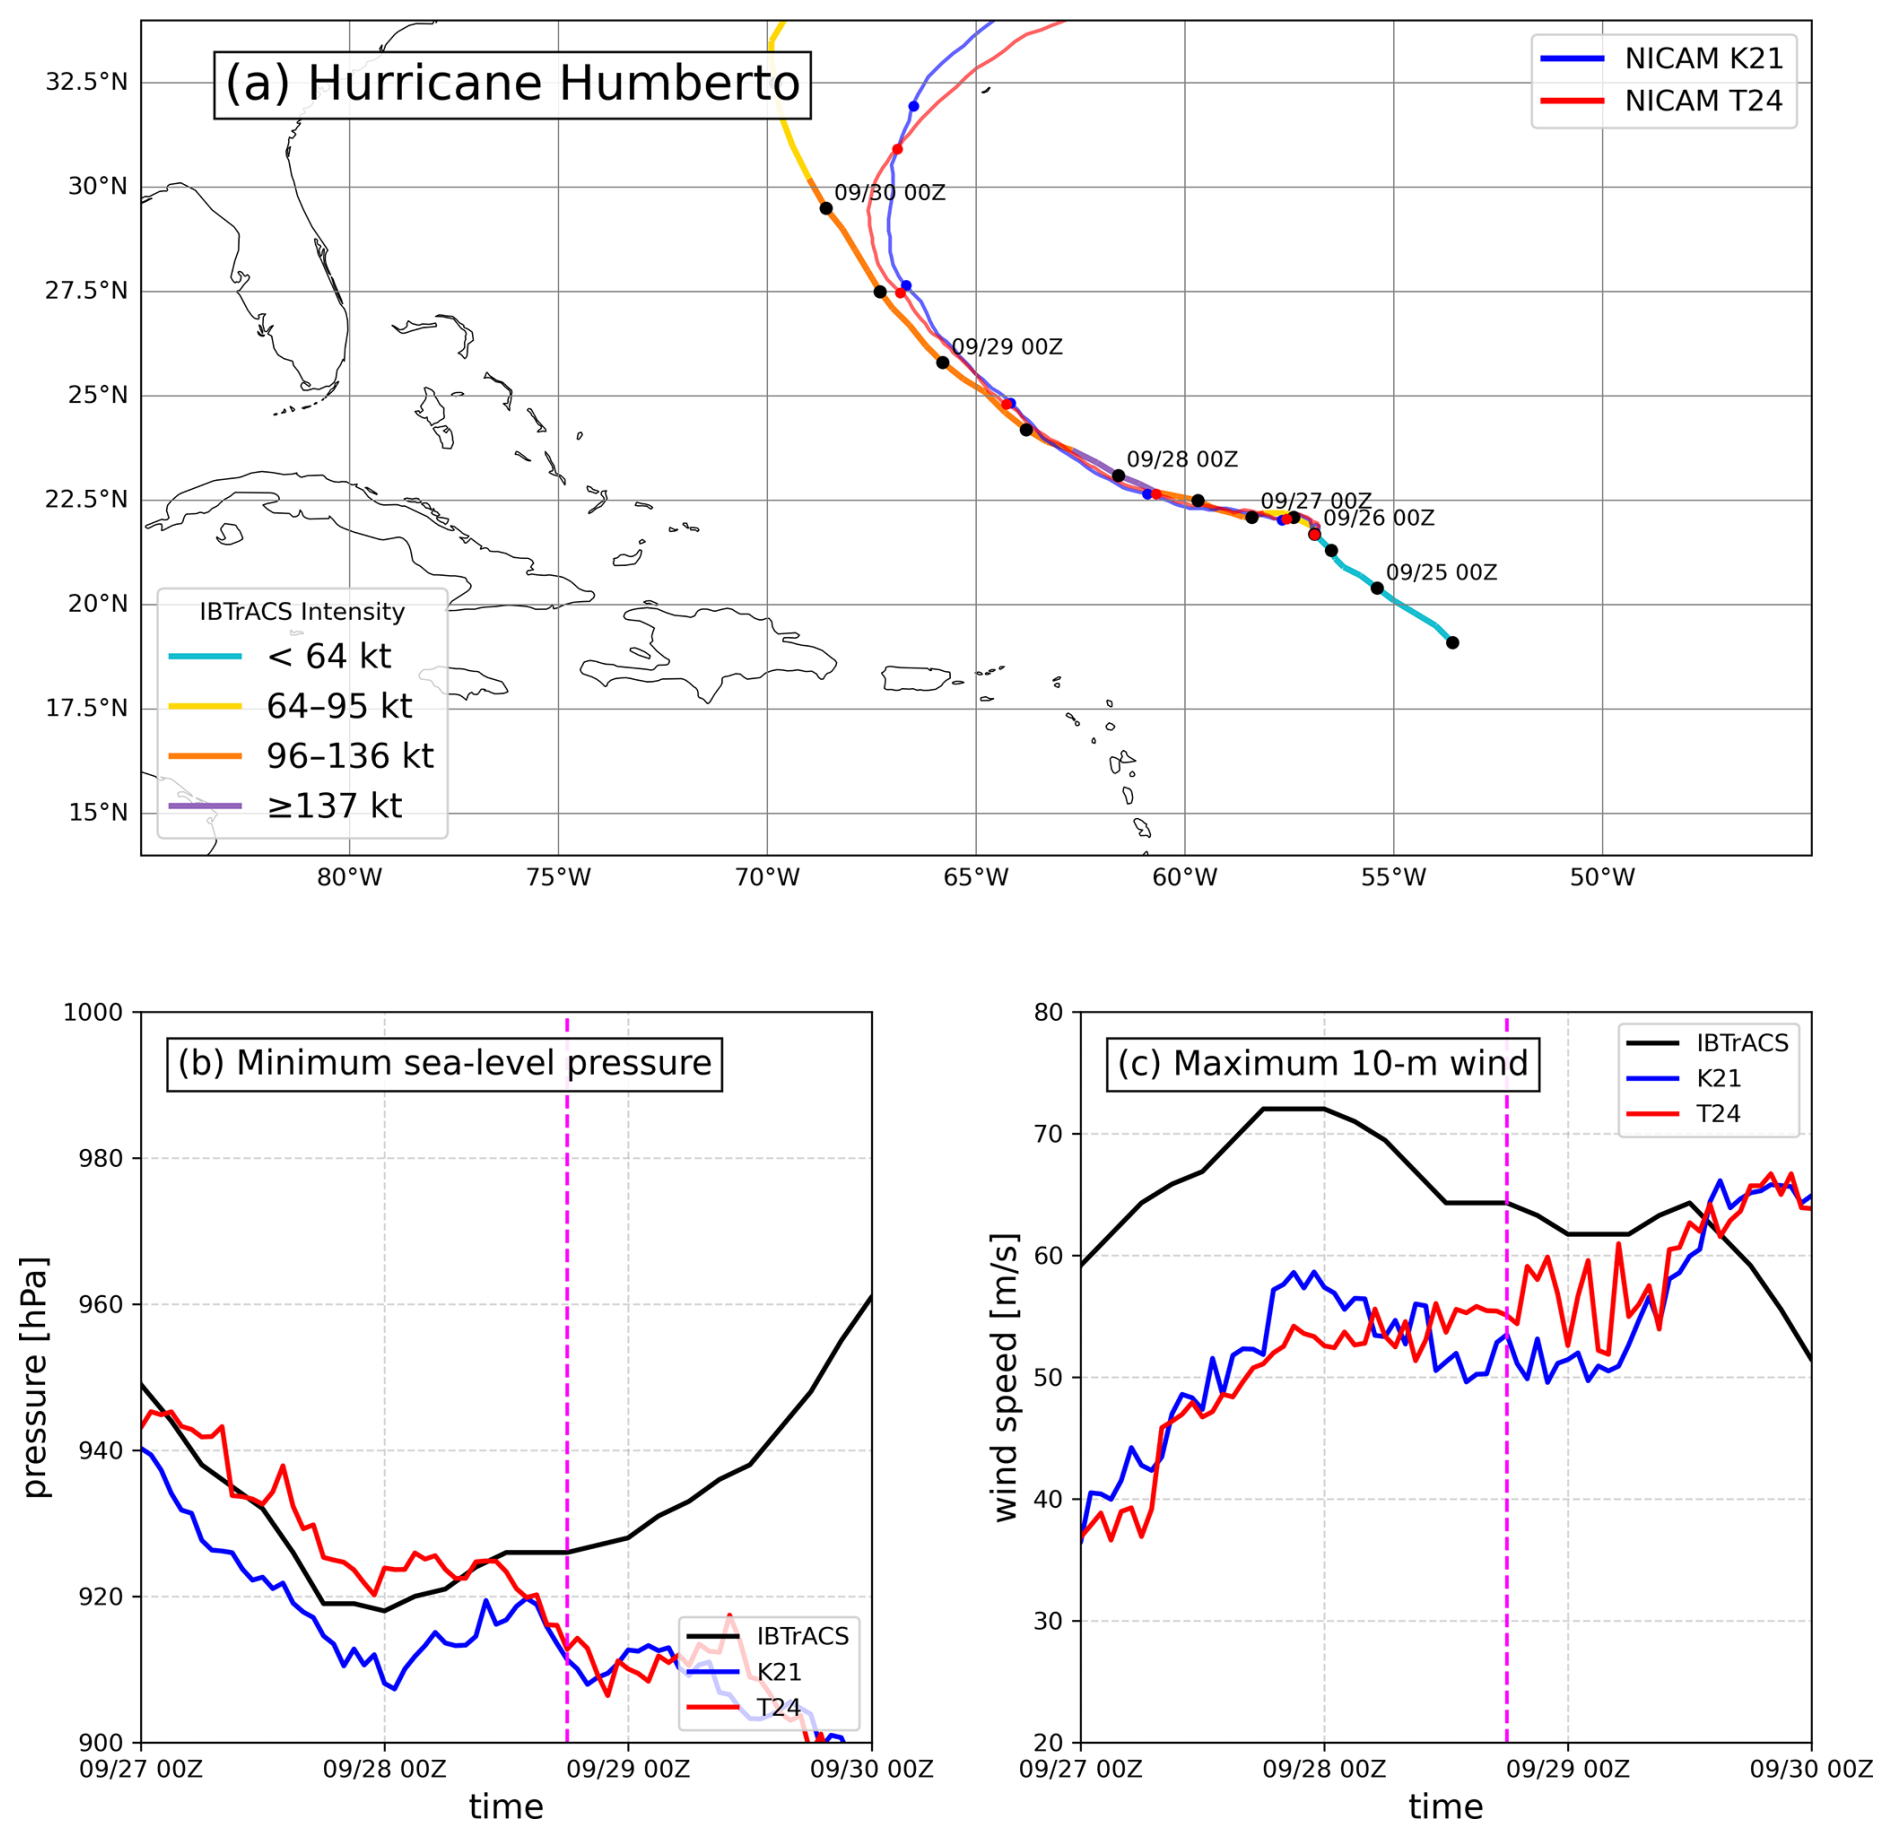
Figure 8(a) Tracks of IBTrACS, K21, and T24. The colored segments along the IBTrACS track indicate the observed storm-intensity categories. Time evolutions of (b) minimum sea-level pressure and (c) maximum near-surface wind. The vertical dashed pink lines indicate the timing when EarthCARE intercepted hurricane Humberto.
We further project the frequency diagrams onto Doppler velocity PDFs to investigate the relationship between Doppler velocity and cloud particle types. Because the sample sizes in the inner-core and rainband regions are insufficient for constructing separate frequency diagrams, all three regions are combined to construct the frequency diagrams in Doppler velocity space (Fig. 7). Small ice particles dominate above 7.5 km, except in regions beyond the upper quartile of Doppler velocity (Fig. 7a). In these regions, snow particles are present, although with lower frequency (Fig. 7b). Snow particles are mainly found between approximately 5 and 12 km and extend toward more negative Doppler velocities than small ice particles (Fig. 7b). Below the freezing level, rain is the dominant particle type (Fig. 7c). However, its frequency decreases in the region of Doppler velocity close to 0 m s−1, where small liquid droplets become more evident (Fig. 7d). Mixed-phase particles are concentrated near and above the melting level and exhibit a distribution across a broad range of Doppler velocities (Fig. 7e). Enhanced frequencies occur on both the more negative and less negative (or near-zero) sides of the Doppler velocity distribution. The less negative side overlaps with Doppler velocity ranges where stronger upward air motion is identified in Fig. 4, while the more negative side is consistent with faster particle falling. These results suggest that mixed-phase particles occur under two different conditions: regions with upward air motion or faster ice particle falling. The different cloud particle types occupy distinct parts of the Doppler velocity distribution, which provides the relationship between cloud particle properties, vertical air motion, and particle falling motion in TCs for evaluating cloud microphysics in models.
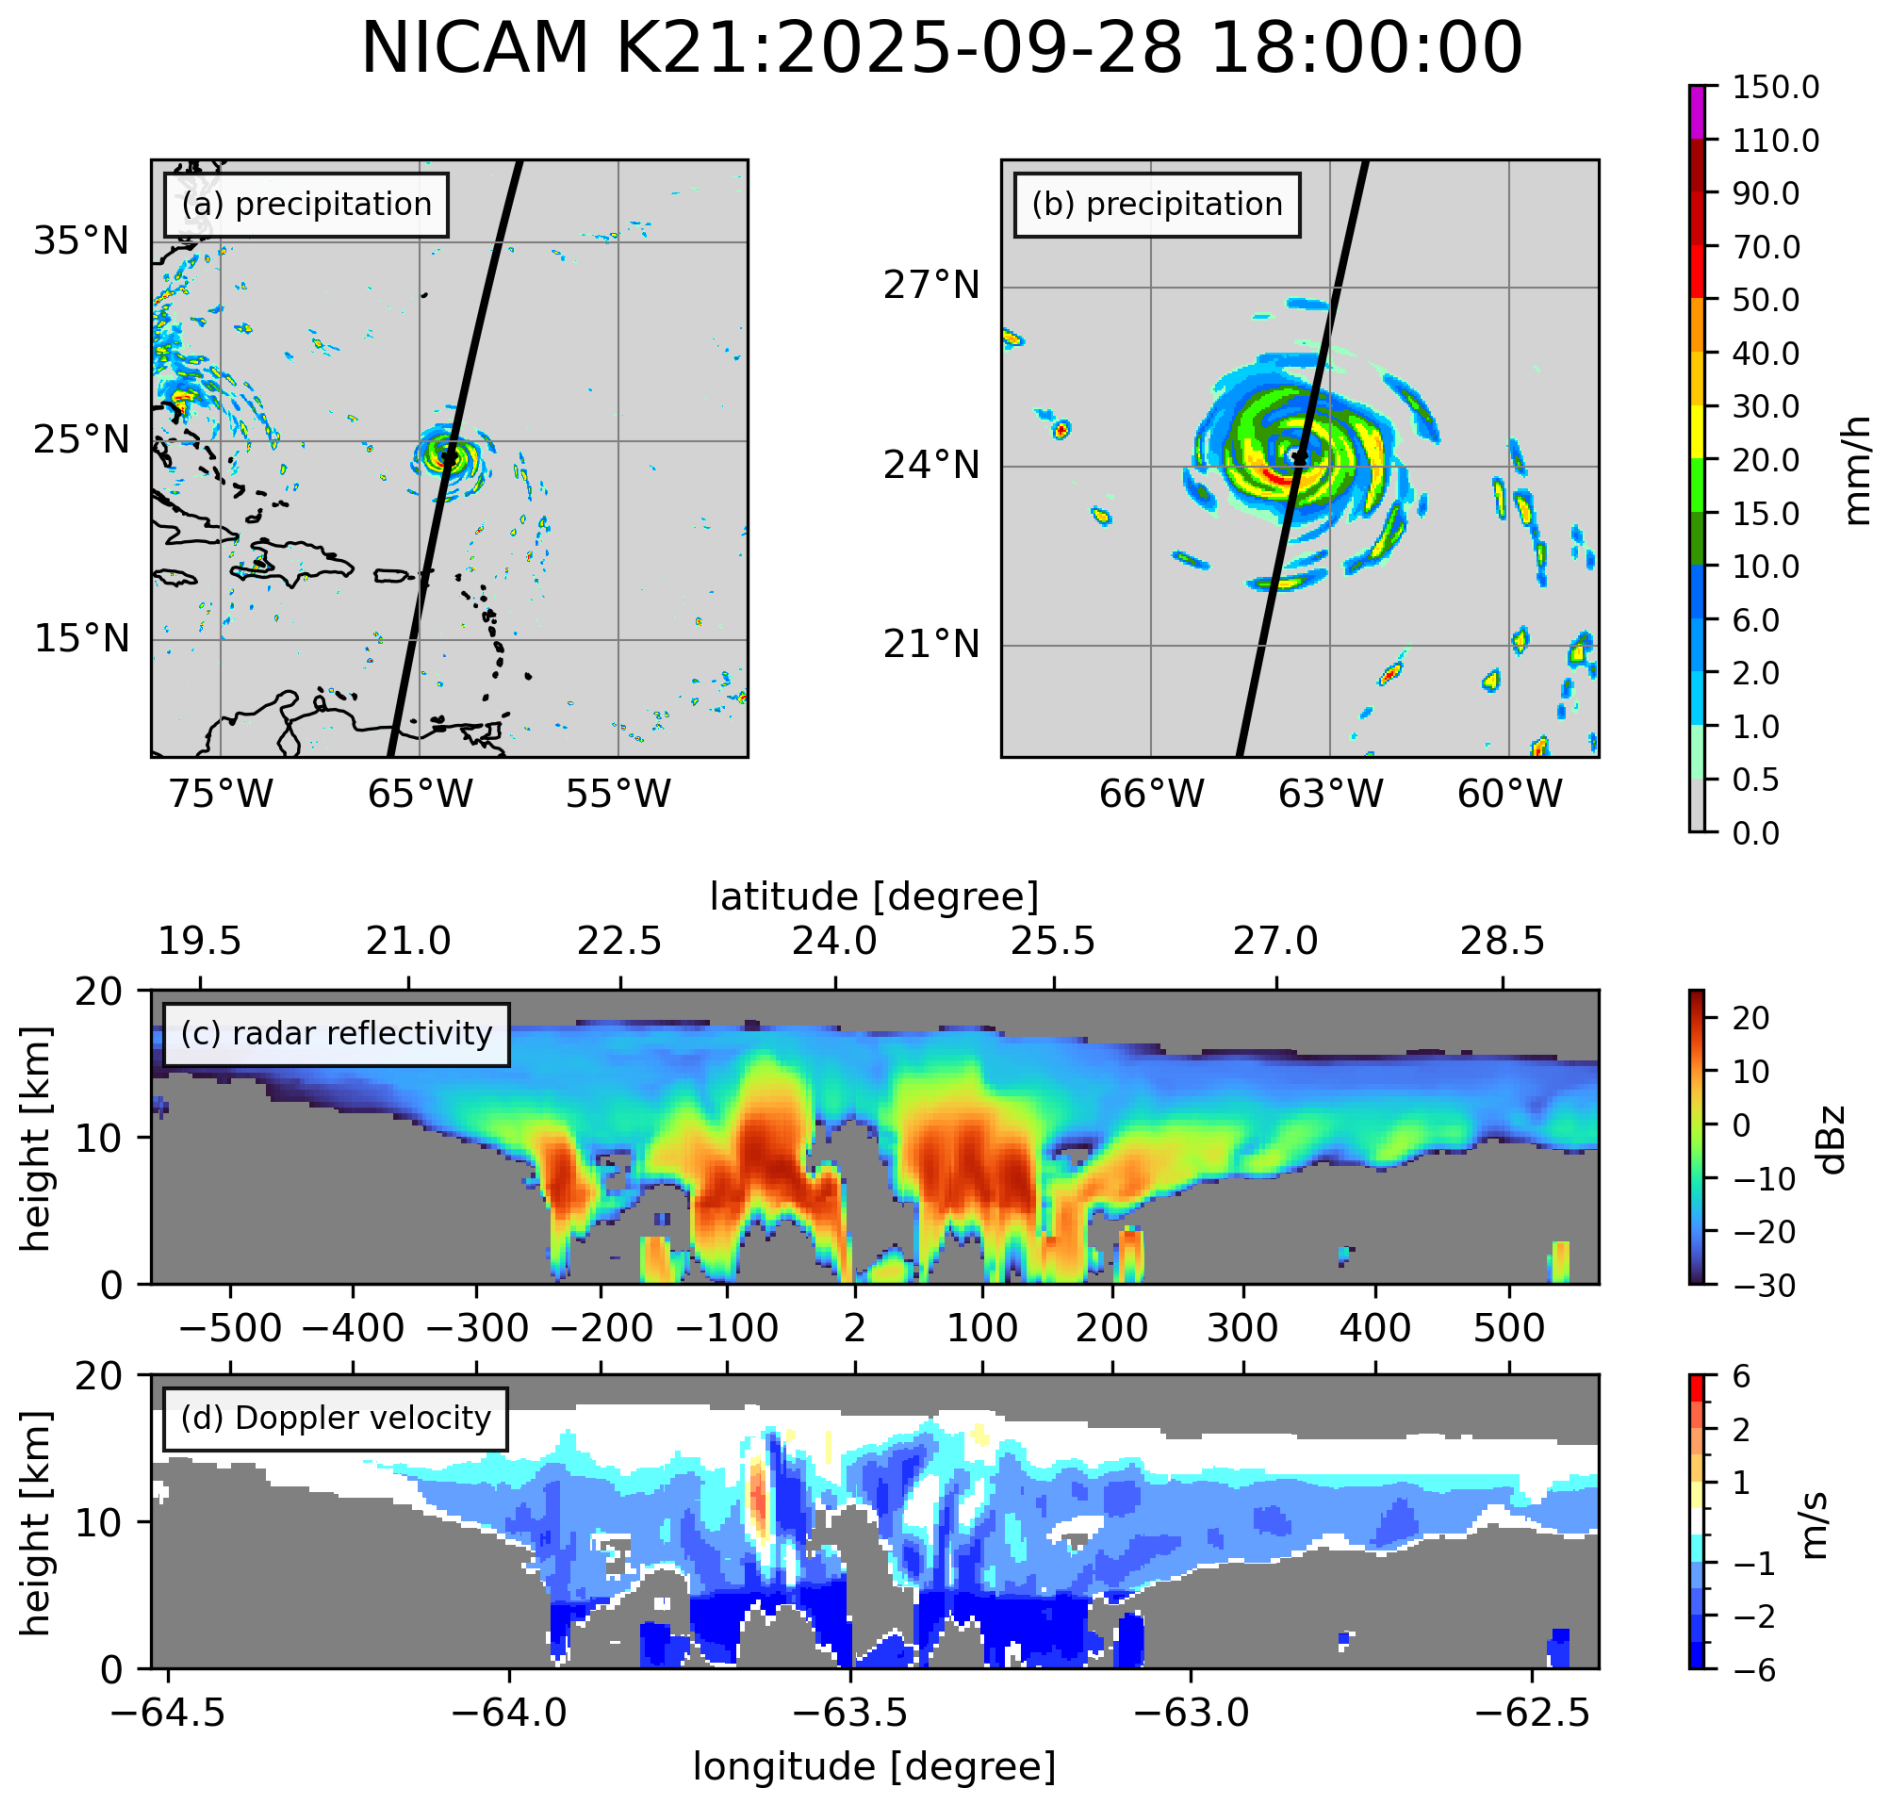
Figure 9(a) and (b) are NICAM K21 precipitation accumulated from 18Z to 19Z for the large and small domain, respectively. The black line indicates the track of EarthCARE overpass with a 1.5° eastward shift to intersect the simulated eyewall. (c) demonstrates the cross-section of simulated radar reflectivity in (b). (d) is the same but for simulated Doppler velocity.
As a case study, we conduct NICAM hindcast simulations of Hurricane Humberto and evaluate the results using EarthCARE observations (Fig. 1). The simulations are initialized at 00:00 UTC on 26 September 2025 using the ECMWF IFS operational analysis, as described in Sect. 2.2.2. Figure 8 compares the simulated track and intensity evolution of Hurricane Humberto with IBTrACS data. Both simulations reproduce the observed track reasonably well (Fig. 8a), although a southeastward bias is present. However, the observed intensity evolution is not fully reproduced. At the time of the EarthCARE overpass, both simulations produce lower minimum sea-level pressures but weaker maximum 10-m winds than IBTrACS (Fig. 8b and c). The simulated storms also continue to intensify after the observed storm begins to weaken. K21 and T24 produce similar tracks and overall intensity evolutions, although the track biases and intensity underestimation are present. Their comparable storm states provide a useful basis for examining how the two NSW6 configurations affect the EarthCARE-observable cloud structures. Nevertheless, the comparison is interpreted as a case-study assessment rather than a general evaluation of NICAM performance for TCs.
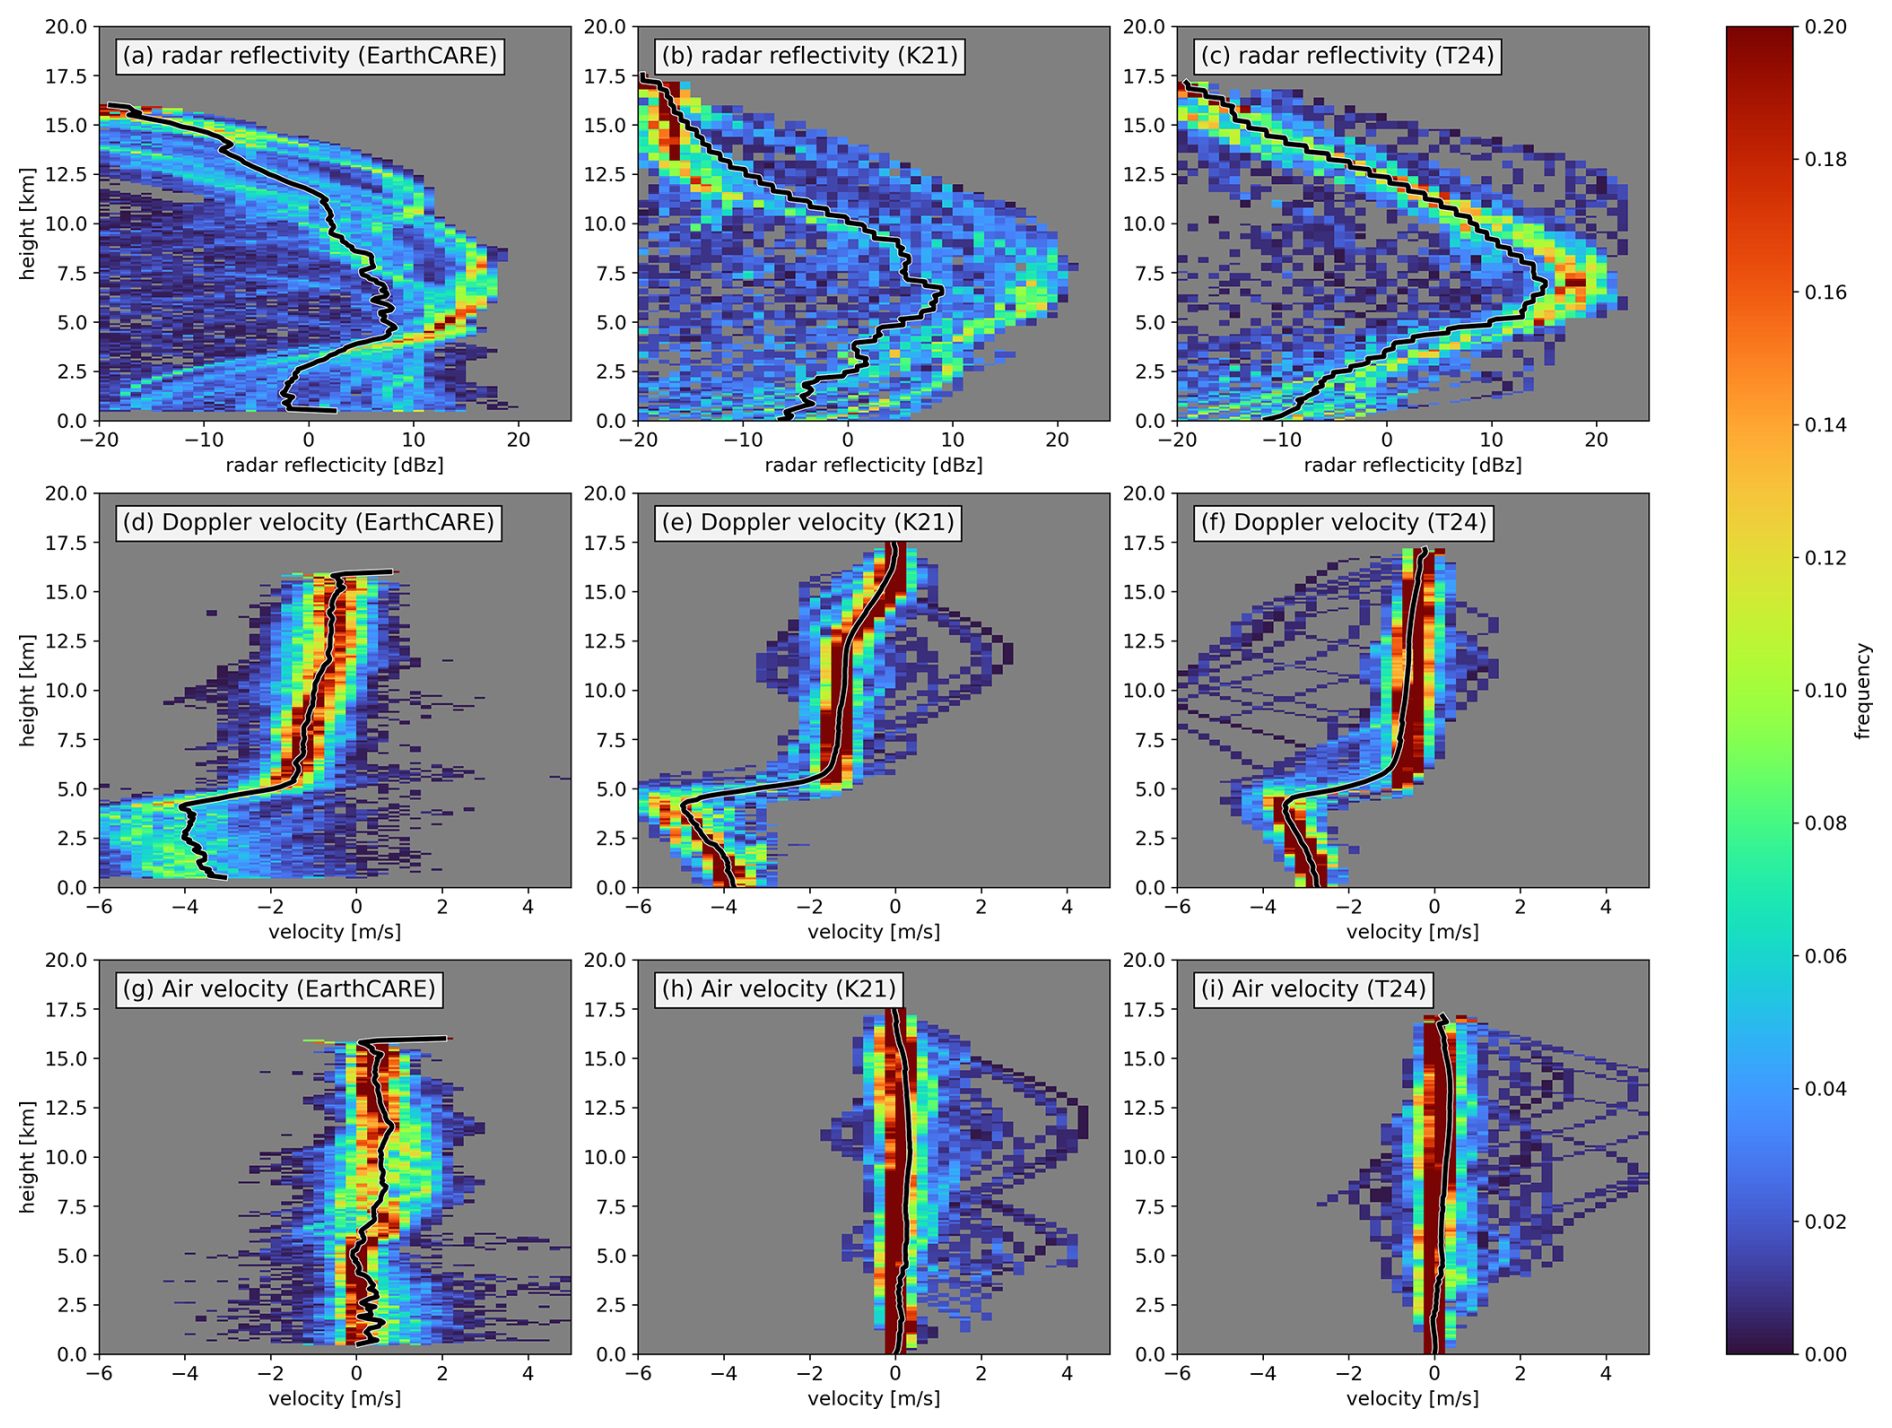
Figure 10Radar reflectivity PDF of (a) EarthCARE, (b) K21, and (c) T24. Doppler velocity PDF of (d) EarthCARE, (e) K21, and (f) T24. Air velocity PDF of (g) EarthCARE, (h) K21, and (i) T24. The black lines are the means of each variable.
Figure 9 shows the simulated radar reflectivity and Doppler velocity generated by the J-Sim along the EarthCARE overpass. To facilitate comparison, the EarthCARE overpass is shifted 1.5° eastward to intersect the simulated eyewall (Fig. 9a). Here, we present results from K21, while those from T24 are provided in Fig. S6 in the Supplement). The simulated precipitation pattern is sparser than that in the IMERG observations, and the rainfall intensity in the eyewall region is weaker in K21 (Figs. 9b and 1b). Despite this, the simulated radar reflectivity captures the overall storm structure, including deep convective and stratiform regions extending into the upper troposphere (Fig. 9c). Compared to observations, the simulated reflectivity is generally stronger but vertically confined below 10 km (Figs. 9c and 1c). Below the freezing level, radar reflectivity is substantially attenuated in both observations and simulations. The simulated Doppler velocity shows more negative values above the freezing level compared to observations (Figs. 9d and 1d). NICAM reproduces the overall TC structure, but discrepancies remain in both the intensity and vertical structure compared with EarthCARE observations.
We compare the PDFs of radar reflectivity, Doppler velocity, and air velocity between EarthCARE observations and NICAM simulations (Fig. 10). To reduce differences in sampling geometry, only NICAM data along the EarthCARE-like transect are used in the main comparison. In addition, the EarthCARE profiles are averaged using a 3.5-km moving window along the satellite track to approximate the horizontal resolution of NICAM before constructing the PDFs. Both the EarthCARE and NICAM PDFs are constructed using only the cross-sectional data for Hurricane Humberto at the time of the EarthCARE overpass. At each height, the PDF is normalized independently using the valid samples at that level. The results using all NICAM samples within 300 km of the Humberto center are provided in Figs. S7 and S8 in the Supplement. The observed distributions exhibit a broad spread across all variables, reflecting substantial variability in both dynamical and cloud microphysical processes. In contrast, the simulated PDFs are much more confined. We focus on the structure above the freezing level because the signal is significantly attenuated below this level.
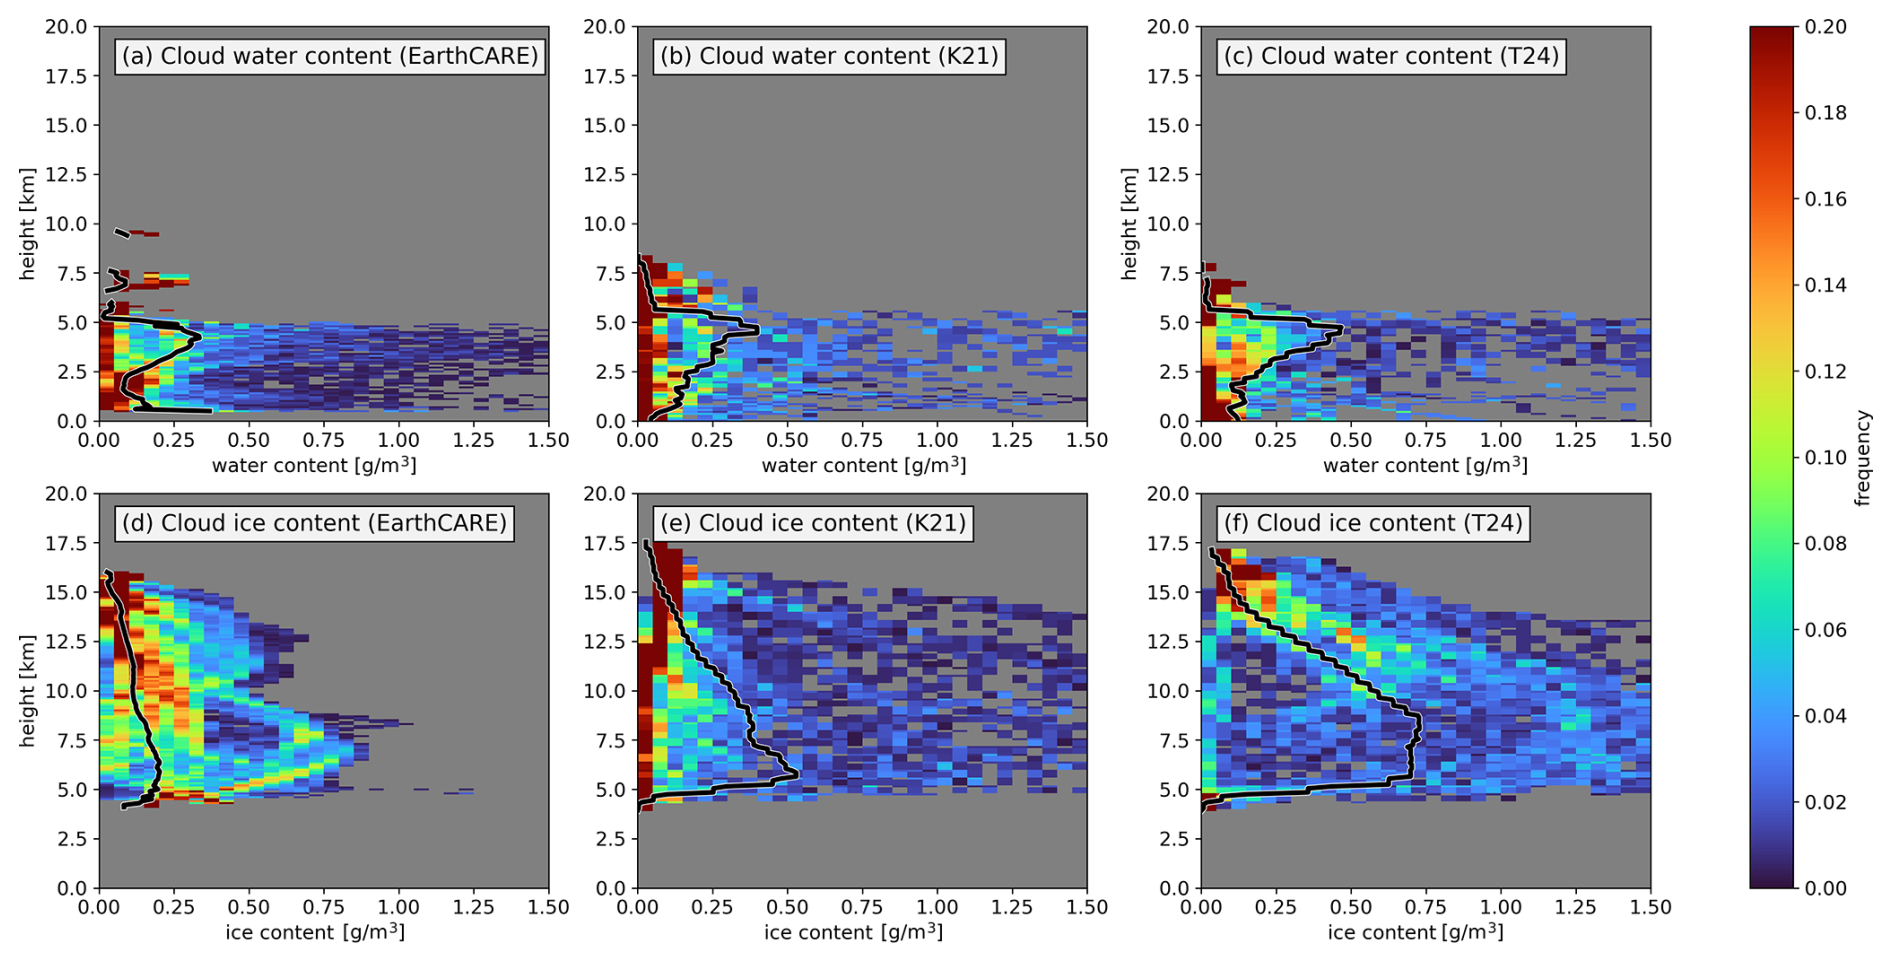
Figure 11Cloud water content PDF of (a) EarthCARE, (b) K21, and (c) T24. Cloud ice content PDF of (d) EarthCARE, (e) K21, and (f) T24. The black lines are the means of each variable.
Figure 10a shows that the EarthCARE PDF has a peak occurrence between 10 and 15 dBZ and develops a double-peaked structure with increasing height. One peak remains near 10 dBZ and sharply shifts toward lower reflectivity at 12.5 km, while the other one tilts from about 5 dBZ at 7 km to −10 dBZ at 12.5 km. In both K21 and T24, the PDF peaks occur between 15 and 20 dBZ at around 6 km, indicating an overestimation of radar reflectivity (Fig. 10b and c). The overestimation of radar reflectivity in T24 is more pronounced compared to K21. Moreover, the simulated reflectivity does not reproduce the double-peaked structure observed by EarthCARE. When all NICAM samples within 300 km of the Humberto center are used, both K21 and T24 still exhibit single-peak distributions (Fig. S7). With increasing height, the peak in K21 shifts rapidly from ∼ 15 dBZ at 6 km to −10 dBZ at 12 km. The peak in T24 remains near 15 dBZ up to 8 km and decreases more gradually, reaching −10 dBZ at around 14 km. However, T24 exhibits a narrower PDF between 8 and 15 km compared to K21. These results suggest that the smaller terminal velocity coefficients in T24, which reduce particle fall speeds, contribute to a more gradual vertical transition in radar reflectivity above approximately 8 km. Meanwhile, the narrower PDF in T24 may be partly related to the enhanced lateral mixing associated with the Leonard term, which tends to reduce horizontal variability.
The PDF of Doppler velocity observed by EarthCARE shifts from about −1.5 m s−1 at 5 km to −0.5 m s−1 at 15 km (Fig. 10d). In K21, the peak of the PDF is well captured near −1.5 m s−1 at 5 km, but the peak remains near −1.5 m s−1 from 5 to 12.5 km and then rapidly shifts toward −0.5 m s−1 (Fig. 10e). This behavior is consistent with overly large ice-particle terminal velocities above the freezing level. In contrast, the peak in T24 remains around −0.5 m s−1 throughout most of the vertical range in ice phase (Fig. 10f). T24 shows closer agreement with EarthCARE in the upper levels, although its Doppler velocity is less negative than observed near the freezing level. These differences indicate that changes in the terminal velocity coefficients substantially affect the vertical structure of Doppler velocity.
On the other hand, the PDFs of air velocity in both K21 and T24 are much narrower than those observed by EarthCARE (Fig. 10g–i). This suggests that the simulations underestimate the variability of vertical air motion. We note that part of the broader spread in the observed Doppler velocity may arise from observational uncertainties, such as beamwidth-related variability and multiple scattering. In addition, the retrieval of air motion is more uncertain in mixed-phase regions and under strong attenuation. These factors may contribute to the wider observed distributions. Nevertheless, the simulated PDFs remain narrower after the EarthCARE observations are averaged to the NICAM resolution even though all NICAM samples are used to construct PDFs (Fig. S7). These results suggest that the simulations produce more confined distributions of radar reflectivity, Doppler velocity, and air velocity. The underestimation of variabilities may be related to both limited resolution and the parameterized representation of cloud microphysical processes. The EarthCARE air velocity distribution also shows a local minimum near the melting level that is not reproduced by the simulations (Figs. 5 and 10g–i). Because air-velocity retrieval is more uncertain under mixed-phase conditions, this particular difference should be interpreted cautiously and should not be attributed solely to model bias.
We further evaluate the distributions of cloud water and ice content in NICAM simulations. The same cross-sectional sampling and horizontal averaging used in Fig. 10 are applied. Cloudy grid points with at least 0.001 g m−3 of liquid or ice water content are sampled to construct the PDFs (Fig. 11). The liquid water content retrieved from EarthCARE is generally smaller than 0.1 g m−3, with a long tail extending beyond 1 g m−3 (Fig. 11a). Both K21 and T24 capture this general pattern, although the frequency of the long tail is lower than in the observations (Figs. 11b and 11c). The mean profiles in K21 and T24 follow the observed structure reasonably well below 6 km. Above this level, liquid clouds are rarely observed, whereas non-negligible liquid water content persists in both simulations. This may suggest that NICAM tends to produce excessive supercooled liquid water. However, due to uncertainties in retrievals within mixed-phase regions, it is difficult to determine whether this represents a model bias.
Above the freezing level, the PDF of cloud ice content from EarthCARE at 5 km exhibits a skewed distribution with a long tail extending beyond 1 g m−3. With increasing height, the PDFs become more concentrated around ∼ 0.1 g m−3 (Fig. 11d). In K21, the PDF peaks near 0.05 g m−3, and the skewed structure is mainly confined between 5 and 10 km (Fig. 11e), which is narrower compared to the observation. In contrast, T24 exhibits a much broader PDF without a distinct peak, with ice content spanning from ∼ 0.05 g m−3 to at least 1.5 g m−3 (Fig. 11f). Both K21 and T24 overestimate the mean ice content relative to EarthCARE, with a larger overestimation in T24 between approximately 5 and 12 km. These results suggest that the modified terminal velocity settings in T24 may contribute to the broader distribution of cloud ice content, although its mean values remain overestimated. The comparison suggests that hydrometeor fall speed strongly influences the variability and the vertical distribution of cloud ice, which in turn affects the simulated reflectivity and Doppler velocity.
Overall, this preliminary case study shows that T24 agrees better with EarthCARE in several upper-level features. T24 shows a more gradual vertical transition in radar reflectivity. It also does not show the rapid upper-level shift in Doppler velocity found in K21. In addition, T24 produces greater variability in cloud ice content between 5 and 12 km. Based on this single-case comparison, T24 appears to be a more promising configuration for further testing in NICAM TC simulations, although T24 still overestimates radar reflectivity near the freezing level and cloud ice content.
This study uses EarthCARE observations to investigate the dynamical and cloud microphysical structures of TCs. By collocating EarthCARE overpasses with TC tracks, we identify 96 intercept events from 27 TCs, including 15 413 valid profiles within 15 RMW. Although the inner-core composite is based on only two independent intercept cases, both cases show similar vertical structures in Doppler and air velocities. These observations are used to construct radial-height statistics of radar reflectivity, Doppler velocity, air vertical motion, and cloud particle types. The inner-core region exhibits enhanced reflectivity, stronger and more variable upward air motion, and a broader Doppler velocity distribution. In the rainband region, the Doppler velocity distribution shifts toward more negative values, accompanied by slightly more negative particle terminal velocities and a pronounced bright band near the melting level. The outer region generally exhibits weaker reflectivity and narrower Doppler velocity and air motion distributions. These regional differences demonstrate how EarthCARE observations can help distinguish the influences of air motion and particle sedimentation on the regional variations in Doppler velocity PDFs.
The retrieved cloud particle types provide additional information for interpreting the Doppler velocity distributions. Small ice particles dominate the upper troposphere, whereas snow particles occur mainly between approximately 5 and 12 km and extend toward more negative Doppler velocities. Below the freezing level, rain dominates at more negative Doppler velocities, while small liquid droplets become more evident near zero Doppler velocity. Mixed-phase particles occur mainly near and above the melting level and span a broad range of Doppler velocities. Their distribution overlaps with both less negative Doppler velocities associated with stronger upward air motion and more negative velocities associated with faster particle falling. However, mixed-phase retrievals remain uncertain when multiple hydrometeor populations coexist.
As a preliminary single-case evaluation, NICAM hindcast simulations of Hurricane Humberto reproduce the storm track and overall cloud structure but underestimate the TC intensity. The simulated distributions of radar reflectivity, Doppler velocity, and air vertical motion are generally more confined than those observed by EarthCARE, indicating that the simulations underestimate the observed variability. The two microphysical configurations produce different vertical structures of radar reflectivity, Doppler velocity, and cloud ice content, demonstrating their sensitivity to the assumed hydrometeor fall speeds. T24 agrees better with EarthCARE in upper-level features, including a more gradual vertical transition in radar reflectivity and Doppler velocity and greater variability in cloud ice content. Nevertheless, it overestimates reflectivity near the freezing level and cloud ice content. Because the comparison is based on a single TC case and the simulated storm intensity is underestimated, these results should not be interpreted as a general evaluation of NICAM performance.
In conclusion, this study presents an observational perspective on regional differences in TC dynamics and cloud microphysical structures using EarthCARE observations. EarthCARE provides complementary constraints for model development. Radar reflectivity is sensitive to particle size distributions, while cloud water and ice contents provide information on condensate mass. Comparing Doppler velocity with retrieved air velocity can further help evaluate particle sedimentation and terminal-velocity settings. Although these retrieved quantities are not fully independent because they share radar inputs and retrieval assumptions, their combined evaluation can help identify microphysical settings that better represent both particle distributions and sedimentation. This study compares two commonly used configurations within the single-moment NSW6 scheme to isolate the sensitivity to different hydrometeor fall speed assumptions. The comparison between K21 and T24 suggests that reducing the effective fall speeds of frozen hydrometeors may improve the vertical structures of radar reflectivity and Doppler velocity in this case. Future sensitivity experiments can therefore vary the fall-speed coefficients of individual hydrometeor species and evaluate them using joint PDFs based on radar reflectivity and Doppler velocity. Future studies will also compare NSW6 with the double-moment NDW6 scheme (Seiki and Nakajima, 2014) and explore more complex microphysics, including bin schemes, to examine the role of particle size distributions and additional microphysical degrees of freedom. The sensitivity of simulated vertical motions to model resolution will also be evaluated.
The EarthCARE data used in this study are available from the JAXA G-Portal (https://gportal.jaxa.jp/gpr/index/index, last access: 26 March 2026), including CPR (https://doi.org/10.57746/EO.01jdvd2gqq34e6yz9p8kfe68x5, JAXA, 2024a) and CPR-ATLID synergistic (https://doi.org/10.57746/EO.01jkwjeg2y0bqndnsvjvaaskaw, JAXA, 2024b) Level-2 products. IMERG dataset can be found in https://gpm.nasa.gov/data/imerg, last access: 28 March 2026, and IBTrACS Version 4r01 subset covering the last 3 years is available from https://doi.org/10.25921/82ty-9e16 (Gahtan et al., 2024). J-Sim used to generate satellite-like signals from NICAM outputs is available from JAXA (https://www.eorc.jaxa.jp/theme/Joint-Simulator/userform/js_userform.html, last access: 17 December 2025). The processed dataset supporting the findings of this study is publicly available at figshare repository (https://doi.org/10.6084/m9.figshare.32142271.v3, Huang, 2026).
The supplement related to this article is available online at https://doi.org/10.5194/acp-26-15633-2026-supplement.
J.-D. H.: Conceptualization, Methodology, Formal analysis, Data curation, Investigation, Writing – original draft. W. R.: Conceptualization, Methodology, Formal analysis, Writing – review and editing. T. M.: Conceptualization, Supervision, Writing – review and editing. M. S.: Conceptualization, Supervision, Funding acquisition, Writing – review and editing.
The contact author has declared that none of the authors has any competing interests.
Publisher's note: Copernicus Publications remains neutral with regard to jurisdictional claims made in the text, published maps, institutional affiliations, or any other geographical representation in this paper. The authors bear the ultimate responsibility for providing appropriate place names. Views expressed in the text are those of the authors and do not necessarily reflect the views of the publisher.
This article is part of the special issue “Early results from EarthCARE (AMT/ACP/GMD inter-journal SI)”. It is not associated with a conference.
The authors thank members of the JAXA EarthCARE Science Team and the J-Sim project. The authors used ChatGPT (OpenAI) to assist with English language editing to improve clarity and reduce potential language barriers.
This work was supported by the EarthCARE satellite study commissioned by the Japan Aerospace Exploration Agency, the Moonshot R&D Grant JPMJMS2282-02 from the Japan Science and Technology Agency, JSPS Core-to-Core Program (grant number: JPJSCCA20220001), JSPS KAKENHI Grant Number 24K00703, 24H02228 and JP24H00275. The NICAM simulations in this study were performed on the supercomputer Fugaku (proposal numbers hp250068, hp250179, hp260066, hp260069). We also thank the joint research program of the Institute for Space-Earth Environmental Research (ISEE), Nagoya University.
This paper was edited by Johannes Quaas and reviewed by three anonymous referees.
Aoki, S., Kubota, T., and Turk, F. J.: Exploring vertical motions in convective and stratiform precipitation using spaceborne radar observations: insights from EarthCARE and GPM coincidence dataset, Atmos. Meas. Tech., 19, 79–100, https://doi.org/10.5194/amt-19-79-2026, 2026.
Baker, A. J., Vannière, B., and Vidale, P. L.: On the realism of tropical cyclone intensification in global storm-resolving climate models, Geophys. Res. Lett., 51, e2024GL109841, https://doi.org/10.1029/2024GL109841, 2024.
Barron, N. R., Didlake, A. C., and Reasor, P. D.: Statistical analysis of convective updrafts in tropical cyclone rainbands observed by airborne Doppler radar, J. Geophys. Res.-Atmos., 127, e2021JD035718, https://doi.org/10.1029/2021JD035718, 2022.
Black, M. L., Burpee, R. W., and Marks, F. D.: Vertical motion characteristics of tropical cyclones determined with airborne Doppler radial velocities, J. Atmos. Sci., 53, 1887–1909, https://doi.org/10.1175/1520-0469(1996)053<1887:VMCOTC>2.0.CO;2, 1996.
Black, R. A. and Hallett, J.: Observations of the distribution of ice in hurricanes, J. Atmos. Sci., 43, 802–822, https://doi.org/10.1175/1520-0469(1986)043<0802:OOTDOI>2.0.CO;2, 1986.
Black, R. A. and Hallett, J.: Electrification of the hurricane, J. Atmos. Sci., 56, 2004–2028, https://doi.org/10.1175/1520-0469(1999)056<2004:EOTH>2.0.CO;2, 1999.
Black, R. A., Heymsfield, G. M., and Hallett, J.: Extra large particle images at 12 km in a hurricane eyewall: Evidence of high-altitude supercooled water?, Geophys. Res. Lett., 30, https://doi.org/10.1029/2003GL017864, 2003.
Dvorak, V. F.: Tropical cyclone intensity analysis and forecasting from satellite imagery, Mon. Weather Rev., 103, 420–430, https://doi.org/10.1175/1520-0493(1975)103<0420:TCIAAF>2.0.CO;2, 1975.
Dvorak, V. F.: Tropical cyclone intensity analysis using satellite data, NOAA, https://repository.library.noaa.gov/view/noaa/19322 (last access: 24 April 2026), 1984.
Gahtan, J., Knapp, K. R., Schreck III, C. J., Diamond, H. J., Kossin, J. P., and Kruk, M. C.: International Best Track Archive for Climate Stewardship (IBTrACS) Project, Version 4r01, last 3 years, NOAA National Centers for Environmental Information [data set], https://doi.org/10.25921/82ty-9e16, 2024.
Hashino, T., Satoh, M., Hagihara, Y., Kubota, T., Matsui, T., Nasuno, T., and Okamoto, H.: Evaluating cloud microphysics from NICAM against CloudSat and CALIPSO, J. Geophys. Res., 118, 7273–7292, https://doi.org/10.1002/jgrd.50564, 2013.
Hence, D. A. and Houze Jr., R. A.: Kinematic structure of convective-scale elements in the rainbands of Hurricanes Katrina and Rita (2005), J. Geophys. Res.-Atmos., 113, D15108, https://doi.org/10.1029/2007JD009429, 2008.
Huang, J.-D.: EarthCARE-TC, figshare [data set], https://doi.org/10.6084/m9.figshare.32142271.v3, 2026.
Huffman, G. J., Bolvin, D. T., Braithwaite, D., Hsu, K. L., Joyce, R. J., Kidd, C., and Xie, P.: Integrated multi-satellite retrievals for the Global Precipitation Measurement (GPM) mission (IMERG), in: Satellite Precipitation Measurement, Springer, Cham, 343–353, https://doi.org/10.1007/978-3-030-24568-9_19, 2020.
Illingworth, A. J., Barker, H. W., Beljaars, A., Ceccaldi, M., Chepfer, H., Clerbaux, N., and Van Zadelhoff, G. J.: The EarthCARE satellite: The next step forward in global measurements of clouds, aerosols, precipitation, and radiation, B. Am. Meteorol. Soc., 96, 1311–1332, https://doi.org/10.1175/BAMS-D-12-00227.1, 2015.
JAXA (Japan Aerospace Exploration Agency): EarthCARE/CPR L2A CPR one-sensor Cloud Products, JAXA [data set], https://doi.org/10.57746/EO.01jdvd2gqq34e6yz9p8kfe68x5, 2024a.
JAXA (Japan Aerospace Exploration Agency): EarthCARE L2B CPR-ATLID Synergy Cloud Products, JAXA [data set], https://doi.org/10.57746/EO.01jkwjeg2y0bqndnsvjvaaskaw, 2024b.
Judt, F., Klocke, D., Rios-Berrios, R., Vannière, B., Ziemen, F., Auger, L., and Zhou, L.: Tropical cyclones in global storm-resolving models, J. Meteorol. Soc. Jpn., 99, 579–602, https://doi.org/10.2151/jmsj.2021-029, 2021.
Knapp, K. R., Kruk, M. C., Levinson, D. H., Diamond, H. J., and Neumann, C. J.: The International Best Track Archive for Climate Stewardship (IBTrACS): Unifying tropical cyclone data, B. Am. Meteorol. Soc., 91, 363–376, https://doi.org/10.1175/2009BAMS2755.1, 2010.
Kodama, C., Ohno, T., Seiki, T., Yashiro, H., Noda, A. T., Nakano, M., Yamada, Y., Roh, W., Satoh, M., Nitta, T., Goto, D., Miura, H., Nasuno, T., Miyakawa, T., Chen, Y.-W., and Sugi, M.: The Nonhydrostatic ICosahedral Atmospheric Model for CMIP6 HighResMIP simulations (NICAM16-S): experimental design, model description, and impacts of model updates, Geosci. Model Dev., 14, 795–820, https://doi.org/10.5194/gmd-14-795-2021, 2021.
Lee, T. Y. and Wing, A. A.: Satellite-based estimation of the role of cloud–radiative interaction in accelerating tropical cyclone development, J. Atmos. Sci., 81, 959–982, https://doi.org/10.1175/JAS-D-23-0142.1, 2024.
Luo, Z., Stephens, G. L., Emanuel, K. A., Vane, D. G., Tourville, N. D., and Haynes, J. M.: On the use of CloudSat and MODIS data for estimating hurricane intensity, IEEE Geosci. Remote S., 5, 13–16, https://doi.org/10.1109/LGRS.2007.905341, 2008.
Nakanishi, M. and Niino, H.: An improved Mellor–Yamada level-3 model: Its numerical stability and application to a regional prediction of advection fog, Bound.-Layer Meteorol., 119, 397–407, https://doi.org/10.1007/s10546-005-9030-8, 2006.
Noda, A. T., Oouchi, K., Satoh, M., Tomita, H., Iga, S.-I., and Tsushima, Y.: Importance of the subgrid-scale turbulent moist process: Cloud distribution in global cloud-resolving simulations, Atmos. Res., 96, 208–217, https://doi.org/10.1016/j.atmosres.2009.05.007, 2010.
Okamoto, H., Sato, K., Nishizawa, T., Jin, Y., Nakajima, T., Wang, M., Satoh, M., Suzuki, K., Roh, W., Yamauchi, A., Horie, H., Ohno, Y., Hagihara, Y., Ishimoto, H., Kudo, R., Kubota, T., and Tanaka, T.: JAXA Level2 algorithms for EarthCARE mission from single to four sensors: new perspective of cloud, aerosol, radiation and dynamics, Atmos. Meas. Tech. Discuss. [preprint], https://doi.org/10.5194/amt-2024-101, 2024.
Reynolds, R. W., Rayner, N. A., Smith, T. M., Stokes, D. C., and Wang, W.: An improved in situ and satellite SST analysis for climate, J. Climate, 15, 1609–1625, https://doi.org/10.1175/1520-0442(2002)015<1609:AIISAS>2.0.CO;2, 2002.
Roh, W. and Satoh, M.: Evaluation of precipitating hydrometeor parameterizations in a single-moment bulk microphysics scheme for deep convective systems, J. Atmos. Sci., 71, 2654–2673, https://doi.org/10.1175/JAS-D-13-0252.1, 2014.
Roh, W., Satoh, M., Hashino, T., Okamoto, H., and Seiki, T.: Evaluations of the thermodynamic phases of clouds in a cloud-system-resolving model using CALIPSO, J. Atmos. Sci., 77, 3781–3801, https://doi.org/10.1175/JAS-D-19-0273.1, 2020.
Roh, W., Satoh, M., Matsugishi, S., Aoki, S., Kubota, T., and Okamoto, H.: Vertical motions in clouds from EarthCARE satellite and a global storm-resolving modeling, Sci. Rep., 16, 2622, https://doi.org/10.1038/s41598-025-32256-8, 2026.
Sato, K., Okamoto, H., Yamamoto, M. K., Fukao, S., Kumagai, H., Ohno, Y., and Abo, M.: 95-GHz Doppler radar and lidar synergy for simultaneous ice microphysics and in-cloud vertical air motion retrieval, J. Geophys. Res., 114, D03203, https://doi.org/10.1029/2008JD010222, 2009.
Sato, K., Okamoto, H., Nishizawa, T., Jin, Y., Nakajima, T. Y., Wang, M., Satoh, M., Roh, W., Ishimoto, H., and Kudo, R.: JAXA Level 2 cloud and precipitation microphysics retrievals based on EarthCARE radar, lidar, and imager: the CPR_CLP, AC_CLP, and ACM_CLP products, Atmos. Meas. Tech., 18, 1325–1338, https://doi.org/10.5194/amt-18-1325-2025, 2025.
Satoh, M., Matsuno, T., Tomita, H., Miura, H., Nasuno, T., and Iga, S.: Nonhydrostatic icosahedral atmospheric model (NICAM) for global cloud resolving simulations, J. Comput. Phys., 227, 3486–3514, https://doi.org/10.1016/j.jcp.2007.02.006, 2008.
Satoh, M., Tomita, H., Yashiro, H., Miura, H., Kodama, C., Seiki, T., and Kubokawa, H.: The non-hydrostatic icosahedral atmospheric model: Description and development, Prog. Earth Planet. Sci., 1, 18, https://doi.org/10.1186/s40645-014-0018-1, 2014.
Satoh, M., Stevens, B., Judt, F., Khairoutdinov, M., Lin, S. J., Putman, W. M., and Düben, P.: Global cloud-resolving models, Curr. Clim. Change Rep., 5, 172–184, https://doi.org/10.1007/s40641-019-00131-0, 2019.
Seiki, T. and Nakajima, T.: Aerosol effects of the condensation process on a convective cloud simulation, J. Atmos. Sci., 71, 833–853, https://doi.org/10.1175/JAS-D-12-0195.1, 2014.
Sekiguchi, M. and Nakajima, T.: A k-distribution-based radiation code and its computational optimization for an atmospheric general circulation model, J. Quant. Spectrosc. Ra., 109, 2779–2793, https://doi.org/10.1016/j.jqsrt.2008.07.013, 2008.
Stevens, B., Satoh, M., Auger, L., Biercamp, J., Bretherton, C. S., Chen, X., and Zhou, L.: DYAMOND: The dynamics of the atmospheric general circulation modeled on non-hydrostatic domains, Prog. Earth Planet. Sci., 6, 61, https://doi.org/10.1186/s40645-019-0304-z, 2019.
Stevens, B., Acquistapace, C., Hansen, A., Heinze, R., Klinger, C., Klocke, D., and Zängl, G.: The added value of large-eddy and storm-resolving models for simulating clouds and precipitation, J. Meteorol. Soc. Jpn., 98, 395–435, https://doi.org/10.2151/jmsj.2020-021, 2020.
Takasuka, D., Kodama, C., Suematsu, T., Ohno, T., Yamada, Y., Seiki, T., and Masunaga, R.: How can we improve the seamless representation of climatological statistics and weather?, J. Adv. Model. Earth Sy., 16, e2023MS003701, https://doi.org/10.1029/2023MS003701, 2024.
Takata, K., Emori, S., and Watanabe, T.: Development of the minimal advanced treatments of surface interaction and runoff, Glob. Planet. Change, 38, 209–222, https://doi.org/10.1016/S0921-8181(03)00030-4, 2003.
Tomita, H.: New microphysical schemes with five and six categories by diagnostic generation of cloud ice, J. Meteorol. Soc. Jpn., 86, 121–142, https://doi.org/10.2151/jmsj.86A.121, 2008.
Tomita, H. and Satoh, M.: A new dynamical framework of nonhydrostatic global model using the icosahedral grid, Fluid Dyn. Res., 34, 357–400, https://doi.org/10.1016/j.fluiddyn.2004.03.003, 2004.
Tourville, N., Stephens, G., DeMaria, M., and Vane, D.: Remote sensing of tropical cyclones: Observations from CloudSat and A-Train profilers, B. Am. Meteorol. Soc., 96, 609–622, https://doi.org/10.1175/BAMS-D-13-00282.1, 2015.
Wehr, T., Kubota, T., Tzeremes, G., Wallace, K., Nakatsuka, H., Ohno, Y., Koopman, R., Rusli, S., Kikuchi, M., Eisinger, M., Tanaka, T., Taga, M., Deghaye, P., Tomita, E., and Bernaerts, D.: The EarthCARE mission – science and system overview, Atmos. Meas. Tech., 16, 3581–3608, https://doi.org/10.5194/amt-16-3581-2023, 2023.
Willoughby, H. E., Jorgensen, D. P., Black, R. A., and Rosenthal, S. L.: Project STORMFURY: A scientific chronicle 1962–1983, B. Am. Meteorol. Soc., 66, 505–514, https://doi.org/10.1175/1520-0477(1985)066<0505:PSASC>2.0.CO;2, 1985.
Wingo, S. M. and Knupp, K. R.: Kinematic structure of mesovortices in the eyewall of Hurricane Ike (2008) derived from ground-based dual-Doppler analysis, Mon. Weather Rev., 144, 4245–4263, https://doi.org/10.1175/MWR-D-16-0085.1, 2016.
Wu, S. N. and Soden, B. J.: Signatures of tropical cyclone intensification in satellite measurements of ice and liquid water content, Mon. Weather Rev., 145, 4081–4091, https://doi.org/10.1175/MWR-D-17-0046.1, 2017.
Wu, S. N., Soden, B. J., and Alaka, G. J.: Ice water content as a precursor to tropical cyclone rapid intensification, Geophys. Res. Lett., 47, e2020GL089669, https://doi.org/10.1029/2020GL089669, 2020.