
the Creative Commons Attribution 4.0 License.
the Creative Commons Attribution 4.0 License.
 | 05 Nov 2026
A preliminary analysis of tropical anvil-cloud dynamics in EarthCARE

The vertical motion in tropical anvil clouds is crucial for understanding their maintenance and evolution but is notoriously difficult to observe. This work explores the potential utility of EarthCARE in revealing previously unobserved aspects of anvil clouds using the radar-only (2A.CPR_CLP) and radar-lidar synergy (2B.AC_CLP) products. Composite vertical profiles of cloud fraction sorted by ice water path (IWP) are constructed as a statistical representation of anvil clouds and deep convection. In-cloud vertical air motion as estimated from Doppler measurements reveals that intense updraft penetrating within deep convection gives way to a weaker ascent in anvil clouds. The radar-only product slightly underestimates the ascent in anvil clouds relative to the radar-lidar product due to a difference in the particle size distribution, while the overall spatial pattern of vertical air motion remains consistent. Diagnostic horizontal wind is then derived from the vertical motion estimates under mass conservation in composite vertical-horizontal space. The resulting wind vector field emerges as an overturning mesoscale circulation constituted of a mid-tropospheric inflow and an upper-tropospheric outflow. The present findings, although preliminary, confirm the promising potential of EarthCARE observations for investigating the anvil cloud dynamics.
- Article
(6305 KB) - Full-text XML
-
Supplement
(1536 KB) - BibTeX
- EndNote


Clouds prevail in the upper troposphere over the Tropics. While the climatological mean high-cloud amount is about 0.37 when averaged over the globe, this number increases to nearly 0.5 at tropical latitudes (Stubenrauch et al., 2024). Tropical high clouds consist of at least two distinct components differentiated from each other by formation mechanism. In situ cirrus is formed ubiquitously in the tropical tropopause layer (TTL) owing to very low temperature there leading to a high relatively humidity, and also because of the limited moisture availability in TTL that prevents ice crystals from growing fast enough to fall out quickly (Jensen et al., 1996; Fueglistaler et al., 2009).
Another member of tropical cirrus is anvil clouds formed in association with the detrainment of condensate from deep convection, which accounts for nearly one half of all the tropical cirrus (Massie et al., 2002; Luo and Rossow, 2004). An anvil cloud can by far outlive the deep convection that produced it, maintained over a length of time depending on different factors such as radiatively-driven in-cloud dynamics (Ackerman et al., 1988; Lilly, 1988; Hartmann et al., 2018; Gasparini et al., 2019), cloud microphysics (Jensen et al., 1996; Garrett et al., 2005; Ohno et al., 2021), and dynamic and thermodynamic environments in the upper troposphere (Sherwood, 1999; Hartmann and Larson, 2002; Bony et al., 2016; Seeley et al., 2019) and even through lower tropospheric dynamics (Masunaga and Bony, 2018; Masunaga, 2023).
Global observations of the cloud radiative and microphysical properties are invaluable for translating the process-level knowledge to understand the workings of cloud feedback as part of Earth's climate system. Global measurements of the anvil cloud properties benefit particularly from active remote sensing from space with the ability to vertically profile the in-cloud structure. The CloudSat and Cloud-Aerosol Lidar and Infrared Pathfinder Satellite Observations (CALIPSO) satellites, flying in formation for over 15 years since their launch in 2006 (Stephens et al., 2018), opened a new pathway to study the cloud vertical structure with simultaneous radar and lidar measurements. CloudSat-CALIPSO data have been demonstrated to be instrumental in studying anvil cloud dynamics (e.g., Sokol and Hartmann, 2020; Wall et al., 2020; Horner and Gryspeerdt, 2023).
While CloudSat and CALIPSO ended their missions in 2023, the Earth Clouds, Aerosols and Radiation Explorer (EarthCARE) satellite was sent into orbit in 2024, carrying Cloud Profiling Radar (CPR) and Atmospheric Lidar (ATLID) with other two instruments aboard (Illingworth et al., 2015; Wehr et al., 2023). EarthCARE CPR (EC-CPR) is a W-band Doppler radar designed to measure the vertical velocity of hydrometers as well as their back-scattered echo. ATLID is a high spectral resolution lidar (HSRL) transmitting ultraviolet (355 nm) laser pulses, having the advanced capability to separate out molecular scattering signals from the particle scattering echoes from clouds and aerosols. As such, EarthCARE not only succeeds CloudSat and CALIPSO, reviving joint radar-lidar observations from space, but benefits from enhanced technologies in satellite active remote sensing.
Vertical velocity remains among key uncertainties in the formation and maintenance mechanisms of cirrus clouds (Kärcher and Spichtinger, 2009). Difficulties arise largely, if not entirely, from the lack of vertical motion measurements in upper-tropospheric clouds to verify existing hypotheses and model simulations (Gasparini et al., 2023). EarthCARE brought about breakthrough as the first spacecraft carrying a Doppler weather radar. Early observations from EC-CPR so far have already proven the value of Doppler measurements for studying the vertical motion in vigorous convective systems (Galfione et al., 2025; Roh et al., 2025; Aoki et al., 2026b; Hotta et al., 2026) and the microphysics in cirrus clouds (Seiki et al., 2025).
The potential of EarthCARE, however, has yet to be explored with focus on anvil clouds. Vertical air velocity in anvil clouds remains within ±1 m−1 most of the time (Muhlbauer et al., 2014), which can be largely or more than entirely offset in Doppler measurements by the contribution of hydrometeor sedimentation. Reliable Doppler estimation of vertical air motion would require a careful treatment of the algorithmic assumptions on cloud microphysics for properly factoring out the sedimentation component. It is crucial to assess if Doppler observations provide a reasonable diagnosis of vertical air velocity as recorded in the EarthCARE data products.
The goals of this paper are twofold. First, the vertical motion estimates are examined for robustness in light of the archetypical cloud-system structure comprised of a deep convective tower and anvil clouds (Sect. 3.2). This is done by averaging observations into a two-dimensional composite diagram in the IWP–height plane. The radar-only product is then compared against the radar-lidar synergy product in composite space. The difference between the two products provides a measure of minimum uncertainty in the EarthCARE measurements of cloud properties and vertical air motion, as will be detailed in Sect. 3.3. Second, a diagnostic estimate of horizontal wind is derived from vertical velocity to illustrate two-dimensional wind field in the vertical plane (Sect. 4). This is a preliminary experiment intended to illuminate the unexplored potential of EarthCARE for looking into the dynamics of anvil clouds.
2.1 Overview of EarthCARE data products
The EarthCARE mission was developed and is being operated jointly by Japan Aerospace Exploration Agency (JAXA) and European Space Agency (ESA). Two independent sets of the EarthCARE science data products are produced and distributed by JAXA and ESA (Eisinger et al., 2024). This work analyzes the cloud fraction (the number of cloudy pixels divided by the total pixel count), ice water content (IWC), ice water path (IWP), cloud effective radius, Doppler velocity, the terminal velocity of hydrometeors, and in-cloud vertical air velocity from the JAXA standard Level-2 cloud products of 2A.CPR_CLP vBb (CPR-only) and 2B.AC_CLP vBb (CPR-ATLID synergy) (Sato et al., 2025). These products contain two sets of variables having different spatial resolutions reconstructed with 1 and 10 km horizontal integration along the satellite track. The 10 km product is chosen for the current analysis to ensure a desirable Doppler accuracy within ∼ 0.3 m s−1 (Hagihara et al., 2023). The vertical resolution of CPR is 500 m but is oversampled every 100 m. The CPR-ATLID synergy product has the same horizontal and vertical sampling intervals as the CPR-only product. Air temperature and pressure, sub-sampled from European Centre for Medium-range Weather Forecasts (ECMWF) forecast runs along the EarthCARE satellite track, are used for computing air density (Sect. 4.1).
All EarthCARE observations over the global tropical oceans (i.e., all longitudes for 20° S–20° N with landmasses and islands removed) are analyzed for the 14-month period from the beginning of August 2024 to the end of September 2025. The latest product version (vCb) released for 2A.CPR_CLP and 2B.AC_CLP is not adopted here because ample statistics are difficult secure due to a limited length of record. The version vCb is so far available only for very recent months since the release date, still pending for reprocessing back in time at the moment of this writing.
2.2 Cloud properties
The retrieval algorithm behind the 2A.CPR_CLP and 2B.AC_CLP products (Sato et al., 2025) is briefly outlined in this subsection. The key input observables include radar reflectivity factor, Doppler velocity, and path-integrated attenuation from EC-CPR and back-scattering coefficient, extinction coefficient, and depolarization ratio from ATLID. The cloud properties such as IWC and cloud effective radius are derived so they match the observables by running an inversion model under prescribed assumptions on particle size distribution (PSD) and ice crystal habit. The PSD model is the sum of two modified gamma distribution for frozen hydrometeors, allowing a group of large ice particles such as snow (mode 1) and another of smaller ones (mode 2) to co-exist. The built-in inventory of ice crystal habit consists of 2D plates, 2D columns, bullet rosettes, snow aggregates, and several others. ATLID lidar ratio and depolarization ratio, CPR reflectivity factor and Doppler velocity, and air temperature help identify the optimal ice habit models. Once the ice habit and PSD parameters are determined, the terminal velocity of hydrometeors is derived with a built-in lookup table so it is aerodynamically consistent with cloud microphysics (Sato et al., 2009).
The CPR-only and CPR-ATLID synergy products contain the same sets of cloud physical variables, but estimated values are not identical for two major reasons. First, the CPR-ATLID algorithm updates the ice habit model identified by CPR alone in effort to optimize the cloud-type classification with all available measurements. Second, the radar-lidar synergy product can exploit an additional constraint on PSD where radar and lidar signals are both available, because the particle-size dependence of cloud back-scattering is systematically different between microwave and visible wavelengths (Okamoto et al., 2003).
Lidar pulses are so susceptible to attenuation that back-scattered lidar echoes are often lost entirely deep inside a thick cloud layer. The synergy impact is thus expected to be efficient near cloud top but is not necessarily confined there because the cloud PSD has control over the extinction of radar and lidar echoes as well as their back-scattering efficiency. Any difference in PSD parameters hence not only locally influences the retrieval but also in the layer immediately below through attenuation correction. A consecutive chain of this effect could eventually reach all levels beneath, leading to the propagation of cloud-top information deeper into the cloud as will be confirmed in Sect. 3.3.
Any systematic bias found between the CPR-only and CPR-ATLID estimates is attributed mainly to differences in the algorithmic assumptions, e.g., PSD models, between the products. As such, comparing the two products offers an incomplete but useful measure of uncertainties that could be refined by further updating the assumptions. The EarthCARE cloud products are ultimately to be assessed against in-situ measurements. Several field campaigns have been conducted and are being planned for EarthCARE product validation (Kubota et al., 2026).
2.3 Doppler velocity and vertical air motion
Doppler velocity, wD, measured by a vertically pointing radar is related to in-cloud vertical motion as
where wt,Z is the terminal velocity of hydrometeors with respect to air (or sedimentation velocity) weighted with the radar back-scattering coefficient in the integral over particle size, wa,c denotes in-cloud vertical air velocity, and ε summarizes the measurement and retrieval errors. By design, wD would offer a good proxy of terminal velocity in still air (wa,c = 0), with the caveat that the fall velocity of large particles predominates as radar back-scattering is acutely sensitive to particle size. In contrast, wD could be a large positive (ascending) in intense convective towers where wa,c overwhelms wt,Z in magnitude. It is otherwise not an obvious task to separate wt,Z from wa,c in a measurement of wD.
An existing method to evaluate wa,c from Doppler observations is to isolate out wt,Z by applying temporal averaging to wD (e.g., Orr and Kropfli, 1999; Deng and Mace, 2006; Protat and Williams, 2011). The approach is based on the premise that vertical air motion with a certain horizontal scale may be temporally smoothed out to zero when averaged over an adequate time interval while the sedimentation speed is not (Mace et al., 2002). The algorithm to derive particle sedimentation velocity is built upon this line of studies for ESA's EarthCARE products, with spatial averaging applied along the track successively over four selected windows of 40, 30, 20, and 10 km in this order (Kollias et al., 2023). Since wa,c is filtered out leaving only the remainder of wD passed on to downstream modules in the Level-2 algorithm flow, ESA's cloud products, unlike JAXA's products, do not provide vertical air motion.
An alternative strategy as pursued by Sato et al. (2009) and Heymsfield et al. (2010) does not involve any averaging procedure but instead relies on an explicit characterization of cloud microphysics in separating wt,Z from wa,c. JAXA's EarthCARE datasets analyzed in this work (2A.CPR_CLP and 2B.AC_CLP) are built upon the method of Sato et al. (2009) . As detailed in Sect. 2.2, their cloud microphysical model allows for a bimodal PSD to account for large precipitating ice (snow and graupel) and co-existing tiny ice crystals. The adequate PSD determined to match a given CPR-ATLID or CPR-only observation (Sato and Okamoto, 2011) is applied to the calculation of wt,Z, with which wa,c is obtained through Eq. (1). The same PSD model is used for the deconvolution of wt,Z into wt, the latter of which denotes the PSD-weighted, but not reflectivity-weighted, terminal velocity as stored in the 2A.CPR_CLP and 2B.AC_CLP products. More technical aspects of the algorithm design are described in Sato et al. (2025) and the algorithm theoretical basis document (ATBD) (Nakajima et al., 2026).
The major sources of Doppler measurement errors, ε in Eq. (1), include Doppler velocity folding, multiple scattering, mirror image echoes, and antenna mispointing errors. Doppler velocity folding or aliasing occurs when the target's speed exceeds the Nyquist velocity, proportional to the pulse repetition frequency (PRF) of the radar for a given electromagnetic frequency. The EC-CPR has three observation modes with different PRFs and, resultingly, different maximum observable altitudes of 16, 18, and 20 km (Imura et al., 2026). A higher PRF ensures a smaller Doppler noise and a larger Nuquist velocity at the expense of a lower maximum observable altitude. At tropical latitudes, EC-CPR had been operated with the 20 km mode until it was switched to the 18 km mode on 8 July 2025 (Imura et al., 2026). The corresponding Nyquist veolocity is about 5 m s−1 (Illingworth et al., 2015; Hagihara et al., 2023). Doppler measurements could exceed this value in cases like falling raindrops and intense updraft in extreme convection. It is very difficult in the latter case to unfold the aliased wD profiles (Galfione et al., 2025).
Multiple scattering (MS) occurs when a weather radar, especially a high-frequency radar like EC-CPR, observes thick, heavily precipitating clouds such as deep convective towers (Aoki et al., 2026a). MS makes a transmitted echo travel over extra distance before returning to the receiver, causing an effect known as pulse stretching. A notable stretching effect detected by a downlooking radar can lead to a long tail of echo extending to far below the surface, which is often called the MS tail (Battaglia and Simmer, 2008). A MS tail is recorded in EC-CPR observations as a second-trip echo, or a ghost echo emerging at a high altitude in the subsequent scan. Second-trip echoes arise also from mirror images, or the bogus echoes resulting from the radar pulses reflected back and forth between clouds and surface. Upper-tropospheric cloud cover estimated from EC-CPR could be falsely enhanced by a few percents due to mirror image echoes and to a much lesser extent by MS tails (Battaglia, 2021).
It is attempted to detect Doppler velocity folding in rainfall, MS tails, and mirror image echoes in the L1 data processing (Nakajima et al., 2026; Aoki et al., 2026a). Corrections to these artifacts are applied to the downstream L2 products. Doppler velocity folding is not expected in any case to impose considerable impacts on anvil clouds, in which neither vertical air motion nor sedimentation speed likely exceeds the Nyquist velocity of ∼ 5 m s−1. MS tails are unlikely either for moderate and small cloud optical depths as typical of cirrus anvils. On the other hand, it was found at an early stage of the analysis that mirror image echoes were partially left unfiltered in the L2 Doppler data. These remaining mirror images are removed in a simple method described in Appendix A.
Doppler velocity is contaminated with the satellite motion if CPR's line of sight (LOS) deviates away from nadir. The LOS contamination has been corrected in JAXA's EarthCARE L2 products with the exception of antenna mispointing errors originating from a thermal distortion of the antenna structure. Thermal distortions are considered to occur periodically over the orbital cycle, since the antenna would experience the largest thermal stress as the satellite flies over near the poles from the sunlit side of the planet to the other and vice versa. This is confirmed by the data indicating that the effects of antenna mispointing on Doppler measurements of ice clouds are gravest at polar latitudes while small at low latitudes (Puigdomènech Treserras et al., 2025). No attempt is made in this study, targeted exclusively on tropical clouds, to apply antenna mispointing corrections.
The in-cloud vertical motion estimates from EarthCARE are shown in this section, first on a snapshot-by-snapshot basis (Sect. 3.1) and then with composite statistics (Sect. 3.2 and 3.3).
3.1 Example snapshots
Five events of organized convective systems are chosen from different regions over tropical oceans in Fig. 1, where each row shows the same snapshot but for different variables and products. The selected events vary from one to another in structural detail but have in common that a thick cloud layer penetrating from below the freezing level (∼ 5 km) to the upper troposphere is accompanied by anvil cloud. The left two columns show that IWC, nearly as large as 1 g m−3 deep inside convective towers, tends to decrease with increasing height. IWC may remain relatively large in anvil clouds in some cases (e.g., the top row) but can be smaller than 10−2 g m−3 in others (e.g., the bottom row). The cloud boundaries form a nearly identical shape between the two products except near cloud top, where the CPR-ATLID product captures the edges of clouds with a very small IWC (colored in light yellow) that are undetected by CPR alone, as highlighted more explicitly in the supplement information (Fig. S1 in the Supplement). This is as expected owing to the greater sensitivity of ATLID to cloud ice compared to CPR.
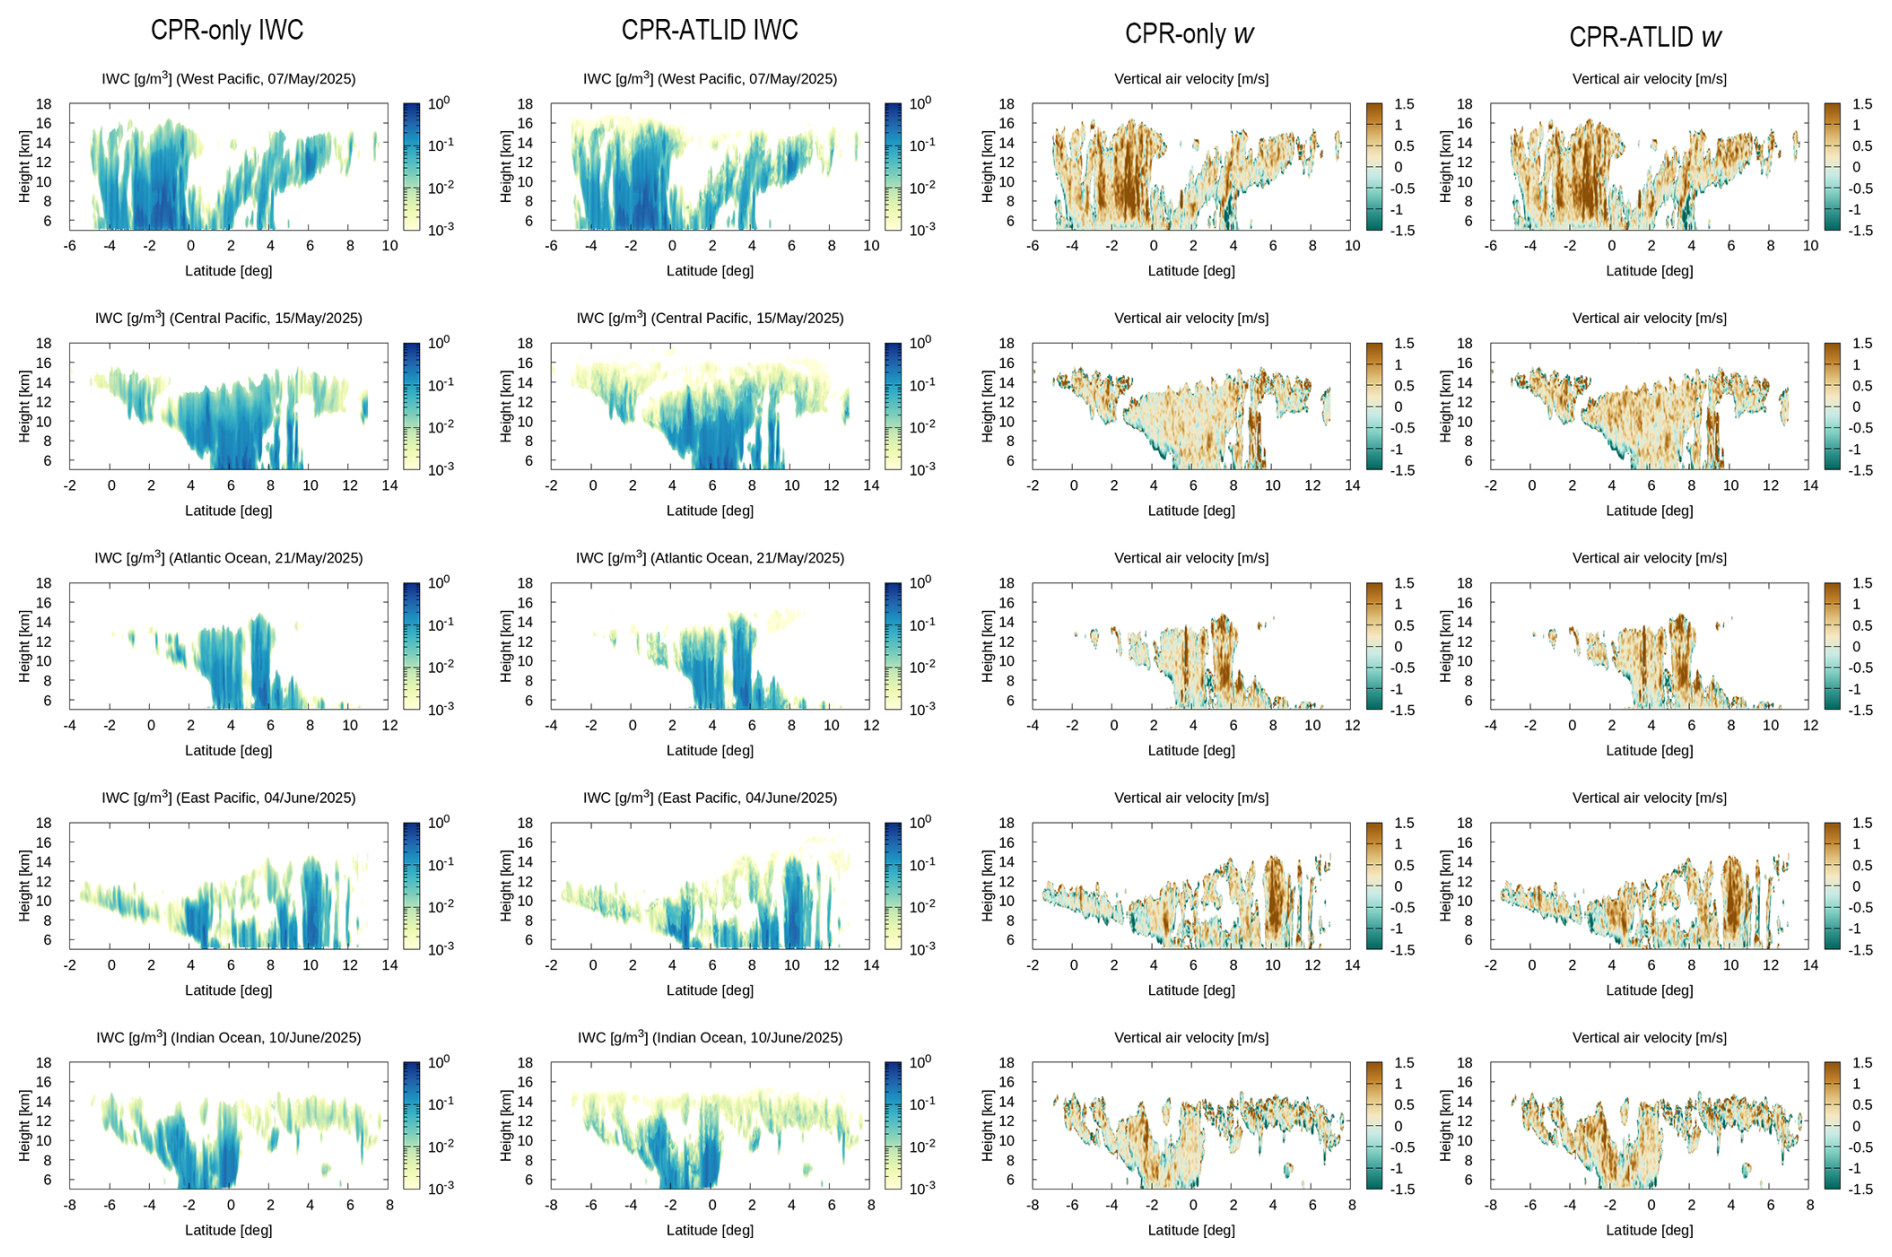
Figure 1Five selected snapshots in latitude-height cross sections of IWC (g m−3, left two columns) and in-cloud vertical air velocity wa,c (m s−1, right two columns) for altitudes above 5 km. The EarthCARE radar-only (2A.CPR_CLP) product is compared with the radar-lidar (2B.AC_CLP) synergy product for each variable. The region and date of observation are indicated above each panel.
Vertical air velocity is plotted in the right two columns of Fig. 1. An updraft motion is found in penetrating cloud layers, e.g., from −2 to 0° latitude in the first example, around 6° in the third, and at 10° in the fourth, whereas anvil clouds have a relatively modest vertical motion as anticipated. The vertical motion profiles seemingly exhibit little apparent difference between the two products. A closer examination, however, reveals that wa,c is slightly but systematically larger in the CPR-ATLID than in the CPR, as most noticeable in the second example. Difference plots between the products are given in Fig. S2.
3.2 Doppler velocity versus air motion
The observed statistics of ice clouds are next examined in terms of IWP. IWP, or the column-integrated mass of cloud ice, may be viewed as a simple metric to conveniently separate deep convective cores (IWP > 103 g m−2) from anvil clouds (10 g m−2 < IWP < 103 g m−2) and thin cirrus (IWP < 10 g m−2), following the definition of Sokol and Hartmann (2020).
The histogram of IWP from the CPR-only and CPR-ATLID products is shown in Fig. 2. The two products yield qualitatively similar histograms, but a discrepancy is manifest. The CPR-only histogram is skewed toward larger IWPs in comparison with the CPR-ATLID statistics, suggesting that IWP in the CPR-only product may tend to be overestimated relative to the CPR-ATLID estimates. An overestimation of IWP in theory implies that, all else being equal, cloud particles are assumed to be too small, because ice water mass is inversely correlated with particle size under a fixed radar reflectivity. This indeed turns out to be the case as will be shown later in Sect. 3.3. The semi-transparent clouds detectable only by lidar may partly explain the difference as well toward the lower end of the histogram.
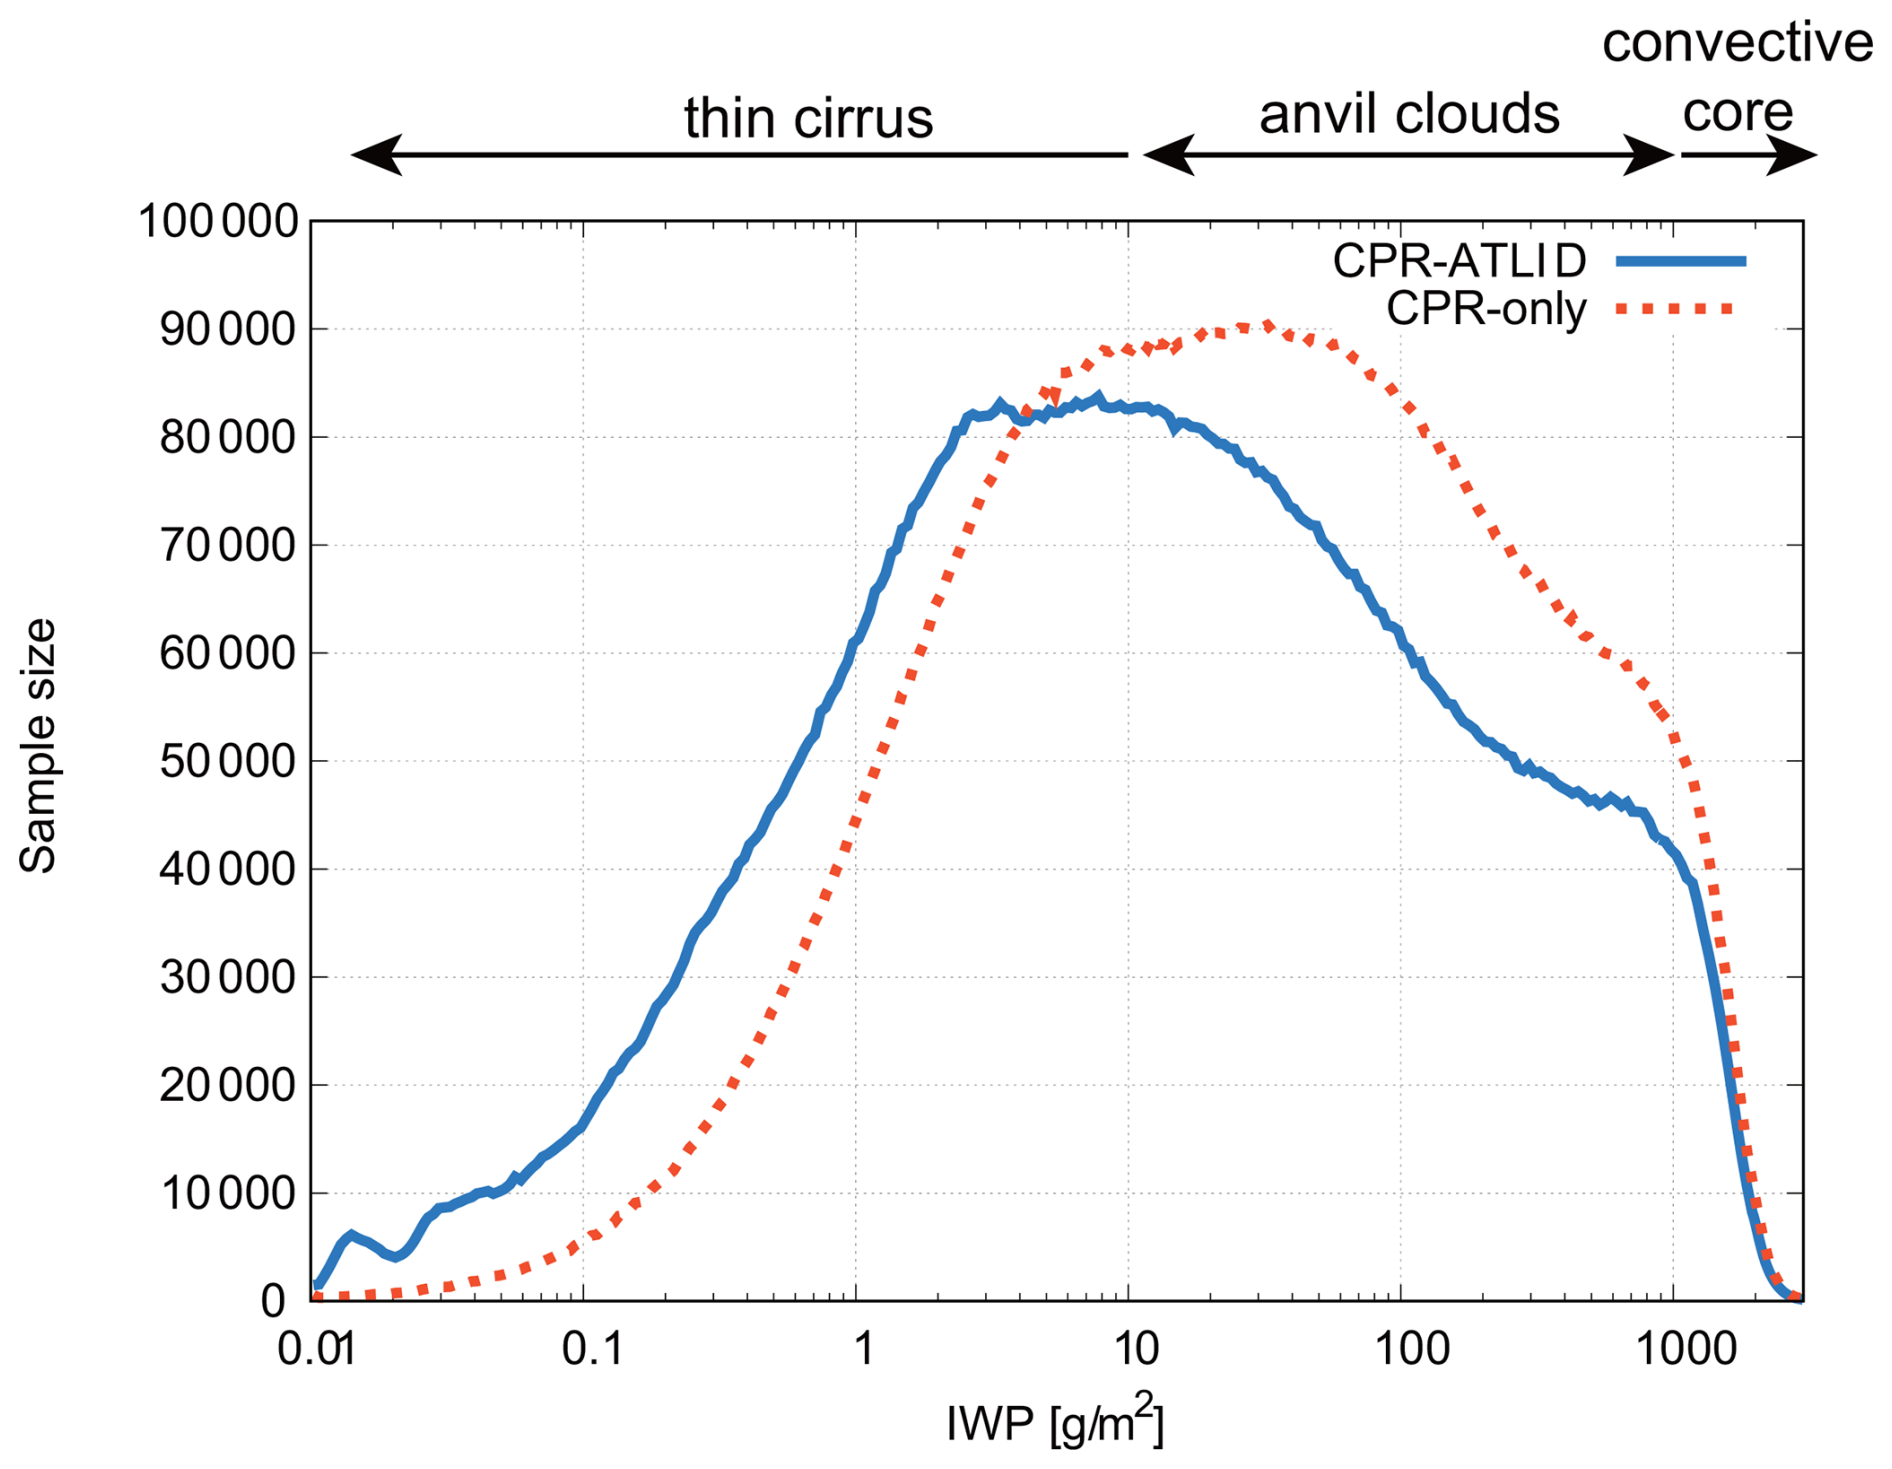
Figure 2Histogram of IWP (g m−2) from the CPR-only (dotted) and CPR-ATLID (solid) products, defined by logarithmically uniform bins with the width of 0.02. Three cloud types of convective cores, anvil clouds, and thin cirrus labeled at the top are as defined by Sokol and Hartmann (2020).
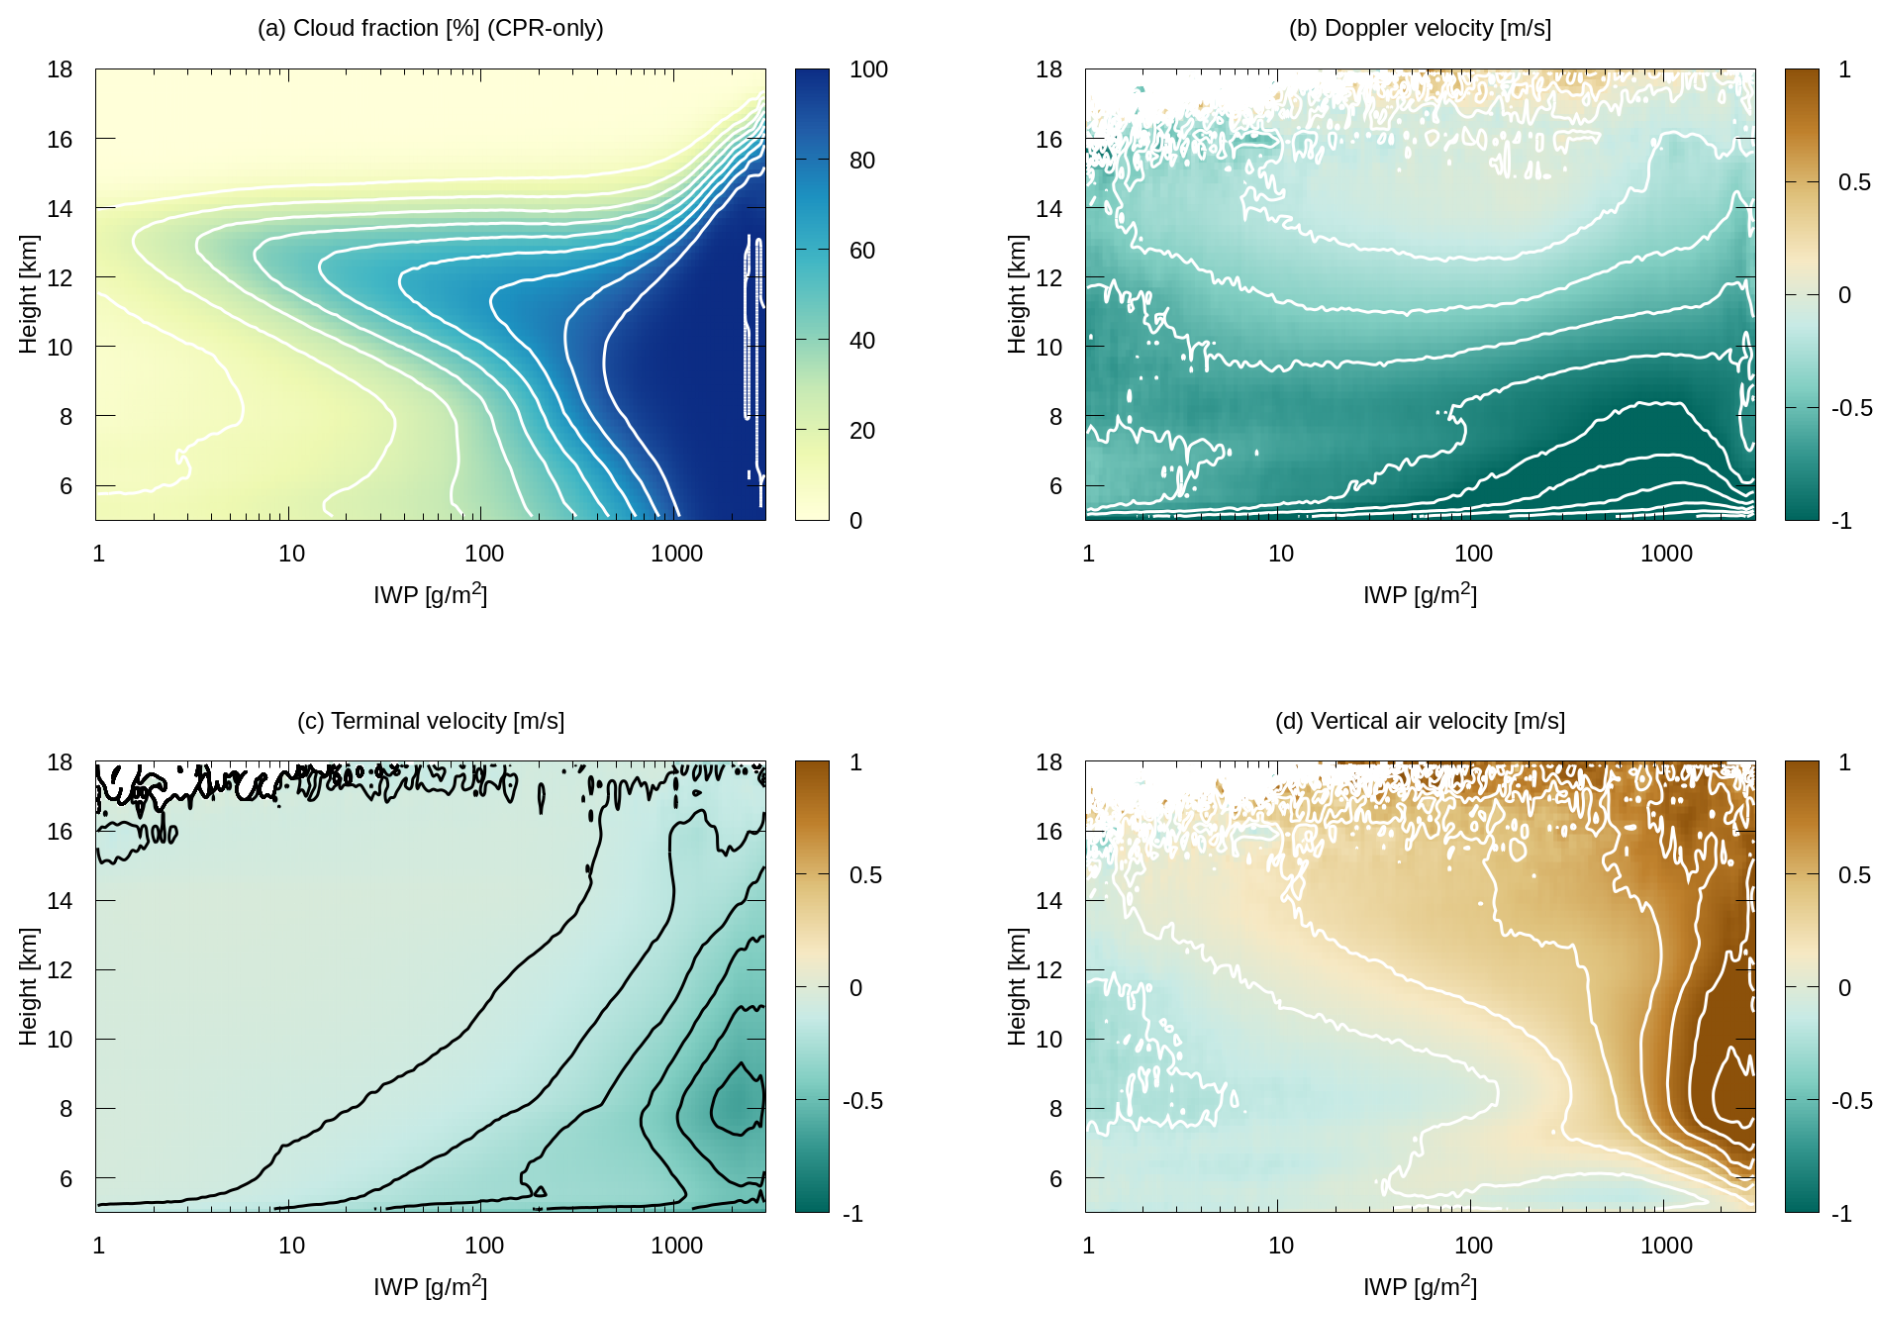
Figure 3Composite IWP-height diagrams of (a) cloud fraction (%), (b) Doppler velocity wD (m s−1), (c) Terminal velocity wt (m s−1), and (d) In-cloud vertical air velocity wa,c (m s−1). The contour intervals are 10 % in panel (a), 0.2 m s−1 in panels (b) and (d), 0.1 m s−1 in panel (c). Velocity is defined as upward positive. All the plots are based on the CPR-only product (2A.CPR_CLP).
Figure 2 remotely resembles the IWP histogram from CloudSat/CALIPSO observations in past work (e.g., Sokol and Hartmann, 2020) but differs in detail. The discrepancies, while partly because observation periods are not overlapping, are likely to arise from algorithm-specific biases. Different products, or different versions of the same product, disagree among one another in the IWP histogram even for the same input observations (Atlas et al., 2024). It is noted that the histogram in Fig. 2 sharply tapers off toward the high end of IWP around 3 × 10³ g m−2. This upper limit is significantly lower than known in the literature, well outside the inter-product spread across multiple CloudSat/CALIPSO products (Atlas et al., 2024). The reasons for this bias are unknown at this point.
Figure 3 presents cloud fraction, wD, wt, and wa,c averaged into a composite IWP-height diagram, as done in some past work (Ohno and Satoh, 2018; Gasparini et al., 2019). It is noted that IWPs smaller than 1 g m−2, although not negligible in occurrence as seen in Fig. 2 above, are set outside the range in order to narrow the focus on anvil clouds and convective cores. The CPR-only product is adopted to plot Fig. 3.
Cloud fraction in IWP-height space (Fig. 3a) offers a clear statistical representation of deep convection at the largest IWPs and anvil clouds gradually thinning as they extend toward smaller IWPs (c.f., Fig. 1 of Gasparini et al., 2019). Doppler velocity (Fig. 3b) is found to be negative (downward) almost throughout the whole domain, most notably for large IWPs just above the freezing level of ∼ 5 km. Terminal velocity (wt) notably increases toward the lower-right corner of the plot (Fig. 3c), where precipitating ice is expected to be abundant and grown in size (Sect. 3.3). Doppler velocity is nearly zero above 12 km in height for an intermediate range of IWP.
In-cloud vertical air velocity implies an intense updraft inside convective cores and a modest ascent in anvil clouds (Fig. 3d). This overall structure of composite wa,c meets intuitive expectations and bears qualitative resemblance to simulated IWP-height diagrams from past numerical studies (Ohno and Satoh, 2018; Gasparini et al., 2022). Surprising, though, is the striking contrast between Fig. 3b and Fig. 3d, that is, wa,c and wD exhibit remarkably different patterns despite the fact that the former is derived from the latter. This discrepancy may be understood through a careful inspection of wt. For example, one can see from the contoured diagrams that terminal velocity monotonically enhances with IWP along any given height (Fig. 3c), whereas Doppler velocity no longer increases with IWP or even turns to diminish at the same altitude once IWP exceeds 103 g m−2 (Fig. 3b). The resulting combination of a largely negative wt and a modestly negative wD for largest IWPs (i.e., convective cores) is attributed to an intense in-cloud updraft (a large positive wa,c) according to Eq. (1).
3.3 CPR-only versus CPR-ATLID retrievals
It was shown in Fig. 3 that convective cores and anvil clouds are observed with positive wa,c even where wD is negative. This disparity between wa,c and wD is explained by the disproportionately large size-dependence of wt,Z. Radar back-scattering strengthens so sharply with particle size that wt,Z could be dominated by large particles falling out of an ascending air parcel even though such precipitating particles are much fewer in number than smaller cloud particles. It follows that an adequate characterization of PSD is crucial for evaluating wa,c from Doppler measurements. Although the Doppler capability is equipped only with CPR, ATLID yields a useful constraint on the determination of PSD when combined with CPR as argued in Sect. 2.2. It is thus a simplistic but useful exercise to compare the CPR-only and CPR-ATLID products for grasping to what extent an inconsistency in PSD could impact on the estimation of wa,c.
The CPR-only cloud fraction is contrasted with its CPR-ATLID counterpart in Fig. 4a–b. While the overall cloud structure is shared in common, CPR-ATLID captures a greater amount of clouds at high altitudes beyond 14 km than CPR alone, as already confirmed in selected snapshots (Fig. 1). Otherwise any discernible difference is absent in cloud fraction, since lidar signals are rapidly lost by attenuation as they travel deeper in the cloud layer. The impact of lidar measurements on cloud microphysics, however, can be more far-reaching (Fig. 5). The reasons for this include the attenuation correction, which can make any microphysical difference propagate from upper to lower cloud layers as described in Sect. 2.2. Another possible reason is that composite statistics are comprised of various cloud samples with different heights. For instance, an upper layer of relatively low-topped clouds are likely averaged together with the deep interior of higher-topped clouds in the composite diagram.
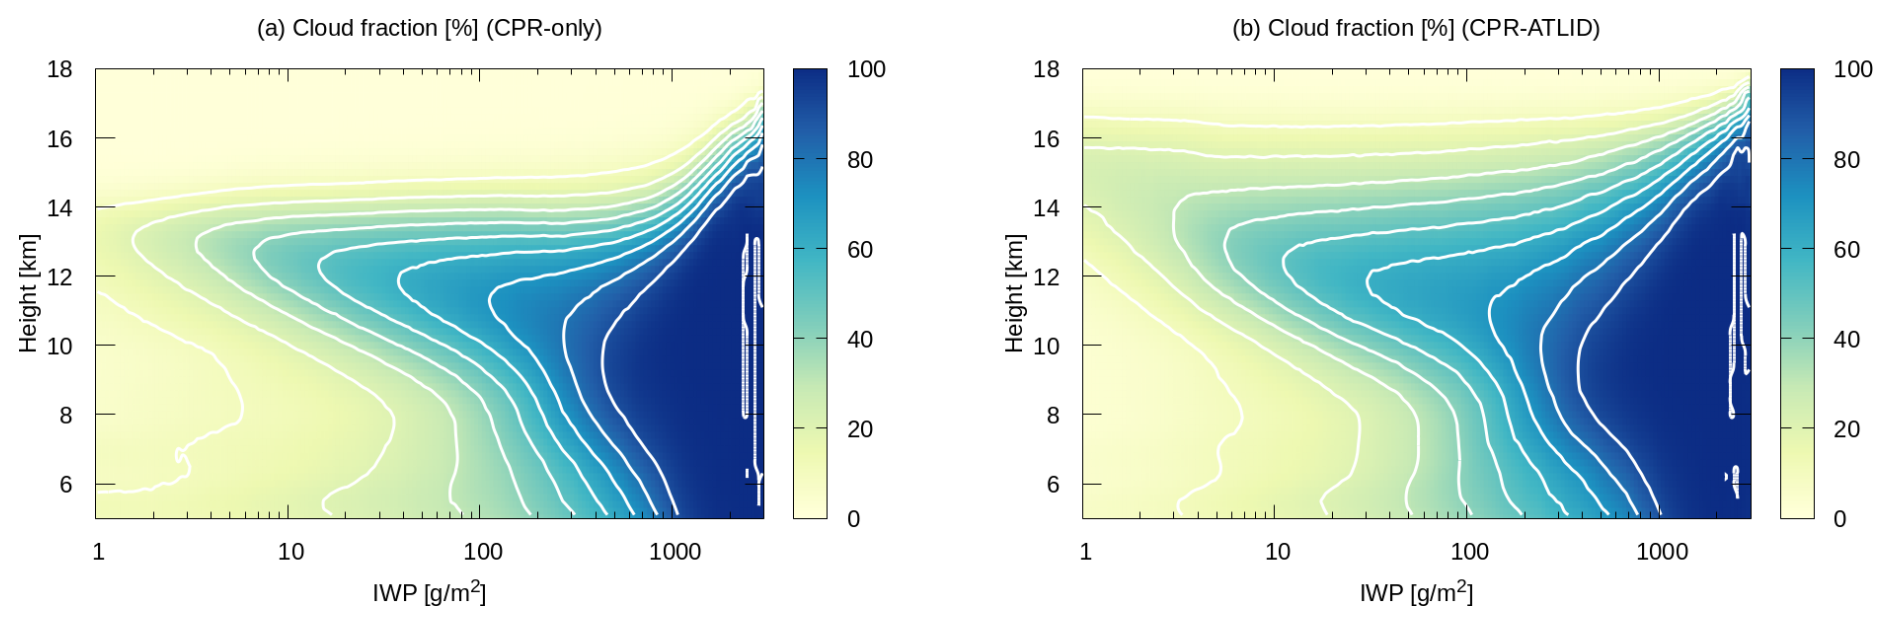
Figure 4Composite IWP-height diagrams of (a) CPR-only cloud fraction (%) as Fig. 3a and (b) CPR-ATLID cloud fraction (%). The contour interval is 10 %.
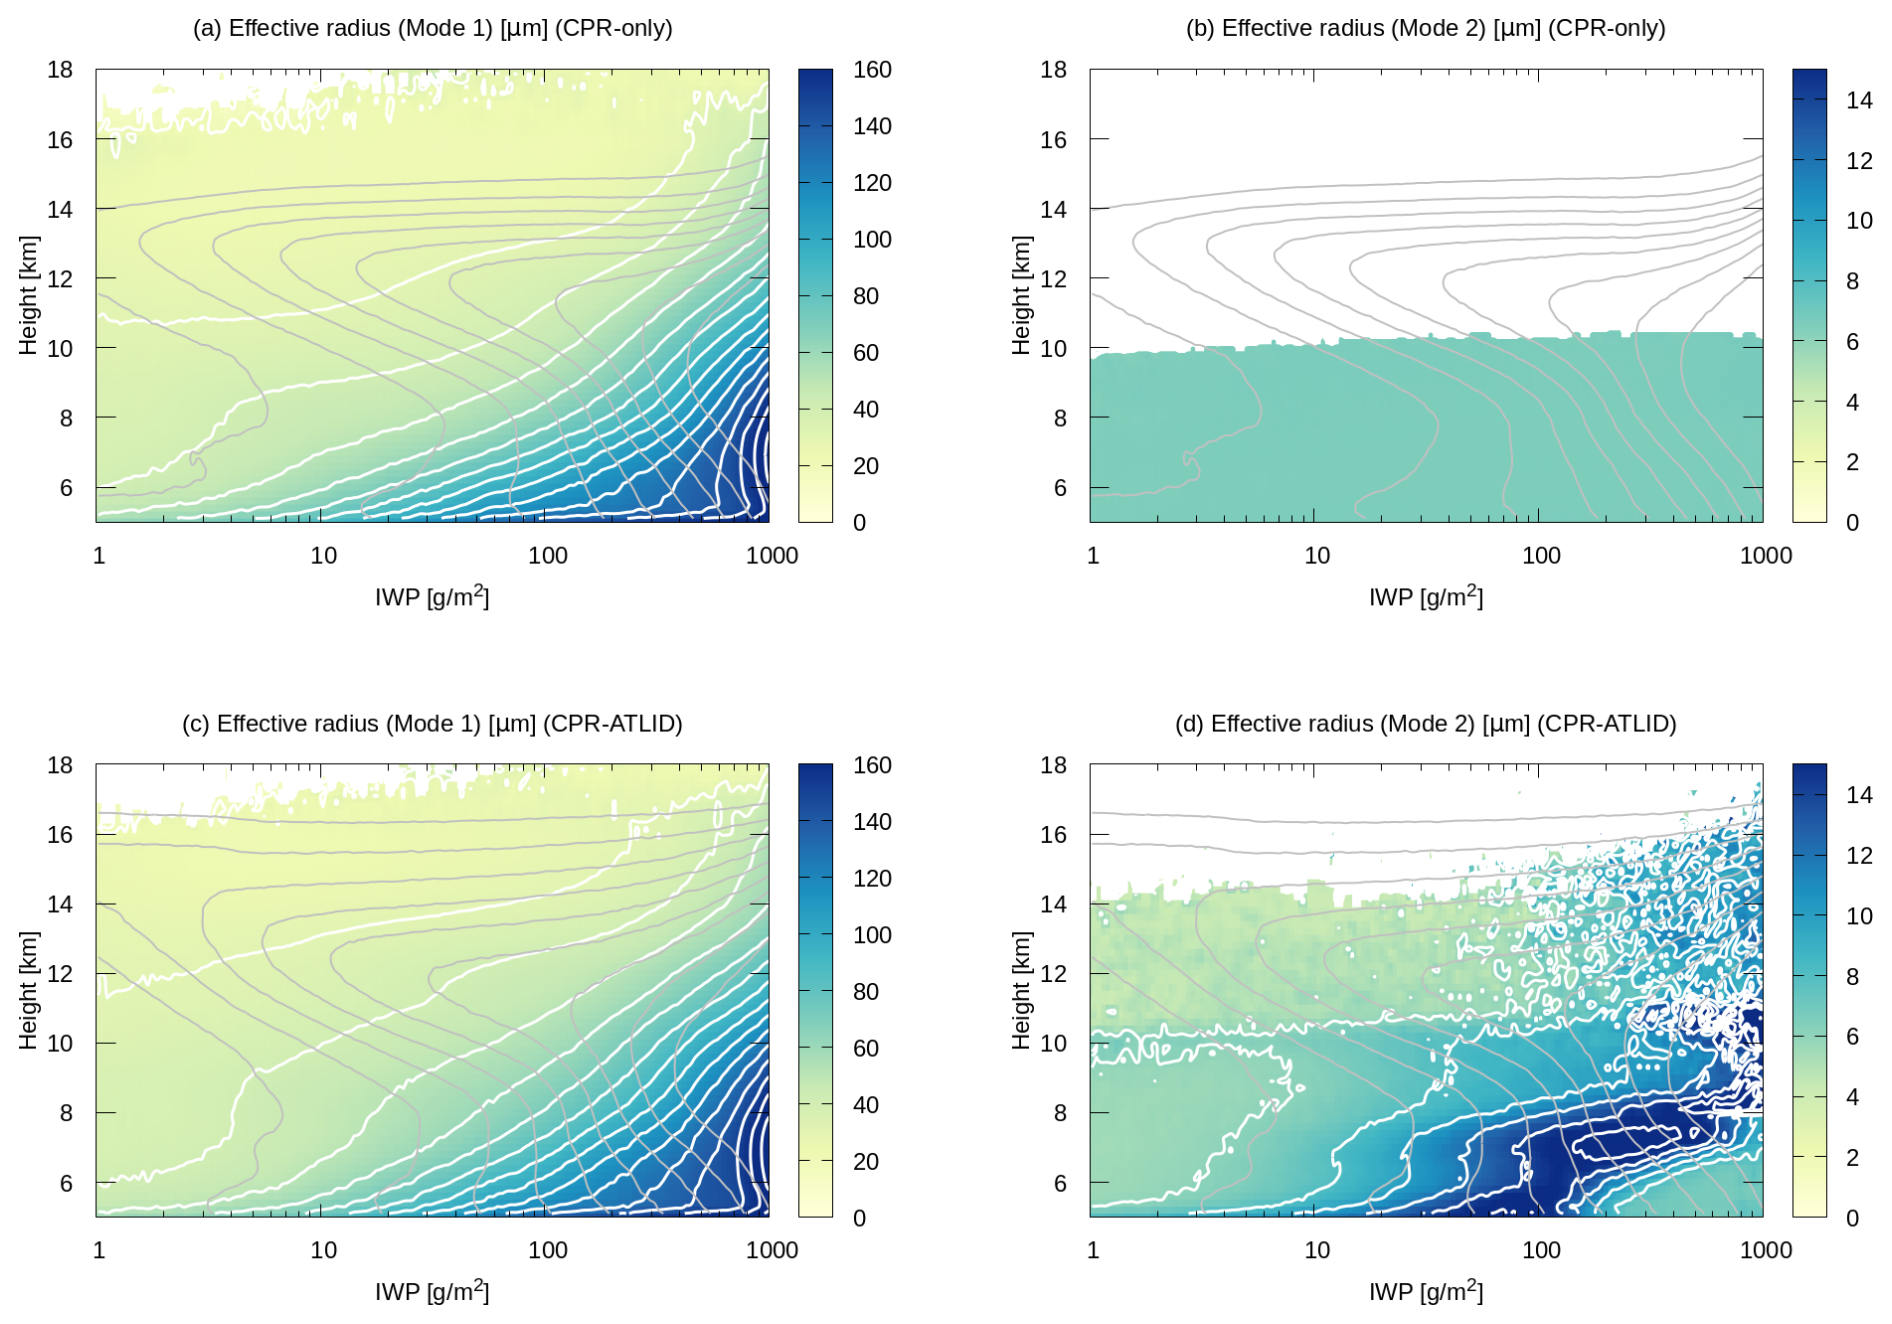
Figure 5Composite IWP-height diagrams of (a) re,1 from CPR-only, (b) re,2 from CPR-only, (c) re,1 from CPR-ATLID, and (c) re,2 from CPR-ATLID.Each variable is contoured in white with an interval of 10 µm for panels (a) and (c) and of 2 µm for panels (b) and (d). The range of variability is so narrow that contours are not visible in panel (b). Cloud fraction is overlaid in gray contours for reference.
The 2A.CPR_CLP and 2B.AC_CLP products contain mode-1 and mode-2 cloud effective radii, denoted hereafter by re,1 and re,2, corresponding to precipitating and non-precipitating particles, respectively. Figure 5 compares re,1 and re,2 from the two products in IWP-height space. A sharp increase toward the lower-right corner in the composite pattern of re,1 is shared by the two products (Fig. 5a, c). To the contrary, the CPR-only and CPR-ATLID estimates of re,2 strikingly disagree with each other. In the CPR-only product, re,2 is nearly homogeneous below 10 km in altitude and entirely missing above (Fig. 5b), while re,2 is highly variable throughout the domain up to 14 km or even higher in the CPR-ATLID product (Fig. 5d). The rich variability in the latter is as expected because ATLID is able to detect small (mode-2) particles that may be missed to a large degree by CPR.
The mode-2 cloud particles are so small that the direct impact of the second mode on wt, and thereby on wa,c, is secondary. The first mode almost exclusively accounts for wt, as visually evident from a structural resemblance of re,1 (Fig. 5a,c) to wt (Fig. 3c). The second mode, nonetheless, is by no means negligible in that the mode-1 PSD is forcibly skewed in compensation for the discrepancies in re,2 under the constraint of a given observation. As color-shaded in Fig. 6a, the mode-1 effective radius tends to be consistently smaller in the CPR-only product than in the CPR-ATLID, except in the close vicinity of the freezing level where the bias switches in sign. A negative bias in effective radius leads to a smaller fall speed, and hence results in an overall underestimation of the CPR-only wa,c relative to the CPR-ATLID as can be confirmed in Fig. 6b. The inter-product bias in wa,c nevertheless remains modest in magnitude (within ±0.2 m s−1). The CPR-only wa,c (Fig. 3d) visually compares well to the CPR-ATLID counterpart as contoured in Fig. 6b, assuring that the overall pattern of wa,c is qualitatively robust.
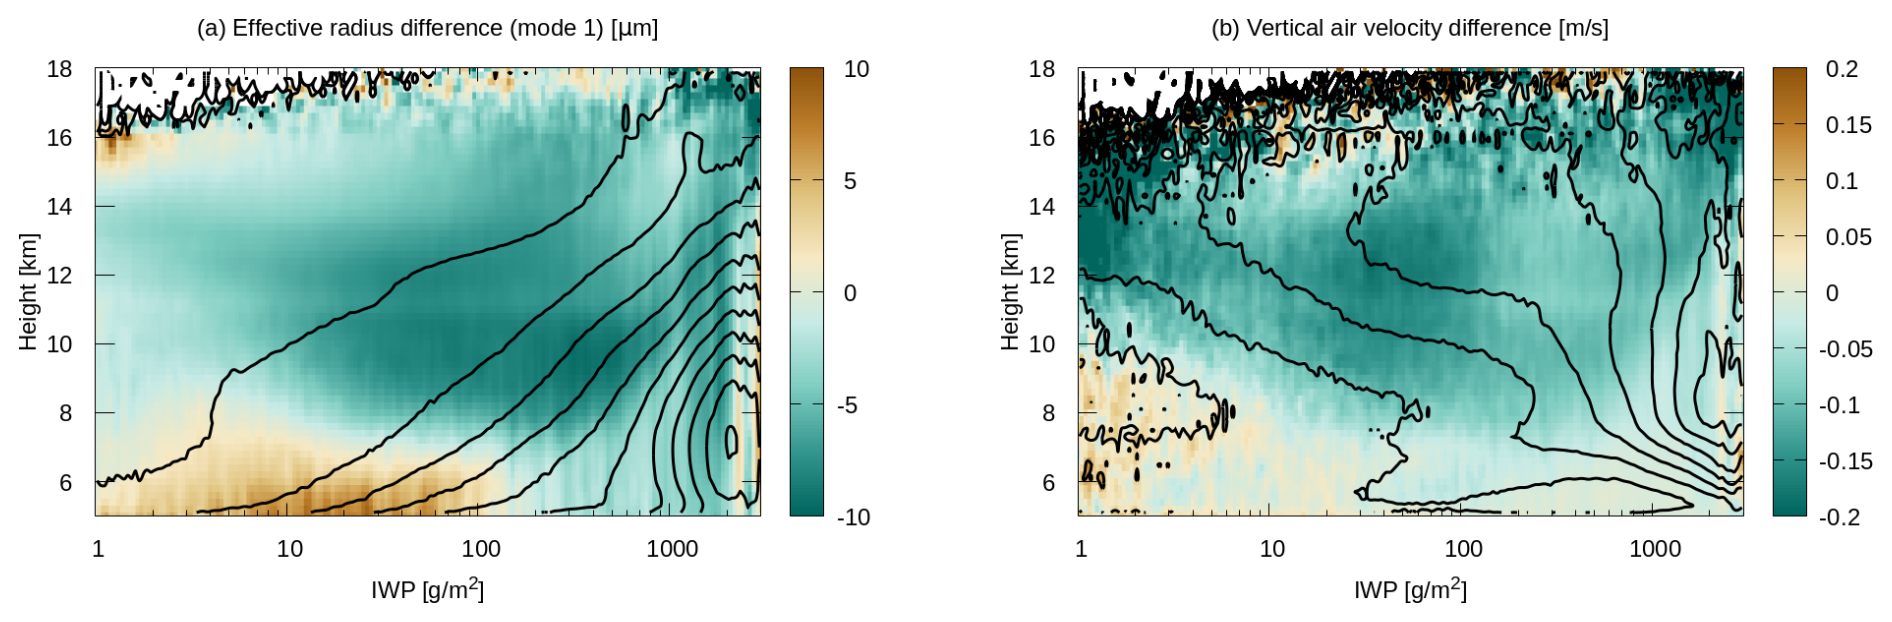
Figure 6Composite IWP-height diagrams of (a) The mode-1 particle effective radius from CPR-ATLID (µm, contoured) and its inter-product difference (CPR-only − CPR-ATLID, in color) and (b) In-cloud vertical air velocity from CPR-ATLID (m s−1, contoured) and its inter-product difference (CPR-only − CPR-ATLID, in color). The contour intervals are 20 µm in panel (a) and 0.2 m s−1 in panel (b).
The composite diagrams shown in the previous section illustrate the mean vertical profiles sorted by IWP instead of a spatial dimension. Although the observed structure of anvil clouds and convective cores in Fig. 4a–b is reminiscent of an organized convective system as we know it, adjacent columns in IWP space are not guaranteed to represent physical neighbors. In this section, similar composite plots are constructed but this time sorted by horizontal distance in place of IWP. The distance-height diagram of vertical air velocity enables to delineate a two-dimensional picture of horizontal wind and thus of circulation field.
4.1 Method
The current approach is conceptually similar to previous methods based on radar-detected cloud features (Igel et al., 2014; Ito and Masunaga, 2022) or infrared-measured cloud properties (Protopapadaki et al., 2017; Sokol and Hartmann, 2020) but differs in that convective cores and anvils are separated simply by IWP.
A convective core is defined as a series of consecutive cloudy columns that each satisfy the empirical definition of IWP > 103 g m−2 over a distance of ±Rc. The convective core radius, Rc, is known to span a broad range with the median of about 5 km over tropical oceans (Takahashi et al., 2023). All convective cores with Rc ≥ 1 km are included in the present analysis to secure a sufficient sample size. A more restrictive definition of Rc ≥ 5 km was also tested and confirmed not to qualitatively alter the results. An along-track sequence of observed columns is sampled around each convective core. This procedure is repeated with all qualifying convective cores over the study region and period (Sect. 2.1). The resulting collection of column sequences are averaged into a composite diagram as a function of horizontal distance measured from the core center.
It is noted that this horizontal distance is not necessarily the distance to the nearest core if multiple convective cores exist in vicinity (a few such examples may be found in Fig. 1). The search over horizontal distance continues up to ±200 km from the origin whether or not neighboring cores are met, with the caveat that the interior of the neighboring cores is not sampled. This caveat is intended to exclude external convective cores that happen to be present nearby from the compositing, as schematically illustrated in Fig. 7. In this schematic, an isolated convection (Core 1) intrudes into an anvil cloud belonging to another convective tower (Core 2). The current sampling procedure may properly attribute the anvil cloud to its parent core (Fig. 7b) or may not (Fig. 7a). Both cases are included in the composite statistics because it is generally difficult to unambiguously discern in actual observations which core is the source of a given anvil cloud.
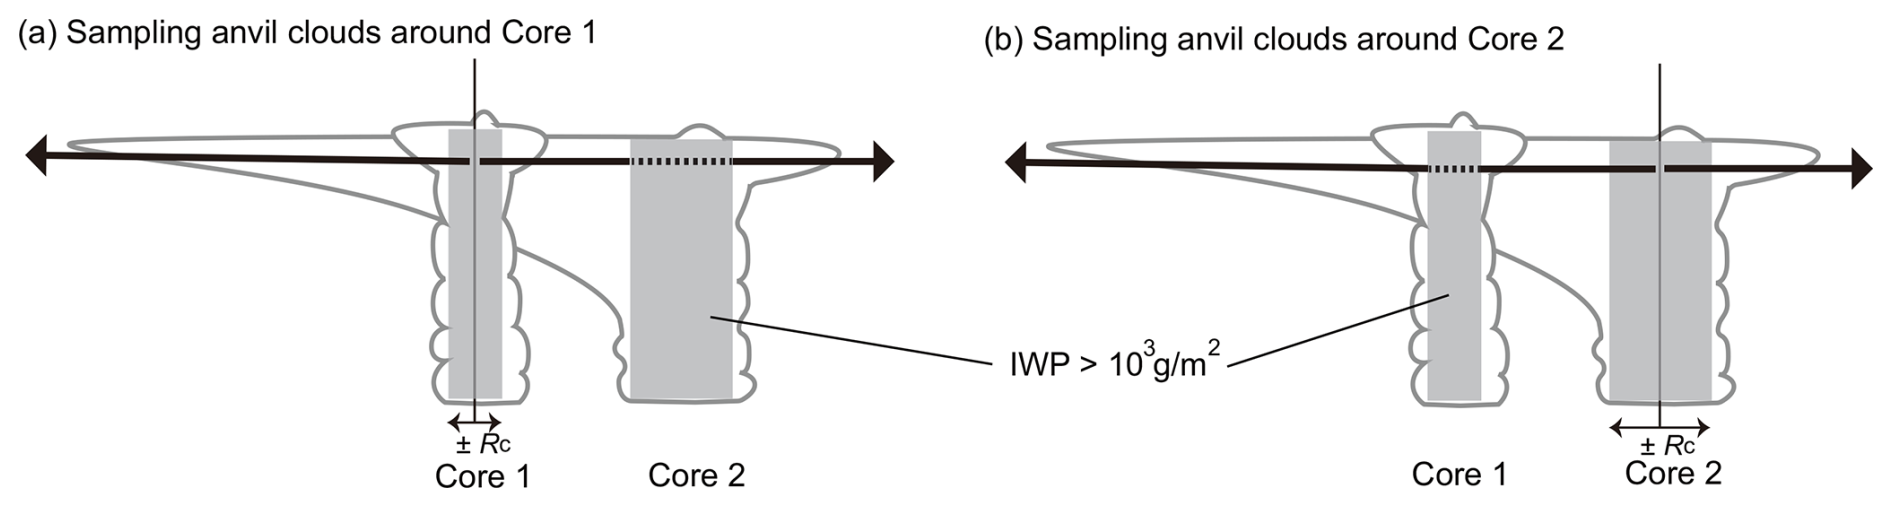
Figure 7Schematic example to illustrate how to sample anvil clouds around deep convective cores for (a) Core 1 and (b) Core 2. Grey boxes are the cloud columns with IWP > 103 g m−2. Distance from the selected core is denoted by thick arrows, of which dashed segments are to be excluded from composite samples.
Nadir observations from EC-CPR and ATLID are unaware of convective cores away from the sub-satellite track, potentially distorting the composite statistics of core-anvil pairs to a certain degree. As a strategy to overcome this problem, it may be possible to locate off-nadir cores in infrared imagery using the whole swath of EarthCARE Multi-Spectral Imager (MSI). This approach, however, has its own limitation that infrared radiance is not optimal for singling out convective cores especially when the cores are embedded in extensive high clouds. No attempt is made in this work to detect off-nadir cores for the sake of methodological simplicity. It is not attempted either for the same reason to put the sampled snapshots into the context of convective life cycle, although several sophisticated methods have been explored in the literature to monitor the anvil cloud evolution over life stages (e.g., Wall et al., 2020; Horner and Gryspeerdt, 2023).
Given all these limitations, it should be noted that the averaged cloud structure in vertical-horizontal space may be a statistically noisy representation of anvil clouds. Nevertheless, a distance-based (instead of IWP-based) composite analysis is crucial for the purpose of deriving diagnostic horizontal wind through the mass conservation law. The anelastic mass-conservation equation in the axisymmetric cylindrical coordinates yields radial wind, ur, as
where ρ0 refers to the unperturbed air density and D designates horizontal divergence,
The air density is calculated from the ERA air temperature and pressure sub-sampled along the satellite track. All-sky vertical velocity, wa, is defined with a combination of wa,c and ambient (clear-sky) vertical velocity, wa,a, as
Cloud fraction, fc, and wa,c are as estimated from EarthCARE observations, while wa,a is prescribed as explained later. The solution ur(r,z) is obtained by integrating Eq. (2) over r from r = 0 at each level with the symmetry-required boundary condition of ur(0,z) = 0. The distribution of wind vectors (ur, wa) in r–z space depicts a circulation field representing the anvil cloud dynamics.
The axisymmetric assumption is valid for isotropic anvil outflows from a point-source-like convective core as may occur in the absence of appreciable background wind. Axisymmetry, however, would not fit highly anisotropic convective systems like squall lines, with anvil clouds expanding nearly perpendicularly to a line of convective clouds. In such cases, the Cartesian continuity equation may offer a more appropriate approximation,
where ux is Cartesian horizontal wind. Equations (3) and (4) remain unchanged in the Cartesian coordinates except that r is to be replaced by x.
The only input variable unavailable from EarthCARE is wa,a, as EC-CPR is by design unable to detect anything outside clouds. The possible origins of wa,a range from radiatively-driven clear-sky subsidence to dynamically-forced ascent and descent such as gravity waves (Poujol and Bony, 2024). In this preliminary analysis, such complex variability of clear-sky vertical air motion is not considered. Instead, two contrasting simplifications are applied to wa,a. In the first case, wa,a is assumed to be absent everywhere, that is,
This zero-ambient-motion model is a workable (though not always realistic) assumption to the extent that wa,a changes more smoothly over height than wa,c, with the fact in mind that wa affects horizontal wind only through its vertical gradient.
The second case is a closed-circulation model, allowing wa,a to depart from zero under the constraint that the all-sky vertical motion vanishes at each level when averaged over a large-scale domain, that is,
for axisymmetry. The large-scale domain radius, RLS, is chosen to be 200 km for the present analysis. Equations (4) and (7) lead to
assuming that wa,a is homogeneous at any given level. For the Cartesian geometry, Eq. (8) is rewritten as
4.2 Result
Figure 8 shows composite cloud fraction and in-cloud vertical motion in the distance–height plane. Anvil clouds are clearly visible as a layer of enhanced cloudiness peaked around a height of 12 km (Fig. 8a). In-cloud upward motion is intense in the convective core (or around distance zero) but rapidly weakens outside the core. The updraft gradually weakens downward in coincidence with cloudiness diminishing from upper to lower levels. The overall pattern of cloud fraction and wa,c resembles the IWP-sorted composite diagram (Fig. 3) with the caveat that left and right should be flipped to match the largest IWP with distance zero.
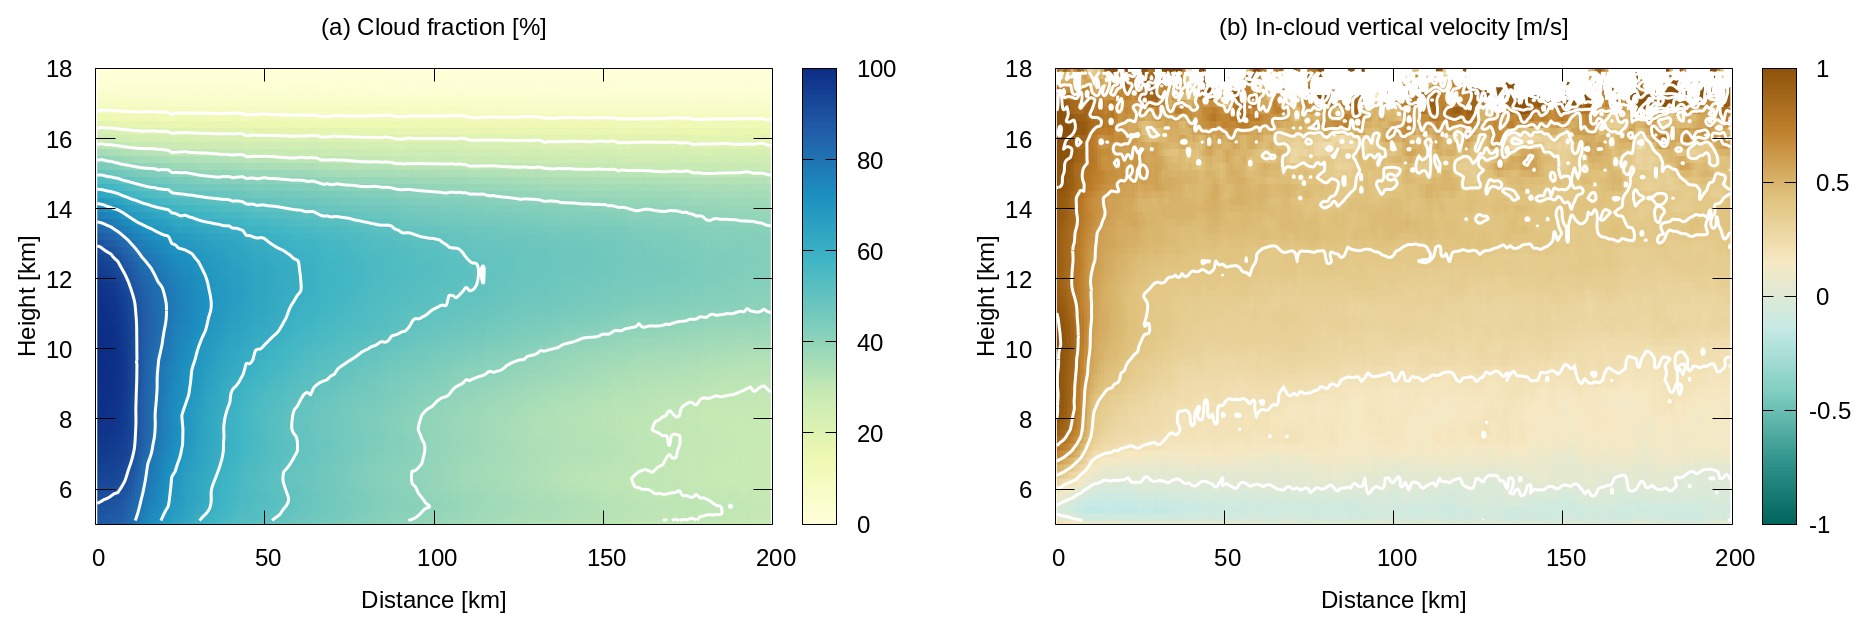
Figure 8Composite distance-height diagrams of (a) Cloud fraction (%) and (b) In-cloud vertical air velocity wa,c (m s−1). The horizontal axis is defined as the along-track distance from deep convective cores (see text for details). The plots are constructed with the CPR-ATLID product.
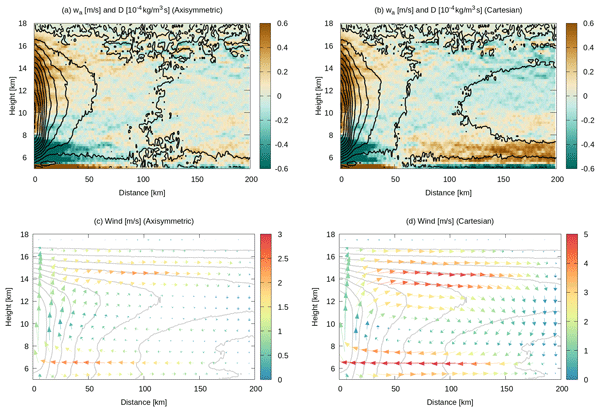
In the zero-ambient-motion model, all-sky vertical motion, wa, is simply the product of fc and wa,c as shown in Eq. (6). Intense updraft trapped within the convective core on the left end of the plot gives way to modest ascent in wa (contours in Fig. 9a). The wa contours at a distance of, say, 100 km implies an upward acceleration until wa reaches a maximum at ∼13 km in altitude and sharply declines beyond. The contrasting pair of acceleration and deceleration generates a layer of horizontal convergence topped by a diverging TTL as color-shaded in Fig. 9a. These features are by construction identical between the axisymmetric (Figs. 9a) and Cartesian (Figs. 9b) geometries when ambient vertical motion is absent.
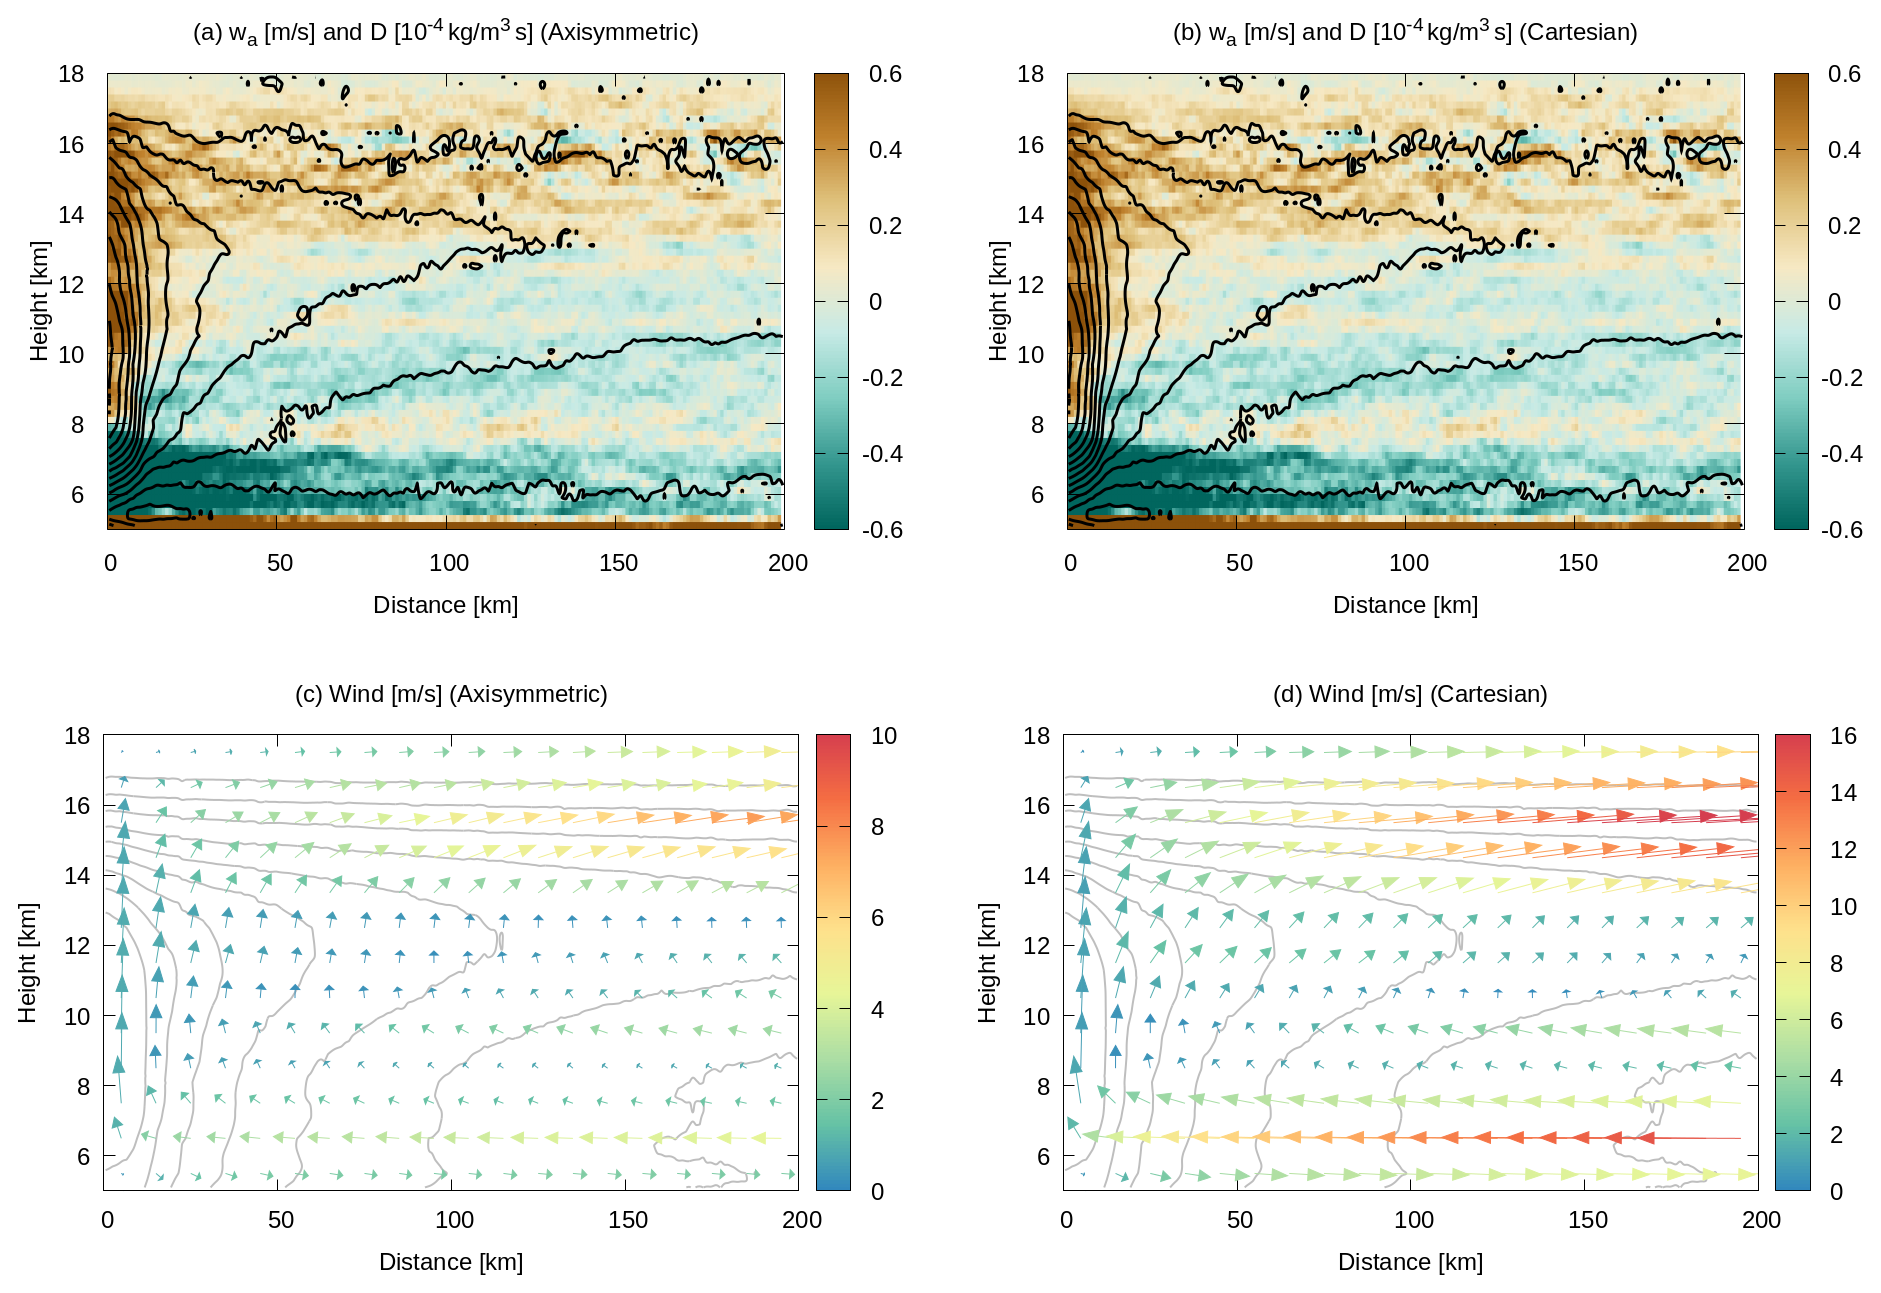
Figure 9Composite distance-height diagrams for the zero-ambient-motion model. (a) Vertical air velocity wa (m s−1, contoured) and horizontal divergence D (10−4 s−1, in color) for axisymmetric geometry. (b) As (a) but for Cartesian geometry. (c) Axisymmetric horizontal-vertical wind field with the amplitude color scaled (m s−1), overlaid by contoured cloud fraction for reference. (d) As (c) but for Cartesian winds. The contour intervals are 0.1 m s−1 in panels (a)–(b) and 10 % in panels (c)–(d).
Figures 9c presents axisymmetric wind vectors in the vertical plane for the no-ambient-motion model. The derived ur and wa together delineates a well-defined trajectories of vector fields comprised of a mid-level inflow below 11–13 km and an upper-level outflow above (Fig. 9c), reminiscent of the mid- to upper-tropospheric circulation archetypical of mesoscale convective dynamics (Moncrieff, 1992; Kingsmill and Houze, 1999). A similar circulation pattern was found also in numerical simulations of anvil clouds formed in association with isolated convection (Gasparini et al., 2019).
The Cartesian circulation is qualitatively identical to the axisymmetric winds (Fig. 9d). Wind speed, however, is estimated to be larger in the Cartesian geometry. The overestimation is most conspicuous at the farthest end away from the core, since axisymmetric (ring-shaped) horizontal divergence is geometrically diluted with increasing radius while Cartesian divergence is independent of distance. Figure 9c–d show that the upper-tropospheric outflow keeps accelerating over distance regardless of geometry, which is an implausible outcome largely due to the assumption that ambient vertical motion is absent. The unlikely acceleration of horizontal wind driven so far away from convective updraft would be rectified when realistic clear-sky subsidence is taken into account to avoid falsely large upper-tropospheric divergence.
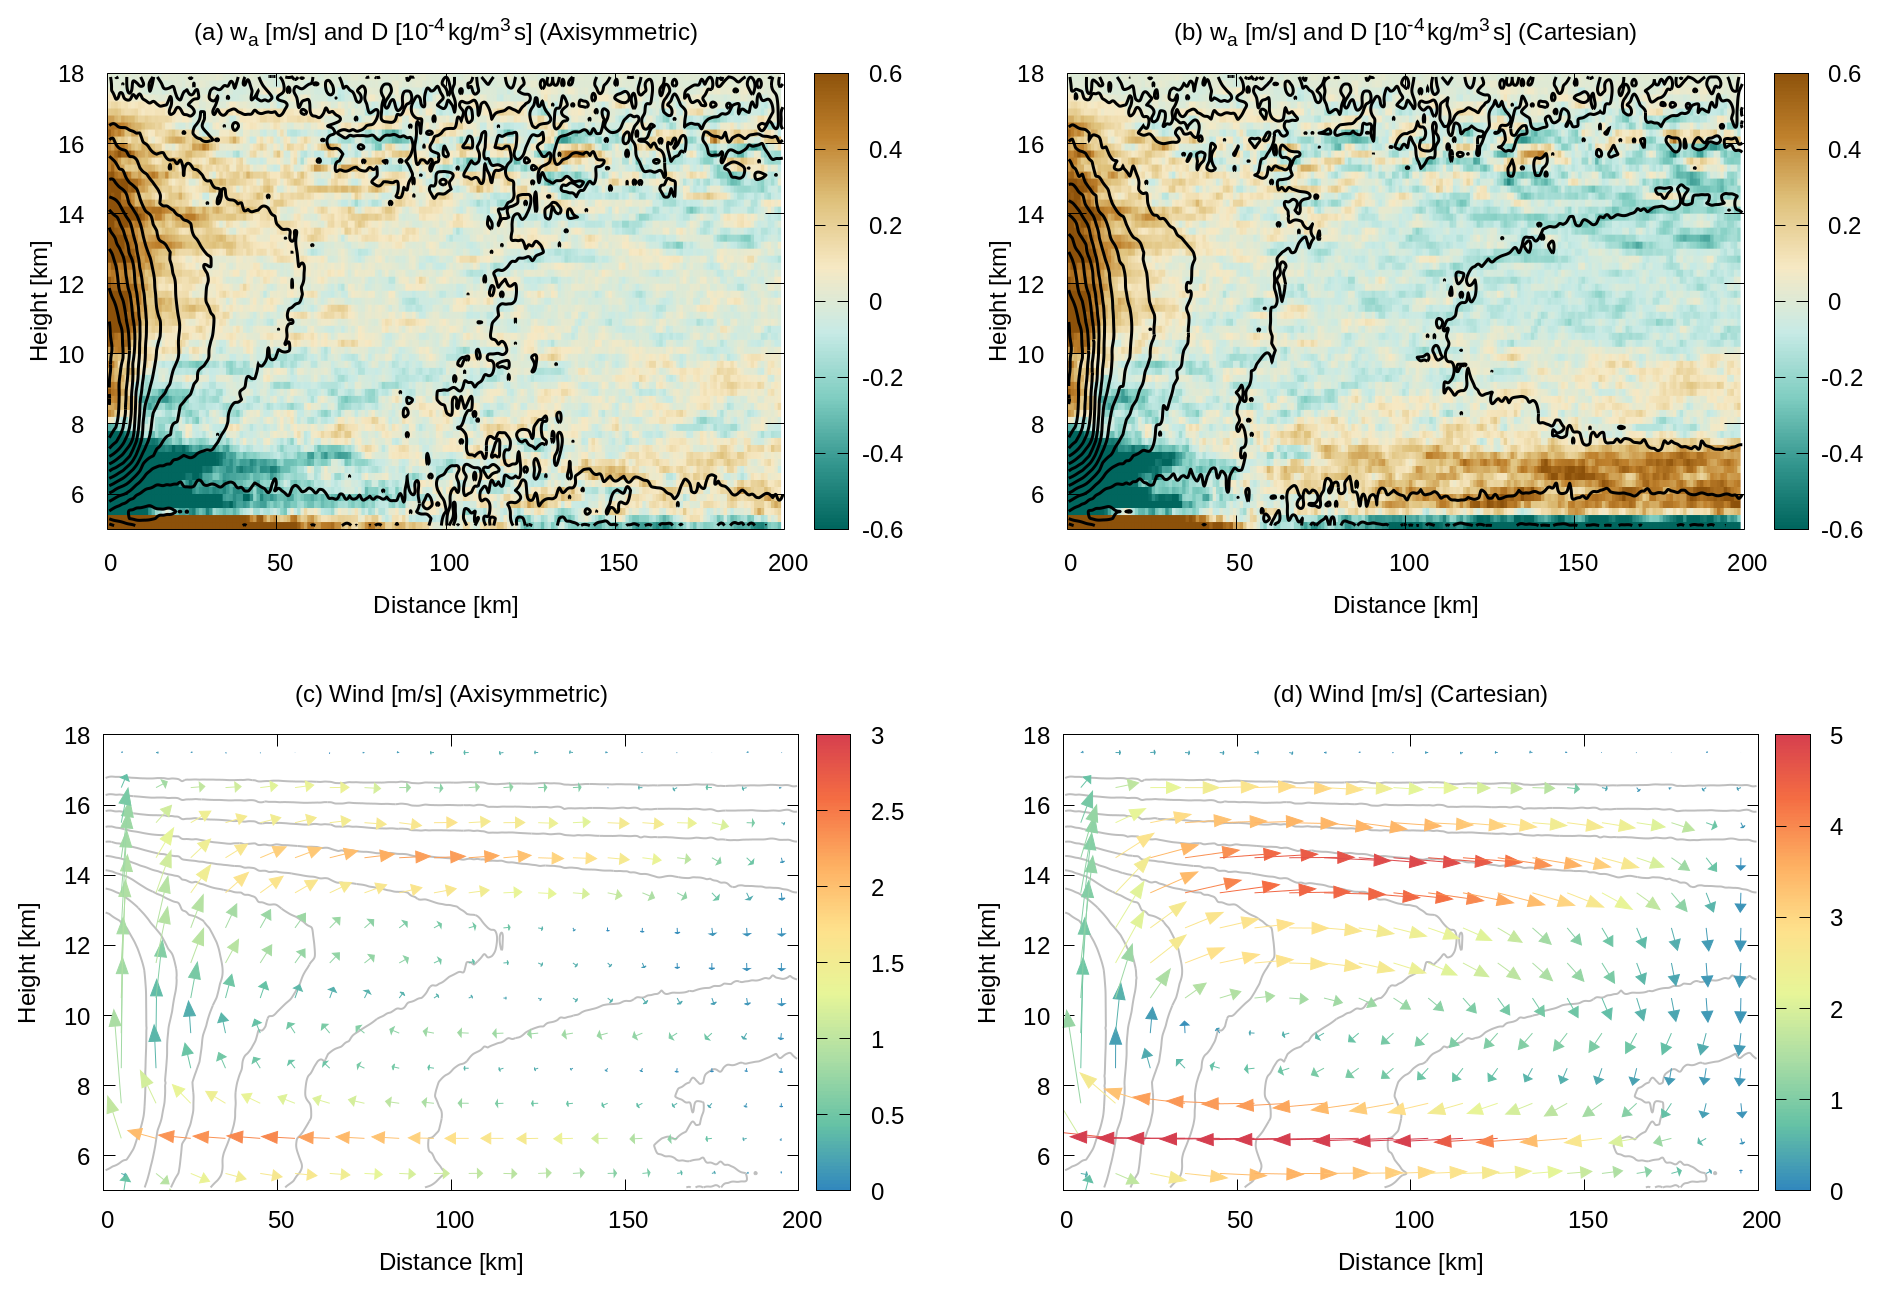
Winds from the closed-circulation model are shown in Fig. 10. The circulation field near the deep convective core (distance zero) is similar to that of the zero-ambient-motion model (Fig. 9), while notably different toward the far end of the domain. The closed-circulation model by design requires a downdraft away from the core to compensate the convective updraft. The compensating downdraft along with the associated mid-level convergence is evident particularly in Cartesian winds (Fig. 10b, d). The closed-circulation model is more realistic than the zero-ambient-motion model in that the forced downdraft suppresses an excessive acceleration of upper-level outflow. This idealized model, however, is of limited utility for practical applications because it relies on an arbitrarily chosen lateral boundary (at 200 km in the current case) and lacks some key processes such as radiative cooling that drive the subsidence.
The mesoscale circulation as depicted in Figs. 9 and 10 is more of an observational confirmation of the anvil cloud dynamics as known in the literature than a new addition to the current state of understanding. The result is nevertheless encouraging for future studies in that the EarthCARE products are proven not only to provide reliable measurements of in-cloud vertical air motion but to be able to offer two-dimensional wind vector as well.
Early observations from EarthCARE over global tropical oceans are investigated in this work to assess the potential of Doppler measurements from space for exploring the dynamics of tropical anvil clouds. Two of JAXA's cloud products derived with EC-CPR only (2A.CPR_CLP) and CPR and ATLID in tandem (2B.AC_CLP) are analyzed with focus on the IWP-sorted vertical structure of in-cloud vertical air velocity. Vertical air velocity derived from CPR Doppler measurements implies an intense updraft within convective cores and a modest ascent in anvil clouds. This result, although as intuitively expected, is not self-evident given the fact that Doppler velocity itself is predominantly negative (downward) or near zero throughout the IWP-height plane.
The Doppler estimation of sedimentation (terminal) velocity, and consequently of in-cloud vertical air velocity, relies sensitively on the microphysical model assumed in the retrieval algorithm. An extra observational constraint by ATLID on the PSD model updates the estimation of vertical air velocity in the CPR-ATLID product. Although the in-cloud domain where CPR and ATLID observations are available at the same time is limited to a narrow layer near cloud top, the benefit of simultaneous measurements by the two sensors extends to the whole ice-cloud layer. The effective radius of precipitating ice is consistently larger in the CPR-ATLID product than in the CPR-only, while the overall pattern of in-cloud vertical velocity is largely shared by the two products.
EC-CPR is a nadir-looking radar with its Doppler capability designed exclusively to measure vertical motion. It is nonetheless demonstrated in this work that diagnostic horizontal wind may be derived as well so that mass conservation is satisfied, with the caveat that this can be done only in composite space where the averaging operation statistically compensates the incomplete geometry of individual cloud samples. The velocity vector field manifests itself as a familiar mesoscale circulation constituted of a mid-tropospheric inflow toward the convective core below a height of 11–13 km and an upper-tropospheric outflow above. This result, although based on simplified assumptions to be refined in future work, underscores EarthCARE's technological utility for studying the dynamics of anvil clouds.
The current assumptions for the calculation of horizontal wind include idealized (axial or Cartesian) symmetry and zero vertical motion in the ambient air. The latter, in particular, is obviously oversimplified and to be improved in future work. The fundamental challenge is that existing satellite missions lack any instrument to observe vertical air motion outside clouds. As a notable exception, Poujol and Bony (2024) developed a novel methodology to derive mid-tropospheric clear-sky vertical velocity from temporal variations in geostationary vapor-channel brightness temperature. This product, once made available for the EarthCARE mission period, would offer a useful observational input as a realistic estimate of wa,a.
As a next step, the present analysis will be extended to include JAXA's EarthCARE radiation product (2B.ALL_RAD) as the ongoing reprocessing of this product is completed over an extended period back in time. The 2B.ALL_RAD product provides the vertical profiles of radiative flux that is physically consistent with the cloud properties from 2B.AC_CLP. A follow-up study being planned will shed light on the radiatively driven dynamics of anvil clouds based on a joint analysis of radiative heating and Doppler-derived circulation field.
Distinctly large values of wD were originally found at altitudes higher than 16 km in the composite IWP-height space (Fig. A1a). These anomalous values are associated with weak radar signals corresponding to small IWCs below 10−2 g m−3, giving rise to a “wing” outside the vertical histogram ridge where a vast majority of samples reside (Fig. A1c). The histogram ridge, confined to modest values of wD within ±1 m s−1, is likely attributed to TTL cirrus, whereas the wing is presumably second-trip echoes due to mirror images (see Sect. 2.3). A Doppler velocity of a few m s−1 is too large for TTL cirrus but instead may be reasonably interpreted as a mirror image arising from falling raindrops. The fact that this artifact avoids extremely large IWPs beyond 103 g m2 (Fig. A1a) suggests that these second-trip echoes are more likely mirror images than MS tails. Although the JAXA EarthCARE data processing attempts to isolate out mirror image echoes, a certain fraction of them apparently remain undetected.
In this work, any samples above 16 km in altitude are retained only when wD < 1 m s−1 and otherwise excluded from the analysis to remove the remaining mirror image echoes. Figure A1b shows the same plot as Fig. A1a but after the correction applied. The mirror images are largely, if not completely, removed from wD by the correction.
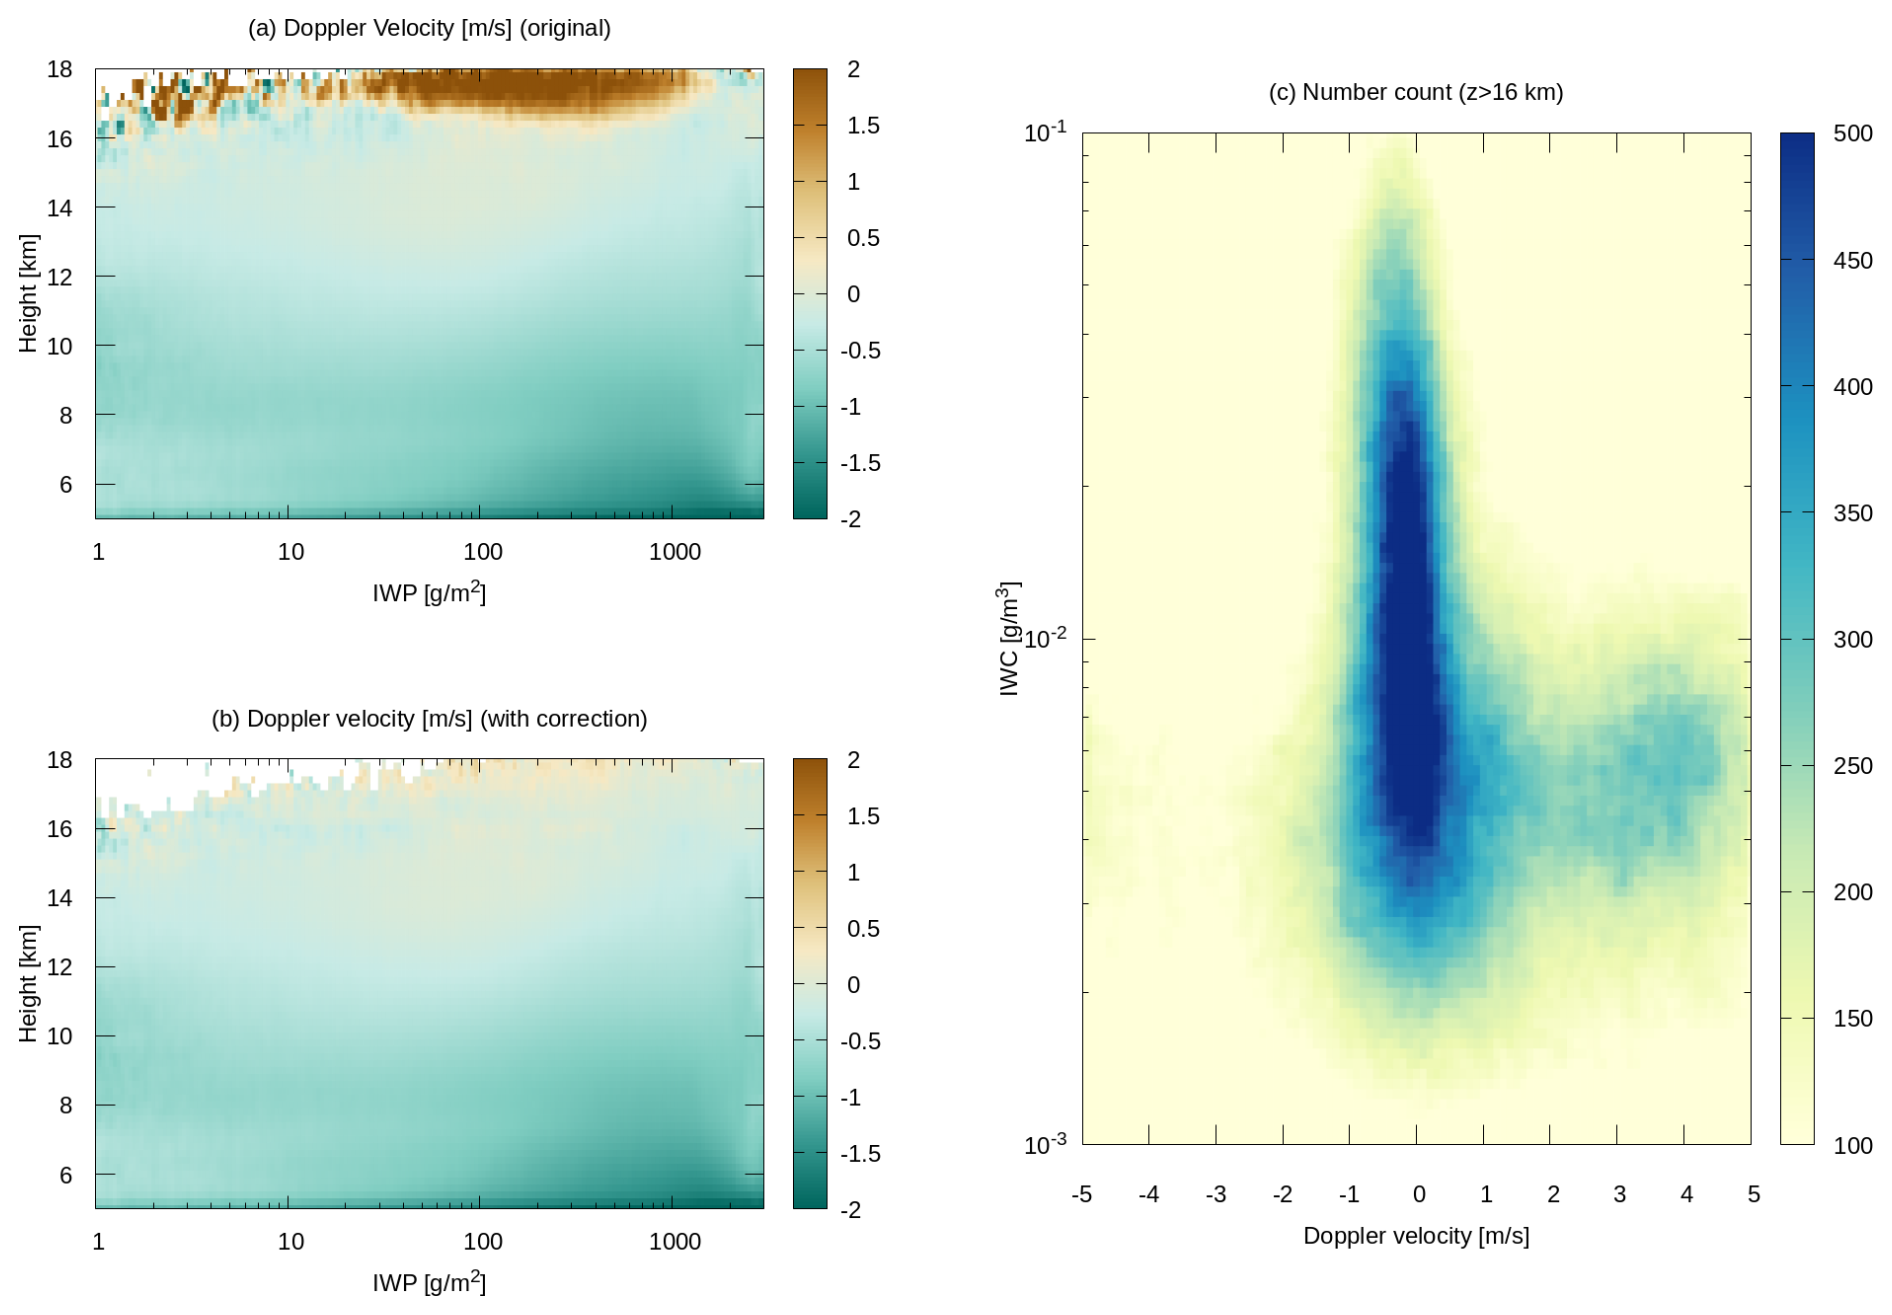
Figure A1(a) Uncorrected Doppler velocity composited in the IWP-altitude plane. (b) As (a) with mirror image echoes removed. (c) Two-dimensional histogram of the upper-tropospheric (z > 16 km) samples as a function of Doppler velocity and IWC.
The 2A.CPR_CLP (https://doi.org/10.57746/EO.01jdvd2gqq34e6yz9p8kfe68x5, JAXA, 2026a) and 2B.AC_CLP (https://doi.org/10.57746/EO.01jkwjeg2y0bqndnsvjvaaskaw, JAXA, 2026b) datasets are freely available through JAXA G-Portal (https://www.gportal.jaxa.jp/, last access: 1 November 2026).
The supplement related to this article is available online at https://doi.org/10.5194/acp-26-15593-2026-supplement.
The author has declared that there are no competing interests.
Publisher's note: Copernicus Publications remains neutral with regard to jurisdictional claims made in the text, published maps, institutional affiliations, or any other geographical representation in this paper. The authors bear the ultimate responsibility for providing appropriate place names. Views expressed in the text are those of the authors and do not necessarily reflect the views of the publisher.
This article is part of the special issue “Early results from EarthCARE (AMT/ACP/GMD inter-journal SI)”. It is not associated with a conference.
The efforts of the JAXA/ESA EarthCARE science teams for the successful mission operation and dataset production are greatly appreciated. The EarthCARE datasets analyzed in this work, 2A.CPR_CLP and 2B,AC_CLP, were provided by JAXA. The author thanks Shunsuke Aoki for his comments on EC-CPR second-trip echoes discussed in Appendix A and is deeply grateful to Adam Sokol and an anonymous reviewer for their insightful feedback.
This research has been supported by the Japan Society for the Promotion of Science (JSPS) Grants-in-Aid for Scientific Research (KAKENHI) (grant no. 25K07398).
This paper was edited by Raphaela Vogel and reviewed by Adam Sokol and one anonymous referee.
Ackerman, T. P., Liou, K.-N., Valero, F. P. J., and Pfister, L.: Heating Rates in Tropical Anvils, J. Atmos. Sci., 45, 1606–1623, https://doi.org/10.1175/1520-0469(1988)045<1606:HRITA>2.0.CO;2, 1988. a
Aoki, S., Kubota, T., Horie, H., and Ohno, Y.: Characteristics of multiple-trip echoes observed by EarthCARE Cloud Profiling Radar, EGUsphere [preprint], https://doi.org/10.5194/egusphere-2026-3256, 2026a. a, b
Aoki, S., Kubota, T., and Turk, F. J.: Exploring vertical motions in convective and stratiform precipitation using spaceborne radar observations: insights from EarthCARE and GPM coincidence dataset, Atmos. Meas. Tech., 19, 79–100, https://doi.org/10.5194/amt-19-79-2026, 2026b. a
Atlas, R. L., Bretherton, C. S., Sokol, A. B., Blossey, P. N., and Khairoutdinov, M. F.: Tropical Cirrus Are Highly Sensitive to Ice Microphysics Within a Nudged Global Storm-Resolving Model, Geophys. Res. Lett., 51, e2023GL105868, https://doi.org/10.1029/2023GL105868, 2024. a, b
Battaglia, A.: Impact of second-trip echoes for space-borne high-pulse-repetition-frequency nadir-looking W-band cloud radars, Atmos. Meas. Tech., 14, 7809–7820, https://doi.org/10.5194/amt-14-7809-2021, 2021. a
Battaglia, A. and Simmer, C.: How Does Multiple Scattering Affect the Spaceborne W-Band Radar Measurements at Ranges Close to and Crossing the Sea-Surface Range?, IEEE T. Geosci. Remote, 46, 1644–1651, https://doi.org/10.1109/TGRS.2008.916085, 2008. a
Bony, S., Stevens, B., Coppin, D., Becker, T., Reed, K. A., Voigt, A., and Medeiros, B.: Thermodynamic control of anvil cloud amount, P. Natl. Acad. Sci. USA, 113, 8927–8932, https://doi.org/10.1073/pnas.1601472113, 2016. a
Deng, M. and Mace, G. G.: Cirrus Microphysical Properties and Air Motion Statistics Using Cloud Radar Doppler Moments. Part I: Algorithm Description, J. Appl. Meteorol. Clim., 45, 1690–1709, https://doi.org/10.1175/JAM2433.1, 2006. a
Eisinger, M., Marnas, F., Wallace, K., Kubota, T., Tomiyama, N., Ohno, Y., Tanaka, T., Tomita, E., Wehr, T., and Bernaerts, D.: The EarthCARE mission: science data processing chain overview, Atmos. Meas. Tech., 17, 839–862, https://doi.org/10.5194/amt-17-839-2024, 2024. a
Fueglistaler, S., Dessler, A. E., Dunkerton, T. J., Folkins, I., Fu, Q., and Mote, P. W.: Tropical tropopause layer, Rev. Geophys., 47, RG1004, https://doi.org/10.1029/2008RG000267, 2009. a
Galfione, A., Battaglia, A., Puigdomènech Treserras, B., and Kollias, P.: First insights into deep convection by the Doppler velocity measurements of the EarthCARE Cloud Profiling Radar, Atmos. Meas. Tech., 18, 6747–6763, https://doi.org/10.5194/amt-18-6747-2025, 2025. a, b
Garrett, T. J., Navarro, B. C., Twohy, C. H., Jensen, E. J., Baumgardner, D. G., Bui, P. T., Gerber, H., Herman, R. L., Heymsfield, A. J., Lawson, P., Minnis, P., Nguyen, L., Poellot, M., Pope, S. K., Valero, F. P. J., and Weinstock, E. M.: Evolution of a Florida Cirrus Anvil, J. Atmos. Sci., 62, 2352–2372, https://doi.org/10.1175/JAS3495.1, 2005. a
Gasparini, B., Blossey, P. N., Hartmann, D. L., Lin, G., and Fan, J.: What Drives the Life Cycle of Tropical Anvil Clouds?, J. Adv. Model. Earth Sy., 11, 2586–2605, https://doi.org/10.1029/2019MS001736, 2019. a, b, c, d
Gasparini, B., Sokol, A. B., Wall, C. J., Hartmann, D. L., and Blossey, P. N.: Diurnal Differences in Tropical Maritime Anvil Cloud Evolution, J. Climate, 35, 1655–1677, https://doi.org/10.1175/JCLI-D-21-0211.1, 2022. a
Gasparini, B., Sullivan, S. C., Sokol, A. B., Kärcher, B., Jensen, E., and Hartmann, D. L.: Opinion: Tropical cirrus – from micro-scale processes to climate-scale impacts, Atmos. Chem. Phys., 23, 15413–15444, https://doi.org/10.5194/acp-23-15413-2023, 2023. a
Hagihara, Y., Ohno, Y., Horie, H., Roh, W., Satoh, M., and Kubota, T.: Global evaluation of Doppler velocity errors of EarthCARE cloud-profiling radar using a global storm-resolving simulation, Atmos. Meas. Tech., 16, 3211–3219, https://doi.org/10.5194/amt-16-3211-2023, 2023. a, b
Hartmann, D. L. and Larson, K.: An important constraint on tropical cloud-climate feedback, Geophys. Res. Lett., 29, https://doi.org/10.1029/2002GL015835, 2002. a
Hartmann, D. L., Gasparini, B., Berry, S. E., and Blossey, P. N.: The Life Cycle and Net Radiative Effect of Tropical Anvil Clouds, J. Adv. Model. Earth Sy., 10, 3012–3029, https://doi.org/10.1029/2018MS001484, 2018. a
Heymsfield, G. M., Tian, L., Heymsfield, A. J., Li, L., and Guimond, S.: Characteristics of Deep Tropical and Subtropical Convection from Nadir-Viewing High-Altitude Airborne Doppler Radar, J. Atmos. Sci., 67, 285–308, 2010. a
Horner, G. and Gryspeerdt, E.: The evolution of deep convective systems and their associated cirrus outflows, Atmos. Chem. Phys., 23, 14239–14253, https://doi.org/10.5194/acp-23-14239-2023, 2023. a, b
Hotta, H., Suzuki, K., Kikuchi, M., Aoki, S., and Kubota, T.: Characteristics of tropical clouds with strong updrafts revealed by Doppler-velocity measurements from EarthCARE/CPR, Atmos. Chem. Phys., 26, 11605–11626, https://doi.org/10.5194/acp-26-11605-2026, 2026. a
Igel, M. R., Drager, A. J., and van den Heever, S. C.: A CloudSat cloud object partitioning technique and assessment and integration of deep convective anvil sensitivities to sea surface temperature, J. Geophys. Res., 119, 10515–10535, https://doi.org/10.1002/2014JD021717, 2014. a
Illingworth, A. J., Barker, H. W., Beljaars, A., Ceccaldi, M., Chepfer, H., Clerbaux, N., Cole, J., Delanoë, J., Domenech, C., Donovan, D. P., Fukuda, S., Hirakata, M., Hogan, R. J., Huenerbein, A., Kollias, P., Kubota, T., Nakajima, T., Nakajima, T. Y., Nishizawa, T., Ohno, Y., Okamoto, H., Oki, R., Sato, K., Satoh, M., Shephard, M. W., Velázzquez-Blázquez, A., Wandinger, U., Wehr, T., and van Zadelhoff, G.-J.: The EarthCARE Satellite: The Next Step Forward in Global Measurements of Clouds, Aerosols, Precipitation, and Radiation, B. Am. Meteorol. Soc., 96, 1311–1332, https://doi.org/10.1175/BAMS-D-12-00227.1, 2015. a, b
Imura, Y., Aoki, S., Kubota, T., Nakatsuka, H., Ohno, Y., and Okamoto, H.: Observation modes of EarthCARE/CPR with different Doppler measurement accuracy: evaluation of their applicability, Atmos. Meas. Tech., 19, 5617–5631, https://doi.org/10.5194/amt-19-5617-2026, 2026. a, b
Ito, M. and Masunaga, H.: Process-Level Assessment of the Iris Effect Over Tropical Oceans, Geophys. Res. Lett., 49, e2022GL097997, https://doi.org/10.1029/2022GL097997, 2022. a
JAXA: EarthCARE/CPR L2A CPR one-sensor Cloud Products, JAXA [data set], https://doi.org/10.57746/EO.01jdvd2gqq34e6yz9p8kfe68x5, 2026a. a
JAXA: EarthCARE L2B CPR-ATLID Synergy Cloud Products, JAXA [data set], https://doi.org/10.57746/EO.01jkwjeg2y0bqndnsvjvaaskaw, 2026b. a
Jensen, E. J., Toon, O. B., Pfister, L., and Selkirk, H. B.: Dehydration of the upper troposphere and lower stratosphere by subvisible cirrus clouds near the tropical tropopause, Geophys. Res. Lett., 23, 825–828, https://doi.org/10.1029/96GL00722, 1996. a, b
Kärcher, B. and Spichtinger, P.: Cloud-controlling Factors of Cirrus, in: Clouds in the Perturbed Climate System: Their Relationship to Energy Balance, Atmospheric Dynamics, and Precipitation, edited by: Heintzenberg, J. and Charlson, R. J., The MIT Press, https://doi.org/10.7551/mitpress/9780262012874.003.0011, 2009. a
Kingsmill, D. E. and Houze Jr., R. A.: Kinematic characteristics of air flowing into and out of precipitating convection over the west Pacific warm pool: An airborne Doppler radar survey, Q. J. Roy. Meteor. Soc., 125, 1165–1207, https://doi.org/10.1002/qj.1999.49712555605, 1999. a
Kollias, P., Puidgomènech Treserras, B., Battaglia, A., Borque, P. C., and Tatarevic, A.: Processing reflectivity and Doppler velocity from EarthCARE's cloud-profiling radar: the C-FMR, C-CD and C-APC products, Atmos. Meas. Tech., 16, 1901–1914, https://doi.org/10.5194/amt-16-1901-2023, 2023. a
Kubota, T., Kikuchi, M., Muto, M., Hashimoto, M., Imura, Y., Maruyama, K., Hoffmann, A., Hummel, T., Koopman, R., Malina, E., Rusli, S., Tzallas, V., von Bismarck, J., and Frommknecht, B.: Summary of the EarthCARE science and validation workshop 2025 -Early achievements and future perspectives for the Earth Cloud Aerosol and Radiation Explorer (EarthCARE) satellite mission-, Journal of the European Meteorological Society, 4, 100037, https://doi.org/10.1016/j.jemets.2026.100037, 2026. a
Lilly, D. K.: Cirrus Outflow Dynamics, J. Atmos. Sci., 45, 1594–1605, https://doi.org/10.1175/1520-0469(1988)045<1594:COD>2.0.CO;2, 1988. a
Luo, Z. and Rossow, W. B.: Characterizing tropical cirrus life cycle, evolution, and interaction with upper-tropospheric water vapor using Lagrangian trajectory analysis of satellite observations, J. Climate, 17, 4541–4563, 2004. a
Mace, G. G., Heymsfield, A. J., and Poellot, M. R.: On retrieving the microphysical properties of cirrus clouds using the moments of the millimeter-wavelength Doppler spectrum, J. Geophys. Res., 107, AAC 22-1–AAC 22-26, https://doi.org/10.1029/2001JD001308, 2002. a
Massie, S., Gettelman, A., Randel, W., and Baumgardner, D.: Distribution of tropical cirrus in relation to convection, J. Geophys. Res., 107, AAC 19-1–AAC 19-16, https://doi.org/10.1029/2001JD001293, 2002. a
Masunaga, H.: The Edge Intensification of Eastern Pacific ITCZ Convection, J. Climate, 36, 3469–3480, https://doi.org/10.1175/JCLI-D-22-0382.1, 2023. a
Masunaga, H. and Bony, S.: Radiative invigoration of tropical convection by preceding cirrus clouds, J. Atmos. Sci., 75, 1327–1342, https://doi.org/10.1002/2016MS000855, 2018. a
Moncrieff, M. W.: Organized Convective Systems: Archetypal Dynamical Models, Mass and Momentum Flux Theory, and Parametrization, Q. J. Roy. Meteor. Soc., 118, 819–850, https://doi.org/10.1002/qj.49711850703, 1992. a
Muhlbauer, A., Kalesse, H., and Kollias, P.: Vertical velocities and turbulence in midlatitude anvil cirrus: A comparison between in situ aircraft measurements and ground-based Doppler cloud radar retrievals, Geophys. Res. Lett., 41, 7814–7821, https://doi.org/10.1002/2014GL062279, 2014. a
Nakajima, T., Kikuchi, M., Ohno, Y., Horie, H., Okamoto, T., Nishizawa, T., Nakajima, T. Y., Suzuki, K., Satoh, M., and Kubota, T.: EarthCARE JAXA Level 2 Algorithm Theoretical Basis Document (L2 ATBD), JAXA, NDX-110018, https://www.eorc.jaxa.jp/EARTHCARE/document/reference/dev/EarthCARE_L2_ATBD.pdf (last access: 1 November 2026), 2026. a, b
Ohno, T. and Satoh, M.: Roles of Cloud Microphysics on Cloud Responses to Sea Surface Temperatures in Radiative-Convective Equilibrium Experiments Using a High-Resolution Global Nonhydrostatic Model, J. Adv. Model. Earth Sy., 10, 1970–1989, https://doi.org/10.1029/2018MS001386, 2018. a, b
Ohno, T., Noda, A. T., Seiki, T., and Satoh, M.: Importance of Pressure Changes in High Cloud Area Feedback Due to Global Warming, Geophys. Res. Lett., 48, e2021GL093646, https://doi.org/10.1029/2021GL093646, 2021. a
Okamoto, H., Iwasaki, S., Yasui, M., Horie, H., Kuroiwa, H., and Kumagai, H.: An algorithm for retrieval of cloud microphysics using 95-GHz cloud radar and lidar, J. Geophys. Res., 108, https://doi.org/10.1029/2001JD001225, 2003. a
Orr, B. W. and Kropfli, R. A.: A Method for Estimating Particle Fall Velocities from Vertically Pointing Doppler Radar, J. Atmos. Ocean. Tech., 16, 29–37, https://doi.org/10.1175/1520-0426(1999)016<0029:AMFEPF>2.0.CO;2, 1999. a
Poujol, B. and Bony, S.: Measuring Clear-Air Vertical Motions From Space, AGU Adv., 5, e2024AV001267, https://doi.org/10.1029/2024AV001267, 2024. a, b
Protat, A. and Williams, C. R.: The Accuracy of Radar Estimates of Ice Terminal Fall Speed from Vertically Pointing Doppler Radar Measurements, J. Appl. Meteorol. Clim., 50, 2120–2138, https://doi.org/10.1175/JAMC-D-10-05031.1, 2011. a
Protopapadaki, S. E., Stubenrauch, C. J., and Feofilov, A. G.: Upper tropospheric cloud systems derived from IR sounders: properties of cirrus anvils in the tropics, Atmos. Chem. Phys., 17, 3845–3859, https://doi.org/10.5194/acp-17-3845-2017, 2017. a
Puigdomènech Treserras, B., Kollias, P., Battaglia, A., Tanelli, S., and Nakatsuka, H.: EarthCARE's cloud profiling radar antenna pointing correction using surface Doppler measurements, Atmos. Meas. Tech., 18, 5607–5618, https://doi.org/10.5194/amt-18-5607-2025, 2025. a
Roh, W., Satoh, M., Matsugishi, S., Aoki, S., Kubota, T., and Okamoto, H.: Vertical motions in clouds from EarthCare satellite and a global storm-resolving modeling, Sci. Rep., 16, 2622, https://doi.org/10.1038/s41598-025-32256-8, 2025. a
Sato, K. and Okamoto, H.: Refinement of global ice microphysics using spaceborne active sensors, J. Geophys. Res., 116, https://doi.org/10.1029/2011JD015885, 2011. a
Sato, K., Okamoto, H., Yamamoto, M. K., Fukao, S., Kumagai, H., Ohno, Y., Horie, H., and Abo, M.: 95-GHz Doppler radar and lidar synergy for simultaneous ice microphysics and in-cloud vertical air motion retrieval, J. Geophys. Res., 114, D03203, https://doi.org/10.1029/2008JD010222, 2009. a, b, c
Sato, K., Okamoto, H., Nishizawa, T., Jin, Y., Nakajima, T. Y., Wang, M., Satoh, M., Roh, W., Ishimoto, H., and Kudo, R.: JAXA Level 2 cloud and precipitation microphysics retrievals based on EarthCARE radar, lidar, and imager: the CPR_CLP, AC_CLP, and ACM_CLP products, Atmos. Meas. Tech., 18, 1325–1338, https://doi.org/10.5194/amt-18-1325-2025, 2025. a, b, c
Seeley, J. T., Jeevanjee, N., Langhans, W., and Romps, D. M.: Formation of Tropical Anvil Clouds by Slow Evaporation, Geophys. Res. Lett., 46, 492–501, https://doi.org/10.1029/2018GL080747, 2019. a
Seiki, T., Horie, H., Hagihara, Y., Aoki, S., and Noda, A. T.: Global identification of dominant ice-particle growth in cirrus clouds using EarthCARE satellite observations, EGUsphere [preprint], https://doi.org/10.5194/egusphere-2025-4819, 2025. a
Sherwood, S. C.: On moistening of the tropical troposphere by cirrus clouds, J. Geophys. Res., 104, 11949–11960, https://doi.org/10.1029/1999JD900162, 1999. a
Sokol, A. B. and Hartmann, D. L.: Tropical Anvil Clouds: Radiative Driving Toward a Preferred State, J. Geophys. Res., 125, e2020JD033107, https://doi.org/10.1029/2020JD033107, 2020. a, b, c, d, e
Stephens, G., Winker, D., Pelon, J., Trepte, C., Vane, D., Yuhas, C., L'Ecuyer, T., and Lebsock, M.: CloudSat and CALIPSO within the A-Train: Ten Years of Actively Observing the Earth System, B. Am. Meteorol. Soc., 99, 569–581, https://doi.org/10.1175/BAMS-D-16-0324.1, 2018. a
Stubenrauch, C. J., Kinne, S., Mandorli, G., Rossow, W. B., Winker, D. M., Ackerman, S. A., Chepfer, H., Di Girolamo, L., Garnier, A., Heidinger, A., Karlsson, K.-G., Meyer, K., Minnis, P., Platnick, S., Stengel, M., Sun-Mack, S., Veglio, P., Walther, A., Cai, X., Young, A. H., and Zhao, G.: Lessons Learned from the Updated GEWEX Cloud Assessment Database, Surv. Geophys., 45, 1999–2048, https://doi.org/10.1007/s10712-024-09824-0, 2024. a
Takahashi, H., Luo, Z. J., Stephens, G., and Mulholland, J. P.: Revisiting the Land-Ocean Contrasts in Deep Convective Cloud Intensity Using Global Satellite Observations, Geophys. Res. Lett., 50, e2022GL102089, https://doi.org/10.1029/2022GL102089, 2023. a
Wall, C. J., Norris, J. R., Gasparini, B., Smith, W. L., Thieman, M. M., and Sourdeval, O.: Observational Evidence that Radiative Heating Modifies the Life Cycle of Tropical Anvil Clouds, J. Climate, 33, 8621–8640, https://doi.org/10.1175/JCLI-D-20-0204.1, 2020. a, b
Wehr, T., Kubota, T., Tzeremes, G., Wallace, K., Nakatsuka, H., Ohno, Y., Koopman, R., Rusli, S., Kikuchi, M., Eisinger, M., Tanaka, T., Taga, M., Deghaye, P., Tomita, E., and Bernaerts, D.: The EarthCARE mission – science and system overview, Atmos. Meas. Tech., 16, 3581–3608, https://doi.org/10.5194/amt-16-3581-2023, 2023. a