
the Creative Commons Attribution 4.0 License.
the Creative Commons Attribution 4.0 License.
 | 04 Nov 2026
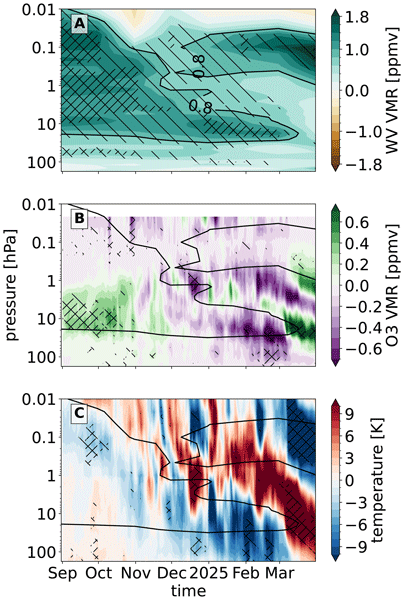
Evidence for Hunga-Tonga eruption influence on the anomalously strong Northern-Hemisphere stratospheric polar vortex in 2024/2025

Matthias Stocker
Alistair Bell
Bruno Lehner
Jessica Kult-Herdin
Gabriel Chiodo
Timofei Sukhodolov
Eugene Rozanov
Gunter Stober
Harald E. Rieder
The 2022 Hunga Tonga (HT) eruption injected an unprecedented amount of water vapour (WV) into the stratosphere and mesosphere, emerging as a potential multi-year driver of variability in those layers and associated climate feedbacks. Using satellite and reanalysis datasets, and ensemble simulations with the SOCOLv4 model, with and without the HT forcing, we diagnose the chain of processes linking the eruption to the exceptionally strong Northern Hemisphere stratospheric polar vortex (SPV) observed in winter 2024/2025. Satellite data show “tongues” of enhanced WV descending from the mesosphere into the polar stratosphere, collocated with ozone reductions and persistent cold anomalies, alongside a record-strong SPV. Our model with the HT forcing can reproduce the main structure of the descending plume, its effects on chemistry, and the SPV strengthening, albeit with underestimated magnitudes and an earlier onset than observed. Offline radiative transfer calculations indicate that the WV and ozone anomalies drive net radiative cooling over the polar stratosphere, which steepens meridional temperature gradients and thereby intensifies the Arctic polar vortex. The observed 2024/2025 winter thus represents a plausible manifestation of HT-induced vortex variability. Our simulations also predicted the observed shift towards more favorable conditions for sudden stratospheric warmings in the winter 2025/2026 as the WV forcing declines.
- Article
(19853 KB) - Full-text XML
-
Supplement
(26745 KB) - BibTeX
- EndNote


The 2022 Hunga Tonga (HT) eruption was unprecedented in terms of (i) injection altitude up to 57 km (Proud et al., 2022), (ii) the observational coverage of a direct water vapor (WV) injection of this magnitude (Vömel et al., 2022), and (iii) the radiatively-driven plume descent shortly after the eruption due to the highly localized moist volcanic cloud (Kroll and Schmidt, 2024). Many studies have been dedicated to the impacts of the HT eruption, including changes in stratospheric and mesospheric composition (Evan et al., 2023), radiation (Stocker et al., 2024; Randel et al., 2024b), and direct (Jenkins et al., 2023; Schoeberl et al., 2023; Stenchikov et al., 2025) and indirect (Bednarz et al., 2026; Kuchar et al., 2025) climate impacts.
The WV inputs of HT were distributed throughout the stratosphere, and even to the mesosphere of the Southern Hemisphere subtropics in the days/weeks following the eruption (APARC, 2025). Randel et al. (2024a) documented positive residuals of WV over high latitudes in both hemispheres in late 2023, tied to the downward transport of WV from the HT eruption. Modelling (Fleming et al., 2024; Zhou et al., 2024; Kuchar et al., 2025; Zhuo et al., 2025) and observational (Millán et al., 2022; Schoeberl et al., 2025) studies suggest that the anomalous WV induced by the HT eruption in 2022 should diminish within 5–7 years. The Antarctic dehydration likely remains the dominant WV removal pathway (Zhou et al., 2024), together with transport of stratospheric air to the troposphere at mid-high latitudes by the Brewer-Dobson circulation (BDC). Therefore, we expect that BDC is responsible for the downward transport of WV over middle and high latitudes during the wintertime, in analogy to the downward transport of NOx, produced by energetic particle precipitation, inside the polar vortex (e.g. Funke et al., 2014).
Kuchar et al. (2025) explored a novel pathway by which water-rich volcanic eruptions, such as HT may modulate stratospheric and mesospheric conditions and influence regional surface climate. Their targeted model simulations illustrated that the excess WV can reduce meridional temperature gradients near the stratopause, leading to a negative Northern Annular Mode anomaly that propagates to the surface in late winter. Several features discussed in Kuchar et al. (2025) were reproduced by an independent atmosphere-only simulation using the NCAR model (Bednarz et al., 2026, and accompanying discussion), including mesospheric cooling at lower latitudes, which, via the thermal wind relation, has the potential to weaken the polar-night jet. Taken together, these studies suggest that HT may have provided favorable conditions for Sudden Stratospheric Warmings (SSWs) observed in NH winters following the HT eruption (Lee et al., 2025).
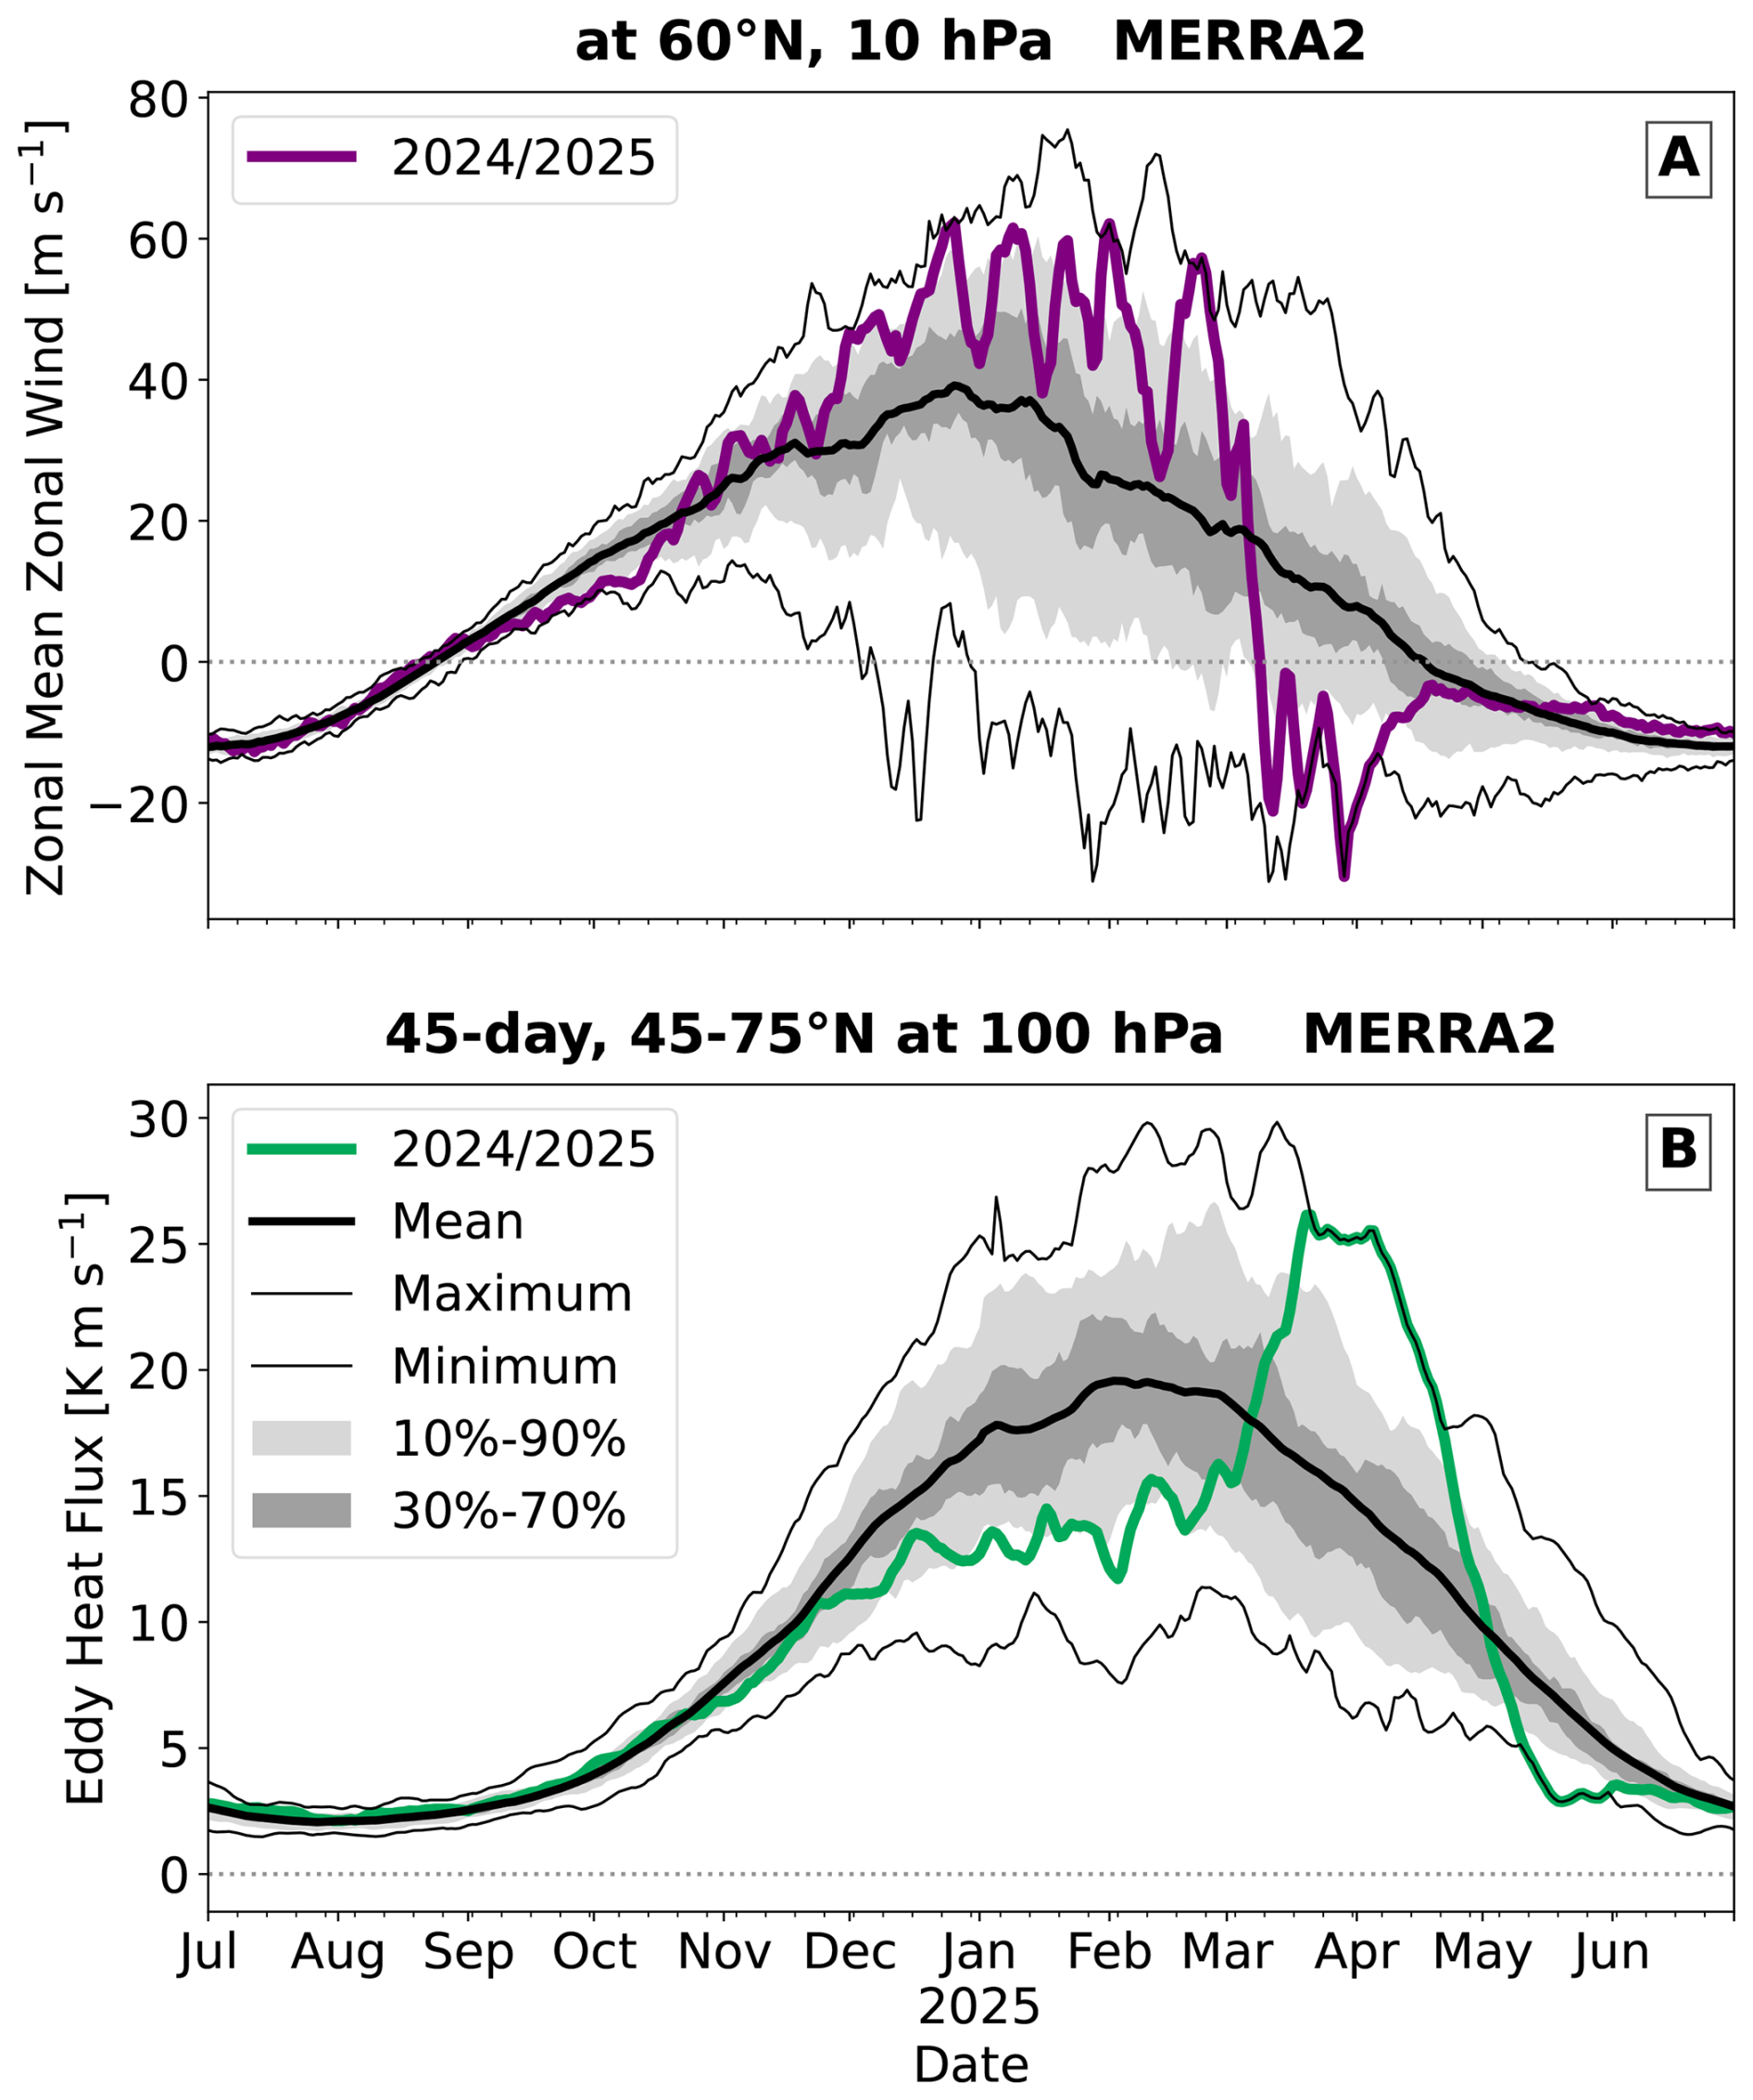
Figure 1(A) The average (east-west) zonal wind for 60° N at 10 hPa for the extended winter 2024/2025 (OW3) in MERRA2. This is near the peak of the polar jet maximum. (B) The eddy heat flux (EHF) averaged between 45 and 75° N at 100 hPa for the 45 d before the date indicated.
Various atmospheric (and surface) signals have also been linked to a stratospheric WV increase. Joshi et al. (2006) showed a strengthening of the stratospheric jet in boreal winter associated with the cooler lower stratospheric midlatitudes (increase of meridional temperature gradient) in response to an increased stratospheric WV. Maycock et al. (2013) and Seabrook et al. (2023) reported a similar circulation response. This feature was indeed observed in the winter 2024/2025 when the stratospheric polar vortex was anomalously strong, reaching the climatological maximum (∼ 61.19 m s−1) on 24 December 2024 (see Fig. 1A and Sect. 2.1.1). There were only a few recent winters with a similarly strong and stable polar vortex in the Northern Hemisphere, i.e. 2010/2011, 2015/2016, and 2019/2020 (Manney et al., 2011; Matthias et al., 2016; Lawrence et al., 2020; Rieder et al., 2025).
Motivated by the diverse findings of HT impacts summarized in the recent dedicated report (APARC, 2025), the aim of this study is to document the portfolio of pathways by which the HT eruption may have modulated stratospheric and mesospheric conditions and consequently impacted the surface climate. Specifically, we aim here to answer the following questions: (i) How does the long-term response of the stratospheric polar vortex (SPV) to atmospheric composition changes following the HT eruption differ from the short-term response? (ii) Did atmospheric composition changes precondition SPV states, particularly the strong SPV observed in 2024/2025? and (iii) if so, what predictive power can be derived from comprehensive chemistry-climate model (CCM) simulations for SPV states in the coming years?
To this end, we provide a combined observational and modelling assessment of the 2024/2025 event and its linkages to the lingering Hunga-induced moist plume. We use a reanalysis dataset and observations from MLS and SWOOSH (Sect. 2.1), together with large-ensemble SOCOLv4 simulations with and without the HT forcing (Sect. 3.1), to investigate the sensitivity of the circulation to excess WV from HT and assess the chain of processes leading to SPV strengthening (Sect. 4).
2.1 Observational datasets
2.1.1 MERRA2
Here we analyze a widely used reanalysis data set, the National Aeronautics and Space Administration (NASA) Modern Era Retrospective Analysis for Research and Applications Version 2 (MERRA2, resolution 0.625°×0.5°, model top at 0.01 hPa; Gelaro et al., 2017). We extract zonal wind (ZW) for 60° N at 10 hPa and eddy heat flux (EHF) between 45 and 75° N at 100 hPa postprocessed by the NASA Ozone Watch (Kramarova and Lait, 2025) for the extended winter 2024/2025.
2.1.2 MLS
The Microwave Limb Sounder (MLS; Waters et al., 2006) instrument onboard NASA's Aura Satellite has been operational since 2004 and provides near-global (82° S–82° N) measurements of key atmospheric constituents and temperature based on thermal microwave emissions along the Earth's limb. The MLS provides about 3500 vertical profiles per day for each species. The profiles have a vertical resolution of approximately 3 to 5 km in the stratosphere and 6 to 8 km in the mesosphere. In this study, we use Version 6 of the retrieval products for water vapor, ozone, and temperature (Livesey et al., 2026).
Since May 2024, the 190 GHz subsystem in MLS, which is responsible for observing water vapor, N2O, HCN, and upper stratospheric HNO3, has been operating on a duty cycle to extend the instrument's lifetime (see https://mls.jpl.nasa.gov/, last access: 22 October 2026). The measurements are reactivated for about six days in the middle of each calendar month. Other MLS channels, including those used for ozone and temperature, remain unaffected.
2.1.3 SWOOSH
The Stratospheric Water and Ozone Satellite Homogenized (SWOOSH) version 2.72 dataset provides zonally averaged monthly profiles for water vapor and ozone. SWOOSH combines measurements from several satellite sensors, including the Stratospheric Aerosol and Gas Experiment (SAGE II & III), the Upper Atmosphere Research Satellite Halogen Occultation Experiment (UARS HALOE), UARS MLS, and Aura MLS version 5.0. The retrieval artifact in the 10–8 hPa layer apparent in SWOOSH (see Fig. 2 and Niemeier et al., 2023; Millán et al., 2024) has been corrected in the MLS data version 6 we use in this study. To account for measurement offsets and biases, the data records were homogenized using “reference” satellites during times in which observations of different satellite systems overlapped. The satellite that showed the best agreement with balloon-based measurements was chosen as a reference (Davis et al., 2016b).
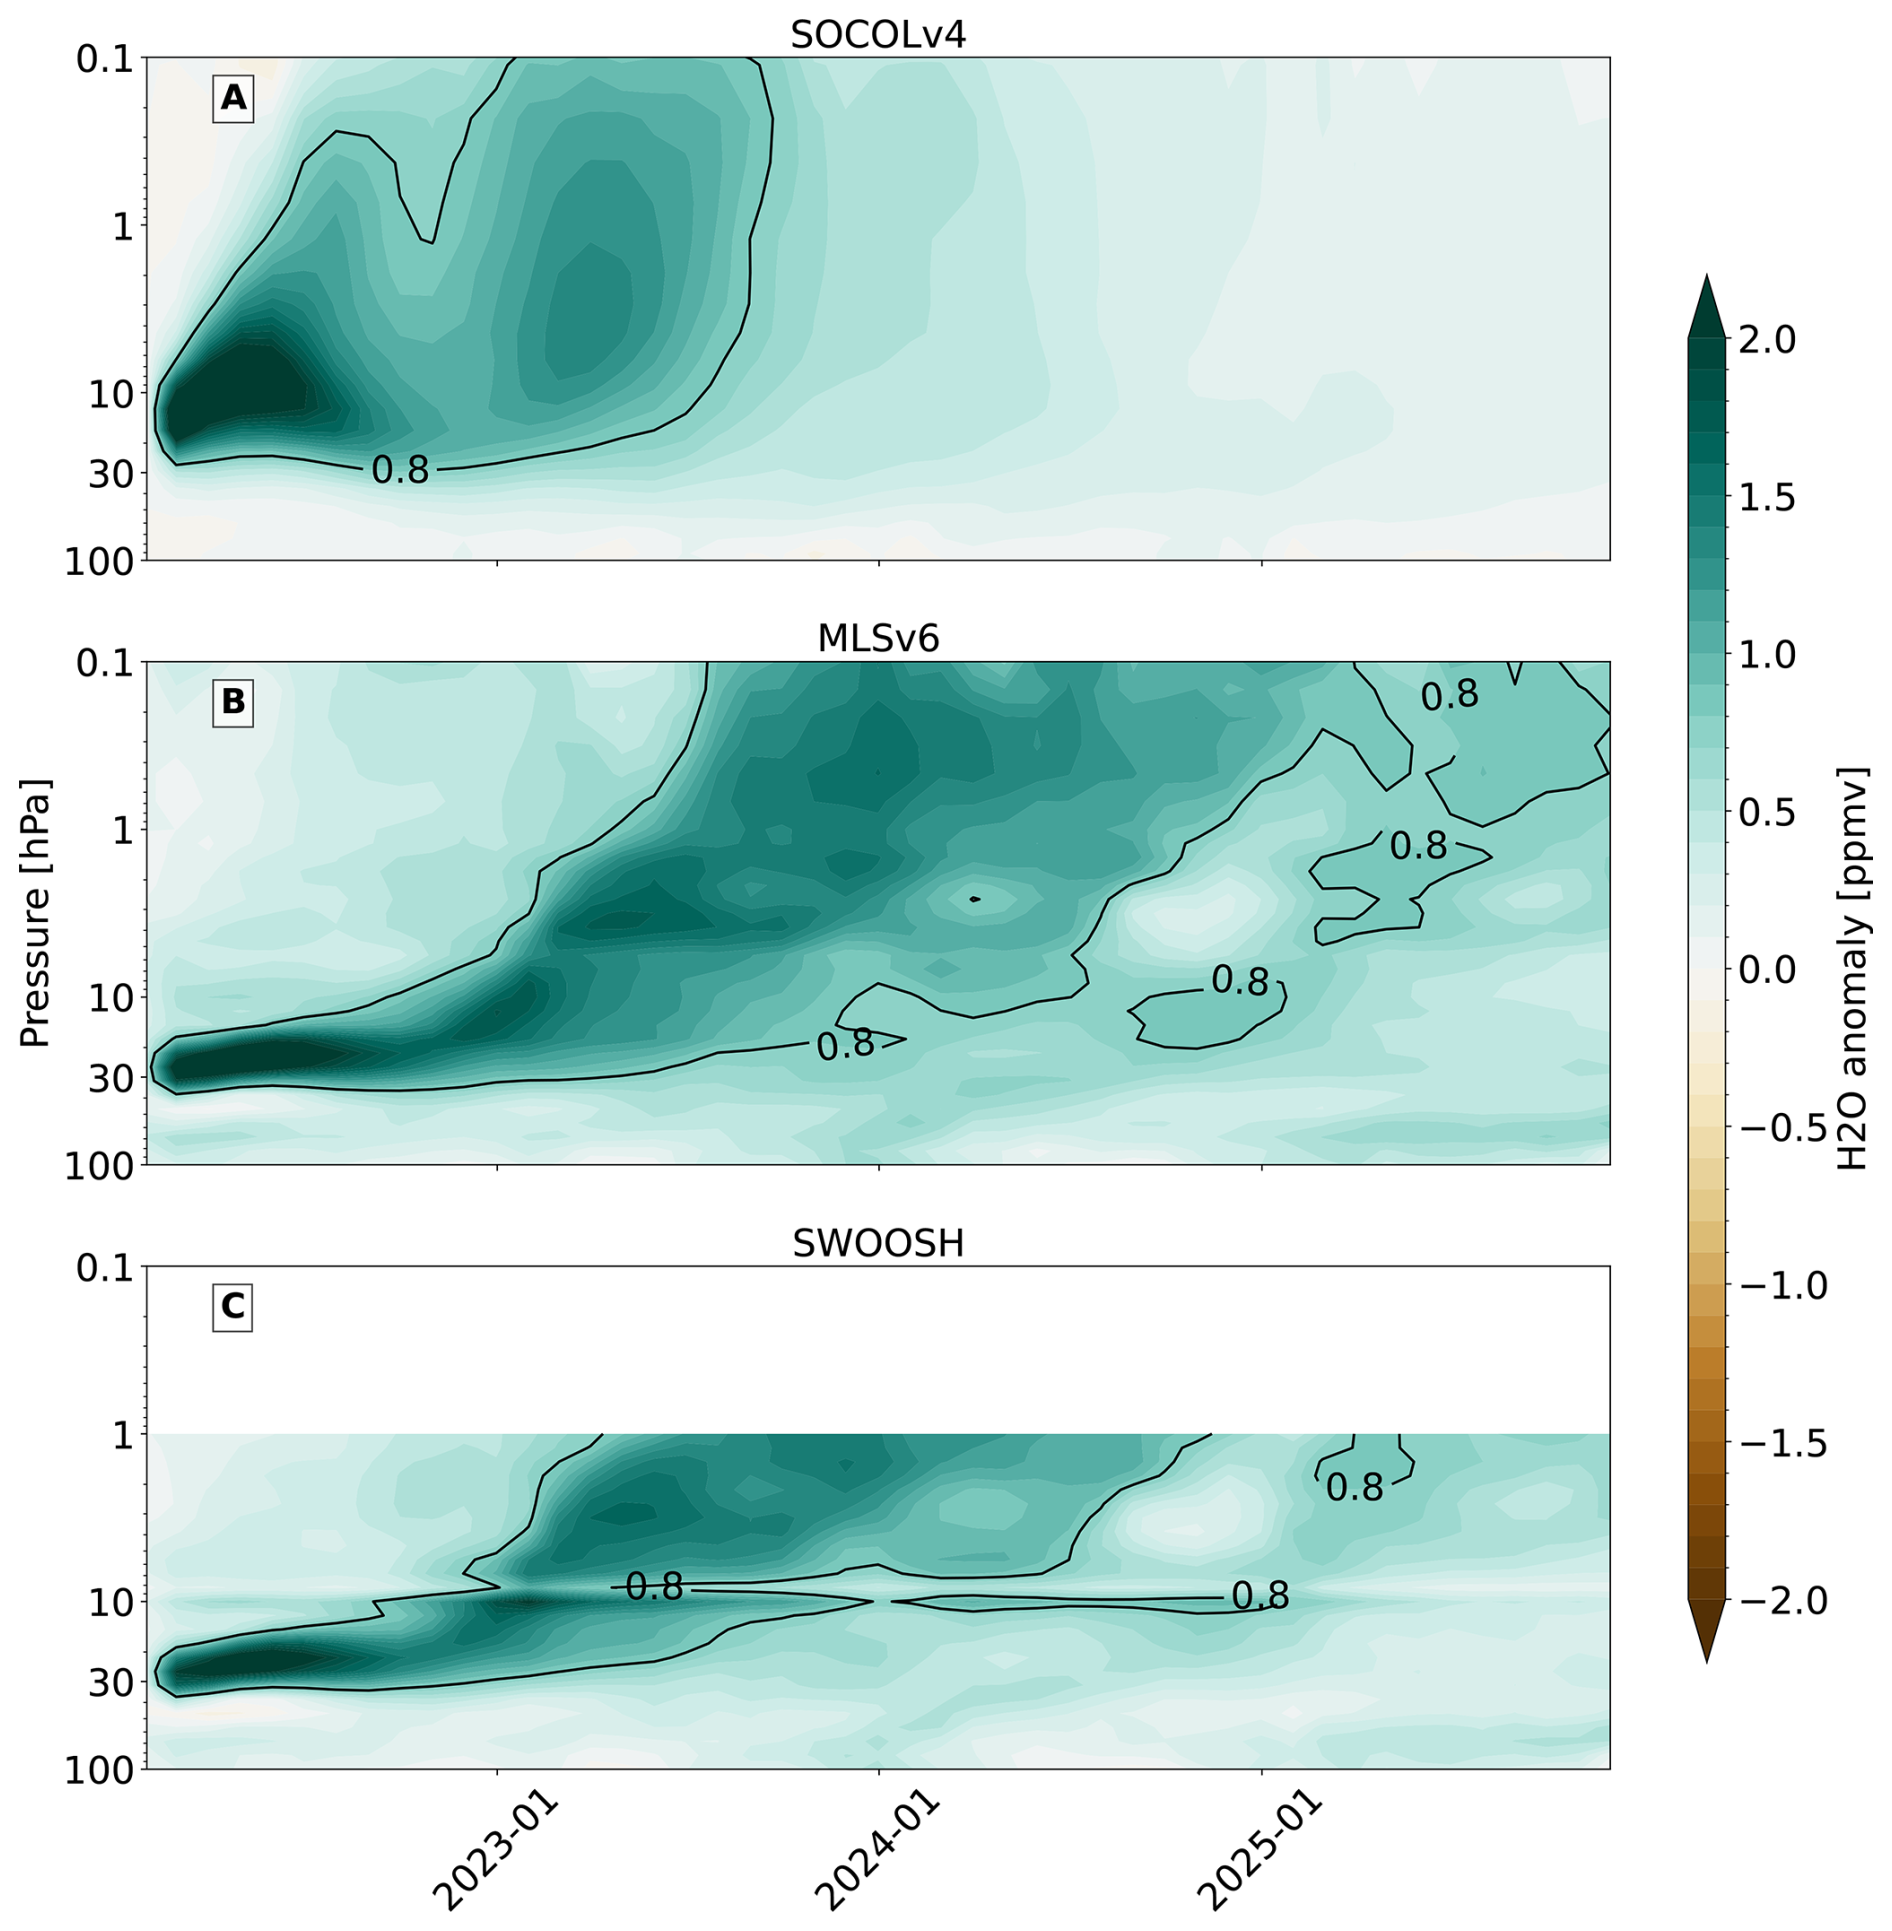
Figure 2Globally averaged water vapour (WV) anomalies (shading and labeled contours for 0.8 ppmv) in SOCOLv4 (A), MLSv6 (B) and SWOOSH (C) for the period 202201–202511. The 10–8 hPa artifact (Millán et al., 2024) in WV remains apparent in SWOOSH, as it contains data from MLSv5. 0 (Davis et al., 2016a).
3.1 SOCOLv4 simulations
Our set of SOCOLv4 (Sukhodolov et al., 2021) simulations comprises an ensemble of transient simulations with and without the HT forcing, i.e. 150 Tg of WV and 0.5 Tg of SO2 have been distributed over the emission region (22–14° S, 182–186° E and 25–30 km) within 15 January similarly to the community recommendation (Zhu et al., 2025). We perform a 5-year spin-up before the HT eruption. Both ensembles comprise 10 ensemble members. We stress that the Quasi-Biennial Oscillation (QBO) is nudged in both simulations with and without the HT forcing. We use equatorial zonal wind at 10 hPa as a proxy for Quasi-biennial Oscillation (QBO) to demonstrate a link between QBO and the polar vortex in SOCOLv4, i.e. the so-called Holton-Tan mechanism (Holton and Tan, 1980). For a detailed description of our SOCOLv4 simulations, we refer to Appendix A1 in Kuchar et al. (2025).
As indicated in Kuchar et al. (2025), the anomalous WV following HT decays and propagates vertically too rapidly in SOCOLv4 compared with MLS/SWOOSH (cf. globally averaged WV anomaly in SOCOLv4, MLSv6 and SWOOSH in Fig. 2) or some of the other models (Randel et al., 2024b). Note that the contour at 0.5 ppmv does not reach the year 2024 in SOCOLv4, unlike in SWOOSH. This limitation is well documented for the SOCOL model family: SOCOLv4 retains, as in previous SOCOL versions, a too-fast residual circulation and excessive mixing in the surf zone, and its tropical water-vapour tape-recorder signal propagates upward too rapidly (Stenke et al., 2013; Arsenovic et al., 2019; Sukhodolov et al., 2021). Related stratospheric transport biases are also common in many CCMs, as indicated by too-young age of air (AoA) and overly rapid tropical ascent in CCM intercomparisons (Dietmüller et al., 2018; Abalos et al., 2026), although their magnitude and vertical/latitudinal structure vary across models.
Overall, SOCOLv4 is adequate for broad NOx/HOx/ClOx driven ozone depletion/recovery studies (Sukhodolov et al., 2021). The main remaining weaknesses are transport and mixing, and photolysis at large solar zenith angles over the high latitudes of the Southern Hemisphere (e.g. Imanova et al., 2025).
3.2 Offline radiative transfer simulations
We prescribed WV and ozone anomalies from MLS for the extended winter 2024/2025 (OW3) and calculated longwave and shortwave radiative heating rates using konrad's (Kluft et al., 2019; Dacie et al., 2019) interface to the Rapid Radiative Transfer (RT) Model for General circulation models (RRTMG; Kroll et al., 2021). We state that these radiative calculations are robust for various solar zenith angles. We accompany these calculations using a precise line-by-line RT simulations (see details in Bell et al., 2025)
3.3 Calculation of anomalies
Throughout our analysis, we evaluate significance fields using the minimum local p-values from Student's t-test with global test statistics. Most of the illustrations in Sect. 4 show differences between simulations with and without the HT forcing. For the MLSv6 observation, we compute local p-values as empirical two-sided rank p-values for each target month-pressure bin. We confirm this approach using local Monte Carlo p-values with 1000 samples.
3.4 Eliassen-Palm flux diagnostics
We investigate the response of resolved planetary waves (PWs) using the Eliassen-Palm flux diagnostics (EPF; Andrews and McIntyre, 1987) applied to the SOCOLv4 6-hourly outputs. EP fluxes are computed and scaled following Jucker (2021). The EPF convergence serves as an indicator of wave dissipation, and the EPF divergence (EPFD) indicates sourcing. We illustrate all EPF diagnostics from 1 October 2023 to 30 March 2024 in the Supplement.
3.5 Calculation of Southern Oscillation Index (SOI)
We calculate the Southern Oscillation Index (SOI) using sea level pressure (SLP) standardised difference between Tahiti (17.65° S, 149.45° W) and Darwin (12.46° S, 130.84° E) as a proxy for the El Niño Southern Oscillation (ENSO). Negative and positive SOI values coincide with abnormally warm and cold ocean waters across the eastern tropical Pacific typical of El Niño and La Niña episodes, respectively.
4.1 Observed changes in water vapor, ozone, and temperature
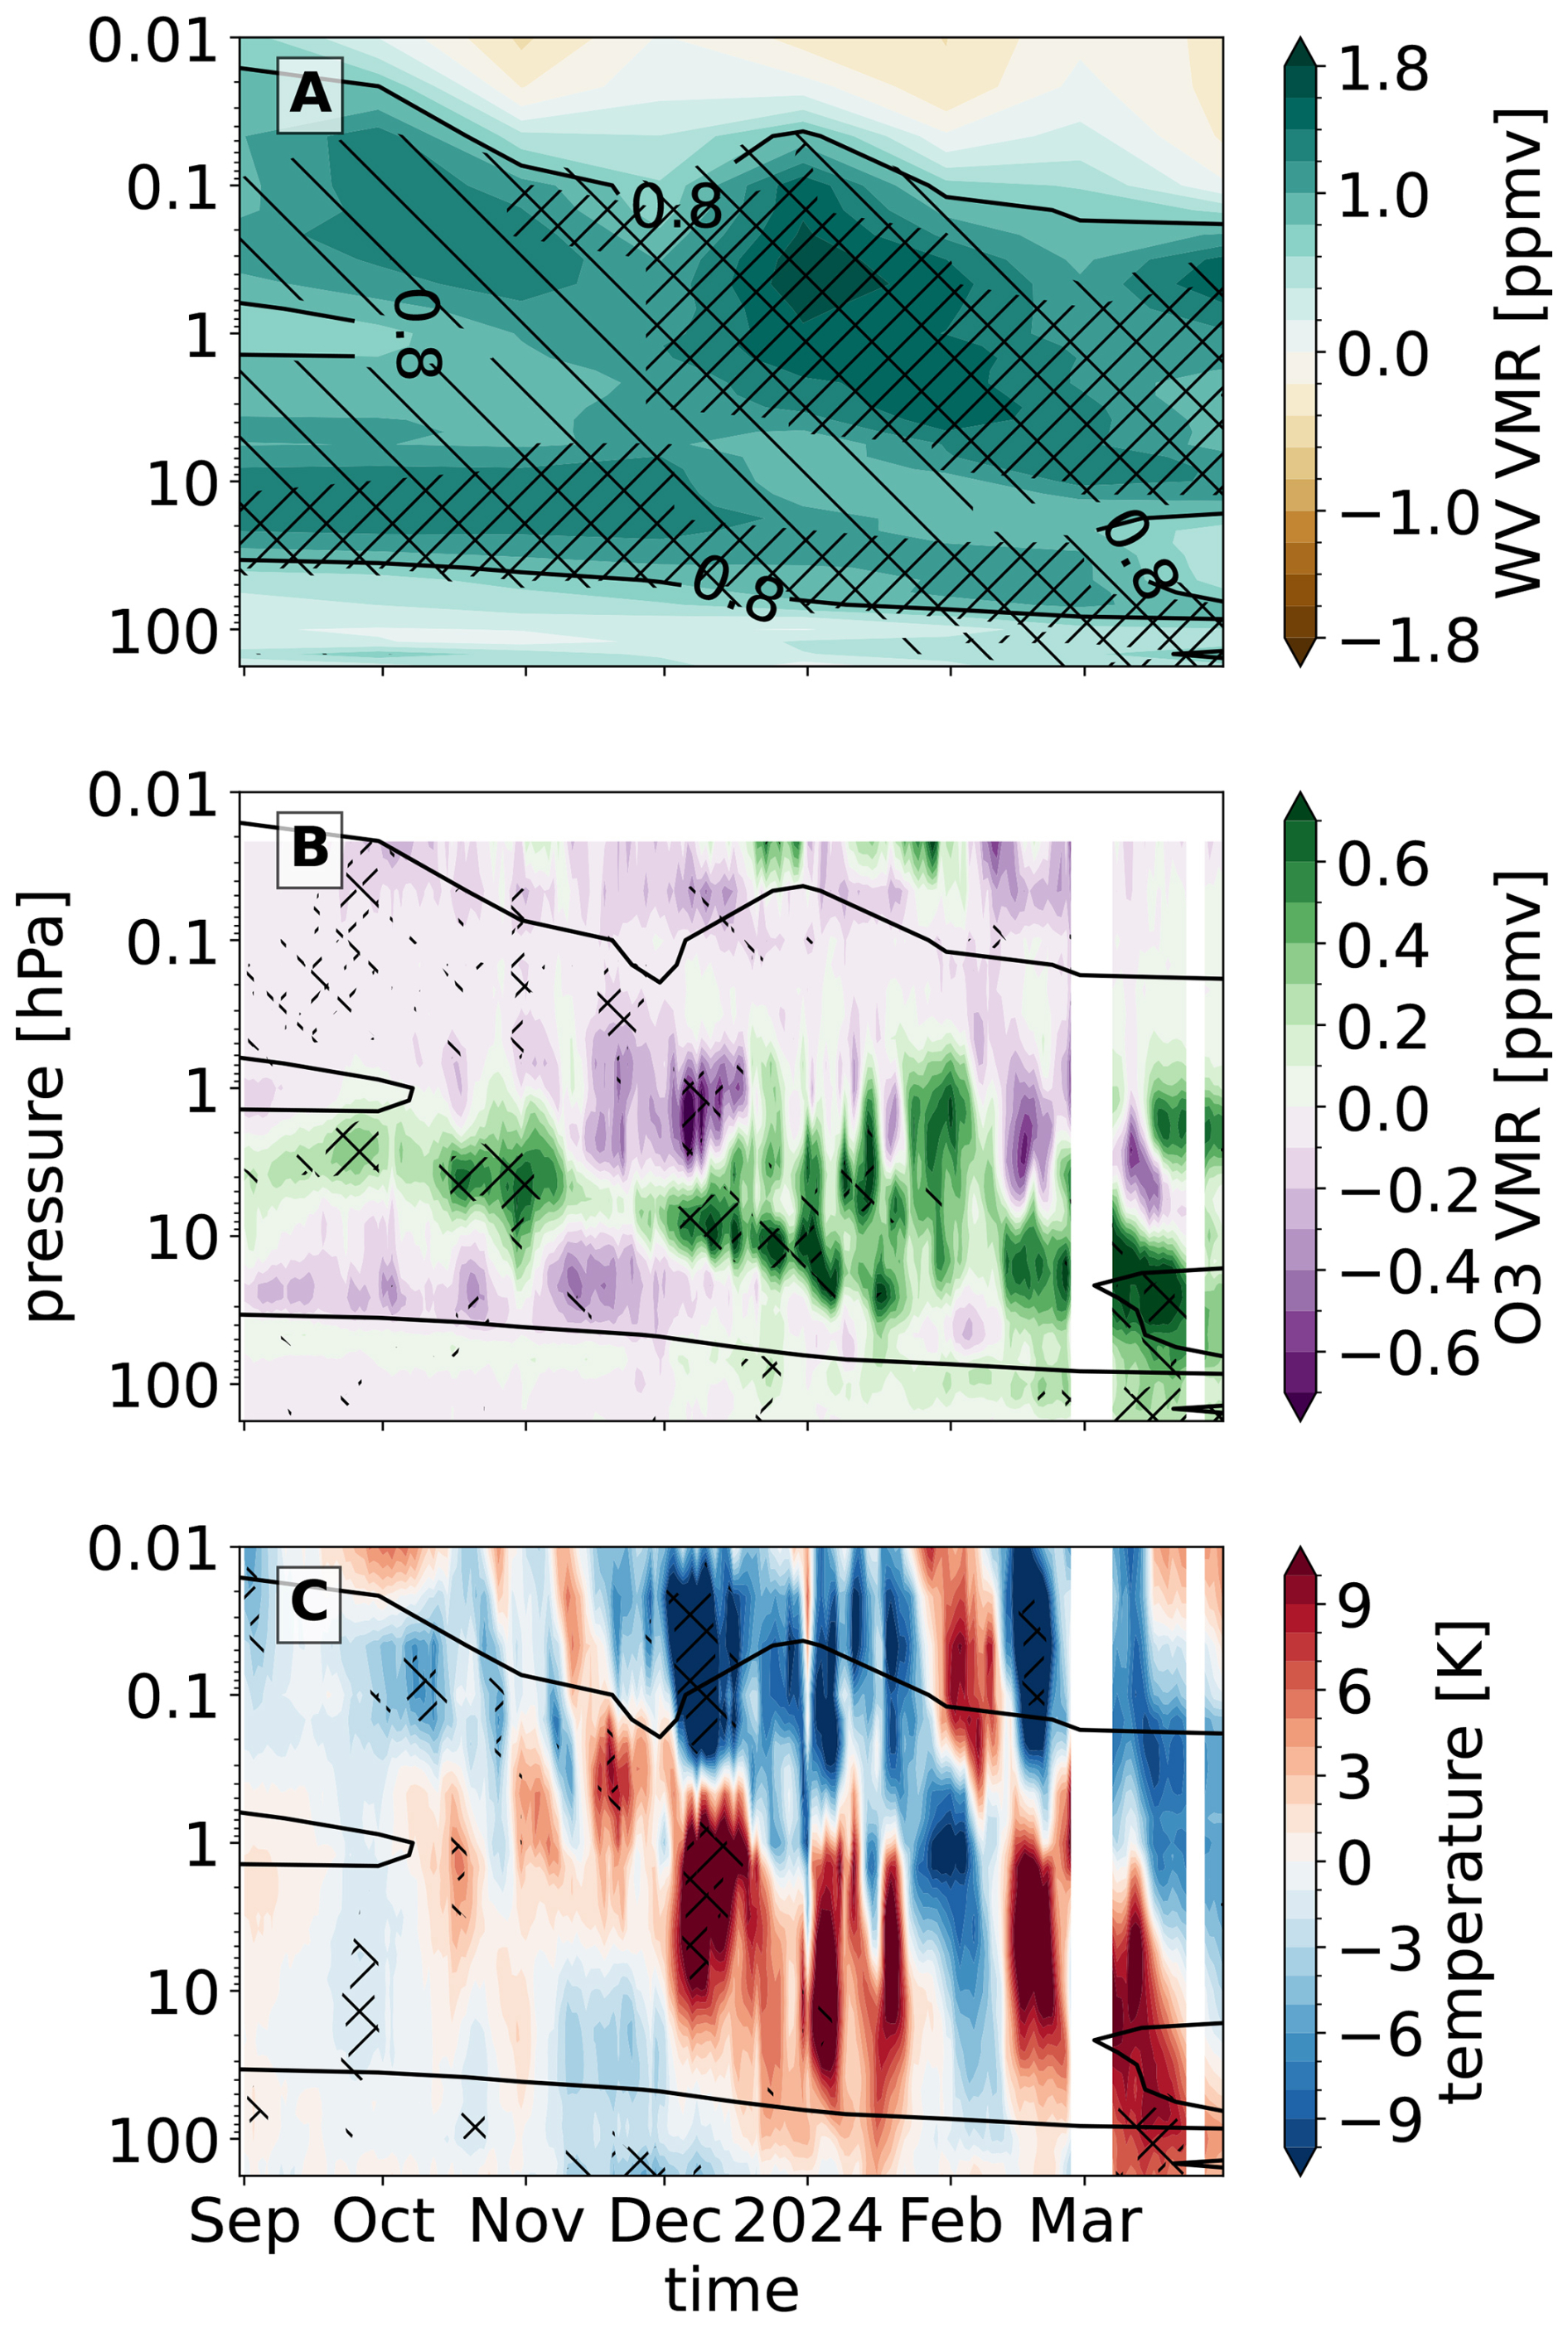
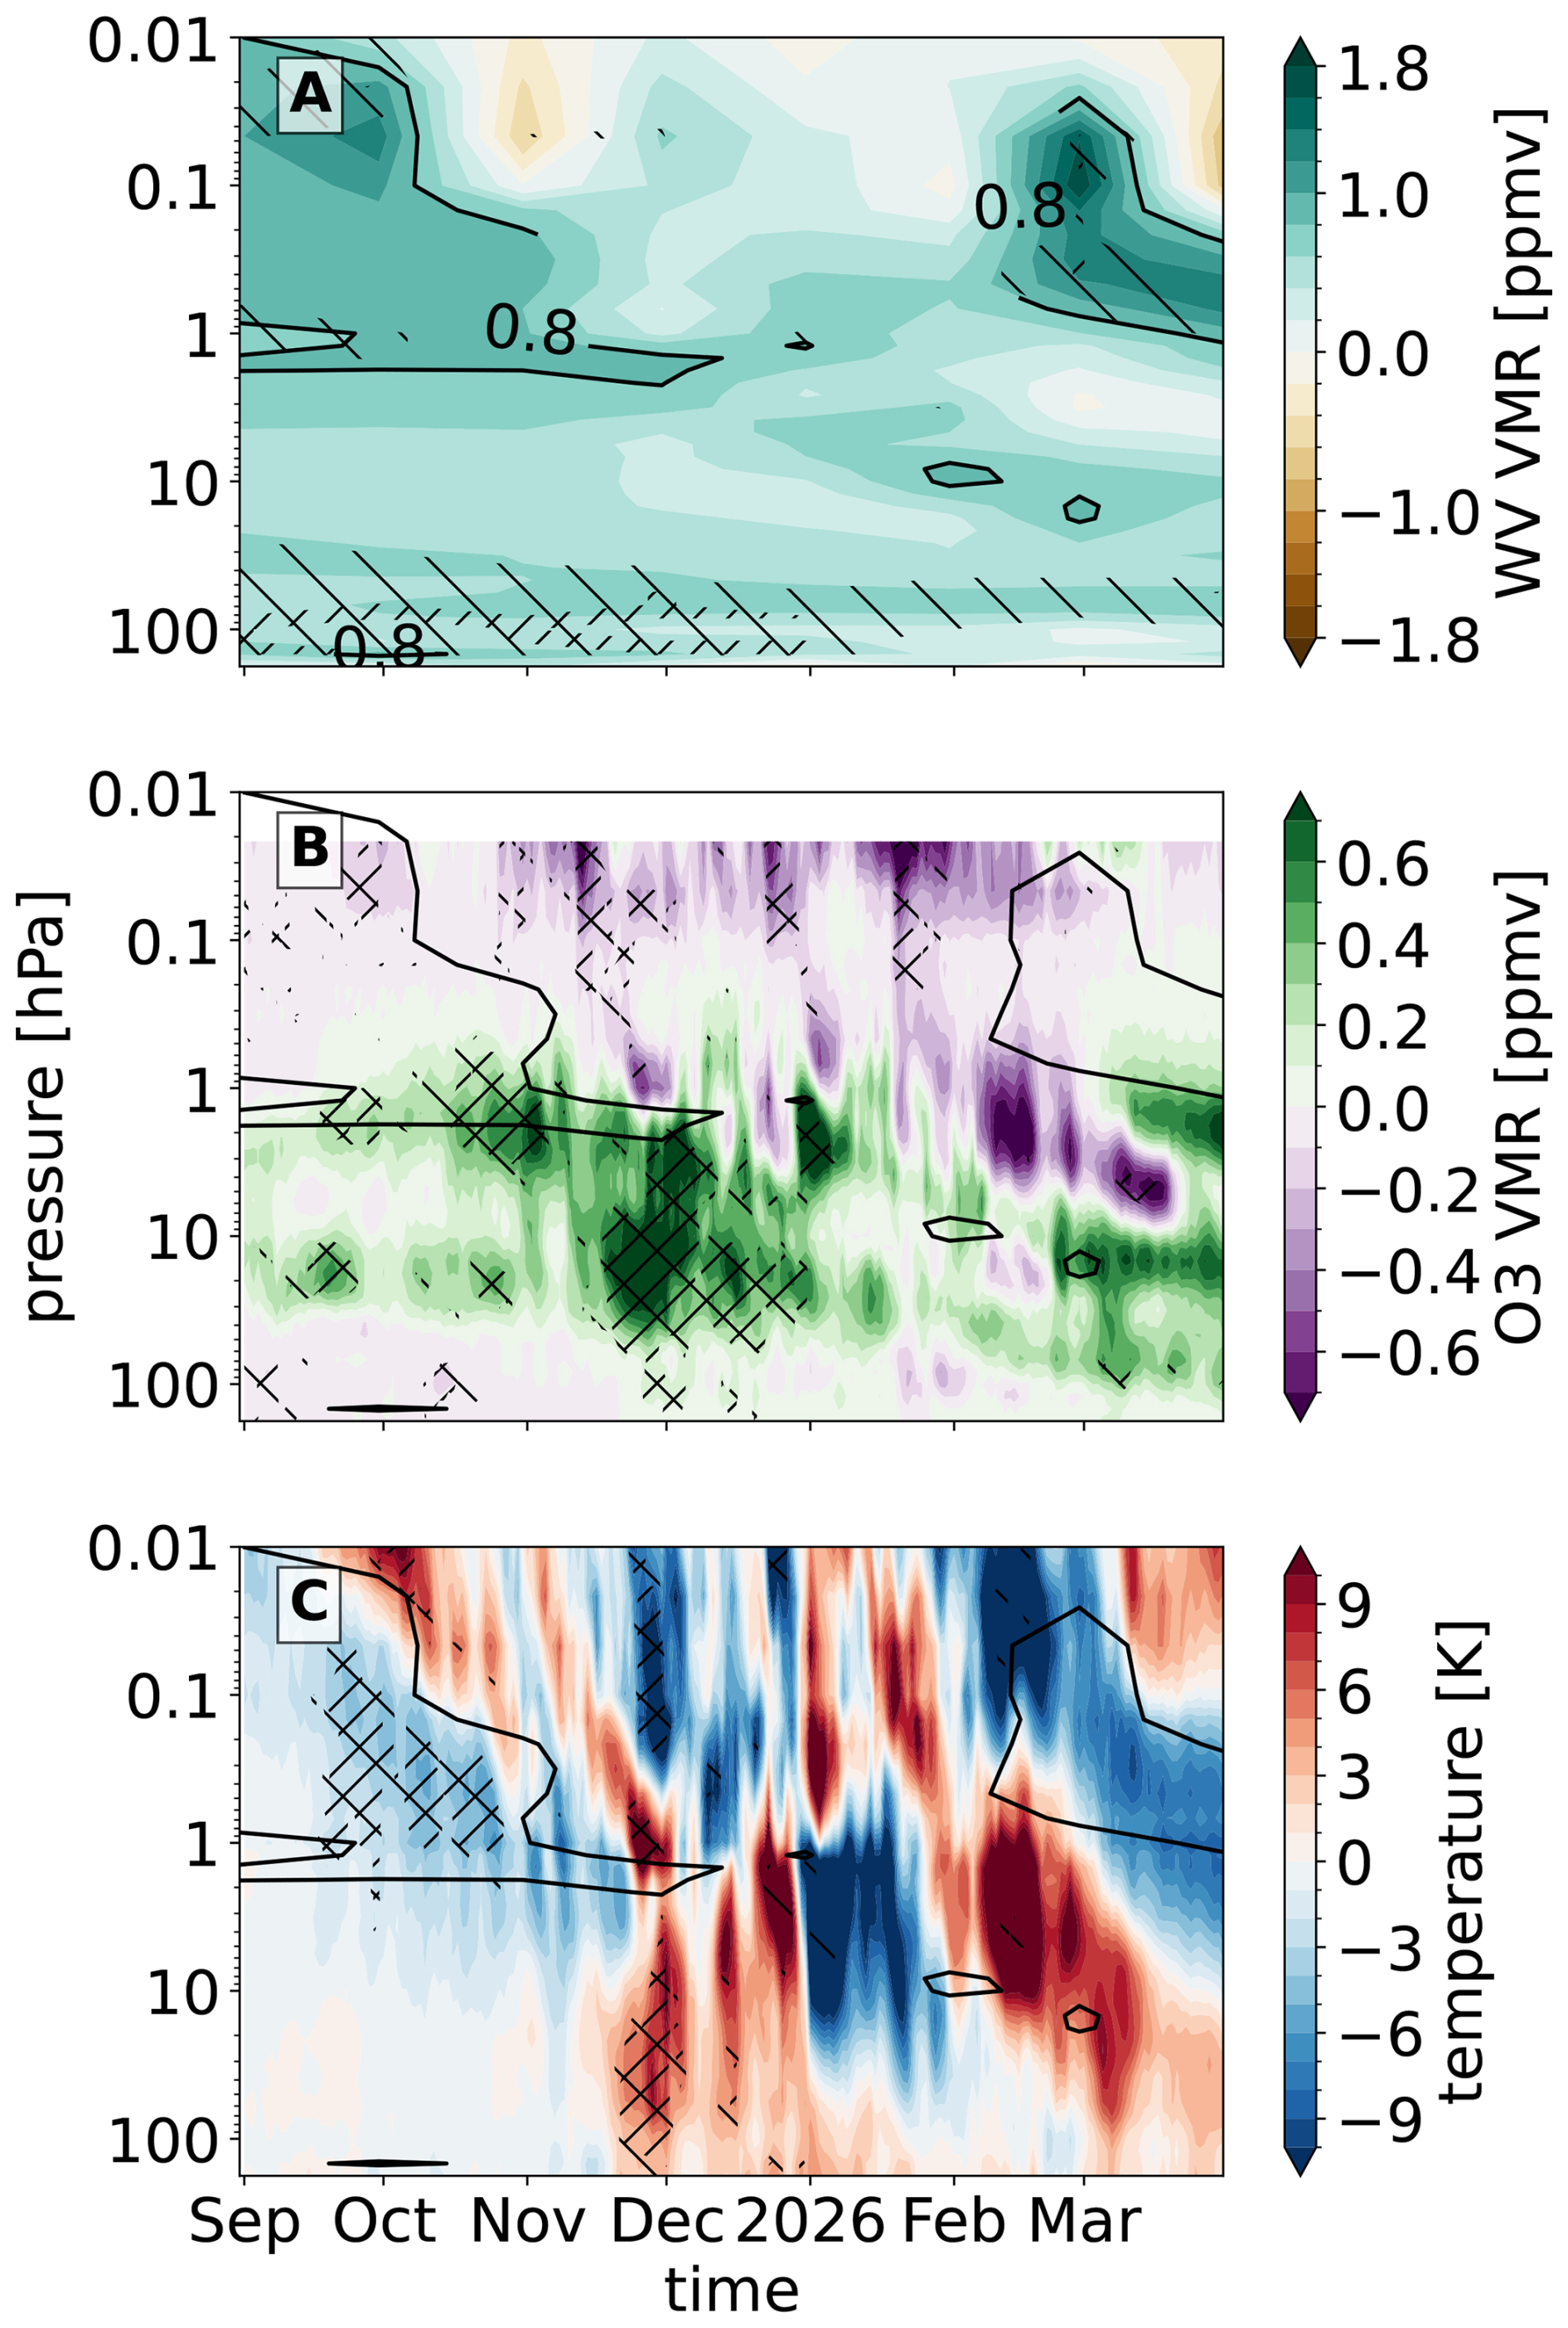
We set the scene by illustrating the daily evolution of stratospheric dynamics in the extended winter 2024/2025 (the third observed winter after the HT eruption; thus, marked as OW3) using the MERRA2 reanalysis in Fig. 1. Here, the zonal-mean winds diagnosed at 60° N at 10 hPa illustrate that the SPV strength exceeds the average strength during DJF 2024/2025. Next, we turn the focus to anomalies of WV, temperature, and ozone (derived from the MLS observations in Fig. 3), to put the exceptionally strong SPV in the context of the lingering HT perturbation in polar latitudes. The WV anomalies (see Fig. 3A) are characterized by “tongues” with concentrations of up to 2 ppmv. The first tongue appears in the mesosphere during September 2024 and continuously propagates downward with time to ∼ 10 hPa, where it gradually weakens and dissipates by March 2025, when it merges with the stratospheric background. A second tongue forms in the mesosphere in January 2025 and also propagates downward (not shown for the chosen time frame of Fig. 3). The WV anomaly is statistically significant (at respective p-values for given figure) over much of the descending tongue. In contrast, the negative ozone and temperature anomalies are statistically significant only locally, mainly along the upper flank of the WV tongue starting around 0.1 hPa in September and ending below 10 hPa in February (see Fig. 3B, C), reflecting the large daily and interannual variability of polar wintertime conditions. We therefore do not interpret the 2024/2025 anomalies as uniquely attributable to HT; rather, the observations indicate a plausible HT contribution superimposed on internal dynamical variability. The temperature anomalies are followed by their positive counterparts. By October, an enhanced ozone anomaly (∼0.5 ppmv) emerged around 10 hPa, leading to effective warming due to ozone absorption of solar radiation and increased mixing and thereby masking the WV-induced cooling propagating downward. In March, we observe a significant increase and decrease in stratospheric and mesospheric polar temperatures, respectively. However, the stratospheric ozone anomalies have both alternating positive and negative bands. This corresponds to the stratospheric final warming during which the SPV does not recover and transitions to summer conditions, with easterly winds across the stratosphere (see Fig. 1A). The observed stratospheric and lower-mesospheric longwave cooling rates are dominated by CO2 together with ozone and WV (Clough and Iacono, 1995; Brasseur and Solomon, 2005). The close correspondence between the WV and ozone anomalies and the diagnosed temperature response suggests the radiative cooling observed in OW3. However, a comparison with OW2 (see Fig. 4) implies that slowly descending WV, i.e. dynamical preconditioning (see EHF in Fig. 1B), positively feeds back on radiative cooling and strengthens the vortex. We examine this mechanism explicitly in the model simulations below.
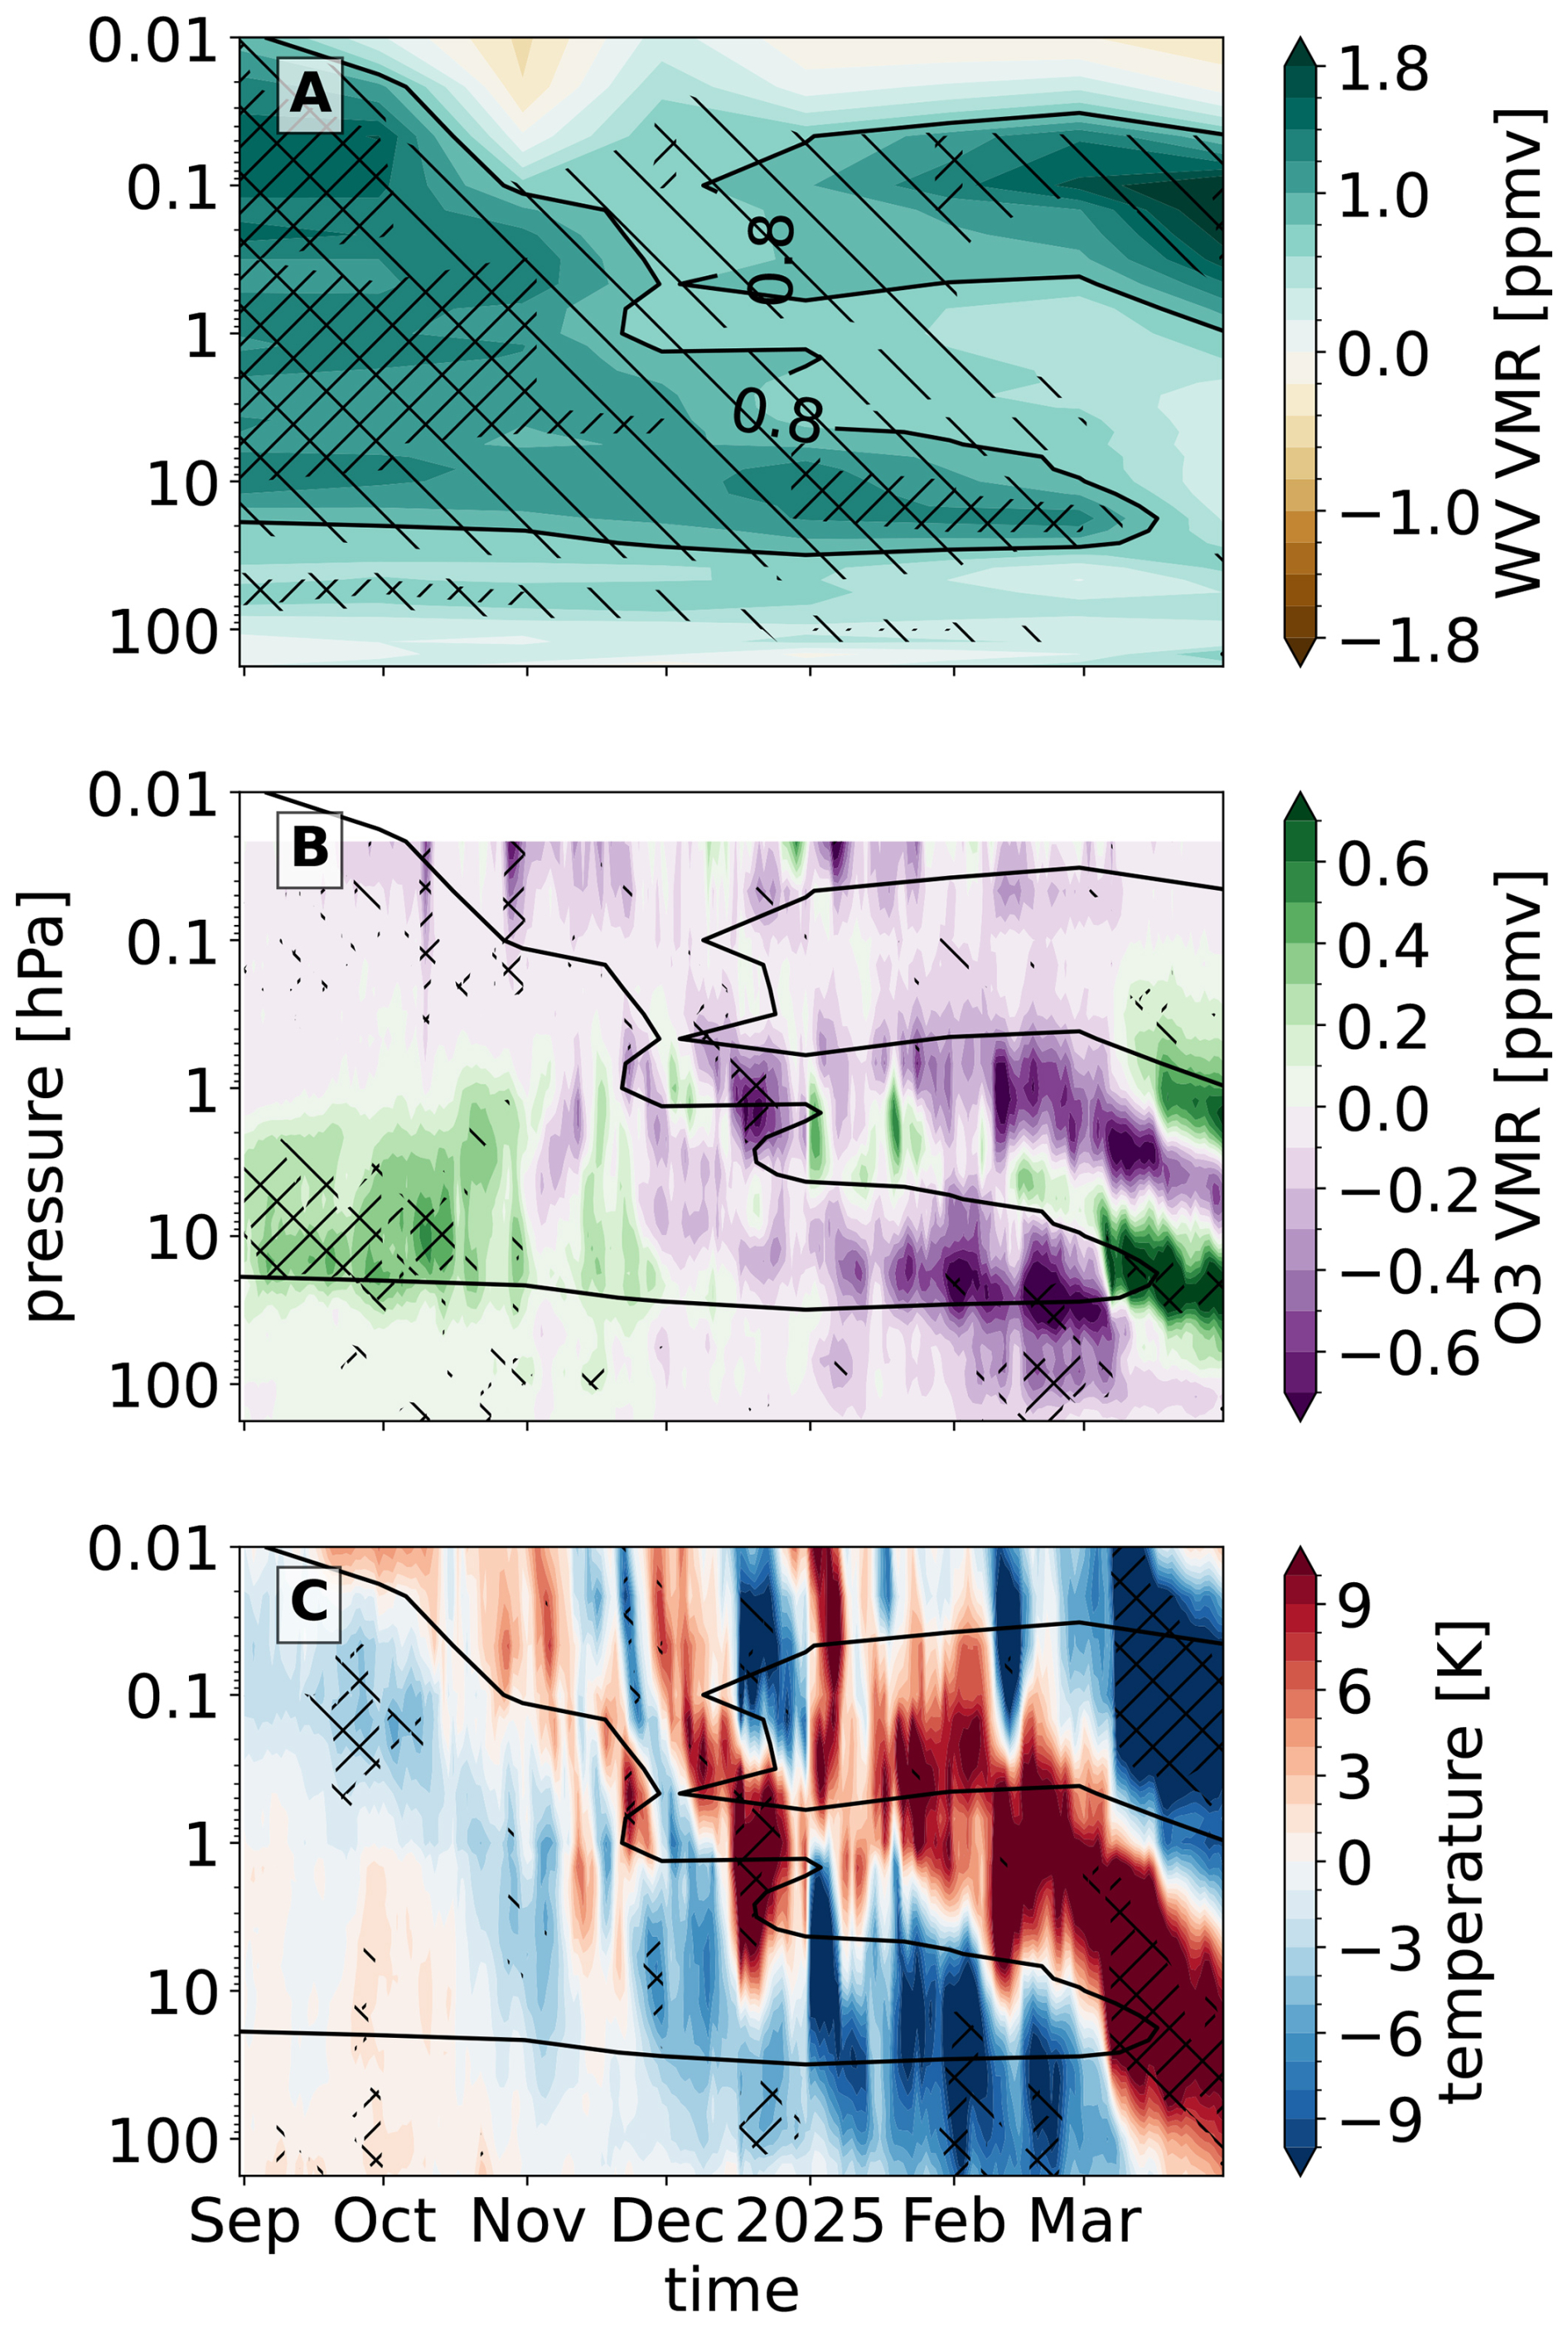
Figure 3Zonal mean weighted average for latitudes between 60–90° N of water vapour volume mixing ratio (VMR; shading in A and contour of 0.8 ppmv in B and C; in ppmv; monthly), ozone VMR (shading in B, in ppmv; daily) and temperature (shading in C; in K; daily) and anomalies for the extended winter 2024/2025 (OW3) from MLS. Anomalies are expressed as differences with respect to the climatology for the period 2006–2020. Hatching and show where the empirical two-sided p-values are <0.1 and <0.05, respectively. Due to missing data, water vapour is visualized as monthly anomalies with interpolated gaps.
4.2 Modeled changes in water vapor, ozone, and temperature
The downward propagating tongue of WV during winter is captured in our SOCOLv4 ensemble. The feature emerges in the extended winter 2023/2024 (marked as the second model winter after the HT eruption, MW2; see Fig. 5A) and winter of 2024/2025 (MW3; see Fig. 6A). The WV enhancement is, however, underestimated compared to observations in Fig. 3A, especially in MW3. Given the well-documented model deficiency of accelerated transport of SOCOLv4 (discussed in detail in Sect. 3.1), we argue that the winter MW2 in our simulations is comparable to OW3 in observations (see Sect. 4.1 and Fig. 3). For the MW2 SOCOLv4 yields a similar strengthening of the vortex with a less pronounced weakening than observed at the end of OW3 (cf. Fig. 5D at 10 hPa and Fig. 1A). In analogy, we assume MW3 matches with the upcoming OW4, as we detail further below.
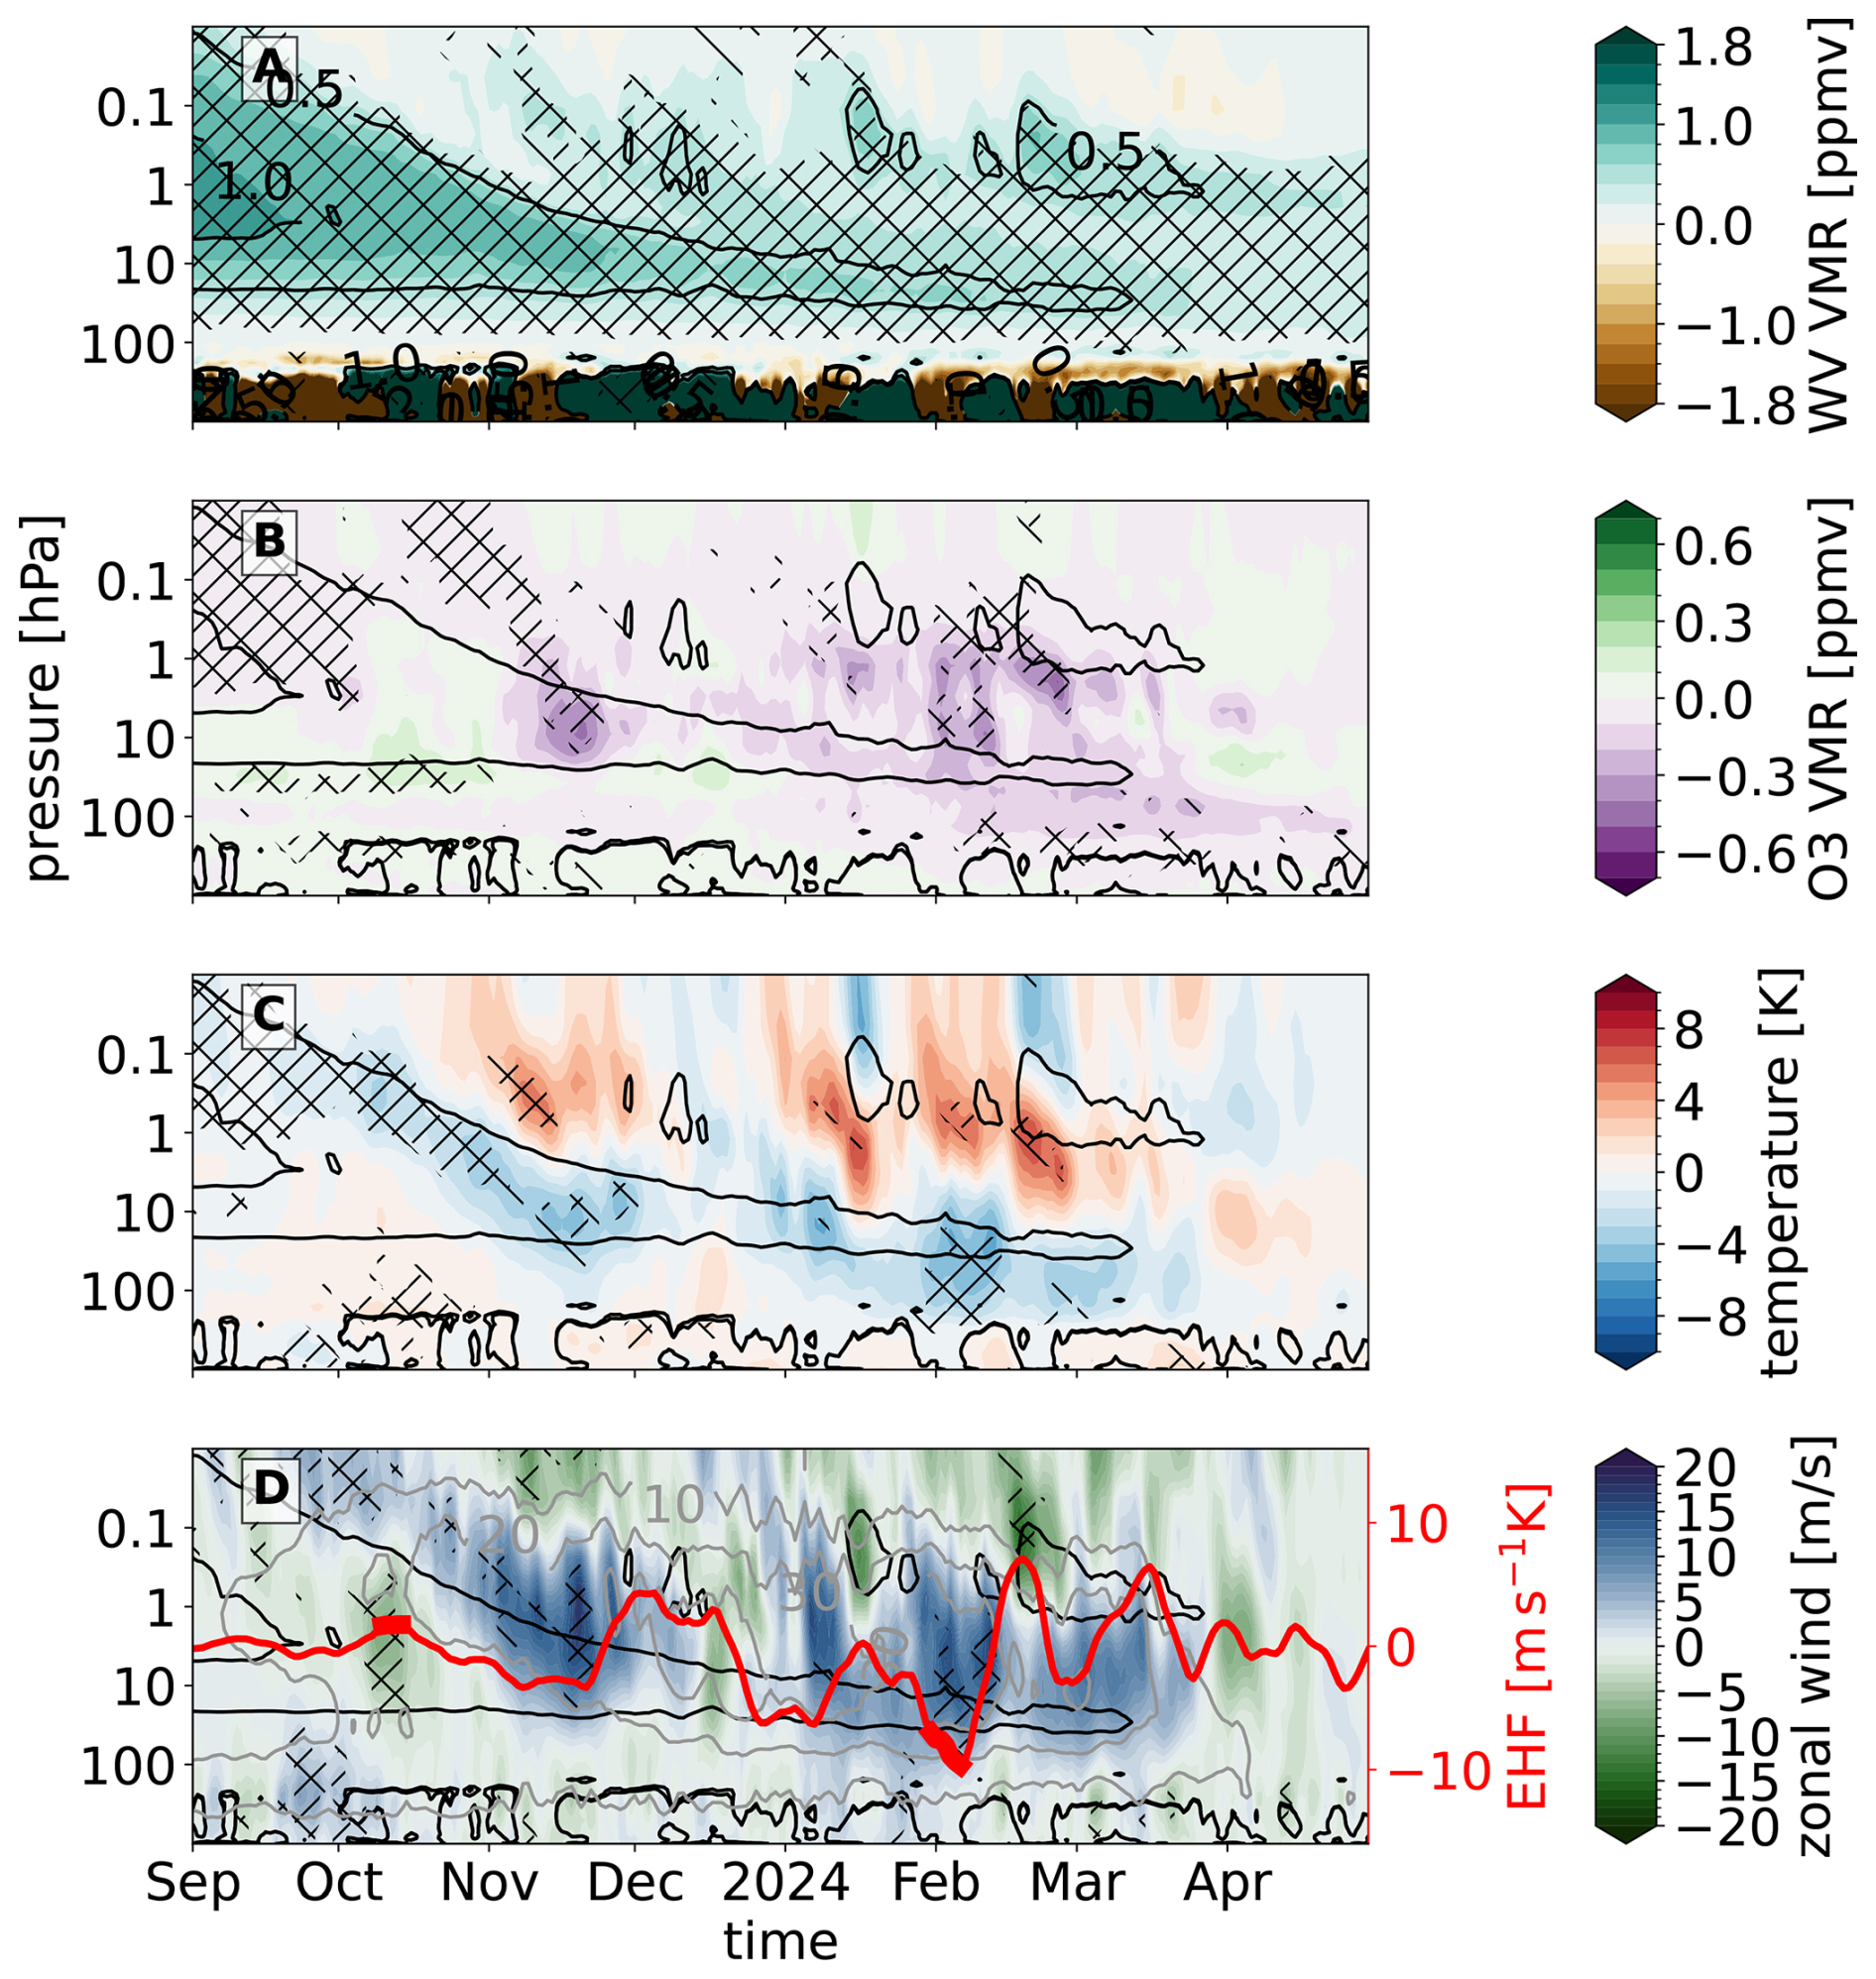
Figure 5Weighted zonal average over 60–90° N of water vapour volume mixing ratio (VMR; shading in A and contours of 0.5 and 1 ppmv in A, B, C and D; in ppmv), ozone VMR (shading in B, in ppmv), temperature (shading in C; in K), and zonal wind at 60° N (shading in D) and Eddy Heat Flux at 100 hPa averaged over 45–75° N (EHF in m s−1 K; red line in C) daily anomalies for the extended winter 2023/2024 (MW2) from SOCOLv4. Anomalies are expressed as the difference between the SOCOLv4 simulation with and without the HT forcing. Hatching and show where the p-values of the t-test are <0.1 and <0.05, respectively. Gray contours in (D) represent absolute values of zonal wind in the SOCOLv4 simulation with the HT forcing.
For MW2 (equaling OW3) we attribute the initial ozone destruction in the upper stratosphere and lower mesosphere to increased OH concentrations induced by the excess WV from the HT eruption (HOx cycle) and the ClOx activation from chlorine reservoirs (see Fig. 7). These coincide with a negative anomaly in NOx mainly attributable to cooling at these levels (Fleming et al., 2024). In contrast, as reported in Fleming et al. (2024); Kuchar et al. (2025), the positive ozone anomaly limited to September–November and rather in the lower to mid stratosphere, similar to MLS, emerges due to increased conversion of NOx to the HNO3 reservoir given an overall higher abundance of OH. While negative ozone and negative temperature anomalies are not statistically significant (at respective p-values for given figure) along the entire WV tongue similarly as in observations (see Fig. 3), they are associated with a stronger SPV and correspondingly weaker poleward transport of ozone from lower latitudes reflected by the EHF (red line in Fig. 5D) and AoA (Fig. 8). Thus, the paired SOCOLv4 simulations indicate that HT forcing shifts the ensemble-mean circulation response toward stronger polar westerlies. However, this ensemble-mean response does not imply that individual ozone, temperature, or wind anomalies, or the full observed evolution of OW3, can be uniquely attributed to the HT forcing.
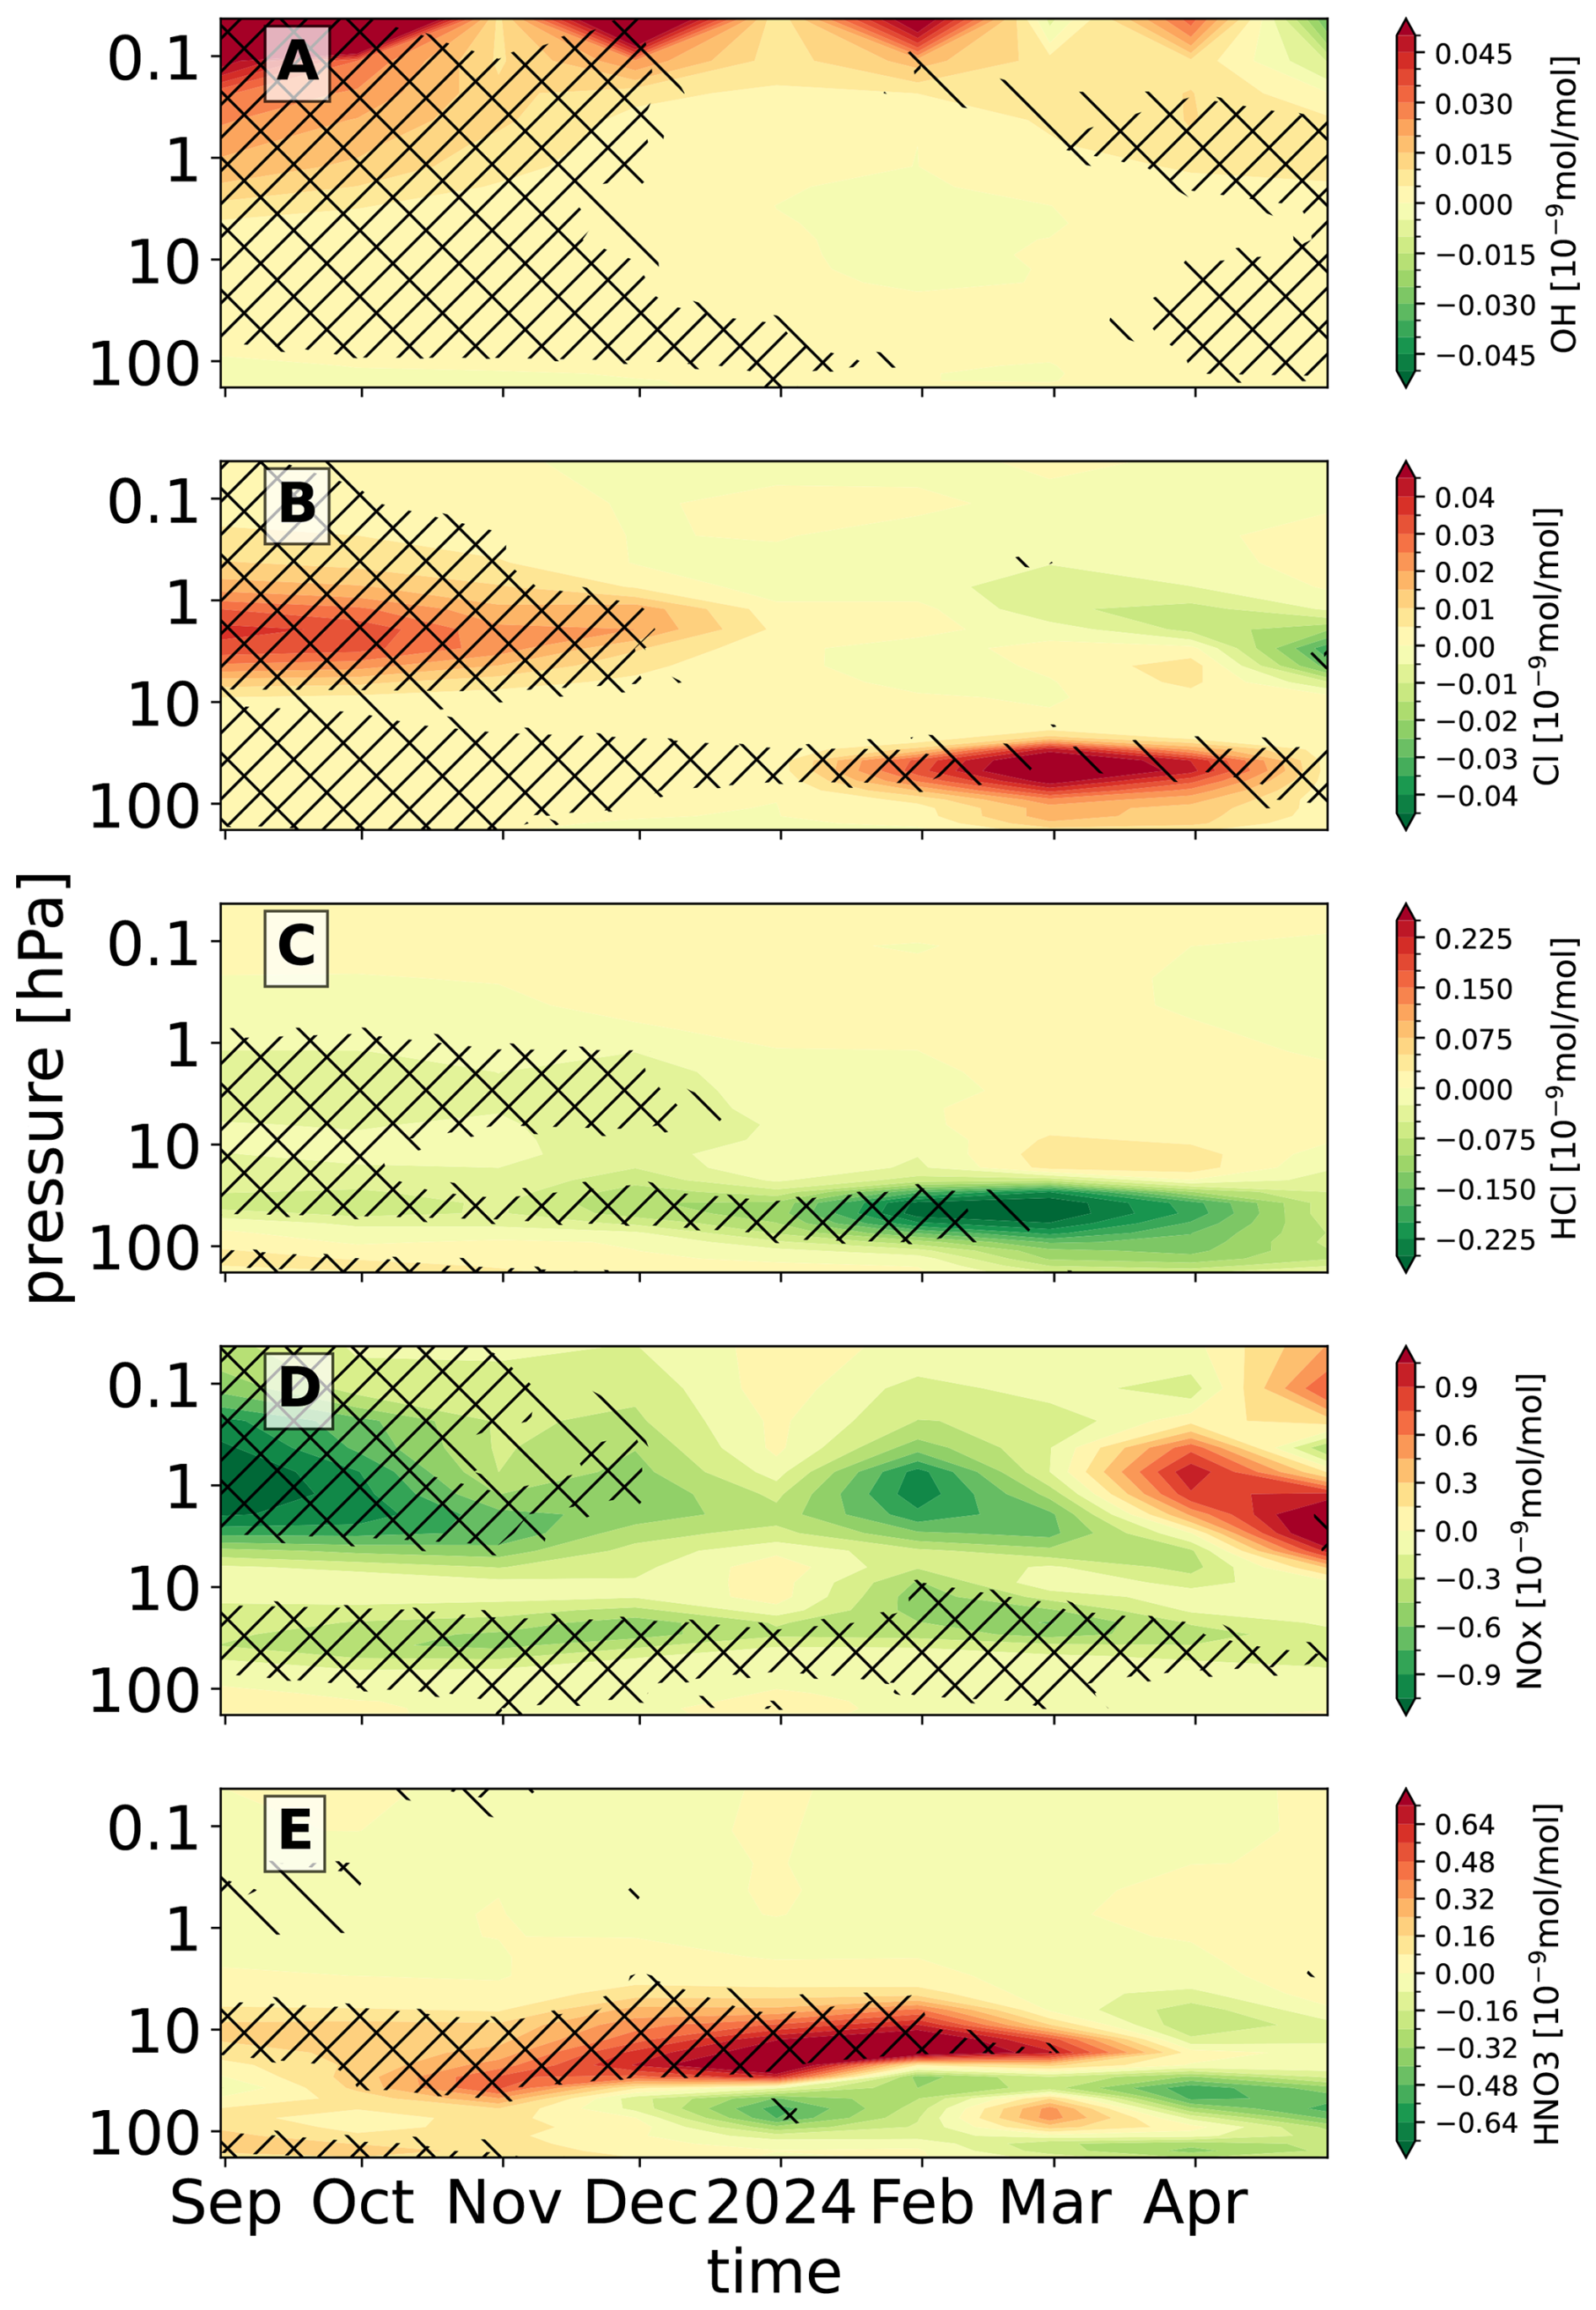
Figure 7Monthly zonal-mean anomalies of polar chemistry for the period 2023/2024 (MW2). Anomalies are expressed as the difference between the SOCOLv4 simulation with and without the HT forcing. Hatching and show where the p-values of the t-test are <0.1 and <0.05, respectively.
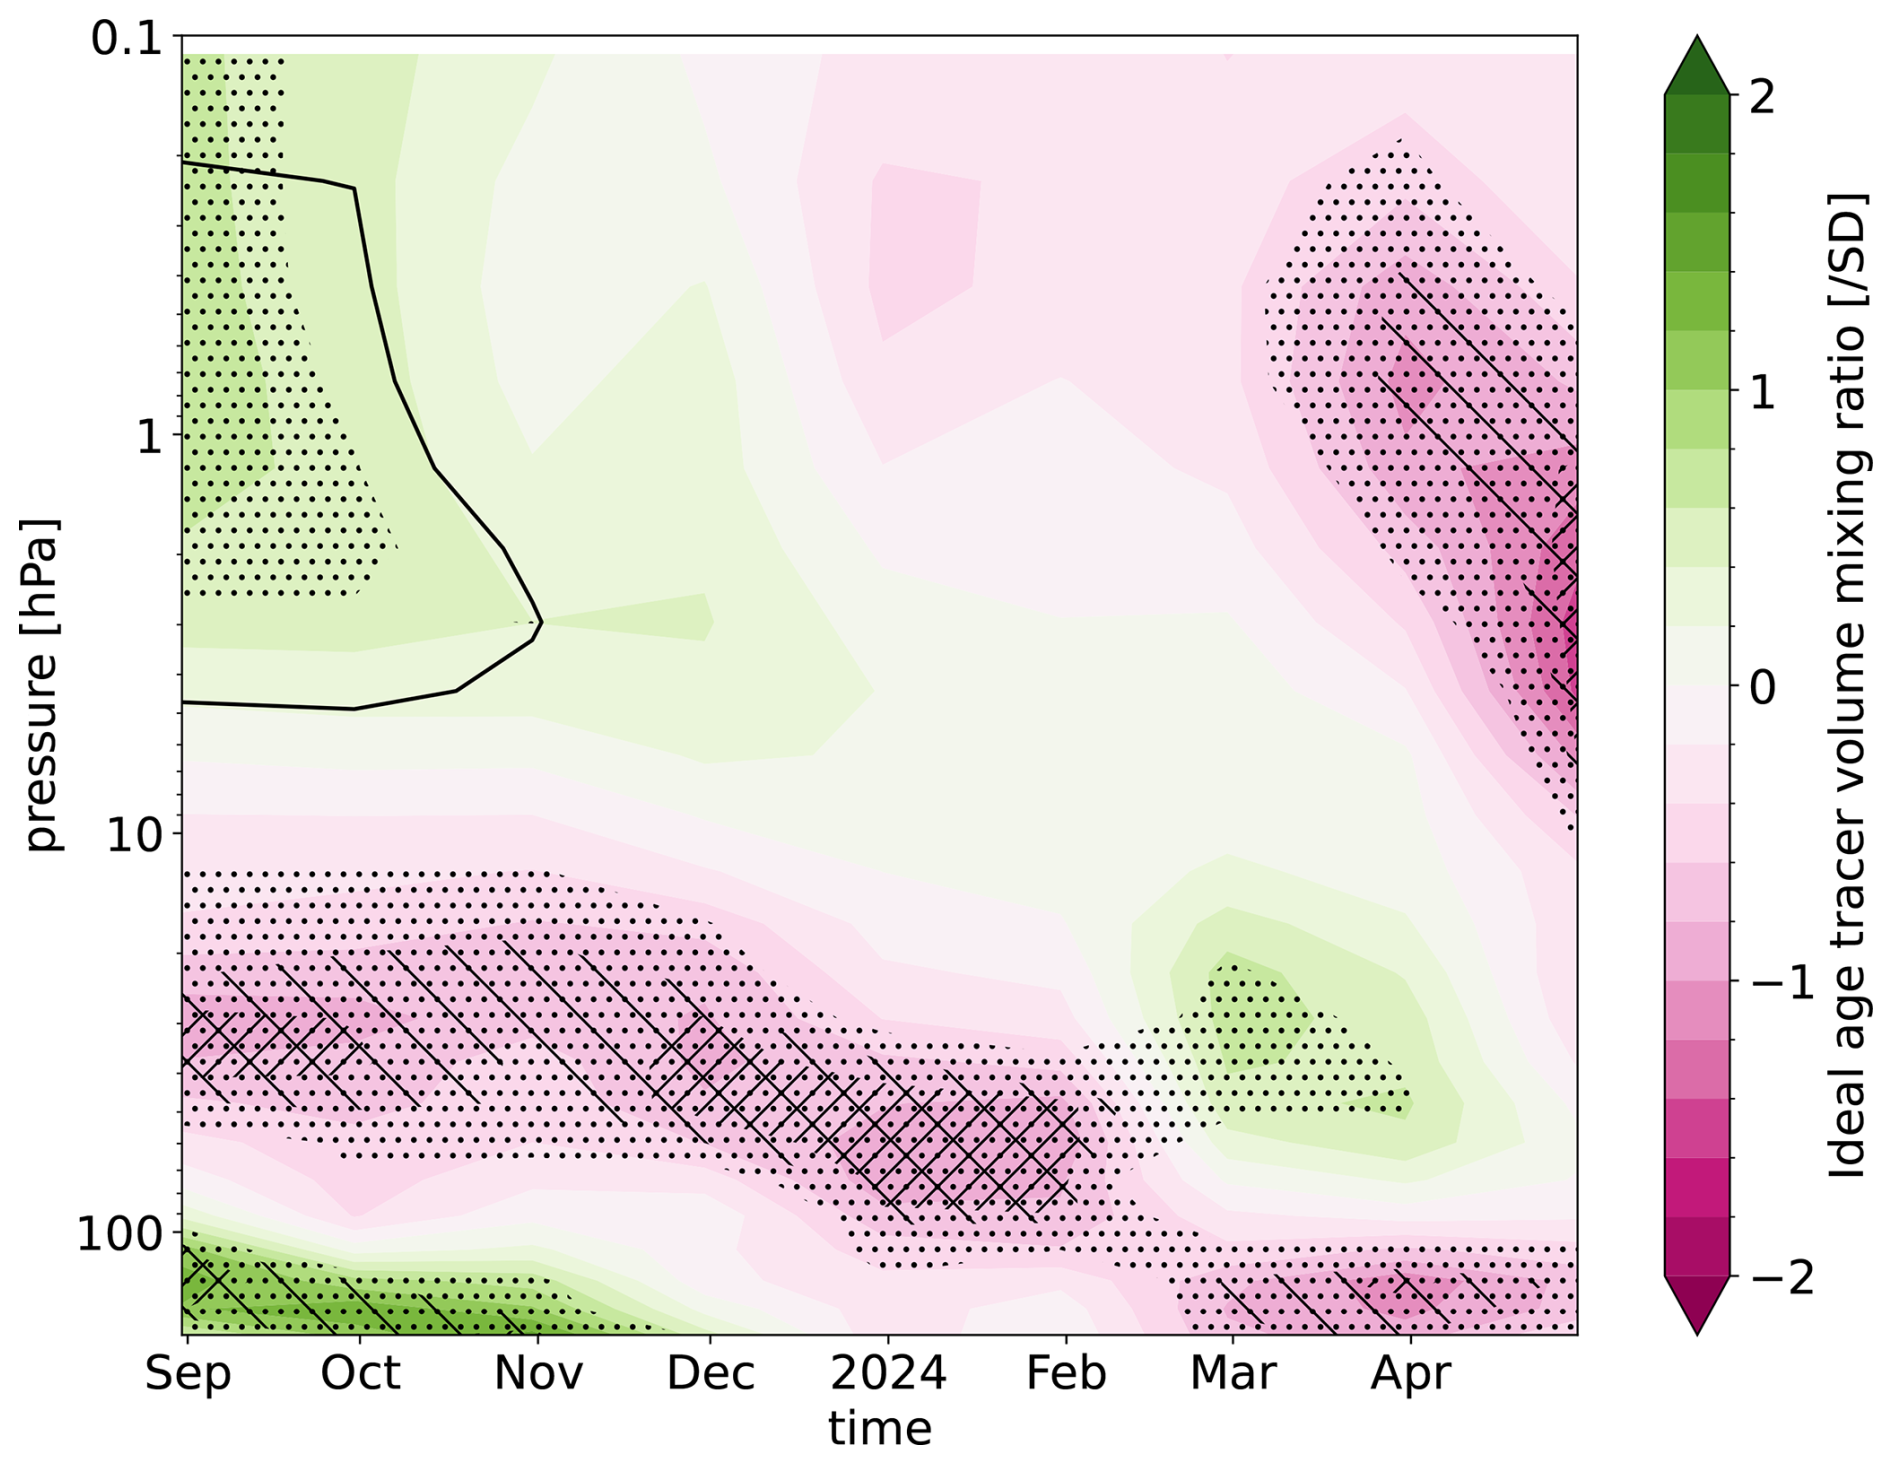
Figure 8Weighted zonal average over 60–90° N of age of air estimated as idealized age tracer volume mixing ratio monthly anomalies for the extended winter 2023/2024 (MW2). Anomalies are expressed as the difference between the SOCOLv4 simulation with and without the HT forcing and normalized to its climatological standard deviation (SD). Dots … and hatching and show where the p-values of the t-test are <0.3 and <0.1 and <0.05, respectively. The black contour line represents the contour of 1 ppmv of water vapour anomaly.
Next, we investigate the radiative effect of the observed changes in WV and O3 on temperature via offline radiative transfer (RT) calculations (see Sect. 3.2). These RT calculations presented in Fig. 9 reveal that perturbations in both WV and ozone abundances are capable of inducing cooling rates in the order of −0.5 to −1 K d−1, with WV and ozone dominating the change in the longwave and shortwave heating rates throughout the stratosphere and in the upper layers, respectively. These heating rate anomalies are collocated with those observed (see Fig. 3C) and simulated (see Fig. 5C). SOCOLv4, however, does yield a weaker temperature response initially, attributable to weaker changes in shortwave heating rates following the weaker ozone anomaly than seen in the MLS observations.
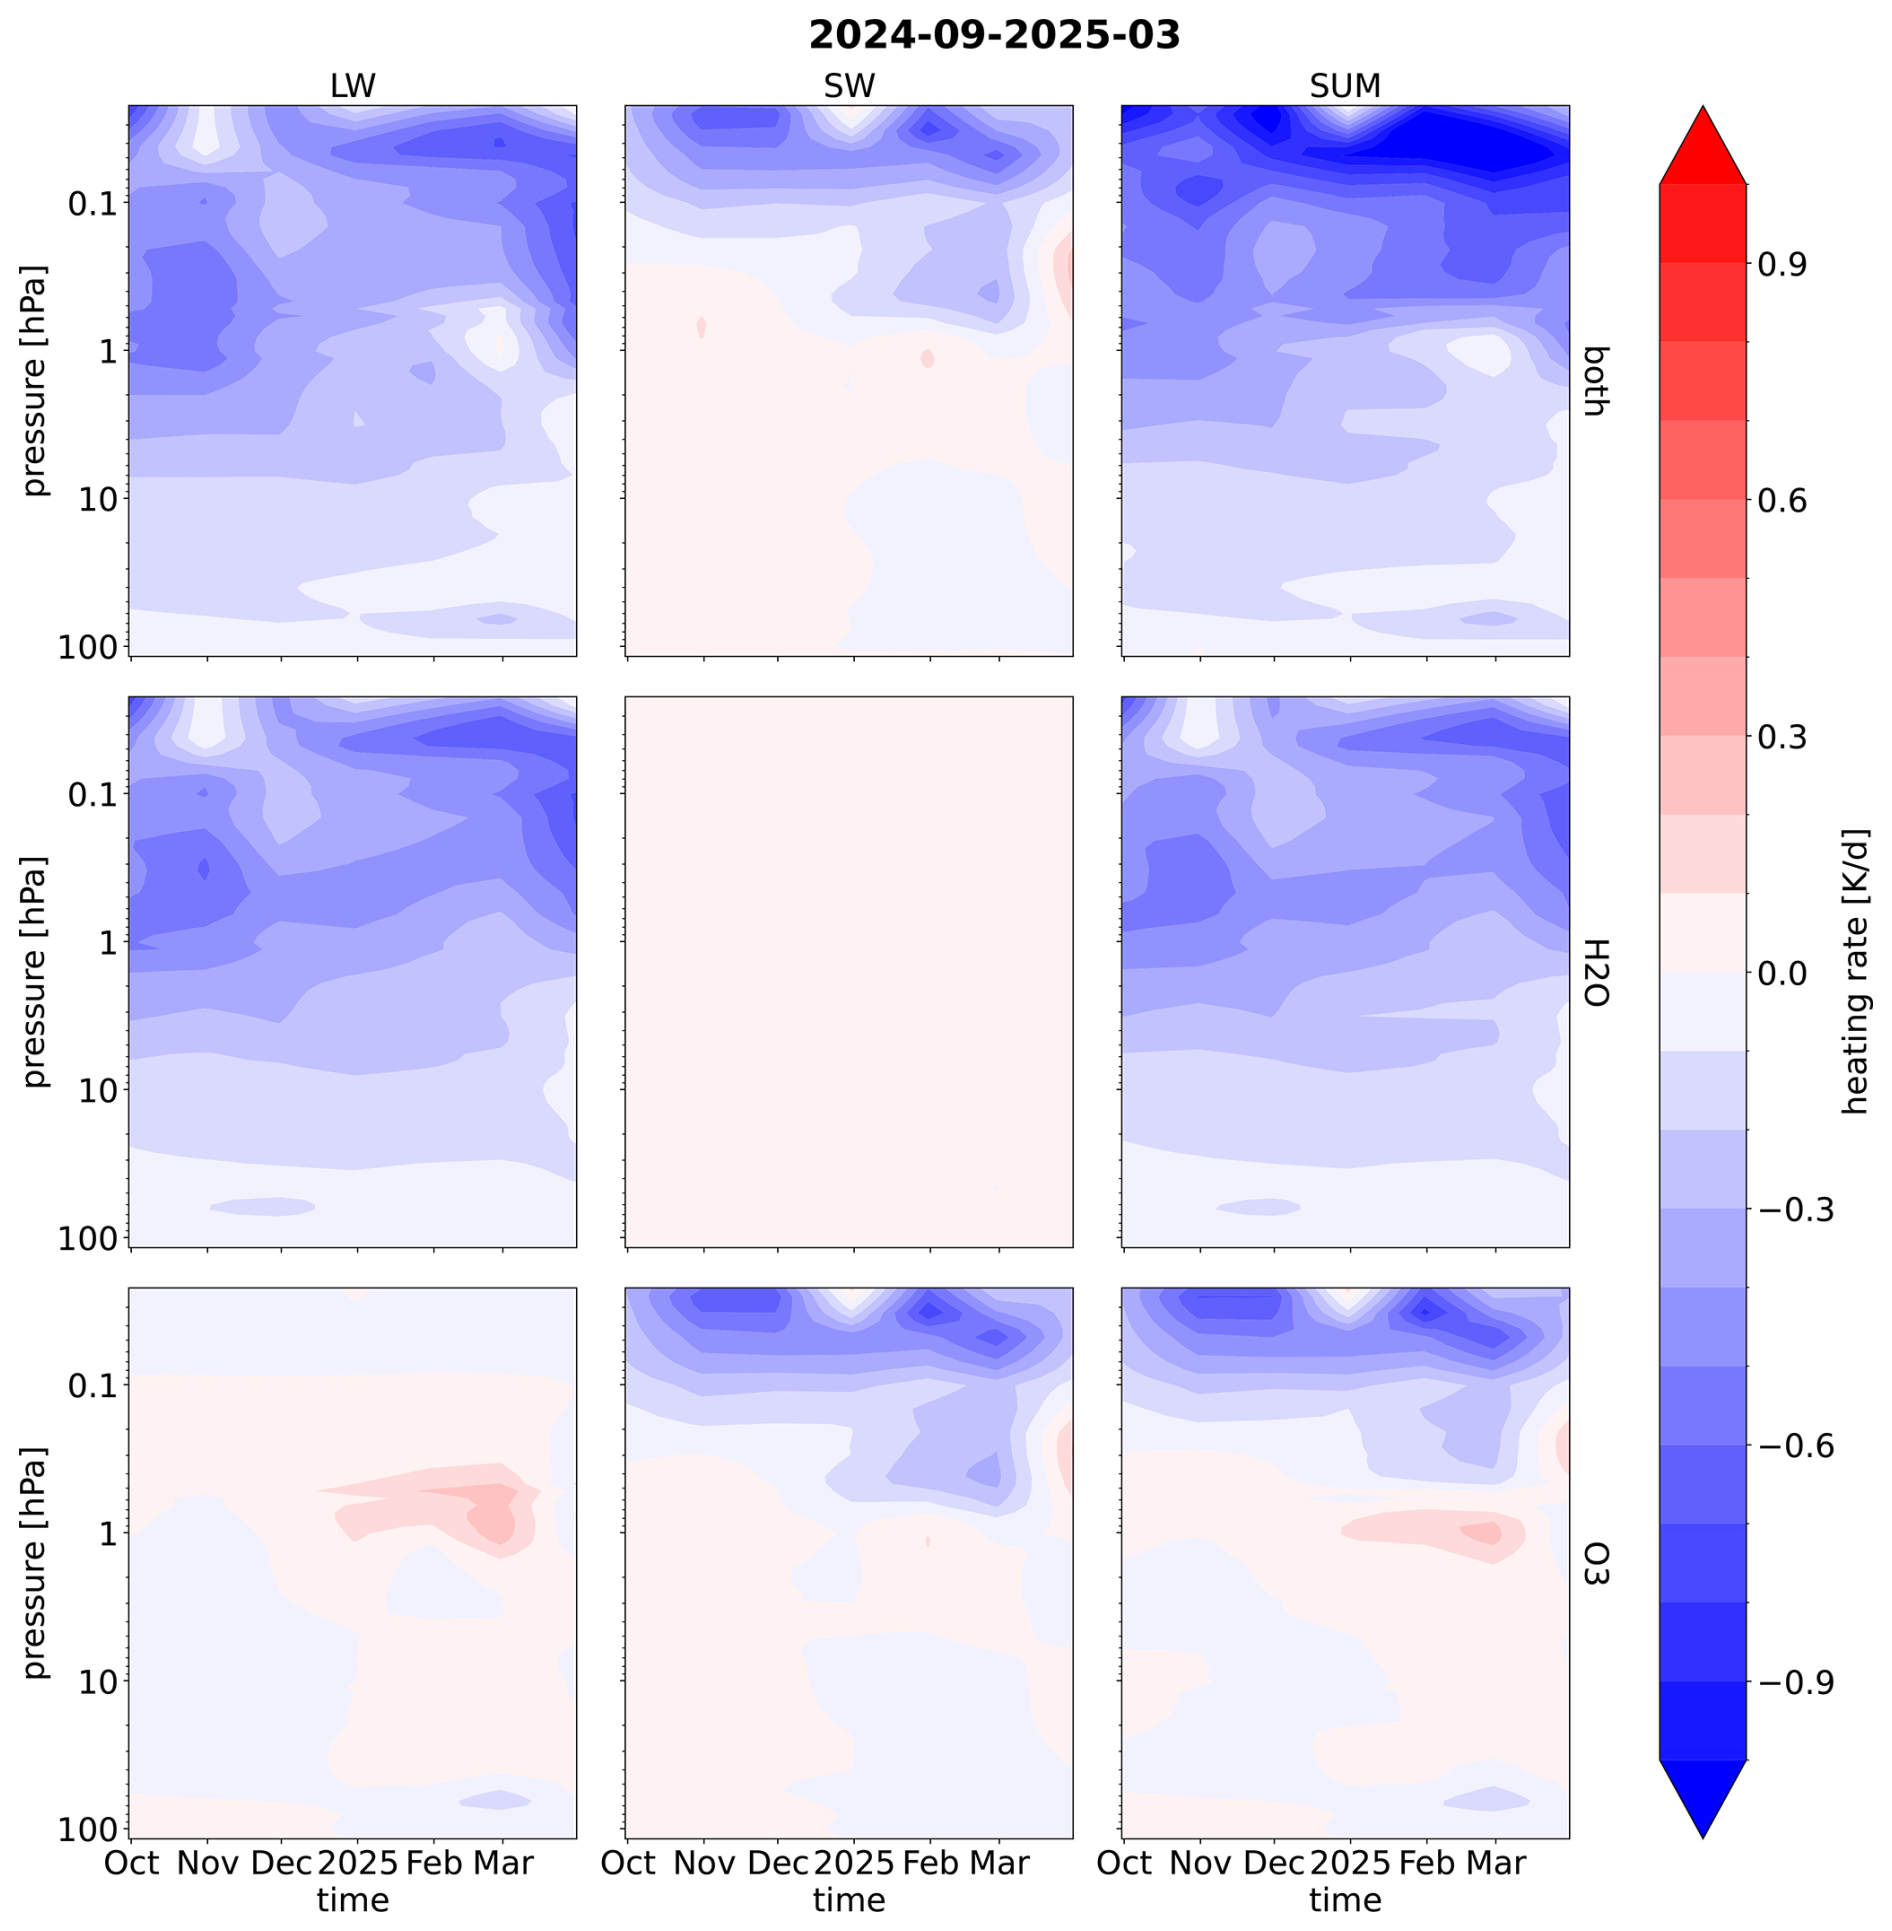
Figure 9RRTMG radiative heating rates (longwave, shortwave and their sum) for prescribed weighted zonal average over 60–90° N of water vapour and ozone monthly anomalies from MLS for the extended winter 2024/2025 (OW3).
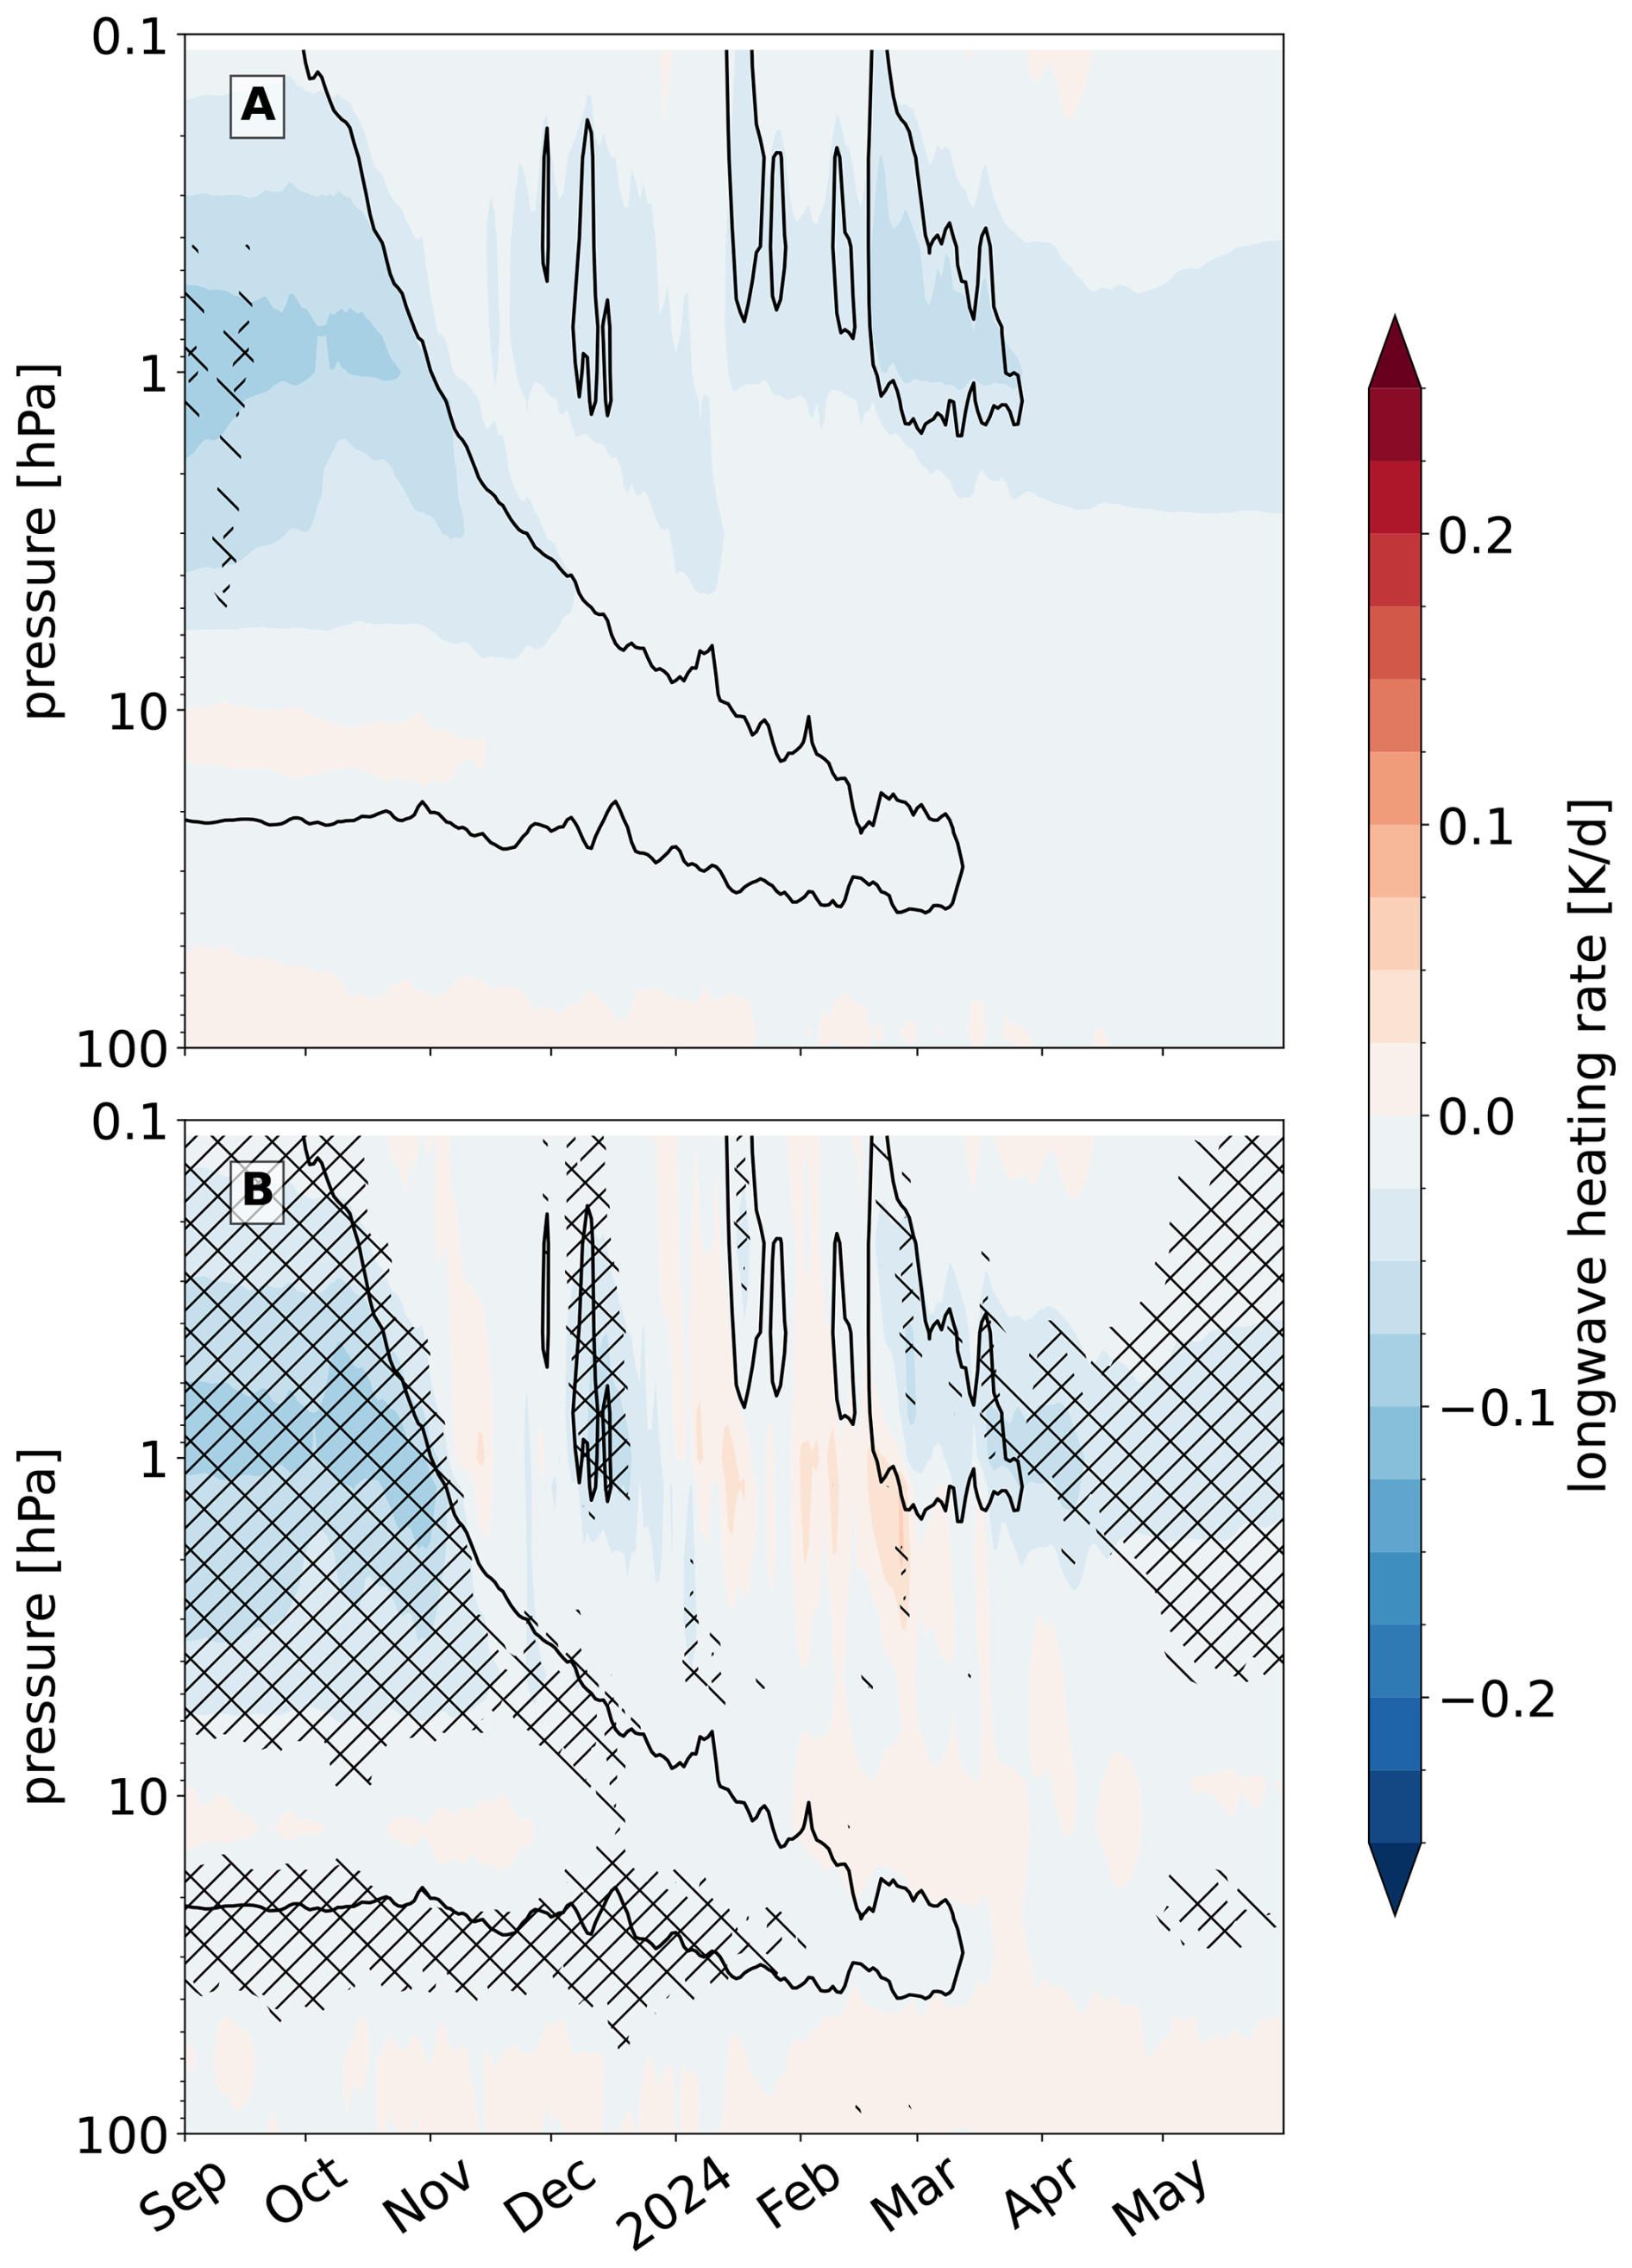
Figure 10Weighted zonal average over 60–90° N of clear-sky (offline) longwave heating rate (in K d−1) anomalies calculated using solely WV (shading in A); WV and O3 (shading in B). Contour in all panels represents a WV anomaly (0.5 ppmv) as in Fig. 5. Anomalies are expressed as the difference between the SOCOLv4 simulation with and without the HT forcing. Hatching and show where the p-values of the t-test are <0.1 and <0.05, respectively.
We confirm these calculations using the line-by-line RT simulations (see Sect. 3.2). The resulting longwave heating rates from prescribed time-evolving WV and ozone from SOCOLv4 are shown in Fig. 10.
As detailed in Bloxam and Huang (2021), the radiative-cooling recovery of SSW-induced temperature anomalies in the absence of dynamical heating is dominated by longwave radiative cooling, and is characterized by increasing e-folding times from the upper to middle stratosphere. If we invert the e-folding times (4–7.5 d in the upper stratosphere) of Bloxam and Huang (2021), we obtain an equivalent heating-rate effect of roughly 0.13–0.25 K d−1 K−1. Given that the e-folding time increases in the lower stratosphere and decreases towards the mesosphere, we expect that temperature perturbations translate into weaker and stronger heating-rate effects at lower and upper levels, respectively. In the lower stratosphere, the air cools more slowly because there is a deeper layer of atmosphere above it that absorbs the radiation, re-emits it upwards but also downwards, and thereby effectively reduces the amount of energy that can escape into space. Closer to the tropopause, the cooling effect reduces as the radiation emitted depends strongly on the background temperature itself (Bloxam and Huang, 2021). This asymmetry may explain the different persistence of the heating rate anomalies at different heights that appear in Fig. 10B. Furthermore, the pronounced positive heating rate anomaly around 1 hPa spanning from December 2024 to March 2025, consistent with enhanced longwave heating related to decreased ozone, aids in explaining the rapid change from negative to positive temperature anomalies (see Figs. 3C and 5C).
The negative temperature anomalies throughout the upper stratosphere and lower mesosphere result in an enhanced meridional temperature gradient (see Fig. 14), which strengthens SPV via the thermal wind balance. The SPV strengthening may initially enhance vertical wave propagation during October, a time when ZW are usually weak and thus allow more PWs to propagate upwards into the stratosphere (Charney and Drazin, 1961). In this respect, we understand the simultaneously observed anomalously high EHF at 100 hPa (see Fig. 1B) as a proxy for upward propagation of PWs (e.g. Newman et al., 2001). This way we associate the anomalously weak ZW below in the stratosphere to anomalously breaking PWs (see visualization of EPF in the Supplement, Sect. 3.4). As the cooling progresses downward, it aids the strengthening of the winds, which tend to be too strong for wave propagation (Plumb, 1989). This may confirm the nonlinearity of SPV for generally large wave forcing during the NH winter conditions (Scott and Haynes, 2002). The stronger SPV is associated with pronounced negative and positive temperature anomalies below and above, respectively. A similar dipole structure has been discussed in studies diagnosing SH high-latitude temperature trends as a consequence of ozone depletion (e.g. Young et al., 2013; Keeble et al., 2014). Manzini et al. (2003) attributed the positive temperature anomaly at upper levels to increased downwelling, and thus, consequently, adiabatic warming due to enhanced gravity wave propagation. Correspondingly, stronger westerlies in the stratosphere filter eastward gravity waves while westward gravity waves propagate freely upward and deposit their momentum above.
4.2.1 QBO and ENSO preconditioning
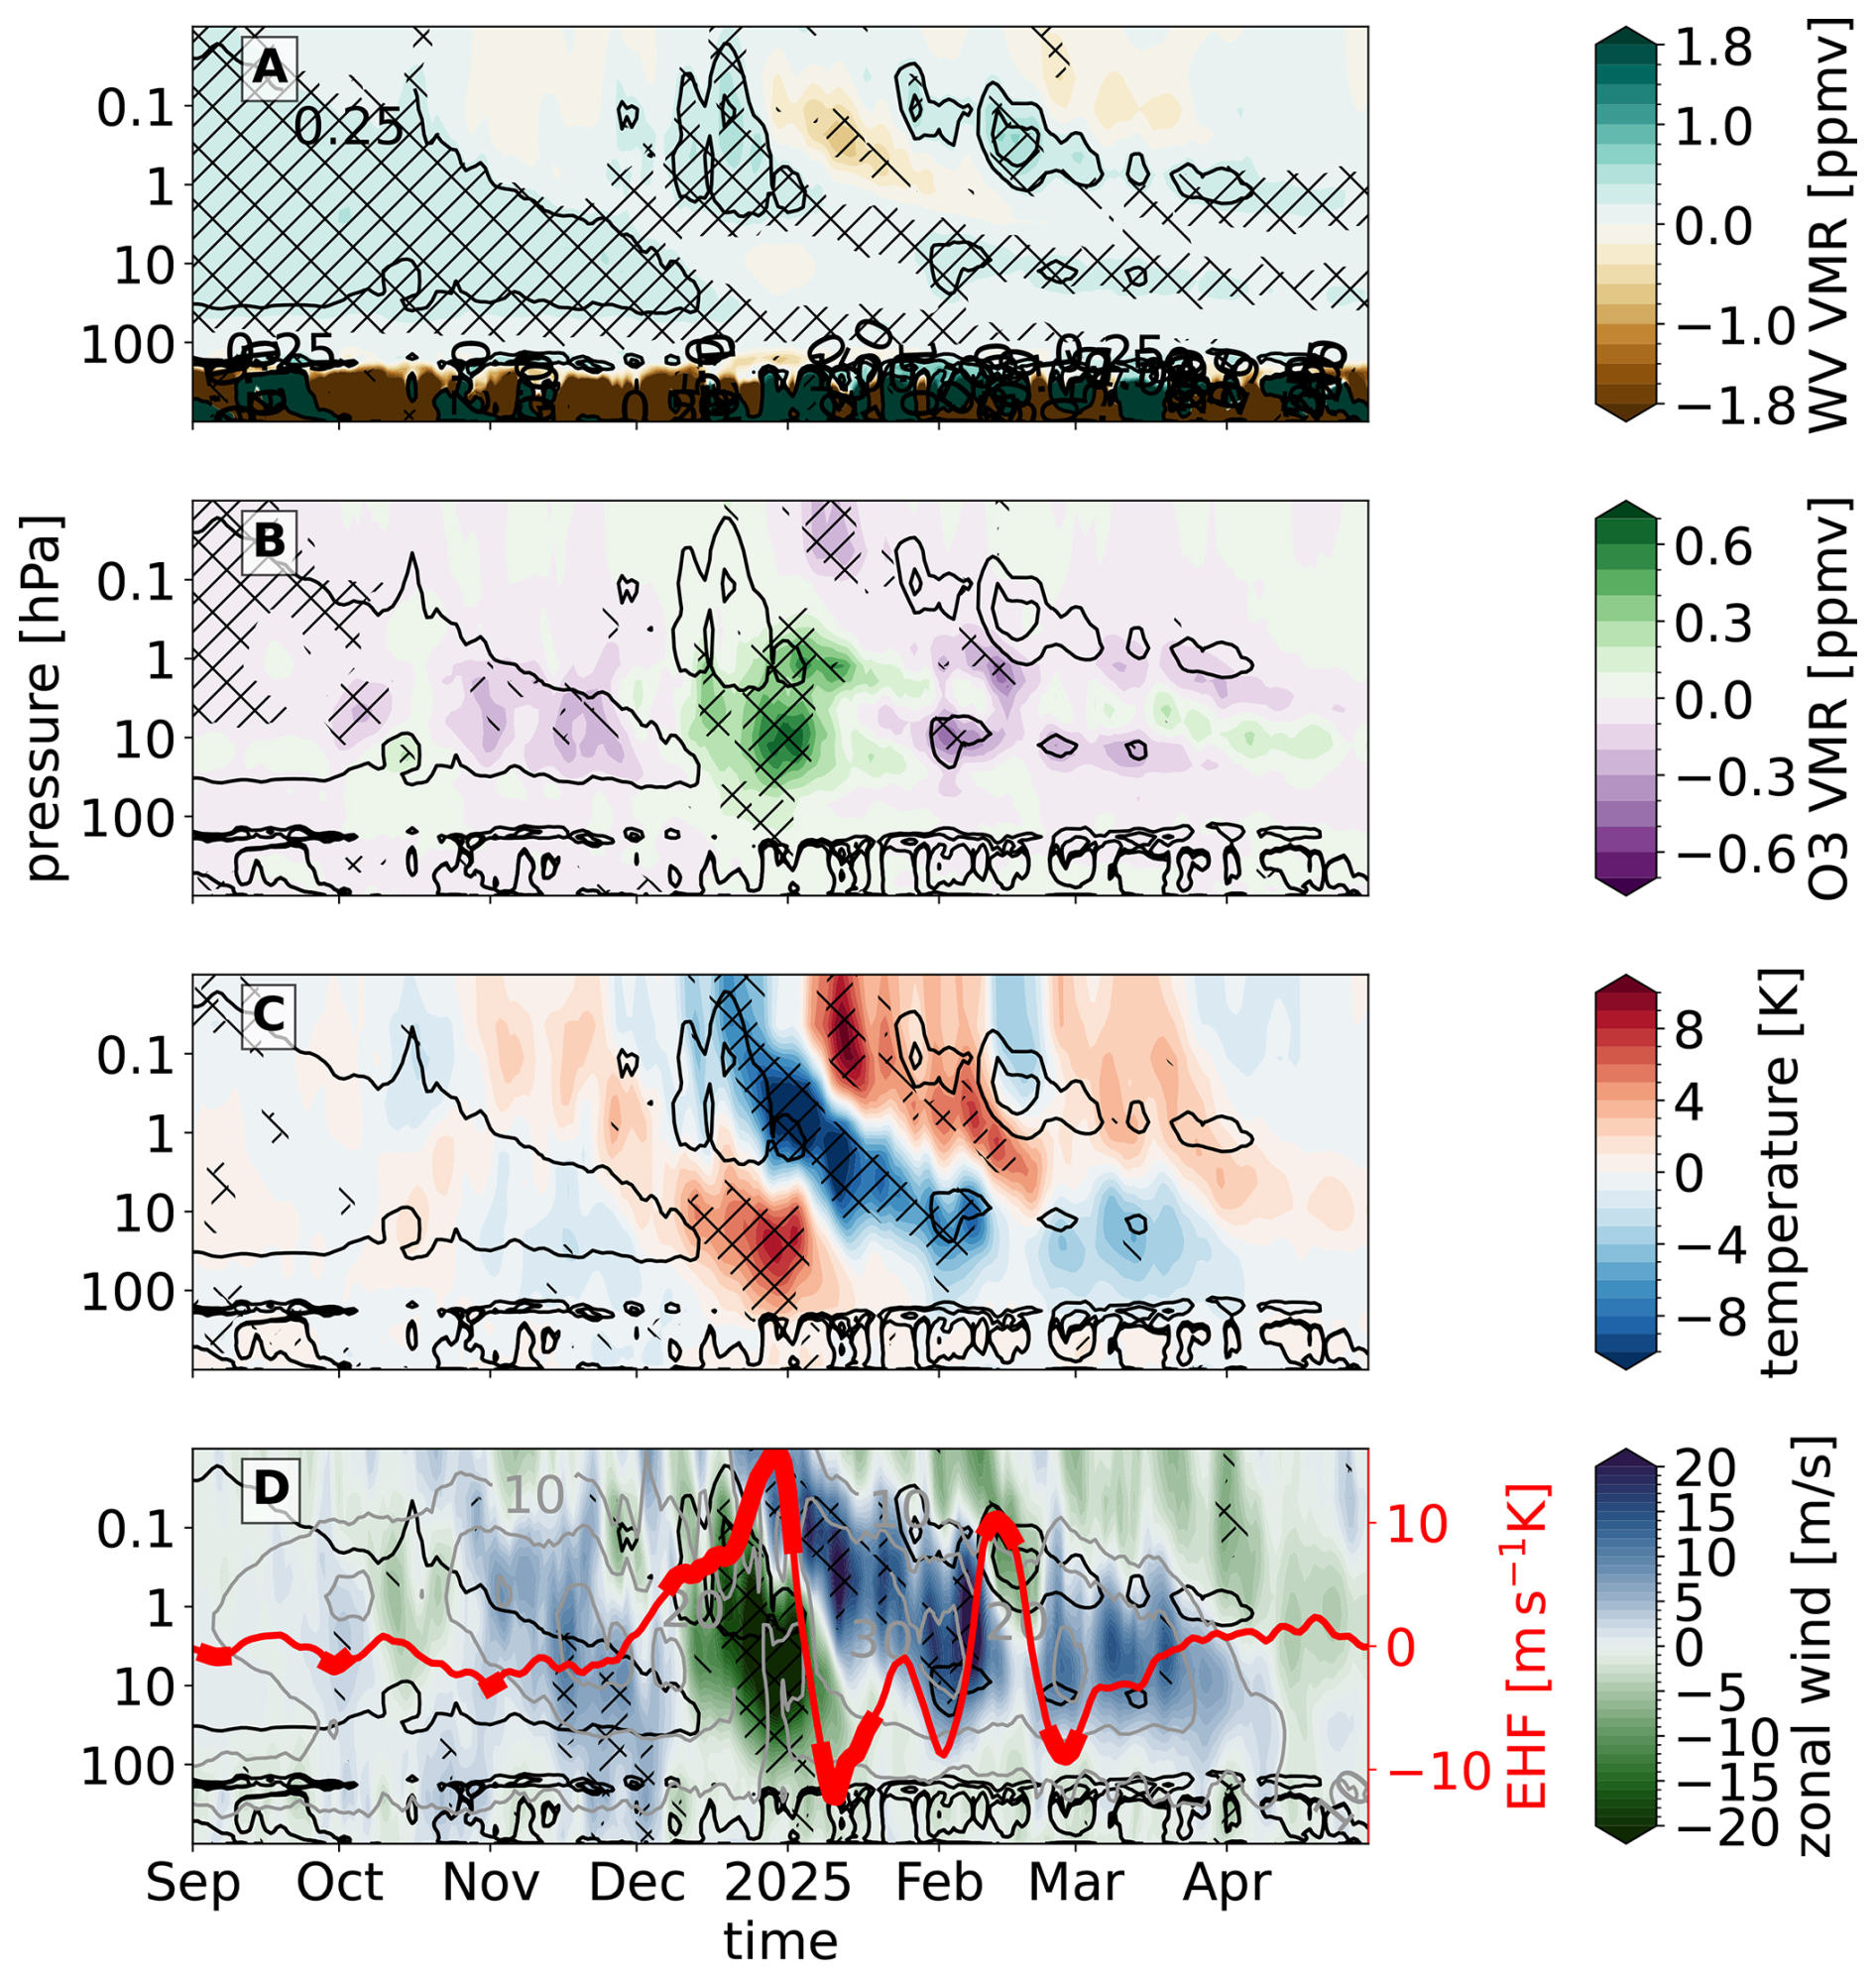
As for MW2, we find similar “tongues” of WV and downward propagation of ozone in the SOCOLv4 simulations for MW3 (see Fig. 6). Here, however, the excess of WV only yields up to 0.25 ppmv, and thus a much smaller magnitude compared to OW3 by MLS. This reduced WV forcing results only in a subtle cooling, which slightly strengthens the ZW, before they significantly weaken as a consequence of anomalously high EHF in December 2024 and the beginning of January 2025. This episode is followed by a recovery of SPV and collocated negative temperature anomaly propagating from the lower mesosphere to the lower stratosphere.
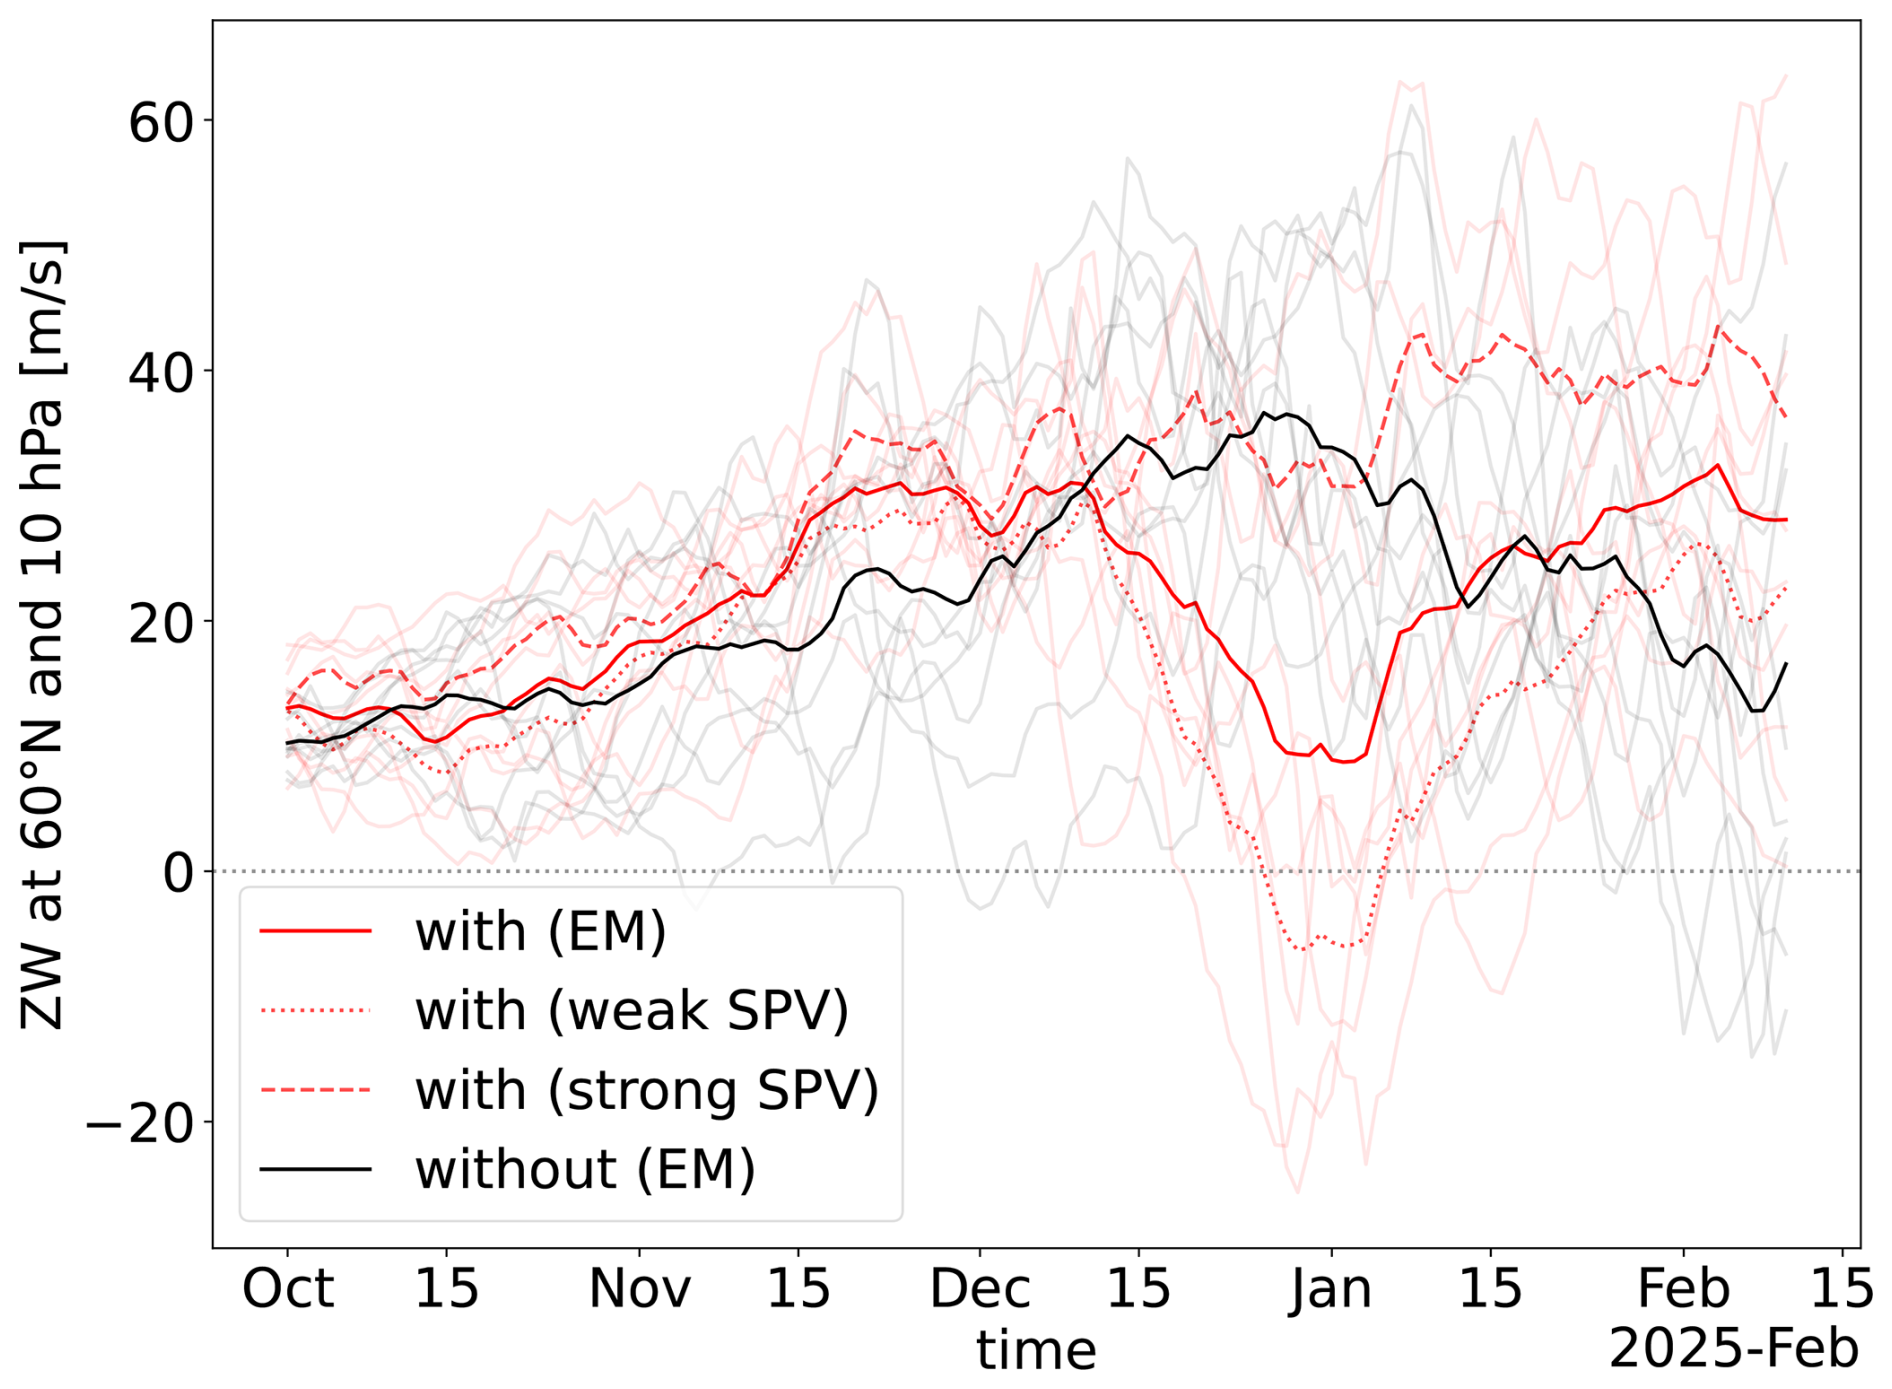
Figure 11Daily zonal-mean zonal wind at 10 hPa and 60° N based on the SOCOLv4 simulation with (ensemble mean (EM); red solid line) and without (black solid line) the HT forcing for the period 2024/2025 (MW3). The SOCOLv4 simulation with the HT forcing reveals two clusters: weak SPV (red dotted line) and strong SPV (red dashed line).
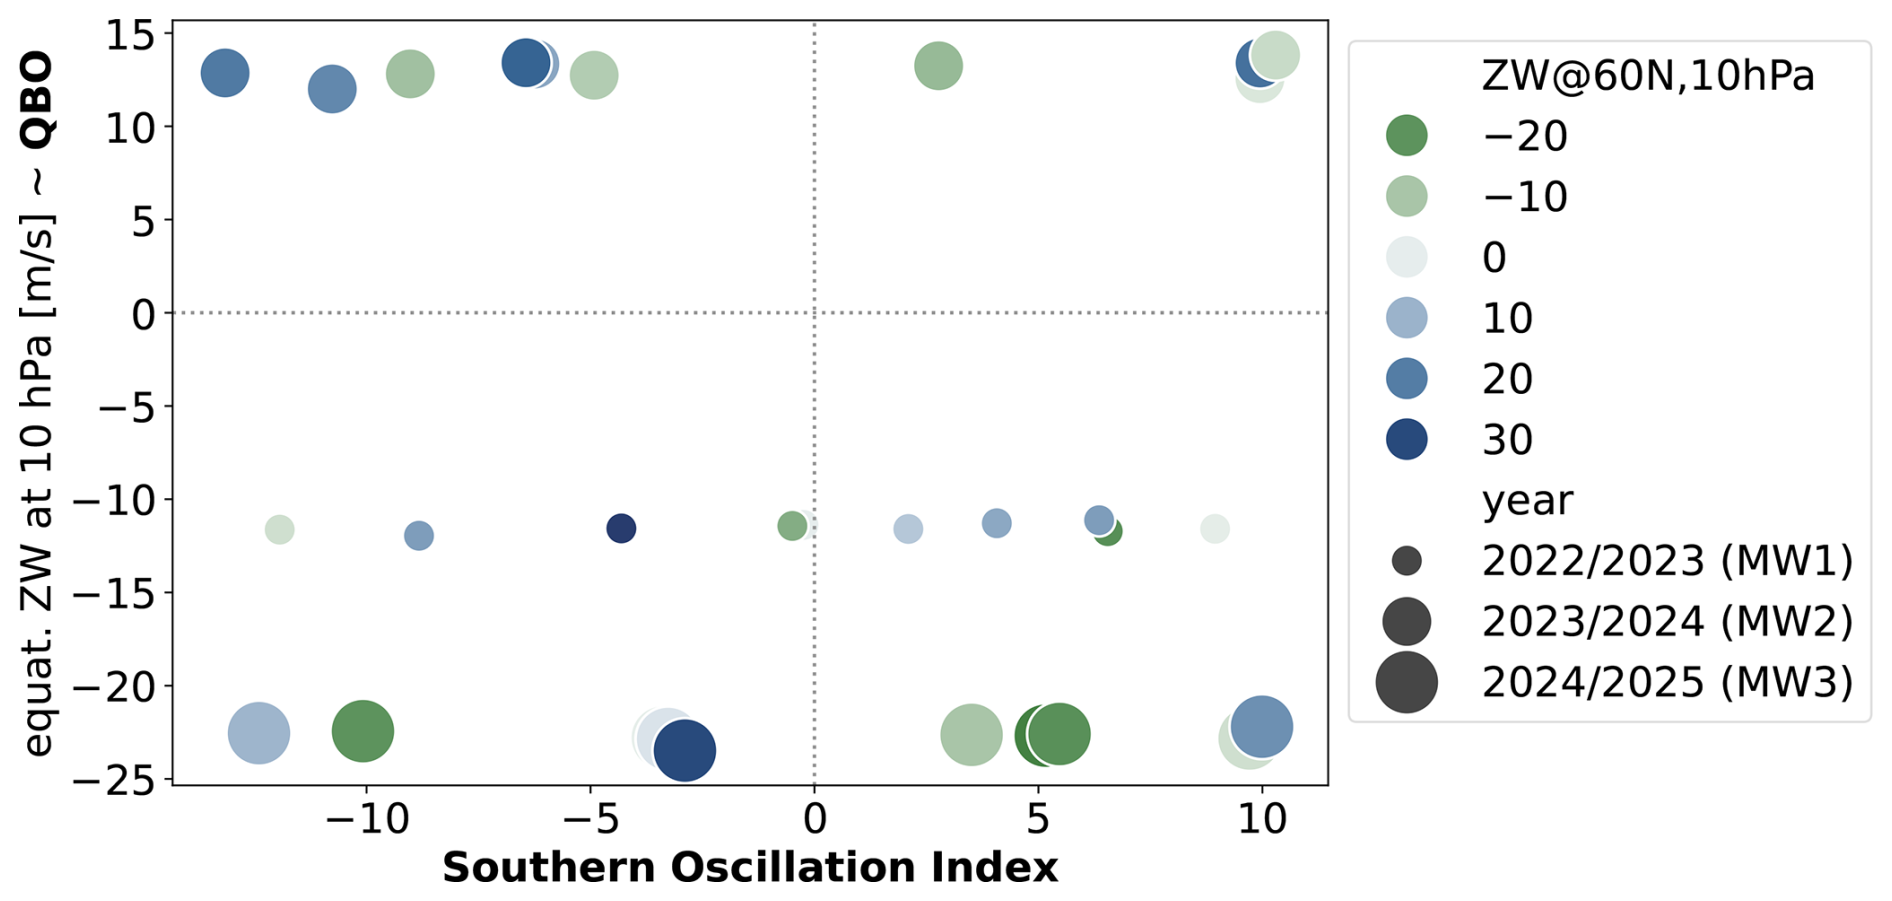
Figure 12Scatter plot of equatorial zonal wind at 10 hPa as a proxy for Quasi-biennial Oscillation (QBO) in SOCOLv4 and Southern Oscillation Index (SOI) in the simulation with the HT forcing averaged over SON. Individual dots correspond to each of the 10 ensemble members in the corresponding year and zonal wind (ZW) anomalies at 60° N averaged over DJF.
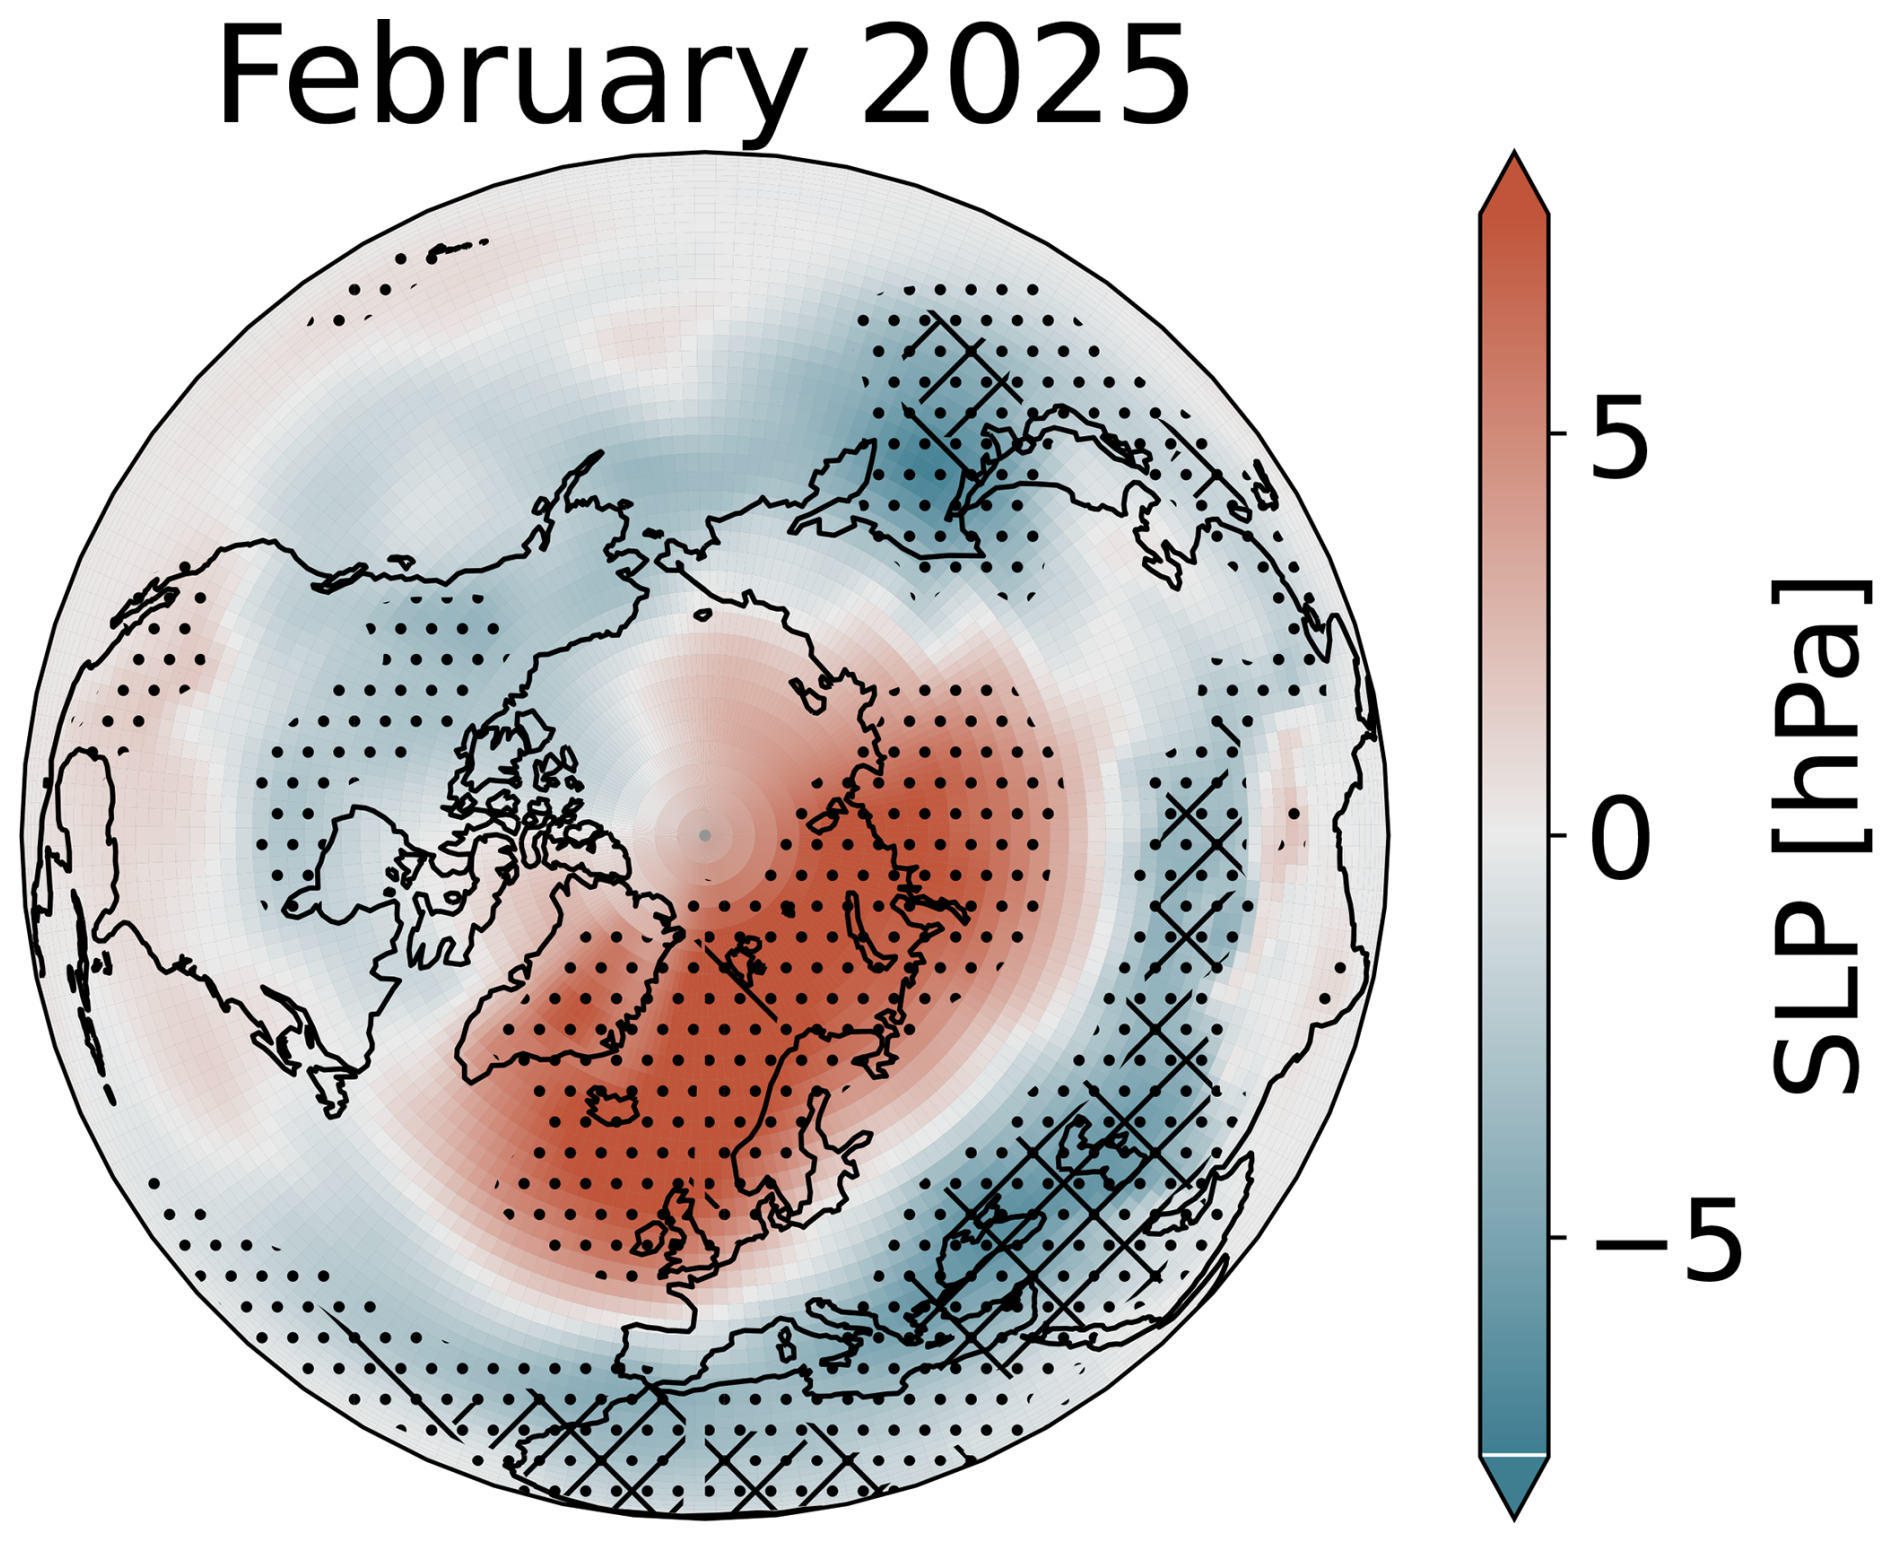
Figure 13Monthly anomaly of sea level pressure (SLP in hPa) in February 2025 (MW3). Anomalies are expressed as the difference between the SOCOLv4 simulation with and without the HT forcing. Dots … and hatching and show where the p-values of the t-test are <0.3 and <0.1 and <0.05, respectively.
The episode with the weakened ZW as a consequence of anomalously high EHF in December 2024 (MW3 in Fig. 6) and the beginning of January 2025 can be traced back to two main clusters of ensemble members in the simulations with the HT forcing (see Fig. 11). While one major cluster of 4 ensemble members (with mixed Southern Oscillation Index (SOI) preconditioning) strengthens SPV, the other cluster of 6 ensemble members (with mostly positive SOI (see Fig. 12) corresponding to La Niña preconditioning) weakens the stratospheric winds leading to the emergence of SSWs between December 2024 and January 2025. Considering the easterly phase of QBO at 10 hPa for MW3, we hypothesize that this may have preconditioned the latter cluster to a higher probability of weaker SPV or SSWs, respectively. Such interpretation is consistent with the observation that SSWs are more likely to occur during easterly QBO in tandem with either El Niño or La Niña conditions (Lee et al., 2025).
That said, the simulated equatorial winds in the westerly QBO phase during the early stage of MW2 (see Fig. 12) create conditions that favor a stronger SPV, consistent with the Holton–Tan mechanism (Holton and Tan, 1980). A similar configuration occurred in OW3, when the QBO was also in its westerly phase (https://www.climate.gov/news-features/blogs/polar-vortex/predicting-chances-polar-vortex-disruption-winter, last access: 22 October 2026). Since the QBO preconditioning is identical in both simulations (with and without the HT forcing) and ENSO is uniformly sampled in SOCOLv4, encompassing both El Niño (SOI<0) and La Niña (SOI>0; as ultimately observed in OW3), we infer that the forced SPV response in MW2 arises from the HT-induced WV compared to OW3 where perhaps both QBO and the HT forcing contributed to the stronger SPV.
From the SOCOLv4 ensemble, yielding one cluster with easterly QBO and La Nina conditions in MW3, we hypothesize that the winter 2025/2026 (OW4) bears an enhanced probability of SSW occurrence. As the associated wind pattern propagates downward, we consequently identify a SLP pattern characteristic of a weaker SPV, i.e., a positive SLP anomaly at the poles and a negative SLP anomaly at the mid-latitudes (see Fig. 13).
Our study addresses the question of whether the anomalously strong Northern Hemisphere stratospheric polar vortex of the boreal winter 2024/2025 has been linked to lingering dynamical and radiative impacts of the HT eruption. For this time period, satellite data show a coherent descent of HT-related water-vapour anomalies into the high-latitude stratosphere, collocated with a marked reduction in ozone and pronounced cold anomalies in the upper stratosphere and lower mesosphere. We detail that an ensemble of SOCOLv4 simulations, with the HT forcing, is able to reproduce the main spatial patterns of this WV plume and associated ozone response. Furthermore, through offline radiative transfer calculations, we show that the WV and ozone anomalies are, in combination, sufficient to generate substantial radiative cooling, which sharpens the meridional temperature gradient (see Fig. 14) and strengthens polar stratospheric westerly winds through thermal-wind balance.
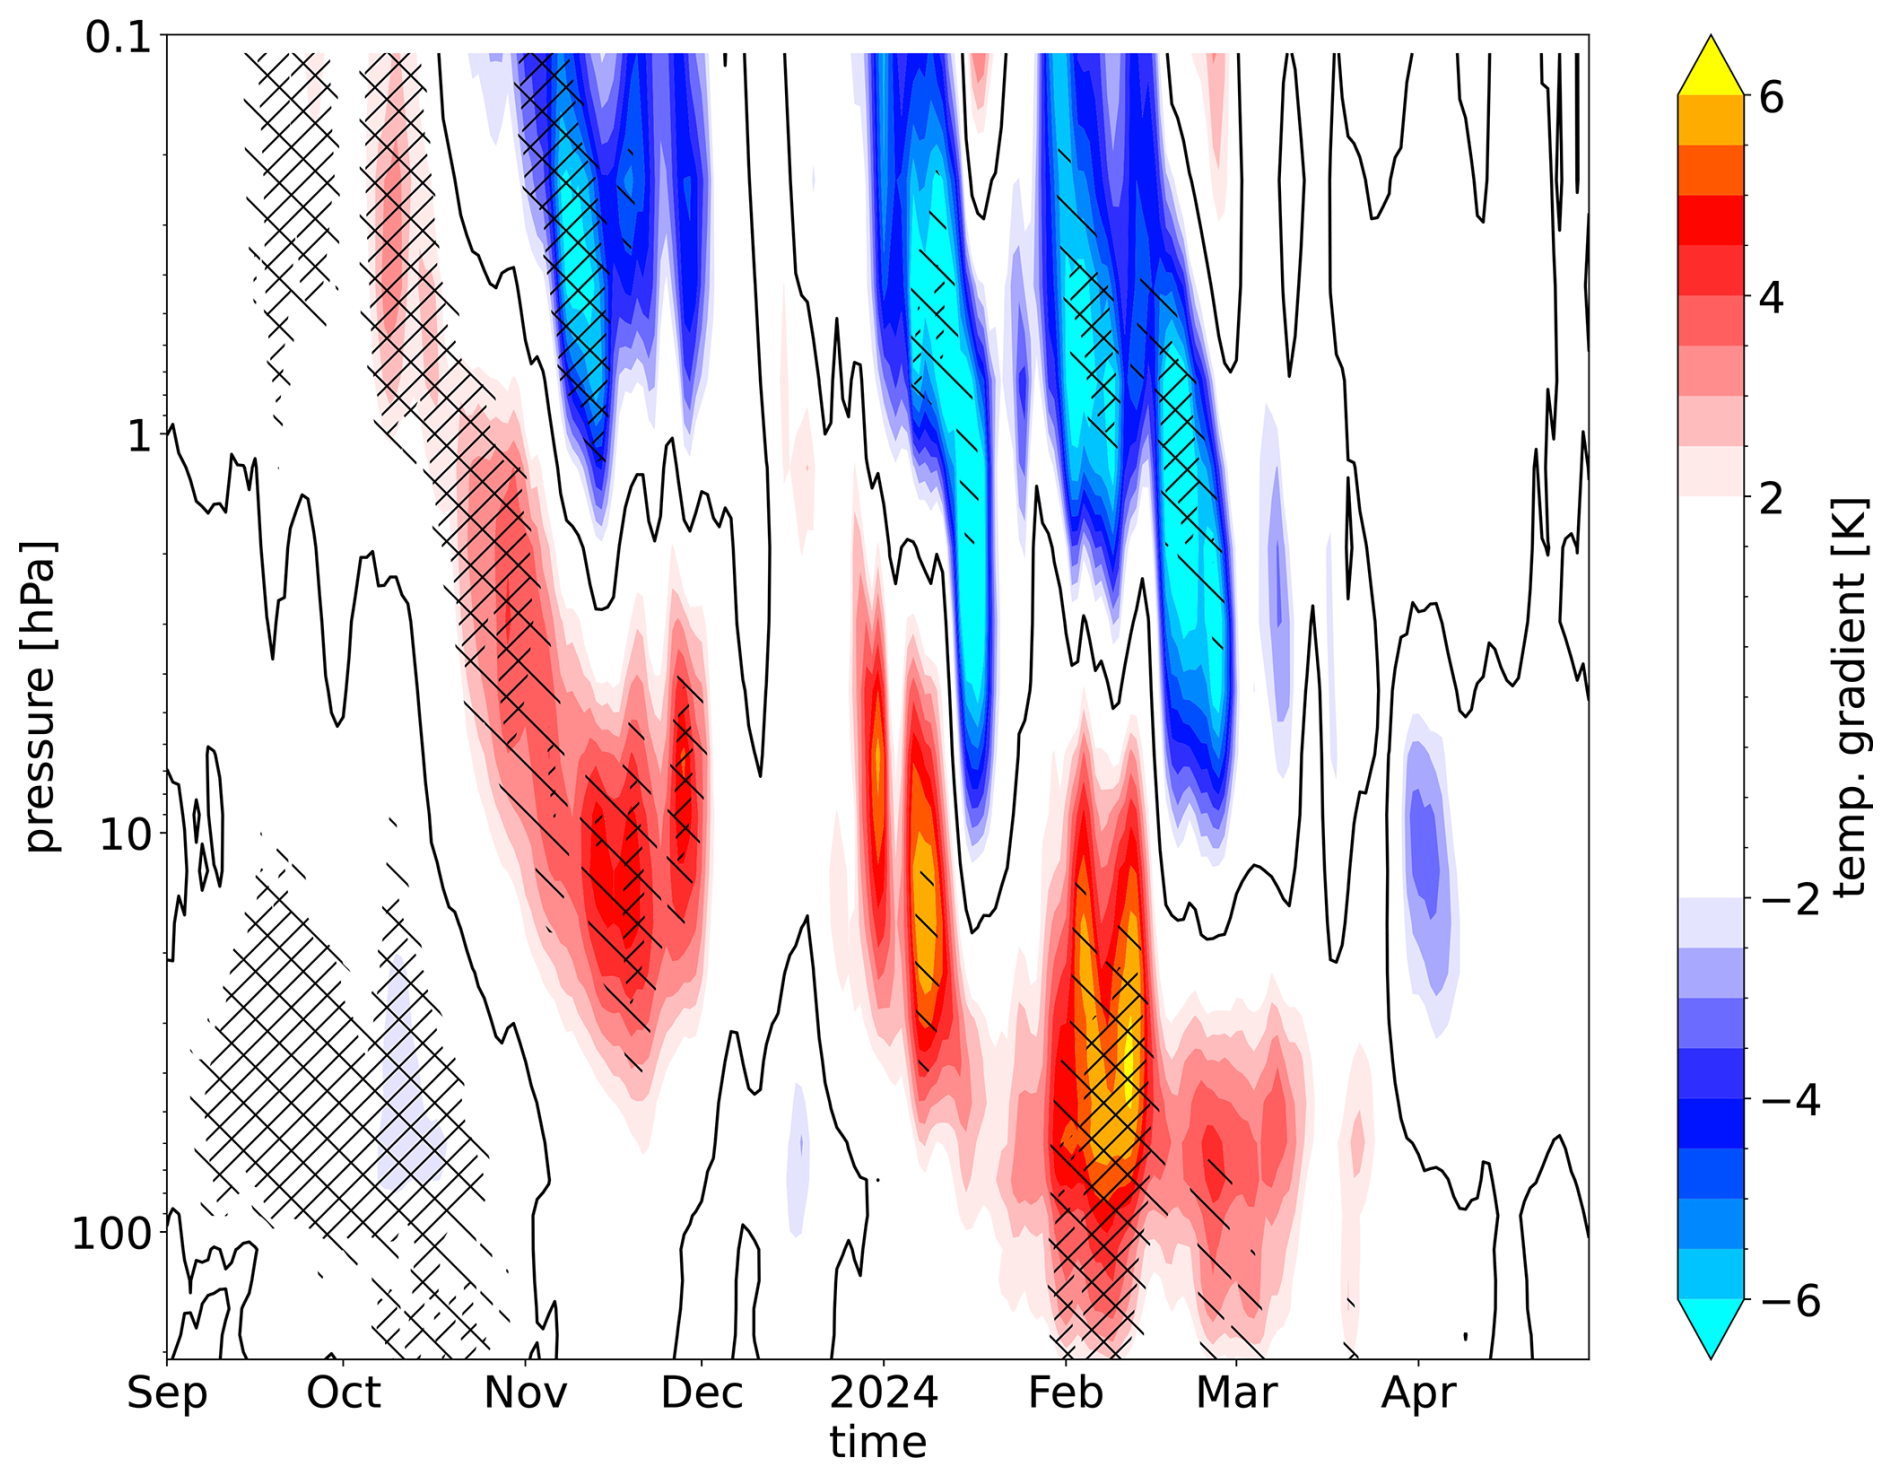
Figure 14As Fig. 5, but daily anomalies of the weighted meridional temperature gradient (K) between lower (0–20° N) and polar (60–90° N) latitude bands for the extended winter 2023/2024 (MW2) from SOCOLv4. Anomalies are calculated as the difference between the SOCOLv4 simulation with and without the HT forcing. Hatching and indicates where the p-values of the t-test are <0.1 and <0.05, respectively. Black contour line represents the zero anomaly.
The proposed mechanism, in which excess WV from HT and associated ozone changes drive radiative cooling that preconditions the polar vortex, is partly analogous to the well-documented Southern Hemisphere response to Antarctic ozone depletion in the lower stratosphere (Haase et al., 2020) and effects driven by energetic particle precipitation from mesospheric levels downward (Seppälä et al., 2025). Here, however, excess stratospheric WV from HT is considered as a joint driver together with slow Brewer–Dobson descent of the HT WV anomaly, enhanced HOx and ClOx chemistry leading to upper-stratospheric/mesospheric ozone loss, and the resulting longwave and shortwave cooling where WV and ozone anomalies overlap. This cooling at the high latitudes steepens the meridional temperature gradient and, via the thermal-wind balance, favours a strong-vortex regime. At the same time, the response is strongly nonlinear: early-autumn wave activity can still transiently weaken the vortex, but once the radiatively strengthened westerlies have reached critical strength, additional wave forcing shows limited impact.
Taken together, the observations and paired SOCOLv4 simulations support a probabilistic interpretation: HT-related WV and ozone anomalies increased the likelihood of a stronger polar vortex while internal variability remains too large to attribute the full evolution of the observed and simulated winters to the HT forcing. Negative ozone and temperature anomalies can also arise dynamically in other strong-vortex winters; the distinctive feature of OW3 is the statistically significant HT-related WV tongue, partly overlapping with these anomalies. The weaker and more variability-dominated MW3 response further indicates that both composition forcing and dynamical preconditioning matter.
Several limitations temper the interpretation and generality of these findings. For one thing, the too-fast transport in SOCOLv4 causes the model to simulate the analogous 2024/2025 winter approximately one year earlier. SOCOLv4 also underestimates the amplitude of the HT-induced WV anomaly when compared with satellite records, implying that our simulated radiative cooling and dynamical response are likely conservative. However, SOCOLv4 agrees well with other models (Zhuo et al., 2025) in terms of the water vapor e-folding time (cf. Kuchar et al., 2025, Appendix A1). Further, the radiative cooling and heating estimates rely on idealized offline calculations and thus cannot fully capture the coupling between radiation, atmospheric composition, and dynamics. In addition, our analysis is also based on a single model with a specific configuration (Sukhodolov et al., 2021, and references therein). Also, internal variability associated with ENSO and other tropospheric sources of internal variability may be only partially sampled by 10 ensemble members (e.g. Bittner et al., 2016a; Bednarz et al., 2026). On the other hand, a sufficiently strong (volcanic) forcing can produce a robust, stronger-than-average NH polar vortex (Bittner et al., 2016b).
Despite these caveats, our findings support the view that HT-induced WV and ozone anomalies have become an important multi-year driver of high-latitude winter variability. In fact, our current study and previous research detail a clear dichotomy: manifesting on the early-time scale as SPV weakening (Kuchar et al., 2025) and on the long-time scale as SPV strengthening. Furthermore, our ensemble simulations indicated that as the WV plume continues to descend and QBO/ENSO conditions evolve, the balance between strong-vortex winters and SSW-prone winters shifted once more in 2025/2026 because of the weaker WV forcing (see recent observed WV (less than 1 ppmv), ozone and temperature anomalies in Fig. 15), with corresponding impacts on surface patterns. More generally, unprecedented eruptions like HT may act as intermittent “sources of predictability” also called “windows of forecast opportunity” for polar winter circulation (Rupp et al., 2026, and references therein), albeit in a fundamentally probabilistic sense.
Future work should therefore (i) extend the analysis to coordinated multi-model HT experiments as in APARC (2025), (ii) investigate how volcanic moistening interacts with ongoing anthropogenic climate change to shape the statistics of SPV strength and SSW occurrence over the coming decades. Better constraining the structure and transport of the descending WV plume using MLS on NASA's Aura satellite may be problematic due to the “duty cycle” of the 190 GHz observations to conserve remaining life for these measurements. Its decommissioning will cause a substantial gap in the measurement of critical atmospheric components such as WV and poses significant challenges for continuous monitoring and assessment of the effects of future extreme events including volcanic eruptions (Salawitch et al., 2025). However, other satellite (Knowland et al., 2025; Himes et al., 2026) and ground-based (De Mazière et al., 2018) instruments can continue to monitor WV after Aura MLS, respectively.
SWOOSHv2.7 data can be downloaded from https://csl.noaa.gov/groups/csl8/swoosh/ (last access: 22 October 2026). The MERRA2 reanalysis dataset postprocessed by the NASA Ozone Watch can be downloaded for zonal wind and eddy heat flux from https://ozonewatch.gsfc.nasa.gov/meteorology/figures/merra2/wind/u60n_10_2024_merra2.txt (last access: 22 October 2026) and https://ozonewatch.gsfc.nasa.gov/meteorology/figures/merra2/heat_flux/vt45_75-45n_100_2024_merra2.txt (last access: 22 October 2026), respectively. Any direct access to full simulation data can be arranged by contacting the authors. The code that was used to produce all plots in this study is available via Zenodo (Kuchar et al., 2026, https://doi.org/10.5281/zenodo.21514652). All postprocessed data files for this study are provided via Mendeley Data (Kuchar, 2026, https://doi.org/10.17632/hb3whw3nfr.2).
The supplement related to this article is available online at https://doi.org/10.5194/acp-26-15479-2026-supplement.
AK designed the study. TS set up and carried out the model simulations. AK analysed the data. AK, BL, JKH, TS, MS, and AB curated the data. AK compiled the manuscript with inputs from all other authors.
The contact author has declared that none of the authors has any competing interests.
Publisher's note: Copernicus Publications remains neutral with regard to jurisdictional claims made in the text, published maps, institutional affiliations, or any other geographical representation in this paper. The authors bear the ultimate responsibility for providing appropriate place names. Views expressed in the text are those of the authors and do not necessarily reflect the views of the publisher.
Ales Kuchar, Bruno Lehner, Jessica Kult-Herdin, and Harald Rieder acknowledge support by the BOKU University. The simulations were performed at the ETH cluster EULER and the Swiss National Supercomputing Centre (CSCS) under project s1191.
ER has been supported by St. Petersburg State University under research grant 124032000025-1. MS was funded by the University of Graz, Graz, Austria. AB has been supported by the “Swiss H2O Hub for High-quality water vapor measurements from ground to space” project financed by GAW Switzerland. GC was funded by the European Union via the ERC Starting Grant (grant no. 101078127). TS acknowledges support from the Swiss National Science Foundation (grant no. 200020E_219166). GC acknowledges funding from the EU via the ERC Starting Grant 101078127. TS and GC acknowledge the Simons Foundation (grant no. SFI-MPS-SRM-00005208). Publisher's note: the article processing charges for this publication were not paid by a Russian or Belarusian institution.
This paper was edited by Matthew Toohey and reviewed by three anonymous referees.
Abalos, M., Birner, T., Chrysanthou, A., Davis, S., de la Cámara, A., Dhomse, S., Garny, H., Hegglin, M. I., Hubert, D., Ivaniha, O., Keeble, J., Linz, M., Minganti, D., Neu, J., Plummer, D., Saunders, L., Shah, K., Stiller, G., Tourpali, K., Waugh, D., Abraham, N. L., Akiyoshi, H., Chipperfield, M. P., Jöckel, P., Josse, B., Marchand, M., Martineau, P., Morgenstern, O., Sukhodolov, T., Watanabe, S., and Yamashita, Y.: Evaluation of stratospheric transport in three generations of Chemistry-Climate Models, Atmos. Chem. Phys., 26, 5249–5291, https://doi.org/10.5194/acp-26-5249-2026, 2026. a
Andrews, D. G. and McIntyre, M. E.: JR Holton, and CB Leovy, 1987: Middle Atmosphere Dynamics, Academic Press Inc. (London) Ltd., ISBN 0-12-058575-8, 1987. a
APARC: The Hunga Volcanic Eruption Atmospheric Impacts Report, APARC Report 11, World Climate Research Programme (WCRP), wCRP Report 10/2025, https://doi.org/10.34734/FZJ-2025-05237, 2025. a, b, c
Arsenovic, P., Damiani, A., Rozanov, E., Funke, B., Stenke, A., and Peter, T.: Reactive nitrogen (NOy) and ozone responses to energetic electron precipitation during Southern Hemisphere winter, Atmos. Chem. Phys., 19, 9485–9494, https://doi.org/10.5194/acp-19-9485-2019, 2019. a
Bednarz, E. M., Butler, A. H., Wang, X., Zhuo, Z., Yu, W., Stenchikov, G., Toohey, M., and Zhu, Y.: Indirect climate impacts of the Hunga eruption, Atmos. Chem. Phys., 26, 197–215, https://doi.org/10.5194/acp-26-197-2026, 2026. a, b, c
Bell, A., Murk, A., and Stober, G.: Radiative impact of increased middle atmospheric water vapour in the aftermath of the Hunga 2022 volcanic eruption at two locations in the Northern Hemisphere, EGUsphere [preprint], https://doi.org/10.5194/egusphere-2025-1396, 2025. a
Bittner, M., Schmidt, H., Timmreck, C., and Sienz, F.: Using a large ensemble of simulations to assess the Northern Hemisphere stratospheric dynamical response to tropical volcanic eruptions and its uncertainty, Geophys. Res. Lett., 43, 9324–9332, https://doi.org/10.1002/2016GL070587, 2016a. a
Bittner, M., Timmreck, C., Schmidt, H., Toohey, M., and Krüger, K.: The impact of wave-mean flow interaction on the Northern Hemisphere polar vortex after tropical volcanic eruptions, J. Geophys. Res.-Atmos., 121, 5281–5297, https://doi.org/10.1002/2015JD024603, 2016b. a
Bloxam, K. and Huang, Y.: Radiative Relaxation Time Scales Quantified from Sudden Stratospheric Warmings, J. Atmos. Sci., 78, 269–286, https://doi.org/10.1175/JAS-D-20-0015.1, 2021. a, b, c
Brasseur, G. P. and Solomon, S.: Aeronomy of the middle atmosphere: Chemistry and physics of the stratosphere and mesosphere, Vol. 32, Springer Science & Business Media, ISBN 978-1-4020-3284-4, 2005. a
Charney, J. G. and Drazin, P. G.: Propagation of planetary-scale disturbances from the lower into the upper atmosphere, J. Geophys. Res., 66, 83–109, 1961. a
Clough, S. A. and Iacono, M. J.: Line-by-line calculation of atmospheric fluxes and cooling rates: 2. Application to carbon dioxide, ozone, methane, nitrous oxide and the halocarbons, J. Geophys. Res.-Atmos., 100, 16519–16535, 1995. a
Dacie, S., Kluft, L., Schmidt, H., Stevens, B., Buehler, S. A., Nowack, P. J., Dietmüller, S., Abraham, N. L., and Birner, T.: A 1D RCE Study of Factors Affecting the Tropical Tropopause Layer and Surface Climate, J. Climate, 32, 6769–6782, https://doi.org/10.1175/JCLI-D-18-0778.1, 2019. a
Davis, S. M., Rosenlof, K. H., Hassler, B., Hurst, D. F., Read, W. G., Vömel, H., Selkirk, H., Fujiwara, M., and Damadeo, R.: The Stratospheric Water and Ozone Satellite Homogenized (SWOOSH) database: a long-term database for climate studies, Earth Syst. Sci. Data, 8, 461–490, https://doi.org/10.5194/essd-8-461-2016, 2016a. a
Davis, S. M., Rosenlof, K. H., Hassler, B., Hurst, D. F., Read, W. G., Vömel, H., Selkirk, H., Fujiwara, M., and Damadeo, R.: The Stratospheric Water and Ozone Satellite Homogenized (SWOOSH) database: a long-term database for climate studies, Earth Syst. Sci. Data, 8, 461–490, https://doi.org/10.5194/essd-8-461-2016, 2016b. a
De Mazière, M., Thompson, A. M., Kurylo, M. J., Wild, J. D., Bernhard, G., Blumenstock, T., Braathen, G. O., Hannigan, J. W., Lambert, J.-C., Leblanc, T., McGee, T. J., Nedoluha, G., Petropavlovskikh, I., Seckmeyer, G., Simon, P. C., Steinbrecht, W., and Strahan, S. E.: The Network for the Detection of Atmospheric Composition Change (NDACC): history, status and perspectives, Atmos. Chem. Phys., 18, 4935–4964, https://doi.org/10.5194/acp-18-4935-2018, 2018. a
Dietmüller, S., Eichinger, R., Garny, H., Birner, T., Boenisch, H., Pitari, G., Mancini, E., Visioni, D., Stenke, A., Revell, L., Rozanov, E., Plummer, D. A., Scinocca, J., Jöckel, P., Oman, L., Deushi, M., Kiyotaka, S., Kinnison, D. E., Garcia, R., Morgenstern, O., Zeng, G., Stone, K. A., and Schofield, R.: Quantifying the effect of mixing on the mean age of air in CCMVal-2 and CCMI-1 models, Atmos. Chem. Phys., 18, 6699–6720, https://doi.org/10.5194/acp-18-6699-2018, 2018. a
Evan, S., Brioude, J., Rosenlof, K. H., Gao, R.-S., Portmann, R. W., Zhu, Y., Volkamer, R., Lee, C. F., Metzger, J.-M., Lamy, K., Walter, P., Alvarez, S. L., Flynn, J. H., Asher, E., Todt, M., Davis, S. M., Thornberry, T., Vömel, H., Wienhold, F. G., Stauffer, R. M., Millán, L., Santee, M. L., Froidevaux, L., and Read, W. G.: Rapid ozone depletion after humidification of the stratosphere by the Hunga Tonga Eruption, Science, 382, eadg2551, https://doi.org/10.1126/science.adg2551, 2023. a
Fleming, E. L., Newman, P. A., Liang, Q., and Oman, L. D.: Stratospheric Temperature and Ozone Impacts of the Hunga Tonga-Hunga Ha'apai Water Vapor Injection, J. Geophys. Res.-Atmos., 129, e2023JD039298, https://doi.org/10.1029/2023JD039298, 2024. a, b, c
Funke, B., López-Puertas, M., Stiller, G. P., and von Clarmann, T.: Mesospheric and stratospheric NOy produced by energetic particle precipitation during 2002–2012, J. Geophys. Res.-Atmos., 119, 4429–4446, https://doi.org/10.1002/2013JD021404, 2014. a
Gelaro, R., McCarty, W., Suárez, M. J., Todling, R., Molod, A., Takacs, L., Randles, C. A., Darmenov, A., Bosilovich, M. G., Reichle, R., Wargan, K., Coy, L., Cullather, R., Draper, C., Akella, S., Buchard, V., Conaty, A., da Silva, A. M., Gu, W., Kim, G.-K., Koster, R., Lucchesi, R., Merkova, D., Nielsen, J. E., Partyka, G., Pawson, S., Putman, W., Rienecker, M., Schubert, S. D., Sienkiewicz, M., and Zhao, B.: The Modern-Era Retrospective Analysis for Research and Applications, Version 2 (MERRA-2), J. Climate, 30, 5419–5454, https://doi.org/10.1175/JCLI-D-16-0758.1, 2017. a
Haase, S., Fricke, J., Kruschke, T., Wahl, S., and Matthes, K.: Sensitivity of the Southern Hemisphere circumpolar jet response to Antarctic ozone depletion: prescribed versus interactive chemistry, Atmos. Chem. Phys., 20, 14043–14061, https://doi.org/10.5194/acp-20-14043-2020, 2020. a
Himes, M. D., Kramarova, N. A., Wargan, K., Davis, S. M., and Jaross, G.: Continuing the MLS water vapor record with OMPS LP using neural networks, Atmos. Meas. Tech., 19, 3601–3624, https://doi.org/10.5194/amt-19-3601-2026, 2026. a
Holton, J. R. and Tan, H.-C.: The influence of the equatorial quasi-biennial oscillation on the global circulation at 50 mb, J. Atmos. Sci., 37, 2200–2208, 1980. a, b
Imanova, A., Egorova, T., Zubov, V., Mironov, A., Polyakov, A., Nerobelov, G., and Rozanov, E.: Seasonal Cycle of the Total Ozone Content over Southern High Latitudes in the CCM SOCOLv3, Atmosphere, 16, https://doi.org/10.3390/atmos16101172, 2025. a
Jenkins, S., Smith, C., Allen, M., and Grainger, R.: Tonga eruption increases chance of temporary surface temperature anomaly above 1.5 °C, Nat. Clim. Change, 13, 127–129, 2023. a
Joshi, M. M., Charlton, A. J., and Scaife, A. A.: On the influence of stratospheric water vapor changes on the tropospheric circulation, Geophys. Res. Lett., 33, https://doi.org/10.1029/2006GL025983, 2006. a
Jucker, M.: Scaling of Eliassen-Palm flux vectors, Atmos. Sci. Lett., 22, e1020, https://doi.org/10.1002/asl.1020, 2021. a
Keeble, J., Braesicke, P., Abraham, N. L., Roscoe, H. K., and Pyle, J. A.: The impact of polar stratospheric ozone loss on Southern Hemisphere stratospheric circulation and climate, Atmos. Chem. Phys., 14, 13705–13717, https://doi.org/10.5194/acp-14-13705-2014, 2014. a
Kluft, L., Dacie, S., Buehler, S. A., Schmidt, H., and Stevens, B.: Re-Examining the First Climate Models: Climate Sensitivity of a Modern Radiative–Convective Equilibrium Model, J. Climate, 32, 8111–8125, https://doi.org/10.1175/JCLI-D-18-0774.1, 2019. a
Knowland, K. E., Wales, P. A., Wargan, K., Weir, B., Pawson, S., Damadeo, R., and Flittner, D.: Stratospheric Water Vapor Beyond NASA's Aura MLS: Assimilating SAGE III/ISS Profiles for a Continued Climate Record, Geophys. Res. Lett., 52, e2024GL112610, https://doi.org/10.1029/2024GL112610, 2025. a
Kramarova, N. and Lait, L. R.: NASA Ozone Watch: 2025 Antarctic MERRA-2 Wind, https://ozonewatch.gsfc.nasa.gov/meteorology/ozone_2024_MERRA2_NH.html (last access: 19 December 2025), 2025. a
Kroll, C. A. and Schmidt, A.: Indirect stratospheric moisture increase after a Pinatubo-magnitude eruption can be comparable to direct increase after 2022 Hunga, Commun. Earth Environ., 5, 497, https://doi.org/10.1038/s43247-024-01651-w, 2024. a
Kroll, C. A., Dacie, S., Azoulay, A., Schmidt, H., and Timmreck, C.: The impact of volcanic eruptions of different magnitude on stratospheric water vapor in the tropics, Atmos. Chem. Phys., 21, 6565–6591, https://doi.org/10.5194/acp-21-6565-2021, 2021. a
Kuchar, A.: Accompanying data to “Modulation of the Northern polar vortex by the Hunga Tonga-Hunga Ha'apai eruption and associated surface response” and “Was the strengthening of the Northern polar vortex in 2024/2025 associated with the Hunga Tonga eruption?”, Mendeley Data [data set], https://doi.org/10.17632/hb3whw3nfr.2, 2026. a
Kuchar, A., Sukhodolov, T., Chiodo, G., Jörimann, A., Kult-Herdin, J., Rozanov, E., and Rieder, H. H.: Modulation of the northern polar vortex by the Hunga Tonga–Hunga Ha'apai eruption and the associated surface response, Atmos. Chem. Phys., 25, 3623–3634, https://doi.org/10.5194/acp-25-3623-2025, 2025. a, b, c, d, e, f, g, h, i
Kuchar, A., Lehner, B., and Kult-Herdin, J.: boku-met/HTHH_strengthening: First release of our code repository related to HT-induced SPV strengthening, Zenodo [code], https://doi.org/10.5281/zenodo.21514652, 2026. a
Lawrence, Z. D., Perlwitz, J., Butler, A. H., Manney, G. L., Newman, P. A., Lee, S. H., and Nash, E. R.: The Remarkably Strong Arctic Stratospheric Polar Vortex of Winter 2020: Links to Record-Breaking Arctic Oscillation and Ozone Loss, J. Geophys. Res.-Atmos., 125, e2020JD033271, https://doi.org/10.1029/2020JD033271, 2020. a
Lee, S. H., Butler, A. H., and Manney, G. L.: Two major sudden stratospheric warmings during winter 2023/2024, Weather, 80, 45–53, https://doi.org/10.1002/wea.7656, 2025. a, b
Livesey, N., Read, W., Wagner, P., Santee, M., Froidevaux, L., Schwartz, M., Lambert, A., Millan, L., Werner, F., Pumphrey, H., Manney, G., Fuller, R., Jarnot, R., Knosp, B., and Vuu, B. C.: Earth Observing System (EOS) Aura Microwave Limb Sounder (MLS) Version 6.0x Level-2 and Level-3 data quality and description document, https://doi.org/10.5067/AURA/MLS/DOC/v6_dataqualitydocument, 2026. a
Manney, G. L., Santee, M. L., Rex, M., Livesey, N. J., Pitts, M. C., Veefkind, P., Nash, E. R., Wohltmann, I., Lehmann, R., Froidevaux, L., Poole, L. R., Schoeberl, M. R., Haffner, D. P., Davies, J., Dorokhov, V., Gernandt, H., Johnson, B., Kivi, R., Kyrö, E., Larsen, N., Levelt, P. F., Makshtas, A., McElroy, C. T., Nakajima, H., Parrondo, M. C., Tarasick, D. W., von der Gathen, P., Walker, K. A., and Zinoviev, N. S.: Unprecedented Arctic ozone loss in 2011, Nature, 478, 469–475, https://doi.org/10.1038/nature10556, 2011. a
Manzini, E., Steil, B., Brühl, C., Giorgetta, M. A., and Krüger, K.: A new interactive chemistry-climate model: 2. Sensitivity of the middle atmosphere to ozone depletion and increase in greenhouse gases and implications for recent stratospheric cooling, J. Geophys. Res.-Atmos., 108, https://doi.org/10.1029/2002JD002977, 2003. a
Matthias, V., Dörnbrack, A., and Stober, G.: The extraordinarily strong and cold polar vortex in the early northern winter 2015/2016, Geophys. Res. Lett., 43, 12287–12294, https://doi.org/10.1002/2016GL071676, 2016. a
Maycock, A. C., Joshi, M. M., Shine, K. P., and Scaife, A. A.: The Circulation Response to Idealized Changes in Stratospheric Water Vapor, J. Climate, 26, 545–561, https://doi.org/10.1175/JCLI-D-12-00155.1, 2013. a
Millán, L., Santee, M. L., Lambert, A., Livesey, N. J., Werner, F., Schwartz, M. J., Pumphrey, H. C., Manney, G. L., Wang, Y., Su, H., Wu, L., Read, W. G., and Froidevaux, L.: The Hunga Tonga-Hunga Ha'apai Hydration of the Stratosphere, Geophys. Res. Lett., 49, e2022GL099381, https://doi.org/10.1029/2022GL099381, 2022. a
Millán, L., Read, W. G., Santee, M. L., Lambert, A., Manney, G. L., Neu, J. L., Pitts, M. C., Werner, F., Livesey, N. J., and Schwartz, M. J.: The Evolution of the Hunga Hydration in a Moistening Stratosphere, Geophys. Res. Lett., 51, e2024GL110841, https://doi.org/10.1029/2024GL110841, 2024. a, b
Newman, P. A., Nash, E. R., and Rosenfield, J. E.: What controls the temperature of the Arctic stratosphere during the spring?, J. Geophys. Res.-Atmos., 106, 19999–20010, https://doi.org/10.1029/2000JD000061, 2001. a
Niemeier, U., Wallis, S., Timmreck, C., van Pham, T., and von Savigny, C.: How the Hunga Tonga—Hunga Ha'apai Water Vapor Cloud Impacts Its Transport Through the Stratosphere: Dynamical and Radiative Effects, Geophys. Res. Lett., 50, e2023GL106482, https://doi.org/10.1029/2023GL106482, 2023. a
Plumb, R. A.: On the seasonal cycle of stratospheric planetary waves, Pure Appl. Geophys., 130, 233–242, 1989. a
Proud, S. R., Prata, A. T., and Schmauß, S.: The January 2022 eruption of Hunga Tonga-Hunga Ha'apai volcano reached the mesosphere, Science, 378, 554–557, https://doi.org/10.1126/science.abo4076, 2022. a
Randel, W. J., Podglajen, A., and Wu, F.: Stratospheric Transit Time Distributions Derived From Satellite Water Vapor Measurements, J. Geophys. Res.-Atmos., 129, e2024JD041595, https://doi.org/10.1029/2024JD041595, 2024a. a
Randel, W. J., Wang, X., Starr, J., Garcia, R. R., and Kinnison, D.: Long-Term Temperature Impacts of the Hunga Volcanic Eruption in the Stratosphere and Above, Geophys. Res. Lett., 51, e2024GL111500, https://doi.org/10.1029/2024GL111500, 2024b. a, b
Rieder, H., Kult-Herdin, J., Polvani, L. M., Solomon, S., and Kuchar, A.: Are springtime Arctic ozone columns predictable from wintertime conditions?, Front. Earth Sci., 13, 1610651, https://doi.org/10.3389/feart.2025.1610651, 2025. a
Rupp, P., Spaeth, J., and Birner, T.: A spread-versus-error framework to reliably quantify the potential for subseasonal windows of forecast opportunity, Weather Clim. Dynam., 7, 767–785, https://doi.org/10.5194/wcd-7-767-2026, 2026. a
Salawitch, R. J., Smith, J. B., Selkirk, H., Wargan, K., Chipperfield, M. P., Hossaini, R., Levelt, P. F., Livesey, N. J., McBride, L. A., Millán, L. F., Moyer, E., Santee, M. L., Schoeberl, M. R., Solomon, S., Stone, K., and Worden, H. M.: The Imminent Data Desert: The Future of Stratospheric Monitoring in a Rapidly Changing World, B. Am. Meteorol. Soc., 106, E540–E563, https://doi.org/10.1175/BAMS-D-23-0281.1, 2025. a
Schoeberl, M. R., Wang, Y., Ueyama, R., Dessler, A., Taha, G., and Yu, W.: The Estimated Climate Impact of the Hunga Tonga-Hunga Ha'apai Eruption Plume, Geophys. Res. Lett., 50, e2023GL104634, https://doi.org/10.1029/2023GL104634, 2023. a
Schoeberl, M. R., Toohey, M., Wang, Y., and Ueyama, R.: Stratospheric Injection Lifetimes, J. Geophys. Res.-Atmos., 130, e2025JD043928, https://doi.org/10.1029/2025JD043928, 2025. a
Scott, R. and Haynes, P.: The seasonal cycle of planetary waves in the winter stratosphere, J. Atmos. Sci., 59, 803–822, 2002. a
Seabrook, M., Smith, D. M., Dunstone, N. J., Eade, R., Hermanson, L., Scaife, A. A., and Hardiman, S. C.: Opposite Impacts of Interannual and Decadal Pacific Variability in the Extratropics, Geophys. Res. Lett., 50, e2022GL101226, https://doi.org/10.1029/2022GL101226, 2023. a
Seppälä, A., Kalakoski, N., Verronen, P. T., Marsh, D. R., Karpechko, A. Y., and Szelag, M. E.: Polar mesospheric ozone loss initiates downward coupling of solar signal in the Northern Hemisphere, Nat. Commun., 16, 748, https://doi.org/10.1038/s41467-025-55966-z, 2025. a
Stenchikov, G., Ukhov, A., and Osipov, S.: Modeling the Radiative Forcing and Atmospheric Temperature Perturbations Caused by the 2022 Hunga Volcano Explosion, J. Geophys. Res.-Atmos., 130, e2024JD041940, https://doi.org/10.1029/2024JD041940, 2025. a
Stenke, A., Schraner, M., Rozanov, E., Egorova, T., Luo, B., and Peter, T.: The SOCOL version 3.0 chemistry–climate model: description, evaluation, and implications from an advanced transport algorithm, Geosci. Model Dev., 6, 1407–1427, https://doi.org/10.5194/gmd-6-1407-2013, 2013. a
Stocker, M., Steiner, A. K., Ladstädter, F., Foelsche, U., and Randel, W. J.: Strong persistent cooling of the stratosphere after the Hunga eruption, Commun. Earth Environ., 5, 450, https://doi.org/10.1038/s43247-024-01620-3, 2024. a
Sukhodolov, T., Egorova, T., Stenke, A., Ball, W. T., Brodowsky, C., Chiodo, G., Feinberg, A., Friedel, M., Karagodin-Doyennel, A., Peter, T., Sedlacek, J., Vattioni, S., and Rozanov, E.: Atmosphere–ocean–aerosol–chemistry–climate model SOCOLv4.0: description and evaluation, Geosci. Model Dev., 14, 5525–5560, https://doi.org/10.5194/gmd-14-5525-2021, 2021. a, b, c, d
Vömel, H., Evan, S., and Tully, M.: Water vapor injection into the stratosphere by Hunga Tonga-Hunga Ha'apai, Science, 377, 1444–1447, https://doi.org/10.1126/science.abq2299, 2022. a
Waters, J. W., Froidevaux, L., Harwood, R. S., Jarnot, R. F., Pickett, H. M., Read, W. G., Siegel, P. H., Cofield, R. E., Filipiak, M. J., Flower, D. A., Holden, J. R., Lau, G. K., Livesey, N. J., Manney, G. L., Pumphrey, H. C., Santee, M. L., Wu, D. L., Cuddy, D. T., Lay, R. R., Loo, M. S., Perun, V. S., Schwartz, M. J., Stek, P. C., Thurstans, R. P., Boyles, M. A., Chandra, K. M., Chavez, M. C., Gun-Shing Chen and Chudasama, B. V., Dodge, R., Fuller, R. A., Girard, M. A., Jiang, J. H., Jiang, Y., Knosp, B. W., LaBelle, R. C., Lam, J. C., Lee, K. A., Miller, D., Oswald, J. E., Patel, N. C., Pukala, D. M., Quintero, O., Scaff, D. M., Van Snyder, W., Tope, M. C., Wagner, P. A., and Walch, M. J.: The earth observing system microwave limb sounder (EOS MLS) on the Aura satellite, IEEE T. Geosci. Remote Sens., 44, 1075–1092, 2006. a
Young, P. J., Butler, A. H., Calvo, N., Haimberger, L., Kushner, P. J., Marsh, D. R., Randel, W. J., and Rosenlof, K. H.: Agreement in late twentieth century Southern Hemisphere stratospheric temperature trends in observations and CCMVal-2, CMIP3, and CMIP5 models, J. Geophys. Res.-Atmos., 118, 605–613, https://doi.org/10.1002/jgrd.50126, 2013. a
Zhou, X., Dhomse, S. S., Feng, W., Mann, G., Heddell, S., Pumphrey, H., Kerridge, B. J., Latter, B., Siddans, R., Ventress, L., Querel, R., Smale, P., Asher, E., Hall, E. G., Bekki, S., and Chipperfield, M. P.: Antarctic Vortex Dehydration in 2023 as a Substantial Removal Pathway for Hunga Tonga-Hunga Ha'apai Water Vapor, Geophys. Res. Lett., 51, e2023GL107630, https://doi.org/10.1029/2023GL107630, 2024. a, b
Zhu, Y., Akiyoshi, H., Aquila, V., Asher, E., Bednarz, E. M., Bekki, S., Brühl, C., Butler, A. H., Case, P., Chabrillat, S., Chiodo, G., Clyne, M., Colarco, P. R., Dhomse, S., Falletti, L., Fleming, E., Johnson, B., Jörimann, A., Kovilakam, M., Koren, G., Kuchar, A., Lebas, N., Liang, Q., Liu, C.-C., Mann, G., Manyin, M., Marchand, M., Morgenstern, O., Newman, P., Oman, L. D., Østerstrøm, F. F., Peng, Y., Plummer, D., Quaglia, I., Randel, W., Rémy, S., Sekiya, T., Steenrod, S., Sukhodolov, T., Tilmes, S., Tsigaridis, K., Ueyama, R., Visioni, D., Wang, X., Watanabe, S., Yamashita, Y., Yu, P., Yu, W., Zhang, J., and Zhuo, Z.: Hunga Tonga–Hunga Ha′apai Volcano Impact Model Observation Comparison (HTHH-MOC) project: experiment protocol and model descriptions, Geosci. Model Dev., 18, 5487–5512, https://doi.org/10.5194/gmd-18-5487-2025, 2025. a
Zhuo, Z., Wang, X., Zhu, Y., Yu, W., Bednarz, E. M., Fleming, E., Colarco, P. R., Watanabe, S., Plummer, D., Stenchikov, G., Randel, W., Bourassa, A., Aquila, V., Sekiya, T., Schoeberl, M. R., Tilmes, S., Zhang, J., Kushner, P. J., and Pausata, F. S. R.: Comparing multi-model ensemble simulations with observations and decadal projections of upper atmospheric variations following the Hunga eruption, Atmos. Chem. Phys., 25, 13161–13176, https://doi.org/10.5194/acp-25-13161-2025, 2025. a, b