
the Creative Commons Attribution 4.0 License.
the Creative Commons Attribution 4.0 License.
 | 29 Oct 2026
Comparative nitrogen speciation in marine and coastal urban aerosols of the Greater Bay Area and implications for PM2.5-bound nitrogen deposition
Wei Chen
Xu Yu
Wing Hei Marco Wong
Ningning Sun
Kun Zhang
Weicong Cheng
Jianping Gan

We present a summer 2024 comparative study of aerosol nitrogen speciation in the Guangdong–Hong Kong–Macau Greater Bay Area (GBA), examining how nitrogen abundance and chemical composition vary between coastal urban air and adjacent marine air, and their implications for nitrogen deposition. Concurrent shipboard and urban observations from 12 July to 3 August 2024 included bulk inorganic nitrogen (IN) and organic nitrogen (ON) measurements in PM2.5 and offline aerosol mass spectrometry (AMS) of water extracts. Regional mean PM2.5-bound total nitrogen and IN concentrations increased from western to eastern coastal waters, reflecting both spatial and temporal variability. Bulk PM2.5-bound ON concentrations decreased offshore by 12.2 % per 10 km, with estimates ranging from 10.1 % to 14.2 % across sensitivity analyses. Beyond these concentration patterns, AMS mass spectra revealed contrasting nitrogen chemistry. Water extracts of urban PM2.5 exhibited higher ratios than marine PM2.5 extracts (7.9 ± 2.6 versus 5.4 ± 1.2) and more pronounced organic nitrate-related fragments. These complementary signatures indicate more prominent organic-nitrate-related oxidized-N functionality in urban PM2.5, consistent with NOx–VOC photochemistry at the urban site. Four ship-influenced samples showed enhanced imidazole-like fragment signatures, identifying an additional compositional feature warranting targeted investigation. Estimated PM2.5-bound nitrogen dry-deposition fluxes were 0.036 and 0.040 mg N m−2 d−1 for marine and coastal urban environments, respectively, with overlapping model-sensitivity ranges. These results demonstrate a notable coastal transition in nitrogen chemical form and suggest that ON speciation should be considered when modelling nitrogen deposition to coastal waters and assessing potential ecosystem responses.
- Article
(5924 KB) - Full-text XML
-
Supplement
(4013 KB) - BibTeX
- EndNote


Atmospheric aerosol nitrogen plays a critical role in marine nutrient cycles and coastal air quality, particularly over the coastal and offshore areas strongly influenced by both continental outflows and local emissions (Jickells et al., 2013; Mahowald et al., 2017; Luo et al., 2018). Reactive nitrogen species emitted from combustion, agriculture, and natural sources, such as soils, lightning, and the ocean, can undergo atmospheric transformations and eventually deposit on terrestrial and aquatic ecosystems (Palta and Hartnett, 2018; Galloway et al., 2008). Their deposition rates depend strongly on chemical speciation and physical phase. In coastal and ocean regions, atmospheric deposition of reactive nitrogen can stimulate phytoplankton productivity, but excessive nitrogen inputs may also promote eutrophication, harmful algal blooms (HAB), and the expansion of hypoxic dead zones (Howarth and Marino, 2006; Anderson et al., 2002; Diaz and Rosenberg, 2008; Lee et al., 2019; Yau et al., 2020). Meanwhile, ocean–atmosphere exchange processes (such as oceanic ammonia and amine emissions) feed back into the atmospheric nitrogen cycle, creating a tightly coupled land–atmosphere–ocean nitrogen budget (Paulot et al., 2015; Zhang et al., 2023).
Nitrate (NO) and ammonium (NH) are major components of aerosol inorganic nitrogen (IN). Their relative contributions depend on precursor emissions, atmospheric processing, gas–particle partitioning and particle size. Traditionally, nitrate (NO) was the dominant form of inorganic nitrogen (IN) in ambient particulate matter (PM), primarily linked to fossil fuel combustion and industrial NOx emissions. However, recent findings reveal a shifting chemical profile in southern China, where ammonium (NH), derived mainly from agricultural NHx (NH3 + NH), now exceeds NO as the major contributor to aerosol N. This transition is attributed to two concurrent trends: rising NH3 emissions due to intensified agricultural activities (e.g., fertilizer use, livestock waste), and declining NOx emissions following air pollution controls on coal combustion and industry (Zhang et al., 2024b).
Organic nitrogen (ON) is a significant but understudied contributor to the total reactive nitrogen budget, contributing approximately 25 %–30 % of total nitrogen deposition globally (Jickells et al., 2013; Duce et al., 2008). Atmospheric ON encompasses diverse compounds, including urea, amines, amino acids, amides, N-heterocyclics, nitroaromatic compounds, nitro-polycyclic aromatic hydrocarbons (nitro-PAHs), and organic nitrates (Yu et al., 2024). These compounds can be either directly emitted from biomass burning, fossil fuel combustion, marine biological activity, and soil sources or formed through atmospheric reactions of volatile organic compounds (VOCs) with nitrogen species such as NOx and . In marine and coastal atmospheres, the balance among marine emissions, transported terrestrial inputs, and secondary formation influences ON concentrations and contributions to total aerosol nitrogen (Jickells et al., 2013). For example, observations at Bermuda in the Atlantic Ocean linked marine aerosol ON to surface-ocean biological activity and wind-driven aerosol generation, supporting a marine biogenic source under remote marine conditions (Altieri et al., 2016). In coastal environments subject to substantial anthropogenic influence, the relative importance of these ON sources remains less well constrained.
The Guangdong–Hong Kong–Macau Greater Bay Area (GBA) is one of China's most densely populated and economically active urban clusters, comprising 11 core cities, including Guangzhou, Shenzhen, Hong Kong, and Macau. It occupies less than 1 % of China's land area but contributes over 10 % of its GDP (Zhang et al., 2020; Hui et al., 2020; Park and Song, 2021). Intensive industrial activity, vehicle traffic, and energy consumption make the GBA a hotspot for reactive nitrogen emissions. Its location along the South China Sea and frequent exposure to monsoonal flows provide opportunities to examine interactions between marine emissions and urban nitrogen pollution. However, observations of aerosol nitrogen species, especially over the GBA's coastal waters, remain very limited. Measurements of both IN and ON in marine and coastal air masses are therefore needed to characterize their transformations and assess their respective contributions to total nitrogen (TN) deposition in this dynamic environment.
To address these data gaps, we characterized marine nitrogenous aerosol composition using samples collected during a summer 2024 cruise campaign over GBA coastal waters and compared the observations with those from a coastal urban site in Hong Kong. Filter-based measurements were used to quantify IN and ON, water-soluble ions, and water-soluble total nitrogen, complemented by offline aerosol mass spectrometry (AMS) characterization of the water-extracted fraction. The objectives were to (1) characterize regional variations in bulk IN and ON concentrations and their within-day offshore associations, (2) compare the relative composition of N-containing organic fragments in PM2.5 water extracts from these contrasting environments using offline AMS measurements, and (3) estimate PM2.5-bound nitrogen dry-deposition fluxes and discuss their implications in the coastal GBA. Our observations provide new constraints on the spatial variability, chemical characteristics, and potential sources of aerosol nitrogen in the GBA, supporting assessment of nitrogen deposition in coastal megacity regions and representation of regional nitrogen budgets in chemical transport models.
2.1 Cruise campaign description
The cruise campaign was carried out from 12 July to 3 August 2024 over the GBA coastal waters (Nuruddin et al., 2026), as part of a broader interdisciplinary survey (Earth-HK, https://earthhk.hkust.edu.hk/, last access: 26 October 2026), which was designed to investigate the regional earth system of the GBA with an emphasis on coupled land–ocean–atmosphere processes. The overall campaign yielded a multidisciplinary dataset, including physical and biogeochemical oceanographic measurements and atmospheric observations. However, chlorophyll a responses to atmospheric nutrient inputs typically lag behind deposition, with the timing depending on regional and environmental conditions (Tan et al., 2011; Wang et al., 2012). Concurrent aerosol and seawater measurements along a moving cruise track were therefore unlikely to capture these delayed responses within the same water mass. Accordingly, we did not assess the relationship between biological responses and aerosol N. Instead, we focus on nitrogen speciation and chemical composition of aerosols collected over the GBA coastal waters during the cruise. The research vessel Lan Bo 3 departed from Hong Kong waters and sailed across three oceanic regions A, B, and C (Fig. 1). These regions were chosen to capture variations in air mass characteristics across the coastal waters, including relatively clean maritime background conditions, continental outflow, and regional shipping influence. The cruise track included several intersecting and partially overlapping transects within and between the three regions, reflecting practical navigation routes, transitions among sampling areas, and adjustments made to accommodate weather conditions and operational requirements.
The campaign took place under prevailing southwesterly monsoonal flow, with frequent air-mass transport over the South China Sea and episodic continental influence. This seasonal setting provided an opportunity to characterize aerosol chemical composition and nitrogen speciation over coastal waters influenced by both maritime transport and anthropogenic emissions from the surrounding coastal megacity cluster and shipping activity.
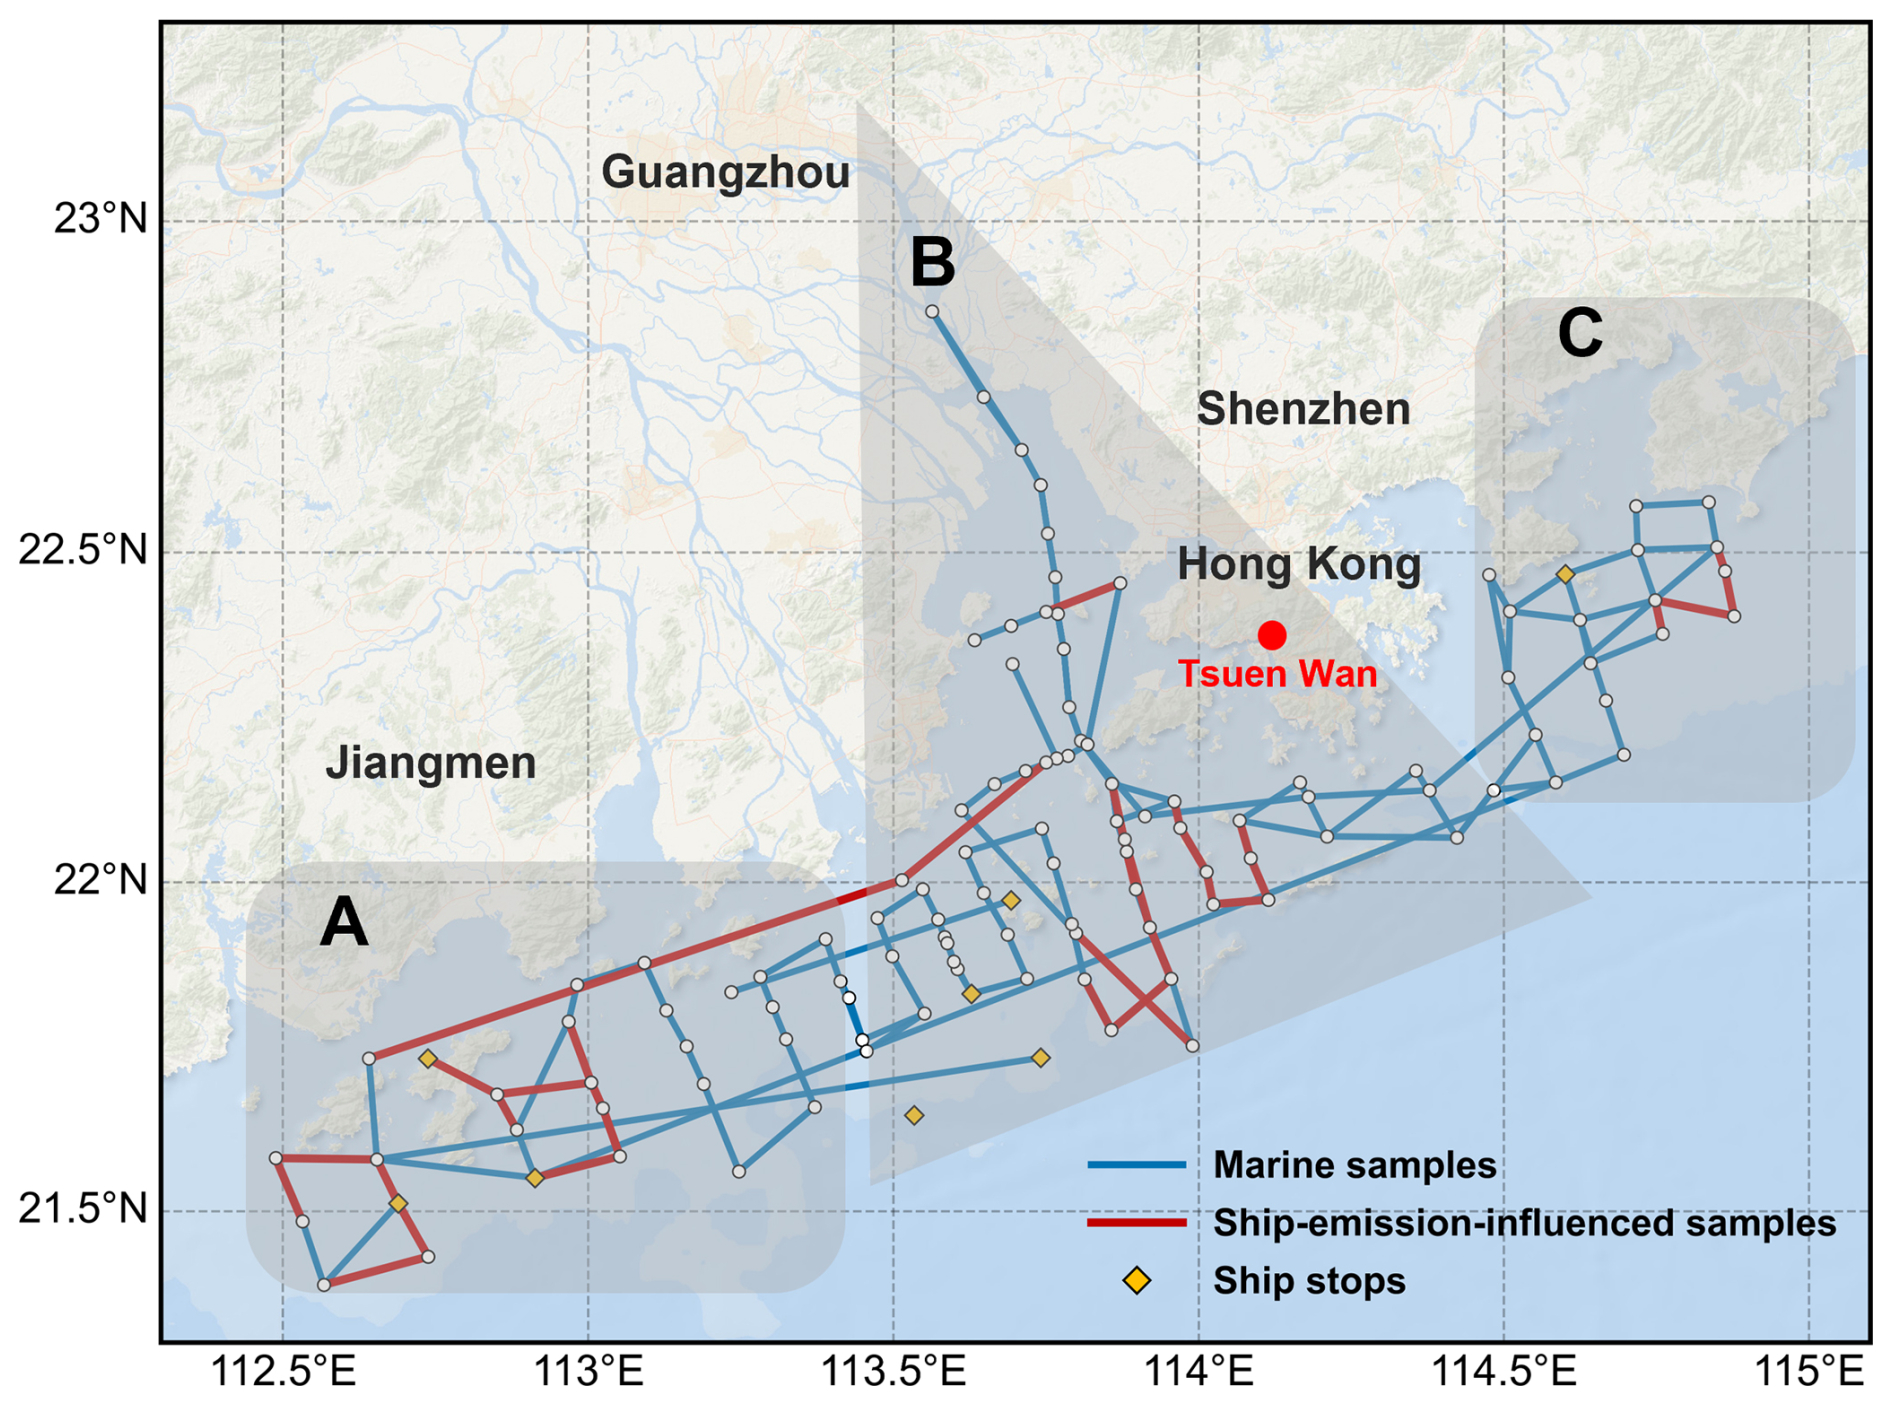
Figure 1Spatial distribution of cruise sampling routes in the GBA waters. Blue routes indicate marine samples retained for analysis, whereas red routes indicate samples identified as ship-emission-influenced. The red dot marks the Tsuen Wan coastal urban site in Hong Kong. White dots denote short ship stops (mainly for oceanographic experiments) when the high-volume air sampler was suspended, whereas yellow diamonds denote longer stationary or anchoring periods, including typhoon-related sheltering and other operational stops, during which sampling was maintained. The shaded areas labeled A–C define the three marine sampling regions used for regional comparison. Basemap source: Esri World Ocean Base; Esri, Garmin, GEBCO, NOAA NGDC, and other contributors | Powered by Esri.
2.2 Aerosol sample collection
A total of 91 ambient PM2.5 aerosol samples were collected over the GBA coastal waters during the cruise campaign, using a high-volume air sampler (1.13 m3 min−1; Thermo Fisher Scientific, USA). Aerosols were collected on prebaked quartz fiber filters (550 °C, 8 h). The sampler was mounted on the upper deck of the research vessel, with its location shown in Fig. S6, and was positioned away from exhaust outlets to minimize direct influence of ship emissions. Sampling was generally conducted while the cruise was underway and was suspended during designated short stops. It continued during some longer anchoring or stationary periods, including typhoon-related sheltering and other operational stops (Fig. 1, Table S11). All samples were subsequently screened for evident ship-emission influence using the NOx measurements described below. Sampling durations were selected to collect sufficient PM2.5 mass for subsequent chemical analysis and ranged from 1.2 to 17.1 h, averaging 3.8 ± 2.8 h. Immediately after collection, filters were wrapped in aluminum foil, sealed in airtight containers, and stored at −18 °C until analysis.
Despite these precautions, some samples may still have been influenced by ship emissions under certain wind conditions. To identify this influence, we operated a chemiluminescence NOx analyzer (model 42i-TL, Thermo Scientific, USA) with one-minute resolution throughout the campaign. The NOx analyzer was located on the second deck, while the high-volume sampler was installed on the third (uppermost) deck outside the bridge; their inlets were separated by approximately 2 m vertically and 10 m horizontally (Fig. S6). Given this close proximity, the NOx record served as a practical indicator of ship-exhaust influence on the concurrent PM2.5 samples. A filter sample was classified as ship-emission-influenced if NOx concentrations exceeded 100 ppb for at least 10 min during its sampling period. This criterion identified 16 of the 91 filters, leaving 75 samples for concentration analyses. Hereafter, “marine samples” refers to these 75 retained filters but does not imply complete absence of ship-emission influence. Independent carbonaceous measurements supported this operational separation: mean elemental carbon (EC) concentrations were significantly higher in the ship-influenced group than in the retained marine group (2.09 ± 2.94 versus 0.60 ± 0.57 µg m−3; two-sided Mann–Whitney p=0.016), as were organic carbon (OC), total carbon (TC) and water-soluble organic carbon (WSOC) concentrations (Sect. S1; Table S1; Fig. S7 in the Supplement). This screening identifies evident fresh ship-plume influence but may not exclude contributions from diluted, aged or regionally transported ship emissions in the retained marine samples.
In parallel, 23 daily PM2.5 samples were collected at the Tsuen Wan air quality monitoring station (22°22′18′′ N, 114°6′52′′ E) in Hong Kong between 12 July and 3 August 2024. This site represents a densely populated coastal urban environment affected by both local traffic emissions and regional transport (Chow et al., 2022). Sampling was conducted using the same type of high-volume air sampler and the same filter preparation protocol as those used for the cruise, ensuring methodological consistency between marine and urban measurements. The Tsuen Wan dataset enables direct comparison of aerosol composition between marine and urban environments in the GBA. Hourly concentrations of eight major water-soluble ions, including NO and NH, at Tsuen Wan were obtained using a Monitor for AeRosols and Gases in ambient Air (MARGA), as described in Sect. 2.3.2.
2.3 Chemical analysis
The collected PM2.5 samples were subjected to a suite of chemical analyses to determine their nitrogenous and carbonaceous components.
2.3.1 IN and ON determined by the aerosol nitrogen analyzer system
The concentrations of aerosol IN and ON were quantified using the thermal evolution–chemiluminescence method, following the protocol described by Yu et al. (2021). Briefly, filter punches were heated in an oxygen flow at stepwise increasing temperatures to release nitrogen-containing species in different volatility fractions. The evolved gases were split into two streams: one passed through a methanator, where CO2 was catalytically converted to CH4 for carbon quantification by a flame ionization detector; the other passed through a molybdenum catalytic converter, where various nitrogen oxides (NOy) were reduced to NO and subsequently detected by chemiluminescence using a NOx analyzer. IN (primarily nitrate and ammonium) was released at lower temperatures, while ON species were released at higher temperatures. Quantification of IN and ON was achieved by applying multivariate curve resolution (MCR) to the temperature-resolved carbon and nitrogen signals. Further details of the method and instrumentation are provided by Yu et al. (2021). Here, “bulk IN” and “bulk ON” refer to the fractions determined directly from filter punches without water extraction. Bulk ON therefore includes both water-soluble and water-insoluble organic nitrogen and is distinct from the N-containing organic fragment signals measured by offline AMS in water extracts. Bulk total nitrogen (TN) was calculated as the sum of IN and ON.
For marine samples, four 1 cm2 filter punches were combined for analysis. For this combined punch area, using the published N mass detection limit of 96 ng as a literature-based benchmark (Yu et al., 2021), an effective filter deposit area of 414 cm2, a sampling flow rate of 1.13 m3 min−1 and a mean sampling duration of 3.8 h, the estimated air-equivalent N detection limit was approximately 0.039 µg N m−3. The regional mean IN and ON concentrations exceeded this estimated benchmark. Relative measurement uncertainties of 8.4 % for IN and 14 % for ON were reported in the ambient-sample validation of this method (Yu et al., 2021).
2.3.2 Water-soluble ions determined by the IC
The eight major water-soluble inorganic ions (Na+, NH, K+, Mg2+, Ca2+, Cl−, NO, and SO) were determined in water extracts of the filter samples. A separate portion of each quartz filter was extracted in ultrapure water under ultrasonication. The extracts were filtered and analyzed using a Dionex ion chromatography (IC) system (Thermo Scientific, USA), which permitted paired anion and cation analyses without manual column exchange. Calibration was performed using multi-ion standards, and field blanks were processed alongside the samples for blank correction. The consistency of the measured ionic composition was further assessed through cation–anion equivalent balance calculations, as described in Sect. S2 (Table S2; Fig. S1).
At the Tsuen Wan urban site, aerosol-phase NO and NH concentrations were measured using a Monitor for AeRosols and Gases in ambient Air (MARGA, Metrohm Applikon), an online IC system operated at hourly resolution (Zhang and Yu, 2026). By collecting gases and particles separately into liquid solutions for prompt analysis, MARGA provides higher temporal resolution and reduces artifacts associated with prolonged filter collection and storage, including losses of semi-volatile ammonium nitrate (Zhang et al., 2026). MARGA measurements were therefore used to represent urban aerosol-phase inorganic ion concentrations. Nitrate and ammonium concentrations were converted to nitrogen-equivalent concentrations, expressed as NO–N and NH–N, using their respective nitrogen mass fractions. Urban filter–MARGA comparisons (Fig. S2) and sensitivity checks concerning marine sampling duration and temperature variability are presented in Sect. S2. Temperature-related variability in ambient nitrate partitioning is illustrated using hourly urban MARGA observations in Fig. S3.
2.3.3 Water-soluble carbon and nitrogen determined by the total organic carbon and total nitrogen (TOC/TN) analyzer
Another aliquot of each water extract was analyzed for WSOC and water-soluble total nitrogen (WSTN) using a Shimadzu TOC/TN analyzer (Shimadzu, Japan). The instrument quantifies WSOC by catalytic combustion and non-dispersive infrared detection of CO2, while WSTN is measured by chemiluminescence detection of NO formed after high-temperature combustion.
2.3.4 Determination of aerosol OC and EC using the OCEC analyzer
OC and EC were measured using a Desert Research Institute (DRI) Model 2001 thermal–optical carbon analyzer following the IMPROVE_A protocol (Chow et al., 2007). Filter punches were heated sequentially at 140, 280, 480 and 580 °C in a pure helium atmosphere, followed by heating at 580, 740 and 840 °C in a mixture of 2 % O2 and 98 % He. The thermal–optical reflectance (TOR) method was used to correct for pyrolytic conversion of OC during analysis and determine the OC–EC split. TC was calculated as the sum of OC and EC.
2.3.5 Offline AMS measurements
The offline AMS method used in this study was adapted from Daellenbach et al. (2016) and Vlachou et al. (2018), with minor modifications to the sample preparation and aerosolization processes. In brief, water extracts of PM2.5 filter samples (23 urban samples, 45 marine samples, and 4 ship-emission-influenced samples) were analyzed using a high-resolution time-of-flight aerosol mass spectrometer (HR-ToF-AMS). Each quartz filter sample was extracted with 15 mL of ultrapure water via ultrasonication. The water extracts were subsequently aerosolized using a custom-built atomizer optimized for small-volume nebulization. Ultra-high purity (UHP) argon gas served as the carrier gas and passed directly through the atomizer without additional air filtration. The argon flow entrained the aqueous extract, forming submicron droplets that were dried using a silica gel diffusion dryer to remove residual water content. The resulting dry particles were then introduced into the HR-ToF-AMS (operated in W-mode) for analysis. For each sample, mass spectra were recorded over an m/z range of 12–300, with a collection time of 60 s per spectrum. Between sample runs, ultrapure water was nebulized to assess system background and minimize potential memory effects. Field blanks were processed using the same protocol and showed signals comparable to those obtained from ultrapure water alone, consistent with low procedural background.
The HR-ToF-AMS characterized the non-refractory components of particles generated from the water extracts, with the vaporizer operated at 600 °C under a vacuum of ∼ 10−7 Torr. Because extraction recovery, nebulization, particle transmission and fragmentation affect the measured signals, the N-containing organic fragments were used to compare relative composition rather than to quantify bulk ON or water-soluble ON concentrations. These fragment signals are distinct from bulk ON measured directly on filter punches and WSTN measured in water extracts, the latter comprising both inorganic and organic nitrogen. Data analysis was conducted using fitting tools SQUIRREL (v1.62G) and PIKA (v1.22G) within the IGOR Pro software package (WaveMetrics Inc., Portland, OR, USA), following standard protocols as described by DeCarlo et al. (2006).
Characteristic fragment ions were used to infer the presence of reduced organic nitrogen classes (amines, amides, amino acids, and imidazole-like heterocycles) in the water extracts, based on reference spectra (Ge et al., 2024). Amines were associated with CnH2n+2N+ ions (e.g., CH4N+, C2H6N+, C3H8N+, and C4H10N+), while amides were characterized by CnH2nNO+ fragments (e.g., CH2NO+, C3H6NO+, and C4H8NO+), reflecting the –CONH– functional group. Amino acids were identified based on the concurrent presence of CH4NO+, C2H3NO+, and C2H4NO ions. Imidazole-like heterocycles were associated with CxHyN ions (e.g., C3H3N and C3H4N), characteristic of N-heterocyclic ring structures (Zhang et al., 2024a). Although individual fragments (e.g., CH4N+ and CH2NO+) may originate from multiple N-containing species, these diagnostic ions were interpreted together to support functional-group-level comparison of water-soluble reduced nitrogen, rather than definitive identification of individual compounds.
The signal ratio was used as a qualitative indicator of nitrate-related composition in the water extracts. This ratio has been widely applied to distinguish organic nitrates and nitro-compounds from inorganic nitrate, as oxidized ON species typically exhibit elevated values (∼ 8.6–15) (Ge et al., 2024; Farmer et al., 2010; Graeffe et al., 2023), whereas inorganic nitrate (e.g., NH4NO3) shows substantially lower ratios (∼ 2.4–2.7) (Bruns et al., 2010; Fry et al., 2009). The ratio was examined alongside signals assigned to CHNO and CH2NO at nominal m/z 75 and 76, respectively; CH2NO has previously been reported as an indicator of organic nitrates (Fry et al., 2011). These complementary spectral signatures were interpreted together to assess the relative prominence of oxidized organic-N signatures, particularly organic-nitrate-related functionality, across sample groups. This interpretation provides qualitative evidence of compositional differences, rather than a quantitative measure of organic-nitrate abundance or the mean oxidation state of bulk ON.
2.4 Aerosol N deposition calculation
The dry N deposition flux from PM2.5 was estimated by using the inferential method expressed in Eq. (1):
where F (mg N m−2 s−1) is the dry deposition flux of PM2.5-bound total nitrogen, Ca (mg N m−3) is the campaign-mean bulk TN concentration calculated as IN + ON, and Vd (m s−1) is the representative particle dry deposition velocity. Ca was from direct measurements, while Vd was estimated using the particle dry-deposition calculation method of Zhang et al. (2001), with representative particle and surface parameters for the marine and coastal urban environments (Sects. 3.4, S6). Fluxes calculated in mg N m−2 s−1 were multiplied by 86 400 to obtain mg N m−2 d−1. These estimates represent conditions during the summer campaign and were not annualized.
3.1 Spatial distribution of aerosol nitrogen and related species over the GBA waters
The regional patterns and within-day associations with offshore distance of bulk IN and ON over the GBA coastal waters are summarized in Fig. 2. Panel (a) presents the spatial distributions of IN and ON concentrations along the cruise track across three geographic regions: (A) western coastal waters west of the Pearl River Estuary, (B) the Pearl River Estuary, and (C) eastern coastal waters, including Mirs Bay and Daya Bay. Panels (b) and (c) show bulk IN and ON concentrations as percentage deviations from their respective same-day means, plotted against offshore distance relative to the same-day mean distance. Offshore distance was calculated as the shortest distance from each sample's representative position, defined as the midpoint of its sampling-start and sampling-end coordinates, to the mainland coastline, excluding islands (Sect. S3; Fig. S4). Distance bins are used only for visualization; statistical inference is based on individual log-transformed concentrations using a regression approach with sampling-day fixed effects (Sect. S4).
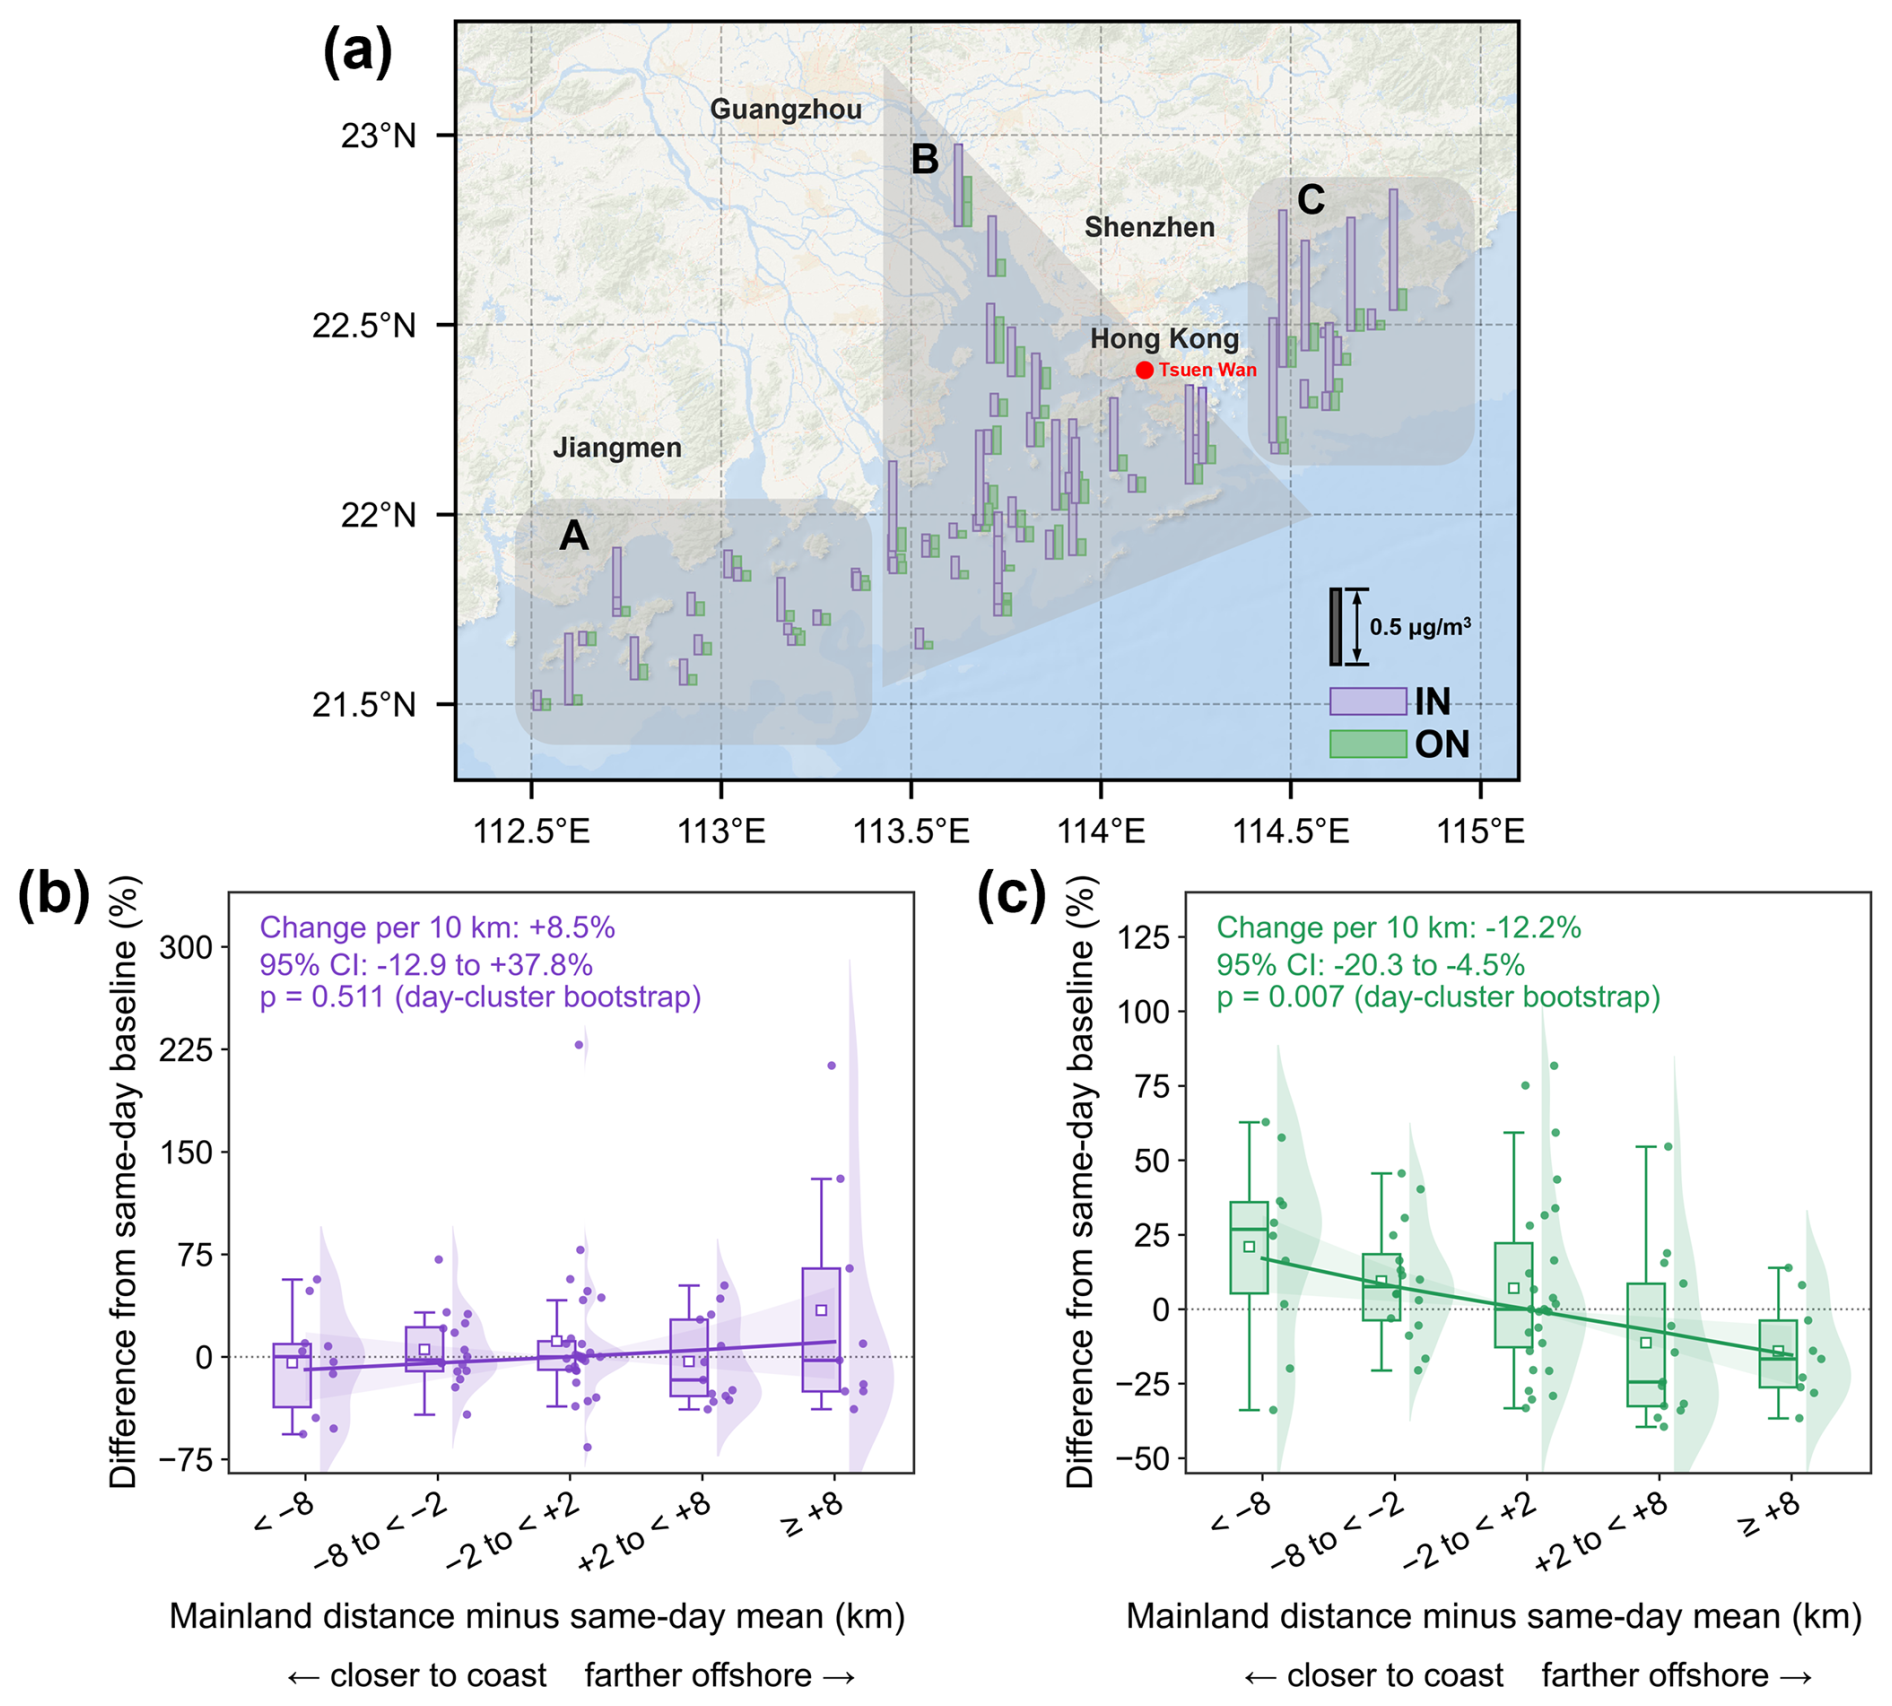
Figure 2Spatial distributions and within-day offshore associations of bulk IN and ON in marine PM2.5 during summer 2024. (a) Spatial distributions of IN (purple bar) and ON (green bar) concentrations in PM2.5 samples collected during the research cruise campaign over the GBA oceanic region during summer 2024. Basemap source: Esri World Ocean Base; Esri, Garmin, GEBCO, NOAA NGDC, and other contributors | Powered by Esri. (b–c) Percentage deviations of IN (b) and ON (c) concentrations from their same-day geometric means, grouped by relative mainland distance (each filter's mainland distance minus the same-day arithmetic mean distance). Negative values indicate distances below the same-day mean. For example, the 8 km bin includes filters whose distances to the mainland were more than 8 km shorter than the same-day mean distance. Sample sizes are n=10, 16, 27, 13 and 9 filters from left to right (75 in total). Bins are used for visualization only; inference uses individual-filter log concentrations (Sect. S4).
Regional mean TN concentrations increased from 0.24 ± 0.12 µg N m−3 in region A to 0.43 ± 0.23 µg N m−3 in region B and 0.56 ± 0.40 µg N m−3 in region C (Fig. 2a; Table 1). Mean IN concentrations followed the same regional ordering. Other aerosol components exhibited varying patterns: NH, SO and WSOC had their highest mean concentrations in region C, whereas NO was highest in region B and mean EC concentrations were similar across the three regions. These observations indicate regional differences in aerosol N abundance and composition during the campaign. However, because the regional records also encompass different sampling dates and atmospheric episodes, the observed ordering cannot be attributed solely to a west–east gradient in anthropogenic emissions.
Sulfate concentrations averaged 1.06 ± 0.73, 1.23 ± 0.81, and 1.96 ± 1.34 µg m−3 in regions A, B, and C, respectively, following the same numerical regional ordering as ammonium. However, these regional mean concentrations incorporate substantial temporal variability. Within region C, sulfate increased from 0.71 ± 0.08 µg m−3 during 21–22 July to 3.21 ± 0.44 µg m−3 during 1–2 August; urban MARGA observations showed a corresponding increase between these periods (Fig. S5c). Sulfate was also elevated in both records during 24–26 July and covaried strongly with ammonium concentrations (descriptive Pearson r=0.93). These observations are consistent with a regional secondary inorganic aerosol influence on the coastal and marine measurements, in agreement with previous Hong Kong studies (Bian et al., 2014; Chow et al., 2022). The higher mean sulfate concentration in region C therefore reflects both the locations sampled and the atmospheric episodes encountered during the cruise. The available observations cannot separately quantify the contributions of local sulfate formation and regional transport.
Table 1Concentrations (average ± standard deviation) of IN and ON as well as ratio, major inorganic ions, carbonaceous components (OC, EC, WSOC), and WSTN in PM2.5 samples from regions A (n = 19), B (n = 44) and C (n=12) in the GBA.
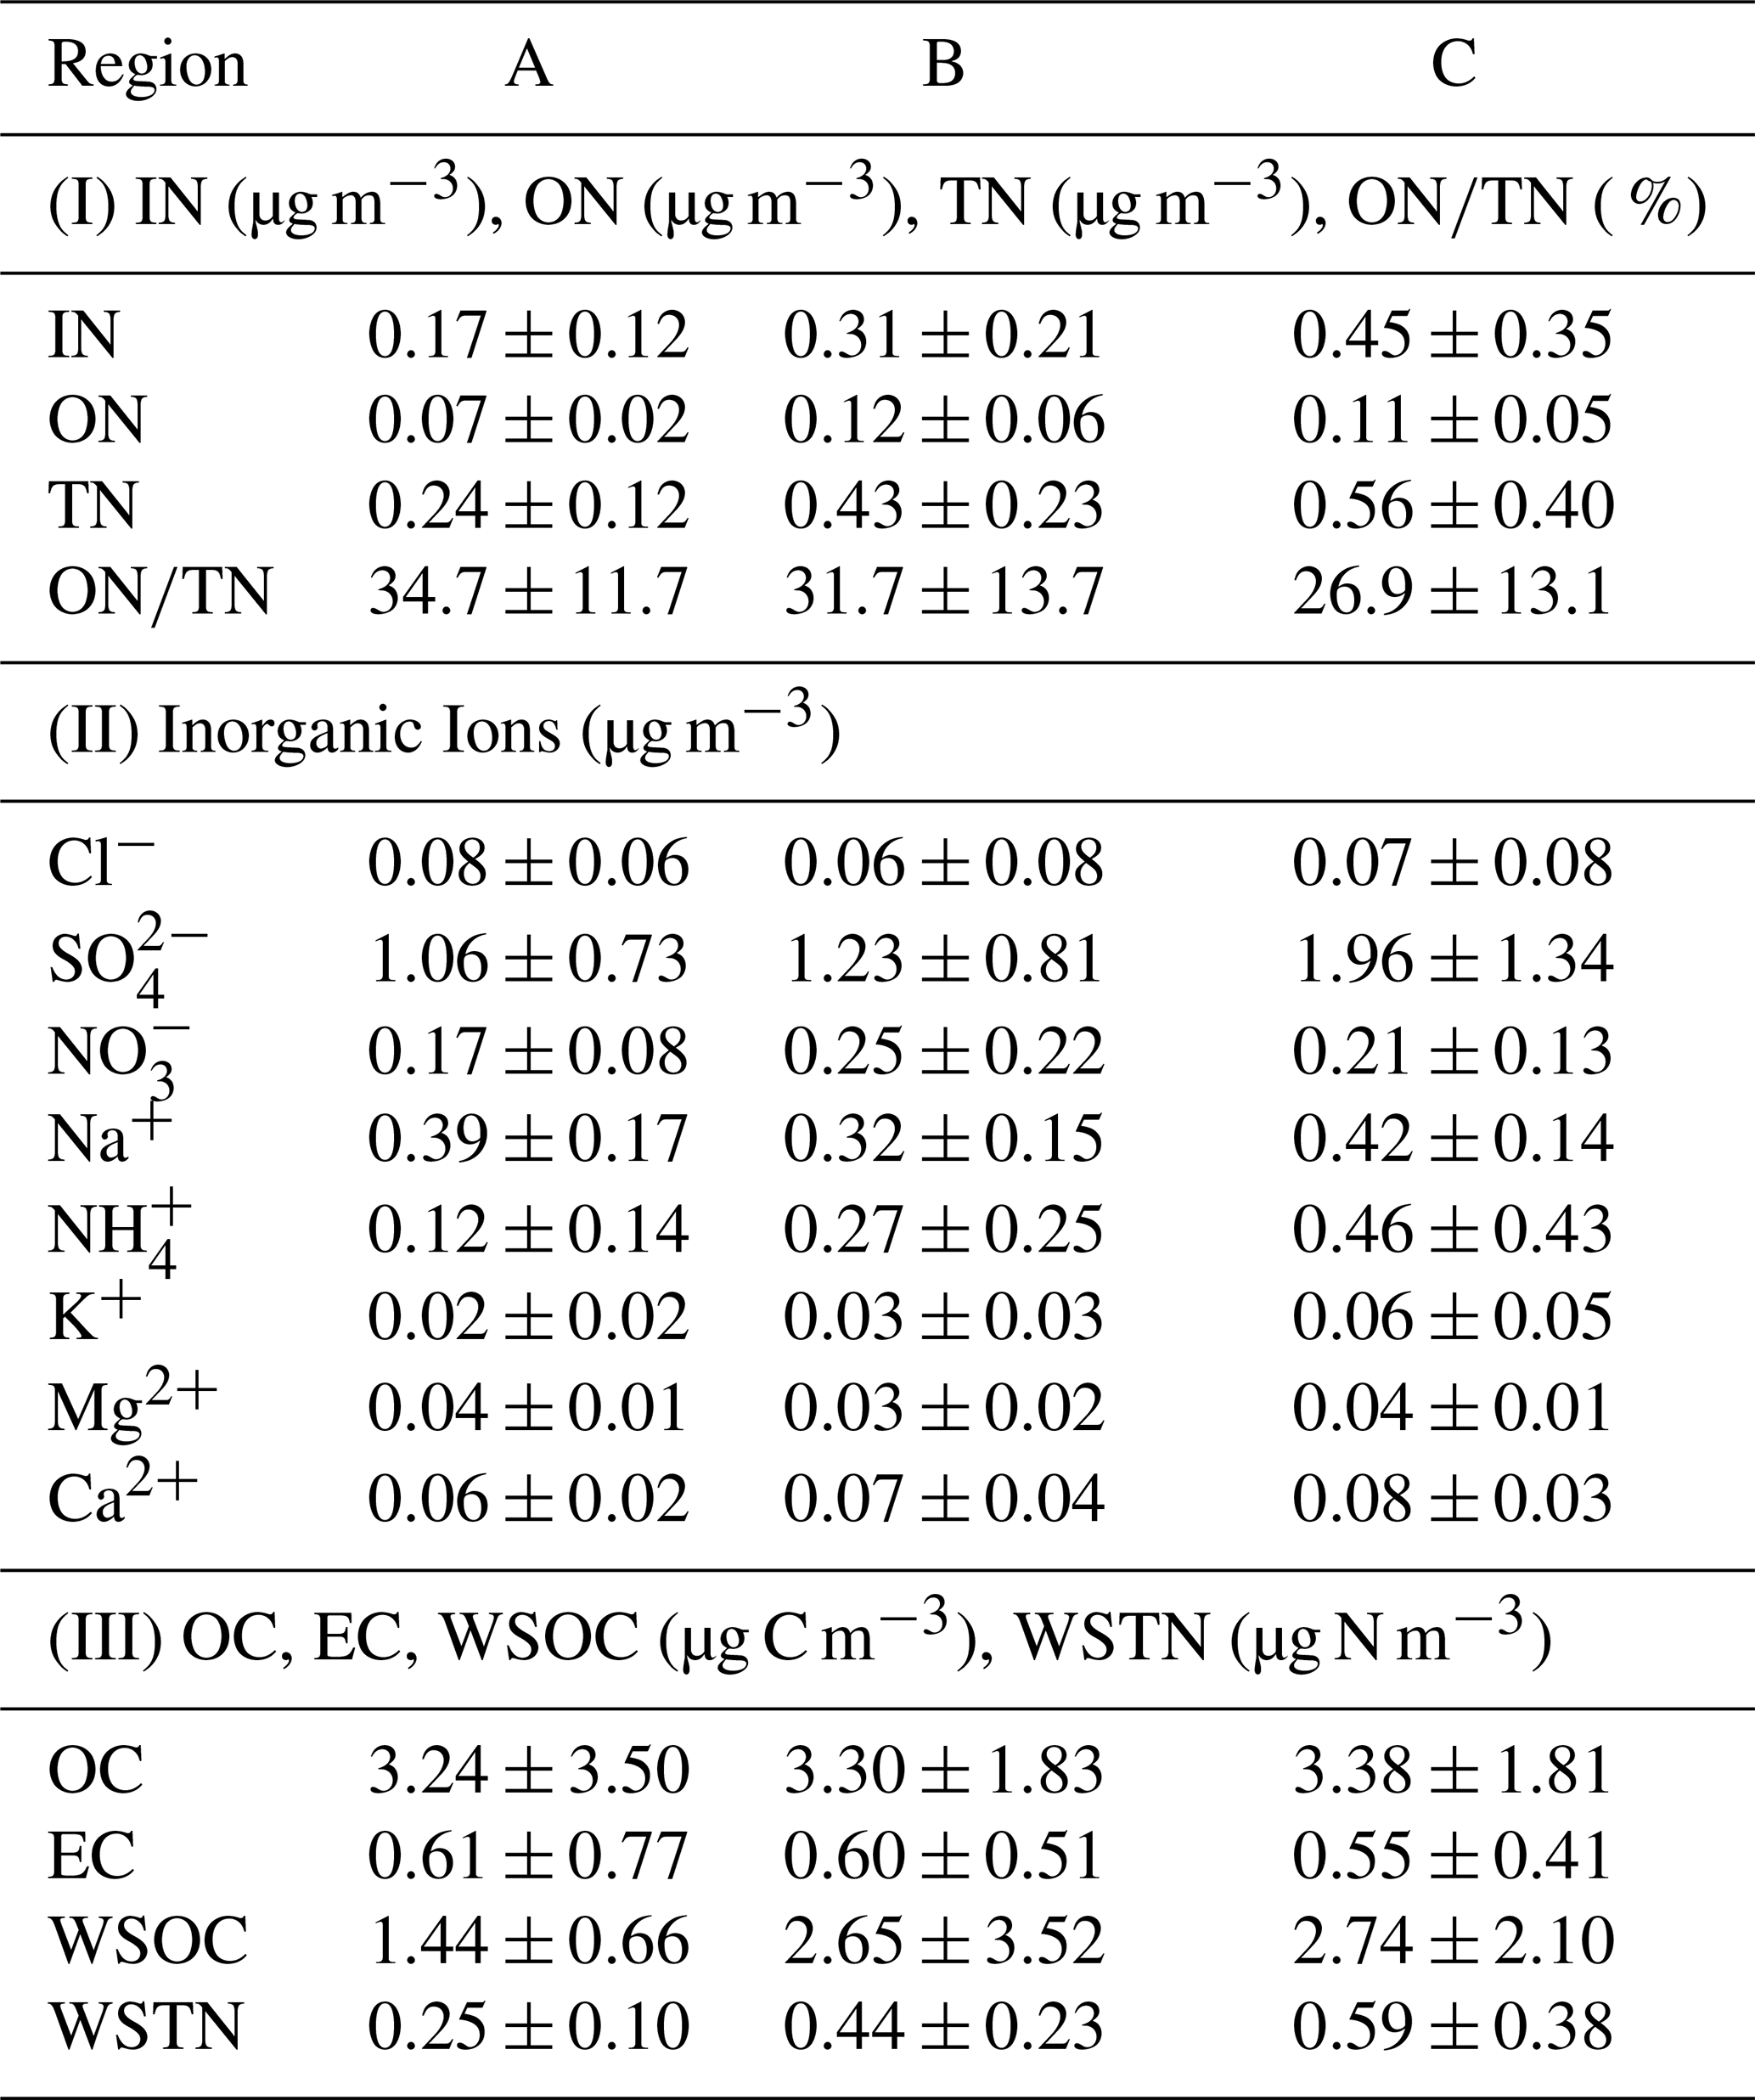
Mean fractions were 34.7 ± 11.7 %, 31.7 ± 13.7 % and 26.9 ± 13.1 % in regions A, B and C, respectively, with no statistically significant overall regional difference (Kruskal–Wallis p=0.224). In contrast, mean IN concentrations were 0.17 ± 0.12, 0.31 ± 0.21 and 0.45 ± 0.35 µg N m−3, respectively, and differed significantly among regions (Kruskal–Wallis p=0.005). Holm-adjusted Dunn tests indicated higher IN concentrations in B and C than in A (adjusted p=0.011 and 0.012, respectively), but no significant difference between B and C (adjusted p=0.520). These filter-level comparisons do not account for temporal dependence or separate regional differences from the atmospheric episodes sampled. The numerically higher fraction in A was primarily driven by lower IN rather than higher absolute ON concentrations, as mean concentration was lowest in A (Table 1). Thus, the pattern alone does not establish stronger marine-biogenic ON contributions. Limited and uneven regional sampling may also constrain the ability to detect differences in . The fractions observed here were broadly similar to the approximately 30 % contribution reported for water-soluble ON over the South China Sea, where most water-soluble ON occurred in fine particles (Shi et al., 2010). However, this comparison is limited by differences in the measured quantities: our measurements represent bulk particulate ON and TN, including both water-soluble and water-insoluble fractions.
To assess offshore gradients while accounting for differences among sampling dates, bulk IN and ON concentrations in the 75 marine samples were analyzed separately using regression models with sampling-day fixed effects. Natural-log concentrations were regressed on offshore distance, with a separate intercept for each sampling date, so that the estimated offshore association was based on within-day variation. Sampling dates were assigned using the midpoint of each sampling window, and effects were expressed as percentage changes per 10 km offshore. Statistical inference used a wild cluster bootstrap with sampling dates as clusters to account for dependence among filters collected on the same day. Four separate robustness checks were conducted: (1) replacing sampling-date clusters with eight consecutive cruise-period clusters to assess sensitivity to temporal dependence across days; (2) adding longitude to the regression model to account for within-day west–east variation; (3) adding 24 h sine and cosine terms to account for diurnal variation; and (4) excluding samples collected during the typhoon period (24–26 July) and refitting the model to assess the influence of this episode. Each check was applied independently to the primary model, and all retained the sampling-day fixed effects (Sect. S4; Table S5).
Bulk ON exhibited a significant negative within-day association with offshore distance, with an estimated decrease of 12.2 % per 10 km (95 % CI: −20.3 % to −4.5 %; p=0.007; Fig. 2c). This association persisted across all four robustness checks, with estimated decreases of 10.1 %–14.2 % per 10 km (all p<0.05; Table S5), supporting the robustness of the observed ON gradient to the adjustments examined. No statistically significant offshore association was detected for IN (estimated change: +8.5 % per 10 km; 95 % CI: −12.9 % to +37.8 %; p=0.511; Fig. 2b). The negative ON association is consistent with a contribution from coastal or continental sources. Previous modelling has demonstrated that atmospheric transport links continental ON sources to deposition over the ocean, with chemical processing and removal influencing ON distribution (Kanakidou et al., 2012). Dilution, mixing and removal may therefore contribute to the observed offshore decrease, while atmospheric processing may further modify ON concentrations.
Overall, the regional differences in bulk N concentrations and the consistent negative within-day offshore association of ON highlight spatial variability in aerosol N abundance and relative composition across the sampled GBA coastal waters. These findings motivate the following comparison of marine and coastal urban aerosols, considering both bulk N concentrations and complementary chemical information from water extracts.
3.2 Contrasting characteristics of IN and ON in marine and urban aerosols
Atmospheric IN and ON over coastal oceans are shaped by the combined influence of continental outflow, regional photochemistry, and marine boundary layer processing (Altieri et al., 2016; Kanakidou et al., 2016). The PM2.5 samples collected over the GBA coastal ocean and at a nearby coastal urban site in Hong Kong provide a paired dataset for examining contrasts and commonalities in IN and ON under closely coupled marine–urban conditions. Figure 3 provides an overview of the campaign-scale temporal variability and distributional differences of PM2.5-bound nitrogen species between the marine and urban environments, including bulk IN and ON concentrations and the partitioning of inorganic nitrogen between nitrate and ammonium.
Marine filters integrated shorter and more variable sampling periods than the urban 24 h filters. To improve temporal comparability, marine bulk-N concentrations were aggregated by local sampling date using actual pump-on duration as the weighting factor (Sect. S5). Across 23 paired dates, mean marine IN and ON concentrations were 0.28 and 0.10 µg N m−3, respectively, compared with 0.22 and 0.14 µg N m−3 in the urban samples. These concentrations were of similar magnitude, although marine daily aggregates represented only the sampled portions of each day and did not provide complete 24 h coverage. Accordingly, the individual-filter records in Fig. 3a–b provide descriptive temporal context rather than a basis for directly comparing temporal variability between the two environments.
Campaign-mean NH–N exceeded NO–N in both environments (Fig. 3c–f). For the comparison using urban MARGA observations averaged over the actual marine pump-on windows, the ratios of mean NH–N to mean NO–N were 4.0 and 5.2 for the marine and urban records, respectively, with no statistically resolved difference between them (Sect. S5). Hourly and daily urban MARGA records are also shown alongside the marine filter measurements to illustrate ion variability at different temporal resolutions (Fig. S5). Mean Na+ concentrations were higher in the marine filters than in the full urban hourly record (0.35 ± 0.15 versus 0.16 ± 0.10 µg m−3), consistent with greater sea-salt influence over the coastal waters. The reaction of HNO3 with sea-salt particles through chloride displacement provides a possible pathway for particulate nitrate formation (Guimbaud et al., 2002; Davies and Cox, 1998). However, higher Na+ concentrations alone do not establish the fraction of nitrate associated with sea salt. Potential filter-sampling artifacts and the corresponding sensitivity checks are discussed in Sect. S2.
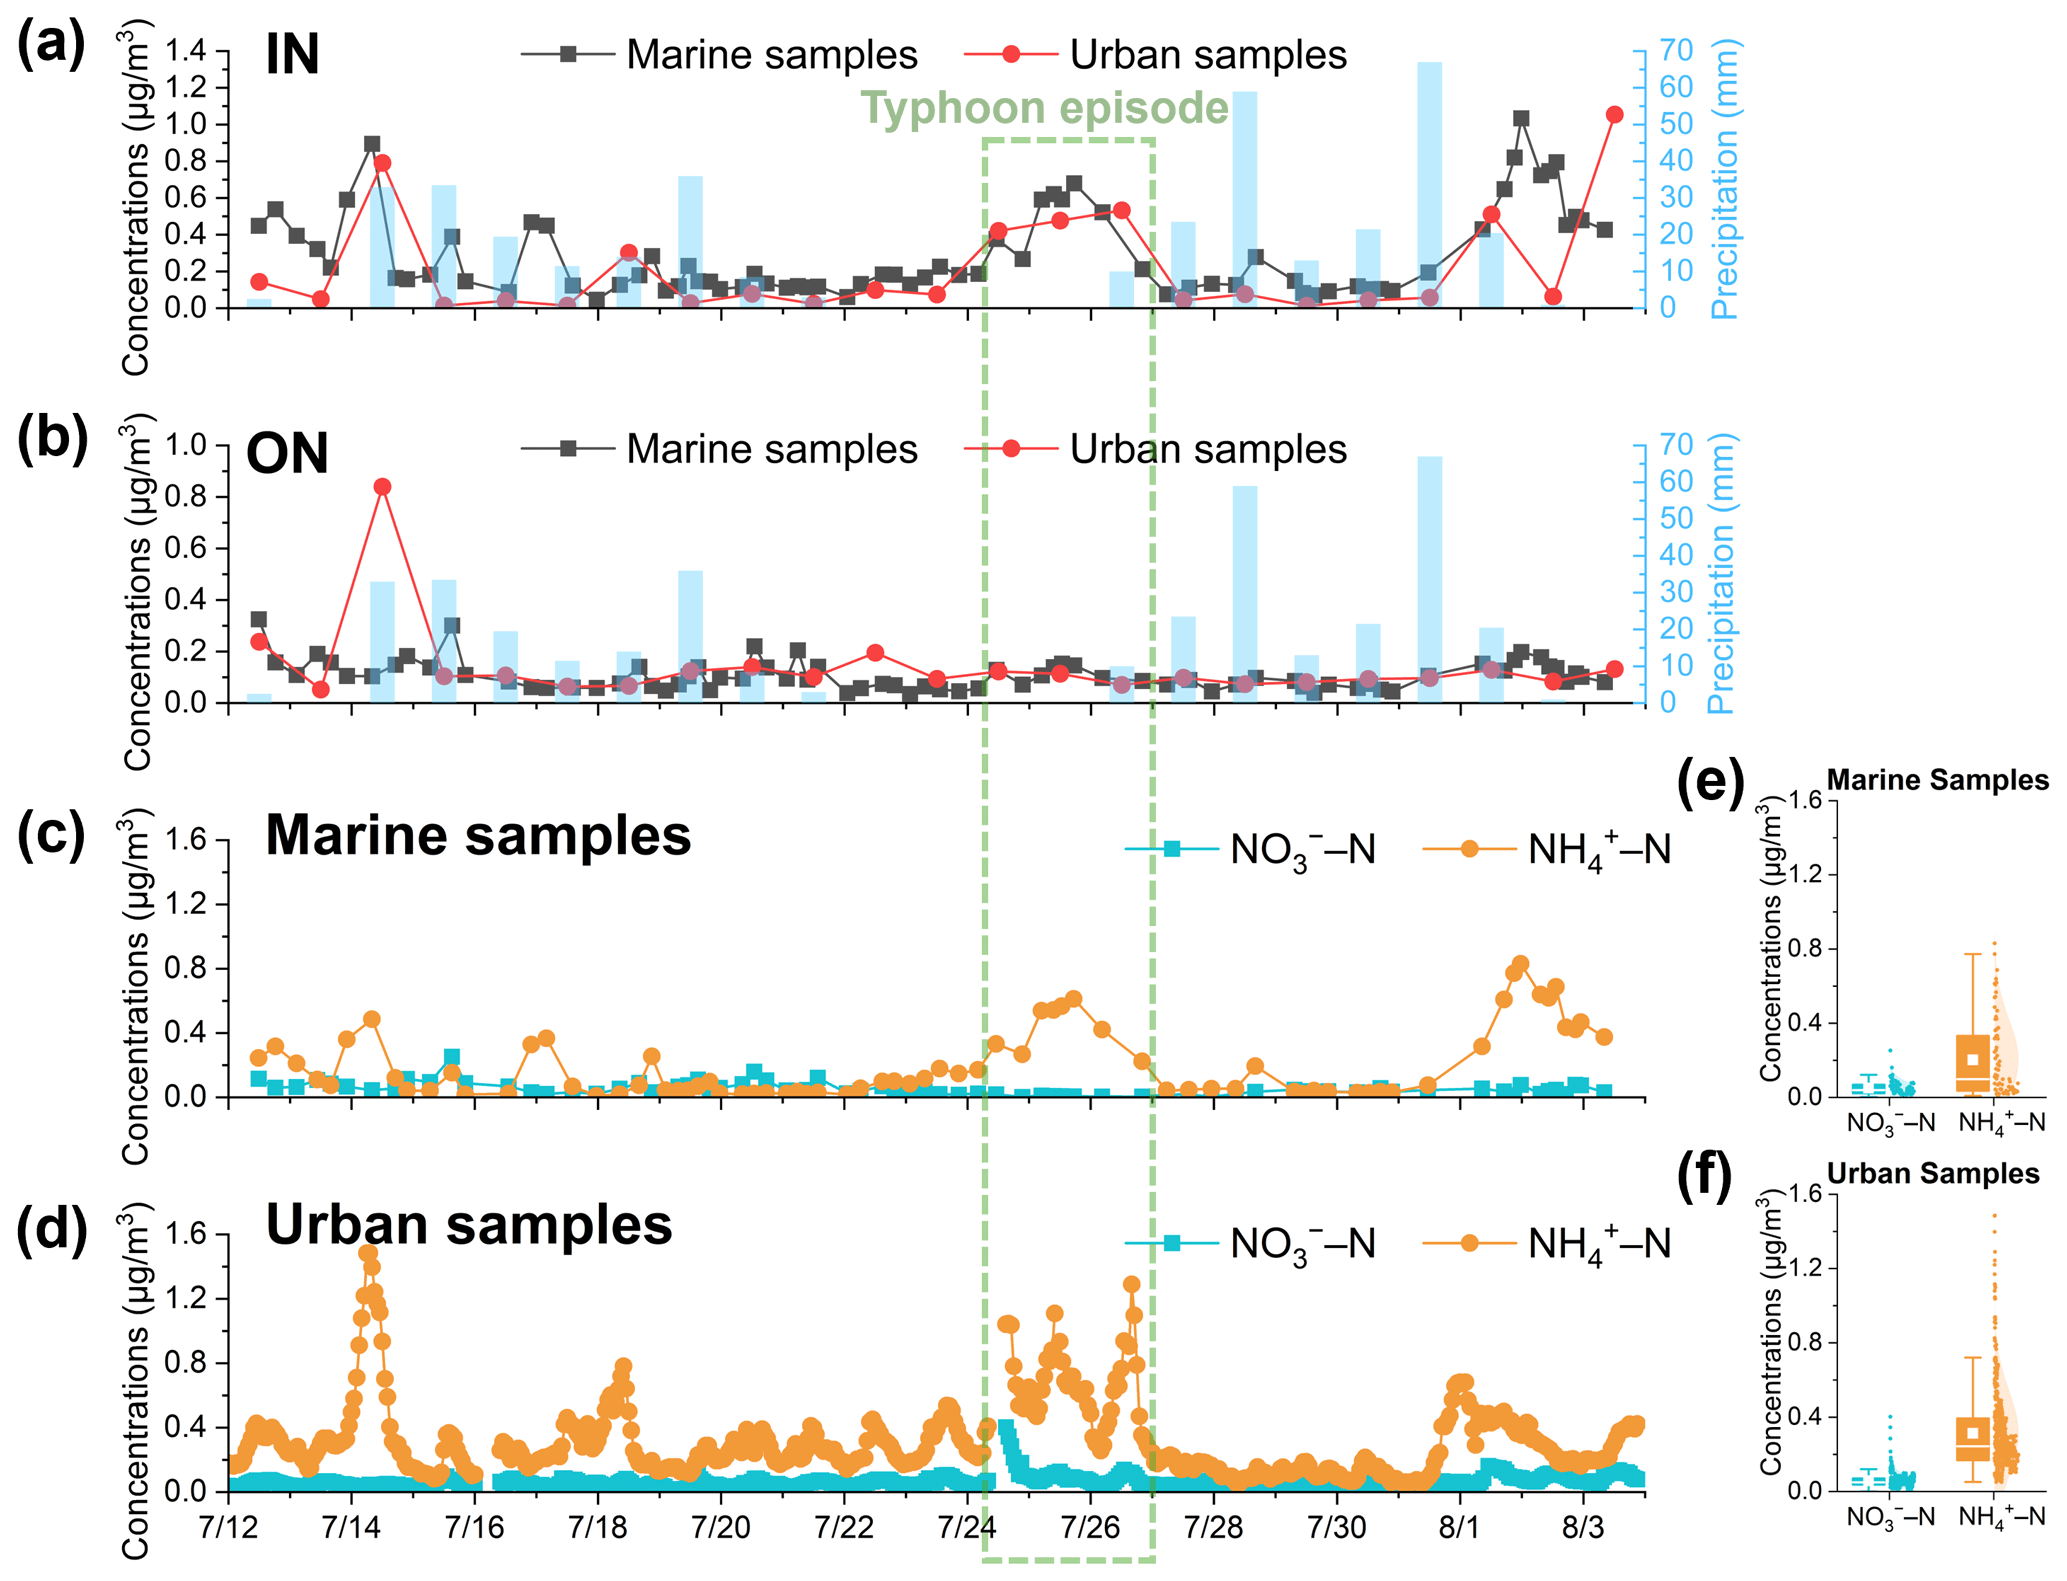
Figure 3Temporal variations of (a) IN and (b) ON concentrations in marine (black squares) and urban (red circles) PM2.5 filter samples during the 2024 summer campaign. Blue bars indicate daily precipitation in Hong Kong (right axis). Panels (c) and (e) show the time series and distributions of nitrate nitrogen (NO–N) and ammonium nitrogen (NH–N) in marine PM2.5 samples based on filter-based IC measurements. Panels (d) and (f) show the corresponding time series and distributions of NO–N and NH–N at the Tsuen Wan urban site based on hourly MARGA measurements. Distributions reflect the respective sampling resolutions. Comparisons accounting for sampling time are described in Sect. S5.
During the typhoon-influenced period (24–26 July 2024), changes in regional meteorological conditions and air-mass transport pathways coincided with enhanced sulfate and ammonium concentrations in both marine and urban aerosols (Figs. 4, S5 and S8). In the nine marine filters collected in region B during this period, mean NH–N was 0.41 µg N m−3, compared with 0.15 µg N m−3 in the other region-B samples, while mean sulfate concentrations were 2.00 versus 1.03 µg m−3. Urban MARGA observations showed corresponding enhancements in sulfate (2.11 versus 1.01 µg m−3) and ammonium (0.76 versus 0.35 µg m−3). These concurrent enhancements are consistent with an increased contribution from regional secondary aerosol containing ammonium and sulfate, potentially formed from continental precursors before or during transport over coastal waters. In contrast, mean marine NO–N concentrations were lower during the episode than in the other region-B samples (0.01 versus 0.07 µg N m−3), while bulk ON showed no corresponding enhancement (0.11 versus 0.12 µg N m−3).
These differing responses are compatible with differences in precursor sources and atmospheric processing among the N components. Formation of ammonium-containing sulfate aerosol involves NH3 and sulfur precursors, whereas particulate nitrate depends on the production and gas–particle partitioning of HNO3 derived from NOx. ON encompasses diverse primary and secondary compounds whose abundances reflect their respective sources and processing histories. Consequently, continental influence that enhances ammonium and sulfate need not simultaneously enhance nitrate or ON. Mean shipboard NOx was also lower during the episode (1.9 versus 9.8 ppb), consistent with weaker recent influence from NOx-rich emissions, although NOx concentrations do not directly constrain HNO3 availability in aged air. Neither OC nor WSOC showed a concurrent enhancement, consistent with the absence of a parallel increase in bulk ON. Together, these observations support a regional sulfate–ammonium enhancement rather than a uniform increase in all aerosol N components.
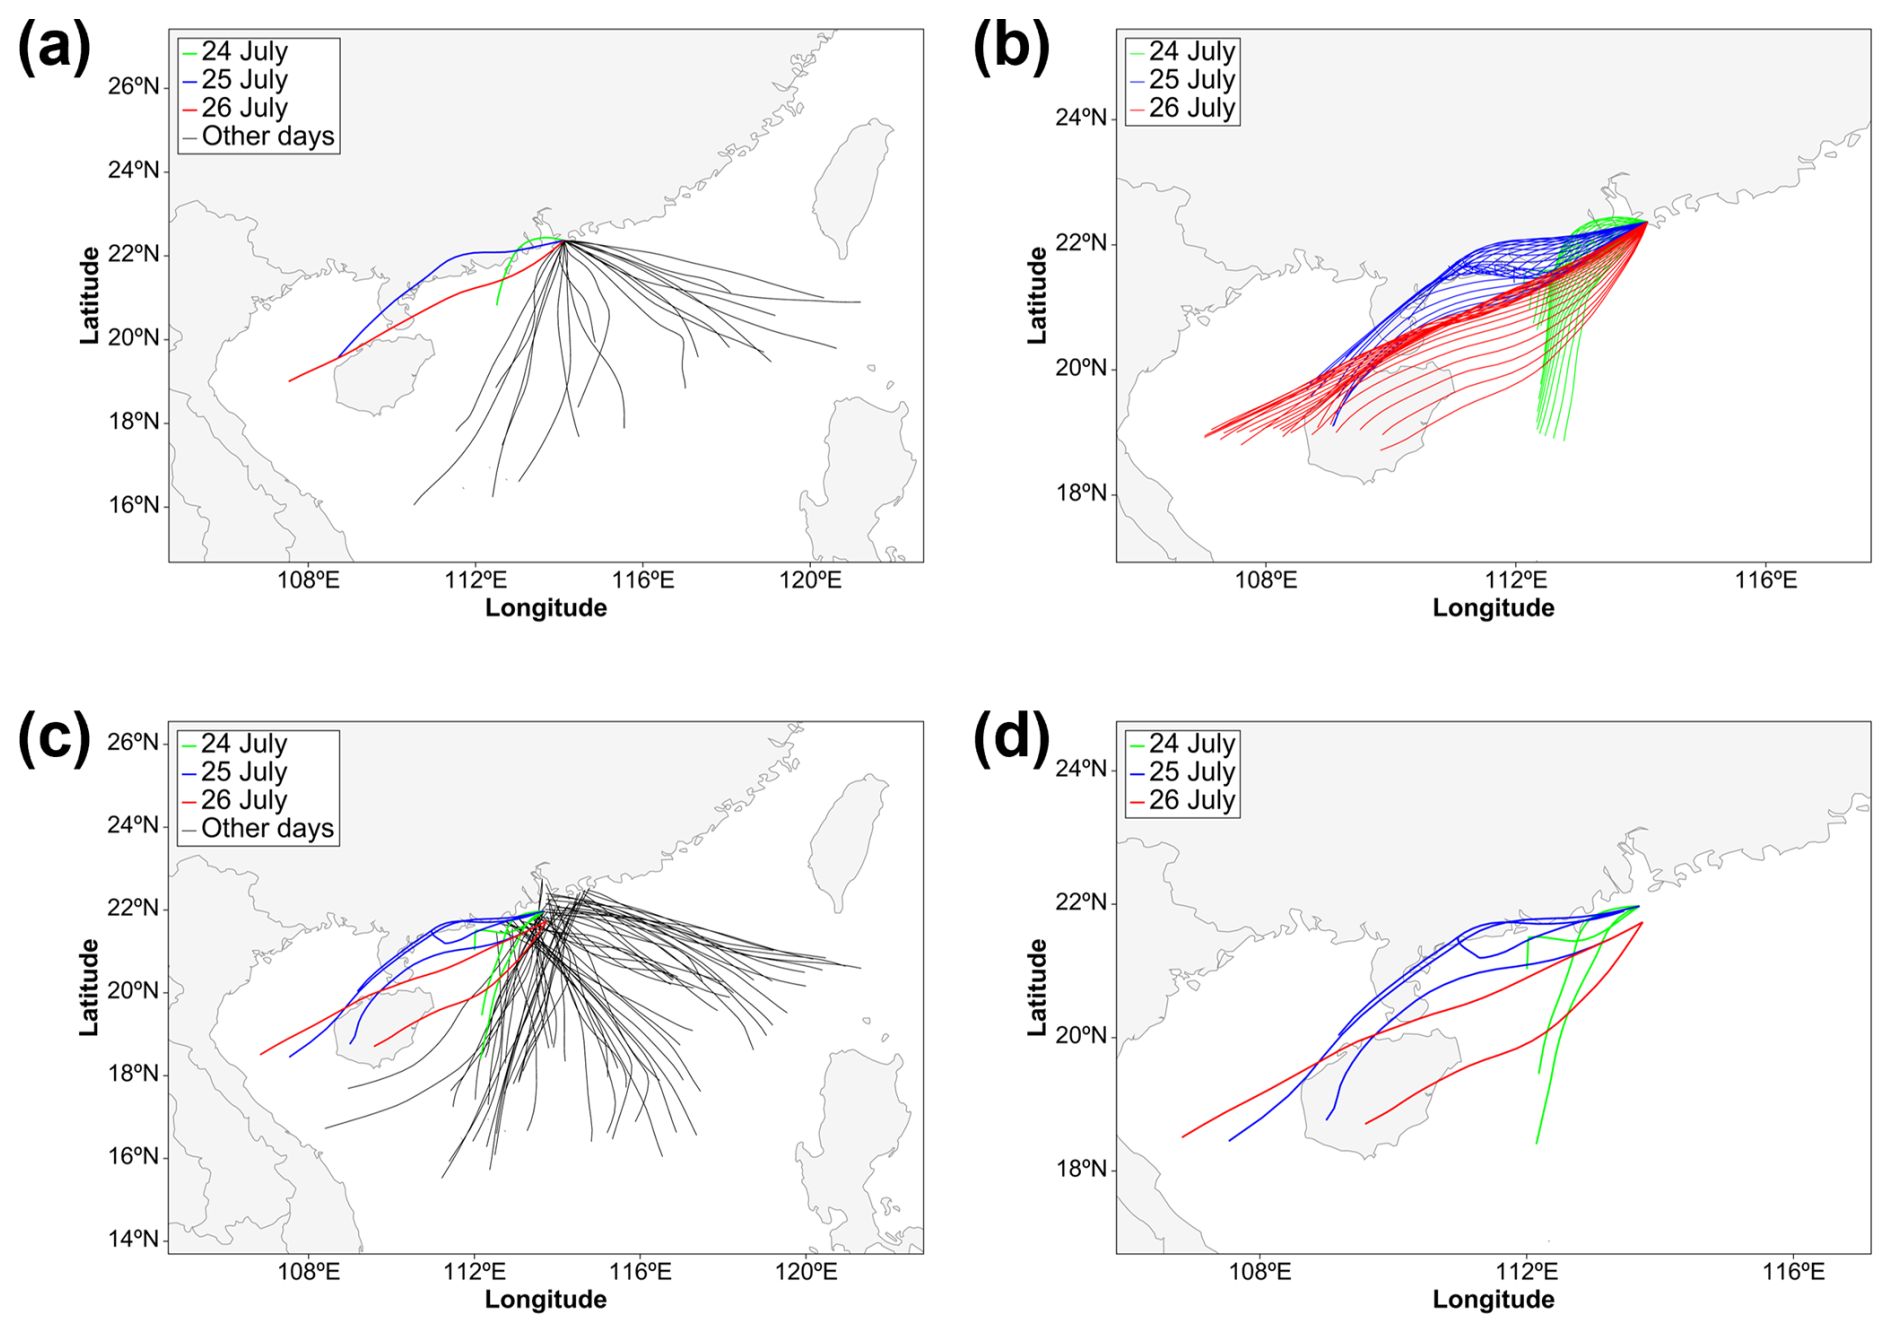
Figure 424 h backward air-mass trajectories arriving at a height of 20 m during the summer 2024 GBA campaign, generated using MeteoInfoMap software with meteorological input data obtained from the National Oceanic and Atmospheric Administration (NOAA). (a) Daily trajectories arriving at the Tsuen Wan urban site during 12 July–3 August 2024. (b) Hourly trajectories arriving at Tsuen Wan during 24–26 July. (c) Sample-specific trajectories for the moving marine sampling locations, with arrival times and intervals determined by the individual filter sampling schedule. (d) Corresponding marine trajectories during 24–26 July. Trajectories for 24, 25 and 26 July are shown in green, blue and red, respectively, and those for other dates in black.
Although marine and urban bulk ON concentrations were of similar magnitude, this does not necessarily imply similar chemical composition. In the following section, we therefore examine N-containing organic fragment signatures in water extracts using offline AMS to explore compositional differences between the two environments, providing complementary information to the bulk-N measurements.
3.3 Nitrogen-containing organic fragment signatures in PM2.5 water extracts
Atmospheric ON comprises chemically diverse compounds associated with primary emissions, secondary formation and multiphase processing. Complementing the bulk-N measurements, offline AMS provides information on the relative composition of N-containing organic fragments in aerosol water extracts. Here, we compare fragment families, selected functional-group-related signals and nitrate-related signatures among marine, urban and ship-influenced samples to explore compositional differences across these coastal environments. Temporal variations in the relative signals of carbon-free N fragments and the families are shown in Fig. S9.
3.3.1 Reduced vs. oxidized ON in marine and urban aerosols
The mean contribution of CHN1 fragments, containing C, H and one N atom but no O, was numerically higher in marine than urban water extracts (64.6 % versus 57.7 %; Fig. 5a), although the difference was not statistically significant after Benjamini–Hochberg (BH) adjustment (adjusted p=0.098; Table S12). Laboratory measurements of organic-N standards show that amines produce prominent CHN fragments, including CnH2n+2N+ ions, supporting their interpretation as signatures compatible with reduced-N-containing precursors (Ge et al., 2024). Previous studies have reported amines and amino acids in marine aerosols (Calderón et al., 2007; Wedyan and Preston, 2008), while observations in remote marine environments have linked water-soluble ON to ocean productivity and wind-driven aerosol production (Altieri et al., 2016). These findings provide context for a possible marine contribution to the observed fragment composition. However, the CHN1 fraction alone cannot distinguish this contribution from the influence of transported terrestrial material or atmospheric processing in the GBA coastal environment.
Urban extracts had a numerically higher CHON1 fraction, but this difference likewise was not significant after BH adjustment (adjusted p=0.098). In contrast, the contribution of CHN fragments containing more than one N atom (CHN> 1) was significantly higher in urban extracts (adjusted p=0.016; Table S12), indicating a difference in the relative composition of the detected N-containing organic fragments. Importantly, oxygen-containing fragments do not necessarily indicate oxidized nitrogen functionality. Standard-compound measurements show that amides generate CnH2nNO+ fragments and amino acids produce ions such as C2H4NO and CH4NO+ (Ge et al., 2024); oxygen in these fragments therefore need not belong to a nitrate or nitro group. We interpret the CHN and CHON families as compositional descriptors and examine the complementary nitrate-related signatures below to assess evidence for oxidized organic-N functionality.
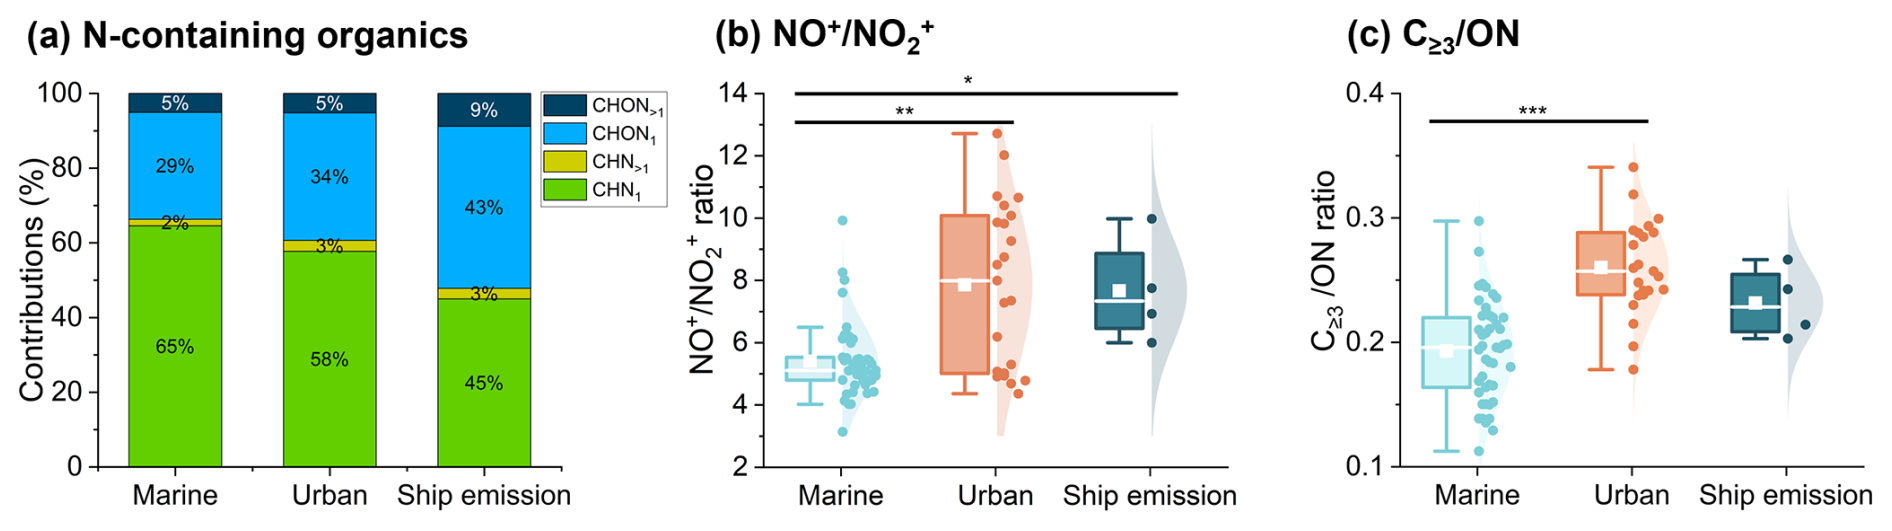
Figure 5Comparison of N-containing organic fragments and related signal ratios in marine, urban, and ship-emission-influenced PM2.5 water extracts. (a) Relative contributions of CHN1, CHN> 1, CHON1, and CHON> 1 formula classes to total N-containing organic fragment signal. (b) signal ratios. (c) Fraction of selected N-containing organic fragment signals with carbon number ≥ 3 (CON). Sample sizes are 45 marine, 23 urban and 4 ship-influenced extracts. Asterisks denote significant differences from two-sided Mann–Whitney U tests with Benjamini–Hochberg adjustment across 45 comparisons: * adjusted p<0.05, adjusted p<0.01, adjusted p<0.001. Additional results are provided in Table S12.
Urban PM2.5 water extracts exhibited significantly higher ratios than marine extracts (7.9 ± 2.6 versus 5.4 ± 1.2; BH-adjusted p=0.009; Fig. 5b). Interpretation of this contrast requires consideration of inorganic nitrate. Campaign-mean ambient NO concentrations were of similar magnitude in marine filters and urban hourly MARGA observations (0.22 ± 0.18 versus 0.25 ± 0.17 µg m−3), whereas Na+ concentrations were approximately 2.22 times higher in marine samples (0.35 ± 0.15 versus 0.16 ± 0.10 µg m−3). These ambient measurements provide compositional context but do not directly constrain inorganic-nitrate contributions to the extract spectra. Laboratory measurements have shown that NaNO3 can produce substantially higher ratios than NH4NO3 (Bruns et al., 2010). Consequently, if sea-salt-associated NaNO3 contributed appreciably to the detected marine spectra with comparable fragmentation behavior, it would tend to increase rather than decrease the marine ratio. Under this assumption, a greater contribution from sea-salt associated NaNO3 would not explain the lower observed marine ratio, although ambient Na+ cannot establish nitrate speciation and literature ratios cannot substitute for instrument-specific calibration (Day et al., 2022).
Complementary evidence comes from signals assigned to CHNO and CH2NO at nominal m/z 75 and 76, which were more prominent and covaried more strongly in urban than marine extracts (Figs. S10 and S12). CH2NO has previously been reported as an organic-nitrate-related AMS fragment (Fry et al., 2011). These carbon-containing signals provide evidence beyond the ratio and collectively support the interpretation of more prominent organic-nitrate-related oxidized-N functionality in urban water extracts. The generally higher urban NOx concentrations (Fig. S11) provide additional context for possible secondary organic nitrate formation through VOC oxidation involving NOx, as investigated in previous studies (Zhu et al., 2025; Graeffe et al., 2023). Taken together, these observations suggest a greater relative contribution of oxidized organic-N signatures, particularly those associated with organic nitrates, to the urban water-extract spectra than to the marine spectra.
A further compositional difference was evident in the fraction of selected N-containing organic fragment signals with carbon number ≥ 3, which was significantly higher in urban extracts (BH-adjusted p=8.45 × 10⁻⁶; Fig. 5c). This indicates a greater relative contribution of fragments retaining more carbon atoms, although structure-dependent fragmentation prevents a direct interpretation in terms of parent-molecule size or complexity (Ge et al., 2024). Urban emissions provide several possible sources of organic material: vehicle exhaust contains N-bearing aromatic compounds, including nitro-PAHs (Kostenidou et al., 2021), while cooking emissions contain diverse organic compounds, including alkanes and fatty acids (Abdullahi et al., 2013). Such emissions and subsequent atmospheric processing provide possible source and processing context for the observed urban fragment composition, but the listed cooking-related compounds are not themselves N-containing, and individual source contributions cannot be resolved by the C≥3 metric. Together, the nitrate-related signatures and fragment carbon-number distribution reveal marine–urban differences in extract composition, with more prominent organic-nitrate-related functionality and a larger fraction of N-containing fragments with three or more carbon atoms in urban extracts. These findings concern relative spectral composition rather than quantitative organic-nitrate abundance or the mean oxidation state of bulk ON.
3.3.2 ON composition in ship-emission-influenced aerosols
The four ship-influenced water extracts exhibited compositional features that differed from those of the marine group. Their mean ratio was higher than that of the marine extracts (7.7 ± 1.7; BH-adjusted p=0.025; Fig. 5b; Table S12), and their average spectra showed different relative contributions of oxygen-containing N fragments (Fig. S10c). Direct exhaust measurements have demonstrated that ships can emit particulate organic nitrates (Chen et al., 2024), providing a plausible source context for the nitrate-related signatures observed here. However, the dependence of on nitrate composition and instrument response also applies to these samples, so the ratio is interpreted as qualitative compositional evidence rather than a quantitative measure of organic-nitrate abundance or bulk-ON oxidation state.
The fraction of signals assigned to imidazole-like fragments was significantly higher in ship-influenced extracts than in marine and urban extracts (BH-adjusted p=0.004 and 0.002, respectively; Fig. S13; Table S12). Selected CxHyN fragments are consistent with N-containing heterocycles, as demonstrated by standard-compound measurements (Ge et al., 2024). Laboratory studies have also shown that aqueous reactions of α-dicarbonyls with ammonium and amines can produce imidazoles and other N-containing heterocycles (Yang et al., 2023), offering a possible processing pathway. The present spectra, however, do not distinguish direct emissions from subsequent atmospheric formation. The four samples provide exploratory evidence rather than a representative ship-emission profile. Additional targeted measurements across a larger number of ship plumes would help establish the prevalence and formation pathways of these signatures.
3.4 PM2.5-bound nitrogen dry deposition
We estimated PM2.5-bound N dry deposition fluxes using the inferential method (Eq. 1), combining measured ambient concentrations with literature-constrained dry deposition velocities (Vd). Since Vd for fine particles is sensitive to wind speed, surface roughness, particle size, and atmospheric stability (Zhang et al., 2001, 2012; Farmer et al., 2021), its estimation should account for the contrasting meteorological and surface conditions between the marine and coastal urban environments. Concurrent shipboard wind observations during the cruise campaign showed substantially higher wind speeds over the GBA marine region (∼ 5.5 m s−1) than at the nearby Shell Tsing Yi station (SHL; ∼ 2.6 m s−1) (Fig. S14). SHL is located approximately 3 km from the Tsuen Wan urban sampling site and is used here to represent the coastal urban wind environment. This contrast may favor stronger wind-driven turbulent exchange over the marine region, although deposition to the smoother water surface may be less efficient than deposition to rougher built surfaces.
To constrain representative Vd values, we conducted a first-order calculation following the size-segregated particle dry-deposition scheme of Zhang et al. (2001), as described in Sect. S6, where the governing equations, input parameters (Table S7), and calculated intermediate and final results (Table S8) are summarized. For a representative dry particle diameter of 0.5 µm, the base-case Vd values were 0.105 cm s−1 for the marine environment and 0.13 cm s−1 for the coastal urban environment. Varying the dry particle diameter from 0.3 to 1.0 µm yielded ranges of 0.07–0.14 and 0.09–0.19 cm s−1, respectively (Table S9). These ranges describe sensitivity to the assumed particle size and illustrate the importance of size-dependent deposition processes. The calculated Vd values are comparable to previously reported fine-particle Vd observations and estimates (Wu et al., 2018; Pryor et al., 2008; Farmer et al., 2021).
We further evaluated sensitivity to hygroscopic growth using the RH-dependent parameterization included in Zhang et al. (2001). Campaign-mean RH was 89.3 % at Waglan Island, used as a marine proxy because continuous shipboard RH measurements were unavailable, and 84.2 % at King's Park, used as the coastal urban proxy. Depending on the assumed aerosol hygroscopicity, the resulting Vd values were approximately 0.074–0.079 cm s−1 for the marine environment and 0.099–0.105 cm s−1 for the coastal urban environment (Table S10). In these model scenarios, hygroscopic growth did not increase Vd: the competing size-dependent deposition processes produced lower values than in the dry-particle base case. These calculations are sensitivity scenarios rather than observationally constrained corrections, because the particle size distribution and hygroscopicity were not measured during the campaign.
Using the dry-particle base-case Vd values, the summer campaign-mean PM2.5-bound TN dry-deposition fluxes were approximately 0.036 mg N m−2 d−1 over the marine region and 0.040 mg N m−2 d−1 at the coastal urban site (Table 2). These point estimates are of similar magnitude, and the sensitivity to the assumed deposition parameters precludes a firm conclusion about a marine–urban difference. The estimates nevertheless quantify the fine-particle component of atmospheric N input to the GBA coastal waters during the summer campaign.
Table 2Base-case deposition velocities, model-sensitivity ranges, and estimated summer campaign–mean PM2.5-bound TN dry-deposition fluxes for the marine and coastal urban environments.

Note: Base-case Vd values correspond to a representative 0.5 µm dry particle; sensitivity ranges correspond to dry diameters of 0.3–1.0 µm. RH and hygroscopic-growth sensitivity calculations are provided in Table S10. Marine and urban fluxes refer to deposition to water and a representative coastal urban surface, respectively. Fluxes were calculated using campaign-mean bulk TN concentrations.
These estimates represent only the fine-particle (PM2.5-bound) contribution to nitrogen dry deposition; coarse-mode particulate nitrogen and gas-phase reactive nitrogen species were not included. Previous measurements in urban Hong Kong indicate that coarse particulate N deposition can be approximately twice fine-mode deposition (e.g., 0.39 vs. 0.21 mg N m−2 d−1 for coarse and fine fractions, respectively) (Yu et al., 2023). In addition, water-soluble gaseous species such as NH3, HNO3, and organic nitrogen vapors may also contribute significantly to total nitrogen dry deposition (Jia et al., 2016; Yu et al., 2026). The present PM2.5-based fluxes therefore characterize the fine-particle component of atmospheric dry N input during the summer campaign, rather than the total dry-deposition flux. Moreover, because the measurements were conducted during a three-week summer period under predominantly southerly monsoon conditions, they cannot constrain annual deposition, particularly given the potential seasonal influence of continental outflow.
Accordingly, previously reported dry N deposition fluxes from other regions are cited here only to provide broader context rather than as direct quantitative comparisons. For example, dry deposition of N in urban Guangzhou has been reported to reach 3.75 mg N m−2 d−1 (Yu et al., 2020), while a value of 1.62 mg N m−2 d−1 has been reported for Singapore (He et al., 2011). In Europe, coastal measurements indicate N dry deposition fluxes of approximately 1.37 mg N m−2 d−1 in Edinburgh, UK (González Benítez et al., 2009), and 1.62 mg N m−2 d−1 at Finokalia in the eastern Mediterranean (Violaki et al., 2010). These higher reported fluxes may reflect differences in the nitrogen pools included, sampling periods and deposition estimation methods, as well as environmental conditions, limiting direct comparison with the present PM2.5-only summer estimates. Future observations incorporating size-resolved particles, gaseous nitrogen species, and year-round measurements will therefore be required to establish a complete annual nitrogen dry deposition budget for the GBA coastal zone.
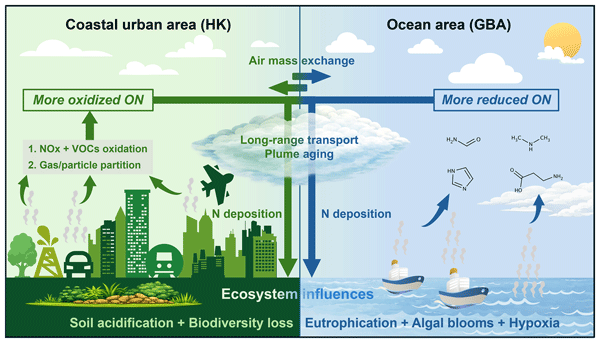
Taken together, the paired marine–urban observations highlight differences in aerosol nitrogen composition, with complementary AMS signatures supporting more prominent organic-nitrate-related oxidized-N functionality in urban water extracts. These compositional observations complement the estimates of PM2.5-bound nitrogen dry deposition over the GBA coastal region, but do not directly quantify the deposition of individual ON compound classes. A conceptual summary of the observed nitrogen chemistry and its implications for PM2.5-bound nitrogen deposition is shown in Fig. 6.
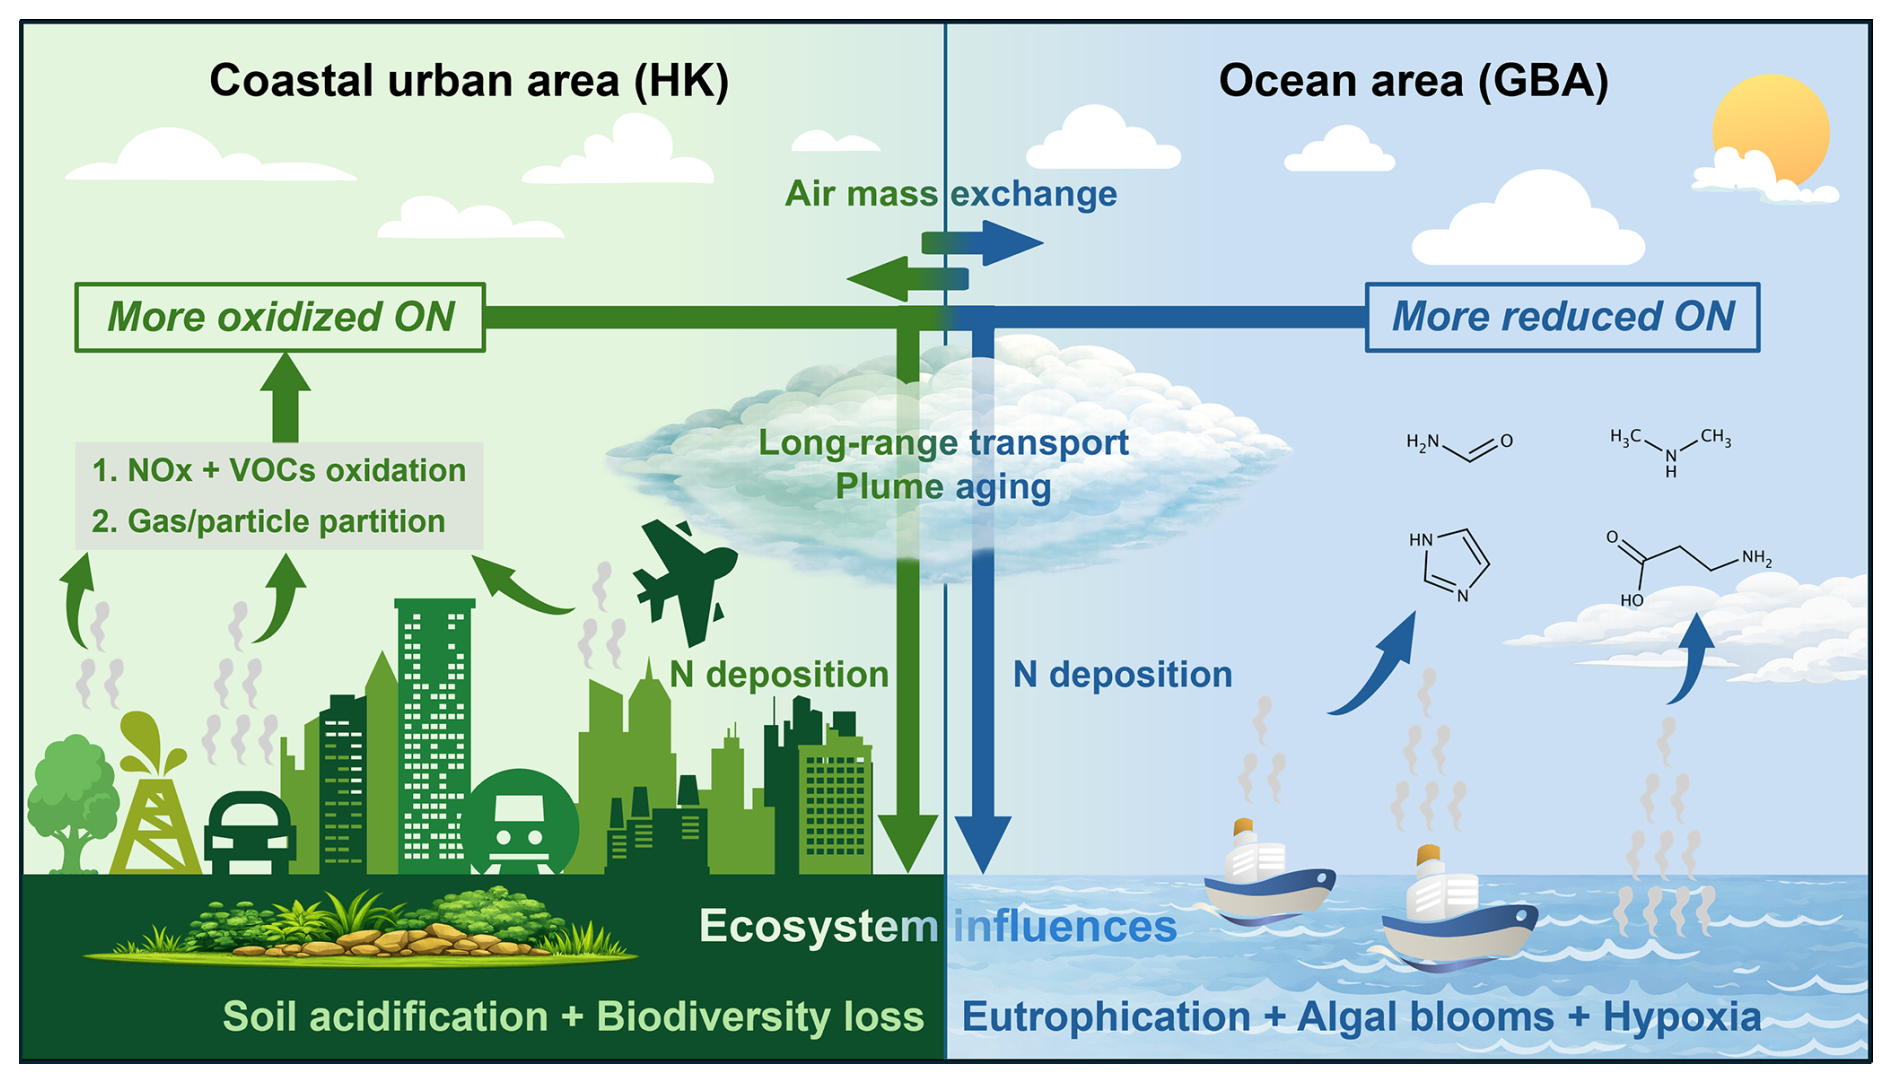
Figure 6Conceptual summary of aerosol nitrogen chemistry, deposition pathways, and potential ecosystem implications in the coastal GBA atmosphere.
This study presents the first paired marine–urban characterization of PM2.5-bound bulk TN, IN, and ON, N-containing organic fragment signatures in PM2.5 water extracts and summer PM2.5-bound nitrogen dry deposition in the GBA, based on sampling at a coastal urban site (Tsuen Wan) and concurrent shipboard sampling over the adjacent coastal waters. By combining bulk-N measurements with complementary extract-based AMS observations, the study extends the chemical characterization of aerosol nitrogen across this coastal megacity environment.
Three principal findings emerge. First, regional mean TN and IN concentrations increased numerically from western to eastern coastal waters, although these regional patterns also reflect differences in sampling dates and atmospheric episodes. Bulk ON showed a significant negative within-day association with offshore distance, decreasing by 10.1 %–14.2 % per 10 km. The fraction was numerically highest in region A (∼ 35 %), consistent with its lower IN loading rather than greater absolute ON abundance. Second, complementary AMS observations revealed marine–urban differences in water-extract composition. Urban extracts exhibited higher ratios than marine extracts (7.9 ± 2.6 versus 5.4 ± 1.2), more prominent carbon-containing nitrate-related fragments (m/z 75, 76), and a higher fraction of N-containing fragments retaining at least three carbon atoms. Together, these signatures support more prominent organic-nitrate-related oxidized-N functionality in urban extracts, without establishing organic nitrate abundance or a quantitative oxidation-state contrast for bulk ON. The four ship-influenced extracts showed elevated ratios relative to marine extracts and higher assigned imidazole-like fragment fractions than both marine and urban extracts, providing exploratory evidence of compositional differences under ship influence. Third, the estimated summer campaign–mean PM2.5-bound N dry-deposition fluxes were approximately 0.036 and 0.040 mg N m−2 d−1 for the marine and coastal urban environments, respectively. These estimates are of similar magnitude, and sensitivity to the assumed deposition parameters precludes a firm conclusion about a marine–urban flux difference.
These findings have several implications beyond deposition magnitude alone.
4.1 Implications for model representation of atmospheric N speciation in coastal megacity regions
The contrasting marine–urban nitrogen chemistry documented here indicates differences in aerosol N composition across the land–sea interface, even when bulk concentrations are similar. This has implications for source apportionment and chemical transport modeling in coastal megacity systems: representing PM2.5 N as a single bulk pool, or applying urban-derived ON source profiles to adjacent marine grid cells, may obscure compositional differences and bias source attribution over the coastal ocean. Our results motivate evaluating the representation of the following processes in coupled urban–marine models of the GBA: (a) organic nitrate formation through VOC oxidation involving NOx in the urban plume, (b) possible contributions from amine-related reduced-ON chemistry in the marine environment, and (c) primary ship emissions, mixing with surrounding aerosol, and subsequent multiphase processing of N-containing organics. These are candidate processes established by the present measurements. In particular, the imidazole-like fragment signatures in the ship-influenced extracts motivate further investigation of the relative roles of direct emissions and atmospheric processing.
4.2 Implications for nitrogen deposition budgets and management
Two practical points follow from the deposition analysis. First, because the present estimates include only PM2.5-bound N and represent a three-week summer campaign, they should not be interpreted as annual total-N deposition budgets or compared directly with annual deposition estimates that include gas-phase and coarse-mode components. The exclusion of coarse particulate N, gaseous reactive nitrogen (NH3, HNO3, and organic-N vapors), wet deposition, and seasonal variability means that the present estimates represent only a partial and campaign-specific component of atmospheric N input to the GBA coastal ocean. Closing the regional atmospheric N deposition budget will require year-round paired marine–urban observations encompassing fine and coarse particles, gaseous N species, and wet deposition. Second, the observed differences in nitrogen composition highlight the value of considering chemical form alongside total deposition flux in coastal assessments. Changes in precursor emissions and meteorology may alter both the magnitude and composition of atmospheric N inputs, motivating coordinated monitoring of inorganic and organic nitrogen. Integrating chemically resolved atmospheric deposition estimates into chemical transport models coupled with coastal biogeochemical models, supported by seawater nutrient and biological observations, would help evaluate how different N inputs contribute to coastal nutrient supply and assess their potential relevance to eutrophication and harmful algal bloom risk.
4.3 Potential implications for marine ecosystem responses
The chemical form of deposited N influences its bioavailability and biogeochemical fate. The inorganic and organic N components measured here may differ in their availability to marine organisms, although bioavailability was not directly assessed. For example, NH is readily assimilable and often energetically favored over NO for phytoplankton uptake. The marine CHN fragment signatures are compatible with reduced-N-containing precursors, but do not establish enrichment of bioavailable reduced ON. In the South China Sea, atmospheric N deposition has been estimated to support on the order of ∼ 20 % of annual new production in some assessments (Kim et al., 2014), and episodic aerosol nutrient inputs can shift nutrient limitation (e.g., by increasing nutrient supply N:P ratios) and promote bloom-favorable conditions in coastal–shelf waters (Mackey et al., 2017; Guo et al., 2022). Our deposition estimates provide a campaign-specific constraint on fine-particle atmospheric N inputs for such assessments, but do not establish changes in seawater nutrient stoichiometry, productivity or ecosystem state. These potential implications warrant particular consideration in the eastern GBA coastal waters, including Mirs Bay in region C (Fig. 2a), where summer waters are less directly affected by nutrient-rich Pearl River discharge and have been reported to exhibit relatively low nutrient concentrations (Li et al., 2020; Lo et al., 2025). Atmospheric N inputs could have greater relative importance where other nutrient inputs are smaller, although lower nutrient concentrations alone do not establish N limitation. The contribution of aerosol inorganic and organic N to bioavailable nutrient supply and local productivity in these waters therefore merits further assessment through coordinated deposition, seawater nutrient and biological measurements.
Building on the limitations identified in this study, three future research priorities emerge. First, uncertainty in Vd remains a major limitation of the deposition estimates. Future cruises should combine shipboard measurements of friction velocity and atmospheric stability with particle-size distributions to better constrain deposition calculations. Second, molecular-level identification and quantification of the compounds underlying the observed N-containing fragment signatures, complemented by bioavailability experiments, would help clarify their sources and potential contribution to marine nutrient supply. Third, the compositional features observed in the four ship-influenced samples merit dedicated investigation, given the GBA's role as a major shipping region and the potential for ship plumes to act as distinct chemical reactors at the air–sea interface. Targeted measurements across plume ages and background conditions, with a larger sample set, would help distinguish direct emissions from mixing and subsequent atmospheric processing, and assess the representativeness of these N-containing organic fragment signatures.
Due to project data-sharing restrictions, the data are not publicly available but can be obtained for scientific research purposes upon request from the corresponding author (jian.yu@ust.hk).
The supplement related to this article is available online at https://doi.org/10.5194/acp-26-15273-2026-supplement.
C.C. and J.Z.Y. designed the research. C.C. collected the marine samples. C.C., W. Chen, W.H.M.W., N.S., and K.Z. conducted the sample analysis. W.Cheng and J.G. organized the cruise and designed the cruise routes. C.C. and J.Z.Y. performed the data interpretation. C.C. wrote the paper. All authors contributed to the paper with useful scientific discussions.
The contact author has declared that none of the authors has any competing interests.
Publisher's note: Copernicus Publications remains neutral with regard to jurisdictional claims made in the text, published maps, institutional affiliations, or any other geographical representation in this paper. The authors bear the ultimate responsibility for providing appropriate place names. Views expressed in the text are those of the authors and do not necessarily reflect the views of the publisher.
We thank support from the Center for Ocean Research in Hong Kong and Macau, a joint research centre for ocean research between Laoshan Laboratory and HKUST.
This research has been supported by the Hong Kong Research Grants Council (grant nos. AoE/P-601/23-N, CRS_HKUST605/24, and SRFS2526-6S05).
This paper was edited by Bingbing Wang and reviewed by two anonymous referees.
Abdullahi, K. L., Delgado-Saborit, J. M., and Harrison, R. M.: Emissions and indoor concentrations of particulate matter and its specific chemical components from cooking: A review, Atmos. Environ., 71, 260–294, https://doi.org/10.1016/j.atmosenv.2013.01.061, 2013.
Altieri, K. E., Fawcett, S. E., Peters, A. J., Sigman, D. M., and Hastings, M. G.: Marine biogenic source of atmospheric organic nitrogen in the subtropical North Atlantic, P. Natl. Acad. Sci. USA, 113, 925–930, https://doi.org/10.1073/pnas.1516847113, 2016.
Anderson, D. M., Glibert, P. M., and Burkholder, J. M.: Harmful algal blooms and eutrophication: Nutrient sources, composition, and consequences, Estuaries, 25, 704–726, https://doi.org/10.1007/BF02804901, 2002.
Bian, Q., Huang, X. H. H., and Yu, J. Z.: One-year observations of size distribution characteristics of major aerosol constituents at a coastal receptor site in Hong Kong – Part 1: Inorganic ions and oxalate, Atmos. Chem. Phys., 14, 9013–9027, https://doi.org/10.5194/acp-14-9013-2014, 2014.
Bruns, E. A., Perraud, V., Zelenyuk, A., Ezell, M. J., Johnson, S. N., Yu, Y., Imre, D., Finlayson-Pitts, B. J., and Alexander, M. L.: Comparison of FTIR and Particle Mass Spectrometry for the Measurement of Particulate Organic Nitrates, Environ. Sci. Technol., 44, 1056–1061, https://doi.org/10.1021/es9029864, 2010.
Calderón, S. M., Poor, N. D., and Campbell, S. W.: Estimation of the particle and gas scavenging contributions to wet deposition of organic nitrogen, Atmos. Environ., 41, 4281–4290, https://doi.org/10.1016/j.atmosenv.2006.06.067, 2007.
Chen, J., Fu, X., Wang, X., Dong, S., Chen, T., Xue, L., Zhou, Y., Sheng, L., and Wang, W.: Unveiling the overlooked direct emissions of particulate organic nitrates from ship, Environ. Int., 185, 108487, https://doi.org/10.1016/j.envint.2024.108487, 2024.
Chow, J. C., Watson, J. G., Chen, L. W., Chang, M. C., Robinson, N. F., Trimble, D., and Kohl, S.: The IMPROVE_A temperature protocol for thermal/optical carbon analysis: maintaining consistency with a long-term database, J. Air Waste Manage. Assoc., 57, 1014–1023, https://doi.org/10.3155/1047-3289.57.9.1014, 2007.
Chow, W. S., Liao, K., Huang, X. H. H., Leung, K. F., Lau, A. K. H., and Yu, J. Z.: Measurement report: The 10-year trend of PM2.5 major components and source tracers from 2008 to 2017 in an urban site of Hong Kong, China, Atmos. Chem. Phys., 22, 11557–11577, https://doi.org/10.5194/acp-22-11557-2022, 2022.
Daellenbach, K. R., Bozzetti, C., Křepelová, A., Canonaco, F., Wolf, R., Zotter, P., Fermo, P., Crippa, M., Slowik, J. G., Sosedova, Y., Zhang, Y., Huang, R.-J., Poulain, L., Szidat, S., Baltensperger, U., El Haddad, I., and Prévôt, A. S. H.: Characterization and source apportionment of organic aerosol using offline aerosol mass spectrometry, Atmos. Meas. Tech., 9, 23–39, https://doi.org/10.5194/amt-9-23-2016, 2016.
Davies, J. A. and Cox, R. A.: Kinetics of the Heterogeneous Reaction of HNO3 with NaCl: Effect of Water Vapor, J. Phys. Chem. A, 102, 7631–7642, https://doi.org/10.1021/jp982134t, 1998.
Day, D. A., Campuzano-Jost, P., Nault, B. A., Palm, B. B., Hu, W., Guo, H., Wooldridge, P. J., Cohen, R. C., Docherty, K. S., Huffman, J. A., de Sá, S. S., Martin, S. T., and Jimenez, J. L.: A systematic re-evaluation of methods for quantification of bulk particle-phase organic nitrates using real-time aerosol mass spectrometry, Atmos. Meas. Tech., 15, 459–483, https://doi.org/10.5194/amt-15-459-2022, 2022.
DeCarlo, P. F., Kimmel, J. R., Trimborn, A., Northway, M. J., Jayne, J. T., Aiken, A. C., Gonin, M., Fuhrer, K., Horvath, T., Docherty, K. S., Worsnop, D. R., and Jimenez, J. L.: Field-Deployable, High-Resolution, Time-of-Flight Aerosol Mass Spectrometer, Anal. Chem., 78, 8281–8289, https://doi.org/10.1021/ac061249n, 2006.
Diaz, R. J. and Rosenberg, R.: Spreading Dead Zones and Consequences for Marine Ecosystems, Science, 321, 926–929, https://doi.org/10.1126/science.1156401, 2008.
Duce, R. A., LaRoche, J., Altieri, K., Arrigo, K. R., Baker, A. R., Capone, D. G., Cornell, S., Dentener, F., Galloway, J., Ganeshram, R. S., Geider, R. J., Jickells, T., Kuypers, M. M., Langlois, R., Liss, P. S., Liu, S. M., Middelburg, J. J., Moore, C. M., Nickovic, S., Oschlies, A., Pedersen, T., Prospero, J., Schlitzer, R., Seitzinger, S., Sorensen, L. L., Uematsu, M., Ulloa, O., Voss, M., Ward, B., and Zamora, L.: Impacts of Atmospheric Anthropogenic Nitrogen on the Open Ocean, Science, 320, 893–897, https://doi.org/10.1126/science.1150369, 2008.
Farmer, D. K., Matsunaga, A., Docherty, K. S., Surratt, J. D., Seinfeld, J. H., Ziemann, P. J., and Jimenez, J. L.: Response of an aerosol mass spectrometer to organonitrates and organosulfates and implications for atmospheric chemistry, P. Natl. Acad. Sci. USA, 107, 6670–6675, https://doi.org/10.1073/pnas.0912340107, 2010.
Farmer, D. K., Boedicker, E. K., and DeBolt, H. M.: Dry Deposition of Atmospheric Aerosols: Approaches, Observations, and Mechanisms, Annu. Rev. Phys. Chem., 72, 375–397, https://doi.org/10.1146/annurev-physchem-090519-034936, 2021.
Fry, J. L., Kiendler-Scharr, A., Rollins, A. W., Wooldridge, P. J., Brown, S. S., Fuchs, H., Dubé, W., Mensah, A., dal Maso, M., Tillmann, R., Dorn, H.-P., Brauers, T., and Cohen, R. C.: Organic nitrate and secondary organic aerosol yield from NO3 oxidation of β-pinene evaluated using a gas-phase kinetics/aerosol partitioning model, Atmos. Chem. Phys., 9, 1431–1449, https://doi.org/10.5194/acp-9-1431-2009, 2009.
Fry, J. L., Kiendler-Scharr, A., Rollins, A. W., Brauers, T., Brown, S. S., Dorn, H.-P., Dubé, W. P., Fuchs, H., Mensah, A., Rohrer, F., Tillmann, R., Wahner, A., Wooldridge, P. J., and Cohen, R. C.: SOA from limonene: role of NO3 in its generation and degradation, Atmos. Chem. Phys., 11, 3879–3894, https://doi.org/10.5194/acp-11-3879-2011, 2011.
Galloway, J. N., Townsend, A. R., Erisman, J. W., Bekunda, M., Cai, Z., Freney, J. R., Martinelli, L. A., Seitzinger, S. P., and Sutton, M. A.: Transformation of the Nitrogen Cycle: Recent Trends, Questions, and Potential Solutions, Science, 320, 889–892, https://doi.org/10.1126/science.1136674, 2008.
Ge, X., Sun, Y., Trousdell, J., Chen, M., and Zhang, Q.: Enhancing characterization of organic nitrogen components in aerosols and droplets using high-resolution aerosol mass spectrometry, Atmos. Meas. Tech., 17, 423–439, https://doi.org/10.5194/amt-17-423-2024, 2024.
González Benítez, J. M., Cape, J. N., Heal, M. R., van Dijk, N., and Díez, A. V.: Atmospheric nitrogen deposition in south-east Scotland: Quantification of the organic nitrogen fraction in wet, dry and bulk deposition, Atmos. Environ., 43, 4087–4094, https://doi.org/10.1016/j.atmosenv.2009.04.061, 2009.
Graeffe, F., Heikkinen, L., Garmash, O., Aijala, M., Allan, J., Feron, A., Cirtog, M., Petit, J. E., Bonnaire, N., Lambe, A., Favez, O., Albinet, A., Williams, L. R., and Ehn, M.: Detecting and Characterizing Particulate Organic Nitrates with an Aerodyne Long-ToF Aerosol Mass Spectrometer, ACS Earth Space Chem., 7, 230–242, https://doi.org/10.1021/acsearthspacechem.2c00314, 2023.
Guimbaud, C., Arens, F., Gutzwiller, L., Gäggeler, H. W., and Ammann, M.: Uptake of HNO3 to deliquescent sea-salt particles: a study using the short-lived radioactive isotope tracer 13N, Atmos. Chem. Phys., 2, 249–257, https://doi.org/10.5194/acp-2-249-2002, 2002.
Guo, C., Zhou, Y., Zhou, H., Su, C., and Kong, L.: Aerosol Nutrients and Their Biological Influence on the Northwest Pacific Ocean (NWPO) and Its Marginal Seas, Biology, 11, https://doi.org/10.3390/biology11060842, 2022.
He, J., Balasubramanian, R., Burger, D. F., Hicks, K., Kuylenstierna, J. C. I., and Palani, S.: Dry and wet atmospheric deposition of nitrogen and phosphorus in Singapore, Atmos. Environ., 45, 2760–2768, https://doi.org/10.1016/j.atmosenv.2011.02.036, 2011.
Howarth, R. W. and Marino, R.: Nitrogen as the limiting nutrient for eutrophication in coastal marine ecosystems: Evolving views over three decades, Limnol. Oceanogr., 51, 364–376, https://doi.org/10.4319/lo.2006.51.1_part_2.0364, 2006.
Hui, E. C. M., Li, X., Chen, T., and Lang, W.: Deciphering the spatial structure of China's megacity region: A new bay area – The Guangdong-Hong Kong-Macao Greater Bay Area in the making, Cities, 105, https://doi.org/10.1016/j.cities.2018.10.011, 2020.
Jia, Y., Yu, G., Gao, Y., He, N., Wang, Q., Jiao, C., and Zuo, Y.: Global inorganic nitrogen dry deposition inferred from ground- and space-based measurements, Sci. Rep., 6, 19810, https://doi.org/10.1038/srep19810, 2016.
Jickells, T., Baker, A. R., Cape, J. N., Cornell, S. E., and Nemitz, E.: The cycling of organic nitrogen through the atmosphere, Philos. T. Roy. Soc. B, 368, 20130115, https://doi.org/10.1098/rstb.2013.0115, 2013.
Kanakidou, M., Myriokefalitakis, S., Daskalakis, N., Fanourgakis, G., Nenes, A., Baker, A. R., Tsigaridis, K., and Mihalopoulos, N.: Past, Present and Future Atmospheric Nitrogen Deposition, J. Atmos. Sci., 73, 2039–2047, https://doi.org/10.1175/JAS-D-15-0278.1, 2016.
Kanakidou, M., Duce, R. A., Prospero, J. M., Baker, A. R., Benitez-Nelson, C., Dentener, F. J., Hunter, K. A., Liss, P. S., Mahowald, N., Okin, G. S., Sarin, M., Tsigaridis, K., Uematsu, M., Zamora, L. M., and Zhu, T.: Atmospheric fluxes of organic N and P to the global ocean, Global Biogeochem. Cy., 26, https://doi.org/10.1029/2011gb004277, 2012.
Kim, T.-W., Lee, K., Duce, R., and Liss, P.: Impact of atmospheric nitrogen deposition on phytoplankton productivity in the South China Sea, Geophys. Res. Lett., 41, 3156–3162, https://doi.org/10.1002/2014GL059665, 2014.
Kostenidou, E., Martinez-Valiente, A., R'Mili, B., Marques, B., Temime-Roussel, B., Durand, A., André, M., Liu, Y., Louis, C., Vansevenant, B., Ferry, D., Laffon, C., Parent, P., and D'Anna, B.: Technical note: Emission factors, chemical composition, and morphology of particles emitted from Euro 5 diesel and gasoline light-duty vehicles during transient cycles, Atmos. Chem. Phys., 21, 4779–4796, https://doi.org/10.5194/acp-21-4779-2021, 2021.
Lee, M., Shevliakova, E., Stock, C. A., Malyshev, S., and Milly, P. C. D.: Prominence of the tropics in the recent rise of global nitrogen pollution, Nat. Commun., 10, 1437, https://doi.org/10.1038/s41467-019-09468-4, 2019.
Li, D., Gan, J., Hui, R., Liu, Z., Yu, L., Lu, Z., and Dai, M.: Vortex and Biogeochemical Dynamics for the Hypoxia Formation Within the Coastal Transition Zone off the Pearl River Estuary, J. Geophys. Res.-Oceans, 125, https://doi.org/10.1029/2020jc016178, 2020.
Lo, H. W., Yu, X., Chen, H., Chu, W. C., Chung, N. M., Lau, S. W., Li, J., Liang, S., Liao, K., Thomas, H. C. J., Wang, Z., Zhang, Z., Yu, J. Z., and Thibodeau, B.: Tidal currents and atmospheric inorganic nitrogen contribute to diurnal variation of dissolved nutrients and chlorophyll a concentrations in Mirs Bay, Hong Kong, Reg. Stud. Mar. Sci., 81, 103941, https://doi.org/10.1016/j.rsma.2024.103941, 2025.
Luo, L., Kao, S.-J., Bao, H., Xiao, H., Xiao, H., Yao, X., Gao, H., Li, J., and Lu, Y.: Sources of reactive nitrogen in marine aerosol over the Northwest Pacific Ocean in spring, Atmos. Chem. Phys., 18, 6207–6222, https://doi.org/10.5194/acp-18-6207-2018, 2018.
Mackey, K. R. M., Kavanaugh, M. T., Wang, F., Chen, Y., Liu, F., Glover, D. M., Chien, C.-T., and Paytan, A.: Atmospheric and Fluvial Nutrients Fuel Algal Blooms in the East China Sea, Front. Mar. Sci., 4, 2017, https://doi.org/10.3389/fmars.2017.00002, 2017.
Mahowald, N. M., Scanza, R., Brahney, J., Goodale, C. L., Hess, P. G., Moore, J. K., and Neff, J.: Aerosol Deposition Impacts on Land and Ocean Carbon Cycles, Curr. Clim. Change Rep., 3, 16–31, https://doi.org/10.1007/s40641-017-0056-z, 2017.
Nuruddin, M. F., Poon, Y. C. J., He, X., Zhang, Z., Tang, X., Lee, S. S., Zhang, S., He, D., and Wu, L.: Zooplankton Metabolism Shapes Molecular Composition of Dissolved Organic Matter in Coastal Waters, Environ. Sci. Technol., https://doi.org/10.1021/acs.est.6c05592, 2026.
Palta, M. M. and Hartnett, H. E.: Nitrogen Cycle, in: Encyclopedia of Geochemistry: A Comprehensive Reference Source on the Chemistry of the Earth, edited by: White, W. M., Springer International Publishing, Cham, 987–991, https://doi.org/10.1007/978-3-319-39312-4_160, 2018.
Park, J. and Song, H.: Variance of destination region image according to multi-dimensional proximity: A case of the Greater Bay Area, J. Destin. Mark. Manage., 20, https://doi.org/10.1016/j.jdmm.2021.100600, 2021.
Paulot, F., Jacob, D. J., Johnson, M. T., Bell, T. G., Baker, A. R., Keene, W. C., Lima, I. D., Doney, S. C., and Stock, C. A.: Global oceanic emission of ammonia: Constraints from seawater and atmospheric observations, Global Biogeochem. Cy., 29, 1165–1178, https://doi.org/10.1002/2015gb005106, 2015.
Pryor, S. C., Gallagher, M., Sievering, H., Larsen, S. E., Barthelmie, R. J., Birsan, F., Nemitz, E., Rinne, J., Kulmala, M., Grönholm, T., Taipale, R., and Vesala, T.: A review of measurement and modelling results of particle atmosphere–surface exchange, Tellus B, 60, https://doi.org/10.1111/j.1600-0889.2007.00298.x, 2008.
Shi, J., Gao, H., Qi, J., Zhang, J., and Yao, X.: Sources, compositions, and distributions of water-soluble organic nitrogen in aerosols over the China Sea, J. Geophys. Res.-Atmos., 115, https://doi.org/10.1029/2009jd013238, 2010.
Tan, S.-C., Shi, G.-Y., Shi, J.-H., Gao, H.-W., and Yao, X.: Correlation of Asian dust with chlorophyll and primary productivity in the coastal seas of China during the period from 1998 to 2008, J. Geophys. Res., 116, https://doi.org/10.1029/2010jg001456, 2011.
Violaki, K., Zarbas, P., and Mihalopoulos, N.: Long-term measurements of dissolved organic nitrogen (DON) in atmospheric deposition in the Eastern Mediterranean: Fluxes, origin and biogeochemical implications, Mar. Chem., 120, 179–186, https://doi.org/10.1016/j.marchem.2009.08.004, 2010.
Vlachou, A., Daellenbach, K. R., Bozzetti, C., Chazeau, B., Salazar, G. A., Szidat, S., Jaffrezo, J.-L., Hueglin, C., Baltensperger, U., Haddad, I. E., and Prévôt, A. S. H.: Advanced source apportionment of carbonaceous aerosols by coupling offline AMS and radiocarbon size-segregated measurements over a nearly 2-year period, Atmos. Chem. Phys., 18, 6187–6206, https://doi.org/10.5194/acp-18-6187-2018, 2018.
Wang, S. H., Hsu, N. C., Tsay, S. C., Lin, N. H., Sayer, A. M., Huang, S. J., and Lau, W. K. M.: Can Asian dust trigger phytoplankton blooms in the oligotrophic northern South China Sea?, Geophys. Res. Lett., 39, https://doi.org/10.1029/2011gl050415, 2012.
Wedyan, M. A. and Preston, M. R.: The coupling of surface seawater organic nitrogen and the marine aerosol as inferred from enantiomer-specific amino acid analysis, Atmos. Environ., 42, 8698–8705, https://doi.org/10.1016/j.atmosenv.2008.04.038, 2008.
Wu, Y., Liu, J., Zhai, J., Cong, L., Wang, Y., Ma, W., Zhang, Z., and Li, C.: Comparison of dry and wet deposition of particulate matter in near-surface waters during summer, PLoS One, 13, e0199241, https://doi.org/10.1371/journal.pone.0199241, 2018.
Yang, L., Huang, R.-J., Shen, J., Wang, T., Gong, Y., Yuan, W., Liu, Y., Huang, H., You, Q., Huang, D. D., and Huang, C.: New Insights into the Brown Carbon Chromophores and Formation Pathways for Aqueous Reactions of α-Dicarbonyls with Amines and Ammonium, Environ. Sci. Technol., 57, 12351–12361, https://doi.org/10.1021/acs.est.3c04133, 2023.
Yau, Y. Y., Baker, D. M., and Thibodeau, B.: Quantifying the Impact of Anthropogenic Atmospheric Nitrogen Deposition on the Generation of Hypoxia under Future Emission Scenarios in Chinese Coastal Waters, Environ. Sci. Technol., 54, 3920–3928, https://doi.org/10.1021/acs.est.0c00706, 2020.
Yu, X., Pan, Y., Song, W., Li, S., Li, D., Zhu, M., Zhou, H., Zhang, Y., Li, D., Yu, J., Wang, X., and Wang, X.: Wet and Dry Nitrogen Depositions in the Pearl River Delta, South China: Observations at Three Typical Sites With an Emphasis on Water-Soluble Organic Nitrogen, J. Geophys. Res.-Atmos., 125, https://doi.org/10.1029/2019jd030983, 2020.
Yu, X., Li, Q., Ge, Y., Li, Y., Liao, K., Huang, X. H., Li, J., and Yu, J. Z.: Simultaneous Determination of Aerosol Inorganic and Organic Nitrogen by Thermal Evolution and Chemiluminescence Detection, Environ. Sci. Technol., 55, 11579–11589, https://doi.org/10.1021/acs.est.1c04876, 2021.
Yu, X., Wong, Y. K., and Yu, J. Z.: Abundance and sources of organic nitrogen in fine (PM2.5) and coarse (PM2.5−10) particulate matter in urban Hong Kong, Sci. Total Environ., 901, 165880, https://doi.org/10.1016/j.scitotenv.2023.165880, 2023.
Yu, X., Li, Q., Liao, K., Li, Y., Wang, X., Zhou, Y., Liang, Y., and Yu, J. Z.: New measurements reveal a large contribution of nitrogenous molecules to ambient organic aerosol, npj Clim. Atmos. Sci., 7, https://doi.org/10.1038/s41612-024-00620-6, 2024.
Yu, X., Marco Wong, W. H., Cao, C., Zhang, K., Yu, L., Gan, J., and Yu, J. Z.: Significant Contribution of Gaseous Organic Nitrogen to Wet and Dry Nitrogen Deposition: Evidence From Year-Long Monitoring in Coastal Hong Kong, J. Geophys. Res.-Atmos., 131, https://doi.org/10.1029/2025jd046052, 2026.
Zhang, C., Wang, Y., Liu, J., Chen, T., Huang, W., Liu, Z., Chu, B., Ma, Q., and He, H.: Insight into wet scavenging effects on sulfur and nitrogen containing organic compounds in urban Beijing, npj Clim. Atmos. Sci., 7, https://doi.org/10.1038/s41612-024-00756-5, 2024a.
Zhang, J., Yu, L., Li, X., Zhang, C., Shi, T., Wu, X., Yang, C., Gao, W., Li, Q., and Wu, G.: Exploring Annual Urban Expansions in the Guangdong-Hong Kong-Macau Greater Bay Area: Spatiotemporal Features and Driving Factors in 1986–2017, Remote Sens., 12, https://doi.org/10.3390/rs12162615, 2020.
Zhang, L., Gong, S., Padro, J., and Barrie, L.: A size-segregated particle dry deposition scheme for an atmospheric aerosol module, Atmos. Environ., 35, 549–560, https://doi.org/10.1016/S1352-2310(00)00326-5, 2001.
Zhang, L., Jacob, D. J., Knipping, E. M., Kumar, N., Munger, J. W., Carouge, C. C., van Donkelaar, A., Wang, Y. X., and Chen, D.: Nitrogen deposition to the United States: distribution, sources, and processes, Atmos. Chem. Phys., 12, 4539–4554, https://doi.org/10.5194/acp-12-4539-2012, 2012.
Zhang, Q., Jia, S., Chen, W., Mao, J., Yang, L., Krishnan, P., Sarkar, S., Shao, M., and Wang, X.: Contribution of marine biological emissions to gaseous methylamines in the atmosphere: An emission inventory based on multi-source data sets, Sci. Total Environ., 898, 165285, https://doi.org/10.1016/j.scitotenv.2023.165285, 2023.
Zhang, Z. and Yu, J. Z.: Quantifying sensitivity of PM2.5 mass to ammonia and nitrate availability in Hong Kong based on four-year hourly measurements, Environ. Sci. Atmos., 6, 565–578, https://doi.org/10.1039/d5ea00114e, 2026.
Zhang, Z., Liao, K., and Yu, J. Z.: Assessing Temperature-Dependent Bias in Offline Filter-Based Nitrate Measurements: Insights from Multi-Year PM2.5 and PM10 Comparisons with Monitor for Aerosols and Gases in Ambient Air (MARGA), ACS ES&T Air, https://doi.org/10.1021/acsestair.6c00157, 2026.
Zhang, Z. E., Li, J., Zhang, R., Tian, C., Sun, Z., Li, T., Han, M., Yu, K., and Zhang, G.: Increase in Agricultural-Derived NHx and Decrease in Coal Combustion-Derived NOx Result in Atmospheric Particulate N-NH Surpassing N-NO in the South China Sea, Environ. Sci. Technol., 58, 6682–6692, https://doi.org/10.1021/acs.est.3c09173, 2024b.
Zhu, W., Shi, J., Guo, S., Wang, Q., Chen, J., Lou, S., and Hu, M.: Comparative analysis of methods for seasonal particulate organic nitrate estimation in urban areas, npj Clim. Atmos. Sci., 8, 21, https://doi.org/10.1038/s41612-025-00904-5, 2025.
Coastal waters receive nitrogen from the air, but its chemical forms are poorly understood. We sampled airborne particles during a cruise in the Guangdong–Hong Kong–Macau Greater Bay Area and at an urban site in Hong Kong. Nitrogen chemistry differed between urban and marine air, and carbon-containing nitrogen declined offshore. Fine particles supplied nitrogen to coastal waters, highlighting the need to consider its chemical form when assessing nutrient inputs and potential ecosystem effects.
Coastal waters receive nitrogen from the air, but its chemical forms are poorly understood. We...