
the Creative Commons Attribution 4.0 License.
the Creative Commons Attribution 4.0 License.
 | 29 Oct 2026
Impacts of the heterogeneous ammonia uptake on air quality in the North China Plain
Yuxuan Lu
Ruonan Wang
Ningning Zhang

Qiyuan Wang
Yuepeng Pan
Qian Jiang
Xuexi Tie
Previous studies have revealed that the heterogeneous uptake of ammonia (NH3) on secondary organic aerosols (SOA) may influence the NH3 budget, nitrate aerosol chemistry, and the regional PM2.5 burden, also constituting an important source of nitrogen-containing organic compounds (NOCs). However, regional modeling remains hindered by large uncertainties in the uptake coefficient (γ) and limited field-based constraints. In this study, we incorporate a first-order NOCs-forming NH3–SOA reactive-uptake pathway into WRF-Chem and adopt a literature-based sensitivity range of to evaluate its impacts on air quality and particulate organic nitrogen over the North China Plain during November 2017. Laboratory evidence of declining reaction efficiency and comparison with the measured NOCs burden support considering as a conservative upper limit for sustained operation of this pathway under the conditions examined. With , the uptake reaction decreases NH3 concentrations by 0.62 % and inorganic aerosol and PM2.5 concentrations by less than 0.06 %, while producing 1.2 µg m−3 of NOCs in the NCP. These results indicate that the pathway has only a minor influence on NH3 and PM2.5 under the present conditions, but may provide an additional source of particulate organic nitrogen.
- Article
(15928 KB) - Full-text XML
-
Supplement
(1167 KB) - BibTeX
- EndNote


As the only primary alkaline gas in the atmosphere, ammonia plays an important role in atmospheric particulate matter formation, precipitation acidity, and nitrogen deposition to sensitive ecosystems (Behera et al., 2013; Cheng et al., 2016; Pye et al., 2020; Zheng et al., 2023). Major sources of NH3 include animal waste, fertilizer application, combustion processes, and industrial emissions (Seinfeld and Pandis, 1998). In recent years, global ammonia emissions have shown a significant upward trend (Clarisse et al., 2009; Liu et al., 2022a; Xu et al., 2019; Ma et al., 2025). For instance, ammonia concentrations in East Asia increased by 75.7±6.3 % between 2008 and 2018, with an annual growth rate of 5.80±0.61 %yr−1 (Van Damme et al., 2021). NH3 emissions in China, in particular, have nearly tripled since the 1980 s because of rapid population growth (Fu et al., 2020). Satellite and surface observations confirm that the North China Plain (NCP) is one of the largest NH3 emission regions worldwide (Van Damme et al., 2018). Moreover, China's stringent emission-control policies have substantially reduced acidic oxide concentrations since 2013 but inadvertently prolonged the atmospheric lifetime of NH3 (Feng et al., 2021; Wu et al., 2017), contributing to frequent air-pollution events associated with high NH3 levels in the NCP (Wen et al., 2015; Fu et al., 2017; Lachatre et al., 2019).
Ammonia's chemical reactivity further underscores its significance in the atmosphere. It reacts with both inorganic acids (primarily sulfuric and nitric acids) and organic acids to form ammonium salts, contributing to fine particulate matter (Luo et al., 2007; Na et al., 2007; Makar et al., 2009). The acid-base reactions involving inorganic acids are well understood and have been incorporated into atmospheric models. In addition, gas-phase ammonia can react with certain carbonyl compounds in secondary organic aerosols (SOA), leading to the formation of nitrogen-containing organic compounds (NOCs).
The mechanism of ammonia uptake on SOA was first discovered in 2008 (Mang et al., 2008), and the formation of NOCs was confirmed later in laboratory experiments (Laskin et al., 2014; Nguyen et al., 2012). The generated NOCs contribute to atmospheric brown carbon (BrC), a type of light-absorbing organic aerosol with significant impacts on atmospheric chemistry, human health and climate forcing (Laskin et al., 2015; Moise et al., 2015). Recent work has quantified NOCs as a constant component of fine particulate matter (PM2.5) (1.4 % on average), highlighting its potential role in regional radiative forcing (Wang et al., 2022b).
To evaluate the regional air quality implications of this NH3 uptake process, several numerical modeling studies have been conducted using sensitivity experiments to bridge the gap between laboratory kinetics and atmospheric scales. Zhu et al. (2018) first incorporated this mechanism into a large-scale chemical transport model (CTM) for the United States, testing a range of uptake coefficients (γ) from and considering 10−3 to be the upper limit γ. Their results showed that with the γ of 10−3, domain-averaged NH3 concentrations are reduced by 31.3 % in winter and up to 67.0 % in summer. Notably, the study has also demonstrated that the NH3 uptake significantly promotes summer biogenic SOA production in the US through enhanced acid-catalyzed pathways, with specific species like AISO3 increasing by 16.2 % even at a low γ of 10−5.
In the context of China's high-ammonia environment, Wu et al. (2021) performed similar simulations across mainland China. While their results showed that the γ of 10−5 leads to only modest decreases in average NH3 mixing ratios (2.0 % in summer and 4.8 % in winter), the study maintained 10−3 as the primary upper-limit value for regional modeling. With the γ of 10−3, they predicted that the uptake reaction leads to decreases in gas-phase NH3 mixing ratios of 27.5 % (summer) and 19.0 % (winter). This depletion further suppresses ammonium nitrate formation by as much as 30 %, resulting in an overall PM2.5 reduction of approximately 8.9 % in summer and 8.7 % in winter. Collectively, these studies underscore the profound influence of NH3-SOA interactions on regional atmospheric composition and PM budgets.
However, the γ values used in previous regional simulations remain highly uncertain (Liu et al., 2015; Zhu et al., 2018; Wu et al., 2021). In addition, the scarcity of simultaneous observations of NH3, aerosol chemical components, and NOCs limits assessment of this heterogeneous pathway in regional environments. It is therefore important to evaluate the atmospheric implications of literature-based γ values and to ensure that the simulated contribution from an individual reaction pathway does not exceed the upper bound provided by the measured NOCs burden.
During November 2017, a field campaign over the North China Plain and surroundings (NCPs) provided observations of aerosol species, NH3, and NOCs. In this study, we adopt a literature-based sensitivity range of for a simplified NOCs-forming NH3–SOA pathway. These values are selected according to laboratory measurements and previous modeling studies. The observations are used to assess the atmospheric plausibility of the contribution of this pathway and the sensitivity simulations are used to evaluate the corresponding air-quality impacts over the NCP.
2.1 WRF-Chem model and measurements
A modified version of the WRF-Chem model developed by Li et al. (2010, 2011a, b) is used in this study. WRF-Chem provides the online-coupled meteorology, transport, gas-phase chemistry, photolysis, deposition, and aerosol–radiation framework, whereas aerosol processes are represented by the CMAQ/Models-3 AERO5 modal aerosol module incorporated within WRF-Chem. Gas-phase chemistry is represented by the SAPRC-99 mechanism. The WRF-Chem simulations are conducted for November 2017 over the NCP. The base simulation (BASE) does not include the additional NOCs-forming NH3–SOA pathway. Three sensitivity simulations use the γ values of 10−3, 10−4, and 10−5 (S(−3), S(−4), and S(−5), respectively). Further details of the model configuration and simulation domain are provided in Sect. S1, Table S1 in the Supplement, and Fig. 1.
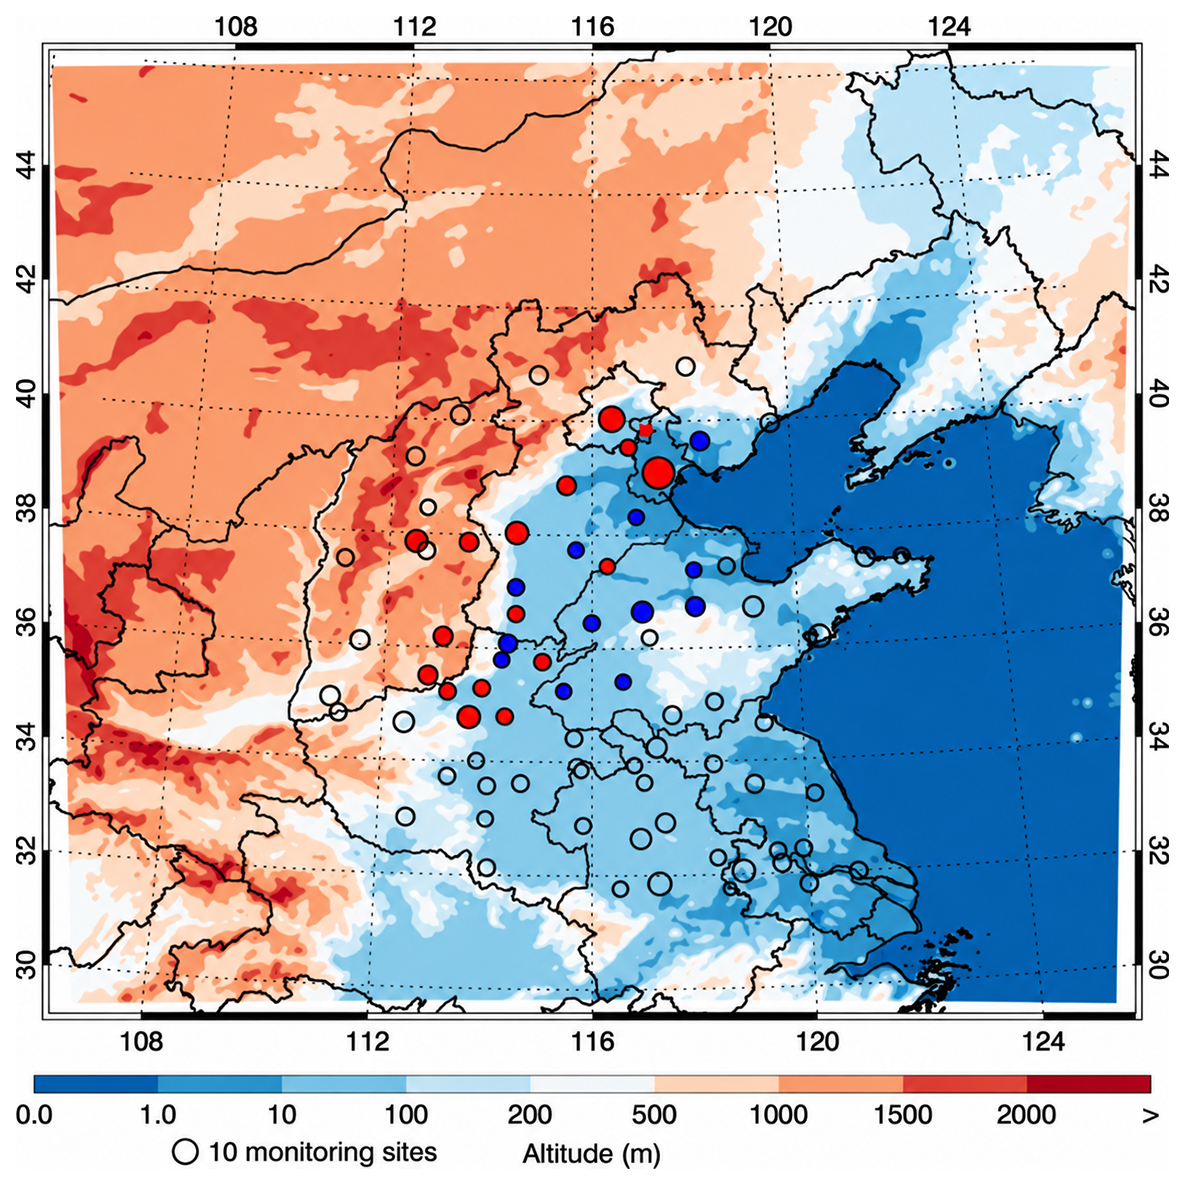
Figure 1WRF-Chem simulation domain with topography. The circles represent centers of cities with ambient monitoring sites, and the circle size denotes the number of ambient monitoring sites of cities. The filled red circles denote those cities with continuous measurement of aerosol components, and the filled blue circles denote the cities with discontinuous measurements of aerosols components. The filled red rectangle indicates the Xianghe station.
Primary NOC emissions are not explicitly resolved in the anthropogenic emission inventory, and the model does not include a separate primary-NOCs tracer. Some nitrogen-containing organic material may be implicitly included within bulk primary organic aerosol (POA) or lumped organic-gas emissions, but it cannot be separately speciated or diagnosed as NOCs. The modeled NOCs concentration therefore represents only the product of the implemented NH3–SOA reactive-uptake pathway and should not be interpreted as total ambient NOCs. Because the measured NOCs burden can include primary emissions and products from other secondary pathways, the model–measurement comparison provides a conservative upper limit for the contribution of this pathway.
The BASE simulation is evaluated using a comprehensive suite of observations, including hourly criteria pollutants (PM2.5, O3, NO2, and SO2) from national networks and daily filter measurements of aerosol chemical components in the NCP. In situ measurements of NH3 and NOCs and Infrared Atmospheric Sounding Interferometer (IASI) satellite products are also used to evaluate model performance. Measurement details are provided in Sect. S2. Model performance is quantified using mean bias (MB), root mean square error (RMSE), and the index of agreement (IOA), as described in Sect. S3.
2.2 Parameterization of the NH3–SOA reactive-uptake pathway
Total heterogeneous uptake of a gaseous species by an aerosol particle may involve gas-phase diffusion, surface accommodation, solvation, condensed-phase diffusion, and chemical reaction (Crowley et al., 2010). The present parameterization does not resolve these steps separately or represent the complete particulate uptake and fate of NH3. For consistency with previous laboratory and modeling studies, we retain the notation γ but interpret it here as an effective coefficient for the implemented NOCs-forming pathway. A literature-based range of is selected based on the laboratory results of Liu et al. (2015) and previous modeling studies (Zhu et al., 2018; Wu et al., 2021). The corresponding first-order loss rate is incorporated into the model for the sensitivity simulations and is calculated as
Here, γ is the net probability that an NH3 collision with an SOA-containing particle ultimately contributes to a particulate organic-N product through the implemented pathway. is the mean molecular speed of NH3, and SSOA is the wet surface-area concentration of SOA.
In this study, modeled NOCs are a lumped representation of reduced-nitrogen organic products that may form when NH3 reacts with reactive organic components of SOA, including carbonyl- or dicarbonyl-containing compounds. After formation, the modeled NOCs undergo dry and wet deposition.
In the real atmosphere, NH3 can react with various SOA species to form NOCs. To simplify the simulation while retaining key chemical characteristics, SOA species are divided into three main categories based on their precursor origins: anthropogenic volatile organic compounds (VOCs), biogenic VOCs, and primary organic components. Each category is assigned a representative molecular weight, which is used in calculating NOCs concentrations. The molecular weights for these SOA categories are adopted from a previously established model framework (Li et al., 2011b).
3.1 Model validation
Figure S1 in the Supplement presents the diurnal profiles of observed and simulated near-surface PM2.5, O3, NO2, and SO2 concentrations averaged across monitoring sites in the NCP during the simulation episode. The model well captures the temporal variations of these pollutants, with IOA values of 0.93, 0.84, 0.83, and 0.67, respectively. Figure S2 compares the simulated and observed spatial distributions of their mean concentrations. The simulated spatial patterns are generally consistent with observations from ambient monitoring stations. Detailed validation results are provided in Sect. S4.
The simulated mass concentrations of key aerosol components are also evaluated against observations, including sulfate, nitrate, ammonium, elemental carbon (EC), primary organic aerosols (POA), and SOA (Fig. 2). The model generally performs well in simulating the sulfate, nitrate and ammonium concentrations, with IOAs of 0.74, 0.87, and 0.85, respectively, but underestimates the sulfate concentration appreciably, with a mean bias (MB) of . The model also reasonably reproduces POA, EC, and SOA concentrations, with the IOA of 0.59, 0.62, and 0.53, respectively. It is worth noting that the model tends to underestimate the carbonaceous aerosols, particularly with regard to POA with a MB of .
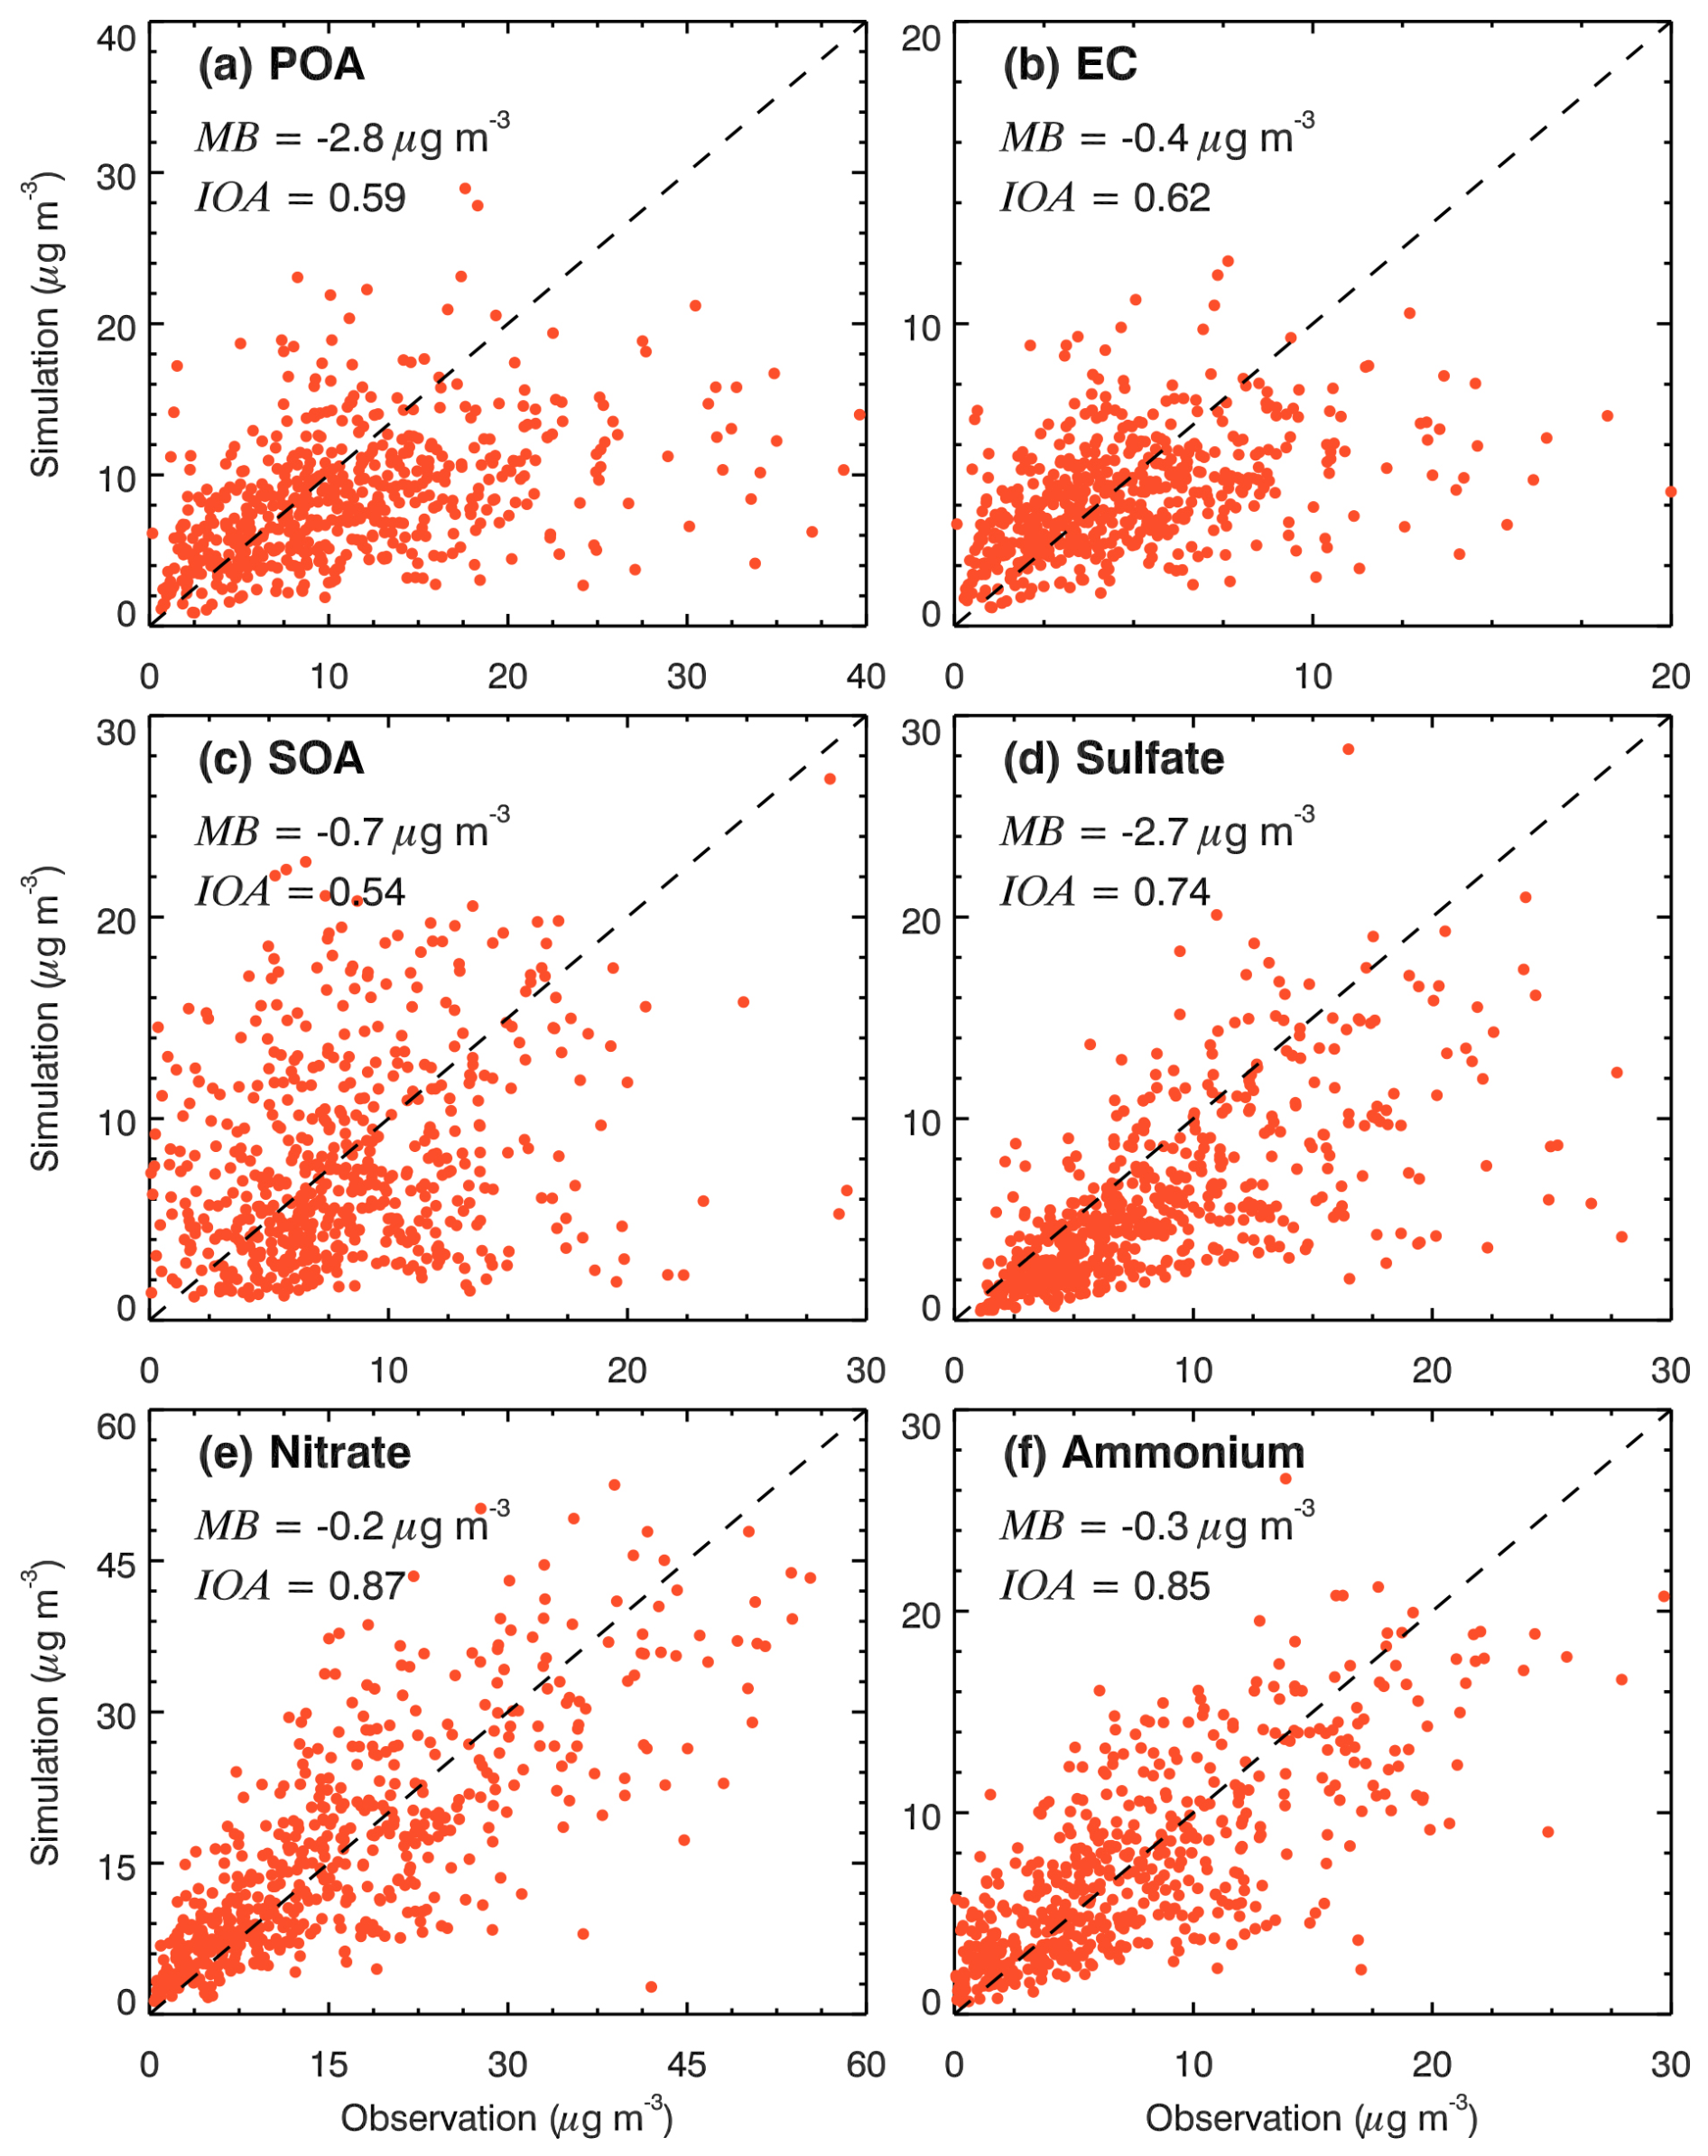
Figure 2Comparison of simulated and observed daily concentrations of (a) POA, (b) EC, (c) SOA, (d) sulfate, (e) nitrate and (f) ammonium aerosols at sites in NCP and surrounding areas in November 2017.
The simulated NH3 vertical column densities (VCDs) show a generally good consistency with the IASI retrievals during the simulation period, with an IOA of 0.66 and MB of , indicating that the model generally reproduces the observed NH3 VCDs with minimal systematic bias (Fig. 3a). Figure 3b displays the comparison of simulated and observed NH3 concentrations at Xianghe station. The model demonstrates a good performance in simulating near-surface NH3 concentrations, with the IOA of 0.66 and the MB of −0.01 ppb. The monthly variation in NH3 emissions is strongly influenced by agricultural practices and environmental conditions such as temperature and wind speed. During the simulation period, the observed NH3 concentrations have exhibited several pronounced peak events in mid-November that the model fails to reproduce. These anomalies are likely associated with localized biomass burning activities (primarily crop and residential wood combustion), which are prevalent in the rural-urban fringe of the NCP during the transition to the heating season (Pan et al., 2018). These episodic emissions explain the discrepancy between simulations and observations.
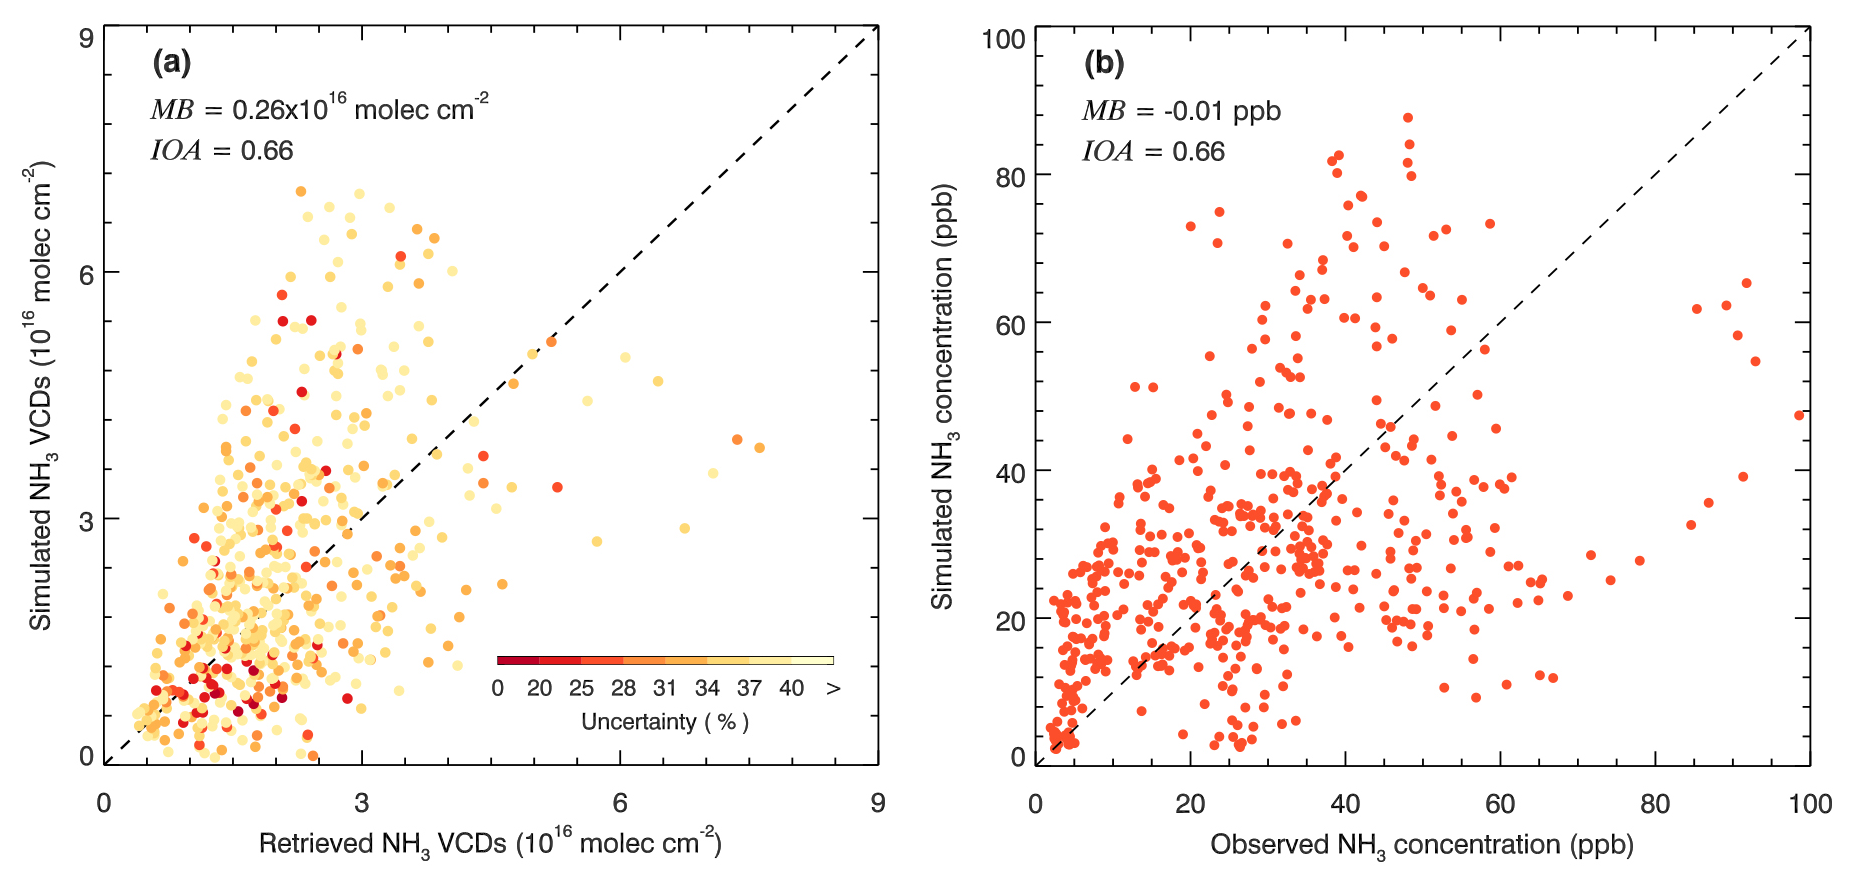
Figure 3(a) Comparison between satellite retrieved and simulated NH3 VCDs and (b) comparison of simulated and observed ammonia concentration at Xianghe in November 2017. In (a), the dot's color indicates the uncertainty (below 40 %) of the retrieved NH3 VCDs. In (a, b), the black dashed line represents the 1:1 reference line.
Overall, the comprehensive validation against multi-source datasets indicates that the model exhibits a good performance in capturing the spatiotemporal variations of both criteria pollutants and NH3, providing a reliable foundation for the subsequent sensitivity analysis.
3.2 Impact of the uptake reaction on concentrations of NH3 and aerosol components
Figure 4a shows the simulated distribution of average near-surface NH3 concentrations during the simulation period. Quantitatively, the modeled NH3 concentrations in the NCP range from 0.24–50.9 µg m−3, with an average of 15.6 µg m−3. These simulated NH3 concentrations are within the range of observations reported in recent studies (Ianniello et al., 2010; Pan et al., 2018; Wang et al., 2022a; Zhang et al., 2021). For example, Ianniello et al. (2010) have reported that the observed daily average NH3 concentrations in Beijing range from 0.20–44.38 µg m−3, and Pan et al. (2018) have reported a regional annual average of 13.4 µg m−3 over the NCP in 2015. Notably, the simulated NH3 peak concentrations are concentrated in southern Hebei and eastern Henan provinces, which has been further verified by recent emission constraints, showing sustained high nitrogen loading in these specific agricultural corridors (Liu et al., 2022b; Yang et al., 2023).
Figure 4b–d shows the net changes in NH3 concentrations in S(−3), S(−4), and S(−5) relative to BASE. In S(−3) and S(−4) (Fig. 4b and c), the pathway decreases NH3 throughout the NCP. The domain-average decrease is approximately 31.4 % (4.9 µg m−3) in S(−3), comparable to the sensitivity reported by Wu et al. (2021), and 5.5 % (0.86 µg m−3) in S(−4), with a maximum local reduction of 26.7 %. In S(−5) (Fig. 4d), the decrease is not spatially uniform, and small positive changes occur in southeastern parts of the domain. Nevertheless, the domain-average NH3 concentration decreases by 0.62 % (0.096 µg m−3), with a maximum local reduction of 5.2 %.
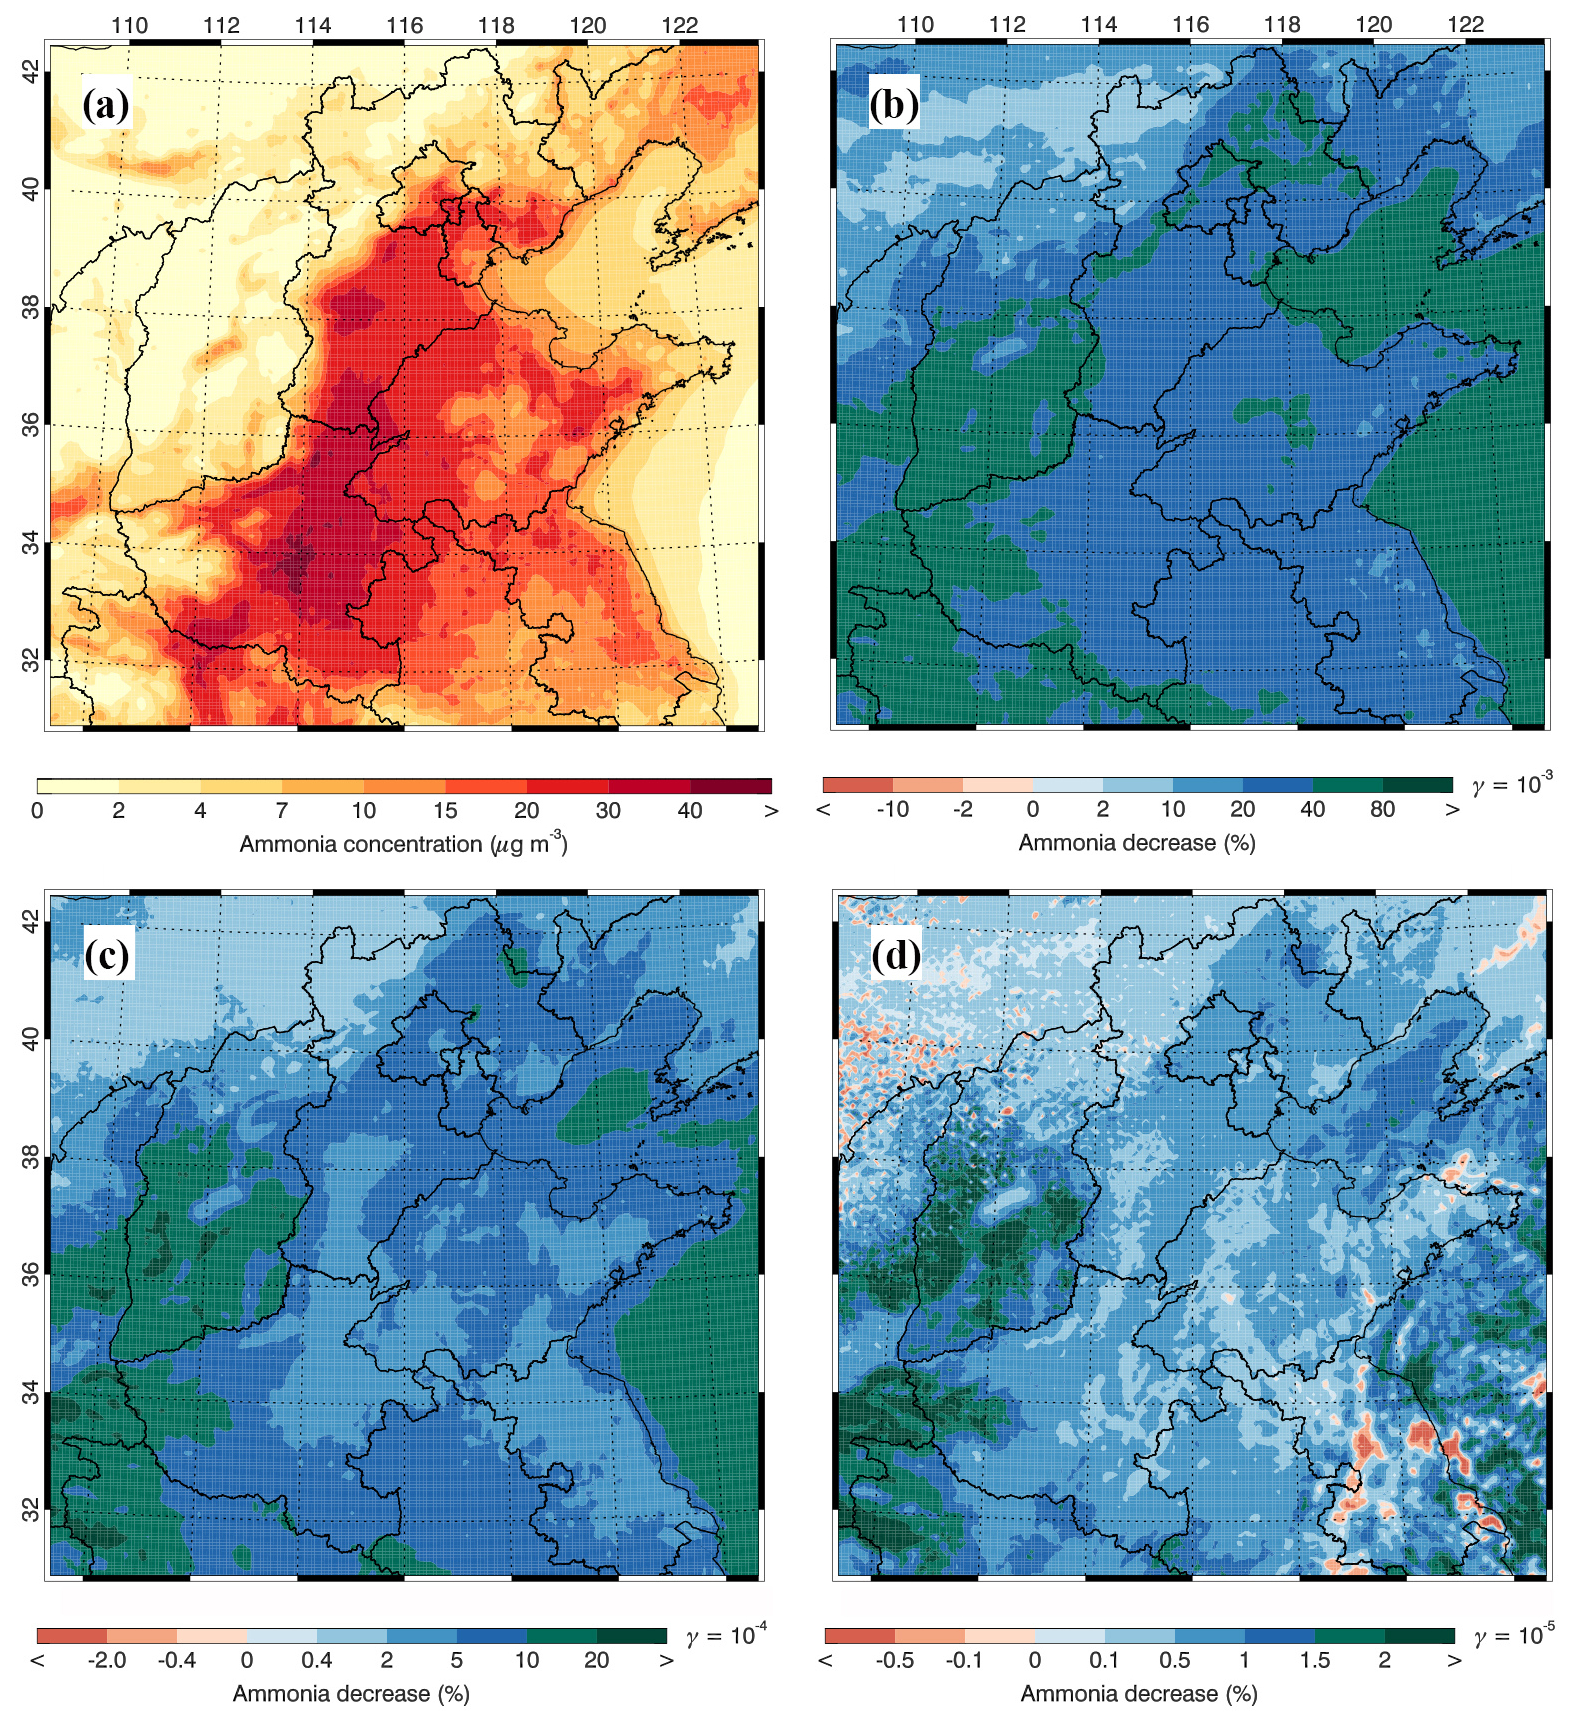
Figure 4(a) simulated (color contours) average near-surface mass concentrations of NH3 and NH3 concentration variation due to NH3 uptake on SOA when the uptake coefficient equals (b) 10−3, (c) 10−4 and (d) 10−5 in November 2017.
Considering that NH3 serves as the sole precursor of ammonium aerosols, the perturbation of NH3 concentrations due to its uptake on SOA directly influences the formation of ammonium aerosols in the atmosphere. Figure 5a shows the pattern comparison of average simulated and observed concentrations of ammonium aerosols during the simulated episode. Both the observation and simulation show high ammonium concentrations in the south of the NCP, generally exceeding 8 µg m−3. In the S(−3) (Fig. 5b), although the NH3 uptake reaction decreases NH3 concentrations by over 30 % in the NCP, it only reduces the ammonium concentration by 5.5 % or 0.86 µg m−3. The ammonium aerosol is formed by neutralizing sulfuric and nitric acids in the atmosphere. The observed and simulated high NH3 level in the NCP indicates that NH3 is excessive after neutralizing inorganic acids to form ammonium salt. Hence, an over 30 % decrease in NH3 concentrations only causes a 5.5 % reduction in ammonium aerosols in the NCP, an NH3-rich region. However, in the NH3-poor region, i.e., in Shanxi province and over oceans, ammonium concentrations decrease considerably.
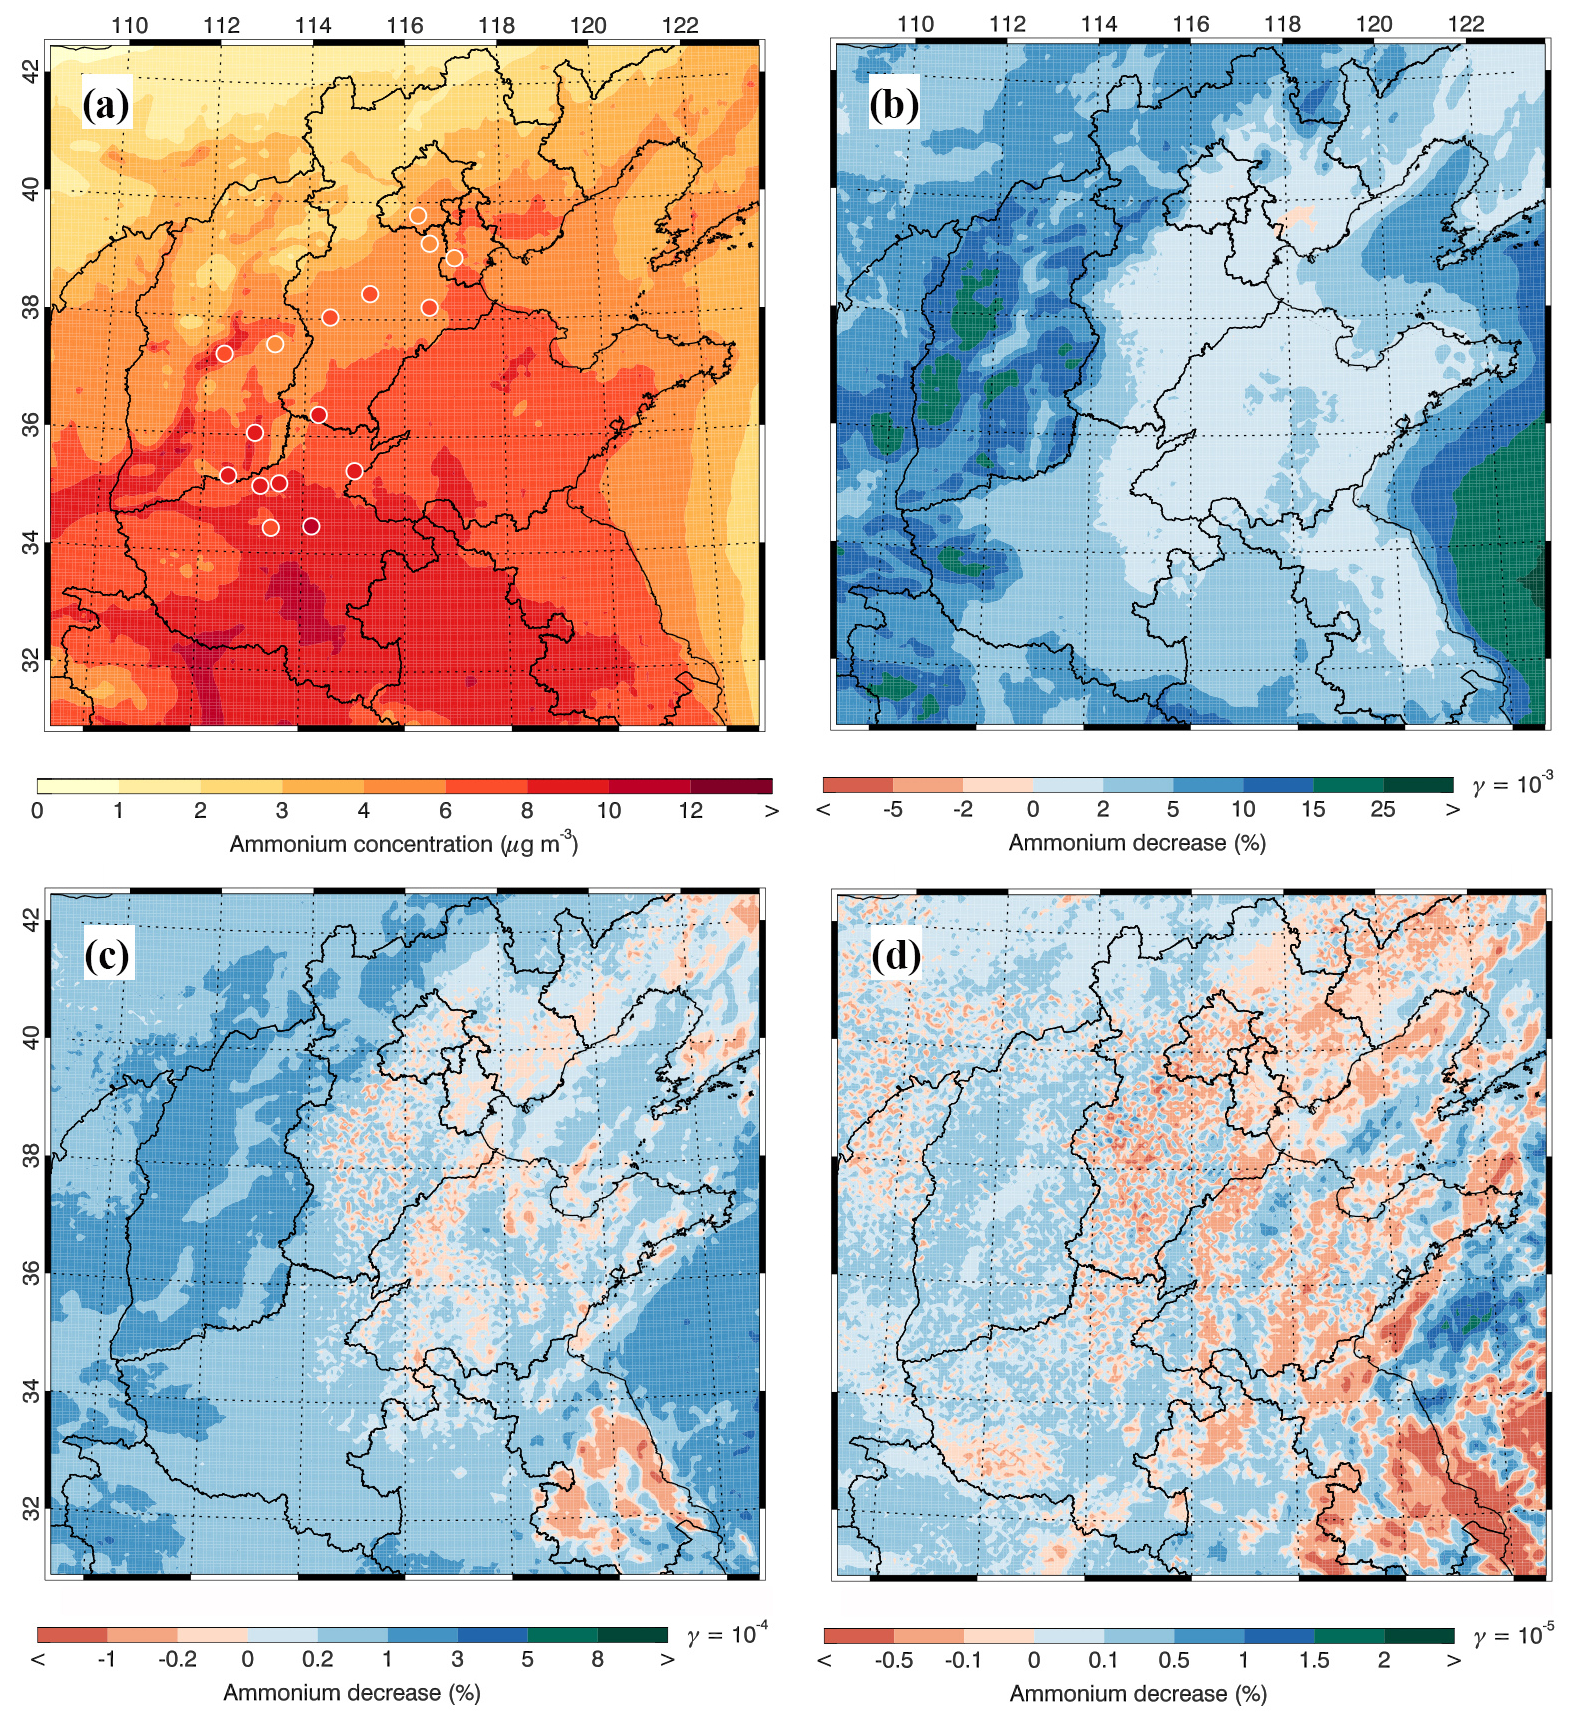
Figure 5(a) Pattern comparisons of simulated (color contours) versus observed (colored circles) average near-surface mass concentrations of ammonium aerosols and their variations due to NH3 uptake on SOA when the uptake coefficient equals (b) 10−3, (c) 10−4 and (d) 10−5 in November 2017.
In S(−4) and S(−5) (Fig. 5c and d), ammonium responses are spatially heterogeneous, with a slight increase north of Beijing. On average, ammonium concentrations decrease by 0.48 % () and 0.048 % (), respectively.
Although reactive uptake itself is strictly a sink for gas-phase NH3, the difference between the sensitivity and BASE simulations represents the net response of all coupled chemical, thermodynamic, and dynamical processes rather than the uptake tendency alone. A two-way coupled WRF–CMAQ study of the same NH3–SOA uptake process have similarly predicted a local increase in NH3 over Iowa, which is attributed to uptake-induced meteorological feedback that reduces the 10 m wind speed and atmospheric dispersion, thereby promoting NH3 accumulation in a high-emission region (Zhu et al., 2022). WRF-Chem studies over the NCP have also shown that aerosol–radiation feedbacks can perturb surface temperature, planetary boundary layer development, and wind fields, leading to spatial redistribution of near-surface pollutants (Bei et al., 2017; Wu et al., 2019). In addition, the ISORROPIA thermodynamic module recalculates the equilibrium partitioning between gaseous NH3 and particulate . Changes in temperature, relative humidity, aerosol liquid water, particle acidity, and nitrate availability may promote NH4NO3 dissociation and partially replenish gas-phase NH3 (Nenes et al., 1998; Pye et al., 2020; Nenes et al., 2020). Therefore, the small positive NH3 values in a limited number of grid cells do not indicate direct NH3 production by the uptake reaction, but likely reflect secondary redistribution, aerosol–radiation interactions and gas–particle repartitioning within the coupled modeling system.
The decrease in ammonium shifts the thermodynamic equilibrium of NH4NO3 toward the gas phase and can reduce particulate nitrate. The model generally reproduces the nitrate distribution (Fig. 6a), with concentrations exceeding 10 µg m−3 and accounting for more than 20 % of PM2.5 in parts of the NCP. In S(−3), nitrate decreases by 4.6 % (0.70 µg m−3) across most of the domain. The responses in S(−4) and S(−5) are smaller and spatially non-uniform because of coupled aerosol–radiation and thermodynamic feedbacks. The domain-average nitrate changes are −0.56 % () and −0.037 % (), respectively.
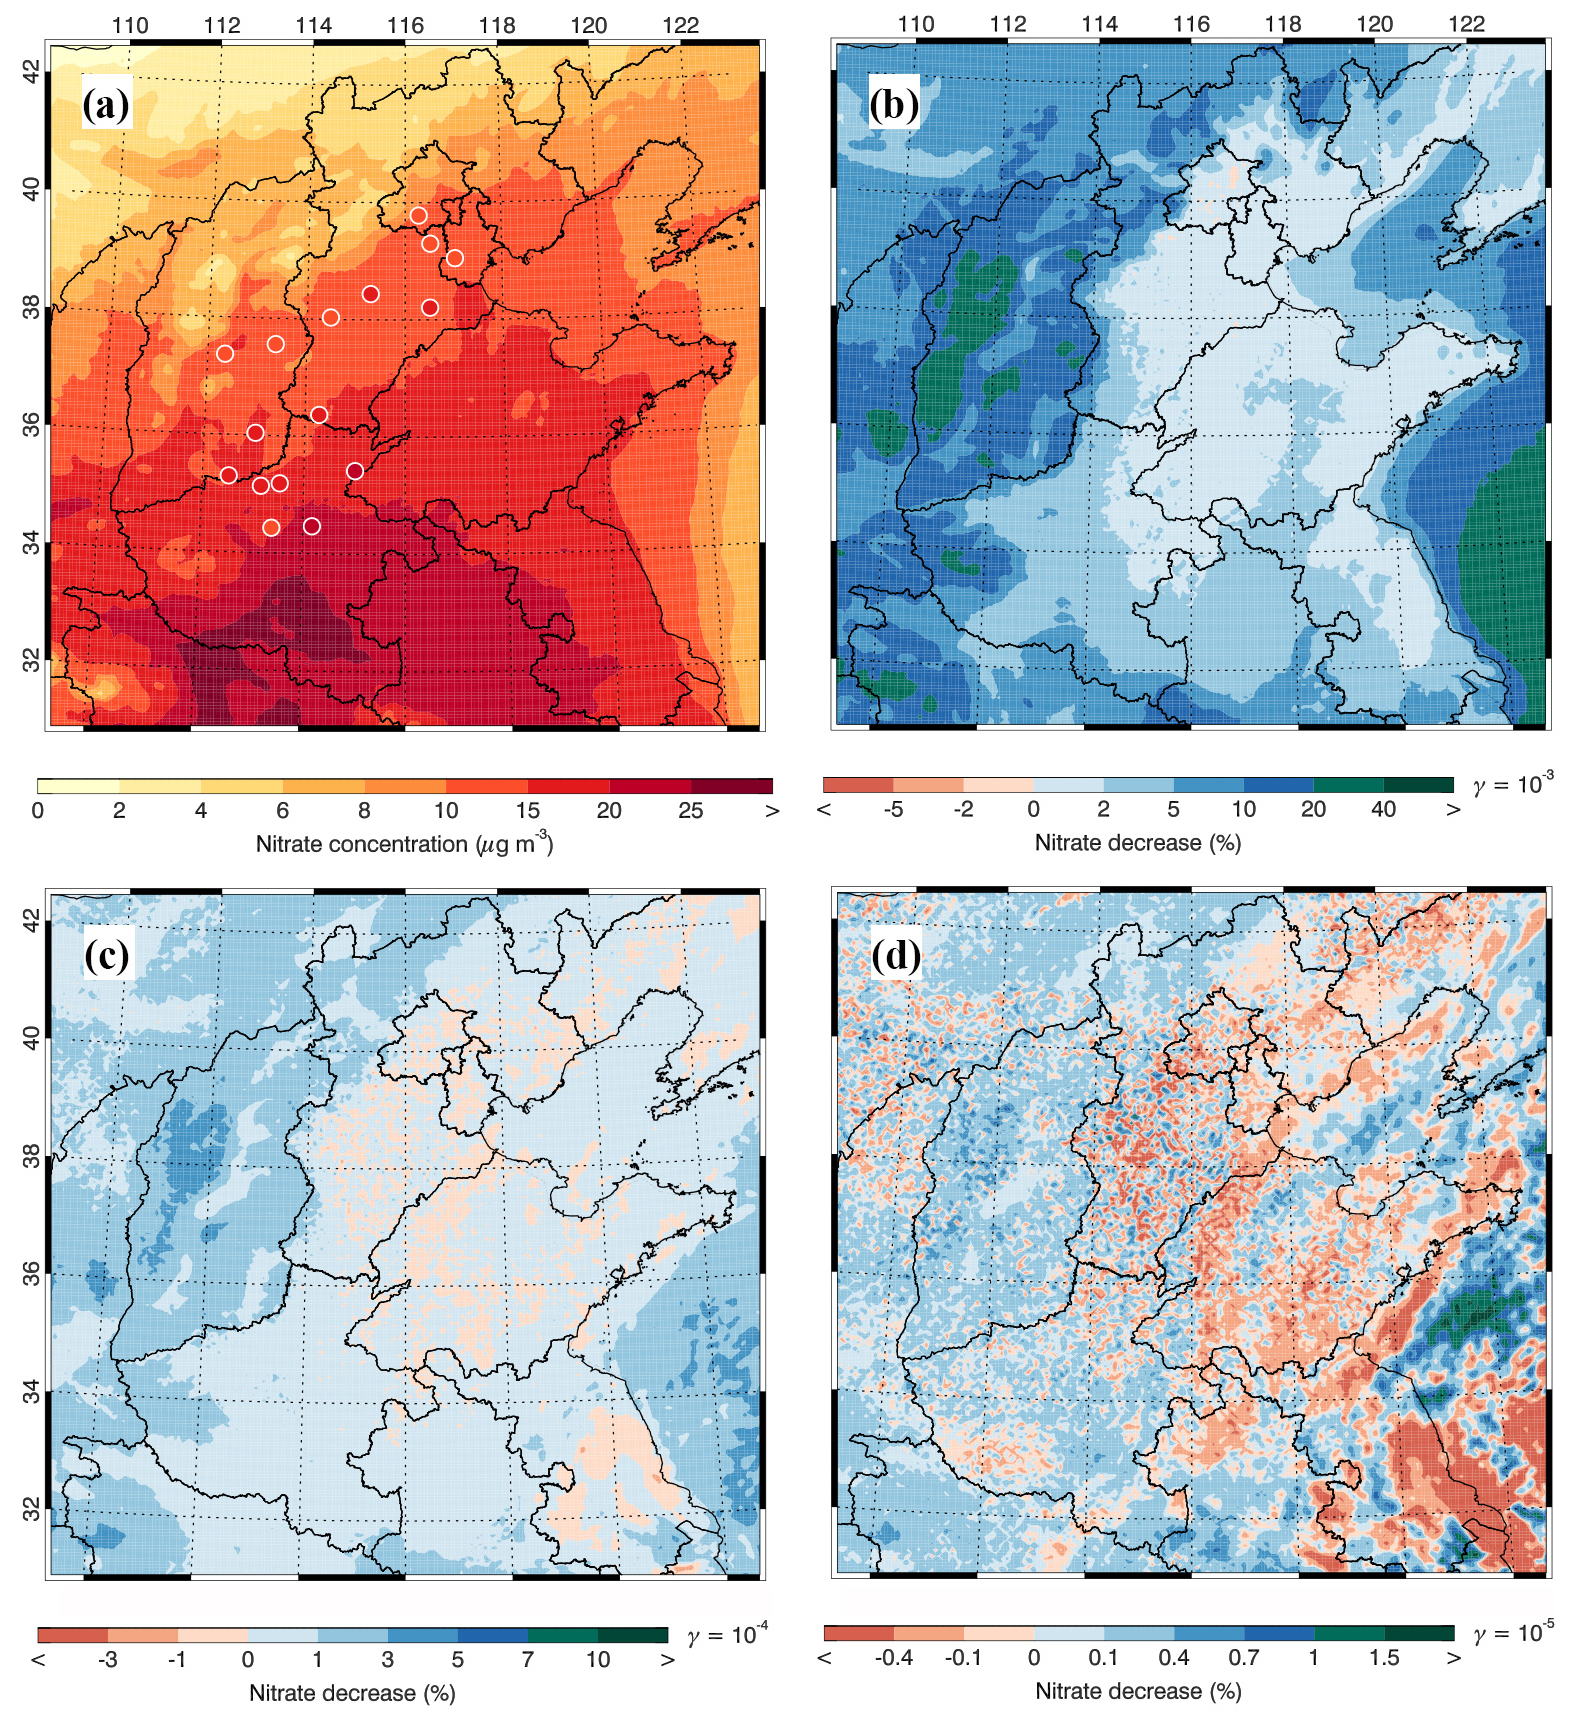
Figure 6(a) Pattern comparisons of simulated (color contours) versus observed (colored circles) average near-surface mass concentrations of nitrate aerosols and their variations due to NH3 uptake on SOA when the uptake coefficient equals (b) 10−3, (c) 10−4 and (d) 10−5 in November 2017.
The reduction in available NH3 can also lower aerosol pH, indirectly suppress aqueous-phase SO2 oxidation, and potentially decrease sulfate formation (Zhu et al., 2018; Zhang et al., 2020; Zhang et al., 2026). Because NH3 is abundant in the NCP, this pH perturbation is expected to be small. Decreases in nitrate and ammonium may also reduce aerosol liquid water (ALW), thereby hindering sulfate formation. The model generally underestimates observed sulfate (Fig. 7a), but the simulated sulfate changes induced by this pathway remain small: the domain-average decreases are 1.1 %, 0.16 %, and 0.059 % in S(−3), S(−4), and S(−5), respectively. At smaller γ values, the sulfate response becomes increasingly spatially heterogeneous (Fig. 7b–d).
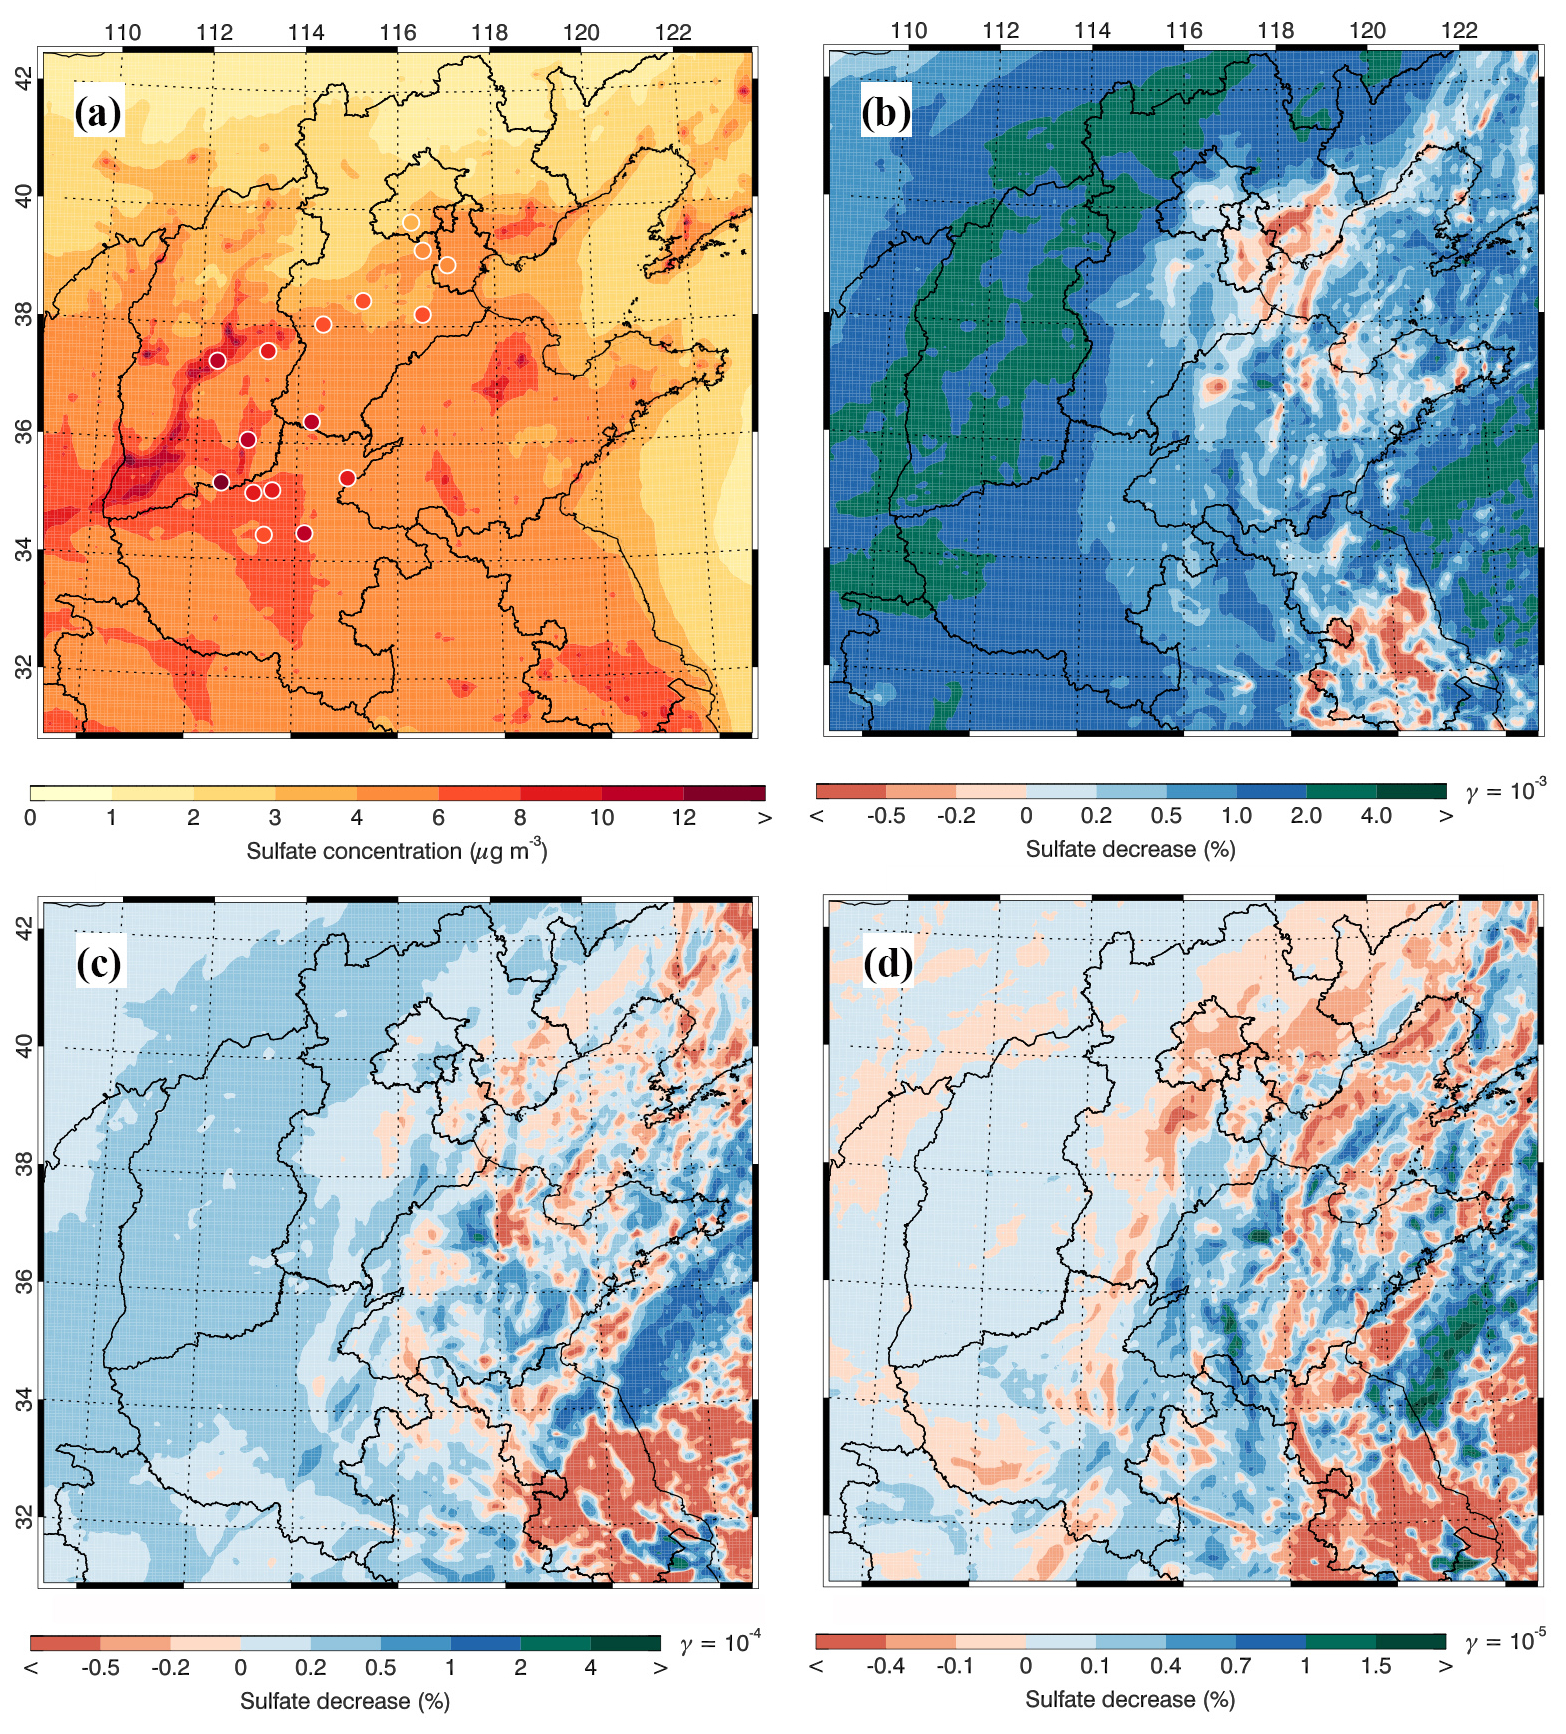
Figure 7(a) Pattern comparisons of simulated (color contours) versus observed (colored circles) average near-surface mass concentrations of sulfate aerosols and their variations due to NH3 uptake on SOA when the uptake coefficient equals (b) 10−3, (c) 10−4 and (d) 10−5 in November 2017.
In all sensitivity simulations, the NH3 loss calculated specifically for the implemented reactive-uptake pathway is converted into a particulate organic nitrogen product while SOA mass is not depleted. The simulated SOA concentration averages 6.8 µg m−3 in the NCP, although urban SOA is generally underestimated (Fig. 8a). S(−3) produces an unrealistically high mean NOCs concentration of 65.5 µg m−3, much higher than the simulated SOA concentration (Fig. 8b). The mean NOCs concentration in S(−4) remains high at 11.3 µg m−3 (Fig. 8c). By contrast, S(−5) produces 1.2 µg m−3, within the magnitude of the measured NOCs burden (Fig. 8d). To place this value in context, Wang et al. (2022b) reported an average NOCs concentration of 1.27 µg m−3 at a regional site in Hebei, and Wang et al. (2024) reported daily concentrations of 0.71–3.89 µg m−3 over the Tibetan region.
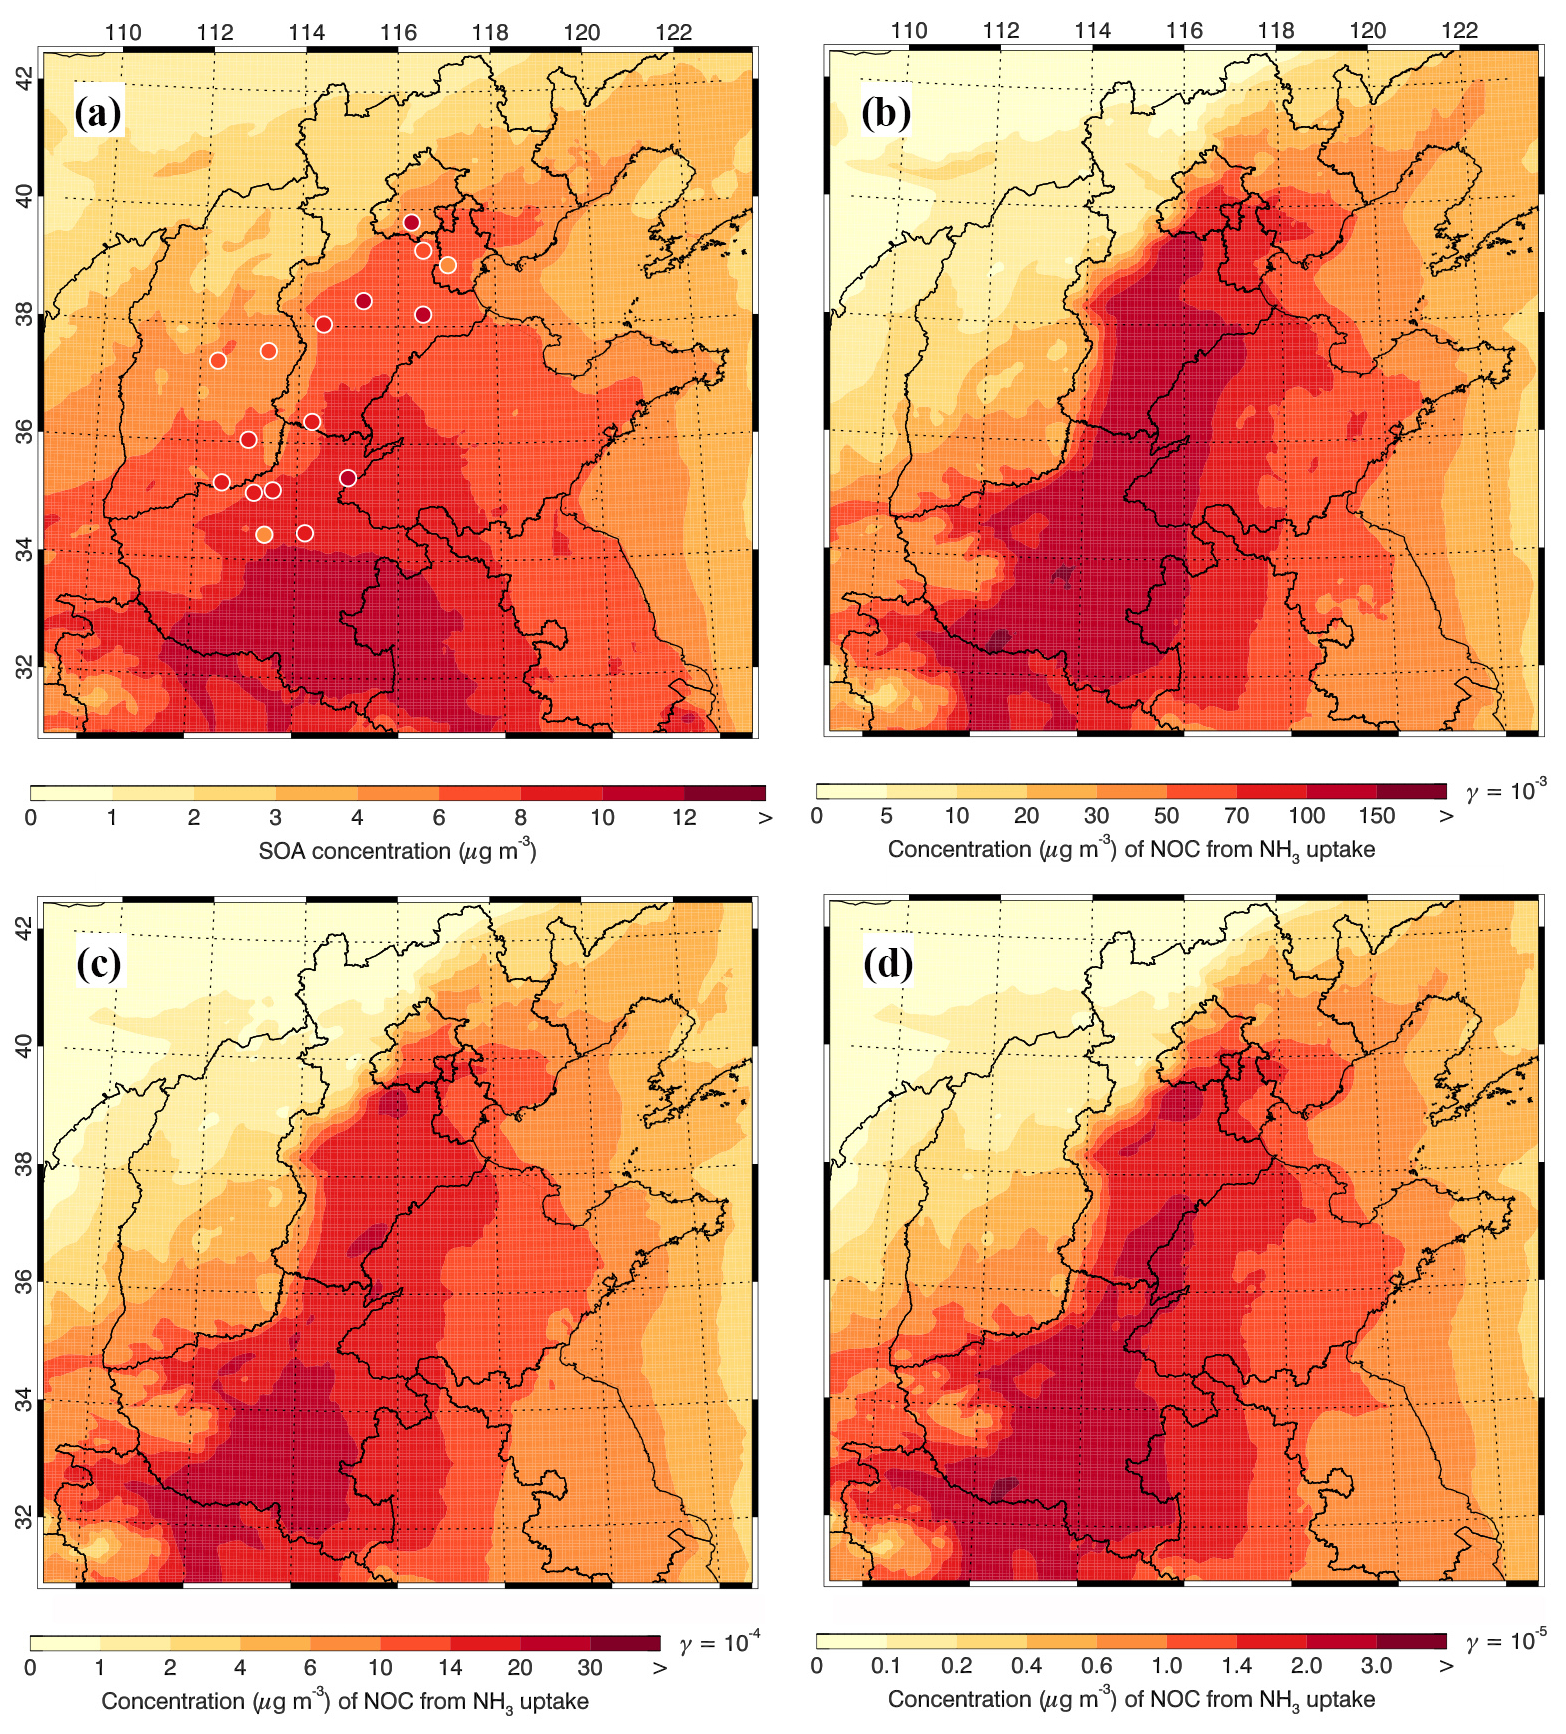
Figure 8(a) Pattern comparisons of simulated (color contours) versus observed (colored circles) near-surface mass concentrations of SOA and the near-surface NOCs concentration due to NH3 uptake on SOA when the uptake coefficient equals (b) 10−3, (c) 10−4 and (d) 10−5 in November 2017.
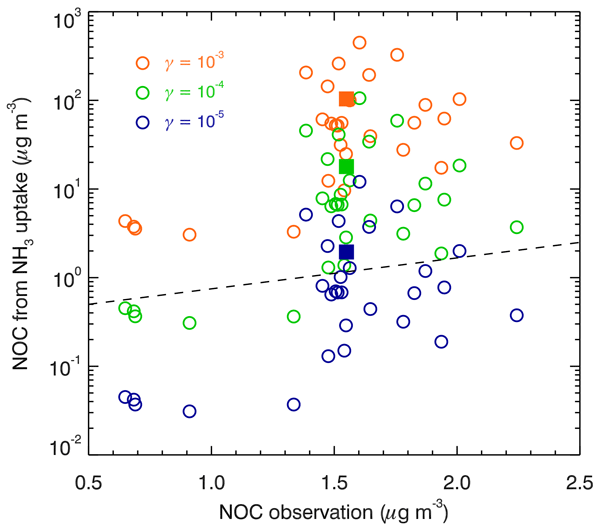
Figure 9 compares measured and simulated daily NOCs concentrations at Xianghe in November 2017. The observed monthly average NOCs concentration is 1.52 µg m−3, ranging from 0.65–2.24 µg m−3. In the S(−3), the model simulates unrealistically high monthly average NOCs concentrations of 85.5 µg m−3 at the station. In the S(−4), the simulated concentration is 14.7 µg m−3, which remains well above the observation. Only in the S(−5) with the γ of 10−5, the simulated concentration is 1.6 µg m−3, which is within the observed range. Therefore, although large γ values are expected to enhance NH3 uptake and accelerate NOCs formation, the γ of 10−5 might be more reasonable to simulate the NH3 uptake on SOA when the simulation is constrained by the observations of NH3 and NOCs as well as other air species.
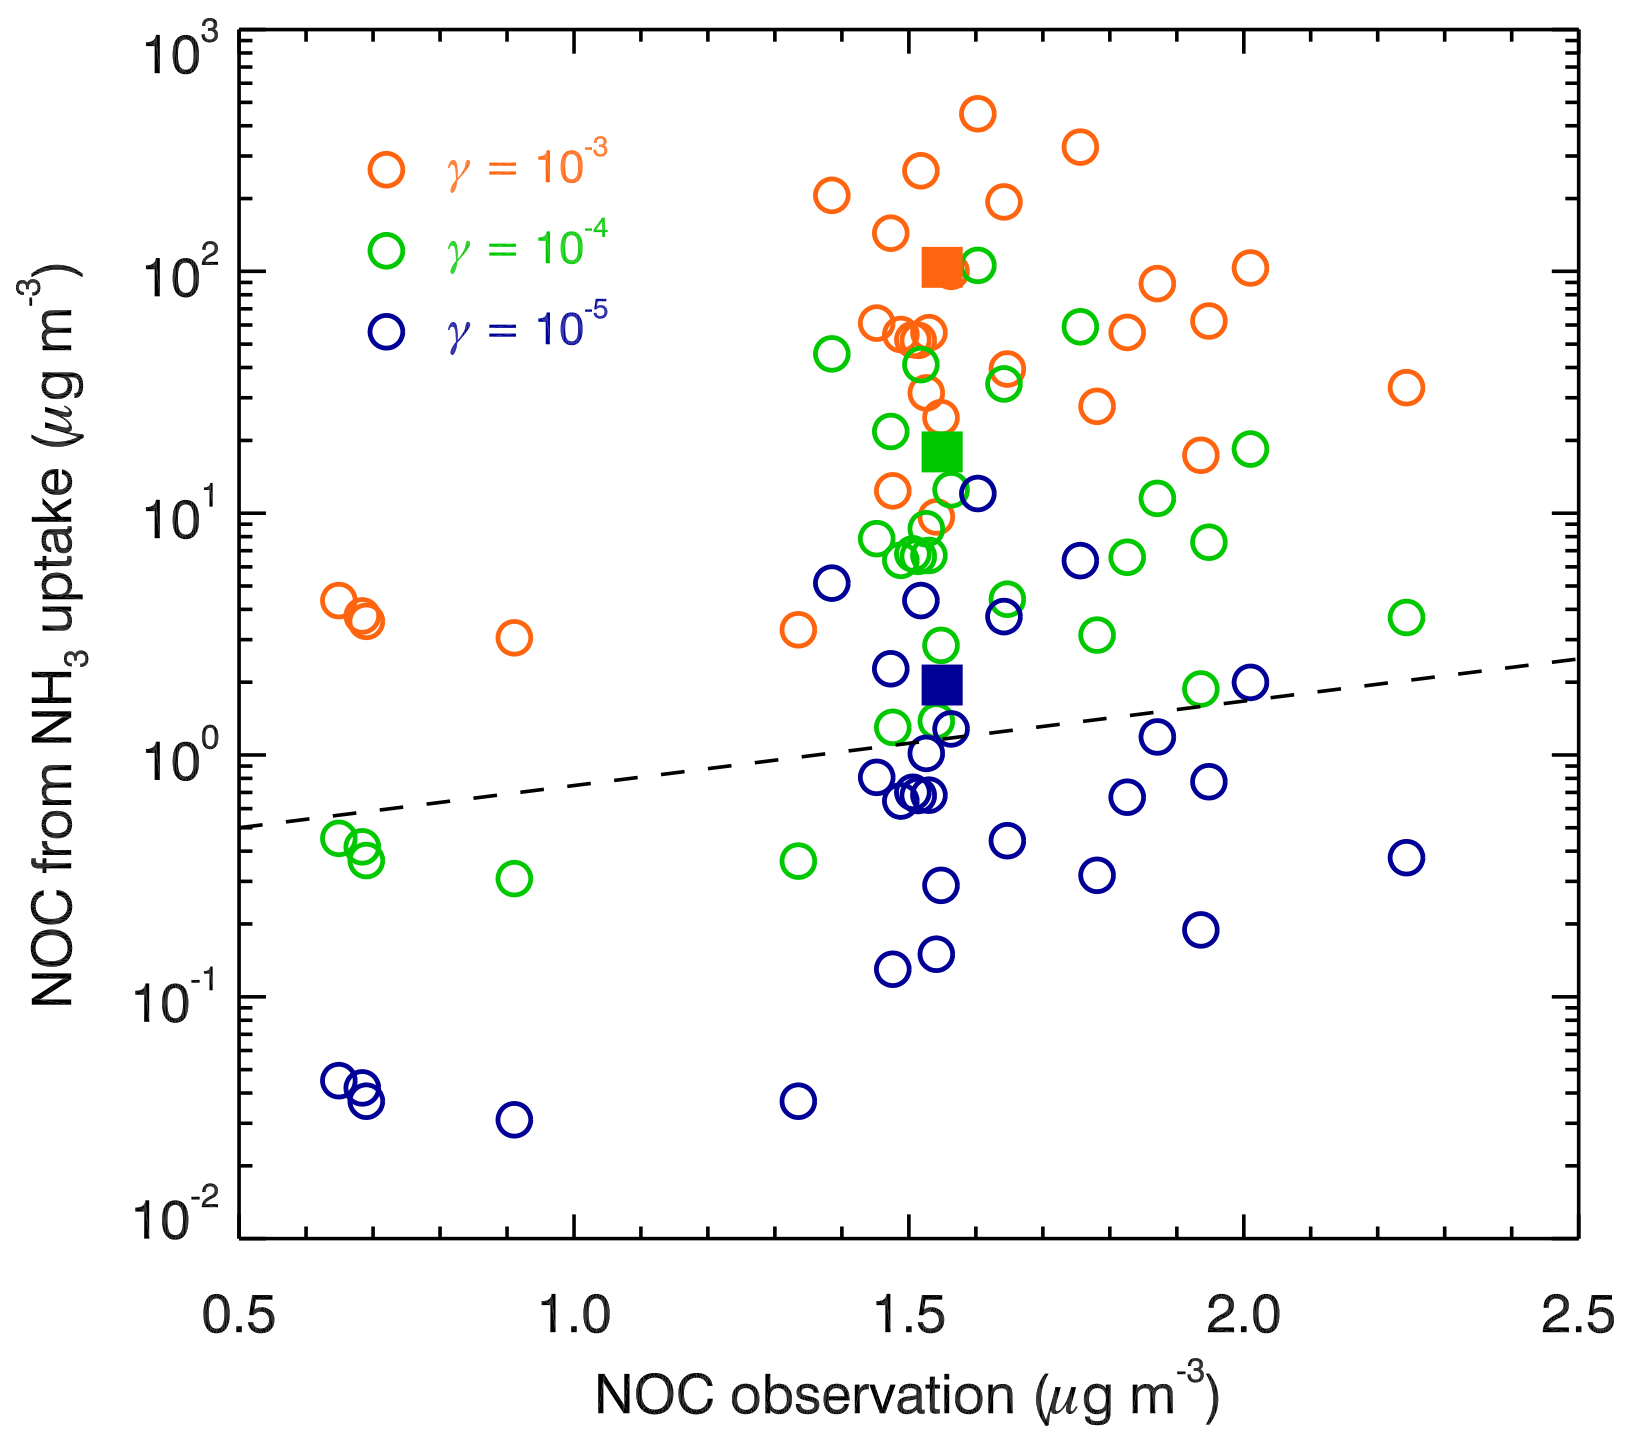
Figure 9Comparison of observed and simulated near-surface daily NOCs concentrations at Xianghe station in November 2017.
Laboratory studies indicate that NH3 uptake by SOA is finite, with about 10 % or less of the SOA material reacting with NH3 to form reduced-nitrogen products. Liu et al. (2015) further showed that γ decreased from initial values of approximately toward 10−5 during continued NH3 exposure. This decay was attributed to reduced accessibility of reactive sites and condensed-phase diffusion limitations as the particles aged. Accordingly, the very high NOCs concentrations in S(−3) and S(−4) should not be interpreted as sustainable atmospheric production. Rather, these cases illustrate the overestimation that can arise when large initial coefficients are applied continuously without explicitly resolving progressive depletion or shielding of reactive organic sites.
In the atmosphere, the measured NOCs burden is also influenced by processes other than the pathway examined here. Secondary pathways include reactions of ammonia or ammonium with particulate organic acids (Laskin et al., 2009; Wang et al., 2017; Zhang et al., 2025), while primary sources include biomass burning, coal combustion, vehicle emissions, biogenic emissions, and soil dust (Cheng et al., 2006; Harrison et al., 2005; Lu et al., 2019; Wang et al., 2022b). These additional sources further limit the fraction of the measured NOCs burden that can be assigned to the implemented pathway.
Considering both the laboratory evidence for finite and declining SOA reactivity and the ceiling provided by the measured NOCs burden, we interpret as a conservative upper limit for sustained operation of the NOCs-forming pathway under the present conditions.
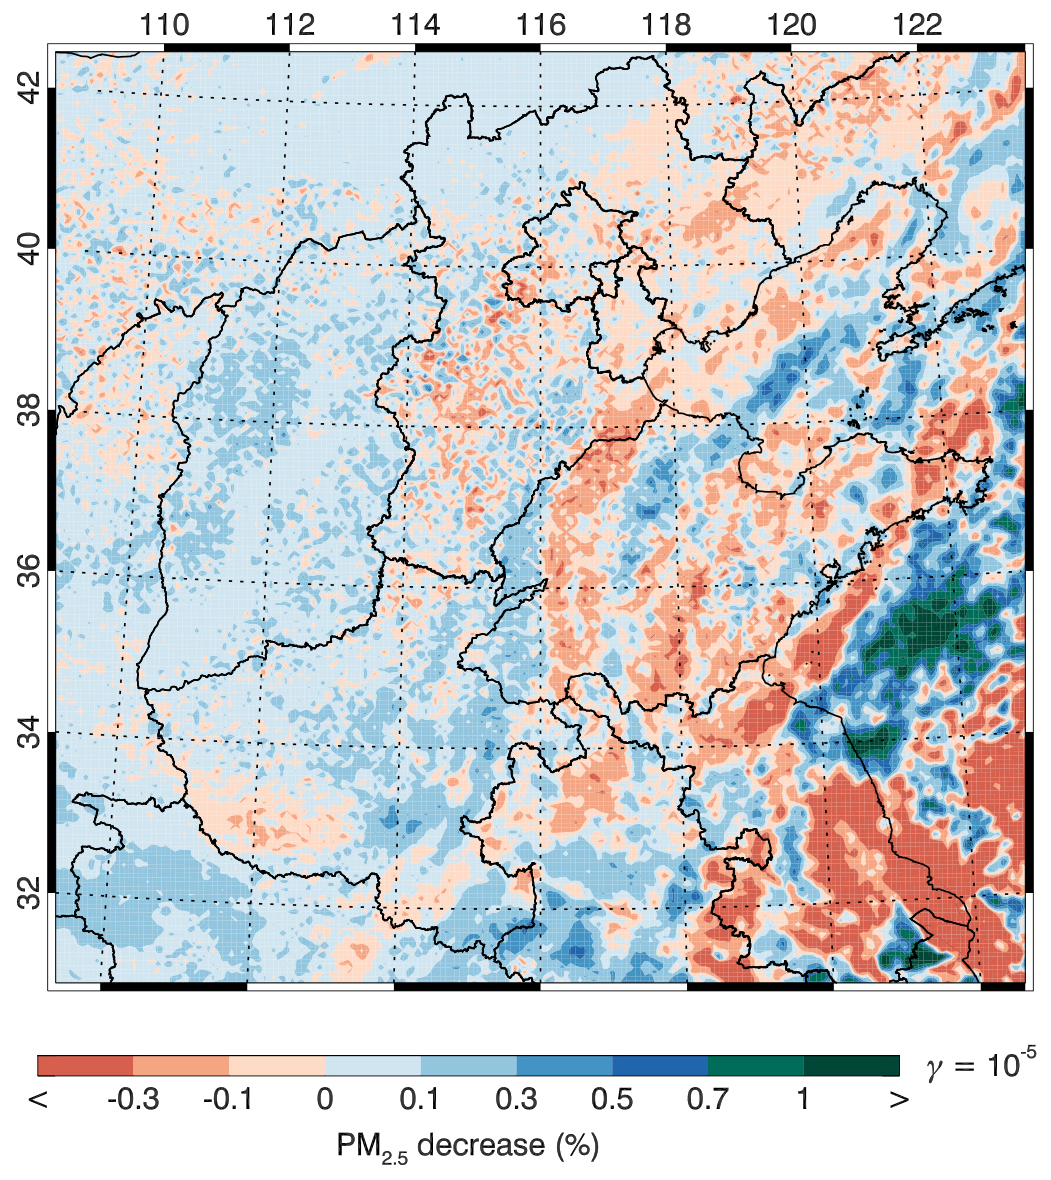
Figure 10Average decrease in PM2.5 concentration due to the NH3 uptake on SOA with the uptake coefficient of 10−5 in November 2017.
In S(−5), the pathway has an almost negligible effect on inorganic aerosol over the NCP. Under NH3-rich conditions, only a small fraction of NH3 is consumed by this pathway, leaving most NH3 available for neutralization of inorganic acids. Consequently, the domain-average PM2.5 concentration decreases by only 0.018 % (), and the spatial response is heterogeneous because of coupled aerosol–radiation and thermodynamic feedbacks (Fig. 10).
Discrepancies from previous studies (Zhu et al., 2018; Wu et al., 2021) may reflect differences in chemical mechanisms, aerosol treatments, simulation periods, seasons, and baseline chemical environments. All sensitivity cases in the present study use the same gas-phase mechanism, aerosol module, emissions, and meteorological configuration, so their differences isolate the perturbation introduced by the added pathway within this framework. The case is used to characterize the air-quality response of an observationally conservative upper limit representation, not to derive a universal physical coefficient. Under the NH3-rich conditions examined here, this pathway has little influence on NH3, inorganic aerosol, or PM2.5. Even in S(−3) and S(−4), the domain-average PM2.5 decreases are only 0.99 % (2.0 µg m−3) and 0.26 % (0.12 µg m−3), respectively.
Recent studies indicate that heterogeneous interactions of NH3 with SOA may influence the NH3 budget and aerosol composition and provide a pathway to particulate organic nitrogen. However, the magnitude of this pathway remains uncertain because of poorly constrained coefficients and limited field measurements of NOCs. We implemented a first-order NOCs-forming NH3–SOA reactive-uptake pathway in WRF-Chem for a severe PM2.5 episode over the NCP in November 2017. Three γ values () are selected based on laboratory and modeling literature, and the measured NOCs burden is used as an upper limit for the contribution of this pathway.
The model generally well reproduced spatial distributions and temporal variations of PM2.5, SO2, NO2, and O3 concentrations when comparing to observations during the episode in the NCP. It also reasonably well simulates POA, EC, SOA, sulfate, nitrate, and ammonium against the measurements in the NCP. In addition, the model also performs reasonably in simulating the NH3 concentration compared with satellite retrievals and in-situ measurement at Xianghe station. The simulated NH3 concentration in the NCP is 15.6 µg m−3, indicating that the region was characterized by NH3-rich conditions during the episode.
The larger sensitivity coefficients produce contributions from this pathway that are not sustainable under the observed conditions: S(−3) yields a domain-average NOCs concentration of 65.5 µg m−3, and S(−4) yields 11.3 µg m−3. By contrast, S(−5) yields 1.2 µg m−3 over the NCP and 1.6 µg m−3 at Xianghe, within the magnitude of the measured NOCs burden. Together with laboratory evidence of declining reaction efficiency, we conclude represents a conservative upper limit for sustained operation of this pathway under the conditions examined. At this γ value, the pathway decreases NH3 by only 0.62 % (0.096 µg m−3) and changes inorganic aerosol and PM2.5 by less than 0.06 %. Thus, the pathway has only a minor effect on regional NH3 and PM2.5 during this episode but may provide a limited source of NOCs.
The estimated impacts remain uncertain because of the chemical complexity of SOA, poorly constrained condensed-phase diffusivities and reactive-site availability, and the scarcity of field measurements of NOCs. Absolute responses may also depend on the gas-phase chemical mechanism and aerosol module. This study uses SAPRC-99 and the incorporated CMAQ/Models-3 AERO5 module; these components are held identical across all sensitivity cases, but comparison with newer mechanisms would require emission remapping and separate model evaluation. In addition, the parameterization does not explicitly resolve molecular NH3–H2SO4 clustering or cluster-mediated new-particle formation. Competition among these processes, uptake by existing particles, and ammonium sulfate formation may depend strongly on gas-phase sulfuric acid and ALW. Resolving these uncertainties requires additional field measurements, laboratory constraints, and model development.
The hourly ambient surface O3, NO2, SO2 and PM2.5 mass concentrations are real-timely released by Ministry of Ecology and Environment, China on the website http://www.aqistudy.cn/ (last access: 2 May 2026). The NH3 total column products used in this study were provided by the Infrared Atmospheric Sounding Interferometer (IASI) instruments on the Metop-B and Metop-C platforms, available through the IASI portal (https://iasi.aeris-data.fr/, last access: 7 April 2026).
The supplement related to this article is available online at https://doi.org/10.5194/acp-26-15257-2026-supplement.
NZ, as the corresponding author, provided the ideas, verified the conclusions, and revised the paper. YL conducted research, designed the experiments, performed the simulation, processed the data, prepared the data visualization, and prepared the manuscript, with contributions from all authors. YP provided the primary data processing and reviewed the manuscript. RW and QJ analyzed the initial simulation data and visualized the model results. XT reviewed the manuscript and provided critical reviews. QW analyzed the initial simulation data and reviewed the manuscript.
The contact author has declared that none of the authors has any competing interests.
Publisher's note: Copernicus Publications remains neutral with regard to jurisdictional claims made in the text, published maps, institutional affiliations, or any other geographical representation in this paper. The authors bear the ultimate responsibility for providing appropriate place names. Views expressed in the text are those of the authors and do not necessarily reflect the views of the publisher.
The authors thank the editor and the two anonymous reviewers for their constructive comments and valuable suggestions on this manuscript.
This research has been supported by the Key Research and Development Program of Shaanxi (grant no. 2024SF-ZDCYL-05-05), the Natural Science Basic Research Program of Shaanxi Province (grant no. 2023-JC-QN-0293) and the National Natural Science Foundation of China (grant no. 42307154).
This paper was edited by Zhonghua Zheng and reviewed by two anonymous referees.
Behera, S., Sharma, M., Aneja, V., and Balasubramanian, R.: Ammonia in the atmosphere: A review on emission sources, atmospheric chemistry and deposition on terrestrial bodies, Environ. Sci. Pollut. Res. Int., 20, 8092–8131, https://doi.org/10.1007/s11356-013-2051-9, 2013.
Bei, N., Wu, J., Elser, M., Feng, T., Cao, J., El-Haddad, I., Li, X., Huang, R., Li, Z., Long, X., Xing, L., Zhao, S., Tie, X., Prévôt, A. S. H., and Li, G.: Impacts of meteorological uncertainties on the haze formation in Beijing–Tianjin–Hebei (BTH) during wintertime: a case study, Atmos. Chem. Phys., 17, 14579–14591, https://doi.org/10.5194/acp-17-14579-2017, 2017.
Cheng, Y., Li, S.-M., and Leithead, A.: Chemical Characteristics and Origins of Nitrogen-Containing Organic Compounds in PM2.5 Aerosols in the Lower Fraser Valley, Environ. Sci. Technol., 40, 5846–5852, https://doi.org/10.1021/es0603857, 2006.
Cheng, Y., Zheng, G., Wei, C., Mu, Q., Zheng, B., Wang, Z., Gao, M., Zhang, Q., He, K., Carmichael, G., Pöschl, U., and Su, H.: Reactive nitrogen chemistry in aerosol water as a source of sulfate during haze events in China, Sci. Adv., 2, e1601530, https://doi.org/10.1126/sciadv.1601530, 2016.
Clarisse, L., Clerbaux, C., Dentener, F., Hurtmans, D., and Coheur, P.-F.: Global ammonia distribution derived from infrared satellite observations, Nat. Geosci., 2, 479–483, https://doi.org/10.1038/ngeo551, 2009.
Crowley, J. N., Ammann, M., Cox, R. A., Hynes, R. G., Jenkin, M. E., Mellouki, A., Rossi, M. J., Troe, J., and Wallington, T. J.: Evaluated kinetic and photochemical data for atmospheric chemistry: Volume V – heterogeneous reactions on solid substrates, Atmos. Chem. Phys., 10, 9059–9223, https://doi.org/10.5194/acp-10-9059-2010, 2010.
Feng, T., Bei, N., Zhao, S., Wu, J., Liu, S., Li, X., Liu, L., Wang, R., Zhang, X., Tie, X., and Li, G.: Nitrate debuts as a dominant contributor to particulate pollution in Beijing: Roles of enhanced atmospheric oxidizing capacity and decreased sulfur dioxide emission, Atmos. Environ., 244, 117995, https://doi.org/10.1016/j.atmosenv.2020.117995, 2021.
Fu, H., Luo, Z., and Hu, S.: A temporal-spatial analysis and future trends of ammonia emissions in China, Sci. Total Environ., 731, 138897, https://doi.org/10.1016/j.scitotenv.2020.138897, 2020.
Fu, X., Wang, S., Xing, J., Zhang, X., Wang, T., and Hao, J.: Increasing Ammonia Concentrations Reduce the Effectiveness of Particle Pollution Control Achieved via SO2 and NOx Emissions Reduction in East China, Environ. Sci. Tech. Let., 4, 221–227, https://doi.org/10.1021/acs.estlett.7b00143, 2017.
Harrison, M. A. J., Barra, S., Borghesi, D., Vione, D., Arsene, C., and Iulian Olariu, R.: Nitrated phenols in the atmosphere: a review, Atmos. Environ., 39, 231–248, https://doi.org/10.1016/j.atmosenv.2004.09.044, 2005.
Ianniello, A., Spataro, F., Esposito, G., Allegrini, I., Rantica, E., Ancora, M. P., Hu, M., and Zhu, T.: Occurrence of gas phase ammonia in the area of Beijing (China), Atmos. Chem. Phys., 10, 9487–9503, https://doi.org/10.5194/acp-10-9487-2010, 2010.
Lachatre, M., Fortems-Cheiney, A., Foret, G., Siour, G., Dufour, G., Clarisse, L., Clerbaux, C., Coheur, P.-F., Van Damme, M., and Beekmann, M.: The unintended consequence of SO2 and NO2 regulations over China: increase of ammonia levels and impact on PM2.5 concentrations, Atmos. Chem. Phys., 19, 6701–6716, https://doi.org/10.5194/acp-19-6701-2019, 2019.
Laskin, A., Smith, J. S., and Laskin, J.: Molecular characterization of nitrogen-containing organic compounds in biomass burning aerosols using high-resolution mass spectrometry, Environ. Sci. Technol., 43, 3764–3771, https://doi.org/10.1021/es803456n, 2009.
Laskin, A., Laskin, J., and Nizkorodov, S. A.: Chemistry of Atmospheric Brown Carbon, Chem. Rev., 115, 4335–4382, https://doi.org/10.1021/cr5006167, 2015.
Laskin, J., Laskin, A., Nizkorodov, S. A., Roach, P., Eckert, P., Gilles, M. K., Wang, B., Lee, H. J., and Hu, Q.: Molecular Selectivity of Brown Carbon Chromophores, Environ. Sci. Technol., 48, 12047–12055, https://doi.org/10.1021/es503432r, 2014.
Li, G., Lei, W., Zavala, M., Volkamer, R., Dusanter, S., Stevens, P., and Molina, L. T.: Impacts of HONO sources on the photochemistry in Mexico City during the MCMA-2006/MILAGO Campaign, Atmos. Chem. Phys., 10, 6551–6567, https://doi.org/10.5194/acp-10-6551-2010, 2010.
Li, G., Bei, N., Tie, X., and Molina, L. T.: Aerosol effects on the photochemistry in Mexico City during MCMA-2006/MILAGRO campaign, Atmos. Chem. Phys., 11, 5169–5182, https://doi.org/10.5194/acp-11-5169-2011, 2011a.
Li, G., Zavala, M., Lei, W., Tsimpidi, A. P., Karydis, V. A., Pandis, S. N., Canagaratna, M. R., and Molina, L. T.: Simulations of organic aerosol concentrations in Mexico City using the WRF-CHEM model during the MCMA-2006/MILAGRO campaign, Atmos. Chem. Phys., 11, 3789–3809, https://doi.org/10.5194/acp-11-3789-2011, 2011b.
Liu, L., Xu, W., Lu, X., Zhong, B., Guo, Y., Lu, X., Zhao, Y., He, W., Wang, S., Zhang, X., Liu, X., and Vitousek, P.: Exploring global changes in agricultural ammonia emissions and their contribution to nitrogen deposition since 1980, P. Natl. Acad. Sci. USA, 119, e2121998119, https://doi.org/10.1073/pnas.2121998119, 2022a.
Liu, P., Ding, J., Ji, Y., Xu, H., Liu, S., Xiao, B., Jin, H., Zhong, X., Guo, Z., Wang, H., and Liu, L.: Satellite Support to Estimate Livestock Ammonia Emissions: A Case Study in Hebei, China, Atmosphere, 13, 1552, https://doi.org/10.3390/atmos13101552, 2022b.
Liu, Y., Liggio, J., Staebler, R., and Li, S.-M.: Reactive uptake of ammonia to secondary organic aerosols: kinetics of organonitrogen formation, Atmos. Chem. Phys., 15, 13569–13584, https://doi.org/10.5194/acp-15-13569-2015, 2015.
Lu, C., Wang, X., Li, R., Gu, R., Zhang, Y., Li, W., Gao, R., Chen, B., Xue, L., and Wang, W.: Emissions of fine particulate nitrated phenols from residential coal combustion in China, Atmos. Environ., 203, 10–17, https://doi.org/10.1016/j.atmosenv.2019.01.047, 2019.
Luo, C., Zender, C. S., Bian, H., and Metzger, S.: Role of ammonia chemistry and coarse mode aerosols in global climatological inorganic aerosol distributions, Atmos. Environ., 41, 2510–2533, https://doi.org/10.1016/j.atmosenv.2006.11.030, 2007.
Ma, J., Shi, H., Zhu, Y., Li, R., Wang, S., Lu, N., Yao, Y., Bian, Z., and Huang, K.: The Evolution of Global Surface Ammonia Concentrations during 2001–2019: Magnitudes, Patterns, and Drivers, Environ. Sci. Technol., 59, 5066–5079, https://doi.org/10.1021/acs.est.4c14020, 2025.
Makar, P. A., Moran, M. D., Zheng, Q., Cousineau, S., Sassi, M., Duhamel, A., Besner, M., Davignon, D., Crevier, L.-P., and Bouchet, V. S.: Modelling the impacts of ammonia emissions reductions on North American air quality, Atmos. Chem. Phys., 9, 7183–7212, https://doi.org/10.5194/acp-9-7183-2009, 2009.
Mang, S. A., Henricksen, D. K., Bateman, A. P., and Nizkorodov, S. A.: Contribution of Carbonyl Photochemistry to Aging of Atmospheric Secondary Organic Aerosol, J. Phys. Chem. A, 112, 8337–8344, https://doi.org/10.1021/jp804376c, 2008.
Moise, T., Flores, J. M., and Rudich, Y.: Optical Properties of Secondary Organic Aerosols and Their Changes by Chemical Processes, Chem. Rev., 115, 4400–4439, https://doi.org/10.1021/cr5005259, 2015.
Na, K., Song, C., Switzer, C., and Cocker, D. R.: Effect of ammonia on secondary organic aerosol formation from alpha-pinene ozonolysis in dry and humid conditions, Environ. Sci. Technol., 41, 6096–6102, https://doi.org/10.1021/es061956y, 2007.
Nenes, A., Pandis, S. N., and Pilinis, C.: ISORROPIA: A new thermodynamic equilibrium model for multiphase multicomponent inorganic aerosols, Aquat. Geochem., 4, 123–152, https://doi.org/10.1023/A:1009604003981, 1998.
Nenes, A., Pandis, S. N., Weber, R. J., and Russell, A.: Aerosol pH and liquid water content determine when particulate matter is sensitive to ammonia and nitrate availability, Atmos. Chem. Phys., 20, 3249–3258, https://doi.org/10.5194/acp-20-3249-2020, 2020.
Nguyen, T. B., Lee, P. B., Updyke, K. M., Bones, D. L., Laskin, J., Laskin, A., and Nizkorodov, S. A.: Formation of nitrogen- and sulfur-containing light-absorbing compounds accelerated by evaporation of water from secondary organic aerosols, J. Geophys. Res.-Atmos., 117, D01207, https://doi.org/10.1029/2011JD016944, 2012.
Pan, Y., Tian, S., Zhao, Y., Zhang, L., Zhu, X., Gao, J., Huang, W., Zhou, Y., Song, Y., Zhang, Q., and Wang, Y.: Identifying Ammonia Hotspots in China Using a National Observation Network, Environ. Sci. Technol., 52, 3926–3934, https://doi.org/10.1021/acs.est.7b05235, 2018.
Pye, H. O. T., Nenes, A., Alexander, B., Ault, A. P., Barth, M. C., Clegg, S. L., Collett Jr., J. L., Fahey, K. M., Hennigan, C. J., Herrmann, H., Kanakidou, M., Kelly, J. T., Ku, I.-T., McNeill, V. F., Riemer, N., Schaefer, T., Shi, G., Tilgner, A., Walker, J. T., Wang, T., Weber, R., Xing, J., Zaveri, R. A., and Zuend, A.: The acidity of atmospheric particles and clouds, Atmos. Chem. Phys., 20, 4809–4888, https://doi.org/10.5194/acp-20-4809-2020, 2020.
Seinfeld, J. H. and Pandis, S. N.: Atmospheric chemistry and physics: from air pollution to climate change, John Wiley & Sons, New York, 1326 pp., ISBN 9780471178156, 1998.
Van Damme, M., Clarisse, L., Whitburn, S., Hadji-Lazaro, J., Hurtmans, D., Clerbaux, C., and Coheur, P.-F.: Industrial and agricultural ammonia point sources exposed, Nature, 564, 99–103, https://doi.org/10.1038/s41586-018-0747-1, 2018.
Van Damme, M., Clarisse, L., Franco, B., Sutton, M., Erisman, J. W., Wichink Kruit, R., van Zanten, M., Whitburn, S., Hadji-Lazaro, J., Hurtmans, D., Clerbaux, C., and Coheur, P.-F.: Global, regional and national trends of atmospheric ammonia derived from a decadal (2008–2018) satellite record, Environ. Res. Lett., 16, 055017, https://doi.org/10.1088/1748-9326/abd5e0, 2021.
Wang, C., Li, X., Zhang, T., Tang, A., Cui, M., Liu, X., Ma, X., Zhang, Y., Liu, X., and Zheng, M.: Developing Nitrogen Isotopic Source Profiles of Atmospheric Ammonia for Source Apportionment of Ammonia in Urban Beijing, Front. Environ. Sci., 10, 903013, https://doi.org/10.3389/fenvs.2022.903013, 2022a.
Wang, M., Wang, Q., Ho, S. S. H., Li, H., Zhang, R., Ran, W., Qu, L., Lee, S. C., and Cao, J.: Chemical characteristics and sources of nitrogen-containing organic compounds at a regional site in the North China Plain during the transition period of autumn and winter, Sci. Total Environ., 812, 151451, https://doi.org/10.1016/j.scitotenv.2021.151451, 2022b.
Wang, M., Wang, Q., Ho, S. S. H., Tian, J., Zhang, Y., Lee, S., and Cao, J.: Dominant influence of biomass combustion and cross-border transport on nitrogen-containing organic compound levels in the southeastern Tibetan Plateau, Atmos. Chem. Phys., 24, 11175–11189, https://doi.org/10.5194/acp-24-11175-2024, 2024.
Wang, X. F., Wang, H. L., Jing, H., Wang, W. N., Cui, W. D., Williams, B. J., and Biswas, P.: Formation of nitrogen-containing organic aerosol during combustion of high-sulfur-content coal, Energ. Fuel., 31, 14161–14168, https://doi.org/10.1021/acs.energyfuels.7b02273, 2017.
Wen, L., Chen, J., Yang, L., Wang, X., Xu, C., Sui, X., Yao, L., Zhu, Y., Zhang, J., Zhu, T., and Wang, W.: Enhanced formation of fine particulate nitrate at a rural site on the North China Plain in summer: The important roles of ammonia and ozone, Atmos. Environ., 101, 294–302, https://doi.org/10.1016/j.atmosenv.2014.11.037, 2015.
Wu, J., Li, G., Cao, J., Bei, N., Wang, Y., Feng, T., Huang, R., Liu, S., Zhang, Q., and Tie, X.: Contributions of trans-boundary transport to summertime air quality in Beijing, China, Atmos. Chem. Phys., 17, 2035–2051, https://doi.org/10.5194/acp-17-2035-2017, 2017.
Wu, J., Bei, N., Hu, B., Liu, S., Zhou, M., Wang, Q., Li, X., Liu, L., Feng, T., Liu, Z., Wang, Y., Cao, J., Tie, X., Wang, J., Molina, L. T., and Li, G.: Aerosol–radiation feedback deteriorates the wintertime haze in the North China Plain, Atmos. Chem. Phys., 19, 8703–8719, https://doi.org/10.5194/acp-19-8703-2019, 2019.
Wu, K., Zhu, S., Liu, Y., Wang, H., Yang, X., Liu, L., Dabdub, D., and Cappa, C. D.: Modeling Ammonia and Its Uptake by Secondary Organic Aerosol Over China, J. Geophys. Res.-Atmos., 126, e2020JD034109, https://doi.org/10.1029/2020JD034109, 2021.
Xu, R., Tian, H., Pan, S., Prior, S. A., Feng, Y., Batchelor, W. D., Chen, J., and Yang, J.: Global ammonia emissions from synthetic nitrogen fertilizer applications in agricultural systems: Empirical and process-based estimates and uncertainty, Glob. Change Biol., 25, 314–326, https://doi.org/10.1111/gcb.14499, 2019.
Yang, S. L., Wang, M. Y., Wang, M. J., Zhang, X., Han, Q., Wang, H., Xiong, Q., Zhang, C., and Wang, M.: Establishing an emission inventory for ammonia, a key driver of haze formation in the southern North China plain during the COVID-19 pandemic, Sci. Total Environ., 904, 166857, https://doi.org/10.1016/j.scitotenv.2023.166857, 2023.
Zhang, G., Lian, X., Fu, Y., Lin, Q., Li, L., Song, W., Wang, Z., Tang, M., Chen, D., Bi, X., Wang, X., and Sheng, G.: High secondary formation of nitrogen-containing organics (NOCs) and its possible link to oxidized organics and ammonium, Atmos. Chem. Phys., 20, 1469–1481, https://doi.org/10.5194/acp-20-1469-2020, 2020.
Zhang, G., Wang, T., Lin, Q., Liu, K., Sun, W., Chen, D., Li, L., Wang, X., and Bi, X.: A comparative study on the formation of nitrogen-containing organic compounds in cloud droplets and aerosol particles, J. Environ. Sci., 146, 456–464, https://doi.org/10.1016/j.jes.2024.01.026, 2025.
Zhang, G., Li, T., Sun, W., Huang, X., Wang, T., Wang, X., Ma, N., Hu, W., Tang, M., Shi, Z., Wang, X., Peng, P., and Bi, X.: Molecular Evidence of Aqueous-Processed NOCs: From Mechanistic Insights to Environmental Impacts, J. Geophys. Res.-Atmos., 131, e2025JD045757, https://doi.org/10.1029/2025JD045757, 2026.
Zhang, R., Han, Y., Shi, A., Sun, X., Yan, X., Huang, Y., and Wang, Y.: Characteristics of ambient ammonia and its effects on particulate ammonium in winter of urban Beijing, China, Environ. Sci. Pollut. R., 28, 62828–62838, https://doi.org/10.1007/s11356-021-14108-w, 2021.
Zheng, G., Su, H., and Cheng, Y.: Role of Carbon Dioxide, Ammonia, and Organic Acids in Buffering Atmospheric Acidity: The Distinct Contribution in Clouds and Aerosols, Environ. Sci. Technol., 57, 12571–12582, https://doi.org/10.1021/acs.est.2c09851, 2023.
Zhu, S., Horne, J. R., Montoya-Aguilera, J., Hinks, M. L., Nizkorodov, S. A., and Dabdub, D.: Modeling reactive ammonia uptake by secondary organic aerosol in CMAQ: application to the continental US, Atmos. Chem. Phys., 18, 3641–3657, https://doi.org/10.5194/acp-18-3641-2018, 2018.
Zhu, S., Wu, K., Nizkorodov, S. A., and Dabdub, D.: Modeling reactive ammonia uptake by secondary organic aerosol in a changing climate: a WRF-CMAQ evaluation, Front. Environ. Sci., 10, 867908, https://doi.org/10.3389/fenvs.2022.867908, 2022.