
the Creative Commons Attribution 4.0 License.
the Creative Commons Attribution 4.0 License.
 | 28 Oct 2026
Volatile organic compounds and their role in secondary aerosol chemistry in a cold and dark urban environment
James R. Campbell

Brice Temime-Roussel
Barbara D'Anna
Kathy S. Law
Weihang Zhang
Rodney J. Weber
Michael Battaglia Jr.
Kayane K. Dingilian
Meeta Cesler-Maloney
Jason M. St. Clair
Benjamin Chazeau
Jingqiu Mao
The role of volatile organic compound (VOC) emissions in secondary aerosol chemistry in urban subarctic environments remains poorly understood. Previous studies in wintertime Fairbanks, Alaska suggest that aldehydes may serve as precursors of sulfur(IV) adducts in aerosols, contributing to the high concentrations of wintertime PM2.5 pollution Fairbanks often experiences. It is unknown to what extent VOCs participate in secondary aerosol chemistry, or what the sources of largely secondary VOCs (like formaldehyde) are in such a cold and dark environment. Here, we explore the sources of VOCs and examine their role in secondary chemistry. We use measurements from an online proton transfer reaction time of flight mass spectrometer, combined with complementary gas and aerosol measurements from the Alaskan Layered Pollution and Chemical Analysis (ALPACA) wintertime field campaign in 2022, to examine VOC sources and their roles in aerosol chemistry in downtown Fairbanks. We find that alcohols, aromatics and carbonyls together account for ∼ 70 % of measured VOCs, with methanol, ethanol, formaldehyde, benzene and toluene as dominant species. Positive matrix factorization (PMF) analysis indicates up to 56 % of VOCs are vehicle-associated, with 29 %–36 % from direct emissions and 21 % from windshield wiper fluid. Wood heating and heating oil together contribute 14 %. Formaldehyde is primarily linked to diesel emissions, as well as primary and secondary sources associated with local aged air masses. By comparing PMF factors with measured PM2.5 S(IV) species, we find that vehicle-related emissions of ammonia (which modulates aerosol pH) and formaldehyde could promote the formation of hydroxymethanesulfonate (HMS) in Fairbanks.
- Article
(2901 KB) - Full-text XML
-
Supplement
(4385 KB) - BibTeX
- EndNote


Volatile organic compounds (VOCs) are associated with many serious adverse health effects (Sharma et al., 2018; Zhou et al., 2025). While the majority of VOCs are of biogenic origin on a global scale (Guenther et al., 1995), anthropogenic sources can dominate in urban environments. VOCs can undergo secondary processes, typically via photooxidation. This can lead to the formation of secondary products like fine particulate matter and ozone (Grosjean et al., 1983; Seinfeld and Pandis, 2016; Ziemann and Atkinson, 2012), which have been further associated with adverse health effects (Nuvolone et al., 2018; Pope and Dockery, 2006; Schwartz et al., 2002).
Fairbanks, Alaska is a subarctic town which often experiences episodes of poor air quality. The Fairbanks North Star Borough frequently violates the EPA PM2.5 (particles with an aerodynamic diameter of < 2.5 µm) air quality standard of 35 µg m−3 in the wintertime, exacerbated by strong inversion layers limiting dispersion (Cesler-Maloney et al., 2022; Simpson et al., 2024). Previous work has shown increased hospitalizations for cerebrovascular disease and respiratory tract infections in Fairbanks during periods of high PM2.5 pollution (Kossover, 2010).
Despite a focus on achieving reductions in PM2.5 (Campbell et al., 2022; Kotchenruther, 2016; Nattinger, 2016; Ward et al., 2012), VOCs in Fairbanks have received less attention. Wintertime Fairbanks is unique as an urban environment, with temperatures down to −40 °C and only a few hours of daylight. Under these conditions biogenic VOC emissions are insignificant, and secondary VOC production related to UV photooxidation is expected to be small. Dark aging of VOCs may be taking place, although to what extent is not clear. Many VOCs have an appreciable decrease in volatility in such cold temperatures, leading to more organic aerosol mass than predicted (Ijaz et al., 2025a). Analysis shows that levels of hazardous VOCs like benzene, toluene, and C8 aromatics (ethylbenzene, xylene) can be up to ten times higher in Fairbanks compared to other US wintertime cities (Ketcherside et al., 2025; Simpson et al., 2024).
Certain VOC species can also form organosulfur compounds in the aerosol phase, such as hydroxymethanesulfonate (HMS) (Boyce and Hoffmann, 1984). In downtown Fairbanks, elevated mixing ratios of formaldehyde – comparable to wintertime levels observed in the North China Plain (Campbell et al., 2022; Song et al., 2019) – were found to play a key role in the formation of HMS. Acetaldehyde and other carbonyls can also form similar S(IV) adducts (sulfur species with a +4 oxidation state), leading to higher aerosol S(IV) concentrations (Dingilian et al., 2024a; Holen et al., 2025). HMS and other S(IV) species can account for up to 41 % sulfur PM2.5 mass and 6.8 % of total PM2.5 mass in Fairbanks, a larger fraction than in other urban environments (Campbell et al., 2022, 2024). The sources of formaldehyde and other aldehydes in Fairbanks remain poorly characterized, limiting our capability of developing mitigation strategies.
Positive matrix factorization (PMF) has been used extensively to quantify sources of VOCs in urban settings (Baudic et al., 2016; Gkatzelis et al., 2021; Huang et al., 2024; Ketcherside et al., 2025; McDonald et al., 2018; Rivellini et al., 2024; Sadeghi et al., 2022). Some studies done in the US have reported that the fraction of pollution related to vehicle emissions have decreased, and volatile chemical products (VCPs) from consumer and industrial products have become the dominant source of urban VOCs (Gkatzelis et al., 2021; McDonald et al., 2018). It is not clear whether this trend of decreasing vehicle emissions holds true for Fairbanks; many studies have found that certain VOC emissions can be more than an order of magnitude higher for both gasoline and diesel vehicles when cold-starting at −7 °C compared to 23–24 °C (Cao et al., 2024; Ferrarese et al., 2024; George et al., 2015; Hays et al., 2017; Liu et al., 2023). However, Fairbanks commonly experiences temperatures down to −40 °C and, unlike many places, Alaska does not use ethanol-blended fuels. We are not aware of any work that has examined vehicle emissions at temperatures as low as Fairbanks, nor that uses non-ethanol-blended fuel, so it remains unclear how prominent vehicle VOC emissions are in Fairbanks.
Several studies conducted PMF analysis during the 2022 ALPACA field campaign. Ijaz et al. (2025b), conducted in downtown Fairbanks, used PM1 measurements from both a PTR-ToF-MS with a CHARON inlet and an AMS to conduct PMF; they found that most PM1 OA at the downtown site was attributed to residential heating when using the CHARON PTR-ToF-MS measurements. Ketcherside et al. (2025) combined PTR-ToF-MS VOCs, PM2.5, and gaseous measurements of SO2, CO, ozone, and NOx to examine sources of gases and aerosols in a residential neighborhood approximately 3 km away from the downtown ALPACA site. They find that aromatic VOCs make up 50 % of the total VOC mixing ratio, which are mainly attributed to traffic and heating oil. Formaldehyde was found to come from various sources, and many other VOCs were mainly attributed to residential wood combustion. As the VOC measurements in their work were conducted in a residential area about 3 km away from downtown Fairbanks, their analysis is likely more influenced by residential factors like space heating. The role of VOCs in secondary aerosol chemistry has not been addressed in these studies.
Here, we report VOC measurements from an online PTR-ToF-MS in downtown Fairbanks during the ALPACA campaign in 2022. We use PMF to identify VOC sources in the uniquely cold and dark conditions of Fairbanks, and we note the uncommon aspect that gasoline in Alaska contains no ethanol. We also discuss our PMF solutions with Ketcherside et al. (2025) to highlight the differences and similarities between the downtown site and the residential site. We further compare our PMF solutions with complementary gas and aerosol measurements to identify drivers for formation of S(IV) species in aerosols in Fairbanks.
2.1 Measurements
Measurements were conducted in a trailer in downtown Fairbanks next to the University of Alaska Fairbanks Community and Technical College (64.84064° N, 147.72677° W, elevation 136 m above sea level) from 17 January to 25 February 2022 as part of the 2022 ALPACA campaign, unless stated otherwise. This location is referred to as the downtown site throughout the paper, which was co-located with Ijaz et al. (2025b). Ketcherside et al. (2025) took place in a residential neighborhood (referred to as the residential site) approximately 3 km away from the downtown site. Detailed information about the ALPACA campaign can be found in Simpson et al. (2024).
A proton-transfer-reaction time-of-flight mass spectrometry (PTR-TOF 6000 X2, Ionicon Analytik GmbH, Austria) was used to monitor VOCs. As described in Ijaz et al. (2025a), the PTR-ToF-MS was equipped with an inlet to switch between gas-phase and aerosol-phase species. The gas-phase was measured for 15 min every hour, and the aerosol-phase species for 45 min every hour. Both were measured at a 20 s time resolution. Only the gas-phase data was used for the PMF analysis in this work. The instrument was operated at a low of 65 Td (i.e., drift voltage/pressure; pressure, temperature, and voltage of the drift tube were set at 2.6 mbar, 120 °C, and 230 V) and in RF mode for optimal sensitivity. Raw PTR-ToF-MS spectra were processed with the commercial Ionicon Data Analyzer (IDA) software to fit high-resolution mass peaks and extract the corresponding time series. Times series were post-processed (i.e., background subtraction, conversion of raw signal to mixing ratios, 2 min temporal averaging, PMF input generation) with an in-house data processing tool, PeTeR Toolkit (version 6.0; Igor 6.37).
Mixing ratios were calculated using Eq. (1):
Where RH+ and H3O+ are the signal intensities in counts per second (cps) of the individual protonated ion and the reagent ion corrected by their relative transmission (Tr) respectively, Udrift, Tdrift, pdrift and τ are the voltage (V), temperature (K), and pressure (mbar) residence time (s) of the ions in the drift tube respectively, k the reaction rate (cm3 s−1) between the reagent ion and VOC. The average relative uncertainty regarding the concentration derived from the propagation of the relative uncertainties on the transmission and the k is estimated to be within ±30 %. This value aggregates the systematic uncertainty of the reaction rate constants, typically 25 %–30 % (Ellis and Mayhew, 2014; Zhao and Zhang, 2004), and the experimental ion transmission curve (15 %). The combined root sum-square calculation yields an estimated uncertainty of approximately 30 % for uncalibrated VOCs. While this uncertainty can be in the range of 20 %–50 % for specific compounds (Sekimoto et al., 2017), 30 % represents a reasonable overall estimate across the range of species considered in this study.
A 12-component mix at ppmV level (Apel Riemer Environmental Inc, Miami, USA) in the range of 32–134 amu diluted in pure nitrogen was used to experimentally determine the relative ion transmission at the beginning and at the end of the measurement campaign.
In this study, no general fragmentation correction was applied. As demonstrated by Pagonis et al. (2019), the absence of such corrections may lead to an underestimation of oxygenated and nitrogen-containing compound families. The magnitude of this bias is difficult to assess for the present dataset, as it depends on the fragmentation behavior of individual compounds. However, the PTR-ToF-MS was operated at a low (60 Td), which minimizes fragmentation, and the resulting bias is therefore expected to be limited. It is worth noting that fragmentation corrections are only feasible when the protonated molecular ion is detected and can be uniquely assigned to the compound of interest. This is not the case for some O-containing compounds (e.g., > C3 alcohols, > C3 linear aldehydes) or for N-containing compounds, for which the protonated molecular ion is generally not observed in ambient air, and whose main fragments ions are not specific and overlap with fragment ions from abundant atmospheric hydrocarbons, such as alkanes and alkenes (Brown et al., 2010; Buhr et al., 2002; Duncianu et al., 2017).
Compound-specific proton-transfer reaction rate constants (k) were applied for VOCs where available in the literature (Cappellin et al., 2012). For all other species, a rate constant of 2 × 10⁻⁹ cm3 s−1 was assumed; this is a common value used when a measured rate constant is unavailable (Cappellin et al., 2012; Wang et al., 2020, 2021). An additional correction was applied to ethanol using calibration coefficients obtained from post-campaign laboratory measurements, as significant fragmentation resulted in an underestimation of ethanol mixing ratios by a factor of 9 when default reaction rate constants were assumed. Post-campaign ethanol calibration was conducted using a certified 20-component gas reference mixture, for which the certified concentration uncertainty was 10.1 %. Instrument drift between campaign and post-campaign calibration was corrected using acetaldehyde, a compound common to both the campaign and post-campaign calibration cylinders with certified relative uncertainties of 5 % and 5.4 %, respectively. Therefore, the relative uncertainty obtained by uncertainty propagation by transferring the ethanol calibration to the post-campaign period is estimated as 12.5 %.
Alongside the PTR-ToF-MS, two additional formaldehyde measurements were made using a MIRA Ultra Gas Analyzer (Aeris Technologies) and COmpact Formaldehyde FluorescencE Experiment (COFFEE) (St. Clair et al., 2017). Correlations between all three instruments were high (r2 ranging from 0.69 and 0.81, Fig. S1 in the Supplement) but the PTR-ToF-MS measurements were about four times lower than both the MIRA Ultra Gas Analyzer and COFFEE. This is because formaldehyde has a proton affinity close to water, the back-reaction of protonated formaldehyde with water vapor becomes relevant and reduces the sensitivity of formaldehyde in the PTR-ToF-MS (Vlasenko et al., 2010). Although the PTR-ToF-MS measurements of formaldehyde were underestimated due to back-reactions with water vapor, we find no relationship between relative humidity or dew point and the magnitude of difference of PTR-ToF-MS compared to other formaldehyde instruments (Fig. S2). Therefore, the formaldehyde measured by the PTR-ToF-MS was scaled up by a constant factor of four to match these instruments, and the scaled data was used in the PMF input. Mixing ratios were corrected for background contribution using a cylinder of high purity nitrogen (99.999 purity).
Based on post-campaign calibration measurements using D3–D5 siloxane standards and comparison of their main fragmentation patterns with the closest matching ions observed in the campaign data, only ions at 297.098 and 299.066, which are consistent, within the instrument mass accuracy, with ions previously reported for pure D4 siloxane were detected ( 297.083 and 299.062 corresponding to C8H24O4Si4H+ and C7H22O5Si4H+). However, the fact that both ions are mainly associated with the biomass burning factor (50 % and 42 % versus 3 % and 8 % for the VCP factor) indicates that their assignment to D4 siloxane remains uncertain. Other plausible assignments, including C20H10O3H+ (297.091) and C21H12O2H+ (299.071), corresponding to compounds that are more likely to be associated with biomass burning emissions, cannot be excluded.
The PTR-ToF-MS is unable to detect short-chain alkanes with less than C8 such as ethane, propane, and butane due to their low proton affinities. Very few works contain a comprehensive overview of both oxygenated VOCs and short-chain alkane VOCs in the US. The CalNex campaign, which used multiple instruments to measure both categories as described in Heald et al. (2020), found that short-chain alkanes made up on average 36.5 % of the total measured µg C sm−3, excluding organic aerosols. Heald et al. (2008) contains VOC measurements from other North American campaigns, although not all VOCs were measured for all campaigns. Ethane, propane, and butane range from 7.5 %–37.2 % of the measured µg C sm−3 for measurements done in the US and Canada, excluding organic aerosols. A direct comparison between these works and Fairbanks are difficult due to the unique climate of Fairbanks, but we expect short-chain alkanes and alkenes to be in a similar range.
Other non-VOC measurements made at the downtown site were used for comparison with the PMF results. PM1 OA, sulfate, nitrate, and ammonium were measured by an Aerosol Mass Spectrometer (AMS). Black Carbon (BC) was measured by a Multi-Angle Absorption Photometer (MAAPS). Other downtown measurements include carbon monoxide (CO), SO2, NOx, ozone (O3), temperature, wind speed and wind direction. Total ammonium was measured using a mist chamber coupled with ion chromatography (MC-IC) (Cofer et al., 1985), and total S(IV) was measured using a particle into liquid sampler coupled with ion chromatography (PILS-IC) (Orsini et al., 2003). Both MC-IC and PILS-IC methods have been discussed in other ALPACA papers (Campbell et al., 2024; Dingilian et al., 2024a; Simpson et al., 2024).
2.2 Positive Matrix Factorization (PMF)
PMF is a mathematical model commonly used to estimate source contributions of VOCs datasets. Briefly, the PMF model uses a time series dataset matrix and corresponding error matrix as inputs. The user specifies a number of factors – in our case, the number of factors equates to the number of VOC sources. The PMF model attempts to split the main dataset into two matrices: a time series of factors, and the contribution of each VOC species to each factor. The user then interprets the resulting matrices to determine what source each factor corresponds to. More detailed information about the model can be found in literature (Paatero, 1999). We used SoFi Pro version 9 which utilizes the ME-2 engine (Canonaco et al., 2013; Paatero, 1999). Over 300 ions were included for PMF analysis. An error matrix was also calculated with the PeTeR tool by propagating uncertainties in ion counts and background signals, assuming Poisson counting statistics (de Gouw and Warneke, 2007). The data was down-weighted based on the recommendations of Paatero and Hopke (2003).
3.1 Overview of VOC Measurements in Downtown Wintertime Fairbanks
We first examine the campaign average for VOC measurements. The mean VOC mixing ratio during the campaign was 35.6 ppb. In this section, for simplicity, we report VOC mixing ratio ± one standard deviation for species which had a campaign average of 0.05 ppb or higher. This included 46 species which account for 33.6 ppb (94.3 % of the total VOC mixing ratio). It should be noted that there were two periods of enhanced pollution during the ALPACA campaign, as described in Simpson et al. (2024). Figure S3 shows PM1 (measured by aerosol mass spectrometer, described below) and temperature during the campaign, with the pollution events highlighted.
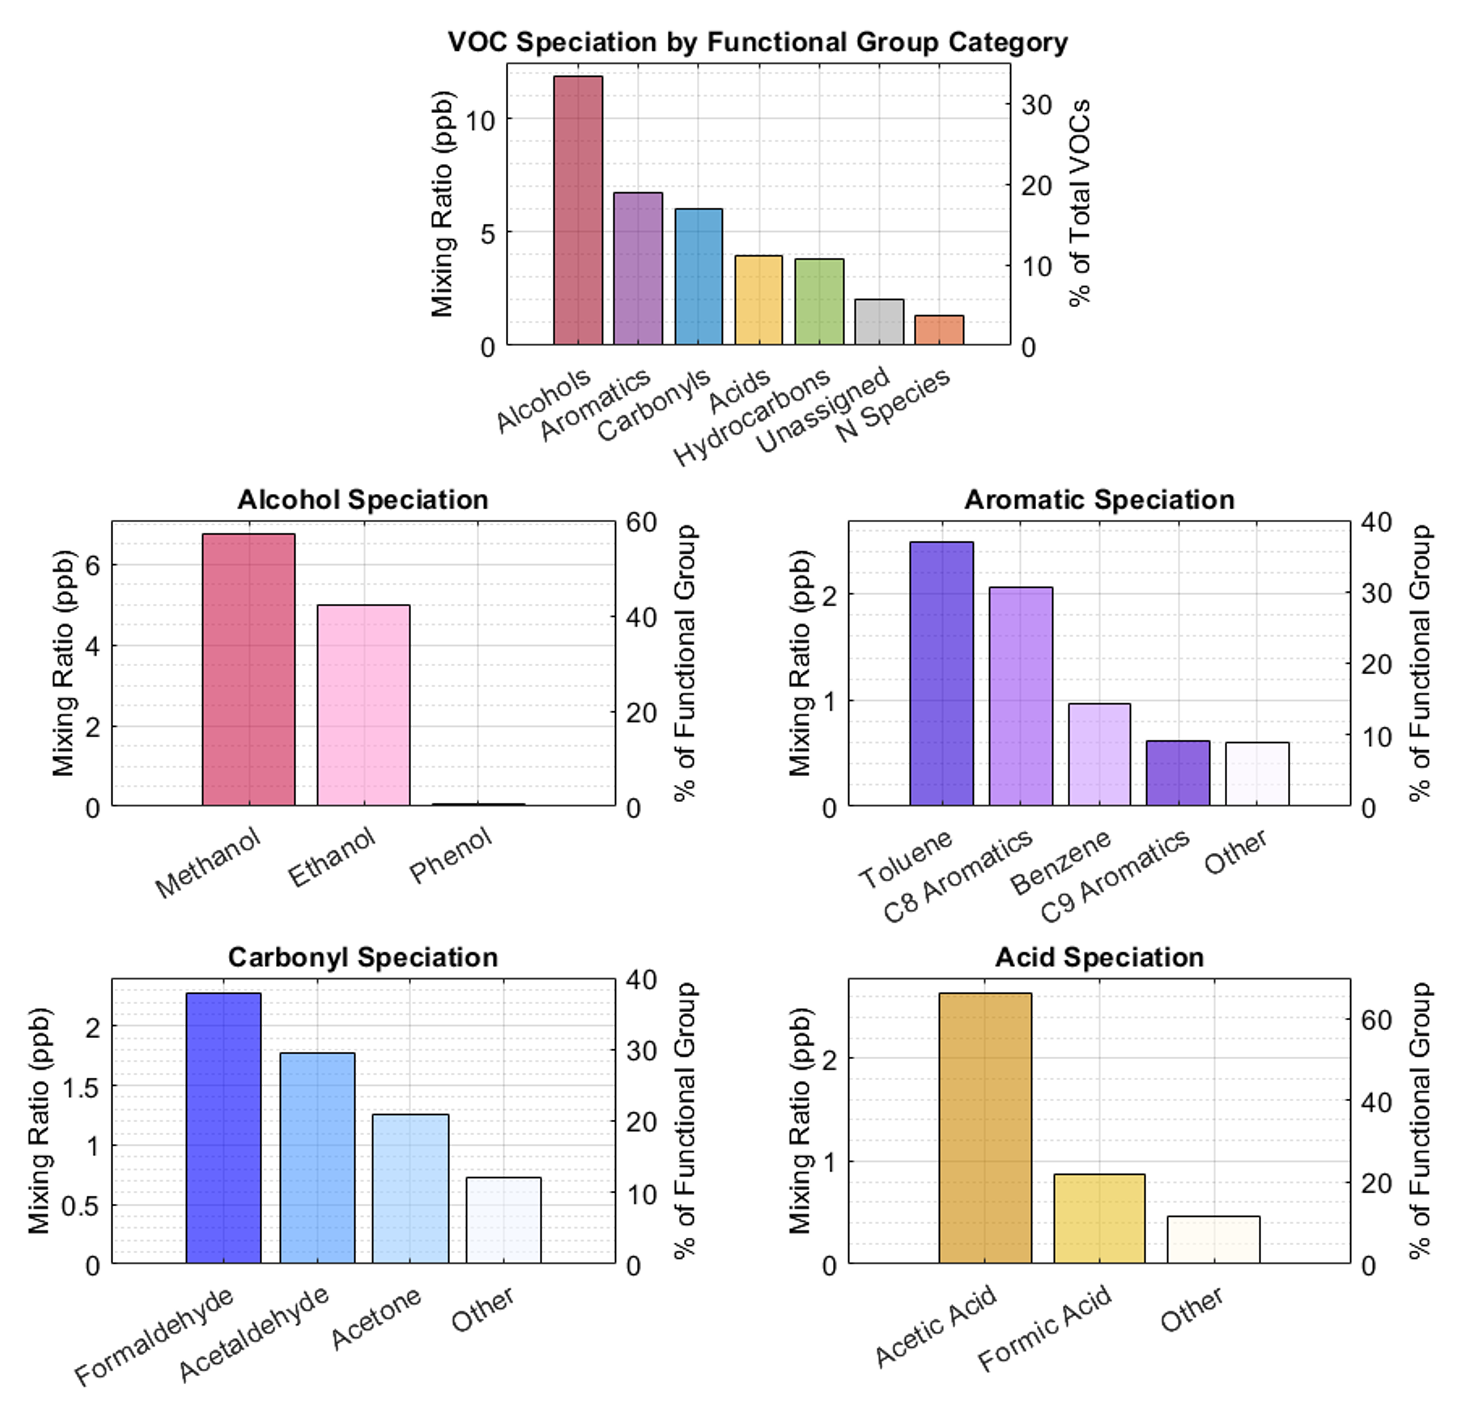
Figure 1Mean composition of VOCs categorized by their functional groups during ALPACA campaign. The “Unassigned” group is made of up of about 290 species whose individual campaign means are all less than 0.05 ppb.
Figure 1 shows the percent contributions and campaign-mean VOC mixing ratios by functional group (see Table S1 for details). Alcohols, aromatics, carbonyls, acids, non-aromatic hydrocarbons, and nitrogen-containing species are the dominant VOC classes. Alcohols were by far the most prominent category due to the high mixing ratio of methanol (6.8 ± 8.0 ppb) and ethanol (5 ± 7.4 ppb) during the campaign. The species with the third largest mean mixing ratio was formaldehyde at 2.3 ± 1.3 ppb. Common species from other functional group categories are (in decreasing order): toluene, C8 aromatics, benzene, and C9 aromatics for aromatics; formaldehyde, acetaldehyde and acetone for carbonyls; C2H4O2 (acetic acid) and formic acid for acids. The speciation is similar with median values (Fig. S4).
Methanol and ethanol are highest from 21 to 25 January before the first pollution event, with methanol spikes up to 166 ppb and ethanol spikes up to 180 ppb. Interestingly, as shown in Table S2 and Fig. S5a, there was not much enhancement of methanol and ethanol during the cold polluted event compared to periods outside the pollution events, but they were significantly increased during the warm pollution event, with methanol spikes up to 133 ppb. Both are similar mixing ratios to measurements at the residential site in Ketcherside et al. (2025).
The methanol in wintertime Fairbanks is on average 1.2–2 times higher than other urban wintertime measurements in the US and China (Li et al., 2019; Millet et al., 2005), and 2–6 times higher than measurements in Europe (Languille et al., 2020; Legreid et al., 2007; Patokoski et al., 2014). The large discrepancy of methanol between Fairbanks and Europe may be because the US and Canada use methanol-based windshield wiper fluid and Europe uses ethanol-based. Legreid et al. (2007) attributes the high ethanol mixing ratios in Zürich, Switzerland to windshield wiper fluid. Slowik et al. (2010) attributes high levels of methanol due to windshield wiper fluid in Toronto, Canada, but did not report a mixing ratio. We further discuss the influence of windshield wiper fluid in Fairbanks in Sect. 3.2. Ethanol in Fairbanks is between 1.2–5 times higher than measurements in the US and Europe (Gkatzelis et al., 2021; Legreid et al., 2007; Millet et al., 2005).
The aromatics were mainly made up of toluene (2.5 ± 2.7 ppb), C8 aromatics (xylenes and ethylbenzene, 2.1 ± 2.2 ppb), benzene (1.00 ± 0.92 ppb) and C9 aromatics (0.62 ± 0.64 ppb). All species show enhancements during the polluted episodes, with similar mixing ratios during the cold and warm pollution events (Fig. S5b, Table S2). The mean aromatic mixing ratio in Ketcherside et al. (2025) is 11.9 ppb, almost double what is reported in this work. All aromatics are higher at the residential site, with C8 aromatics having the largest discrepancy – nearly 3 times higher at the residential site than downtown. This likely reflects a greater influence of heating oil combustion in residential areas. The mixing ratios of aromatics in this work are 2–12 times higher than those reported during other North American wintertime campaigns in urban locations like NYC, NY (Gkatzelis et al., 2021); Boulder, CO (Gkatzelis et al., 2021); Pittsburgh, PA (Millet et al., 2005); Houston, TX (Sadeghi et al., 2022); and Toronto, Canada (Rivellini et al., 2024). Benzene, toluene and C8 aromatic levels are comparable to urban and suburban wintertime measurements in China (Li et al., 2015, 2019).
The high aromatic mixing ratio in wintertime Fairbanks compared to other US cities is also likely due, in part, to differences in gasoline composition. Yano et al. (2016) measured the aromatic content of Anchorage, AK gasoline in 2013, after new gasoline regulations took place nationwide. They found benzene content was 1.3 % , and the total aromatic content (benzene, toluene, ethylbenzene, and xylene) was 25 % . This is more than double the average benzene content in gasoline in 2013 (0.6 % ), and about 1.3 times higher than the total aromatic content (19 % ) provided by the United States Environmental Protection Agency (EPA, 2017). The relatively high aromatic content in Alaskan gasoline, combined with increased vehicle emissions at cold temperatures, leads to high gas-phase aromatic mixing ratios.
The greatest carbonyl species was formaldehyde (2.3 ± 1.3 ppb), followed by acetaldehyde (1.8 ± 1.2 ppb) and acetone (1.2 ± 0.7 ppb). Nine other carbonyls had mean values between 0.05–0.17 ppb (Table S1). Formaldehyde, acetaldehyde and acetone are all enhanced during the pollution periods (Fig. S5c, Table S2). Formaldehyde is noticeably much higher during the cold event, whereas acetaldehyde is highest during the warm event. In contrast, measurements of formaldehyde (1.4 ppb) and acetaldehyde (1.3 ppb) at the residential site are on average 40 %–60 % lower compared to downtown measurements. Acetone has a similar mixing ratio range to other wintertime measurements in the US, Europe, and China, although acetaldehyde is 2–3 times higher (Gkatzelis et al., 2021; Legreid et al., 2007; Li et al., 2019; Millet et al., 2005). In another study, formaldehyde, acetaldehyde, and acetone are in a similar range to wintertime non-haze periods in Beijing, and about half as much when compared to haze periods (Rao et al., 2016).
Acetic acid (1.7 ± 1.4 ppb) and formic acid (0.88 ± 0.32 ppb) are the two most prominent acid species. Although these compounds often spike at the same time, in many periods formic acid increases while acetic acid decreases (Fig. S5d, see 28–29 January, 3–4 February, 21–23 February), and they are poorly correlated (Fig. S6), suggesting that they are likely arising from different sources, instead of a shared source like wood heating. Acetic acid at the residential site is lower (1.3 ppb) compared to the downtown site, but formic acid is similar. Formic acid is unique in that it is slightly lower during both pollution events compared to the clean periods (Table S2). This indicates a lack of primary sources of formic acid in downtown Fairbanks, and may be evidence of dark aging, which is discussed more in Sect. 3.2. Both formic acid and acetic acid are moderately lower than urban and suburban wintertime measurements in China (Li et al., 2019).
Mixing ratios of nonaromatic hydrocarbons and nitrogen species are generally low. The two most prominent nonaromatic hydrocarbon species are C3H6 (1.7 ± 1.4 ppb) and C5H8 (0.39 ± 0.31 ppb) (Fig. S7a), but these ions may also include fragmentation of larger VOCs (Coggon et al., 2024; Gueneron et al., 2015). Similarly, the most commonly measured nitrogen-containing ion was NO fragments (Fig. S7b), a common fragment for many organic nitrate species (Aoki et al., 2007; Hansel and Wisthaler, 2000).
3.2 Nine Factor PMF Solution
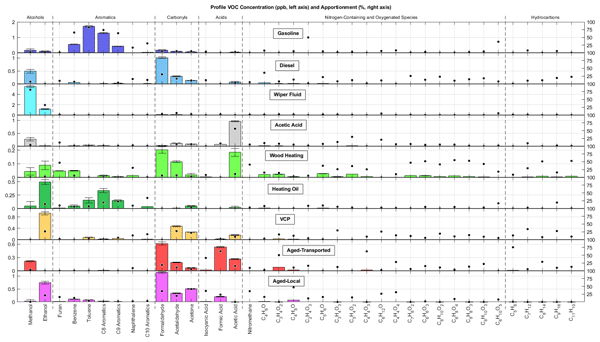
Nine factors were resolved from the PMF analysis. These factors are: gasoline, diesel, windshield wiper fluid, acetic acid, wood heating, heating oil, volatile chemical products (VCPs), aged-transported, and aged-local. Section S1 describes how the nine-factor solution was chosen, while Sect. S2 describes how VOC profiles, diurnal cycles, and correlation with external measurements were used to assign the PMF factors. A summary of the factors is shown in Fig. 2 and Table S3. A log-scale version of Fig. 2 is shown in Fig. S8, all species are shown in Figs. S9–S11, and time series of all factors is shown in Fig. S12. Diurnal cycles of all factors are shown in Fig. 3. In the following, we define a VOC as negligible to a factor's composition when a VOC contributes less than 3 % of its average campaign mixing ratio to a factor. The likely assignment of the VOC “C2H4O2” is acetic acid, however we refer to it by its chemical formula to avoid confusion with the acetic acid factor.
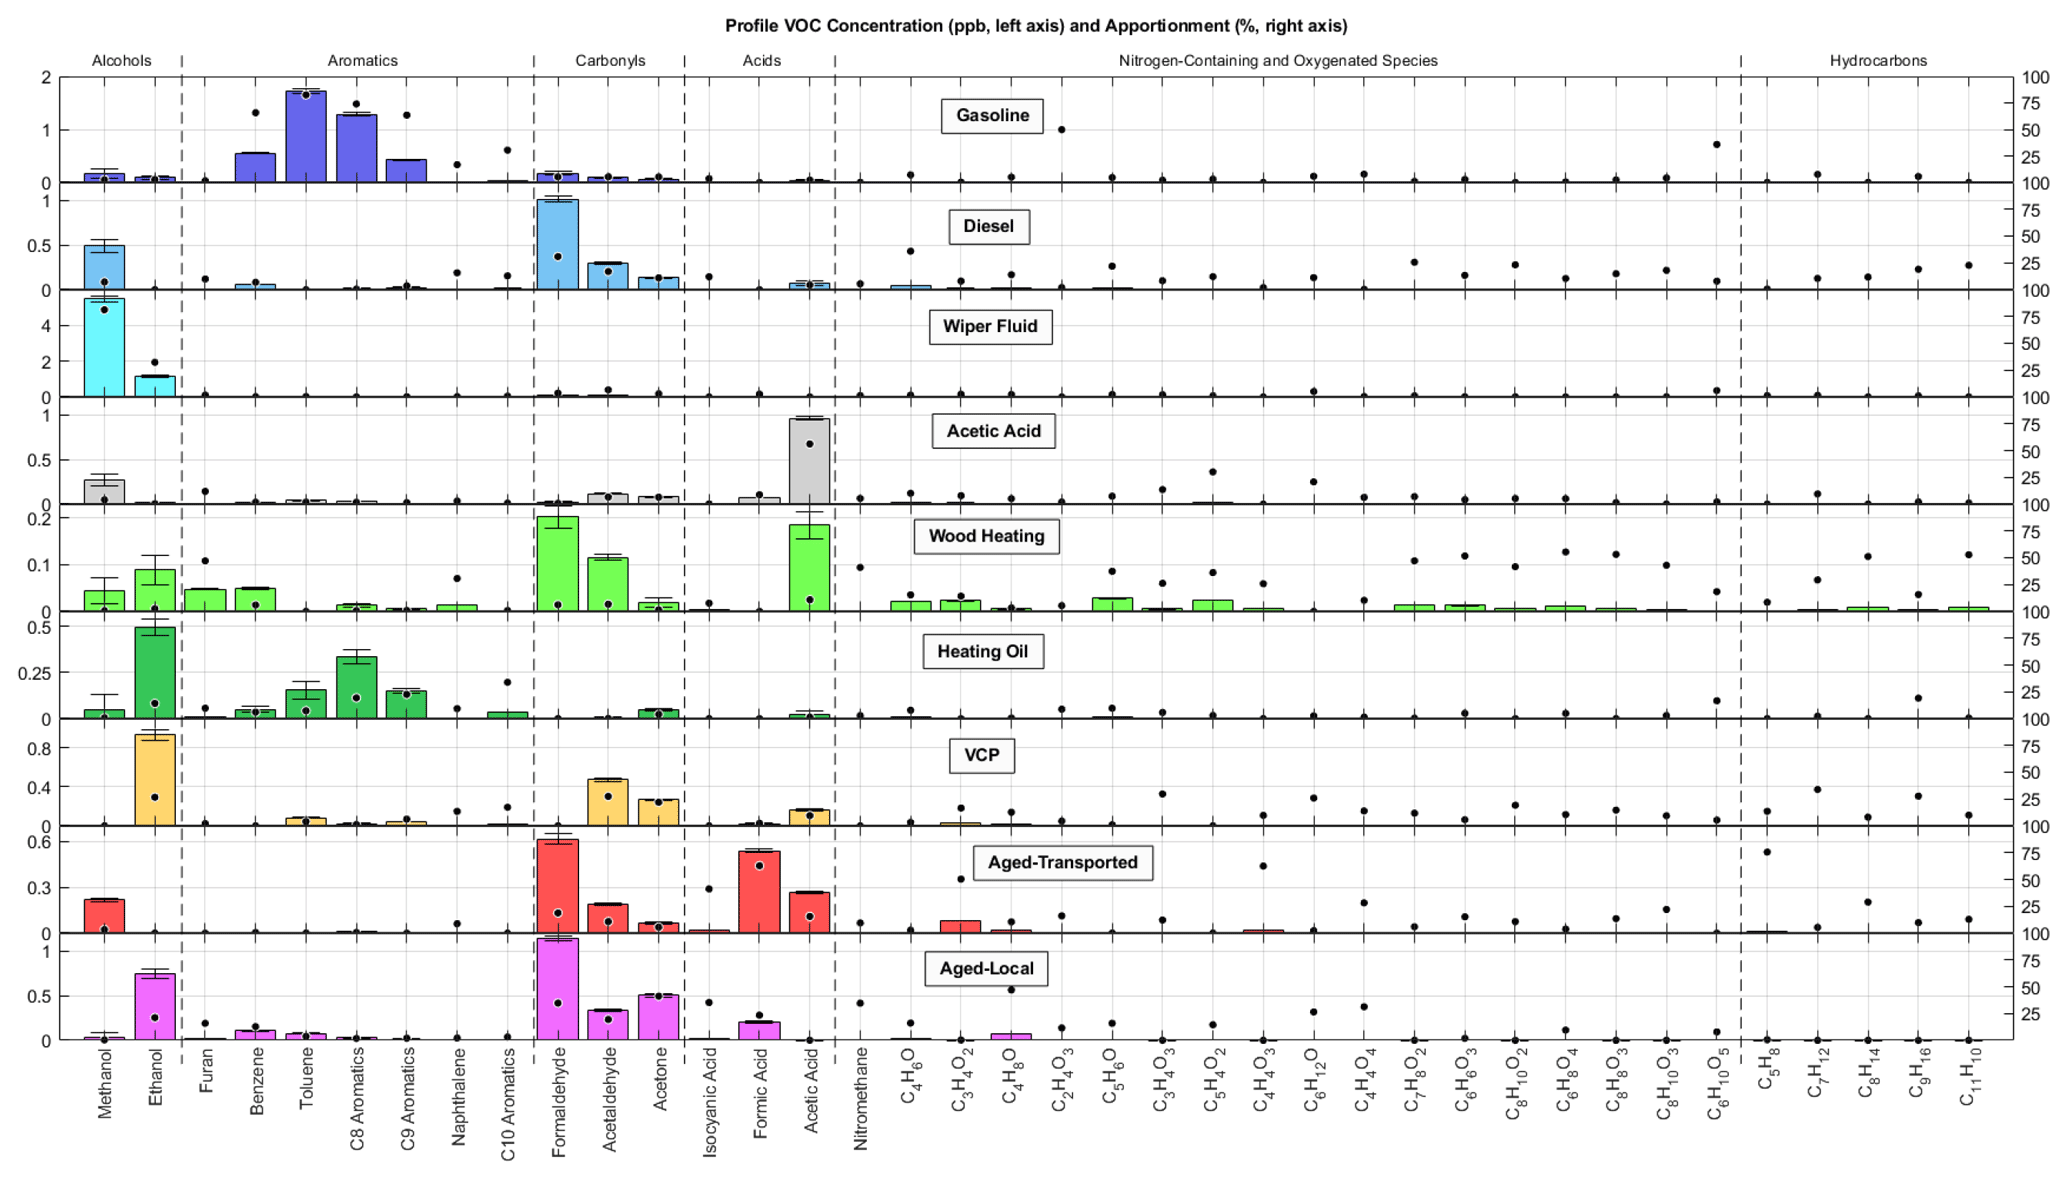
Figure 2Mixing ratio (left y-axis, ppb) and percent apportionment (right y-axis) of VOCs assigned each factor. The x-label shows either the chemical name for species which are likely to be dominated by one isomer, or the chemical formula for species which are likely to have multiple isomers. The mixing ratio and percent for each species in each factor can be found in Tables S9 and S10, respectively.
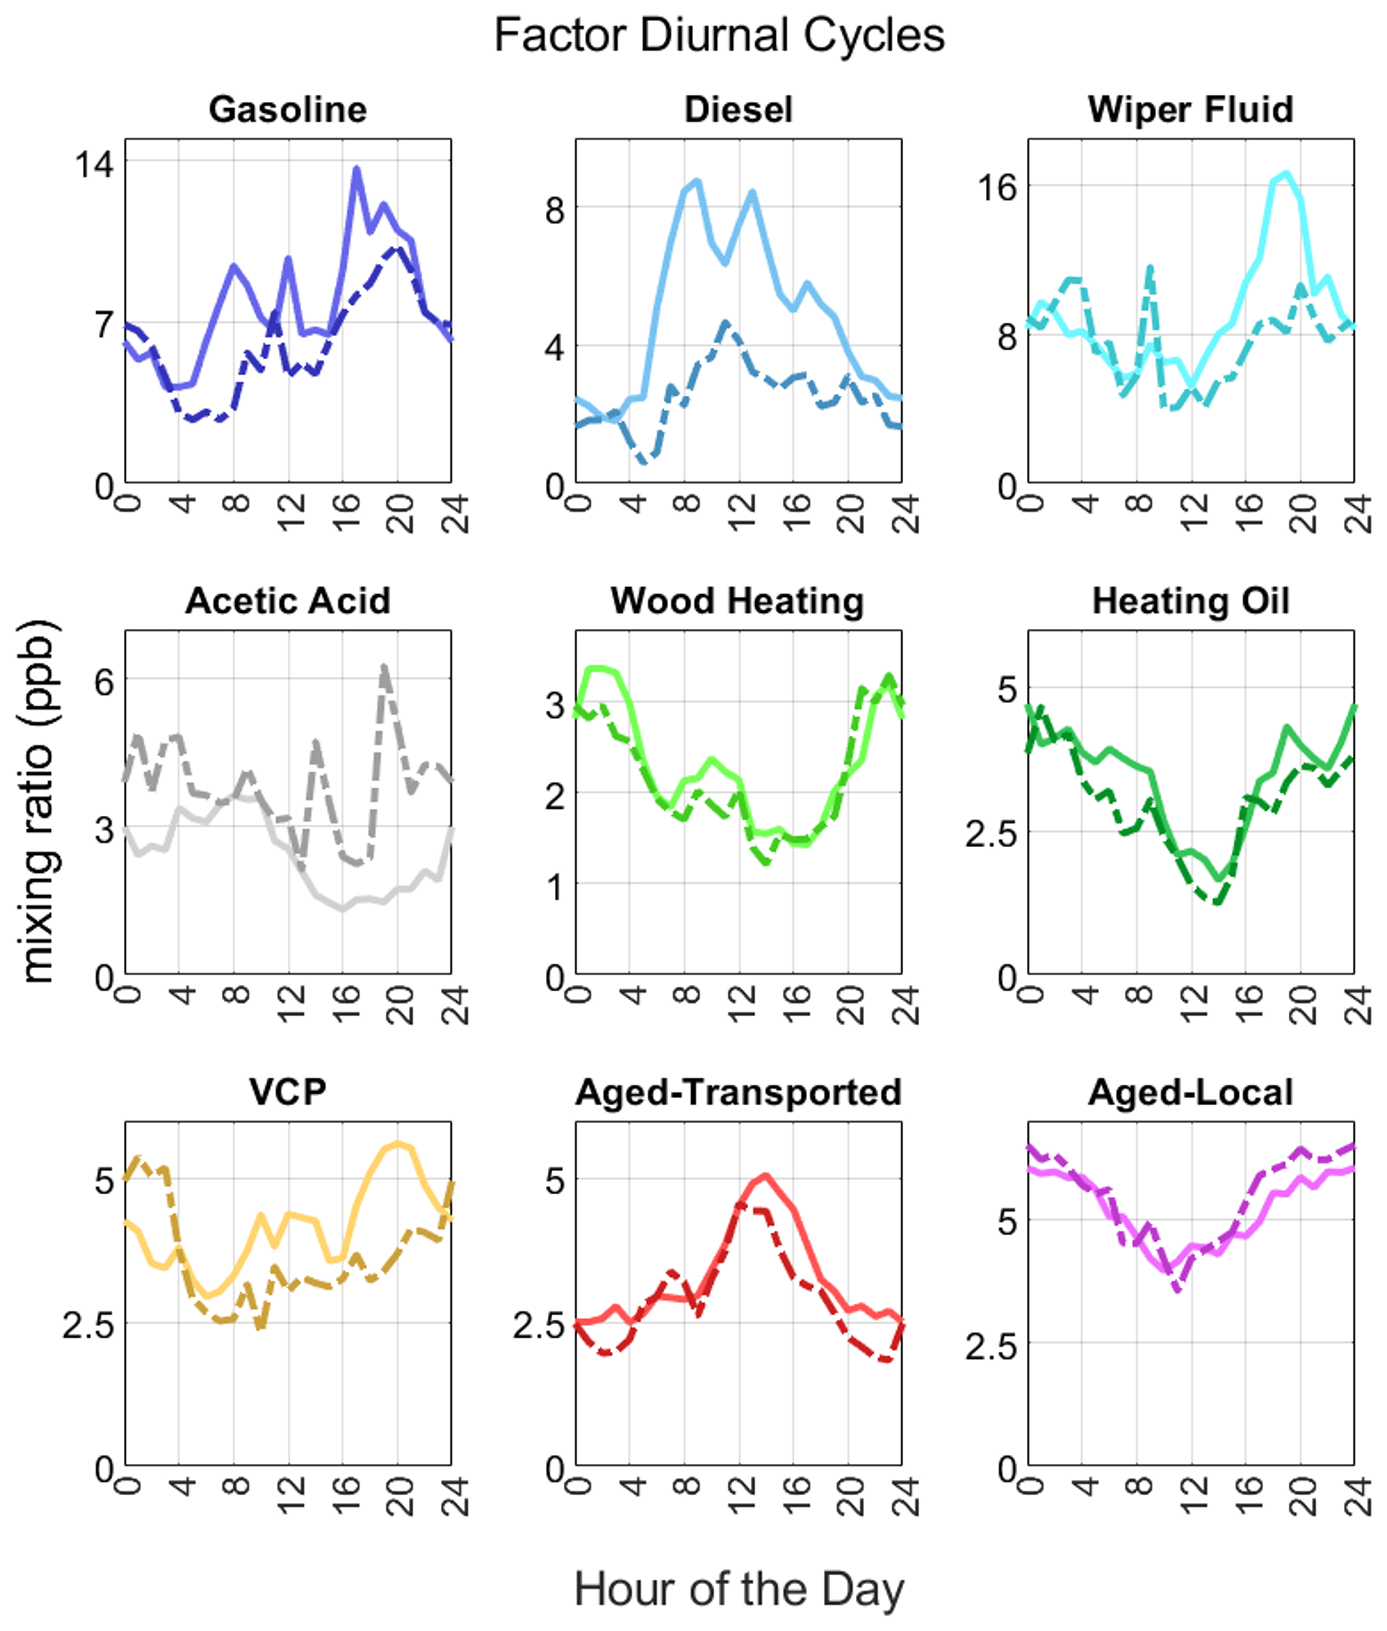
Figure 3Mean diurnal cycles of all figures. The solid line is the weekday diurnal cycle (Monday through Friday), and the dashed line is the weekend diurnal cycle (Saturday and Sunday).
3.2.1 Traffic Factors: Gasoline and Diesel
There are two traffic factors related to direct vehicle emissions – gasoline (6.4 ppb, 18.2 %) and diesel (3.7 ppb, 10.6 %). The gasoline factor is by far the largest source of aromatic species, with 65.8 % of the total measured benzene, 82.6 % of toluene, 74.1 % of C8 aromatics, and 63.4 % of C9 aromatics assigned to the factor. A little more than 5 % each of formaldehyde, acetaldehyde, and acetone are explained by the gasoline factor. 6.9 % of total benzene and 3.5 % of total C9 aromatics are associated with the diesel factor, but toluene and C8 aromatics are negligible. The diesel factor is the largest primary source of formaldehyde, accounting for 30.8 %; acetaldehyde and acetone are lower at 17.0 % and 11.0 %, respectively.
The mean VOC mixing ratios for the gasoline and diesel factor are likely underreported because the PTR-ToF-MS used in this study was not able to measure hydrocarbon species with less than 8 carbons. Ferrarese et al. (2024) shows that gasoline vehicle emissions of hydrocarbons (in mg km−1) between 2–5 carbons are higher than aromatic emissions, and that hydrocarbon emissions increase as temperature decreases. Diesel emissions of short-chain hydrocarbons are overall smaller, but also increase as temperature decreases.
Both traffic factors are lower on weekends than during the weekdays, with diesel decreasing the most by nearly 50 % (Fig. 3). This may indicate that heavy duty diesel vehicles that do not operate on weekends (school busses, public transportation, garbage trucks, etc.) account for much of the diesel emissions.
The gasoline and diesel factors do not have the same diurnal cycles, although this could be due to differences in cold start emissions between gasoline and diesel vehicles. The weekday and weekend diurnal cycles for each factor are shown in Fig. 3. The gasoline and diesel factors both increase early in the morning. Gasoline continues to increase until it peaks around 07:00 pm LT, whereas diesel starts to decrease around 02:00 pm LT. Since the site is downtown (as opposed to the residential areas outside of downtown), measurements in the morning will mainly be characterized by vehicles that have been started elsewhere and are driven into town, so the full impact of cold start emissions are not expected to be observed. After the typical workday is over, vehicles will be cold-started downtown, which would lead to an increase in gasoline vehicle emissions (Cao et al., 2024; George et al., 2015). However, diesel vehicle VOC emissions are less affected by cold starts overall compared to gasoline vehicles (Ferrarese et al., 2024; Marques et al., 2022; Wang et al., 2022), which leads to a much lower afternoon peak for diesel compared to gasoline. Some diesel vehicle emissions, especially carbonyls, can increase at low temperatures (Ferrarese et al., 2024; Hays et al., 2017; Liu et al., 2023; Suarez-Bertoa et al., 2022; Wærsted et al., 2022; Zhang et al., 2026), but to our knowledge emission measurements for VOCs diesel vehicles have not been carried out at the extremely low temperatures Fairbanks experiences.
3.2.2 Other Vehicle-Related Factors: Windshield Wiper Fluid and Acetic Acid
The windshield wiper fluid factor (7.2 ppb, 20.7 %) is made up of 81.2 % of the total measured methanol and 32.3 % of the total ethanol. Contributions from all other species are very small. The wiper fluid factor is the largest source of VOCs due to high mixing ratios of methanol measured during the campaign. Since the windshield wiper fluid is only associated with vehicles but is not a direct tailpipe emission, it is technically a volatile chemical product (VCP). However, we feel it is more fitting to include the wiper fluid factor as a vehicle-associated factor, since the VCP factor (discussed in Sect. 3.2.4) is a much broader grouping that includes cleaning products, personal care products, solvents, and other similar products.
The periods with the highest mixing ratio of the wiper fluid factor are the warmer periods at the beginning (21–26 January) and end (21–27 February) of the ALPACA campaign, where temperatures are often greater than −15 °C (Fig. S13). It is 2.9 times higher on average in the warm polluted period than the cold polluted period. In warmer periods, slush and mud on the road from snow melt would be more common, necessitating more use of windshield wiper fluid.
The acetic acid factor (2.4 ppb, 6.8 %) may be related to vehicle emissions, as described in the Sect. S2. The acetic acid factor mainly consists of C2H4O2 (acetic acid), and 56.1 % of the total C2H4O2 measured is attributed to this factor. It does not have a well-defined diurnal cycle (Fig. 3), as it is affected by large spikes of C2H4O2 which do not occur at regular intervals.
If the windshield wiper fluid and acetic acid factors are included with the gasoline and diesel factors, the total VOCs related to vehicles increases from 28.8 % to 56.3 %.
3.2.3 Space Heating Factors: Wood Heating and Heating Oil
Two factors were related to residential heating: wood heating (2.0 ppb, 5.6 %) and heating oil (3.1 ppb, 8.8 %). Although wood heating and heating oil are the largest and second largest contributors to PM2.5 mass, respectively (Nattinger, 2016), their contribution to total VOC mixing ratios are relatively small at 14.2 % total.
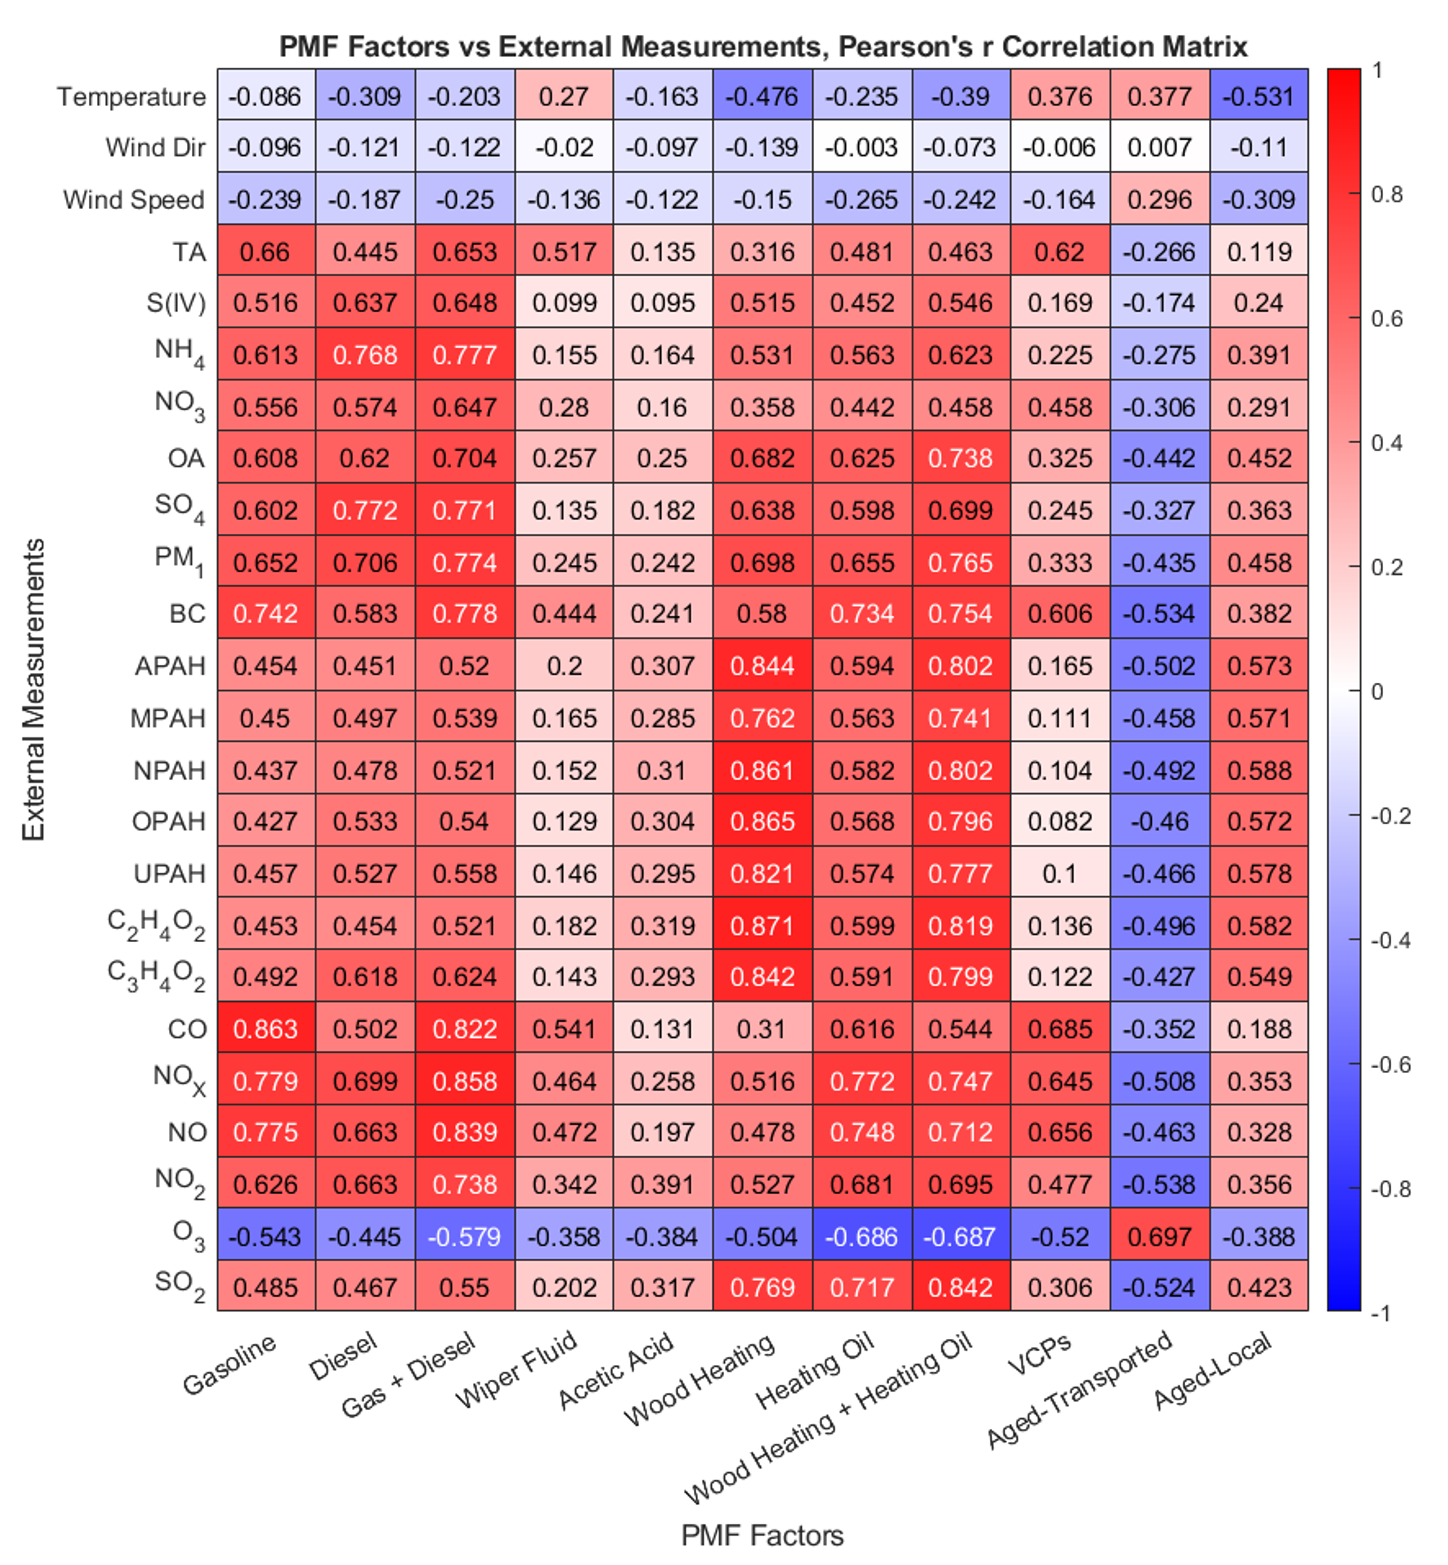
Figure 4Correlation matrix of PMF factors versus external species. TA (total ammonium) includes both gas-phase and aerosol-phase measurements. Species from S(IV) to C3H4O2 are all measurements in the aerosol phase. Species from CO to SO2 are all measurements in the aerosol phase.
Residential wood heating is a moderate source of small carbonyl species, associated with 6.2 % of total formaldehyde and 6.7 % of acetaldehyde. It is also associated with 5.9 % of benzene, although other aromatics are negligible. Heating oil, which can be residential or commercial in downtown Fairbanks, is the second largest contributor to total aromatics, including 19.3 % of C8 aromatics and 22.6 % of C9 aromatics. Figure 4 shows a weak negative correlation between temperature and wood heating. The wood heating factor is 6.1 times higher in the cold polluted period than the warm polluted period, a large increase in wood burning at these extremely cold temperatures.
Heating oil is associated with no formaldehyde or acetaldehyde, and 4.1 % of the total acetone. The lack of formaldehyde assigned to the heating oil factor may be because heating oil boilers operate without after-treatment systems. In contrast, diesel vehicles can produce higher formaldehyde emissions due to oxidation of unburned fuel in their exhaust after-treatment systems, especially under cold conditions (Suarez-Bertoa et al., 2022).
3.2.4 Volatile Chemical Products (VCP) Factor
The VCP factor (3.1 ppb, 8.9 %) is a minor contributor to VOCs in Fairbanks, in contrast to other US cities like LA, NYC, and Boulder, where it is becoming a main anthropogenic source of VOCs; McDonald et al. (2018) and Gkatzelis et al. (2021) find that the ratio of vehicle emissions to VCP emissions is between 0.3–1.4. In Fairbanks, we find that vehicle emissions are 3.2 times higher than VCPs when looking at only the combined gasoline and diesel factors, and 6.3 times higher when including the windshield wiper fluid and acetic acid factor. The relatively high contribution of VOCs related to vehicles is likely due to the increase in both gasoline and diesel vehicle VOC emissions at low temperatures (Cao et al., 2024; Ferrarese et al., 2024; George et al., 2015; Hays et al., 2017; Liu et al., 2023), and decreased volatility of VCPs at cold temperatures leading to less off-gassing. Overall, vehicle emissions remain the dominant source of VOCs in wintertime Fairbanks.
The VCP factor is highest during the warmer periods at the beginning (21–26 January) and end (21–27 February) of the ALPACA campaign (Fig. S14), and 3.3 times higher on average in the warm polluted period than the cold polluted period. This could be due to more off-gassing of VCP products at higher temperatures.
3.2.5 Aged-Transported Factor
The aged-transported factor (2.8 ppb, 7.9 %) describes air masses that have been transported from outside downtown Fairbanks and have undergone secondary chemistry. 18.7 % of total formaldehyde, 10.7 % of acetaldehyde, and 5.5 % of acetone are associated with the aged-transported factor. Benzene, toluene, C8 aromatics and C9 aromatics are all negligible. This factor is the largest source of formic acid, accounting for 62.8 %. The large fraction of formic acid, formaldehyde (18.7 %), and maleic anhydride (64.3 %), combined with this factor being the only one with a positive correlation to ozone (Fig. 4), may be indicative of secondary formation via ozonolysis and/or NO3 radicals (Eliason et al., 2003; Li et al., 2023; Paulot et al., 2011). The aged-transported factor explains much of the observed C3H4O2 (50.3 %), C2H4O3 (16.1 %), C3H4O3 (75.6 %), C4H4O3 (62.5 %), C5H6O3 (28.9 %), C4H4O4 (28.2 %), and C5H6O4 (29.7 %). These species are associated with aged residential biomass burning plumes (Coggon et al., 2019; Li et al., 2023) and decomposition of aromatic VOCs (Lannuque et al., 2023; Mehra et al., 2020). And, as mentioned earlier, formic acid mixing ratios are lower during both polluted events with strong surface inversions, indicating few primary sources of formic acid in downtown Fairbanks. As discussed in Brett et al. (2025), residential space heating emissions are emitted above the surface. Thus, wood heating plumes may be transported aloft from areas with prominent wood heating emissions, during which longer chain VOC species are oxidized by ozone and/or NO3 radicals, and break down into smaller chain VOCs, producing formaldehyde and especially formic acid. A similar OVOC factor was observed in Wang et al. (2024). It had similarities to the time series of O3 + NO2, contributions from low mass oxidized compounds like formic acid, and high contribution from CxHyO3 ions, although they relate it to daytime photochemistry.
We further evaluate the aged-transported factor by comparing it and ozone to wind speed and direction. Ozone, as shown in Fig. S15, increases significantly when wind speed is greater than 3 mph (4.8 km h−1). These higher wind speeds coincide with weakly stable periods and lower NOx, and more vertical mixing, as discussed in Brett et al. (2025). In contrast, strongly stable stagnant conditions correspond to low wind speeds, and are associated with high NOx which titrates ozone. At the surface, during periods of higher wind speeds, air masses mainly come from 0–100° (northeast to east direction) or 210–280° (southwest to west). Figures 4 and S16 show that the aged-transported factor is the only factor to have a positive correlation with wind speed. However, unlike ozone, Fig. S15 shows that the aged-transported factor (at the surface) only increases when wind directions are from the east (80–100°). This means that not only wind speed, but also the wind direction matters for the aged-transported factor. Figure S17 show the high wind speed vectors overlaid on a map of Fairbanks, with points colored by the mixing ratio of the aged-transported factor. We can see that periods associated with a higher mixing ratio come from Fort Wainwright and the northern part of the town Badger. It is also possible that plumes from the nearby town of North Pole, which has greater use of wood heating compared to Fairbanks (Nattinger, 2016), are included in these air masses. Brett et al. (2025) examined pollutant dispersion during ALPACA. The results show clear differences in pollutant dispersion and emission influences between stable conditions with strong surface-based temperature inversions trapping pollutants local to the CTC site below 20 m, and weakly stable conditions with enhanced vertical exchange and pollutant dispersion. Higher wind speeds indicate transport from less populated areas like Steele Creek and Ester are associated with lower mixing ratios.
3.2.6 Aged-Local Factor
The aged-local factor (4.4 ppb, 12.6 %) contains relatively stable products of atmospheric reactions involving a wide range of VOCs, and accounts for 21.2 %, 34.7 %, 19.4 %, and 41.2 % of the variability of ethanol, formaldehyde, acetaldehyde, and acetone, respectively. Notably, it is also the factor with the second largest amount of formic acid (23.5 %), which we associate with secondary chemistry. It has a low contribution of markers of primary emissions, does not correlate well with any usual tracers or external measurements (Fig. 4), and has small diurnal variability (Fig. 3). This indicates that this factor is secondary in nature, representing the local background. It has a low contribution from primary emission markers (12.7 % of benzene and 3.7 % of toluene is related to this factor, but other aromatics are negligible).
3.2.7 Factor Summary
According the PMF result, vehicle-related factors are the largest source of VOCs in downtown Fairbanks. Gasoline vehicles are by far the largest source of all major aromatic species like benzene, toluene, C8 aromatics, and C9 aromatics. A smaller but still significant fraction is attributed to heating oil, especially C8 (19.3 %) and C9 aromatics (22.6 %). Sources of carbonyl species are more variable. Diesel is the largest primary source of formaldehyde (30.8 %). The aged-transported and aged-local factors account for about 53 % of the formaldehyde, which may be a mixture of primary and secondary sources. The three largest sources of acetaldehyde are (in decreasing order) VCPs, local aged air, and diesel. The three largest sources of acetone are (in decreasing order) local aged air, VCPs, and diesel.
3.3 Comparison with Other PMF Work in Fairbanks
Ketcherside et al. (2025) also used PTR-ToF-MS data in Fairbanks to conduct PMF of VOC measurements in Fairbanks, but there are a few main differences. First, their instrumentation was located in a residential area 2.6 km away from the downtown site. Therefore, their analysis is likely more influenced by residential factors, like space heating. Second, in their PMF analysis they included species that were measured at the residential site by instruments besides PTR-ToF-MS, like the gas-phase species CO and NOx, as well as aerosol-phase PM1 species like BC, sulfate, nitrate, and ammonium. They also include SO2 measured at the downtown site. In our analysis, we only use PTR-ToF-MS data as inputs for PMF analysis, but we do compare the PMF outputs to the corresponding downtown measurements of these species. Third, their analysis is based on hourly measurements, while ours is based on 2-minute data. They also use the EPA PMF 5.0 software while we use SoFi Pro V9; however, both are based on the ME-2 engine (Canonaco et al., 2013; Norris et al., 2014) so the PMF procedures should be largely similar. More information on the differences between these two sites and the instrumentation at the residential site can be found in Simpson et al. (2024) and Ketcherside et al. (2025).
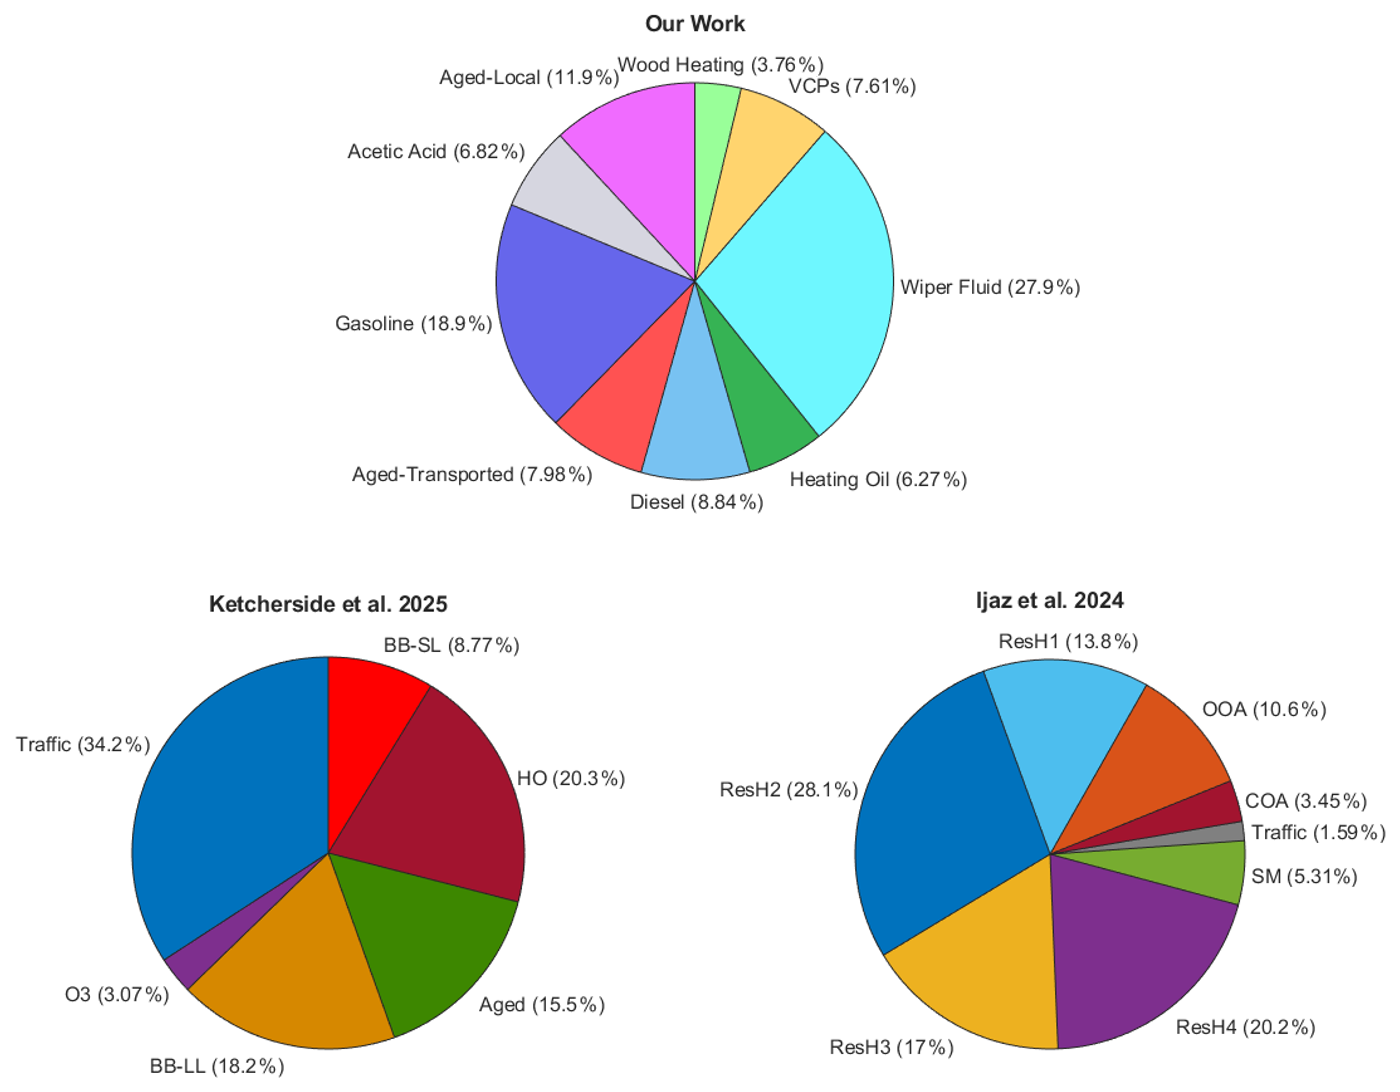
Figure 5Comparison of the PMF factor solutions used in this work, Ketcherside et al. (2025), and Ijaz et al. (2025b). In Ijaz et al. (2025b), the factors ResH1, ResH2, and ResH4 originate from biomass burning, while ResH3 originates from heating oil.
Despite the different methodology, there are many similarities between our work and the results in Ketcherside et al. (2025). Both studies found factors related to aged-transported air masses (which they call ozone), local aged air, heating oil, wood heating (i.e., biomass burning), and traffic. Their study identifies two biomass burning factors (one for short-lived VOCs and one for long-lived), while we only have one. We find two traffic factors, while in their six-factor solution they only find one. Their traffic diurnal cycle is most similar to our gasoline factor. We find the wiper fluid, VCP, and acetic acid factor, which they did not. They found that methanol was largely associated with traffic emissions, which is similar to our assignment of methanol to windshield wiper fluid. They also did not observe the large spikes of C2H4O2 that we find, which helps to confirm that our analysis of C2H4O2 are local to the downtown site. They mainly attribute C2H4O2 and formic acid to biomass burning, while we find that much of the C2H4O2 is in its own factor (the acetic acid factor), and formic acid is mainly attributed to the aged-transported factor. Figure 5 presents pie charts of the PMF factor contributions from our work and Ketcherside et al. (2025), It is notable that wood heating and heating oil are a significantly smaller fraction in our work compared to theirs. Figure S18 can be used for further comparison between the two studies.
Both our study and Ketcherside et al. (2025) find traffic to be the largest source and heating oil to be the second largest source of aromatic VOCs. However, in our results the gasoline factor dominates, making up 75 % of the total benzene, toluene, C8 aromatics, and C9 aromatics, while heating oil only makes up 13 %. In Ketcherside et al. (2025), gasoline makes up 48 % and heating oil makes up 39 %. This large difference likely due to the increased influence of space heating at the residential site compared to the downtown site. The large amount of aromatic VOCs attributed to VOCs in both works is in contrast to the Alaska Department of Environmental Conservation's emission inventory for ALPACA, which contributes little to no aromatic species to heating oil, as described in Zhang et al. (2026). The results of these works show a need to update the emission inventories to include heating oil emissions of aromatic species. Based on these findings, tracer modelling of aromatics during ALPACA show improved agreement with observations when these emissions are included (Zhang et al., 2026).
Ketcherside et al. (2025) attributes 18 % of formaldehyde to heating oil, whereas we do not see any formaldehyde associated with heating oil. A possible reason for this discrepancy could be due to the different time resolution used in our works. The measurements in Ketcherside et al. (2025) were averaged to one hour, while our measurements are every 2 min. Heating oil and diesel fuel are compositionally similar but the combustion process is different, so the emissions are comparable but not identical. Our two-minute data may be able to resolve the differences between heating oil and diesel emissions more effectively. Another reason is that since their work was conducted at a residential site with less traffic than our downtown site, diesel emissions are expected to be much smaller and thus may be more difficult to distinguish from heating oil. As the downtown site is much more dominated by traffic emissions, the variation of formaldehyde related to heating oil may be difficult to distinguish from other factors. Qualitatively, their heating oil factor contains characteristics of both our diesel and heating oil factors – for example, a 5 am increase similar to our diesel factor, and an afternoon increase present in our heating oil factor.
Our wood heating factor appears to be most comparable to the short-lived biomass burning factor in Ketcherside et al. (2025), including similarities between the furan, methylfuran, furfural, and methylfurfural assignments, and their diurnal cycles (Fig. 3, Table S4). Meanwhile, our aged-transported factor has similarities to the chemical composition of their long-lived biomass burning factor (notably formic acid and formaldehyde, as well as furans and other aldehydes, Table S4) but the diurnal cycle of the aged-transported factor is closer to their ozone factor diurnal cycles. The discrepancy between chemical composition and diurnal cycles may be because 98 % of ozone gas was applied to their ozone factor. Although our aged-transported factor is correlated with observed ozone, there are also periods where observed ozone and the aged-transported factor are not in agreement (Fig. S15). Their ozone factor describes the transport of background levels of ozone from all wind directions, but our aged-transported factor is highest when wind direction is from the east.
We cannot compare the source apportionment of species like CO, NOx, BC, and PM1 sulfate because we used these species as external validation to compare with the PMF results. However, we do find that CO, NOx, and BC are well-correlated with traffic (Fig. 4), which is consistent with these species being associated with their traffic factors.
Ijaz et al. (2025b) conducted PMF in Fairbanks using PM1 measurements with both a PTR-ToF-MS with a CHARON inlet and an AMS. We focus on their PTR-ToF-MS results here since that is the same instrument used in our analysis. They found four residential heating-related factors, including three biomass burning factors and one heating oil factor, which contribute on average 2.6 µg m−3 (62 %) of total measured OA. Although this is a much larger fraction of OA mass compared the 14 % of total VOCs we attribute to residential heating, the absolute mass is much lower than our wood heating (8.6 µg m−3) and heating oil (12.1 µg m−3) factors. Ijaz et al. (2025b) attribute about 1.6 % (0.06 µg m−3) of measured OA to traffic, significantly less than the 29 % (36.6 µg m−3) of VOCs that we attribute to the gasoline and diesel factor. They also identify a cooking factor, while neither our work nor Ketcherside et al. (2025) resolved a cooking factor. This comparison shows major differences between the sources of PM1 OA and gaseous VOCs. Comparison of VOC and aerosol partitioning is also explored in Ijaz et al. (2025a).
3.4 PMF Comparison with Mist Chamber Total Ammonium and PILS S(IV)
High concentrations of HMS and related aldehyde-S(IV) species are a unique feature of Fairbanks wintertime PM2.5 (Campbell et al., 2022, 2024; Dingilian et al., 2024a; Holen et al., 2025; Moon et al., 2023) and so are investigated more here. The MC-IC measures gas-phase and PM2.5 aerosol-phase species. This is important for total ammonium, which could have a significant portion in the gas-phase. In extremely cold environments like Fairbanks, high concentrations of total ammonium can increase aerosol pH to 4-5, greatly facilitating secondary aqueous chemistry of species like HMS and sulfate (Campbell et al., 2024). We compare MC-IC total ammonium (TA) measurements to the PMF factors in order to help determine the sources of TA.
Gasoline vehicles may be a large source of total ammonium in wintertime Fairbanks. The diurnal cycle of TA has many similarities to the gasoline factor, including an early morning increase and 05:00 pm LT peak on weekdays (Fig. S19). We find that TA correlates best with the gasoline factor (r = 0.659), followed by the VCP factor (r = 0.620) as shown in Fig. 4. TA is also correlated to external factors CO (R2 = 0.47), NOx, (R2 = 0.42), and somewhat with BC (R2 = 0.36), which are commonly associated with vehicle emissions (Fig. S20). Vehicle emissions have also been shown to be a large source of ammonia (Ji et al., 2025). Therefore, a large fraction of TA may be coming from gasoline vehicle emissions. VCPs may also be a large source of TA, but since VCPs include a broad category of industrial and personal care products, it is more difficult to pinpoint exact sources.
HMS formation may be highly dependent on ammonia emissions from gasoline vehicles because of ammonia's effects on aerosol acidity, and formaldehyde emissions from diesel vehicles because formaldehyde is an HMS precursor. PILS-IC total S(IV) correlates best with diesel (r = 0.636), followed by gasoline (r = 0.516) and wood heating (r = 0.515), as shown in Fig. 4. The total S(IV) during the ALPACA campaign was found to be mostly HMS in Dingilian et al. (2024a) and Holen et al. (2025). Total S(IV) has a diurnal cycle most similar to diesel during weekdays and most similar to gasoline on the weekends (Fig. S21). Furthermore, total S(IV) has a similar diurnal cycle to formaldehyde on weekdays and NHx on the weekends (Fig. S22). Although SO2 gas is a precursor to HMS, there are few similarities to the S(IV) and SO2 diurnal cycles (Fig. S22), which may be because SO2 gas (campaign mean 9.6 ppb) is often much higher than formaldehyde gas (campaign mean 2.3 ppb), making formaldehyde mixing ratios more often the limiting factor in HMS formation (Dingilian et al., 2024a). The diesel factor is not the largest source of formaldehyde, but formation of HMS related to the gasoline and diesel factors is likely helped by both factors being emitted in the same place, and the mixing of air that occurs from moving vehicles.
As the site in Ketcherside et al. (2025) is residential, we expect VOC species related to vehicle emissions to be lower compared to our downtown site. This is true for formaldehyde, which is on average 60 % lower at the residential site compared to downtown. Assuming the same is true for total ammonia, secondary aerosol formation of S(IV) and other species may be elevated at the downtown site compared to the residential site.
Since the formation of HMS and other S(IV) species are secondary reactions, many other factors need to be considered, and this is not a complete picture of what drives aqueous S(IV) chemistry in Fairbanks. However, this first investigation seems to indicate that vehicle emissions are involved in S(IV) formation.
In this work, we use online PTR-ToF-MS measurements at two minute time resolution to characterize VOCs in downtown Fairbanks during the winter 2022 ALPACA campaign. High mixing ratios of many hazardous VOCs like formaldehyde, benzene, and toluene were measured in wintertime Fairbanks, with mixing ratios comparable to and often exceeding measurements in other US cities. With PMF analysis, we attribute 29 %–36 % of total VOCs to direct vehicle emissions and 21 % to windshield wiper fluid, for a maximum of 56 % of vehicle-related VOCs. The mean mixing ratios of the gasoline and diesel factors are likely underreported since we were unable to measure short-chain alkanes. Unlike many other US cities, VCPs related to consumer and industrial products are a relatively minor source of VOCs. High mixing ratios of aromatics were measured and a majority of all prominent aromatic species (benzene, toluene, C8 aromatics, C9 aromatics) were attributed to gasoline vehicles, followed by heating oil as the second largest aromatic factor. Sources of various carbonyls are more complex. Large portions of formaldehyde can be attributed to diesel vehicles, wood heating, aged and transported air masses, and possible secondary chemistry; other species like acetaldehyde and acetone can be attributed to diesel, aged and transported air masses, and VCPs.
We further compare these source profiles with other complementary measurements, including total ammonium and S(IV). Total ammonium, which allows for the moderate aerosol pH that S(IV) formation requires in wintertime Fairbanks, is best correlated with the gasoline factor. S(IV) (largely made up of HMS) is best correlated with the diesel factor, which is the largest primary source of formaldehyde (an HMS precursor), and S(IV) has a similar diurnal cycle to both gasoline and diesel vehicles. These results suggest that formation of S(IV) adducts in the particle phase may be linked to vehicle emissions through ammonia and aldehydes, highlighting the importance of VOCs on secondary aerosol formation in extremely dark and cold environments like Fairbanks.
Several aspects can be further improved in future work. Measurements of short-chain alkanes and alkenes would provide a more comprehensive characterization of VOCs in wintertime Fairbanks. In addition, the lack of ammonia measurements during the ALPACA campaign precludes definitive conclusions about secondary S(IV) formation. Future measurements that simultaneously characterize VOCs, ammonia, ammonium, and S(IV), combined with aerosol pH modeling, would enable a more comprehensive understanding of the mechanisms controlling S(IV) formation.
Our work highlights the important role of VOCs, particularly aldehydes, in secondary aerosol sulfur formation in winter urban environments. We show that vehicle emissions can influence aerosol sulfur chemistry directly through S(IV) precursors and indirectly through ammonia that modulates aerosol acidity. These findings demonstrate the coupled roles of organic and inorganic emissions in wintertime secondary aerosol formation and may help develop more effective air quality control strategies in cold urban environments beyond Fairbanks.
Meteorological data used in this study are available at https://doi.org/10.18739/A27D2Q87W (Simpson et al., 2023). MC-IC, PILS-IC, and COFFEE HCHO data is available at https://doi.org/10.18739/A2VD6P65Q (Dingilian et al., 2024b). The PTR-ToF-MS dataset can be found at https://doi.org/10.18739/A2G44HS98 (Campbell et al., 2026).
The supplement related to this article is available online at https://doi.org/10.5194/acp-26-15161-2026-supplement.
SoFi PMF analysis was performed by JRC and BTR. JRC, BTR, BDA, KL, RJW, KSL, MB, KKD, JMSC, and JM contributed to data collection and data analysis. JRC prepared the manuscript with key contributions from BTR, BDA, KL, JM, and contributions from all coauthors.
The contact author has declared that none of the authors has any competing interests.
Publisher's note: Copernicus Publications remains neutral with regard to jurisdictional claims made in the text, published maps, institutional affiliations, or any other geographical representation in this paper. The authors bear the ultimate responsibility for providing appropriate place names. Views expressed in the text are those of the authors and do not necessarily reflect the views of the publisher.
We thank William R. Simpson for measurements provided at the downtown site.
The ALPACA project was initiated as a part of PACES under IGAC and with the support of IASC. J.R.C and J.M. were supported by the NSF Atmospheric and Geospace Sciences Program (grant no. AGS-2029747) and the NSF Navigating the New Arctic Program (grant no. ICER-1927750). B.D'A., K.S.L, B.T.-M. and W.Z. acknowledge support from the Agence National de Recherche (ANR) CASPA (Climate relevant Aerosol Sources and Processes in the Arctic) project (Grant ANR-21-CE010017), and the Institut polaire français Paul-Émile Victor (IPEV) (Grant 1215) and CNRS-INSU programme LEFE (Les Enveloppes Fluides et l'Environnement) ALPACA-France Projects. K.K.D., M.B. and R.J.W. were supported by the NSF Atmospheric Geoscience Program (grant no. AGS-2029730) and the NSF Navigating the New Arctic Program (grant no. ICER-1927778). M.B. acknowledges support from NASA (grant no. 80NSSC18K0557). M.C.-M was supported by the NSF Sustainably Navigating Arctic Pollution Through Engaging Communities (grant no. 1927750). J.M.S.C. acknowledges support from the NSF Atmospheric Geoscience Program (grant no. AGS-2029770).
This paper was edited by Barbara Ervens and reviewed by two anonymous referees.
Aoki, N., Inomata, S., and Tanimoto, H.: Detection of C1–C5 alkyl nitrates by proton transfer reaction time-of-flight mass spectrometry, Int. J. Mass Spectrom., 263, 12–21, https://doi.org/10.1016/j.ijms.2006.11.018, 2007.
Baudic, A., Gros, V., Sauvage, S., Locoge, N., Sanchez, O., Sarda-Estève, R., Kalogridis, C., Petit, J.-E., Bonnaire, N., Baisnée, D., Favez, O., Albinet, A., Sciare, J., and Bonsang, B.: Seasonal variability and source apportionment of volatile organic compounds (VOCs) in the Paris megacity (France), Atmos. Chem. Phys., 16, 11961–11989, https://doi.org/10.5194/acp-16-11961-2016, 2016.
Boyce, S. D. and Hoffmann, M. R.: Kinetics and mechanism of the formation of hydroxymethanesulfonic acid at low pH, J. Phys. Chem., 88, 4740–4746, https://doi.org/10.1021/j150664a059, 1984.
Brett, N., Law, K. S., Arnold, S. R., Fochesatto, J. G., Raut, J.-C., Onishi, T., Gilliam, R., Fahey, K., Huff, D., Pouliot, G., Barret, B., Dieudonné, E., Pohorsky, R., Schmale, J., Baccarini, A., Bekki, S., Pappaccogli, G., Scoto, F., Decesari, S., Donateo, A., Cesler-Maloney, M., Simpson, W., Medina, P., D'Anna, B., Temime-Roussel, B., Savarino, J., Albertin, S., Mao, J., Alexander, B., Moon, A., DeCarlo, P. F., Selimovic, V., Yokelson, R., and Robinson, E. S.: Investigating processes influencing simulation of local Arctic wintertime anthropogenic pollution in Fairbanks, Alaska, during ALPACA-2022, Atmos. Chem. Phys., 25, 1063–1104, https://doi.org/10.5194/acp-25-1063-2025, 2025.
Brown, P., Watts, P., Märk, T. D., and Mayhew, C. A.: Proton transfer reaction mass spectrometry investigations on the effects of reduced electric field and reagent ion internal energy on product ion branching ratios for a series of saturated alcohols, Int. J. Mass Spectrom., 294, 103–111, https://doi.org/10.1016/j.ijms.2010.05.028, 2010.
Buhr, K., van Ruth, S., and Delahunty, C.: Analysis of volatile flavour compounds by Proton Transfer Reaction-Mass Spectrometry: fragmentation patterns and discrimination between isobaric and isomeric compounds, Int. J. Mass Spectrom., 221, 1–7, https://doi.org/10.1016/S1387-3806(02)00896-5, 2002.
Campbell, J., Temime-Roussel, B., D'Anna, B., Law, K., Zhang, W., Weber, R., Battaglia Jr., M., Dingilian, K., Cesler-Maloney, M., St Clair, J., Chazeau, B., and Mao, J.: Online gas-phase PTR-ToF-MS data in wintertime Fairbanks, Alaska during the Alaska Layered Pollution and Chemical Analysis (ALPACA) campaign 2022, Arctic Data Center [data set], https://doi.org/10.18739/A2G44HS98, 2026.
Campbell, J. R., Battaglia, M., Dingilian, K., Cesler-Maloney, M., St Clair, J. M., Hanisco, T. F., Robinson, E., DeCarlo, P., Simpson, W., Nenes, A., Weber, R. J., and Mao, J.: Source and Chemistry of Hydroxymethanesulfonate (HMS) in Fairbanks, Alaska, Environ. Sci. Technol., acs.est.2c00410, https://doi.org/10.1021/acs.est.2c00410, 2022.
Campbell, J. R., Michael Battaglia Jr., Dingilian, K. K., Cesler-Maloney, M., Simpson, W. R., Robinson, E. S., DeCarlo, P. F., Temime-Roussel, B., D'Anna, B., Holen, A. L., Wu, J., Pratt, K. A., Dibb, J. E., Nenes, A., Weber, R. J., and Mao, J.: Enhanced aqueous formation and neutralization of fine atmospheric particles driven by extreme cold, Sci. Adv., 10, eado4373, https://doi.org/10.1126/sciadv.ado4373, 2024.
Canonaco, F., Crippa, M., Slowik, J. G., Baltensperger, U., and Prévôt, A. S. H.: SoFi, an IGOR-based interface for the efficient use of the generalized multilinear engine (ME-2) for the source apportionment: ME-2 application to aerosol mass spectrometer data, Atmos. Meas. Tech., 6, 3649–3661, https://doi.org/10.5194/amt-6-3649-2013, 2013.
Cao, Y., Zhao, H., Zhang, S., Wu, X., Anderson, J. E., Shen, W., Wallington, T. J., and Wu, Y.: Impacts of ethanol blended fuels and cold temperature on VOC emissions from gasoline vehicles in China, Environ. Pollut., 348, 123869, https://doi.org/10.1016/j.envpol.2024.123869, 2024.
Cappellin, L., Karl, T., Probst, M., Ismailova, O., Winkler, P. M., Soukoulis, C., Aprea, E., Märk, T. D., Gasperi, F., and Biasioli, F.: On Quantitative Determination of Volatile Organic Compound Concentrations Using Proton Transfer Reaction Time-of-Flight Mass Spectrometry, Environ. Sci. Technol., 46, 2283–2290, https://doi.org/10.1021/es203985t, 2012.
Cesler-Maloney, M., Simpson, W. R., Miles, T., Mao, J., Law, K. S., and Roberts, T. J.: Differences in Ozone and Particulate Matter Between Ground Level and 20 m Aloft are Frequent During Wintertime Surface-Based Temperature Inversions in Fairbanks, Alaska, J. Geophys. Res.-Atmos., 127, e2021JD036215, https://doi.org/10.1029/2021JD036215, 2022.
Cofer, W. R., Collins, V. G., and Talbot, R. W.: Improved aqueous scrubber for collection of soluble atmospheric trace gases, Environ. Sci. Technol., 19, 557–560, https://doi.org/10.1021/es00136a012, 1985.
Coggon, M. M., Lim, C. Y., Koss, A. R., Sekimoto, K., Yuan, B., Gilman, J. B., Hagan, D. H., Selimovic, V., Zarzana, K. J., Brown, S. S., Roberts, J. M., Müller, M., Yokelson, R., Wisthaler, A., Krechmer, J. E., Jimenez, J. L., Cappa, C., Kroll, J. H., de Gouw, J., and Warneke, C.: OH chemistry of non-methane organic gases (NMOGs) emitted from laboratory and ambient biomass burning smoke: evaluating the influence of furans and oxygenated aromatics on ozone and secondary NMOG formation, Atmos. Chem. Phys., 19, 14875–14899, https://doi.org/10.5194/acp-19-14875-2019, 2019.
Coggon, M. M., Stockwell, C. E., Claflin, M. S., Pfannerstill, E. Y., Xu, L., Gilman, J. B., Marcantonio, J., Cao, C., Bates, K., Gkatzelis, G. I., Lamplugh, A., Katz, E. F., Arata, C., Apel, E. C., Hornbrook, R. S., Piel, F., Majluf, F., Blake, D. R., Wisthaler, A., Canagaratna, M., Lerner, B. M., Goldstein, A. H., Mak, J. E., and Warneke, C.: Identifying and correcting interferences to PTR-ToF-MS measurements of isoprene and other urban volatile organic compounds, Atmos. Meas. Tech., 17, 801–825, https://doi.org/10.5194/amt-17-801-2024, 2024.
de Gouw, J. and Warneke, C.: Measurements of volatile organic compounds in the earth's atmosphere using proton-transfer-reaction mass spectrometry, Mass Spectrom. Rev., 26, 223–257, https://doi.org/10.1002/mas.20119, 2007.
Dingilian, K., Hebert, E., Battaglia, M. Jr., Campbell, J. R., Cesler-Maloney, M., Simpson, W., St. Clair, J. M., Dibb, J., Temime-Roussel, B., D'Anna, B., Moon, A., Alexander, B., Yang, Y., Nenes, A., Mao, J., and Weber, R. J.: Hydroxymethanesulfonate and Sulfur(IV) in Fairbanks Winter During the ALPACA Study, ACS EST Air, https://doi.org/10.1021/acsestair.4c00012, 2024a.
Dingilian, K., Hebert, E., Battaglia, M., Campbell, J., Cesler-Maloney, M., Simpson, W., St. Clair, J., Dibb, J., Temime-Roussel, B., D'Anna, B., Moon, A., Alexander, B., Yang, Y., Nenes, A., Mao, J., and Weber, R.: Hydroxymethanesulfonate and Sulfur (IV) in Fairbanks Winter During the Alaskan Layered Pollution and Chemical Analysis (ALPACA) Study, 2022, Arctic Data Center [data set], https://doi.org/10.18739/A2VD6P65Q, 2024b.
Duncianu, M., David, M., Kartigueyane, S., Cirtog, M., Doussin, J.-F., and Picquet-Varrault, B.: Measurement of alkyl and multifunctional organic nitrates by proton-transfer-reaction mass spectrometry, Atmos. Meas. Tech., 10, 1445–1463, https://doi.org/10.5194/amt-10-1445-2017, 2017.
Eliason, T. L., Aloisio, S., Donaldson, D. J., Cziczo, D. J., and Vaida, V.: Processing of unsaturated organic acid films and aerosols by ozone, Atmos. Environ., 37, 2207–2219, https://doi.org/10.1016/S1352-2310(03)00149-3, 2003.
Ellis, A. M. and Mayhew, C. A.: Proton Transfer Reaction Mass Spectrometry: Principles and Applications, John Wiley & Sons Ltd, ISBN 978-1-118-68357-6, 2014.
EPA: Fuel Trends Report: Gasoline 2006–2016, Office of Transportation and Air Quality, U.S. Environmental Protection Agency, https://nepis.epa.gov/Exe/ZyPDF.cgi?Dockey=P100T5J6.pdf (last access: 19 August 2026), 2017.
Ferrarese, C., Franzetti, J., Selleri, T., and Suarez-Bertoa, R.: VOC emissions from Euro 6 vehicles, Environ. Sci. Eur., 36, 27, https://doi.org/10.1186/s12302-024-00854-4, 2024.
George, I. J., Hays, M. D., Herrington, J. S., Preston, W., Snow, R., Faircloth, J., George, B. J., Long, T., and Baldauf, R. W.: Effects of Cold Temperature and Ethanol Content on VOC Emissions from Light-Duty Gasoline Vehicles, Environ. Sci. Technol., 49, 13067–13074, https://doi.org/10.1021/acs.est.5b04102, 2015.
Gkatzelis, G. I., Coggon, M. M., McDonald, B. C., Peischl, J., Gilman, J. B., Aikin, K. C., Robinson, M. A., Canonaco, F., Prevot, A. S. H., Trainer, M., and Warneke, C.: Observations Confirm that Volatile Chemical Products Are a Major Source of Petrochemical Emissions in U.S. Cities, Environ. Sci. Technol., 55, 4332–4343, https://doi.org/10.1021/acs.est.0c05471, 2021.
Grosjean, D., Swanson, R. D., and Ellis, C.: Carbonyls in Los Angeles air: Contribution of direct emissions and photochemistry, Sci. Total Environ., 29, 65–85, https://doi.org/10.1016/0048-9697(83)90034-7, 1983.
Gueneron, M., Erickson, M. H., VanderSchelden, G. S., and Jobson, B. T.: PTR-MS fragmentation patterns of gasoline hydrocarbons, Int. J. Mass Spectrom., 379, 97–109, https://doi.org/10.1016/j.ijms.2015.01.001, 2015.
Guenther, A., Hewitt, C. N., Erickson, D., Fall, R., Geron, C., Graedel, T., Harley, P., Klinger, L., Lerdau, M., Mckay, W. A., Pierce, T., Scholes, B., Steinbrecher, R., Tallamraju, R., Taylor, J., and Zimmerman, P.: A global model of natural volatile organic compound emissions, J. Geophys. Res.-Atmos., 100, 8873–8892, https://doi.org/10.1029/94JD02950, 1995.
Hansel, A. and Wisthaler, A.: A method for real-time detection of PAN, PPN and MPAN in ambient air, Geophys. Res. Lett., 27, 895–898, https://doi.org/10.1029/1999GL010989, 2000.
Hays, M. D., Preston, W., George, B. J., George, I. J., Snow, R., Faircloth, J., Long, T., Baldauf, R. W., and McDonald, J.: Temperature and Driving Cycle Significantly Affect Carbonaceous Gas and Particle Matter Emissions from Diesel Trucks, Energy Fuels, 31, 11034–11042, https://doi.org/10.1021/acs.energyfuels.7b01446, 2017.
Heald, C. L., Goldstein, A. H., Allan, J. D., Aiken, A. C., Apel, E., Atlas, E. L., Baker, A. K., Bates, T. S., Beyersdorf, A. J., Blake, D. R., Campos, T., Coe, H., Crounse, J. D., DeCarlo, P. F., de Gouw, J. A., Dunlea, E. J., Flocke, F. M., Fried, A., Goldan, P., Griffin, R. J., Herndon, S. C., Holloway, J. S., Holzinger, R., Jimenez, J. L., Junkermann, W., Kuster, W. C., Lewis, A. C., Meinardi, S., Millet, D. B., Onasch, T., Polidori, A., Quinn, P. K., Riemer, D. D., Roberts, J. M., Salcedo, D., Sive, B., Swanson, A. L., Talbot, R., Warneke, C., Weber, R. J., Weibring, P., Wennberg, P. O., Worsnop, D. R., Wittig, A. E., Zhang, R., Zheng, J., and Zheng, W.: Total observed organic carbon (TOOC) in the atmosphere: a synthesis of North American observations, Atmos. Chem. Phys., 8, 2007–2025, https://doi.org/10.5194/acp-8-2007-2008, 2008.
Heald, C. L., Gouw, J. de, Goldstein, A. H., Guenther, A. B., Hayes, P. L., Hu, W., Isaacman-VanWertz, G., Jimenez, J. L., Keutsch, F. N., Koss, A. R., Misztal, P. K., Rappenglück, B., Roberts, J. M., Stevens, P. S., Washenfelder, R. A., Warneke, C., and Young, C. J.: Contrasting Reactive Organic Carbon Observations in the Southeast United States (SOAS) and Southern California (CalNex), Environ. Sci. Technol., 54, 14923–14935, https://doi.org/10.1021/acs.est.0c05027, 2020.
Holen, A. L., Wu, J., Forshee, L., Dingilian, K. K., Selimovic, V., Battaglia, M. A., Robinson, E. S., Cysneiros De Carvalho, K., Ketcherside, D. T., Campbell, J. R., Moon, A., Alexander, B., Simpson, W. R., Mao, J., Hu, L., Williams, B. J., DeCarlo, P. F., Weber, R. J., and Pratt, K. A.: Quantifying Contributions of Sulfate, Hydroxymethanesulfonate, and Additional S(IV) Compounds to Wintertime Aerosol Particles, ACS EST Air, acsestair.5c00232, https://doi.org/10.1021/acsestair.5c00232, 2025.
Huang, W., Yu, X., Deng, H., Chen, B., Cheng, P., Yang, W., Li, M., Yuan, B., Wang, M., and Gong, Y.: Strong Seasonal Transition and Complex Sources of Volatile Organic Compounds at an Urban Site in Guangzhou, China, J. Geophys. Res.-Atmos., 129, e2024JD040890, https://doi.org/10.1029/2024JD040890, 2024.
Ijaz, A., Temime-Roussel, B., Kammer, J., Mao, J., Simpson, W., Law, K. S., and D'Anna, B.: In situ measurements of gas–particle partitioning of organic compounds in Fairbanks, Faraday Discuss., https://doi.org/10.1039/D4FD00175C, 2025a.
Ijaz, A., Temime-Roussel, B., Chazeau, B., Albertin, S., Arnold, S. R., Barret, B., Bekki, S., Brett, N., Cesler-Maloney, M., Dieudonne, E., Dingilian, K. K., Fochesatto, J. G., Mao, J., Moon, A., Savarino, J., Simpson, W., Weber, R. J., Law, K. S., and D'Anna, B.: Complementary aerosol mass spectrometry elucidates sources of wintertime submicron particle pollution in Fairbanks, Alaska, during ALPACA 2022, Atmos. Chem. Phys., 25, 11789–11811, https://doi.org/10.5194/acp-25-11789-2025, 2025b.
Ji, Z., Bao, Z., Chen, H., Zhang, P., Luo, D., Wu, H., Geng, L., Cao, J., and Yan, X.: Overview of the Generation Mechanism, Influence Factors, and Control Technologies of NH3 Emissions from Road Transport Vehicles, Environ. Sci. Technol., https://doi.org/10.1021/acs.est.5c11764, 2025.
Ketcherside, D., Yokelson, R. J., Selimovic, V., Robinson, E. S., Cesler-Maloney, M., Holen, A. L., Wu, J., Temime-Roussel, B., Ijaz, A., Kuhn, J., Moon, A., Pappaccogli, G., Carvalho, K. C. D., Decesari, S., Alexander, B., Williams, B. J., D'Anna, B., Stutz, J., Pratt, K. A., DeCarlo, P. F., Mao, J., Simpson, W. R., Hopke, P. K., and Hu, L.: Wintertime Abundance and Sources of Key Trace Gas and Particle Species in Fairbanks, Alaska, J. Geophys. Res.-Atmos., https://doi.org/10.1029/2025JD043677, 2025.
Kossover, R.: Association between Air Quality and Hospital Visits – Fairbanks, 2003–2008, https://dec.alaska.gov/media/7528/epibulletinfbxpm25hospital.pdf (last access: 5 September 2026), 2010.
Kotchenruther, R. A.: Source apportionment of PM 2.5 at multiple Northwest U.S. sites: Assessing regional winter wood smoke impacts from residential wood combustion, Atmos. Environ., 142, 210–219, https://doi.org/10.1016/j.atmosenv.2016.07.048, 2016.
Languille, B., Gros, V., Petit, J.-E., Honoré, C., Baudic, A., Perrussel, O., Foret, G., Michoud, V., Truong, F., Bonnaire, N., Sarda-Estève, R., Delmotte, M., Feron, A., Maisonneuve, F., Gaimoz, C., Formenti, P., Kotthaus, S., Haeffelin, M., and Favez, O.: Wood burning: A major source of Volatile Organic Compounds during wintertime in the Paris region, Sci. Total Environ., 711, 135055, https://doi.org/10.1016/j.scitotenv.2019.135055, 2020.
Lannuque, V., D'Anna, B., Kostenidou, E., Couvidat, F., Martinez-Valiente, A., Eichler, P., Wisthaler, A., Müller, M., Temime-Roussel, B., Valorso, R., and Sartelet, K.: Gas–particle partitioning of toluene oxidation products: an experimental and modeling study, Atmos. Chem. Phys., 23, 15537–15560, https://doi.org/10.5194/acp-23-15537-2023, 2023.
Legreid, G., Lööv, J. B., Staehelin, J., Hueglin, C., Hill, M., Buchmann, B., Prevot, A. S. H., and Reimann, S.: Oxygenated volatile organic compounds (OVOCs) at an urban background site in Zürich (Europe): Seasonal variation and source allocation, Atmos. Environ., 41, 8409–8423, https://doi.org/10.1016/j.atmosenv.2007.07.026, 2007.
Li, J., Xie, S. D., Zeng, L. M., Li, L. Y., Li, Y. Q., and Wu, R. R.: Characterization of ambient volatile organic compounds and their sources in Beijing, before, during, and after Asia-Pacific Economic Cooperation China 2014, Atmos. Chem. Phys., 15, 7945–7959, https://doi.org/10.5194/acp-15-7945-2015, 2015.
Li, K., Li, J., Tong, S., Wang, W., Huang, R.-J., and Ge, M.: Characteristics of wintertime VOCs in suburban and urban Beijing: concentrations, emission ratios, and festival effects, Atmos. Chem. Phys., 19, 8021–8036, https://doi.org/10.5194/acp-19-8021-2019, 2019.
Li, S., Liu, D., Wu, Y., Hu, K., Jiang, X., Tian, P., Sheng, J., Pan, B., and Zhao, D.: Aging effects on residential biomass burning emissions under quasi-real atmospheric conditions, Environ. Pollut., 337, 122615, https://doi.org/10.1016/j.envpol.2023.122615, 2023.
Liu, X., Wang, Y., Zhu, R., Wei, Y., and Hu, J.: Complex temperature dependence of vehicular emissions: Evidence from a global meta-analysis, Environ. Res., 237, 116890, https://doi.org/10.1016/j.envres.2023.116890, 2023.
Marques, B., Kostenidou, E., Valiente, A. M., Vansevenant, B., Sarica, T., Fine, L., Temime-Roussel, B., Tassel, P., Perret, P., Liu, Y., Sartelet, K., Ferronato, C., and D'Anna, B.: Detailed Speciation of Non-Methane Volatile Organic Compounds in Exhaust Emissions from Diesel and Gasoline Euro 5 Vehicles Using Online and Offline Measurements, Toxics, 10, 184, https://doi.org/10.3390/toxics10040184, 2022.
McDonald, B. C., De Gouw, J. A., Gilman, J. B., Jathar, S. H., Akherati, A., Cappa, C. D., Jimenez, J. L., Lee-Taylor, J., Hayes, P. L., McKeen, S. A., Cui, Y. Y., Kim, S.-W., Gentner, D. R., Isaacman-VanWertz, G., Goldstein, A. H., Harley, R. A., Frost, G. J., Roberts, J. M., Ryerson, T. B., and Trainer, M.: Volatile chemical products emerging as largest petrochemical source of urban organic emissions, Science, 359, 760–764, https://doi.org/10.1126/science.aaq0524, 2018.
Mehra, A., Wang, Y., Krechmer, J. E., Lambe, A., Majluf, F., Morris, M. A., Priestley, M., Bannan, T. J., Bryant, D. J., Pereira, K. L., Hamilton, J. F., Rickard, A. R., Newland, M. J., Stark, H., Croteau, P., Jayne, J. T., Worsnop, D. R., Canagaratna, M. R., Wang, L., and Coe, H.: Evaluation of the chemical composition of gas- and particle-phase products of aromatic oxidation, Atmos. Chem. Phys., 20, 9783–9803, https://doi.org/10.5194/acp-20-9783-2020, 2020.
Millet, D. B., Donahue, N. M., Pandis, S. N., Polidori, A., Stanier, C. O., Turpin, B. J., and Goldstein, A. H.: Atmospheric volatile organic compound measurements during the Pittsburgh Air Quality Study: Results, interpretation, and quantification of primary and secondary contributions, J. Geophys. Res.-Atmos., 110, https://doi.org/10.1029/2004JD004601, 2005.
Moon, A., Jongebloed, U., Dingilian, K. K., Schauer, A. J., Chan, Y.-C., Cesler-Maloney, M., Simpson, W. R., Weber, R. J., Tsiang, L., Yazbeck, F., Zhai, S., Wedum, A., Turner, A. J., Albertin, S., Bekki, S., Savarino, J., Gribanov, K., Pratt, K. A., Costa, E. J., Anastasio, C., Sunday, M. O., Heinlein, L. M. D., Mao, J., and Alexander, B.: Primary Sulfate Is the Dominant Source of Particulate Sulfate during Winter in Fairbanks, Alaska, ACS EST Air, https://doi.org/10.1021/acsestair.3c00023, 2023.
Nattinger, K. C.: Temporal And Spatial Trends Of Fine Particulate Matter Composition In Fairbanks, Alaska, https://scholarworks.alaska.edu/cgi/viewcontent.cgi?article=1065&context=uaf_grad_chem_biochem (last access: 5 September 2026), 2016.
Norris, G., Duvall, R., Brown, S., and Bai, S.: Positive Matrix Factorization (PMF) 5.0 Fundamentals and User Guide, https://www.epa.gov/sites/default/files/2015-02/documents/pmf_5.0_user_guide.pdf (last access: 5 September 2026), 2014.
Nuvolone, D., Petri, D., and Voller, F.: The effects of ozone on human health, Environ. Sci. Pollut. Res., 25, 8074–8088, https://doi.org/10.1007/s11356-017-9239-3, 2018.
Orsini, D. A., Ma, Y., Sullivan, A., Sierau, B., Baumann, K., and Weber, R. J.: Refinements to the particle-into-liquid sampler (PILS) for ground and airborne measurements of water soluble aerosol composition, Atmos. Environ., 37, 1243–1259, https://doi.org/10.1016/S1352-2310(02)01015-4, 2003.
Paatero, P.: The Multilinear Engine: A Table-Driven, Least Squares Program for Solving Multilinear Problems, including the n-Way Parallel Factor Analysis Model, J. Comput. Graph. Stat., 8, 854–888, https://doi.org/10.2307/1390831, 1999.
Paatero, P. and Hopke, P. K.: Discarding or downweighting high-noise variables in factor analytic models, Anal. Chim. Acta, 490, 277–289, https://doi.org/10.1016/S0003-2670(02)01643-4, 2003.
Pagonis, D., Sekimoto, K., and de Gouw, J.: A Library of Proton-Transfer Reactions of H3O+ Ions Used for Trace Gas Detection, J. Am. Soc. Mass Spectrom., 30, 1330–1335, https://doi.org/10.1007/s13361-019-02209-3, 2019.
Patokoski, J., Ruuskanen, T. M., Hellén, H., Taipale, R., Grönholm, T., Kajos, M. K., Petäjä, T., Hakola, H., Kulmala, M., and Rinne, J.: Winter to spring transition and diurnal variation of VOCs in Finland at an urban background site and a rural site, Boreal Environ. Res., 19, http://hdl.handle.net/10138/165174, 2014.
Paulot, F., Wunch, D., Crounse, J. D., Toon, G. C., Millet, D. B., DeCarlo, P. F., Vigouroux, C., Deutscher, N. M., González Abad, G., Notholt, J., Warneke, T., Hannigan, J. W., Warneke, C., de Gouw, J. A., Dunlea, E. J., De Mazière, M., Griffith, D. W. T., Bernath, P., Jimenez, J. L., and Wennberg, P. O.: Importance of secondary sources in the atmospheric budgets of formic and acetic acids, Atmos. Chem. Phys., 11, 1989–2013, https://doi.org/10.5194/acp-11-1989-2011, 2011.
Pope III, C. A. and Dockery, D. W.: Health Effects of Fine Particulate Air Pollution: Lines that Connect, J. Air Waste Manage., 56, 709–742, https://doi.org/10.1080/10473289.2006.10464485, 2006.
Rao, Z., Chen, Z., Liang, H., Huang, L., and Huang, D.: Carbonyl compounds over urban Beijing: Concentrations on haze and non-haze days and effects on radical chemistry, Atmos. Environ., 124, 207–216, https://doi.org/10.1016/j.atmosenv.2015.06.050, 2016.
Rivellini, L.-H., Jorga, S., Wang, Y., Lee, A. K. Y., Murphy, J. G., Chan, A. W., and Abbatt, J. P. D.: Sources of Wintertime Atmospheric Organic Pollutants in a Large Canadian City: Insights from Particle and Gas Phase Measurements, ACS EST Air, 1, 690–703, https://doi.org/10.1021/acsestair.4c00039, 2024.
Sadeghi, B., Pouyaei, A., Choi, Y., and Rappenglueck, B.: Influence of seasonal variability on source characteristics of VOCs at Houston industrial area, Atmos. Environ., 277, 119077, https://doi.org/10.1016/j.atmosenv.2022.119077, 2022.
Schwartz, J., Laden, F., and Zanobetti, A.: The concentration-response relation between PM(2.5) and daily deaths, Environ. Health Perspect., 110, 1025–1029, https://doi.org/10.1289/ehp.021101025, 2002.
Seinfeld, J. H. and Pandis, S. N.: Atmospheric Chemistry and Physics: From Air Pollution to Climate Change, John Wiley & Sons, Hoboken, ISBN 978-1-118-94740-1, 2016.
Sekimoto, K., Li, S.-M., Yuan, B., Koss, A., Coggon, M., Warneke, C., and De Gouw, J.: Calculation of the sensitivity of proton-transfer-reaction mass spectrometry (PTR-MS) for organic trace gases using molecular properties, Int. J. Mass Spectrom., 421, 71–94, https://doi.org/10.1016/j.ijms.2017.04.006, 2017.
Sharma, N., Agarwal, A. K., Eastwood, P., Gupta, T., and Singh, A. P. (Eds.): Air Pollution and Control, Springer Singapore, Singapore, https://doi.org/10.1007/978-981-10-7185-0, 2018.
Simpson, W., Cesler-Maloney, M., and Hoskins-Chaddon, R.: Gas and meteorological measurements at the CTC site and Birch Hill in Fairbanks, Alaska, during the ALPACA-2022 field study, Arctic Data Center [data set], https://doi.org/10.18739/A27D2Q87W, 2023.
Simpson, W. R., Mao, J., Fochesatto, G. J., Law, K. S., DeCarlo, P. F., Schmale, J., Pratt, K. A., Arnold, S. R., Stutz, J., Dibb, J. E., Creamean, J. M., Weber, R. J., Williams, B. J., Alexander, B., Hu, L., Yokelson, R. J., Shiraiwa, M., Decesari, S., Anastasio, C., D'Anna, B., Gilliam, R. C., Nenes, A., St. Clair, J. M., Trost, B., Flynn, J. H., Savarino, J., Conner, L. D., Kettle, N., Heeringa, K. M., Albertin, S., Baccarini, A., Barret, B., Battaglia, M. A., Bekki, S., Brado, T. J., Brett, N., Brus, D., Campbell, J. R., Cesler-Maloney, M., Cooperdock, S., Cysneiros de Carvalho, K., Delbarre, H., DeMott, P. J., Dennehy, C. J. S., Dieudonné, E., Dingilian, K. K., Donateo, A., Doulgeris, K. M., Edwards, K. C., Fahey, K., Fang, T., Guo, F., Heinlein, L. M. D., Holen, A. L., Huff, D., Ijaz, A., Johnson, S., Kapur, S., Ketcherside, D. T., Levin, E., Lill, E., Moon, A. R., Onishi, T., Pappaccogli, G., Perkins, R., Pohorsky, R., Raut, J.-C., Ravetta, F., Roberts, T., Robinson, E. S., Scoto, F., Selimovic, V., Sunday, M. O., Temime-Roussel, B., Tian, X., Wu, J., and Yang, Y.: Overview of the Alaskan Layered Pollution and Chemical Analysis (ALPACA) Field Experiment, ACS EST Air, 1, 200–222, https://doi.org/10.1021/acsestair.3c00076, 2024.
Slowik, J. G., Vlasenko, A., McGuire, M., Evans, G. J., and Abbatt, J. P. D.: Simultaneous factor analysis of organic particle and gas mass spectra: AMS and PTR-MS measurements at an urban site, Atmos. Chem. Phys., 10, 1969–1988, https://doi.org/10.5194/acp-10-1969-2010, 2010.
Song, S., Gao, M., Xu, W., Sun, Y., Worsnop, D. R., Jayne, J. T., Zhang, Y., Zhu, L., Li, M., Zhou, Z., Cheng, C., Lv, Y., Wang, Y., Peng, W., Xu, X., Lin, N., Wang, Y., Wang, S., Munger, J. W., Jacob, D. J., and McElroy, M. B.: Possible heterogeneous chemistry of hydroxymethanesulfonate (HMS) in northern China winter haze, Atmos. Chem. Phys., 19, 1357–1371, https://doi.org/10.5194/acp-19-1357-2019, 2019.
St. Clair, J. M., Swanson, A. K., Bailey, S. A., Wolfe, G. M., Marrero, J. E., Iraci, L. T., Hagopian, J. G., and Hanisco, T. F.: A new non-resonant laser-induced fluorescence instrument for the airborne in situ measurement of formaldehyde, Atmos. Meas. Tech., 10, 4833–4844, https://doi.org/10.5194/amt-10-4833-2017, 2017.
Suarez-Bertoa, R., Selleri, T., Gioria, R., Melas, A. D., Ferrarese, C., Franzetti, J., Arlitt, B., Nagura, N., Hanada, T., and Giechaskiel, B.: Real-Time Measurements of Formaldehyde Emissions from Modern Vehicles, Energies, 15, 7680, https://doi.org/10.3390/en15207680, 2022.
Vlasenko, A., Macdonald, A. M., Sjostedt, S. J., and Abbatt, J. P. D.: Formaldehyde measurements by Proton transfer reaction – Mass Spectrometry (PTR-MS): correction for humidity effects, Atmos. Meas. Tech., 3, 1055–1062, https://doi.org/10.5194/amt-3-1055-2010, 2010.
Wærsted, E. G., Sundvor, I., Denby, B. R., and Mu, Q.: Quantification of temperature dependence of NO emissions from road traffic in Norway using air quality modelling and monitoring data, Atmos. Environ. X, 13, 100160, https://doi.org/10.1016/j.aeaoa.2022.100160, 2022.
Wang, L., Slowik, J. G., Tripathi, N., Bhattu, D., Rai, P., Kumar, V., Vats, P., Satish, R., Baltensperger, U., Ganguly, D., Rastogi, N., Sahu, L. K., Tripathi, S. N., and Prévôt, A. S. H.: Source characterization of volatile organic compounds measured by proton-transfer-reaction time-of-flight mass spectrometers in Delhi, India, Atmos. Chem. Phys., 20, 9753–9770, https://doi.org/10.5194/acp-20-9753-2020, 2020.
Wang, L., Slowik, J. G., Tong, Y., Duan, J., Gu, Y., Rai, P., Qi, L., Stefenelli, G., Baltensperger, U., Huang, R.-J., Cao, J., and Prévôt, A. S. H.: Characteristics of wintertime VOCs in urban Beijing: Composition and source apportionment, Atmos. Environ. X, 9, 100100, https://doi.org/10.1016/j.aeaoa.2020.100100, 2021.
Wang, L., Slowik, J. G., Klein, F., Stefenelli, G., Pospisilova, V., Tong, Y., Baltensperger, U., and Prévôt, A. S. H.: Characteristics of oxygenated volatile organic compounds in Zurich, Switzerland: Sources, composition, and implication for secondary aerosol formation, Chemosphere, 368, 143686, https://doi.org/10.1016/j.chemosphere.2024.143686, 2024.
Wang, S., Yuan, B., Wu, C., Wang, C., Li, T., He, X., Huangfu, Y., Qi, J., Li, X.-B., Sha, Q., Zhu, M., Lou, S., Wang, H., Karl, T., Graus, M., Yuan, Z., and Shao, M.: Oxygenated volatile organic compounds (VOCs) as significant but varied contributors to VOC emissions from vehicles, Atmos. Chem. Phys., 22, 9703–9720, https://doi.org/10.5194/acp-22-9703-2022, 2022.
Ward, T., Trost, B., Conner, J., Flanagan, J., and Jayanty, R. K. M.: Source Apportionment of PM2.5 in a Subarctic Airshed – Fairbanks, Alaska, Aerosol Air Qual. Res., 12, 536–543, https://doi.org/10.4209/aaqr.2011.11.0208, 2012.
Yano, Y., Morris, S. S., Salerno, C., Schlapia, A. M., and Stichick, M.: Impact of a new gasoline benzene regulation on ambient air pollutants in Anchorage, Alaska, Atmos. Environ., 132, 276–282, https://doi.org/10.1016/j.atmosenv.2016.02.039, 2016.
Zhang, W., Brett, N., Law, K. S., Temime-Roussel, B., D'Anna, B., Onishi, T., Raut, J.-C., Bekki, S., Barret, B., Arnold, S. R., Savarino, J., Yokelson, R. J., Hu, L., Huff, D., Mao, J., Campbell, J., Pappaccogli, G., Pohorsky, R., Schmale, J., and Simpson, W. R.: Exploring factors influencing sources and distributions of aromatics in an Arctic winter urban environment, ES&T Air, in press, 2026.
Zhao, J. and Zhang, R.: Proton transfer reaction rate constants between hydronium ion (H3O+) and volatile organic compounds, Atmos. Environ., 38, 2177–2185, https://doi.org/10.1016/j.atmosenv.2004.01.019, 2004.
Zhou, L., Xiong, Y., Sera, F., Vicedo-Cabrera, A. M., Abrutzky, R., Guo, Y., Tong, S., Coelho, M. de S. Z. S., Saldiva, P. H. N., Lavigne, E., Correa, P. M., Ortega, N. V., Osorio, S., Roye, D., Kyselý, J., Orru, H., Maasikmets, M., Jaakkola, J. J. K., Ryti, N., Pascal, M., Huber, V., Breitner-Busch, S., Schneider, A., Katsouyanni, K., Samoli, E., Entezari, A., Mayvaneh, F., Goodman, P., Zeka, A., Raz, R., Scortichini, M., Stafoggia, M., Honda, Y., Hashizume, M., Ng, C. F. S., Alahmad, B., Diaz, M. H., Arellano, E. E. F., Overcenco, A., Klompmaker, J., Rao, S., Carrasco, G., Seposo, X., Chua, P. L. C., Silva, S. das N. P. da, Madureira, J., Holobaca, I.-H., Scovronick, N., Garland, R. M., Kim, H., Lee, W., Tobias, A., Íñiguez, C., Forsberg, B., Ragettli, M. S., Guo, Y. L., Pan, S.-C., Li, S., Masselot, P., Colistro, V., Bell, M., Zanobetti, A., Schwartz, J., Dang, T. N., Dung, D. V., Gasparrini, A., Huang, Y., and Kan, H.: Associations of ambient exposure to benzene, toluene, ethylbenzene, and xylene with daily mortality: a multicountry time-series study in 757 global locations, The Lancet Planetary Health, 9, https://doi.org/10.1016/j.lanplh.2025.101306, 2025.
Ziemann, P. J. and Atkinson, R.: Kinetics, products, and mechanisms of secondary organic aerosol formation, Chem. Soc. Rev., 41, 6582, https://doi.org/10.1039/c2cs35122f, 2012.