
the Creative Commons Attribution 4.0 License.
the Creative Commons Attribution 4.0 License.
 | 28 Oct 2026
Relative roles of aerosol size and hygroscopicity in modulating marine liquid-phase cloud responses under the winter monsoon
Jianqi Zhao

Hailing Jia
Tong Yang
Peili Zou
Yingying Ku
How aerosol physicochemical properties affect aerosol-cloud interactions (ACI) and when these impacts are most pronounced represent an important source of ACI uncertainty. Targeting a representative liquid-phase cloud case over the Eastern China Ocean (ECO) under the winter monsoon featuring abundant meteorological, aerosol, and cloud variations, this study investigates the impacts of changes in aerosol size (volume-mean radius increased by 1.2 times and decreased by 45 %) and hygroscopicity (volume-mean hygroscopicity increased by 2.2 times and decreased by 62 %) using a spectral-bin cloud model. Results indicate that increased aerosol size and hygroscopicity generally enhance cloud development, raising the averaged cloud droplet number concentration (Nd) by 92 % and 53 %, respectively. These impacts peak under moderate aerosol concentrations (Na) and cold advection, where Nd increases up to 10-fold. Concurrently, increased aerosol size raises cloud water by 1.3 times and extends cloud lifetime by 85 %, whereas increased hygroscopicity has a much weaker effect. By contrast, decreased aerosol size and hygroscopicity generally suppress cloud development, reducing the averaged Nd by 49 % and 43 %, respectively. The former has a relatively strong impact, which is most notable in moderate-to-high Na environments under cold advection, reducing Nd and cloud water by over 80 % and 50 %, respectively. While changes in aerosol size generally exert a stronger overall impact than changes in hygroscopicity, specific conditions reveal the opposite. Notably, the enhancement of Nd by increased hygroscopicity under high Na, and the preservation of cloud and rainwater through evaporation suppression by decreased hygroscopicity, both surpass the effects caused by corresponding aerosol size changes.
- Article
(23086 KB) - Full-text XML
-
Supplement
(3785 KB) - BibTeX
- EndNote


Aerosols affect cloud formation and development by acting as cloud condensation nuclei (CCN) and ice nuclei (IN), which is referred to as aerosol-cloud interactions (ACI; Zhao et al., 2023, 2025a). These interactions are governed by multiple factors and complex mechanisms, making them a key challenge in climate prediction and policy-making (Anwar et al., 2022; Ma et al., 2018). Since the Intergovernmental Panel on Climate Change (IPCC) Fifth Assessment Report identified ACI as the dominant contributor to both aerosol radiative forcing and its uncertainty (IPCC, 2014), researchers have devoted tremendous effort and gained extensive knowledge of ACI over the past decade, but the associated uncertainty has not been significantly reduced (Jackson and Forster, 2021; Jia et al., 2021; Patel and Jiang, 2021; Zhao et al., 2023, 2025a).
Deepening the understanding of the ability of aerosols to act as CCN and the cloud responses to CCN is essential for reducing the ACI uncertainty (Schulze et al., 2020; Seinfeld et al., 2016). These are mainly affected by aerosol properties (Dusek et al., 2006; Liang et al., 2026; Schulze et al., 2020; Zhao et al., 2025c) and meteorological conditions (Geresdi et al., 2006; Li et al., 2025; Niu et al., 2026; Reutter et al., 2009; Zhang et al., 2012). Particle size distribution and chemical composition are two key aerosol properties that control CCN activity. As described by the Köhler theory, increases in aerosol size and hygroscopicity (mainly determined by chemical composition) can reduce the supersaturation threshold required for activation through the curvature and solute effects, respectively, thereby enhancing CCN activity (Hernández Pardo et al., 2019; Khain et al., 2000). Particle size distribution is generally considered to exert a stronger influence than chemical composition. For example, the observational studies by Dusek et al. (2006) indicated that, when temporal variations in chemical effects on CCN activation are neglected, variations in particle size distribution alone can explain 84 % to 96 % of the variation in CCN concentration. The observational study by Patel and Jiang (2021) over the Southern Great Plains of the United States also demonstrates that particle size is the most critical factor affecting CCN activity, while chemical composition plays a secondary role. In addition, modeling studies indicate that the influence of hygroscopicity diminishes with increasing aerosol particle size (Ward et al., 2010).
By modulating CCN activity, aerosols with different sizes have different effects on cloud properties, which is further governed by environmental backgrounds. Satellite retrievals of marine warm clouds show that at a fixed cloud liquid water path (CLWP), an increase in small particles reduces precipitation and cloud droplet effective radius (CER) by 25 % and 40 %, respectively, whereas an increase in large particles enhances them by 400 % and 35 %, respectively (Liu et al., 2022). In this situation, the enhancement of precipitation caused by an increase in large particles leads to cloud disruption (Hoffmann and Feingold, 2021; Liu et al., 2022; McCoy et al., 2024), and the rapid consumption of supersaturated water near the cloud base by large particles at the beginning of the cloud cycle also suppresses cloud development (Ekman et al., 2011). However, Hernández Pardo et al. (2019) found an opposite response of CER to large particles, namely that an increase in large particles increases cloud droplet number concentration (Nd), intensifies competition for water vapor, and reduces CER. The study also suggested that the cloud susceptibility to large particles depends strongly on atmospheric pollution and meteorological conditions. Similarly, the response of clouds to small particles varies under different environments. The increase in the number of small particles typically reduces Nd and strengthens entrainment and cloud water evaporation, leading to a decrease in CLWP and cloud lifetime (Hoffmann and Feingold, 2021). However, in some cases, such as in the pristine Arctic region where supersaturation frequently exceeds 0.5 %, small aerosol particles effectively maintain cloud existence (Bulatovic et al., 2021). In mid-latitude boundary layer clouds, small particles can also buffer precipitation-driven cloud break-up by replenishing CCN and cloud droplets, thereby prolonging cloud lifetime (McCoy et al., 2024).
Although aerosol chemical composition has been reported to have an overall relatively minor effect compared to size distribution (Dusek et al., 2006; Reutter et al., 2009; Ward et al., 2010), in certain environments, it still plays a role in ACI. In-situ measurements of Zhang et al. (2012) showed that at 0.1 % supersaturation, CCN activity is highly sensitive to changes in aerosol composition, and when the organic mass fraction decreases from 30 %–40 % to 10 %–20 %, CCN activity increases by approximately 184 %. Quinn et al. (2008) found that at 0.44 % supersaturation, composition changes represented by hydrocarbon-like organic aerosols can explain 40 % of the variation in critical activation diameter. Similarly, Patel and Jiang (2021) highlighted the importance of aerosol chemical composition at low supersaturation and showed that its influence diminishes markedly at high supersaturation.
While previous studies have provided a broad understanding of the effects of aerosol properties, a systematic and quantitative understanding is still lacking. Specifically, the comprehensiveness and accuracy of our understanding regarding cloud responses to aerosol properties can be further enhanced by exploring how the mechanisms and magnitudes of these impacts vary with meteorological, aerosol, and cloud conditions, as well as by quantitatively evaluating the relative contributions of aerosol particle size and chemical composition. Due to the difficulty in accurately isolating the net effects of individual aerosol properties and the high costs associated with data acquisition, achieving this goal through purely observational approaches is highly challenging. Therefore, a more feasible approach is to utilize limited observational data to validate model simulations and subsequently conduct analyses based on the simulations. In terms of simulations, global circulation models and regional models based on bulk cloud microphysical parameterizations exhibit limitations in simulating ACI due to (1) coarse resolution, (2) simplified treatment of CCN budgets, (3) reduced cloud susceptibility to aerosols caused by the use of the saturation adjustment approach, and (4) simplified treatment of the conversion from cloud water to rainwater and hydrometeor fall velocities (Fan et al., 2012, 2015, 2016; Khain et al., 2015; Zhang et al., 2021). Therefore, this study employs high-resolution simulations with the online-chemistry version of the Weather Research and Forecasting model coupled with the spectral-bin microphysics scheme (WRF-Chem-SBM), which couples a sectional aerosol module with the spectral-bin cloud microphysics (SBM) scheme, to revisit the effects of aerosol size and chemical composition on ACI. Although computationally expensive, it can meaningfully reproduce the ambient environment of clouds, represent aerosol–cloud physical and chemical processes in detail, and effectively track variations in the microphysical and chemical properties of aerosols and clouds (Gao et al., 2016). In this study we focus on liquid-phase clouds, which are spatially extensive, optically thick, and relatively long-lived, and exhibit pronounced susceptibility to aerosol perturbations, thereby contributing substantially to cloud radiative forcing (Andersen et al., 2017; Chen et al., 2011; Jia et al., 2019). Spatially and temporally, the Eastern China Ocean (ECO) region during winter is selected as the study domain and period since transport from East China (EC) under the winter monsoon provides the region with abundant aerosols (Zhao et al., 2025b). Furthermore, stable and widespread low clouds, which are highly favorable for ACI analysis, reach their maximum occurrence frequency over the ECO during this season (Niu et al., 2022).
The structure of this paper is as follows: Chapter 2 introduces the model and experimental design used in this study, Chapter 3 presents the evaluation and discussion of the simulation results, and Chapter 4 provides a summary of the study.
2.1 Model description
In this study, we employ the WRF-Chem-SBM model for ACI modeling, in which the aerosol-cloud module is built upon the coupling of the Model for Simulating Aerosol Interactions and Chemistry (MOSAIC, four-bin version) with the SBM scheme (Gao et al., 2016). The model enables online tracking of size distributions and mass variations of major aerosol species (sulfate, nitrate, chloride, ammonium, sodium, black carbon, primary organics, and other inorganics) and hydrometeors (droplets, ice/snow, and graupel), as well as detailed representation of aerosol-cloud physical and chemical processes (Khain et al., 2004; Sha et al., 2022; Zaveri et al., 2008).
In the model, the four-bin aerosols processed by the MOSAIC aerosol physicochemical parameterizations are remapped into 33 CCN bins of the SBM scheme according to aerosol physical and chemical properties, and then undergo aerosol activation, resuspension, and in-cloud scavenging parameterizations within SBM. Aerosol activation is parameterized based on Köhler theory, which calculates the critical supersaturation (Scrit) at the boundary size of each CCN bin. If the predicted supersaturation falls between the Scrit at the lower and upper boundaries of a specific size bin, then the CCN in that bin are activated proportionally. Meanwhile, CCN in all larger bins are fully activated, and those in all smaller bins remain unactivated (Gao et al., 2016). The parameterization of Scrit follows the κ framework of Petters and Kreidenweis (2007), where the surface tension is treated as a constant, and the aerosol composition is averaged within each of the four MOSAIC bins prior to activation (McFiggans et al., 2006; Ovadnevaite et al., 2017; Xu et al., 2026).
In order to investigate the effects of aerosol size and chemical composition on ACI under varying meteorological conditions, we conducted sensitivity experiments using the coupled model mentioned above. For aerosol size, the focus is placed on the remapping of aerosols from MOSAIC to CCN in SBM. In this process, each MOSAIC aerosol bin is assumed to follow a normal distribution and is remapped into 33 CCN bins defined by different Scrit thresholds, based on its geometric mean dry radius (rdg) and volume-weighted hygroscopicity (hv). The rdg is calculated from the volume-mean radius (rv) and the geometric standard deviation (σg; given the log-normal distribution framework of this module, since the total aerosol number and dry volume of a size bin constrain two of the three distribution parameters, σg is set to 1.492; Gao et al., 2016). By increasing or decreasing rv, the CCN size distribution is shifted toward larger or smaller sizes. This approach minimizes modifications to the original coupled system and avoids potential computational errors when simulating aerosol size variations. For aerosol composition, hv in the MOSAIC-SBM interface module is adjusted. This adjustment directly affects only the remapping of MOSAIC aerosols into SBM CCN bins and aerosol activation, while the hygroscopicity parameters in other modules remain unchanged. This approach reduces interference from non-ACI processes and reasonably represents the impacts of changes in aerosol composition on ACI.
2.2 Experimental design
Constrained by the high computational expense of WRF-Chem-SBM, we selected the liquid-phase cloud case over the ECO region from 1 to 5 February 2019 for simulation. As shown in Fig. 1, under the winter monsoon background, the ECO region received massive continental aerosol transport from EC. During this period, temperature advection (ADV, calculated as , where u and v are the zonal and meridional wind components, and and are the corresponding temperature gradients over the ECO region underwent a transition from warm to cold, accompanied correspondingly by significant changes in vertical velocity, supersaturation, aerosols, clouds, and precipitation (Fig. 2). By encompassing such abundant meteorological, aerosol, and cloud variations, this representative case ensures a highly comprehensive analysis of ACI responses to aerosol physicochemical properties.
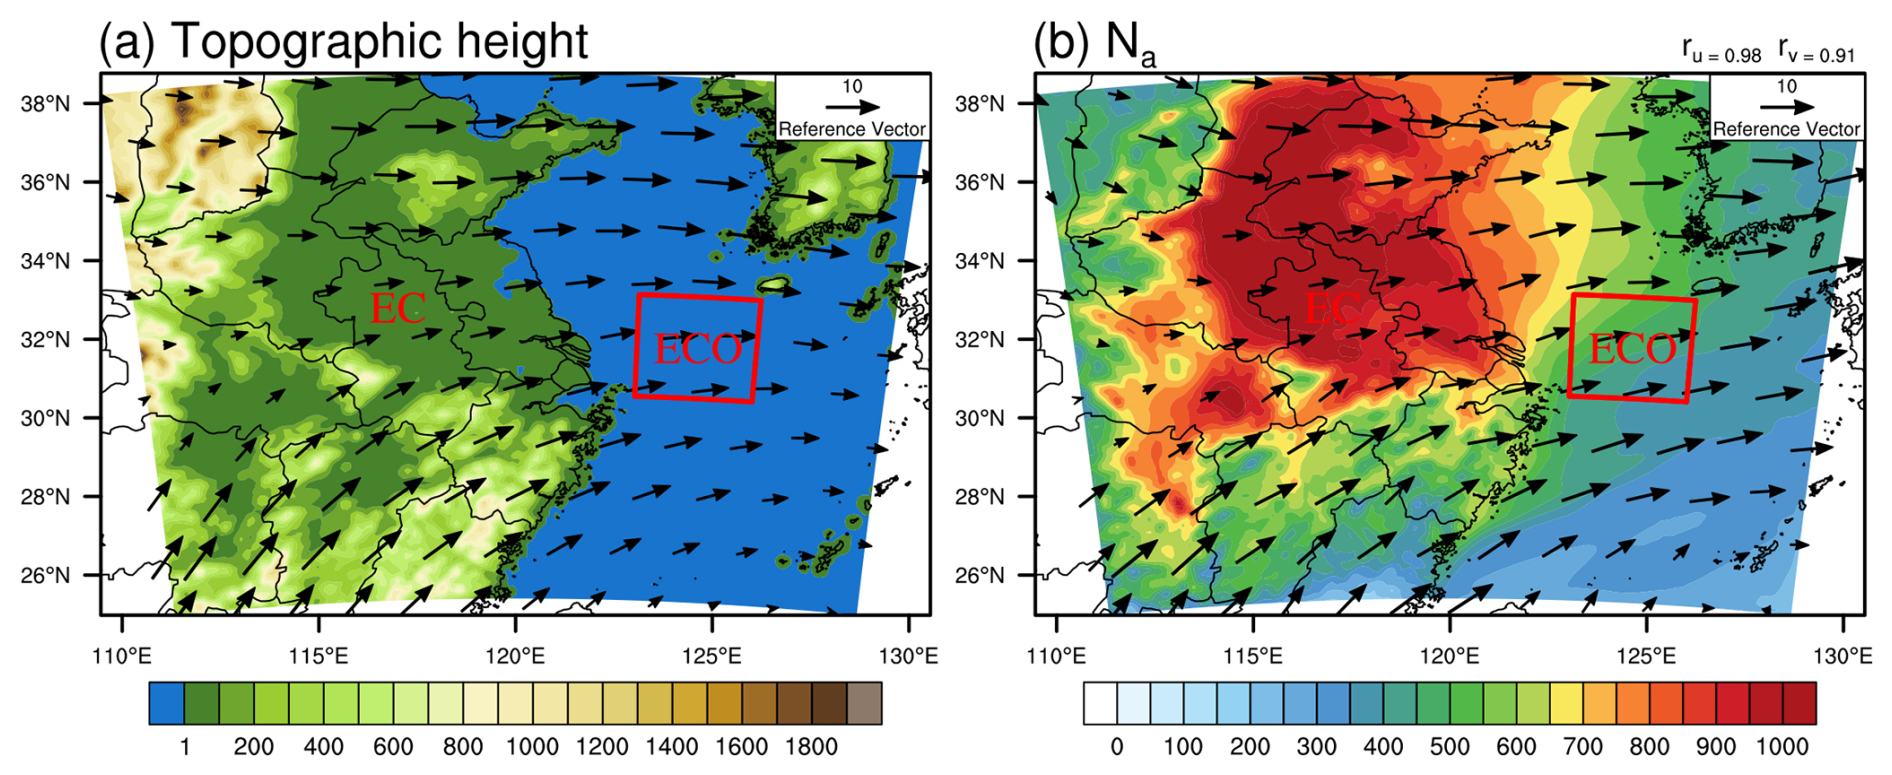
Figure 1Topographic map of the outer domain (a, in m) and the distribution of column-mean Na of the Control experiment (b, in cm−3) during the simulation period. The locations of EC and ECO are highlighted in red text, with the ECO extent (i.e., the inner domain) indicated by a red box. The time-averaged wind fields in (a) and (b) are derived from MICAPS data and the Control simulation, respectively. The values ru and rv in the upper-right corner of (b) denote the Pearson product-moment correlation coefficients for the u and v wind components between MICAPS and the simulation.
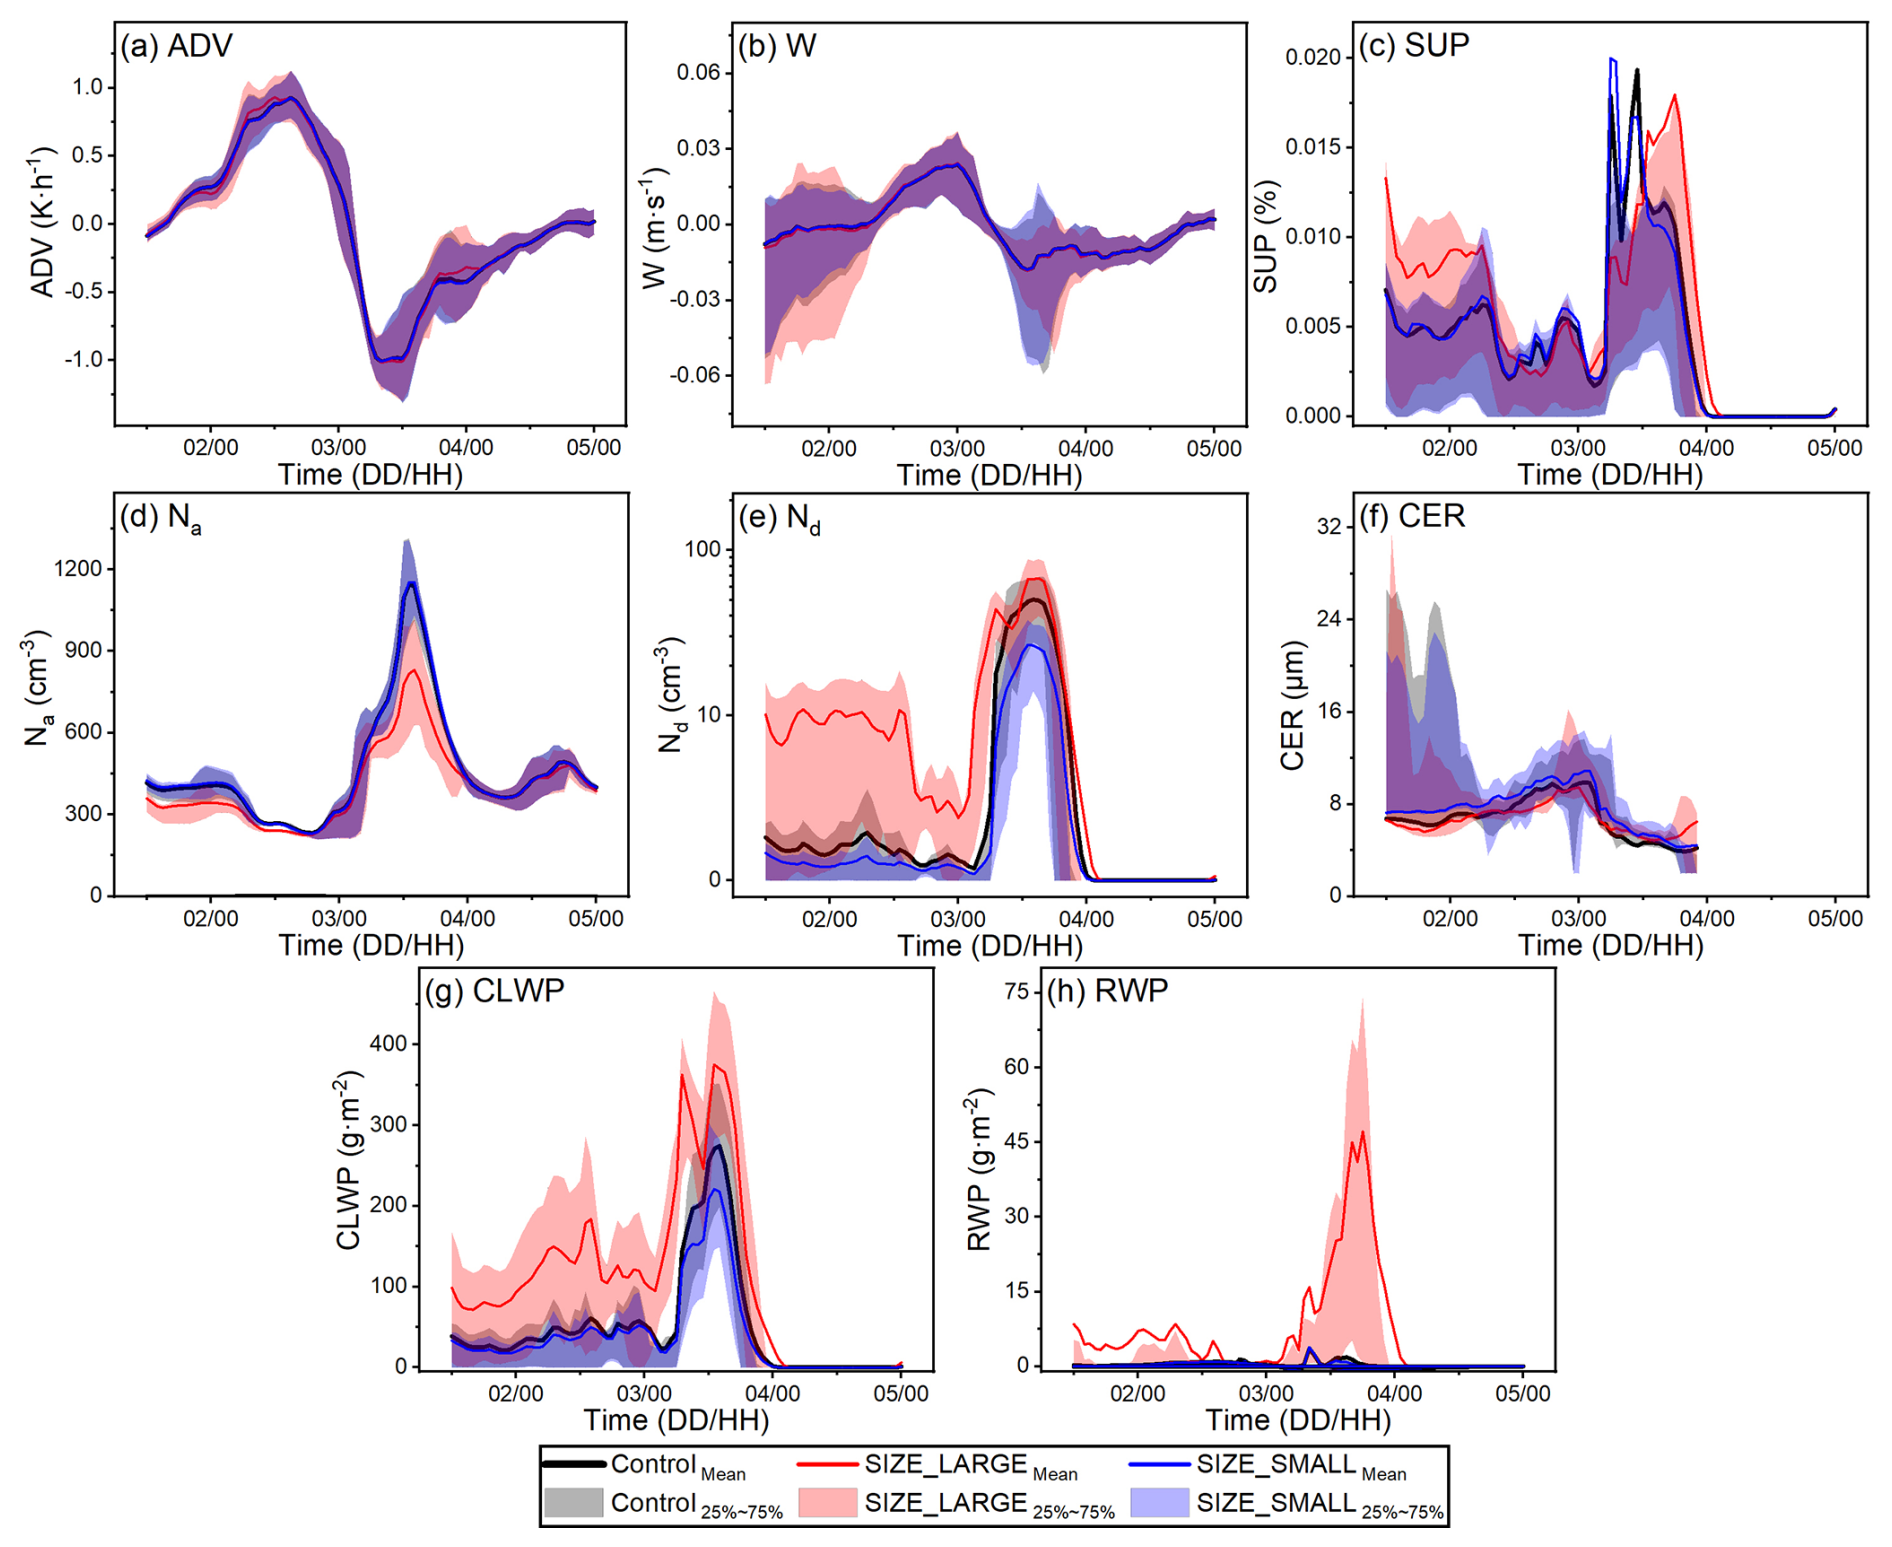
Figure 2Temporal variations (lines, ECO regional mean) and the 25 %–75 % interquartile range (shading, regional variability) of vertically weighted average temperature advection (a), vertical velocity (b) and supersaturation (c) from near the surface up to 1300 m (this height range is selected because over 97 % of cloud droplets during the simulation period exist within this range, ensuring an accurate representation of the meteorological influence on ACI), column-mean Na (d) and Nd (e), as well as CER (f), CLWP (g) and RWP (h) over ECO from the Control, SIZE_LARGE, and SIZE_SMALL experiments.
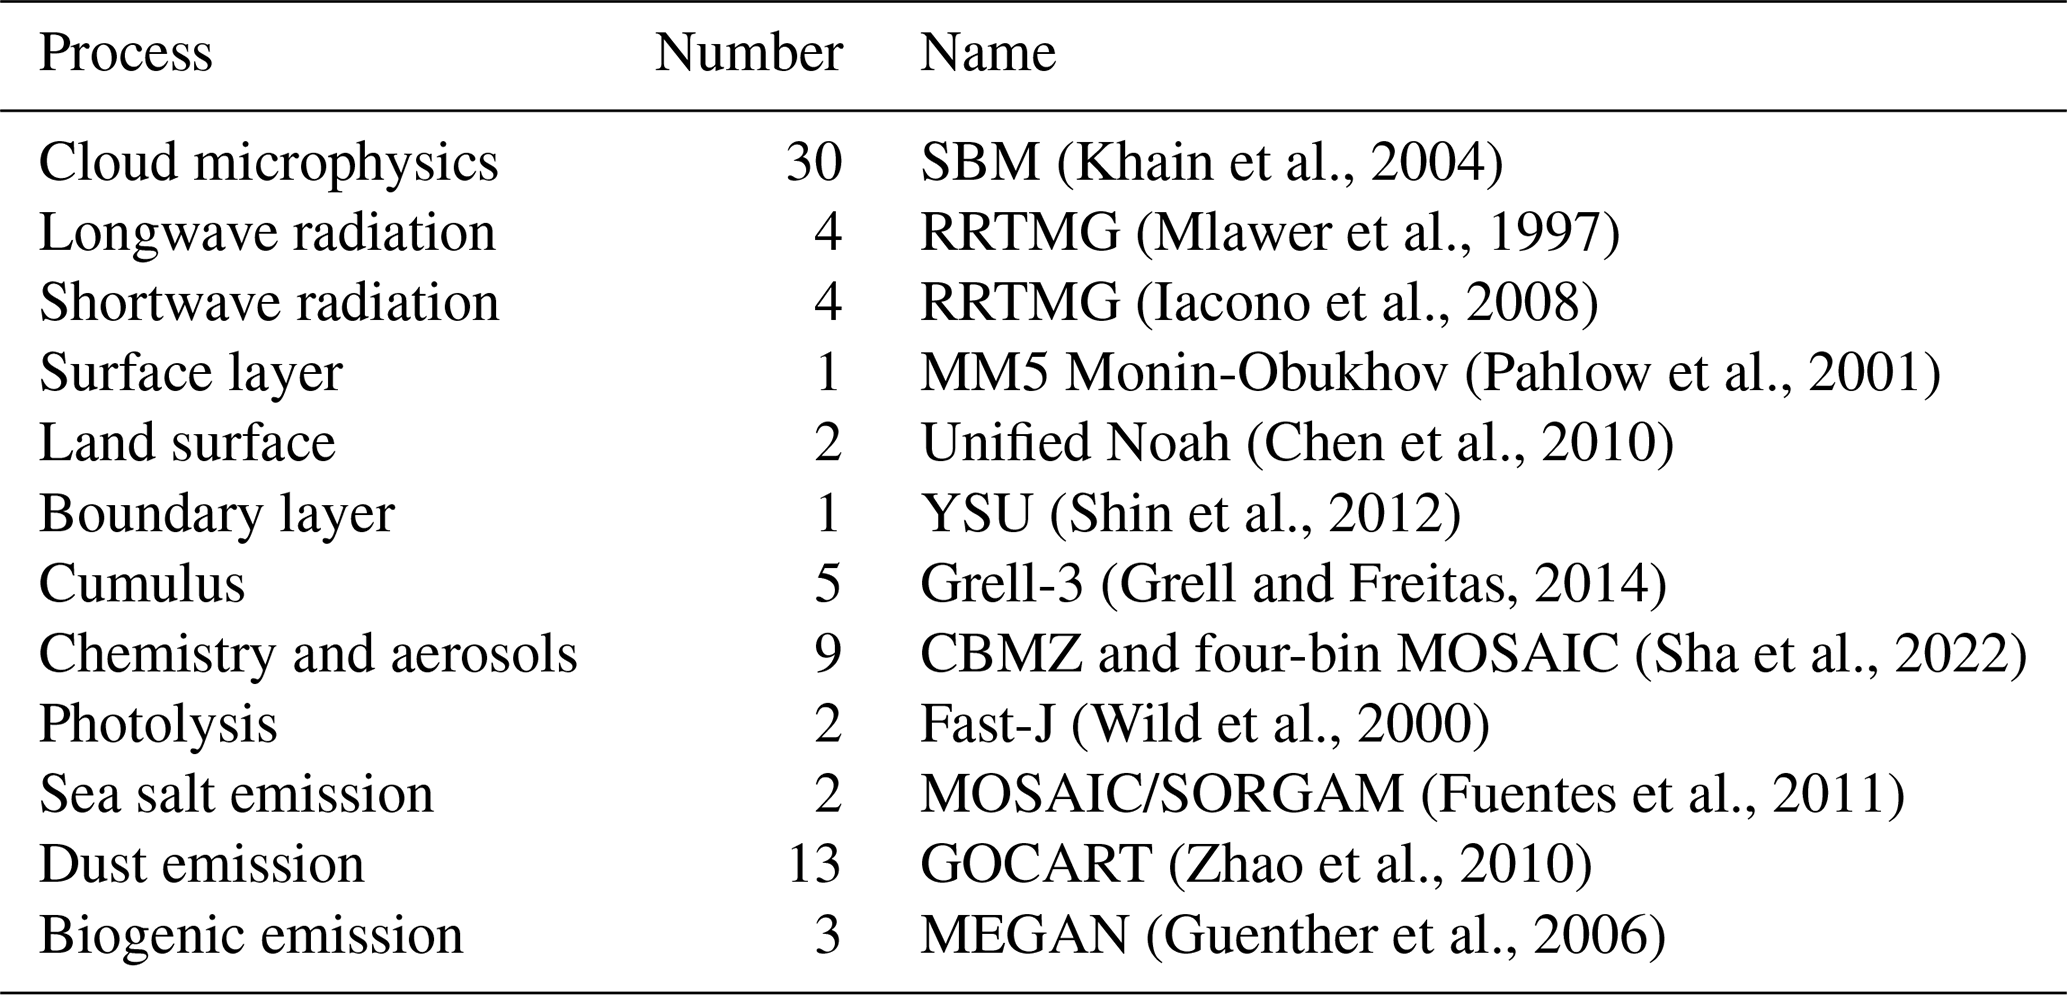
We conduct two-layer nested simulations, with the outer domain covering EC and its surrounding regions, and the inner domain focusing on ECO (Fig. 1). The outer domain provides the inner domain with high-resolution, online-updated aerosol and meteorological boundary conditions. The spatial (temporal) resolutions of the outer and inner domains are 12 km (60 s) and 2.4 km (12 s), respectively, with model outputs once per hour. The analysis in this study is based on results from the inner domain (ECO) simulation, which provides a more accurate representation of ACI. Regarding the model driving data, the meteorological initial and boundary conditions are derived from the National Center for Environmental Prediction (NCEP) FNL reanalysis, providing a temporal resolution of 6 h and a spatial resolution of 0.25°. Furthermore, data assimilation is implemented based on the NCEP operational global surface and upper air observation subsets to enhance the model performance in simulating meteorological fields (Hu et al., 2022; Liu et al., 2005; Zhao et al., 2020). The chemical initial and boundary conditions are obtained from the Community Atmosphere Model with Chemistry (CAM-chem; Buchholz et al., 2019; Emmons et al., 2020). For anthropogenic emissions, the Multi-resolution Emission Inventory for China (MEIC, 2016 version) developed by Tsinghua University is utilized (Li et al., 2017; Zheng et al., 2018). The model parameterization settings are shown in Table 1.
Table 1Model parameterization settings for the Control experiment. “Number” refers to the WRF-Chem namelist switch.
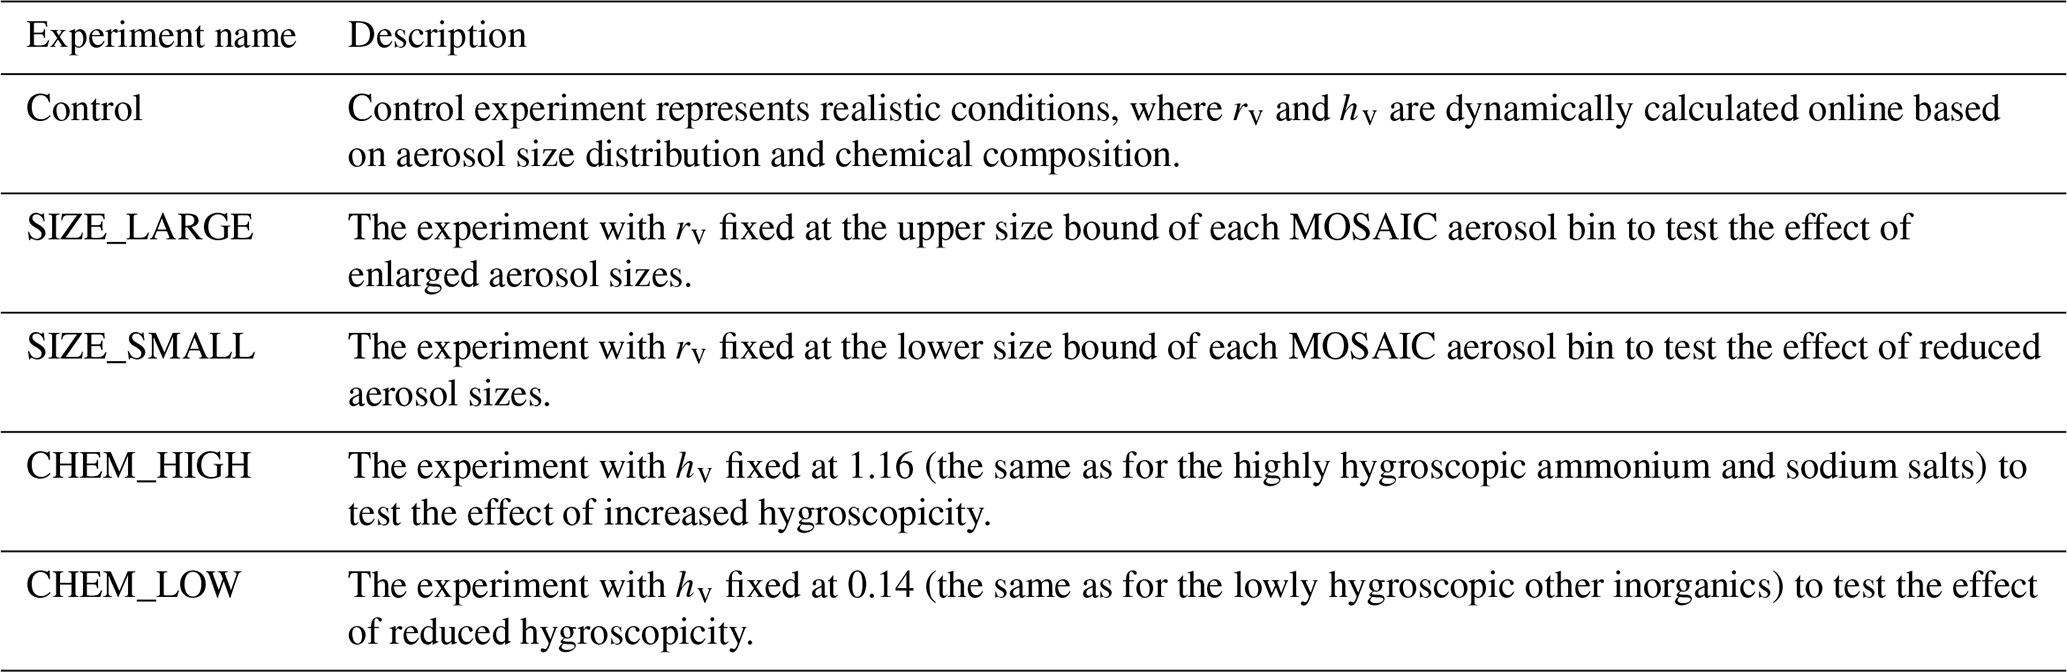
In addition to the Control experiment, which serves as the baseline, four sensitivity experiments are performed: SIZE_LARGE (rv fixed at the upper size bound of each MOSAIC aerosol bin) and SIZE_SMALL (rv fixed at the lower size bound of each MOSAIC aerosol bin) to examine the effects of aerosol size distribution, and CHEM_HIGH (hv fixed at 1.16) and CHEM_LOW (hv fixed at 0.14) to investigate the effects of aerosol chemical composition. Detailed descriptions of the experiments are provided in Table 2. Relative to the Control, the mean rv of aerosol particles in SIZE_LARGE and SIZE_SMALL is increased by 1.2 times and decreased by 45 %, respectively, while the mean hv in CHEM_HIGH and CHEM_LOW is increased by 2.2 times and decreased by 62 %, respectively.
3.1 Isolation of aerosol effects from meteorological background
In our previous study (Zhao et al., 2025b), multisource observational data for meteorology, aerosol, and cloud were used to qualitatively and quantitatively evaluate the simulations of the Control experiment, and our evaluation demonstrated the accuracy of meteorology-aerosol-cloud modeling by WRF-Chem-SBM for the studied case, thus providing a credible basis for the results of the sensitivity experiments in this study.
To isolate the effects of aerosol properties from the external conditions, primarily the meteorological conditions in all experiments should be kept as similar as possible. Therefore, we nudged the meteorological fields of all experiments toward the same observational data (Hu et al., 2022; Zhao et al., 2020) and further turned off the aerosol and cloud radiation effects in the model to prevent any radiation feedback caused by aerosol changes (Zhao et al., 2025b). The statistical analysis (Table S1 in the Supplement) indicates that the main meteorological fields (height, temperature, dewpoint depression, zonal wind, and meridional wind) remain highly consistent among all experiments. In particular, the correlations of height (altitude of each vertical layer), temperature, meridional wind, and zonal wind between each sensitivity experiment and the Control experiment reach 1.0, while the normalized mean differences (NMDs) are all within ±0.07 % (with an average absolute value of only 0.01 %). Since ACI have a relatively strong feedback on atmospheric humidity, the consistency of dewpoint depression among the experiments is slightly lower than that of other meteorological fields. Even though the largest deviation from the Control occurs in the dewpoint depression of the SIZE_LARGE experiment, the NMD is only −0.92 %. The NMDs of SIZE_SMALL, CHEM_HIGH, and CHEM_LOW relative to the Control are even smaller, at 0.13 %, 0.03 %, and 0.03 %, respectively. This also implies that increased aerosol size exerts the strongest feedback on the meteorological fields. Nevertheless, the correlations of dewpoint depression between each sensitivity experiment and the Control remain 1.0, demonstrating consistent spatiotemporal variability. To conclude, changes in aerosol size and composition introduce only minor perturbations to the meteorological fields without altering their overall spatiotemporal evolution, confirming that external confounders are well constrained and that the differences of aerosol-cloud properties across experiments robustly reflect the influence of aerosol properties.
3.2 Influence of aerosol size on ACI
As one of the most important aerosol properties, particle size exerts a significant influence on ACI (Hernández Pardo et al., 2019; Hoffmann and Feingold, 2021; Liu et al., 2022). Several studies have utilized land-sea contrasts to illustrate how aerosol size modulates microphysical processes to affect clouds and their radiative effects (Liang et al., 2026; Zhao et al., 2025c). In parallel to these efforts, our study also investigates the microphysically driven impacts of aerosol size. By focusing on the ECO region and examining a case characterized by abundant variations in meteorology, aerosols, and clouds, we quantitatively resolve the effects of aerosol size and their environmental dependence by comparing SIZE_LARGE and SIZE_SMALL to the Control run.
To minimize the influence of ice-phase processes, all grid points at each time step where the cloud ice water path (CIWP) is greater than zero are excluded from the analysis. The aerosol and cloud properties analyzed in this study include their magnitudes at each vertical layer (including aerosol number concentration (Na), Nd, raindrop number concentration (Nr), cloud liquid water content (CLWC), rainwater content (RWC), and cloud lifetime characterized by the number of liquid-phase cloud samples), column averages (Na, Nd, Nr), and column totals (including CLWP and rainwater path (RWP)). In addition, CER is calculated based on the number of cloud droplets in each bin:
where ri is the radius of the ith bin of cloud droplets and Ni is the total number of cloud droplets in the ith bin within the corresponding spatiotemporal range. Meteorological variables, including ADV, vertical velocity, relative humidity (RH), and supersaturation, are computed as vertically weighted averages.
3.2.1 Overall impact of aerosol size distribution on ACI
In the Control experiment, the main continental aerosol source during the study period is located in the northwest of the outer domain (Fig. 1b), resulting in a northwest-to-southeast decreasing gradient of Na over ECO (Fig. 3a). Overall, Nd exhibits an almost opposite gradient compared to Na (Fig. 3d). This, however, does not imply a suppression of cloud droplet formation by excessive aerosols, but rather indicates that, under abundant aerosols with sufficient transport heights, ice or mixed-phase clouds form (see Fig. S1). Since we focus on liquid clouds in this study, the mixed- and ice-clouds have been excluded from the results shown in Fig. 3. Thus, low Nd is seen over the northern part of ECO due to fewer liquid clouds. The spatial distribution of cloud properties (Fig. 3, left column) shows a clear negative spatial correlation of CER with Nd, whereas there is no evident spatial correlation between water path and Nd or CER, as CLWP and RWP are governed by complex microphysical processes regulated by meteorological conditions and the droplet spectrum. Given this complexity, these relationships will be discussed in more detail in subsequent sections.
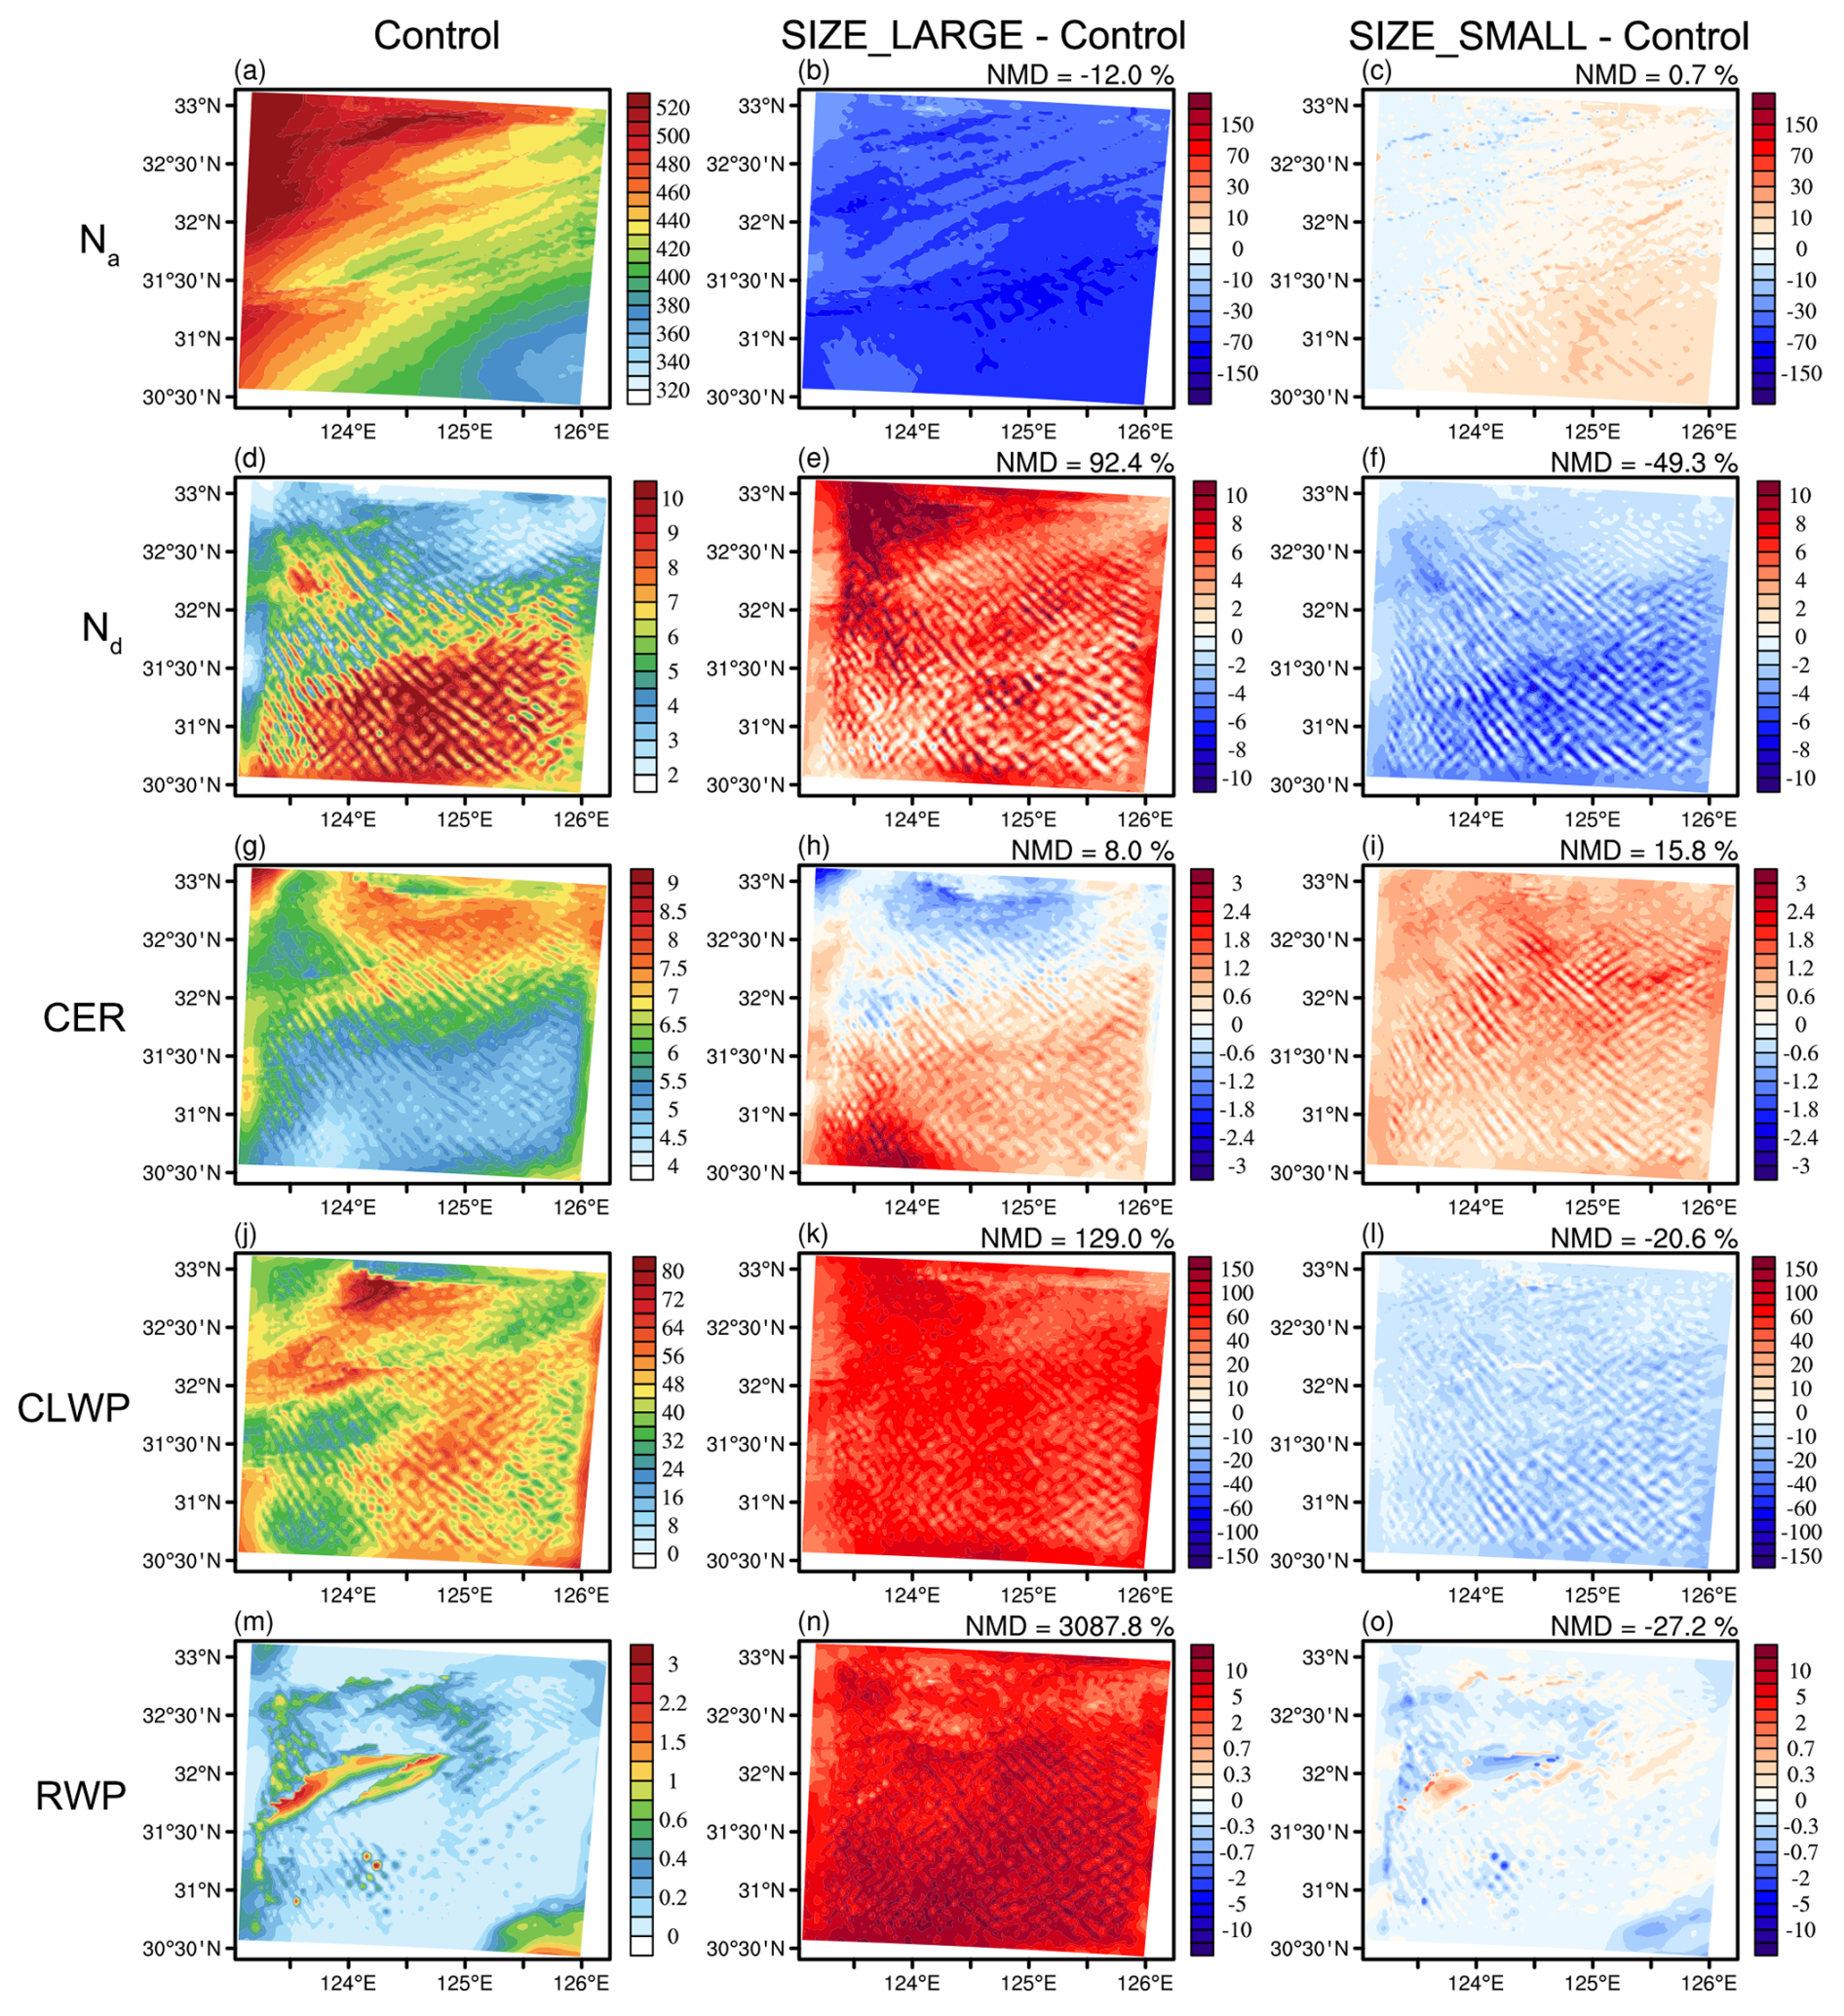
Figure 3Spatial distributions of column-mean Na (a–c, in cm−3) and Nd (d–f, in cm−3), mean CER (g–i, in µm), CLWP (j–l, in m−2), and RWP (m–o, in g m−2) averaged over the simulation period from the Control experiment (left column), and differences of SIZE_LARGE (middle column) and SIZE_SMALL (right column) relative to the Control (NMD of each sensitivity experiment relative to the Control is indicated at the top-right of each subplot). Values represent liquid-phase clouds averaged over the simulation period, and grid points without clouds or with non-liquid-phase clouds are excluded. Na and Nd are column averages, CLWP and RWP are column totals, and CER is calculated based on the droplet number in each bin.
Compared to the Control experiment, increased aerosol size (Fig. 3, middle column) effectively lowers Scrit, leading to a substantial increase in Nd, with a regional mean increase of 92 %. This effect is particularly pronounced in the northwest, where abundant aerosols are present. The increase in Nd typically intensifies competition for water vapor and reduces CER, while the generally enlarged initial droplet size resulting from the increased aerosol size also offsets the reduction in CER (Kogan, 1991). The substantial increase in Nd leads to a reduction in CER in the northern region, while the regional mean CER over ECO increases slightly (8 %). The increase in both Nd and CER effectively enhances CLWP and RWP, with CLWP increasing by 129 % and the originally weak RWP increasing by 31 times. This intensifies wet scavenging, leading to a 12 % reduction in Na. This reduction stems from not only the contribution of local wet scavenging within ECO but also the reduced transport into ECO caused by enhanced scavenging in the outer domain. The wet scavenging mainly affects Na during high-RWP periods, while Na during non-precipitating periods and its overall temporal evolution remain consistent across experiments (Fig. 2d).
In contrast to the effects of increased aerosol size, the decreased aerosol size (SIZE_SMALL, the right column of Fig. 3) induces an elevated Scrit, in turn, leading to a 49 % decrease in Nd. Weakened water competition increases CER by 16 %, which is insufficient to offset the weakened collision-coalescence, resulting in decreases of 21 % and 27 % in CLWP and RWP, respectively. Since precipitation in the Control experiment is already very weak, the precipitation reduction caused by reduced aerosol size has only a minor impact on aerosols, increasing Na by just 0.7 %.
As shown in Fig. 2, the temporal variations of meteorological fields, aerosol, and cloud parameters reveal the overall influence of meteorological conditions on ACI under the winter monsoon background. During the simulation period, meteorological conditions experience a transition in ADV from predominantly warm to cold, while vertical motion overall shifts from upward to downward. During the periods dominated by cold advection and downdrafts (around 12:00 on the 3rd), supersaturation, Nd, CLWP, and RWP are all noticeably higher than those during the periods dominated by warm advection and updrafts (around 12:00 on the 2nd), which highlights the enhancement of clouds by the strong condensation effect triggered by cold advection. The increase in Nd due to increased aerosol size is most pronounced in weak cloud processes prior to 3 February, whereas during the intense cloud process around 12:00 on 3 February, Nd generally increases, but decreases in some periods due to competition from a large number of droplets.
The variations of RWP in SIZE_LARGE generally follow CLWP (r=0.66, p<0.01), indicating that precipitation generally intensifies with cloud development in this case, and its depleting effect does not alter the overall trend of CLWP. Under sufficient CCN supply, RWP increases with Nd (r=0.79, p<0.01) and its variation is minimally affected by CER, and the negative correlation with CER (, p<0.01) is caused by the negative correlation between Nd and CER (, p<0.01). This contrasts with the generally positive correlation between precipitation and CER (Chelani et al., 2024), presenting an important role of collision-coalescence in precipitation over ECO.
3.2.2 Influences of aerosol size on clouds varying with environmental conditions
As described above, an increase (decrease) in aerosol particle size generally promotes (suppresses) cloud and precipitation development, but the specific effects are modulated by meteorological factors and background Na. Particularly, the differences in microphysical characteristics and dominant physical processes lead to distinct responses over different parts of the cloud in the vertical structure (hereafter referred to as cloud parts, including the cloud base, cloud interior, and cloud top) to changes in aerosol particle size.
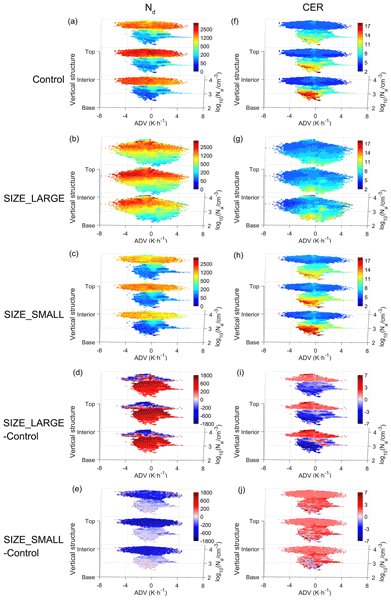
When analyzing the synergistic variations of ACI with meteorology and aerosols, it is necessary to select a parameter to characterize the meteorological changes. Typically, vertical velocity acts as the primary driver for activation and supersaturation. However, under the winter monsoon background, the strong condensation associated with downdrafts also effectively drives supersaturation and cloud development (Fig. 2). Consequently, vertical velocity cannot comprehensively represent the variations in meteorological conditions in this specific scenario. The transition of ADV from negative to positive represents a shift in atmospheric advection from cold to warm, which is accompanied by an increase in vertical velocity, an initial decrease and then increase for supersaturation, Nd, and CLWP, and an initial increase and then decrease for CER (Fig. S2). Therefore, ADV is selected in this study to characterize the variations in meteorological conditions. Na serves as the primary indicator of background aerosol conditions. For cloud parts, a liquid-phase cloud sample is first defined as a grid cell in which CLWC > 0.05 g m−3 and Nd>15 cm−3 persist over three or more consecutive vertical layers at a given time (Jia et al., 2019). The cloud top is defined as the highest layer of the sample, the cloud base as the lowest layer, and the cloud interior as the weighted average of all layers between the cloud base and cloud top. In each experiment, the liquid-phase cloud samples are assigned into bins based on Na (log10(Na) equally spaced bins from 2.0 to 4.3), ADV (equally spaced bins from −6 to 6 K h−1), and cloud parts (cloud base, cloud interior, and cloud top). The mean cloud properties of samples within each bin are then used to demonstrate the variations of cloud properties with aerosol and meteorological conditions, and cloud parts, and to reveal the impacts resulting from changes in aerosol properties.
Cloud responses to aerosols (Na) and meteorological conditions (ADV) are presented in Fig. 4. In the Control experiment (Fig. 4, first row) which reproduces realistic conditions, the number and size of cloud droplets exhibit significant sensitivity to Na. Conversely, the sensitivity of cloud droplets to ADV is relatively low due to the weak warm advection and its accompanying updrafts under the winter monsoon background, as well as the mutual cancellation between cloud enhancement by condensation and cloud inhibition by subsidence as ADV decreases under cold advection. Overall, Nd exhibits an increasing trend with Na, and such response varies with ADV. Specifically, relatively active updrafts under warm advection (ADV > 0) support vigorous activation for low to medium Na conditions (<103.5 (approx. 3162) cm−3). For high Na (>103.5 cm−3), the limited updraft strength in winter would not support full aerosol activation, so the Nd difference between cold and warm advection is quite small.
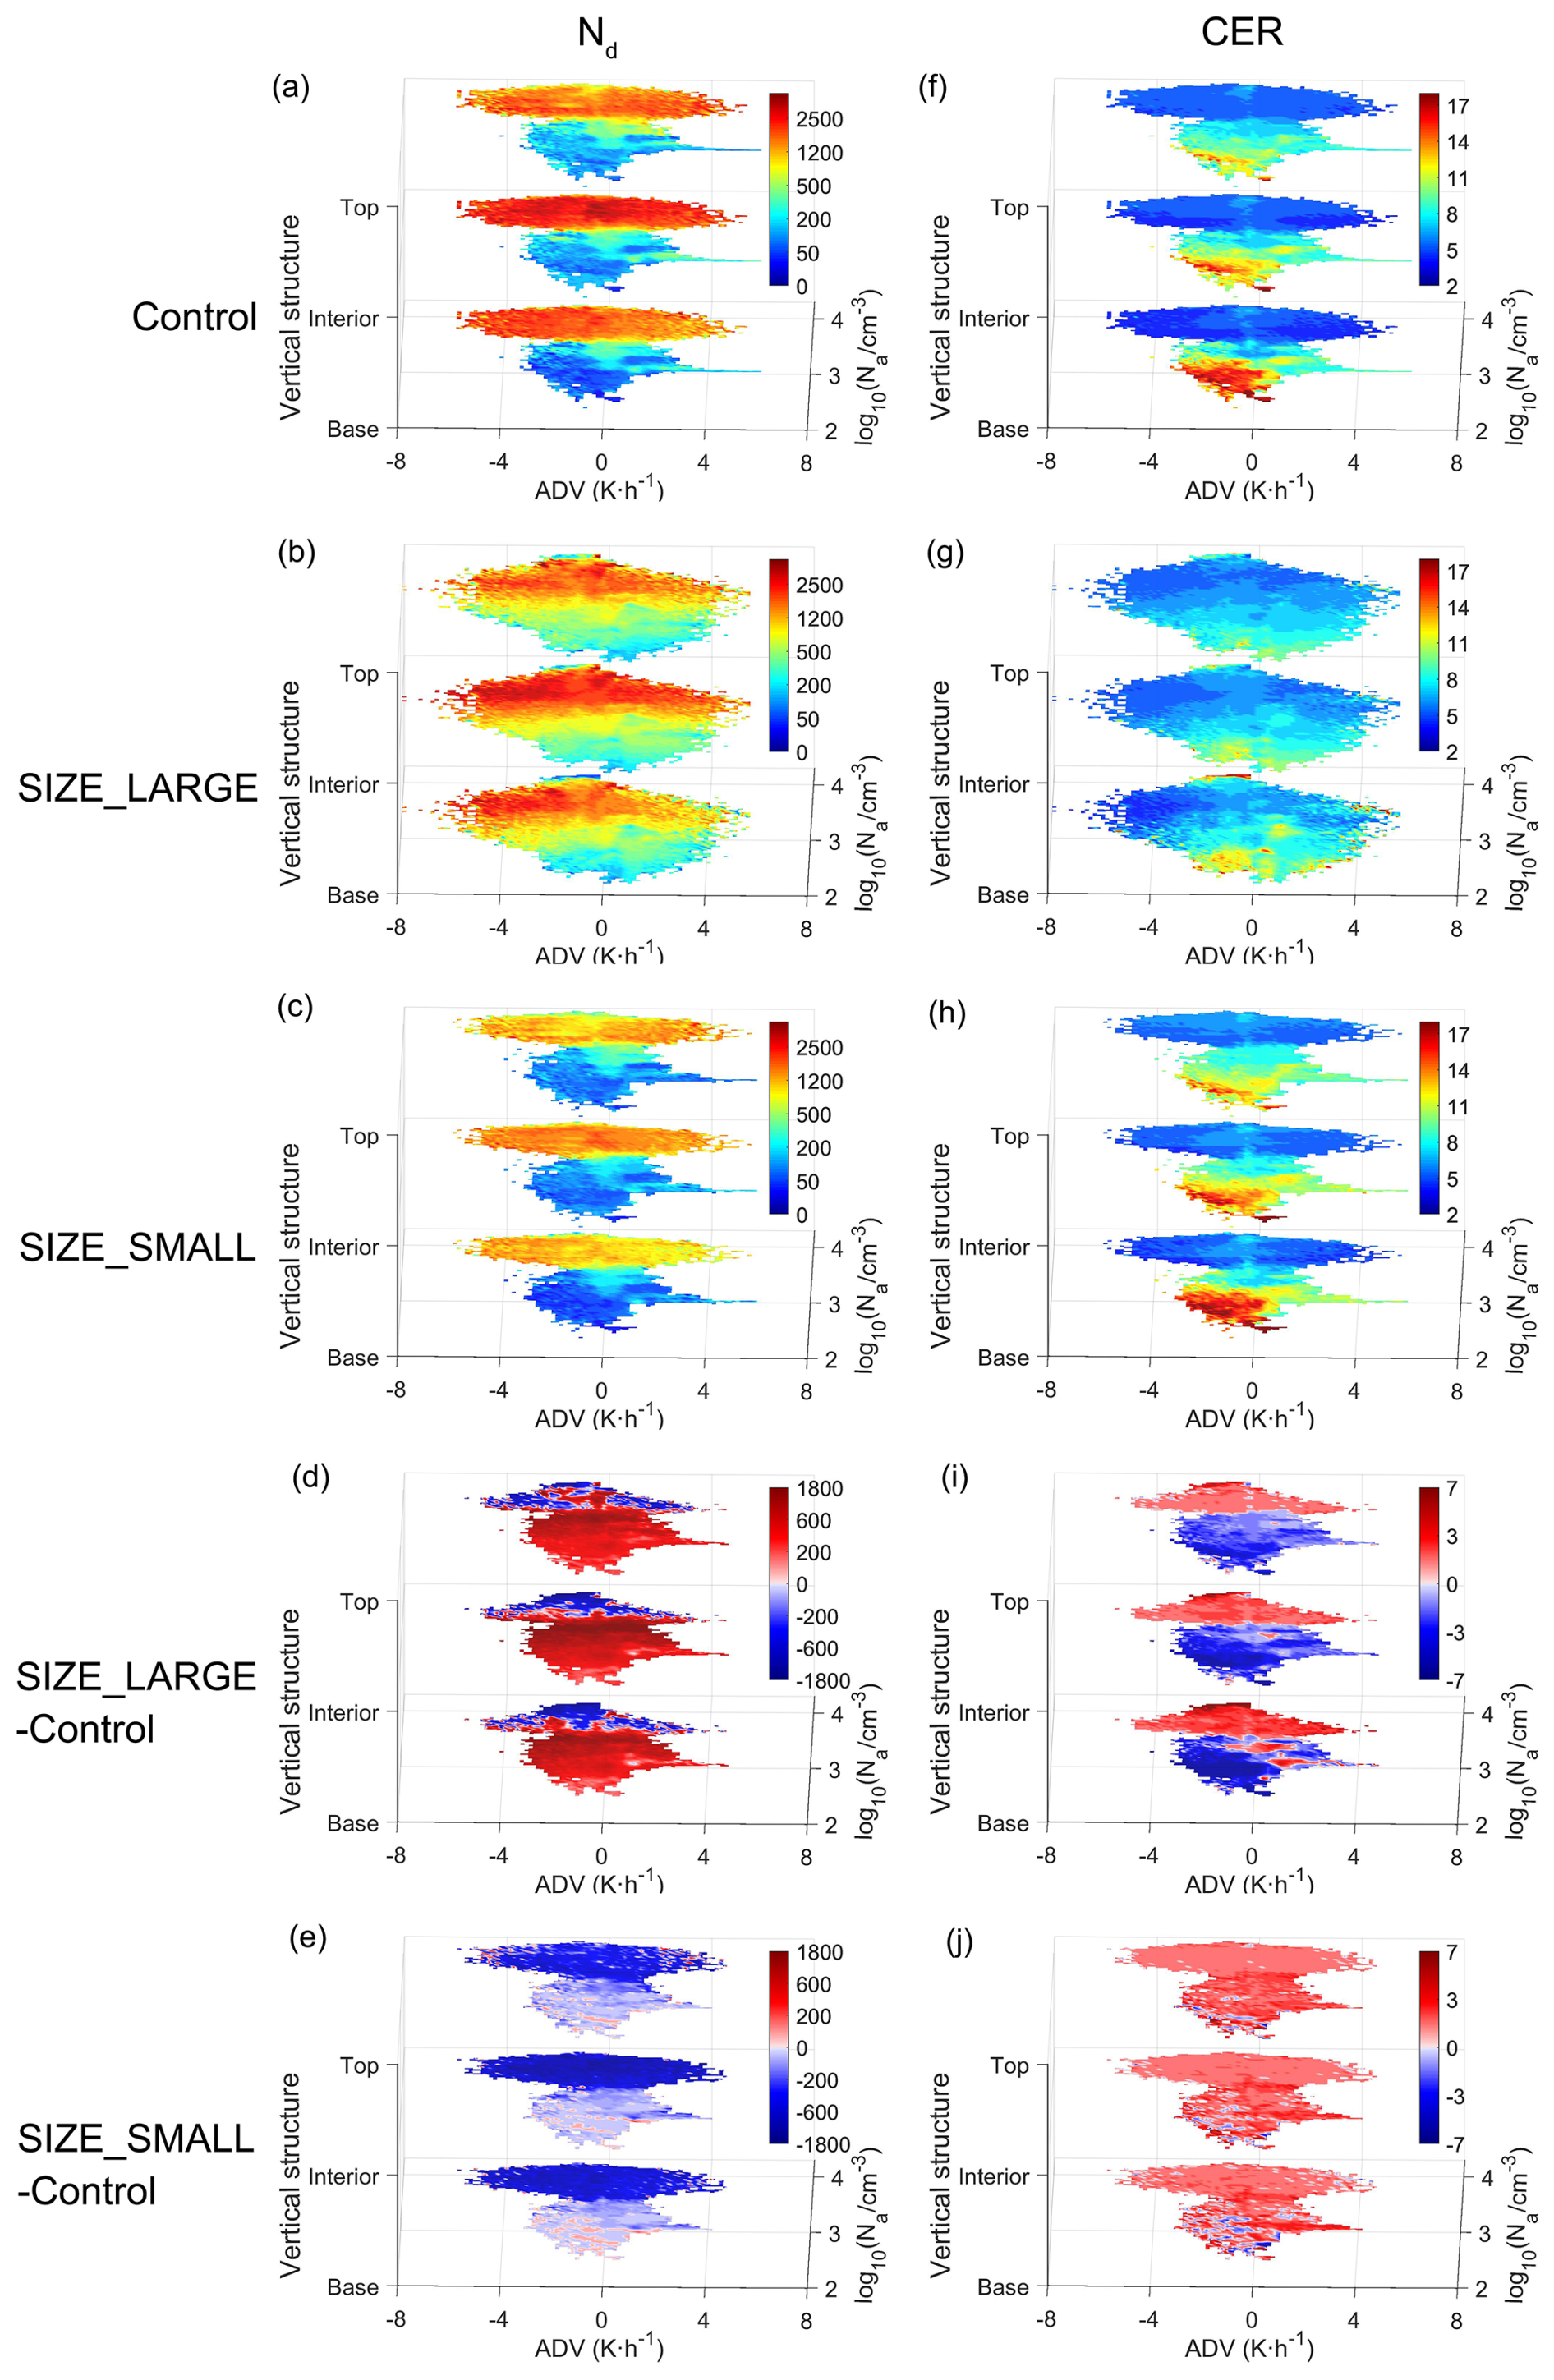
Figure 4Variation of Nd (left column, in cm−3) and CER (right column, in µm) of liquid-phase clouds with Na, ADV and cloud parts for the Control (a, f), SIZE_LARGE (b, g), and SIZE_SMALL (c, h) experiments, and the differences of the SIZE_LARGE (d, i) and SIZE_SMALL (e, j) experiments relative to the Control experiment.
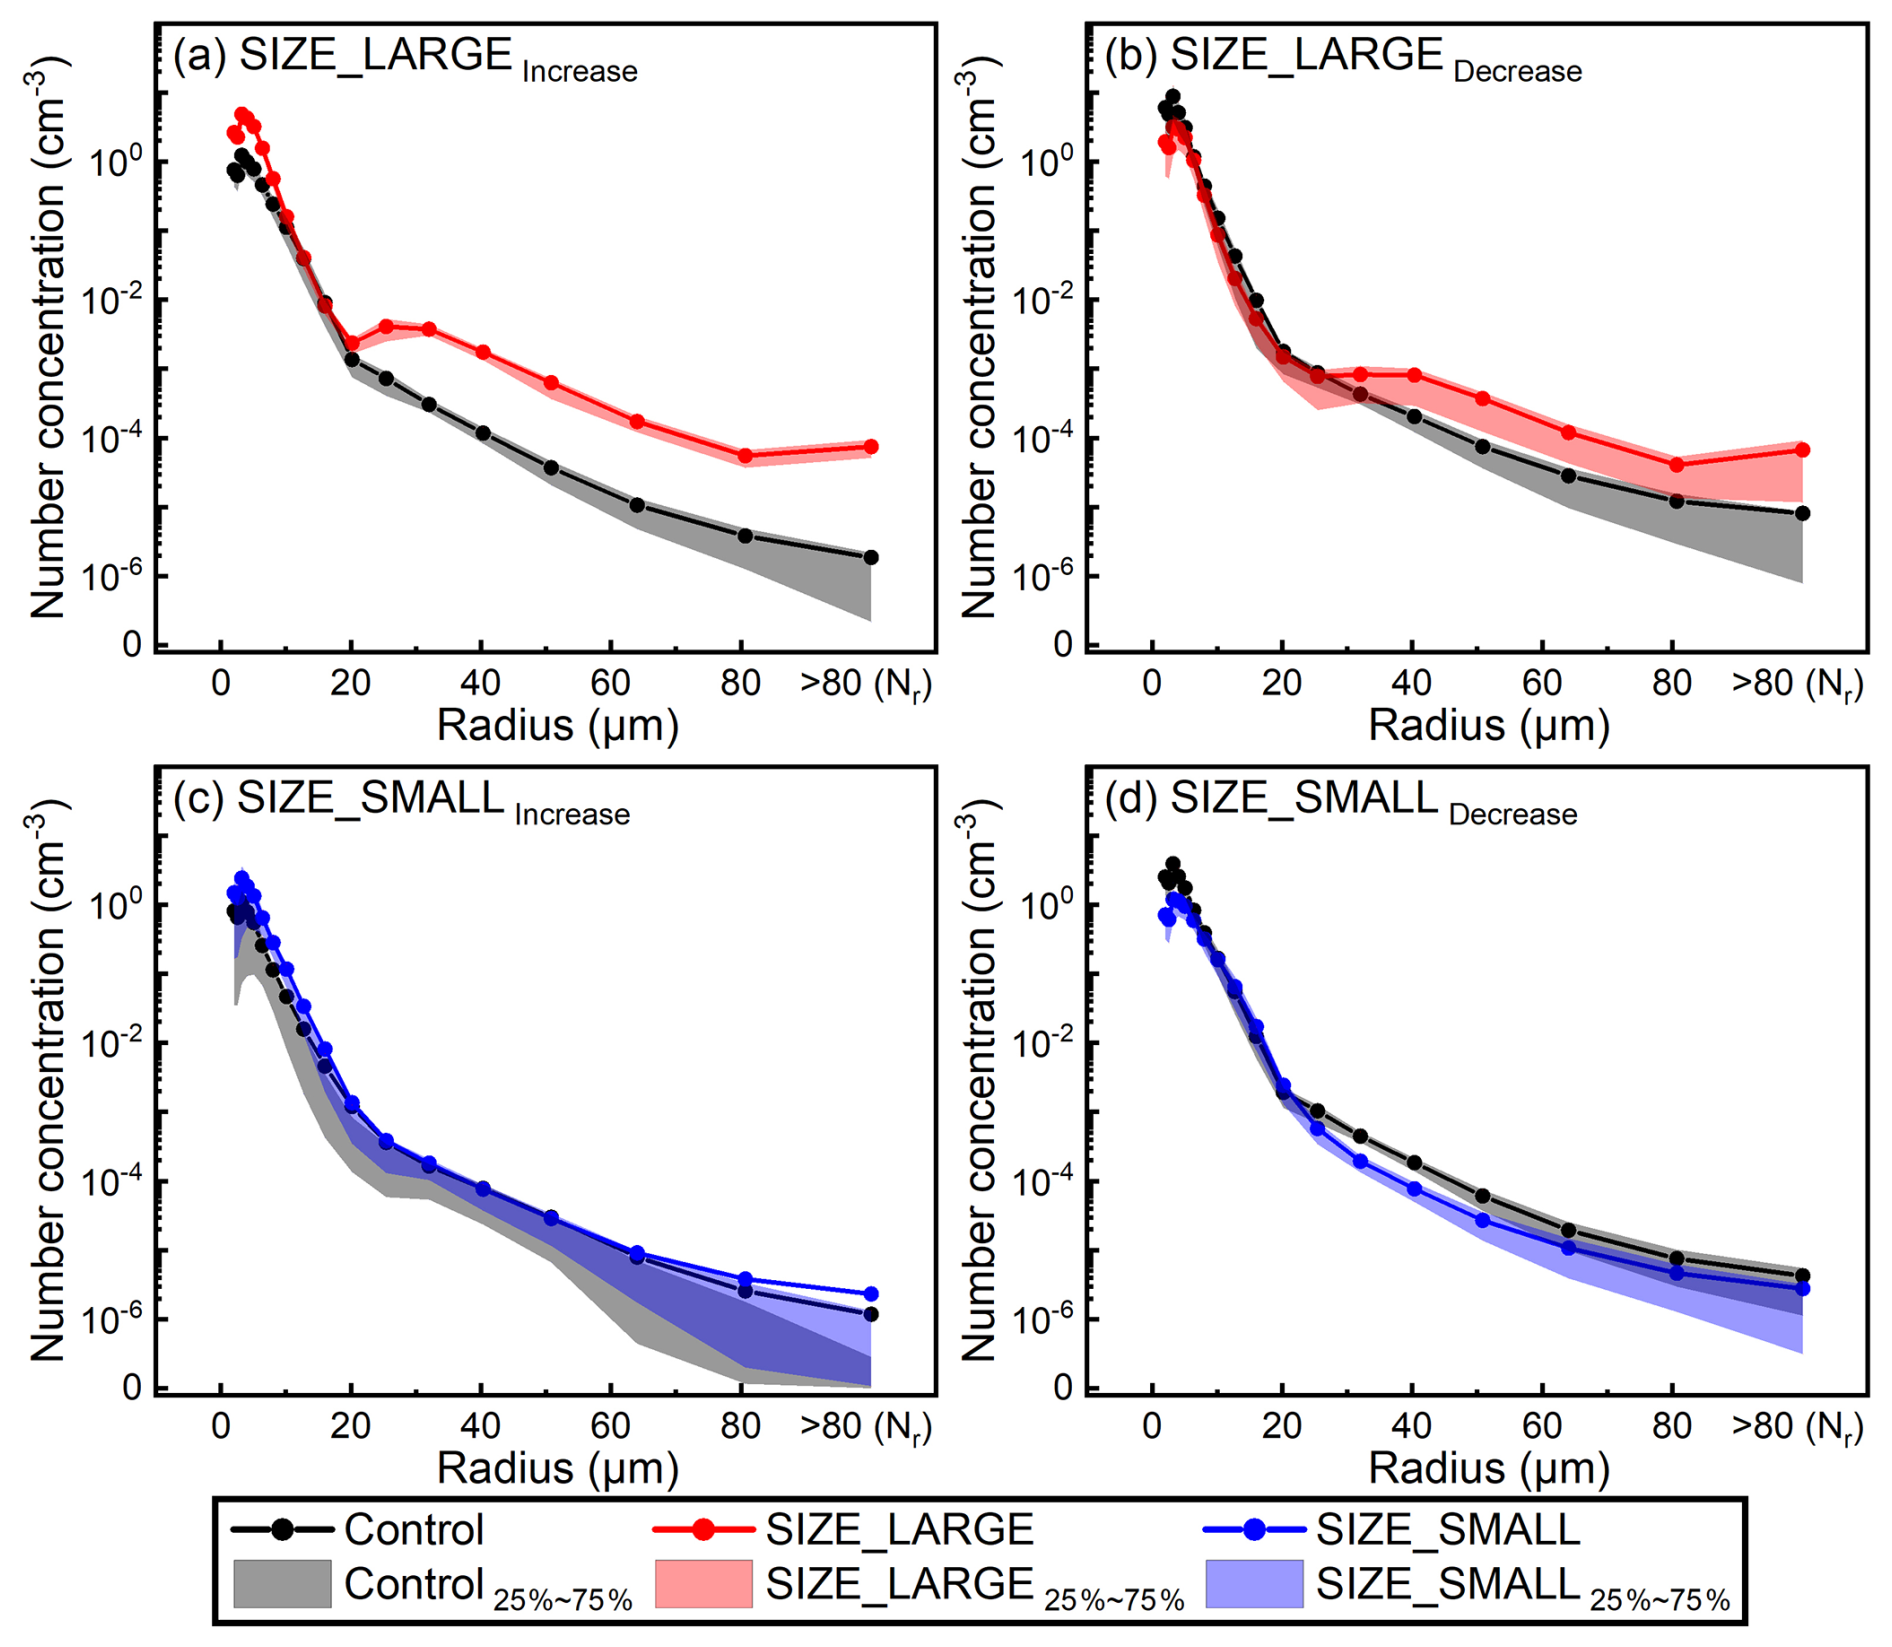
Figure 5Changes in droplet spectra (lines, mean; shading, the 25 %–75 % interquartile range; droplets with a radius greater than 80 µm are raindrops and those less than 80 µm are cloud droplets) for the samples with an increase (a, c) or decrease (b, d) in Nd of more than 0.1 cm−3, in response to increases (upper row) or decreases (lower row) in aerosol size.
The sensitivity experiments as well as their differences compared to the Control experiment (Fig. 4) show that an increase in aerosol particle size (SIZE_LARGE) overall leads to a substantial increase in Nd and a significant decrease in CER under low to medium Na conditions (<103.5 cm−3). Cloud droplet size distributions (Fig. 5a–b) indicate that Nd in the 20 to 30 µm range of the SIZE_LARGE exhibits an apparent opposite trend compared to that of the Control experiment. The reason is that under warm advection conditions, updrafts cause newly formed cloud droplets to have larger sizes (Gao et al., 2016; Kogan, 1991). To further explore changes in microphysical processes, we analyze the correlation between cloud droplets in each bin and those in other bins (Fig. 6). It shows that under increased aerosol particle size, the synchronization rate of changes between small droplets (radii < 10 µm) and those around 20 µm increases, suggesting that increased aerosol size extends the direct influence of activation further into the droplet spectrum toward 20 µm.
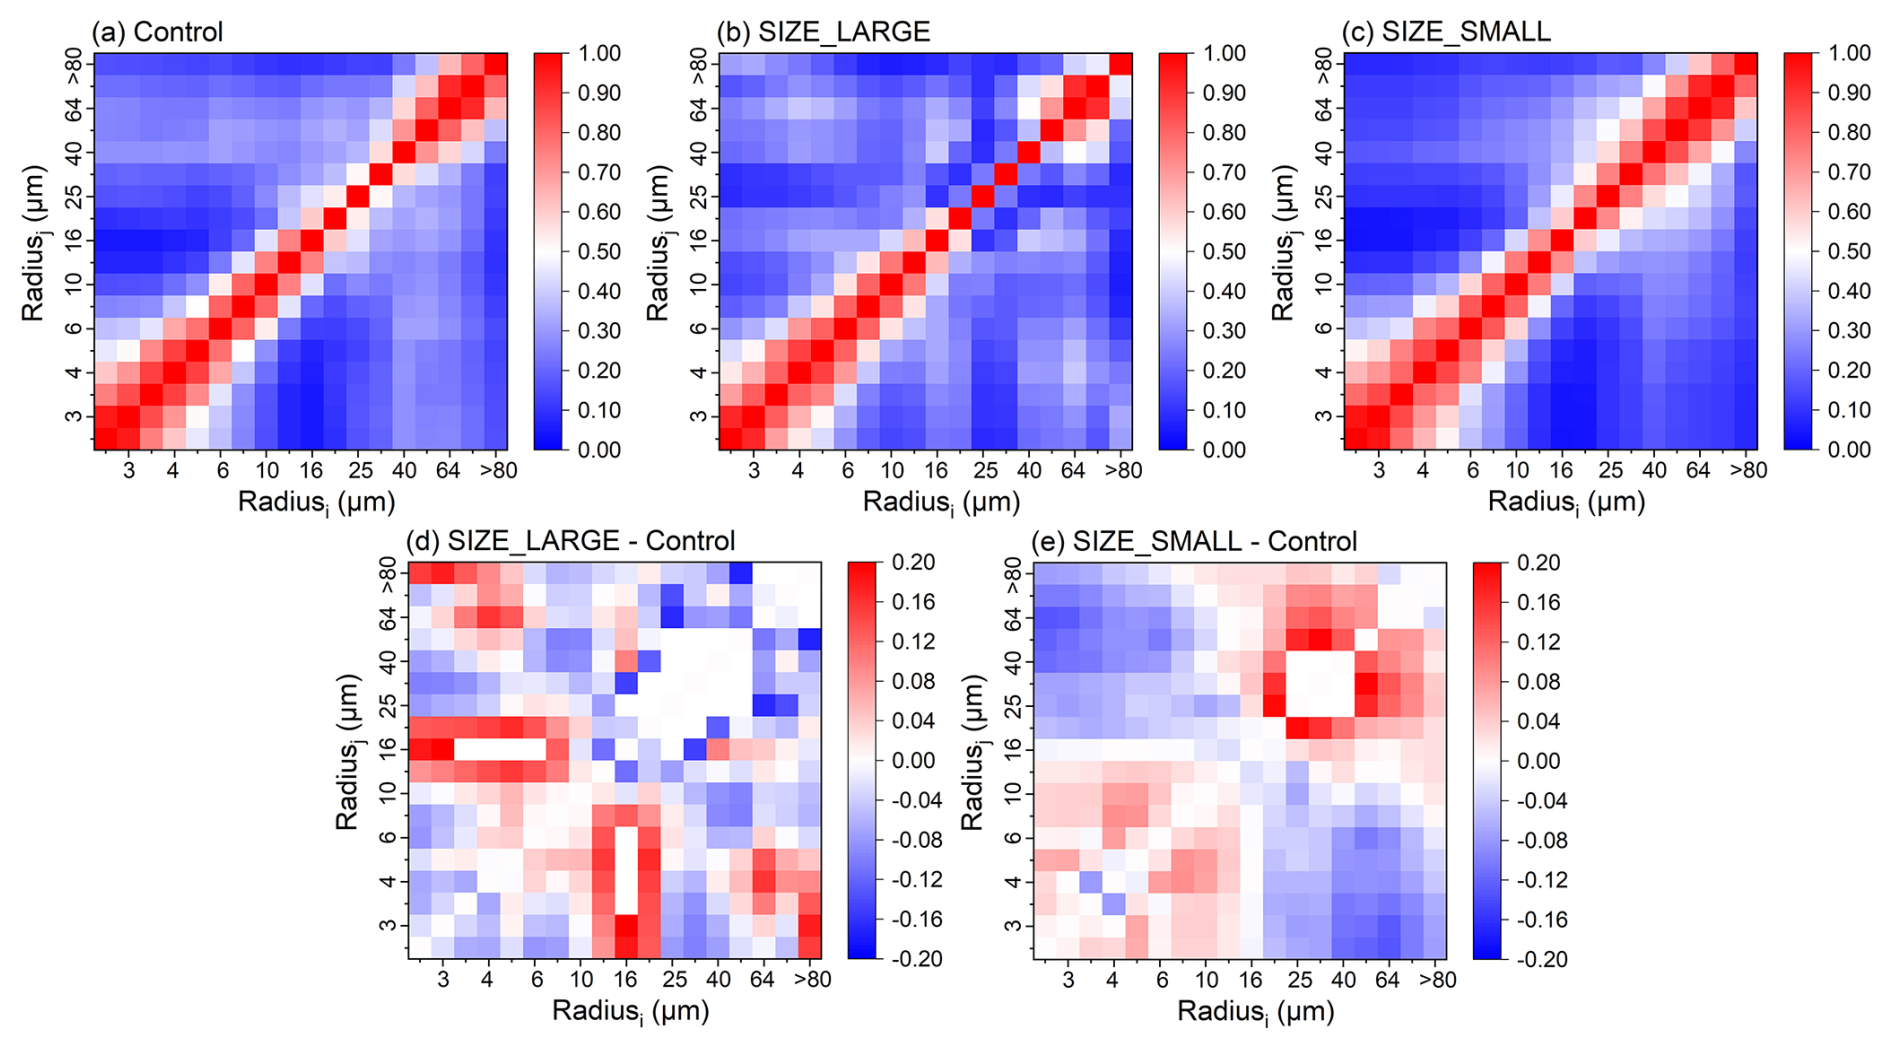
Figure 6Correlation map between liquid droplet number concentrations in size bins i and j from the Control (a), SIZE_LARGE (b), and SIZE_SMALL (c) experiments, and differences of SIZE_LARGE (d) and SIZE_SMALL (e) with the Control. For each size bin, the four-dimensional (time, height, latitude, longitude) droplet number concentration field is first flattened into a one-dimensional array in the same order, and the Pearson correlation coefficient between bins i and j is then computed.
It is also noted that under high Na conditions (>103.5 cm−3), the increase in aerosol particle size leads to a decrease in Nd and an increase in CER (Fig. 4), i.e., cloud responses are quite different from those under low to medium Na conditions. From the droplet size distribution shown in Fig. 5b, it can be inferred that the increase in CER primarily stems from an increased population of large cloud droplets and a reduction in small cloud droplets. Specifically, the increase in large droplets is attributed to the enlarged initial size of droplets resulting from increased aerosol size, while the decrease in small droplets is linked to the competitive advantage of large droplets for water vapor. On one hand, the increase in large droplets inhibits the activation of small aerosol particles, and on the other hand, it further reduces the concentration of small droplets through collision-coalescence.
Compared to the SIZE_LARGE experiment, the SIZE_SMALL experiment (decreased aerosol size, Fig. 4) significantly reduces the number of aerosols that can be activated under the current environmental supersaturation, thereby inhibiting the formation of new cloud droplets. Meanwhile, the weakened competition for moisture provides a better growth environment for existing cloud droplets, leading to an overall increase in CER.
Although the decrease in aerosol size generally leads to a reduction in Nd – an effect that is particularly significant in high Na environments where large numbers of cloud droplets exist and moisture competition is intense – in low Na environments, while the formation of new cloud droplets is inhibited, the increase in cloud droplet size effectively suppresses evaporation and the resulting dissipation of existing small cloud droplets, leading to an increase in Nd and the number of large droplets (Fig. 5c). While affecting cloud droplet properties, the decrease in aerosol size increases the correlation of small and large cloud droplets with droplets of similar sizes to themselves, and weakens the correlation between small droplets and large droplets (Fig. 6e); that is, in cloud microphysical processes, it enhances the relative influence of condensation and weakens the relative influence of collision-coalescence.
In terms of cloud water, increased aerosol size (SIZE_LARGE) leads to an overall increase in CLWC (Fig. 7). This increase in CLWC is most pronounced under moderate Na (103 to 103.5 cm−3) conditions, where CLWC remains at low values due to weakened condensation and insufficient collision-coalescence (Fig. 7a). However, some reductions occur under extremely high Na (>103.8, approx. 6310 cm−3) and in low Na (<102 cm−3) environments under cold advection, driven by a substantial decrease in Nd and intensified evaporation resulting from a sharp decline in CER, respectively. Concurrently, RWC also exhibits its highest growth under moderate Na. Because the number of large droplets increases regardless of whether Nd increases or decreases, RWC increases across all environments under the influence of increased aerosol size. In contrast, decreased aerosol size (SIZE_SMALL) only causes relatively weak variations in both CLWC (with an average impact magnitude that is 16 % of that from increased size) and RWC (with an average impact magnitude that is 0.9 % of that from increased size). It tends to increase CLWC and RWC under low Na by suppressing evaporation, while decreasing both under moderate and high Na by weakening collision-coalescence.
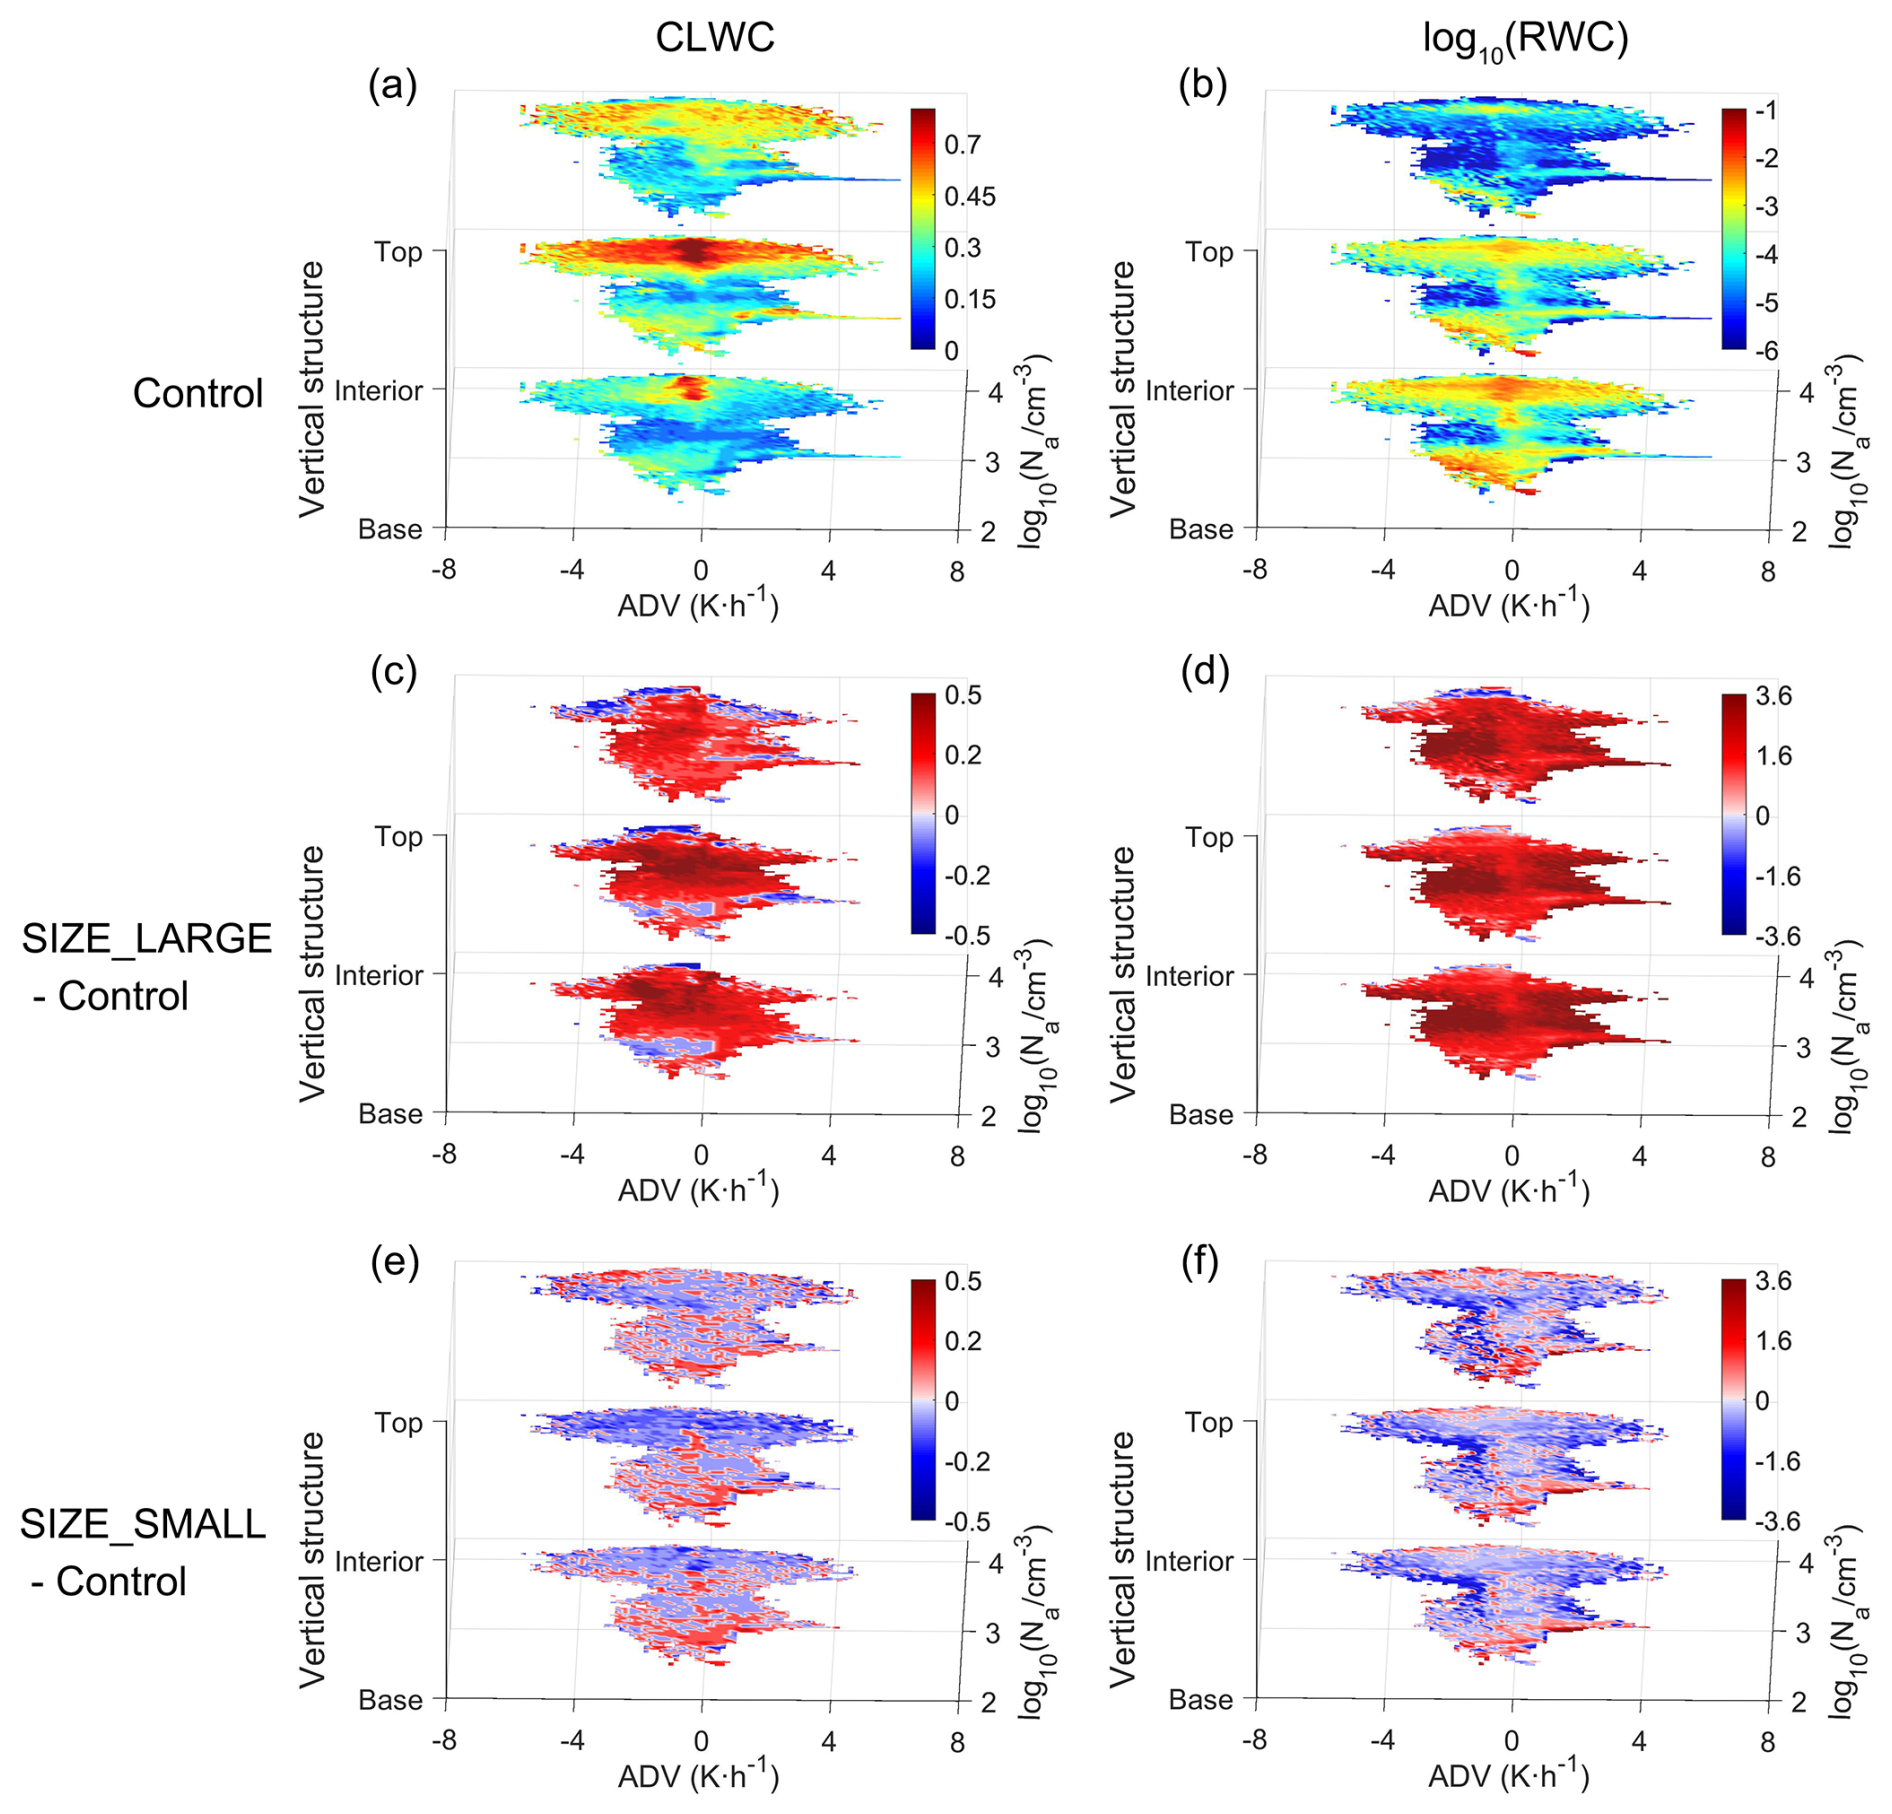
Figure 7Variation of CLWC (left column, unit: g m−3) and RWC (right column, unit: g m−3, presented logarithmically in base 10) with Na, ADV and cloud parts for the Control (a–b) experiment, and the differences of the SIZE_LARGE (c–d) and SIZE_SMALL (e–f) experiments relative to the Control experiment.
The impact of aerosol size distribution on cloud lifetime is essentially a comprehensive result of its regulation of cloud droplet number concentration and size spectrum distribution by changing the number of activatable aerosols in the current environment, which eventually affects physical processes such as condensation, collision-coalescence, evaporation, and precipitation in clouds. Because the influence of aerosol size on various cloud water budget terms varies significantly across different environments, its impact on cloud lifetime also exhibits high nonlinearity and environmental dependency. In this study we use the number of liquid-phase cloud samples to represent cloud lifetime and its variations in different environments (Fig. 8). Regarding the distribution pattern of liquid-phase cloud samples with ADV-Na, the Control and SIZE_SMALL experiments show a basically consistent inverted triangle distribution, meaning that as Na increases, the meteorological conditions available for cloud formation also broaden. The SIZE_LARGE experiment exhibits a diamond-shaped distribution distinct from other experiments: at relatively low Na, the large number of activatable CCN provided by increased aerosol size allows clouds to form under a wide range of meteorological conditions, but at high Na, the substantial reduction in Nd as previously described inhibits cloud formation and development. Compared to the Control experiment, although the increase in aerosol size leads to a decrease in cloud lifetime at extremely high Na (>103.8 cm−3), it prolongs the lifetime of clouds in other environments (Na<103.8 cm−3) due to enhanced collision-coalescence. Simultaneously, the resulting lower Scrit promotes cloud formation in some originally cloud-free environments. These effects lead to an 85 % increase in the number of liquid cloud samples. The change in the number of liquid cloud samples in the SIZE_SMALL experiment, which shows a distribution pattern with ADV-Na consistent with the Control experiment, directly reflects the impact of decreased aerosol size on cloud lifetime. Compared to increased aerosol size, decreased aerosol size has a smaller impact on the magnitude of cloud lifetime. The resulting higher Scrit generally inhibits the development of cloud droplets, leading to an average 16 % reduction in cloud lifetime. Notably, while generally shortening cloud lifetime, decreased aerosol size shows a clear prolonging effect on cloud lifetime at extremely low (<102.85 (approx. 708) cm−3) and extremely high (>103.8 cm−3) Na. The extension of cloud lifetime at extremely low Na is caused by the inhibition of evaporation, while the extension at extremely high Na stems from the mitigation of the excessive inhibition of small aerosol activation and small cloud droplet existence by an overabundance of large cloud droplets, as seen in the SIZE_LARGE experiment.
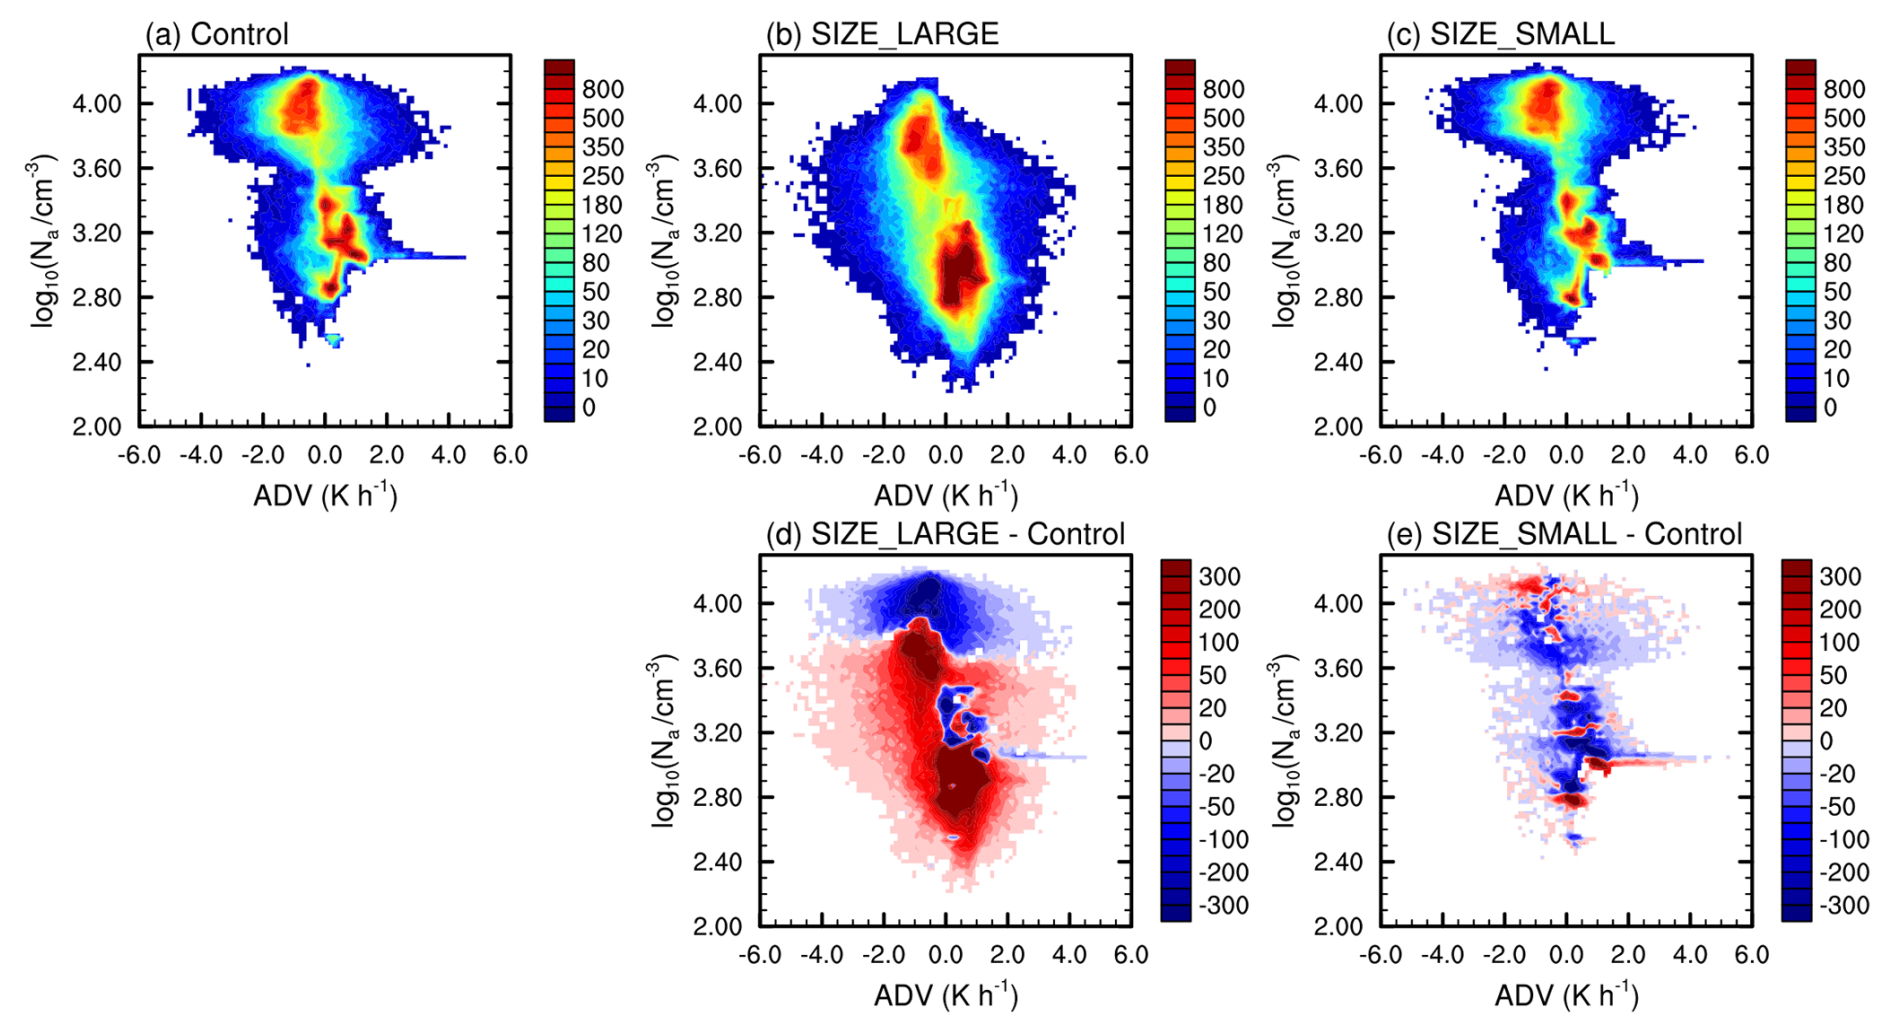
Figure 8Variation of cloud lifetime (characterized by liquid-phase cloud sample count) with ADV and Na. (a), (b), (c), (d), and (e) are the results of the Control, SIZE_LARGE, and SIZE_SMALL experiments, and the differences of SIZE_LARGE and SIZE_SMALL experiments relative to the Control experiment, respectively.
To quantitatively analyze the relative variations of cloud properties with ADV and Na, we grouped the vertically weighted average cloud properties across all cloud layers following the same binning approach as previously described. To prevent individual outliers from skewing the average trends, ADV and Na bins with sample sizes smaller than 5 are excluded from the calculations. Based on this filtering, the variations in cloud properties are calculated as a function of ADV under low (<103 cm−3), moderate (103 to 103.5 cm−3), and high (>103.5 cm−3) Na conditions, as well as a function of Na under cold (ADV < 0) and warm (ADV > 0) advection.
As shown in Fig. 9, the impact of increased aerosol size on Nd is most intense under low and moderate Na conditions. The most significant effect occurs in moderate Na and under cold advection environments, with Nd increasing by more than 10 times, while under high Na conditions, the change in Nd caused by increased aerosol size fluctuates within a range of ±100 %. Conversely, decreased aerosol size leads to a 30 %–80 % reduction in Nd in moderate-to-high Na environments, with quite weak dependency on ADV. For low Na environments, Nd increases and decreases depending on the ADV condition, and the most notable case increases Nd by over 100 % at an ADV of 1 K h−1. CER exhibits an opposite trend in response to the changes in Nd. Furthermore, regarding the variations with Na, the differences between cold and warm advection are mainly reflected in the detailed changes, while the overall trends remain consistent. This once again demonstrates that the variation trend of liquid-phase clouds in the ECO region under the winter monsoon background is dominated by aerosols, with meteorological conditions modulating the magnitude of these changes.
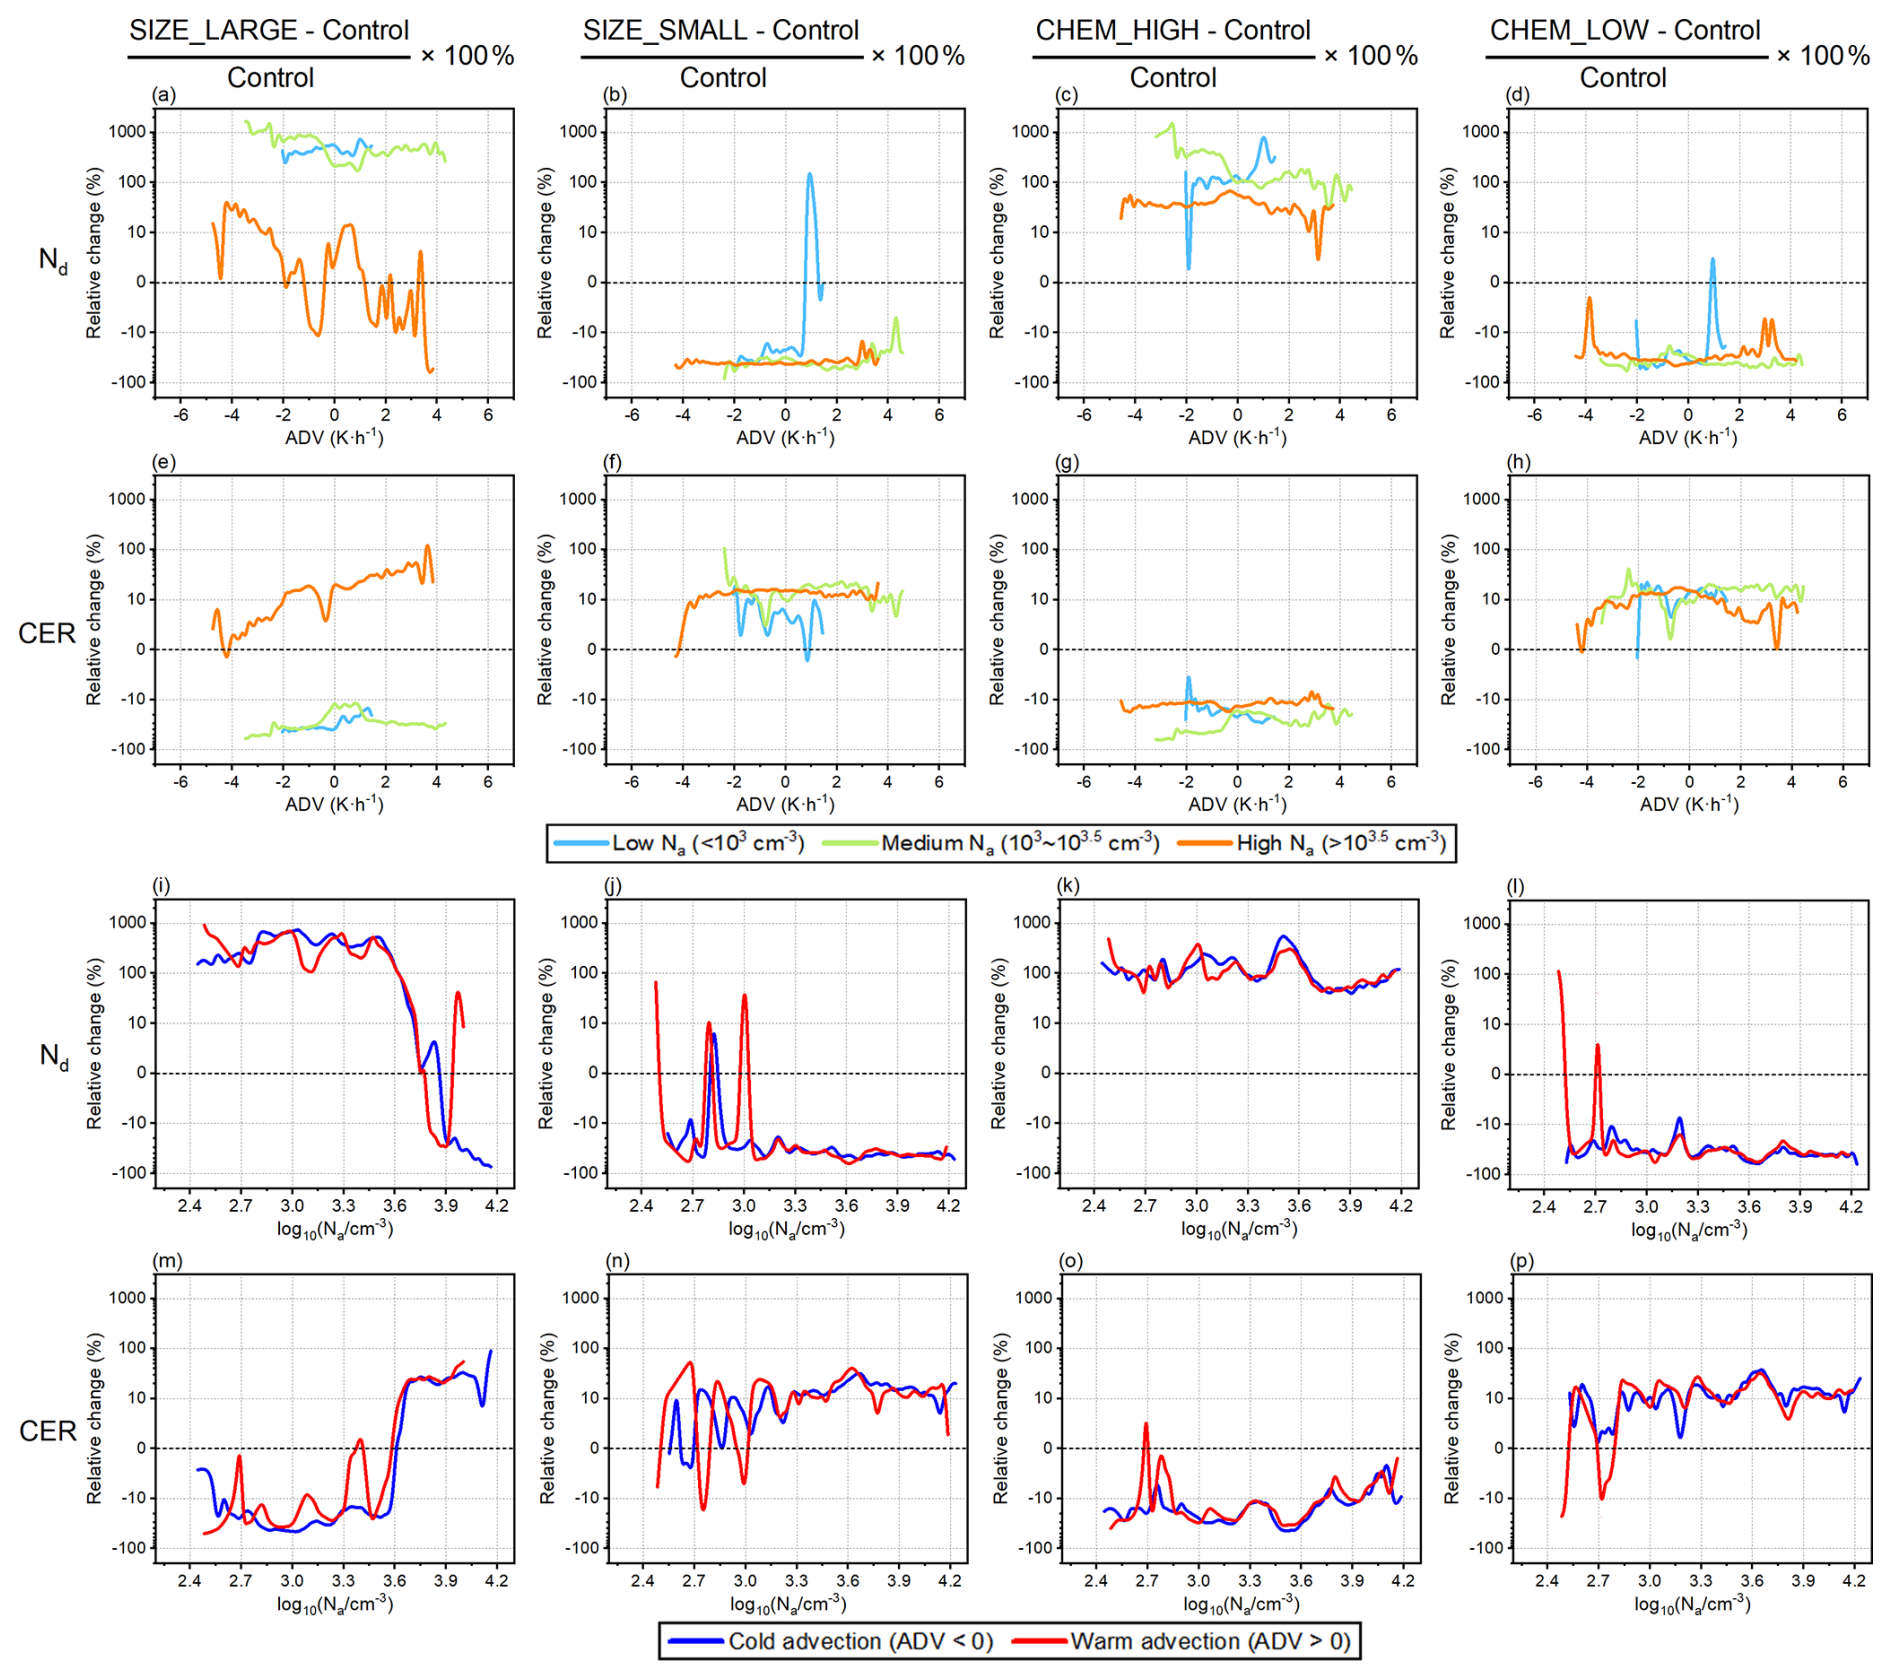
Figure 9Percentage changes in Nd (a–d, i–l) and CER (e–h, m–p) for the SIZE_LARGE (first column), SIZE_SMALL (second column), CHEM_HIGH (third column), and CHEM_LOW (fourth column) experiments relative to the Control experiment. Upper two rows: dependence on ADV (x axis) for different Na conditions; lower two rows: dependence on Na (x axis) for different ADV conditions.
In response to the alterations in cloud droplet number and size induced by changes in aerosol size, CLWC exhibits highly non-linear variations (Fig. 10). The overall impact of increased aerosol size is a relatively stable increase in CLWC under moderate and high Na, accompanied by intense fluctuations under low and extremely high Na. The most significant effect occurs in low Na environments under warm advection, which can increase CLWC by nearly 200 %. On the other hand, decreased aerosol size results in an overall reduction in CLWC under moderate and high Na. The most pronounced weakening effect emerges under high Na and strong cold advection, where it can reduce CLWC by over 50 % by suppressing in-cloud collision-coalescence. Under low Na, a reduction in aerosol size leads to an increase in CLWC across a wider range of meteorological conditions, with the maximum increase exceeding 100 % (under a weak warm advection of 1 K h−1).
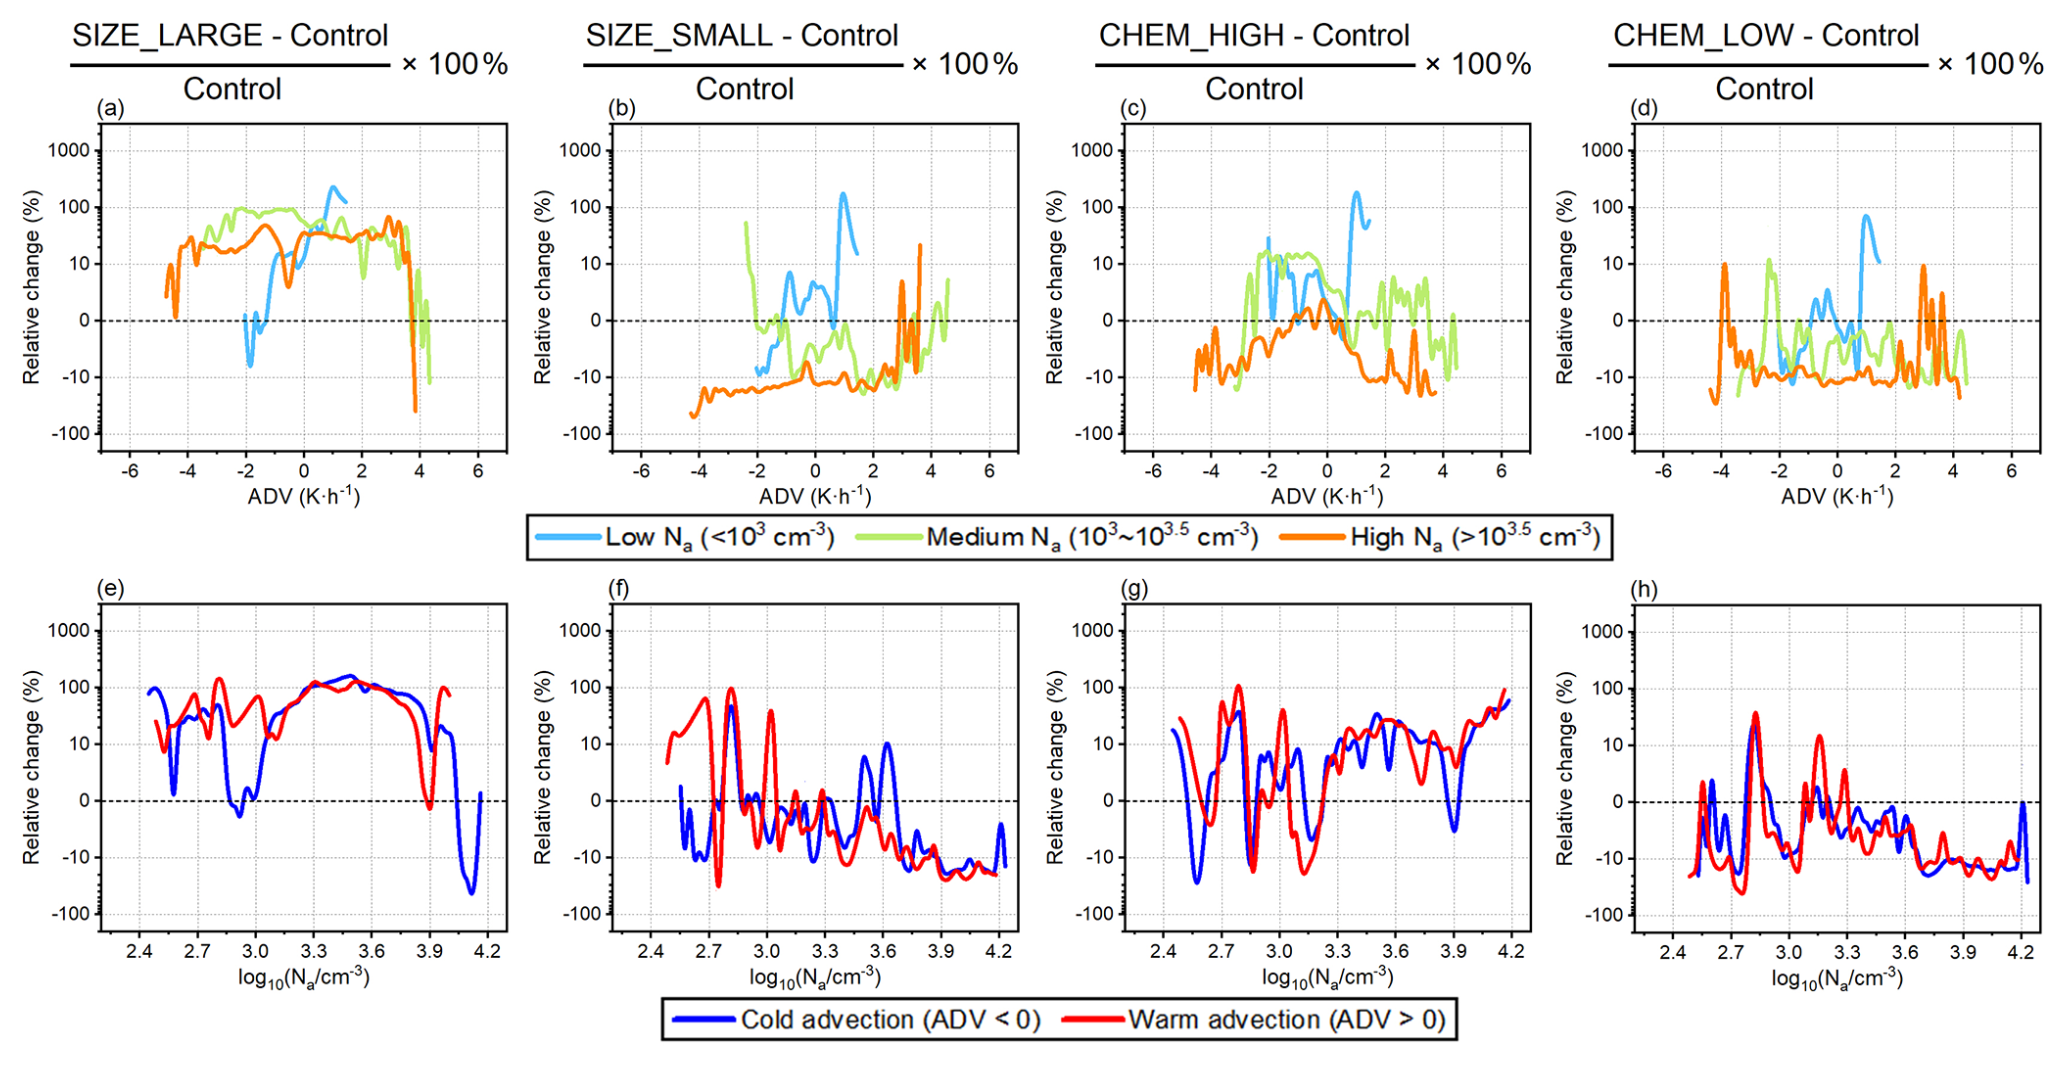
Figure 10Percentage changes in CLWC for the SIZE_LARGE (first column), SIZE_SMALL (second column), CHEM_HIGH (third column), and CHEM_LOW (fourth column) experiments relative to the Control experiment. The first row: dependence on ADV (x axis) for different Na conditions; the second row: dependence on Na (x axis) for different ADV conditions.
3.3 The effect of aerosol chemical composition
Aerosol chemical composition influences Scrit by determining the hygroscopicity of particulate matter, thereby regulating the cloud droplet spectrum and subsequent cloud development. In order to understand how the different aerosol chemical compositions impact ACI, we conduct two sensitivity experiments, i.e., CHEM_HIGH (with increased aerosol hygroscopicity), and CHEM_LOW (with decreased hygroscopicity). By comparing these with the results from the Control experiment, we examine how ACI is sensitive to aerosol hygroscopicity (here representative of aerosol chemical composition).
For the ECO region average (Fig. 11), increased and decreased aerosol hygroscopicity lead to an increase in Nd of 53 % and a decrease of 43 %, respectively (increased and decreased aerosol size lead to an increase in Nd of 92 % and a decrease of 49 %, respectively), indicating that the overall impact of aerosol hygroscopicity on Nd is comparable to that of aerosol size.
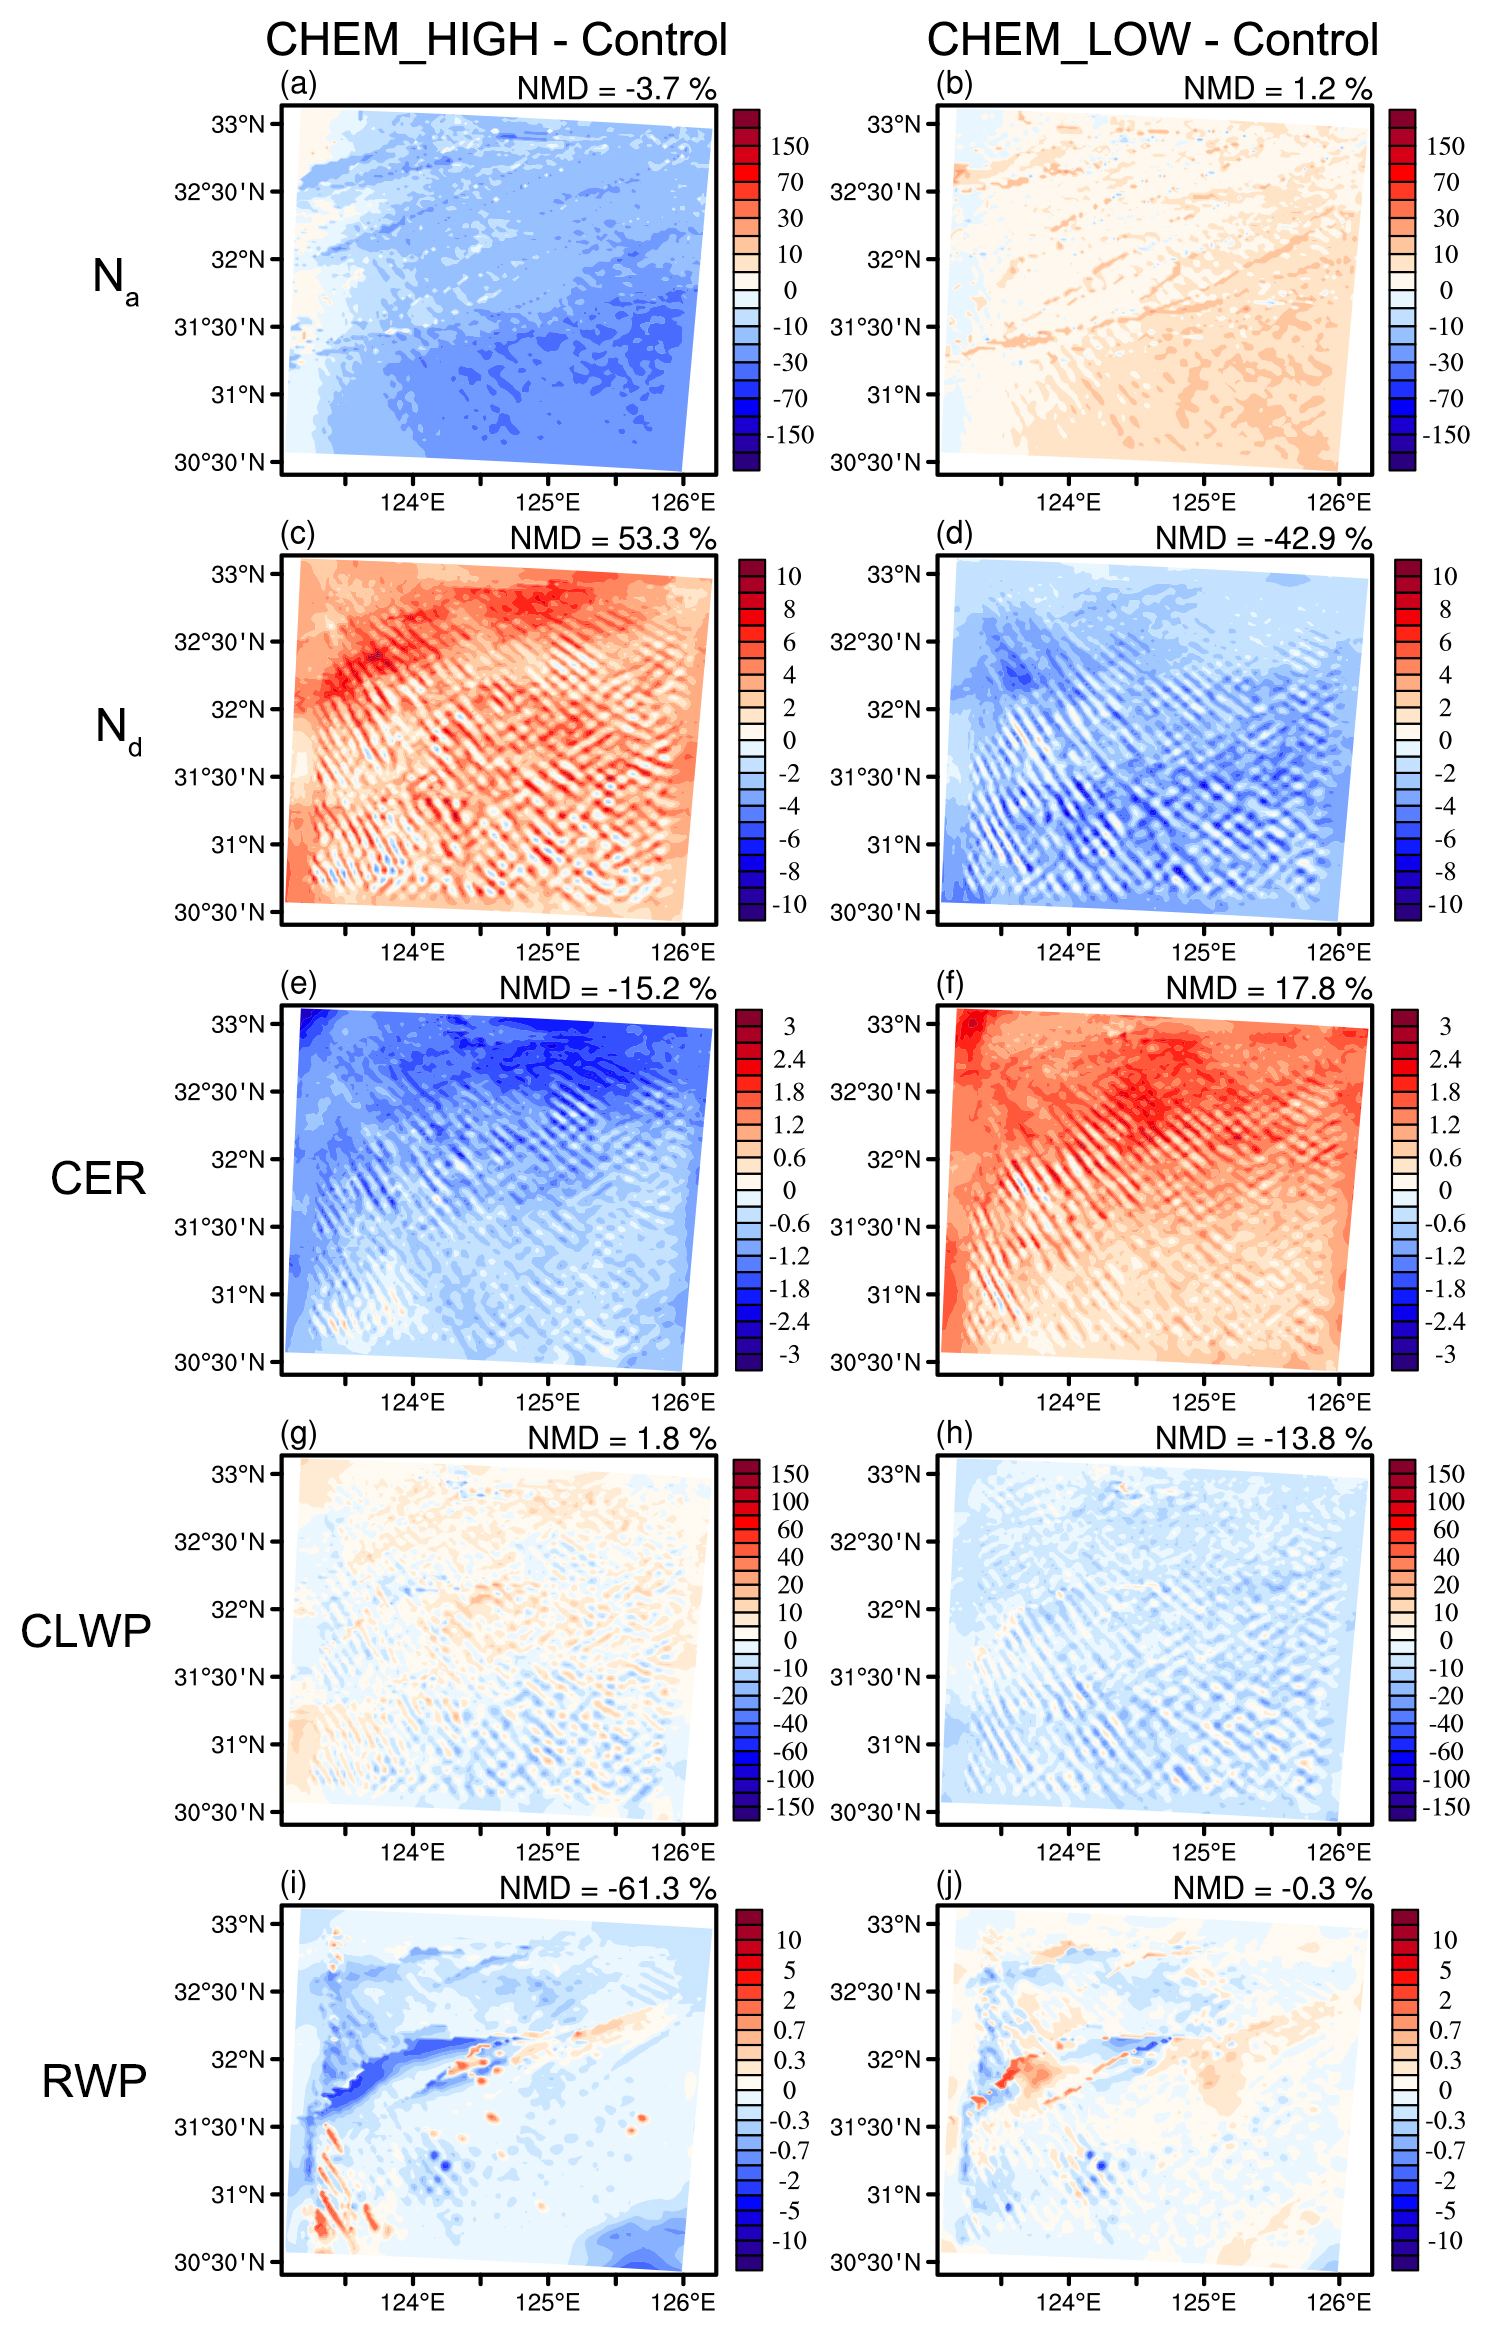
Figure 11Same as Fig. 3, but showing differences in each variable (Na: a–b, in cm−3; Nd: c–d, in cm−3; CER: e–f, in µm; CLWP: g–h, in g m−2; RWP: i–j, in g m−2) between the CHEM_HIGH (left column) and CHEM_LOW (right column) experiments and the Control experiment.
Increased aerosol hygroscopicity (left column of Fig. 11) leads to a decrease in CER accompanied by an increase in Nd, with a regional average decrease of 15 %. A relative balance is reached between the increase in cloud droplet number and the decrease in size, resulting in a very small change in CLWP, which increases by only 2,%. Simultaneously, the reduction in cloud droplet size causes significant inhibition of precipitation in the ECO, leading to a 61 % reduction in RWP. Decreased aerosol hygroscopicity (right column of Fig. 11) causes a 43 % reduction in Nd, an 18 % increase in CER, and 14 % and 0.3 % decreases in CLWP and RWP, respectively.
Figure 11 shows that increased hygroscopicity leads to a relatively high reduction in RWP (61 %), while decreased aerosol hygroscopicity only has a trivial impact on RWP (0.3 %). The former is attributed to the suppression of precipitation caused by decreased cloud droplet size, whereas the latter results from the offsetting effects of increased cloud droplet size and decreased cloud water. Na in the sensitivity experiments remains unchanged relative to the Control. The reason is that the local wet deposition in the ECO region caused by the weak precipitation in the Control, CHEM_HIGH, and CHEM_LOW experiments has a very small impact. The changes in Na in this region caused by variations in aerosol hygroscopicity primarily stem from its influence on wet deposition and transport in the outer layers of the simulation domain. Similar to the Na changes under the influence of aerosol size described in Sect. 3.2, the changes in transport from the outer to the inner layers of the simulation domain caused by variations in aerosol hygroscopicity have almost no impact on Na during cloud-free periods or its change trends in the ECO region (Fig. S3). Furthermore, similar to spatial distribution variations, changes in aerosol chemical composition primarily influence meteorological-aerosol-cloud interactions by altering cloud droplet number and size. These changes exert minimal effects on CLWP and provide only weak feedback to meteorological conditions.
The three-dimensional variations of cloud properties with meteorology, aerosols, and cloud parts further reveal the influence mechanism of aerosol chemical composition on aerosol-cloud interactions (Fig. 12). Increased aerosol hygroscopicity (CHEM_HIGH) leads to an increase in Nd and a decrease in CER, while decreased hygroscopicity (CHEM_LOW) exhibits the opposite effect. These two effects are driven by the decrease and increase in Scrit resulting from increased and decreased hygroscopicity, respectively. The magnitudes of both the increase and decrease in Nd scale with Na, whereas the corresponding reduction and enhancement in CER peak in condensation-dominated low Na environments. Increased hygroscopicity leads to an overall increase in CLWC (Fig. 13, left column). This increase is particularly pronounced within the collision-coalescence-dominated cloud interior and at the cloud base in high Na environments, as well as at the cloud top under moderate and low Na conditions. However, at the cloud base under low Na and at the cloud top under high Na, CLWC decreases due to a sharp decline in CER and strong cloud-top entrainment associated with low CER, respectively. By causing a substantial decrease in Nd, decreased hygroscopicity generally reduces CLWC. However, at the cloud top, as well as at the cloud base and within the cloud interior under low Na conditions, the increase in CER induced by decreased hygroscopicity suppresses evaporation, thereby leading to an increase in CLWC in a relatively large number of cases.
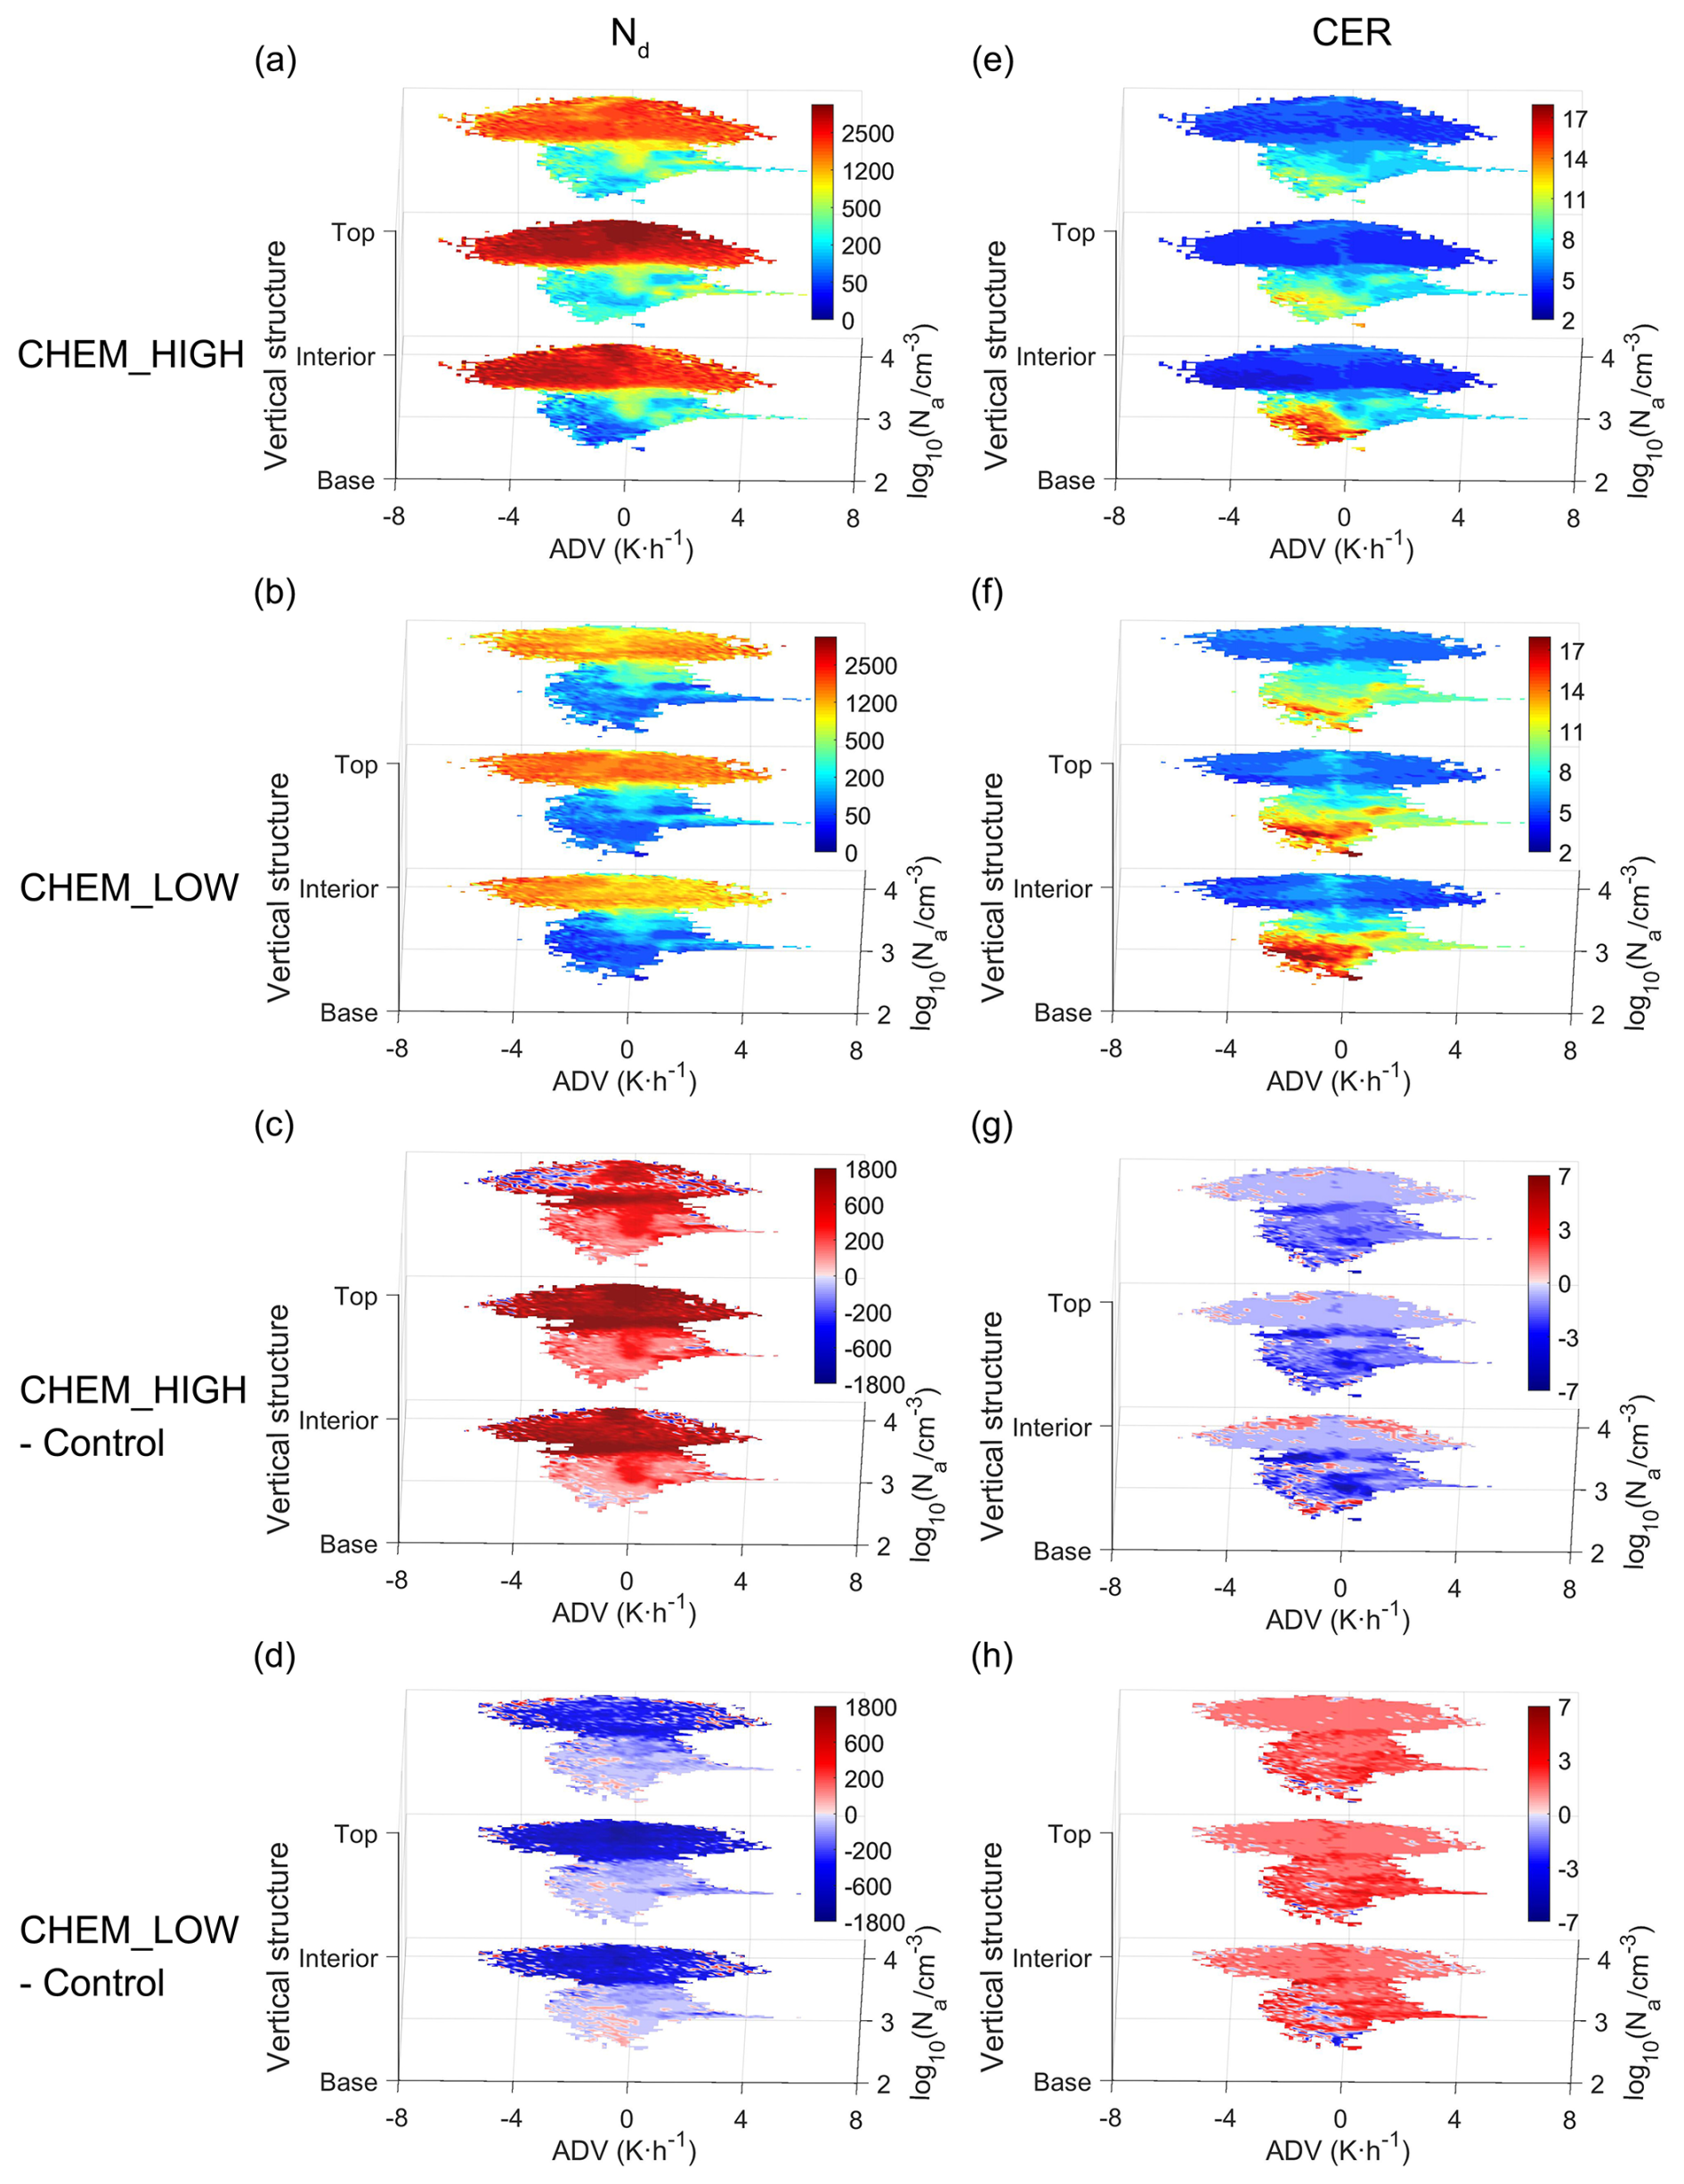
Figure 12Variation of Nd (left column, in cm−3) and CER (right column, in µm) with Na, ADV and cloud parts for the CHEM_HIGH (a, e) and CHEM_LOW (b, f) experiments, and the differences of the CHEM_HIGH (c, g) and CHEM_LOW (d, h) experiments relative to the Control experiment.
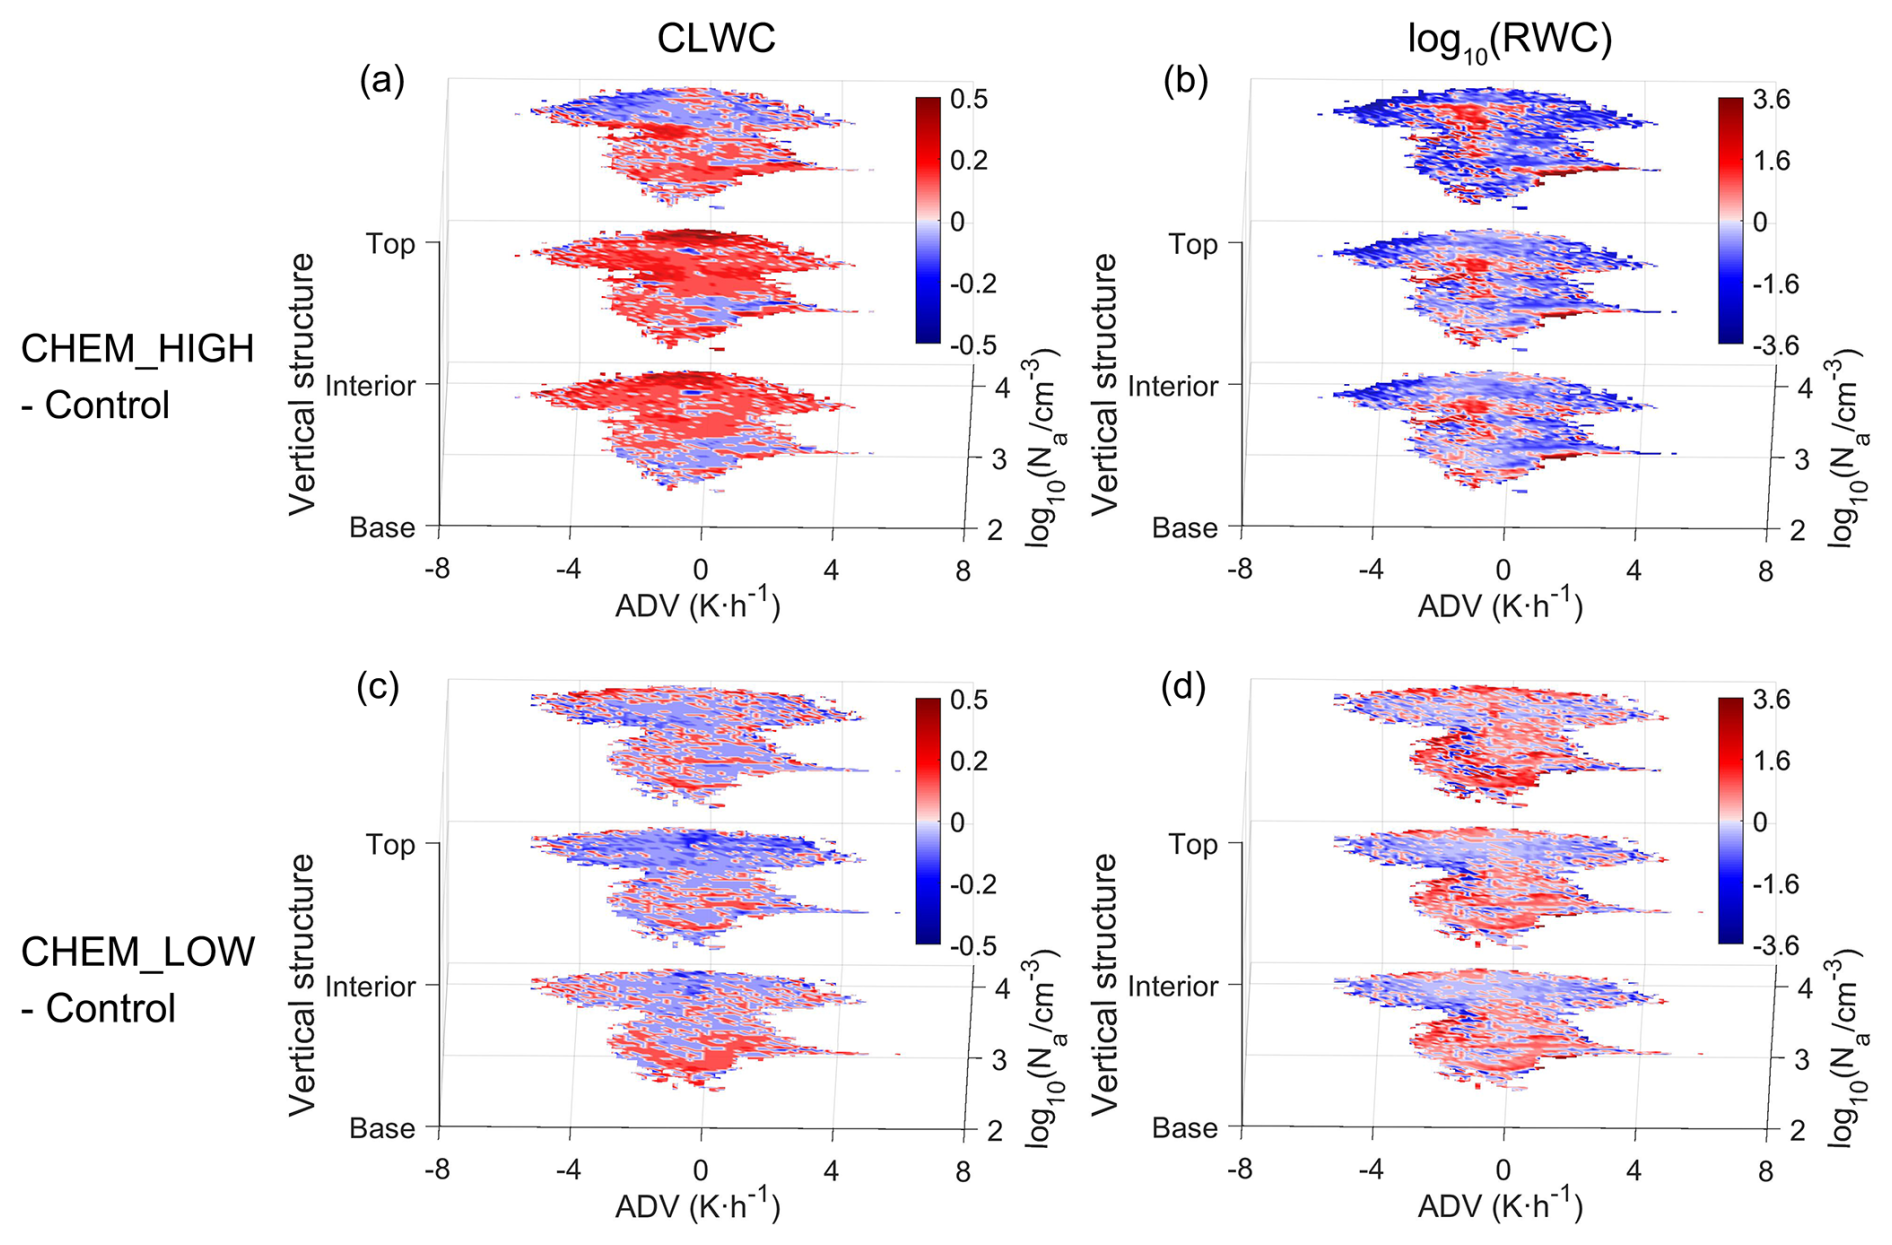
Figure 13Differences between the CHEM_HIGH (a–b) and CHEM_LOW (c–d) experiments and the Control experiment in CLWC (left column, unit: g m−3) and RWC (right column, unit: g m−3, presented logarithmically in base 10) as a function of Na, ADV and cloud parts.
Compared to the significant increase in RWC caused by the strong promotion of cloud development by increased aerosol size, the impact of aerosol hygroscopicity (Fig. 13, right column) is similar to that of decreased aerosol size, causing RWC to both increase and decrease depending on the environment. Specifically, an increase in aerosol hygroscopicity leads to an overall decrease in RWC. However, in middle-to-high Na (103 to 103.5 cm−3) environments where CLWC is reduced due to weakened condensation and insufficient collision-coalescence intensity, the resulting increase in cloud droplets effectively enhances collision-coalescence, thereby causing an increase in RWC. Under the influence of decreased aerosol hygroscopicity, RWC generally decreases in high Na (>103.5 cm−3) environments due to weakened collision-coalescence, while RWC generally increases in low Na (<103.5 cm−3) environments due to weakened evaporation and increased CER.
Aerosol chemical composition also exerts an influence on cloud lifetime by affecting the cloud droplet spectrum and subsequently cloud microphysical processes (Fig. 14). Although it does not significantly alter the trends of cloud droplets and cloud water across environments as the increase in aerosol size does, the increase in aerosol hygroscopicity exhibits a cloud lifetime impact mechanism similar to that of increased aerosol size. Specifically, by lowering the Scrit, it broadens the meteorological conditions available for cloud formation in low to moderate Na (<103.8 cm−3) environments and generally prolongs cloud lifetime, while shortening cloud lifetime in high Na environments. Compared to the increase in aerosol size, the broadening of meteorological conditions for cloud formation caused by increased aerosol hygroscopicity in low to moderate Na environments is less extensive. In high Na environments, unlike the cloud lifetime reduction caused by the inhibition of small droplets by an overabundance of large cloud droplets when aerosol size increases, the reduction in cloud lifetime due to increased aerosol hygroscopicity is primarily driven by the substantial decrease in small cloud droplets from evaporation caused by excessively low CER. Increased aerosol hygroscopicity leads to an increase in the number of liquid-phase cloud samples by generally prolonging cloud lifetime and broadening the meteorological conditions for cloud formation, but the increment (5 %) is much lower than that of increased aerosol size (85 %). Decreased aerosol hygroscopicity exhibits a cloud lifetime effect highly consistent with that of decreased aerosol size. The difference lies in its relatively weak impact on the initial size of cloud droplets, which results in a smaller reduction in cloud lifetime (9 %) compared to that of decreased aerosol size (16 %).
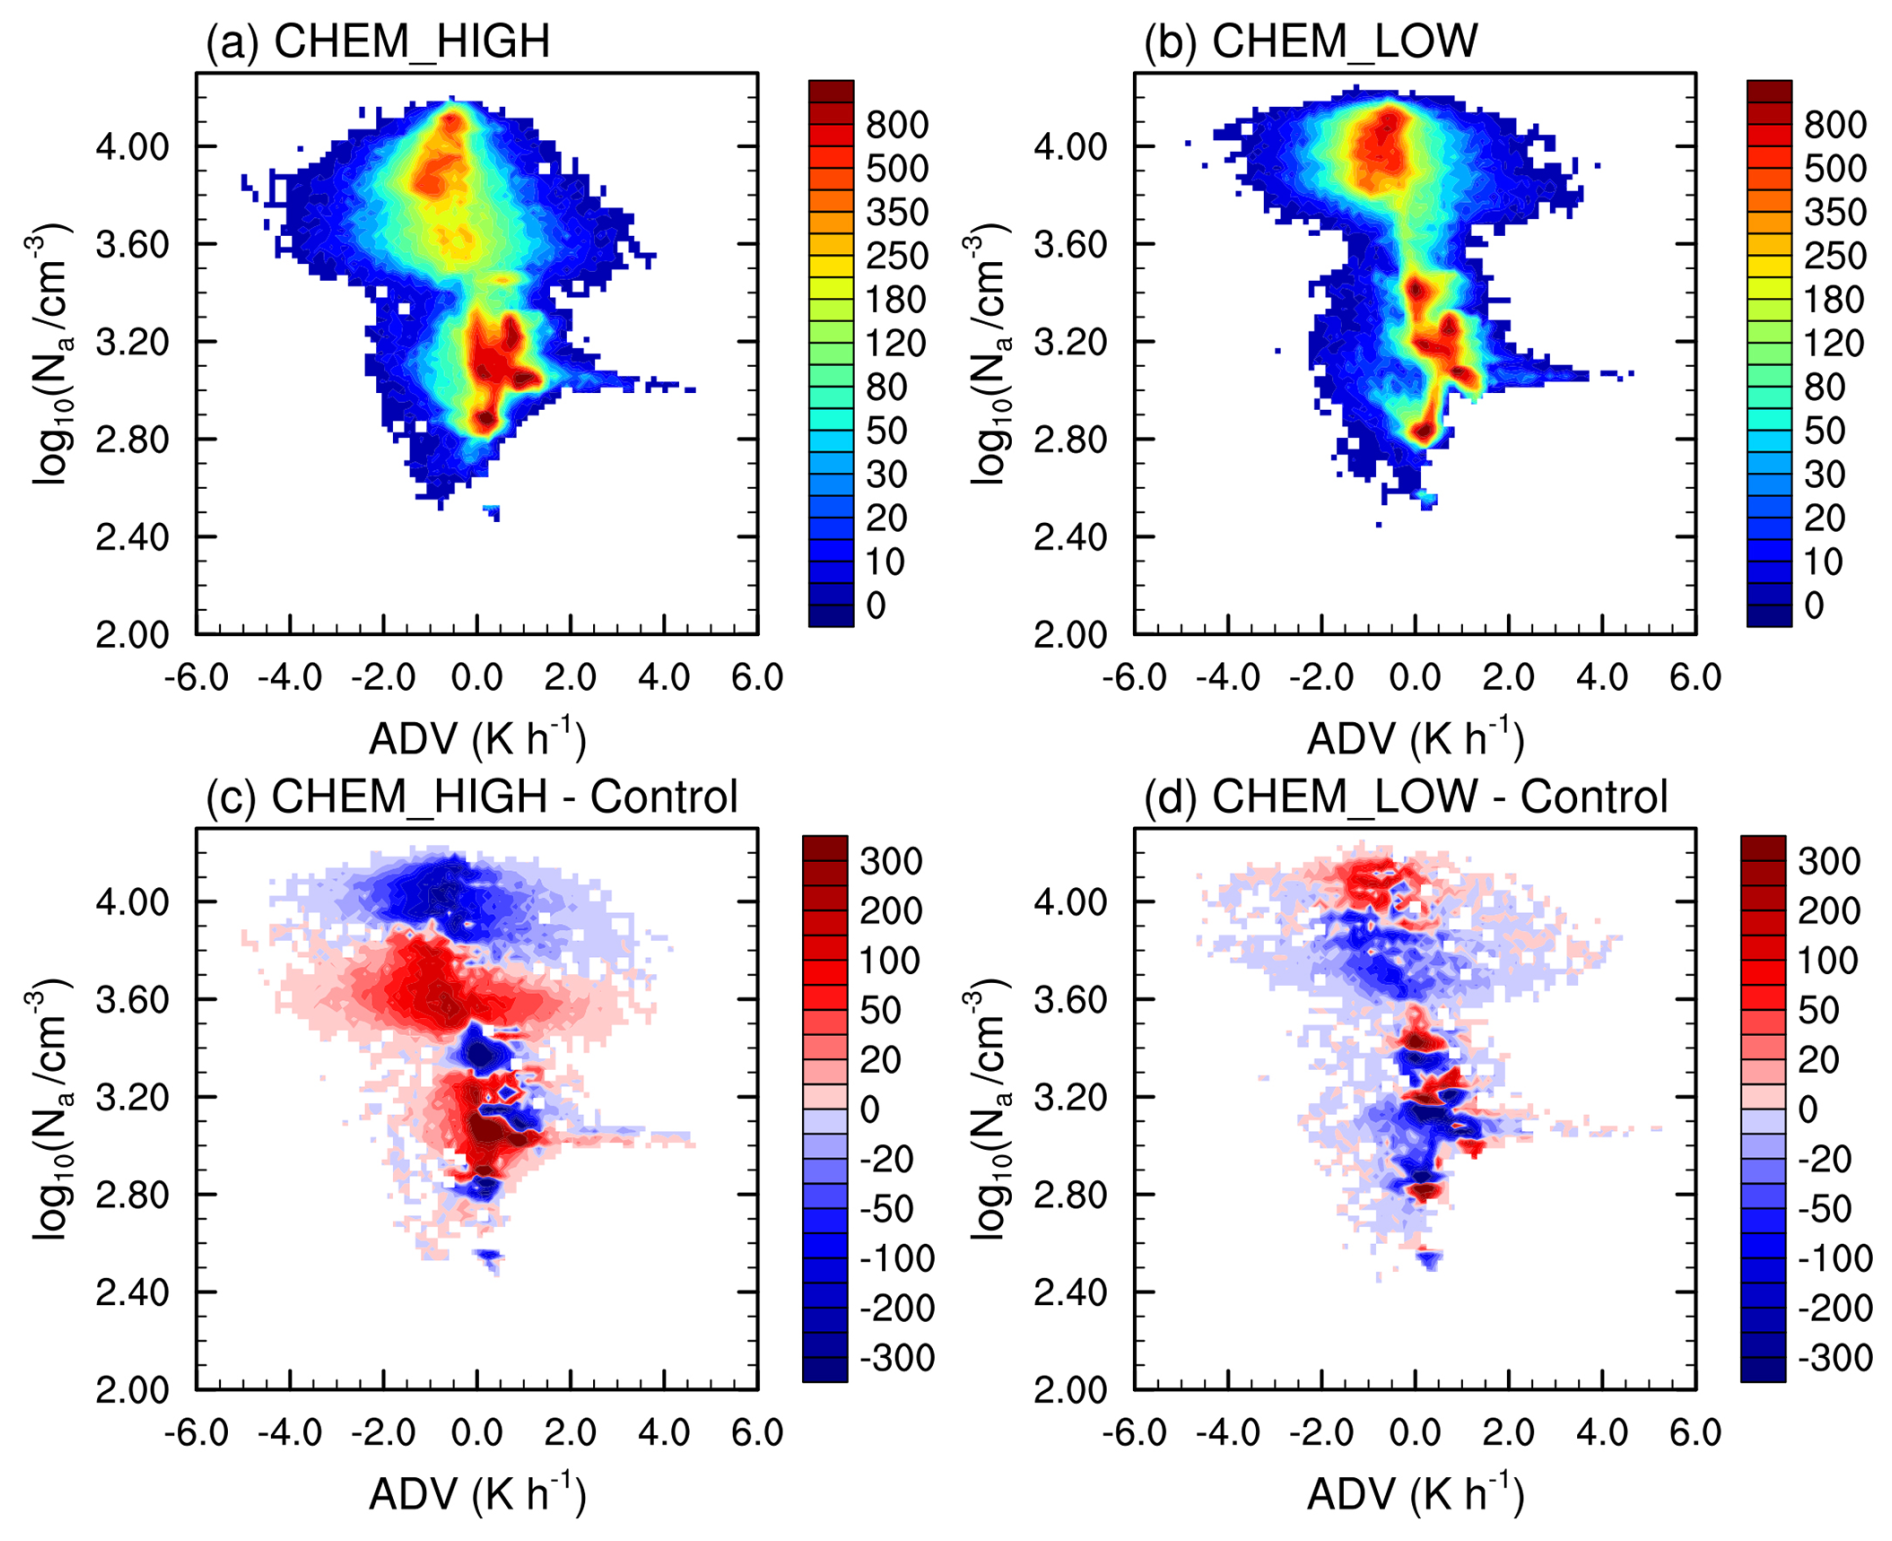
Figure 14Variation of cloud lifetime (characterized by liquid-phase cloud sample count) with ADV and Na. (a), (b), (c), and (d) are the results of the CHEM_HIGH and CHEM_LOW experiments and the differences of the CHEM_HIGH and CHEM_LOW experiments relative to the Control experiment, respectively.
In terms of quantitative impacts, increased hygroscopicity produces the strongest overall enhancement in Nd under moderate Na conditions (Fig. 9, third column), and the most pronounced effect occurs under cold advection of −3 K h−1, where Nd increases by a factor of over 10. The increase in Nd under high Na environments is the weakest due to a limited supply of supersaturated water vapor. Correspondingly, the reduction in CER is most pronounced under moderate Na conditions, where the decrease can exceed 50 % under cold advection of less than 2.5 K h−1. Regarding CLWC (Fig. 10, third column), the enhancement induced by increased hygroscopicity is most intense under low Na, with the maximum increase exceeding 100 % (at an ADV of 1 K h−1). This is followed by the overall increase under moderate Na, while high Na conditions generally demonstrate a minor weakening effect (within 20 %). Decreased hygroscopicity influences Nd and CER in a pattern similar to that of decreased aerosol size, although the resulting variation magnitude is relatively smaller (Fig. 9, fourth column). The corresponding reduction in CLWC (Fig. 10, fourth column) is most pronounced under high Na (10 %–20 %), followed by moderate Na. Under low Na conditions, the overall reduction is the weakest, and instances of CLWC enhancement occur relatively frequently, reaching a maximum increase of over 70 % (at an ADV of 1 K h−1).
Aerosol physico-chemical properties serve as key factors in aerosol activation and play a pivotal role in cloud formation and development. Although researchers have conducted quite a lot of studies on the impacts of aerosol physicochemical properties on clouds, limitations remain regarding the accuracy and comprehensiveness of quantitative insights. Specifically, these limitations stem from external interferences encountered during in-situ observational analyses, the insufficient accuracy of bulk and offline bin simulations, and a lack of comprehensive analysis regarding how physicochemical properties alter cloud responses to aerosols, under what conditions they exert significant impacts, and the relative contributions of aerosol size versus chemical composition. By employing WRF-Chem-SBM to simulate and conduct sensitivity experiments on a typical winter liquid-phase cloud case over the ECO region – which is characterized by abundant meteorological, aerosol, and cloud variations – we address the aforementioned issues based on a quantitative analysis of how the variations in aerosol size (average rv increased by 1.2 times and decreased by 45 %) and hygroscopicity (average hv increased by 2.2 times and decreased by 62 %) impact cloud properties.
The results indicate that the variations in aerosol size can exert crucial impacts on cloud development. In particular, increased aerosol size distinctly alters the variation trends of cloud properties with environmental conditions. Overall, increased aerosol size would lead to substantial enhancements in Nd, CLWC, and cloud lifetime by decreasing Scrit and enhancing initial cloud droplet size. The most pronounced impact occurs in moderate-Na environments, where Nd increases by 10 times and CLWC increases by 100 %. Conversely, decreased aerosol size generally induces a reduction in Nd, CLWC, and cloud lifetime, with the strongest weakening occurring in moderate-to-high Na environments, where Nd is reduced by 80 % and CLWC by 50 %. Similar to Liang et al. (2026), our study demonstrates that aerosol size impacts clouds by modulating microphysical processes. However, distinct from Liang et al. (2026) and Zhao et al. (2025c), who investigated the varying impacts of aerosol properties based on land-sea contrasts, the present study focuses on liquid-phase cloud processes over the ECO region. Because this region is simultaneously influenced by both continental and marine aerosols (with their relative contributions varying alongside meteorological conditions), our approach enables a quantitative analysis of aerosol size effects on a unified baseline with relatively weak external perturbations (such as surface effect).
Our study indicates that the impact of aerosol hygroscopicity on clouds is relatively weak compared to the impact of aerosol size, which is consistent with previous studies. However, we found that hygroscopicity can exert profound impacts on cloud properties under specific meteorological conditions and across various cloud parts. Specifically, increased hygroscopicity leads to a substantial increase in Nd and a decrease in CER and RWP. The most pronounced impact of increased hygroscopicity emerges in moderate-Na environments under cold advection, where Nd increases by up to 10 times. In contrast, decreased hygroscopicity leads to a reduction in Nd and CLWC and an increase in CER.
It should be noted that our study focuses on ECO under winter monsoon conditions, during which aerosols over the study region and period are dominated by anthropogenic emissions from EC and the atmosphere is relatively stable. The impacts of varying aerosol physicochemical properties might change under other conditions (e.g., different aerosol types dominate, and/or strong updrafts). Further exploration of these issues will enhance the systematicity and accuracy of our understanding regarding aerosol physicochemical properties, thereby reducing the associated uncertainties in aerosol-cloud interactions.
The WRF-Chem model code can be downloaded from https://www2.mmm.ucar.edu/wrf/users/download/get_sources.html (last access: 18 March 2026). The WRF-Chem-SBM model code can be obtained by contacting Jiwen Fan (https://www.anl.gov/profile/jiwen-fan, last access: 18 March 2026) of Argonne National Laboratory.
NCEP data sets (https://doi.org/10.5065/39C5-Z211, Satellite Services Division et al., 2004; https://doi.org/10.5065/4F4P-E398, NCEP et al., 2004; https://doi.org/10.5065/D65Q4T4Z, NCEP et al., 2015) and CAM-chem model output (https://doi.org/10.5065/NMP7-EP60, Buchholz et al., 2019) data can be accessed from the corresponding websites or references.
Figures S1–S3 and Table S1 are provided in the supplement file. The supplement related to this article is available online at https://doi.org/10.5194/acp-26-15117-2026-supplement.
JZ and XM designed and conducted the model experiments, analyzed the results, and were the primary contributors to the manuscript. XM developed the project idea and supervised the project. XM and HJ provided scientific suggestions and revised the manuscript. TY, PZ, and YK assisted with data processing and visualization, as well as manuscript preparation.
At least one of the (co-)authors is a member of the editorial board of Atmospheric Chemistry and Physics. The peer-review process was guided by an independent editor, and the authors also have no other competing interests to declare.
Publisher's note: Copernicus Publications remains neutral with regard to jurisdictional claims made in the text, published maps, institutional affiliations, or any other geographical representation in this paper. The authors bear the ultimate responsibility for providing appropriate place names. Views expressed in the text are those of the authors and do not necessarily reflect the views of the publisher.
The numerical calculations in this paper were conducted in the High-Performance Computing Center of Nanjing University of Information Science & Technology. We express our gratitude to Dr. Jiwen Fan of Argonne National Laboratory for providing the code for the WRF-Chem-SBM model. We are grateful to the National Centers for Environmental Prediction and the MEIC support team, for providing the FNL and observation subsets and MEIC emission inventory, respectively.
This research has been supported by the National Natural Science Foundation of China (grant nos. 42575082 and 42061134009), and the Shanxi Provincial Basic Research Program (No. 202503011232005).
This paper was edited by Markus Petters and reviewed by two anonymous referees.
Andersen, H., Cermak, J., Fuchs, J., Knutti, R., and Lohmann, U.: Understanding the drivers of marine liquid-water cloud occurrence and properties with global observations using neural networks, Atmos. Chem. Phys., 17, 9535–9546, https://doi.org/10.5194/acp-17-9535-2017, 2017.
Anwar, K., Alam, K., Liu, Y., Huang, Z., Huang, J., and Liu, Y.: Analysis of aerosol cloud interactions with a consistent signal of meteorology and other influencing parameters, Atmos. Res., 275, 106241, https://doi.org/10.1016/j.atmosres.2022.106241, 2022.
Buchholz, R., Emmons, L., Tilmes, S., and the CESM2 Development Team: CESM2.1/CAM-chem Instantaneous Output for Boundary Conditions, UCAR/NCAR–Atmospheric Chemistry Observations and Modeling Laboratory [data set], https://doi.org/10.5065/NMP7-EP60,2019.
Bulatovic, I., Igel, A. L., Leck, C., Heintzenberg, J., Riipinen, I., and Ekman, A. M. L.: The importance of Aitken mode aerosol particles for cloud sustenance in the summertime high Arctic – a simulation study supported by observational data, Atmos. Chem. Phys., 21, 3871–3897, https://doi.org/10.5194/acp-21-3871-2021, 2021.
Chelani, A. B., Vyawahare, R. V., and Gautam, S.: Aerosol Variability and Its Impact on Cloud-Precipitation Interaction in Urban Areas of Maharashtra, India, in: Aerosol Optical Depth and Precipitation: Measuring Particle Concentration, Health Risks and Environmental Impacts, edited by: Gautam, S., Kumar, R. P., and Samuel, C., Springer Nature Switzerland, Cham, 33–53, https://doi.org/10.1007/978-3-031-55836-8_3, 2024.
Chen, Y.-C., Xue, L., Lebo, Z. J., Wang, H., Rasmussen, R. M., and Seinfeld, J. H.: A comprehensive numerical study of aerosol-cloud-precipitation interactions in marine stratocumulus, Atmos. Chem. Phys., 11, 9749–9769, https://doi.org/10.5194/acp-11-9749-2011, 2011.
Chen, Y. Y., Yang, K., Zhou, D. G., Qin, J., and Guo, X. F.: Improving the Noah Land Surface Model in Arid Regions with an Appropriate Parameterization of the Thermal Roughness Length, J. Hydrometeorol., 11, 995–1006, https://doi.org/10.1175/2010jhm1185.1, 2010.
Dusek, U., Frank, G. P., Hildebrandt, L., Curtius, J., Schneider, J., Walter, S., Chand, D., Drewnick, F., Hings, S., Jung, D., Borrmann, S., and Andreae, M. O.: Size Matters More Than Chemistry for Cloud-Nucleating Ability of Aerosol Particles, Science, 312, 1375–1378, https://doi.org/10.1126/science.1125261, 2006.
Ekman, A. M. L., Engström, A., and Söderberg, A.: Impact of Two-Way Aerosol–Cloud Interaction and Changes in Aerosol Size Distribution on Simulated Aerosol-Induced Deep Convective Cloud Sensitivity, J. Atmos. Sci., 68, 685–698, https://doi.org/10.1175/2010JAS3651.1, 2011.
Emmons, L. K., Schwantes, R. H., Orlando, J. J., Tyndall, G., Kinnison, D., Lamarque, J., Marsh, D., Mills, M. J., Tilmes, S., and Bardeen, C.: The chemistry mechanism in the community earth system model version 2 (CESM2), J. Adv. Model. Earth Syst., 12, e2019MS001882, https://doi.org/10.1029/2019MS001882, 2020.
Fan, J. W., Leung, L. R., Li, Z. Q., Morrison, H., Chen, H. B., Zhou, Y. Q., Qian, Y., and Wang, Y.: Aerosol impacts on clouds and precipitation in eastern China: Results from bin and bulk microphysics, J. Geophys. Res.-Atmos., 117, D00K36, https://doi.org/10.1029/2011jd016537, 2012.
Fan, J. W., Liu, Y. C., Xu, K. M., North, K., Collis, S., Dong, X. Q., Zhang, G. J., Chen, Q., Kollias, P., and Ghan, S. J.: Improving representation of convective transport for scale-aware parameterization: 1. Convection and cloud properties simulated with spectral bin and bulk microphysics, J. Geophys. Res.-Atmos., 120, 3485–3509, https://doi.org/10.1002/2014jd022142, 2015.
Fan, J. W., Wang, Y., Rosenfeld, D., and Liu, X.: Review of Aerosol–Cloud Interactions: Mechanisms, Significance, and Challenges, J. Atmos. Sci., 73, 4221–4252, https://doi.org/10.1175/JAS-D-16-0037.1, 2016.
Fuentes, E., Coe, H., Green, D., and McFiggans, G.: On the impacts of phytoplankton-derived organic matter on the properties of the primary marine aerosol – Part 2: Composition, hygroscopicity and cloud condensation activity, Atmos. Chem. Phys., 11, 2585–2602, https://doi.org/10.5194/acp-11-2585-2011, 2011.
Gao, W. H., Fan, J. W., Easter, R. C., Yang, Q., Zhao, C., and Ghan, S. J.: Coupling spectral-bin cloud microphysics with the MOSAIC aerosol model in WRF-Chem: Methodology and results for marine stratocumulus clouds, J. Adv. Model. Earth Syst., 8, 1289–1309, https://doi.org/10.1002/2016ms000676, 2016.
Geresdi, I., Mészáros, E., and Molnár, A.: The effect of chemical composition and size distribution of aerosol particles on droplet formation and albedo of stratocumulus clouds, Atmos. Environ., 40, 1845–1855, https://doi.org/10.1016/j.atmosenv.2005.11.012, 2006.
Grell, G. A. and Freitas, S. R.: A scale and aerosol aware stochastic convective parameterization for weather and air quality modeling, Atmos. Chem. Phys., 14, 5233–5250, https://doi.org/10.5194/acp-14-5233-2014, 2014.
Guenther, A., Karl, T., Harley, P., Wiedinmyer, C., Palmer, P. I., and Geron, C.: Estimates of global terrestrial isoprene emissions using MEGAN (Model of Emissions of Gases and Aerosols from Nature), Atmos. Chem. Phys., 6, 3181–3210, https://doi.org/10.5194/acp-6-3181-2006, 2006.
Hernández Pardo, L., Toledo Machado, L. A., Amore Cecchini, M., and Sánchez Gácita, M.: Quantifying the aerosol effect on droplet size distribution at cloud top, Atmos. Chem. Phys., 19, 7839–7857, https://doi.org/10.5194/acp-19-7839-2019, 2019.
Hoffmann, F. and Feingold, G.: Cloud Microphysical Implications for Marine Cloud Brightening: The Importance of the Seeded Particle Size Distribution, J. Atmos. Sci., 78, 3247–3262, https://doi.org/10.1175/JAS-D-21-0077.1, 2021.
Hu, Y., Zang, Z., Ma, X., Li, Y., Liang, Y., You, W., Pan, X., and Li, Z.: Four-dimensional variational assimilation for SO2 emission and its application around the COVID-19 lockdown in the spring 2020 over China, Atmos. Chem. Phys., 22, 13183–13200, https://doi.org/10.5194/acp-22-13183-2022, 2022.
Iacono, M. J., Delamere, J. S., Mlawer, E. J., Shephard, M. W., Clough, S. A., and Collins, W. D.: Radiative forcing by long-lived greenhouse gases: Calculations with the AER radiative transfer models, J. Geophys. Res.-Atmos., 113, 103, https://doi.org/10.1029/2008JD009944, 2008.
IPCC: Climate Change 2013 – The Physical Science Basis: Working Group I Contribution to the Fifth Assessment Report of the Intergovernmental Panel on Climate Change, Cambridge University Press, https://www.ipcc.ch/report/ar5/wg1/ (last access: 13 October 2026), 2014.
Jackson, L. and Forster, P.: The Role of Climate Model Emulators in the IPCC 6th Assessment Report, Workshop Report, Zenodo, https://doi.org/10.5281/zenodo.5615538, 2021.
Jia, H., Ma, X., and Liu, Y.: Exploring aerosol–cloud interaction using VOCALS-REx aircraft measurements, Atmos. Chem. Phys., 19, 7955–7971, https://doi.org/10.5194/acp-19-7955-2019, 2019.
Jia, H. L., Ma, X. Y., Yu, F. Q., and Quaas, J.: Significant underestimation of radiative forcing by aerosol-cloud interactions derived from satellite-based methods, Nat. Commun., 12, 3649, https://doi.org/10.1038/s41467-021-23888-1, 2021.
Khain, A., Ovtchinnikov, M., Pinsky, M., Pokrovsky, A., and Krugliak, H.: Notes on the state-of-the-art numerical modeling of cloud microphysics, Atmos. Res., 55, 159–224, https://doi.org/10.1016/S0169-8095(00)00064-8, 2000.
Khain, A., Pokrovsky, A., Pinsky, M., Seifert, A., and Phillips, V.: Simulation of Effects of Atmospheric Aerosols on Deep Turbulent Convective Clouds Using a Spectral Microphysics Mixed-Phase Cumulus Cloud Model. Part I: Model Description and Possible Applications, J. Atmos. Sci., 61, 2963–2982, https://doi.org/10.1175/jas-3350.1, 2004.
Khain, A. P., Beheng, K. D., Heymsfield, A., Korolev, A., Krichak, S. O., Levin, Z., Pinsky, M., Phillips, V., Prabhakaran, T., Teller, A., van den Heever, S. C., and Yano, J. I.: Representation of microphysical processes in cloud-resolving models: Spectral (bin) microphysics versus bulk parameterization, Rev. Geophys., 53, 247–322, https://doi.org/10.1002/2014rg000468, 2015.
Kogan, Y. L.: The Simulation of a Convective Cloud in a 3-D Model With Explicit Microphysics. Part I: Model Description and Sensitivity Experiments, Journal of Atmospheric Sciences, 48, 1160–1189, https://doi.org/10.1175/1520-0469(1991)048<1160:Tsoacc>2.0.Co;2, 1991.
Li, J., Zhao, C., Sun, Y., Zhao, X., Yang, J., Yang, Y., Chen, A., and Zhou, Y.: Distinct Aerosol Impacts on Local Scale Convective Rainfall Between Sichuan Basin and North China Plain Regions in China, J. Geophys. Res.-Atmos., 130, e2024JD042649, https://doi.org/10.1029/2024JD042649, 2025.
Li, M., Liu, H., Geng, G., Hong, C., Liu, F., Song, Y., Tong, D., Zheng, B., Cui, H., and Man, H.: Anthropogenic emission inventories in China: a review, Natl. Sci. Rev., 4, 834–866, https://doi.org/10.1093/nsr/nwx150, 2017.
Liang, Y., Zhao, C., Yang, Y., Zhao, X., Li, J., and Chen, A.: Distinct Impacts of Aerosol Size on Aerosol-Cloud Interactions Over Ocean and Land Regions in Eastern China, J. Geophys. Res.-Atmos., 131, e2025JD045635, https://doi.org/10.1029/2025JD045635, 2026.
Liu, F., Mao, F., Rosenfeld, D., Pan, Z., Zang, L., Zhu, Y., Yin, J., and Gong, W.: Opposing comparable large effects of fine aerosols and coarse sea spray on marine warm clouds, Commun. Earth Environ., 3, 232, https://doi.org/10.1038/s43247-022-00562-y, 2022.
Liu, Y., Bourgeois, A., Warner, T., Swerdlin, S., and Hacker, J.: Implementation of observation-nudging based FDDA into WRF for supporting ATEC test operations, WRF/MM5 Users' Workshop June, 27–30, https://www2.mmm.ucar.edu/wrf/users/workshops/WS2005/abstracts/Session10/7-Liu.pdf (last access: 13 October 2026), 2005.
Ma, X., Jia, H., Yu, F., and Quaas, J.: Opposite aerosol index-cloud droplet effective radius correlations over major industrial regions and their adjacent oceans, Geophys. Res. Lett., 45, 5771–5778, https://doi.org/10.1029/2018GL077562, 2018.
McCoy, I. L., Wyant, M. C., Blossey, P. N., Bretherton, C. S., and Wood, R.: Aitken Mode Aerosols Buffer Decoupled Mid-Latitude Boundary Layer Clouds Against Precipitation Depletion, J. Geophys. Res.-Atmos., 129, e2023JD039572, https://doi.org/10.1029/2023JD039572, 2024.
McFiggans, G., Artaxo, P., Baltensperger, U., Coe, H., Facchini, M. C., Feingold, G., Fuzzi, S., Gysel, M., Laaksonen, A., Lohmann, U., Mentel, T. F., Murphy, D. M., O'Dowd, C. D., Snider, J. R., and Weingartner, E.: The effect of physical and chemical aerosol properties on warm cloud droplet activation, Atmos. Chem. Phys., 6, 2593–2649, https://doi.org/10.5194/acp-6-2593-2006, 2006.
Mlawer, E. J., Taubman, S. J., Brown, P. D., Iacono, M. J., and Clough, S. A.: Radiative transfer for inhomogeneous atmospheres: RRTM, a validated correlated-k model for the longwave, J. Geophys. Res.-Atmos., 102, 16663–16682, https://doi.org/10.1029/97JD00237, 1997.
NCEP, National Weather Service, NOAA, and U.S. Department of Commerce: NCEP ADP Global Surface Observational Weather Data, NCAR [data set], https://doi.org/10.5065/4F4P-E398, 2004.
NCEP, National Weather Service, NOAA, and U.S. Department of Commerce: NCEP GDAS/FNL 0.25 Degree Global Tropospheric Analyses and Forecast Grids, Research Data Archive at the National Center for Atmospheric Research, Computational and Information Systems Laboratory, NCAR [data set], https://doi.org/10.5065/D65Q4T4Z, 2015.
Niu, L., Zhao, C., Zhang, H., Liang, Y., and Chen, A.: Spatiotemporal characteristics of aerosols and low clouds from MODIS and their implications for marine cloud brightening, Science China Earth Sciences, 1–12, https://doi.org/10.1007/s11430-025-1794-7, 2026.
Niu, X., Ma, X., and Jia, H.: Analysis of cloud-type distribution characteristics over major aerosol emission regions in the Northern Hemisphere by using CloudSat/CALIPSO satellite data, Journal of the Meteorological Sciences, 42, 467–480, https://doi.org/10.12306/2021jms.0006, 2022.
Ovadnevaite, J., Zuend, A., Laaksonen, A., Sanchez, K. J., Roberts, G., Ceburnis, D., Decesari, S., Rinaldi, M., Hodas, N., Facchini, M. C., Seinfeld, J. H., and O' Dowd, C.: Surface tension prevails over solute effect in organic-influenced cloud droplet activation, Nature, 546, 637–641, https://doi.org/10.1038/nature22806, 2017.
Pahlow, M., Parlange, M. B., and Porté-Agel, F.: On Monin–Obukhov similarity in the stable atmospheric boundary layer, Bound.-Lay. Meteorol., 99, 225–248, https://doi.org/10.1023/A:1018909000098, 2001.
Patel, P. N. and Jiang, J. H.: Cloud condensation nuclei characteristics at the Southern Great Plains site: role of particle size distribution and aerosol hygroscopicity, Environ. Res. Commun., 3, 075002, https://doi.org/10.1088/2515-7620/ac0e0b, 2021.
Petters, M. D. and Kreidenweis, S. M.: A single parameter representation of hygroscopic growth and cloud condensation nucleus activity, Atmos. Chem. Phys., 7, 1961–1971, https://doi.org/10.5194/acp-7-1961-2007, 2007.
Quinn, P. K., Bates, T. S., Coffman, D. J., and Covert, D. S.: Influence of particle size and chemistry on the cloud nucleating properties of aerosols, Atmos. Chem. Phys., 8, 1029–1042, https://doi.org/10.5194/acp-8-1029-2008, 2008.
Reutter, P., Su, H., Trentmann, J., Simmel, M., Rose, D., Gunthe, S. S., Wernli, H., Andreae, M. O., and Pöschl, U.: Aerosol- and updraft-limited regimes of cloud droplet formation: influence of particle number, size and hygroscopicity on the activation of cloud condensation nuclei (CCN), Atmos. Chem. Phys., 9, 7067–7080, https://doi.org/10.5194/acp-9-7067-2009, 2009.
Satellite Services Division: Office of Satellite Data Processing and Distribution/NESDIS/NOAA/U.S. Department of Commerce, and National Centers for Environmental Prediction/National Weather Service/NOAA/U.S. Department of Commerce: NCEP ADP Global Upper Air Observational Weather Data, NCAR [data set], https://doi.org/10.5065/39C5-Z211, 2004.
Schulze, B. C., Charan, S. M., Kenseth, C. M., Kong, W., Bates, K. H., Williams, W., Metcalf, A. R., Jonsson, H. H., Woods, R., Sorooshian, A., Flagan, R. C., and Seinfeld, J. H.: Characterization of Aerosol Hygroscopicity Over the Northeast Pacific Ocean: Impacts on Prediction of CCN and Stratocumulus Cloud Droplet Number Concentrations, Earth Space Sci., 7, e2020EA001098, https://doi.org/10.1029/2020EA001098, 2020.
Seinfeld, J. H., Bretherton, C., Carslaw, K. S., Coe, H., DeMott, P. J., Dunlea, E. J., Feingold, G., Ghan, S., Guenther, A. B., and Kahn, R.: Improving our fundamental understanding of the role of aerosol–cloud interactions in the climate system, P. Natl. Acad. Sci. USA, 113, 5781–5790, https://doi.org/10.1073/pnas.1514043113, 2016.
Sha, T., Ma, X. Y., Wang, J., Tian, R., Zhao, J. Q., Cao, F., and Zhang, Y. L.: Improvement of inorganic aerosol component in PM2.5 by constraining aqueous-phase formation of sulfate in cloud with satellite retrievals: WRF-Chem simulations, Sci. Total Environ., 804, 150229, https://doi.org/10.1016/j.scitotenv.2021.150229, 2022.
Shin, H. H., Hong, S. Y., and Dudhia, J.: Impacts of the Lowest Model Level Height on the Performance of Planetary Boundary Layer Parameterizations, Mon. Weather Rev., 140, 664–682, https://doi.org/10.1175/mwr-d-11-00027.1, 2012.
Ward, D. S., Eidhammer, T., Cotton, W. R., and Kreidenweis, S. M.: The role of the particle size distribution in assessing aerosol composition effects on simulated droplet activation, Atmos. Chem. Phys., 10, 5435–5447, https://doi.org/10.5194/acp-10-5435-2010, 2010.
Wild, O., Zhu, X., and Prather, M. J.: Fast-J: Accurate simulation of in-and below-cloud photolysis in tropospheric chemical models, J. Atmos. Chem., 37, 245–282, https://doi.org/10.1023/A:1006415919030, 2000.
Xu, X., Curtis, J. H., West, M., and Riemer, N.: Compensating biases in CCN predictions from composition averaging and neglected surfactant effects, Atmos. Chem. Phys., 26, 10647–10659, https://doi.org/10.5194/acp-26-10647-2026, 2026.
Zaveri, R. A., Easter, R. C., Fast, J. D., and Peters, L. K.: Model for Simulating Aerosol Interactions and Chemistry (MOSAIC), J. Geophys. Res.-Atmos., 113, D13204, https://doi.org/10.1029/2007jd008782, 2008.
Zhang, Q., Meng, J., Quan, J., Gao, Y., Zhao, D., Chen, P., and He, H.: Impact of aerosol composition on cloud condensation nuclei activity, Atmos. Chem. Phys., 12, 3783–3790, https://doi.org/10.5194/acp-12-3783-2012, 2012.
Zhang, Y., Fan, J., Li, Z., and Rosenfeld, D.: Impacts of cloud microphysics parameterizations on simulated aerosol–cloud interactions for deep convective clouds over Houston, Atmos. Chem. Phys., 21, 2363–2381, https://doi.org/10.5194/acp-21-2363-2021, 2021.
Zhao, C., Liu, X., Leung, L. R., Johnson, B., McFarlane, S. A., Gustafson Jr., W. I., Fast, J. D., and Easter, R.: The spatial distribution of mineral dust and its shortwave radiative forcing over North Africa: modeling sensitivities to dust emissions and aerosol size treatments, Atmos. Chem. Phys., 10, 8821–8838, https://doi.org/10.5194/acp-10-8821-2010, 2010.
Zhao, C., Yang, Y., Chi, Y., Sun, Y., Zhao, X., Letu, H., and Xia, Y.: Recent progress in cloud physics and associated radiative effects in China from 2016 to 2022, Atmos. Res., 293, 106899, https://doi.org/10.1016/j.atmosres.2023.106899, 2023.
Zhao, C., Li, J., and Yang, Y.: A Short Review of Microphysical Effects of Aerosols on Clouds and Precipitation, Chinese Journal of Atmospheric Sciences, 49, 949–963, https://doi.org/10.3878/j.issn.1006-9895.2503.25015, 2025a (in Chinese).
Zhao, J., Ma, X., Wu, S., and Sha, T.: Dust emission and transport in Northwest China: WRF-Chem simulation and comparisons with multi-sensor observations, Atmos. Res., 241, 104978, https://doi.org/10.1016/j.atmosres.2020.104978, 2020.
Zhao, J., Ma, X., Quaas, J., and Yang, T.: How meteorological conditions influence aerosol-cloud interactions under different pollution regimes, Atmos. Chem. Phys., 25, 17701–17723, https://doi.org/10.5194/acp-25-17701-2025, 2025b.
Zhao, X., Zhao, C., Chi, Y., Yang, J., Sun, Y., Yang, Y., and Fan, H.: Different Impacts of Aerosols on Cloud Development over Land and Ocean Regions in East China, Adv. Atmos. Sci., 42, 731–743, https://doi.org/10.1007/s00376-024-4165-z, 2025c.
Zheng, B., Tong, D., Li, M., Liu, F., Hong, C., Geng, G., Li, H., Li, X., Peng, L., Qi, J., Yan, L., Zhang, Y., Zhao, H., Zheng, Y., He, K., and Zhang, Q.: Trends in China's anthropogenic emissions since 2010 as the consequence of clean air actions, Atmos. Chem. Phys., 18, 14095–14111, https://doi.org/10.5194/acp-18-14095-2018, 2018.