
the Creative Commons Attribution 4.0 License.
the Creative Commons Attribution 4.0 License.
 | 22 Oct 2026
From direct emission factors to inverse and indirect impact factors of road traffic: influence of emerging and unregulated pollutants
Lauri K. Savolainen

Heidi Hellén
Henna Lintusaari
Milja Jäppi
Jarkko V. Niemi
Kimmo Teinilä
Minna Aurela
Markus Lampimäki
Anu Kousa
Janne Lampilahti
Katrianne Lehtipalo
Tuukka Petäjä
Miikka Dal Maso
Hanna E. Manninen
Hilkka Timonen
Topi Rönkkö
Even though emissions regulations have successfully reduced concentrations of some road traffic-originated air pollutants, road traffic is still an important source of many unregulated emerging pollutants such as semi-volatile ultrafine particles, non-exhaust emissions and volatile organic compounds (VOCs) in urban areas. In addition, road traffic can have season- and location-dependent inverse and indirect effects on the urban aerosol which are not well understood. In our study, we investigate wintertime vehicle fleet emission factors (EF) of road traffic in a street canyon environment in central Helsinki, Finland, by using CO2 as a tracer for fuel consumption. We report EFs for particle number and size distribution, black carbon, PM10, PM2.5, NOx, NO2, NO, CO as well as for organic and inorganic chemical components of particulate matter, and VOCs, including aromatic hydrocarbons, alkanes, and polycyclic aromatic hydrocarbons. The obtained fleet EFs of PM and NOx were considerably higher than required for new vehicles in Europe since 2014, showing the major role of older vehicles and heavy-duty traffic on the urban aerosol. In addition to direct EFs, we show that CO2-based EF determination enables detection of inverse and indirect effects of road traffic. For example, road traffic had an inverse effect, i.e., negative EF, on O3 and small ion (<2 nm) concentrations. Also, we found that road traffic contributes to compounds that are not necessarily considered to be traffic-derived such as terpenoid VOCs. We introduce a term impact factor (IF) to describe the found inverse and indirect effects of road traffic.
- Article
(2410 KB) - Full-text XML
-
Supplement
(1693 KB) - BibTeX
- EndNote


Road traffic is generally known to be a significant contributor to poor air quality in urban areas. Traffic exhaust and traffic-influenced air pollutants such as fine particulate matter (PM2.5) and nitrogen oxides (NOx) have been associated with various adverse health endpoints and premature deaths (Raaschou-Nielsen et al., 2010; Vodonos et al., 2018; Park et al., 2018). Due to the adverse health effects, regulations have been implemented to control vehicle emissions. For example, the first EURO emission standard by the European Union (EU) was introduced in 1992, limiting emissions of CO, hydrocarbons, NOx and particulate matter of vehicles (only diesel). Since 2011, the EURO standards have also regulated the number concentration of emitted nonvolatile particles larger than 23 nm from diesel vehicles (gasoline since 2014). Advancements in vehicular technologies and tightening emission regulations have led to declining trends in many traffic-related pollutants at urban roadside monitoring sites in Europe and globally (Wallington et al., 2022; Garcia-Marlès et al., 2024; Krecl et al., 2024). These pollutants include ultrafine particles (UFPs, <100 nm), particulate matter (PM10 and PM2.5), NO, NO2, SO2, lead (Pb), and black carbon (BC).
While the emissions of many traffic-related pollutants have reduced due to the regulations, road traffic is still an important source of many emerging pollutants, i.e. species that have potential adverse effects on health and climate but remain unregulated. For example, road traffic is a major source of particles smaller than 30 nm, including nanocluster aerosol (<3 nm) (Rönkkö et al., 2017). However, only the number concentration of nonvolatile particles larger than 23 nm until 2026 and larger than 10 nm from 2026 onward is regulated in the EURO standards. Diesel particulate filters have proven effective in reducing emissions of BC and accumulation mode particles (>100 nm) (Saarikoski et al., 2024). Yet, they are still ineffective at controlling nucleation mode particles (<30 nm) (Damayanti et al., 2023), which are likely associated with (semi-)volatile aerosol emissions. Despite their low contribution to particle mass, UFPs have been linked to adverse health effects (Vallabani et al., 2023; Lloyd et al., 2024) although more data on these health effects are still needed. In addition to UFPs, road traffic is an important source of non-exhaust emissions: There are indications that even the majority of PM10 emissions of road traffic would be non-exhaust originated (Bukowiecki et al., 2010; Singh et al., 2020). For example, metallic brake-wear particles include compounds that are harmful to health (Grigoratos and Martini, 2015). Non-exhaust emissions will be included in the EURO 7 standard for the first time in 2026.
Alongside the particulate emissions, road traffic contributes to gaseous emissions, including various volatile organic compounds (VOCs) and polycyclic aromatic hydrocarbons (PAHs). VOCs contribute to secondary aerosol formation (Chaturvedi et al., 2023), and organic aerosol is the most abundant compound in PM1 in Europe (Chen et al., 2022). According to Daellenbach et al. (2020), secondary organic aerosol is the most important contributor to the oxidative potential of PM10 in most parts of Europe. In addition, VOCs are participating in ozone formation together with NOx. Some of the VOCs are also considered directly harmful: For example, benzene is classified as a carcinogenic compound by the International Agency for Research on Cancer (IARC, 2026). Also, effects of VOCs, e.g., on central nervous and immune systems have been identified (Li et al., 2021). Ambient VOCs are mainly unregulated, but EU has set a limit for the annual average concentration of benzene in ambient air (Directive (EU) 2024/2881, 2024).
In addition to direct effects, traffic emissions can have indirect effects by affecting other airborne compounds. As an example, NOx and O3 are known to have inverse dependency: Decreasing NOx emissions can cause an increase in O3 concentrations in urban ambient air as NO depletes O3 (Keuken et al., 2009; Anttila et al., 2011). Also, particle emissions from road traffic increase the condensation and coagulation sink which affect the scavenging of semi-volatile aerosol precursors and UFPs. On the other hand, road traffic increases the concentrations of aerosol precursors in ambient air (Olin et al., 2020). Both these attributes can influence new particle formation events as well as growth of UFPs into sizes where they could act as cloud condensation nuclei (Bousiotis et al., 2021).
Emission factors (EFs) derived from roadside measurements are useful when quantifying the impacts of road traffic on ambient air. For example, by measuring CO2 simultaneously with other pollutants, emissions can be normalized to the amount of fuel burned, as elevated CO2 levels at roadside measurements likely originate from the nearby road traffic. In contrast to laboratory measurements, roadside EFs include the real-life direct and short-term effects of vehicular emissions, such as the particle formation due to exhaust cooling and dilution. Also, roadside measurements enable the determination of the EFs for the entire vehicle fleet. Yet, roadside EFs are sensitive to site-specific conditions such as meteorology, traffic composition, driving conditions, and built environment (Choi et al., 2016; Pirjola et al., 2016; Wang et al., 2021). Hence, they enable estimation of traffic emissions in different conditions and situations. For example, a study by Wang et al. (2018b) found that particle number (PN) EFs were 2.0 times higher in winter compared to summer at an urban near-road site. Conversely, toluene EFs in summer were 2.5 times higher than in winter. Thus, varying conditions and seasons can considerably affect the impacts of road traffic on urban air quality. Up-to-date fleet EFs are, therefore, important when estimating how well and quickly technological advances and tightening regulations decrease the impacts of road traffic in varying urban areas with different conditions. Such insights are valuable when considering future regulatory actions.
In earlier studies, EFs from roadside measurements have mainly been determined for particulate matter (mass), black carbon and gases (CO, NO, NO2). Additionally, some VOC EFs – mostly the BTEX group VOCs (benzene, toluene, ethyl benzene, and xylene) – have been studied (e.g., Majumdar et al., 2009; Gaga et al., 2018). For various emerging airborne compounds, fleet EFs have been determined less frequently, including those for several other VOCs, PN down to sizes below 10 nm, airborne ions, and chemical components of PM. Furthermore, literature of EFs derived in winter conditions remain limited.
The aim of our study is to extend the CO2-based fleet EF calculation beyond regulated pollutants to include emerging pollutants and compounds that have not been previously necessarily considered to be directly traffic derived. The road traffic emissions were studied in a street canyon environment in Helsinki city center, Finland, in winter 2022. EFs were calculated for PN (including size distribution), PM2.5, PM10, BC, NO, NO2, NOx, alveolar lung deposited surface area (LDSAal) as well as for ions and various VOCs and chemical compounds of PM. Also, the inverse effects of road traffic on O3 and small ions were investigated. Furthermore, influence of increased regional and long-range transported pollution events on the determined EFs was investigated. Overall, in addition to up-to-date fleet EFs of wintertime road traffic, the study brings a new and wider perspective on the use and interpretation of EFs determined in ambient measurements to recognize the direct and indirect effects of road traffic on urban air quality.
2.1 Measurement site and conditions
The intensive measurement campaign of this study was conducted at an air quality monitoring supersite operated by Helsinki Region Environmental Services Authority (HSY) on 17 January–22 February 2022 (Teinilä et al., 2025). The station is located at Mäkelänkatu street canyon (Mäkelänkatu 50, Helsinki; 60.1964° N, 24.9521° E), next to a main street leading toward the city center of Helsinki. The street width is 42 m, consisting of two pavements, six lanes, and two tramlines lined with trees in the middle. The speed limit is 40 km h−1, and the street has many traffic light junctions. The map of the measurement street together with a wind rose plot during the campaign is shown in Fig. S1 in the Supplement. The heights of the surrounding buildings are 16–19 m, limiting the dilution process of pollutants. The station is located on the pavement less than 0.5 m from the lanes. The measurement instruments utilized in this study were located inside the air quality monitoring supersite as well as right next to it in an additional measurement container. The height of inlets was 4 m above ground level (29 m above sea level). A more detailed description of the station with its air flow patterns, profile and in-depth aerosol characterization are provided by Kuuluvainen et al. (2018) and Barreira et al. (2021).
During the measurement campaign, the traffic rate of the street was about 17 000 vehicles per weekday of which the heavy-duty vehicles account for 10 % (statistics from the City of Helsinki). The shares of gasoline cars, diesel cars, vans, city buses and trucks were 45 %, 34 %, 12 %, 6 %, and 4 %, in 2022, respectively (Table S1 in the Supplement). The shares of mileage for different EURO emission classes for gasoline cars, diesel cars, vans, city buses and trucks are collected in Table S2.
The weather conditions during the campaign represented typical wintertime conditions in Southern Finland. The mean temperature during the campaign was −1.4 °C (range ), and the temperature was most of the time near zero centigrade. The mean relative humidity was 89 % (58 %–100 %). The prevailing wind direction was from south to south-west and the mean wind speed was 4.9 m s−1 (0.59–11.4 m s−1). The average mixing height was 408 m (58–844 m). The measurement campaign conditions are described in more detail by Teinilä et al. (2025).
During the campaign three distinct pollution episodes occurred. These episodes took place 22 January (local time: 03:00 p.m.)–23 January (10:00 a.m.), 31 January (07:00 a.m.)–5 February (04:00 p.m.), and 13 February (12:00 p.m.)–17 February (11:00 p.m.). During the episodes, the contribution of pollution sources other than road traffic at the site increased compared to the non-episodic data. For example, long-range and regionally transported biomass burning-originated aerosols contributed to increased pollutant concentrations measured at the studied site during the episodes. A cold temperature inversion combined with low wind speeds led to the accumulation of pollutants below the boundary layer, particularly during the second episode. The pollution episodes during the campaign are described in more detail by Teinilä et al. (2025).
2.2 Instrumentation
Detailed descriptions of the instruments used during the campaign are provided by Teinilä et al. (2025). Briefly, PN concentrations and size distributions were measured by utilizing a condensation particle counter (CPC) model A20 (Airmodus), Neutral cluster and Air Ion Spectrometer (NAIS) model 5-27 (Airel Ltd.), and a differential mobility particle sizer (DMPS). The particle size range of the CPC was 5.4 nm–2.5 µm, whereas the particle size distributions were measured in the size ranges of ∼2–20 nm (NAIS), and 11–800 nm (DMPS). NAIS was additionally used to measure air ion size distributions with both polarities in the mobility diameter range of ∼0.8–40 nm, the total duration of the measurement cycle being 1.5 min (30 s ions, 30 s offset, 30 s particles–operation modes) (Mirme and Mirme, 2013; Manninen et al., 2016). For the particle size distributions, the negative particle mode was used with the NAIS data (i.e., negative charger and analyzer polarity). DMPS consisted of a Vienna type differential mobility analyzer followed by A20 model CPC, and a scanning time of 9 min was used. The alveolar LDSAal concentration of aerosol particles from 10–400 nm was measured using a Pegasor AQ™ Urban instrument (Pegasor Ltd.) (Kuula et al., 2020).
Particulate matter, PM10 and PM2.5, concentrations were measured using a Fidas 200 fine dust monitor (Palas). BC in PM1 was measured with an AE33 dual-spot aethalometer (Magee Scientific) based on the attenuation of light at the wavelength of 880 nm (Hansen et al., 1984; Drinovec et al., 2015). A Soot Particle Aerosol Mass Spectrometer (SP-AMS, Aerodyne Research Inc.) was used to investigate the chemical composition of submicron particles (Onasch et al., 2012). The SP-AMS was operated with a 60–90 s time-resolution of which half was measured in mass spectrum mode and half in particle time-of-flight mode.
Gaseous compounds were measured using following analyzers: CO with APMA 360 (Horiba), CO2 with LI-7000 (LICOR), NOx with APNA 370 (Horiba), and O3 using APOA 370 (Horiba). Gaseous PAHs, VOCs and IVOCs were measured with 30–45 min time resolution using an in-situ thermal desorption unit connected to a gas chromatograph and mass spectrometer (TD-GC-MS, PerkinElmer TurboMatrix 350, Clarus 680, and SQ 8 T). The gaseous compounds were reported at +20 °C and particles in ambient temperatures according to the European Union standards.
2.3 Data processing
The EFs were determined to represent the influence of the entire vehicle fleet passing the measurement station. EF for each pollutant metric was calculated by comparing the measured pollutant concentration with the concurrently measured CO2 with a time resolution of 1 min as a default. The EF of CO2 () was assumed to be 3.141 , determined for average Finnish road traffic (Yli-Tuomi et al., 2005). The EF calculation method is similar to previous studies, such as Rönkkö et al. (2017) and Lintusaari et al. (2023). The EFs for each studied pollutant (EFP) were calculated assuming the ideal gas law and standard conditions (STP) by using an equation
where ERP is the emission ratio for each pollutant compared to the concurrently measured CO2, R is the molar gas constant (8.3144621 ), Tstd is the standard temperature (273.15 K), is the molar mass of CO2, and pstd is the standard pressure (105 Pa). The ERP was determined by utilizing a linear fit between the studied pollutant metric and CO2. Before that, the CO2 data was divided into 5 ppm bins after which the measured pollutant concentrations were averaged by using geometric mean over the 5 ppm CO2 bins. The linear fit was applied for the averaged data to determine emission ratios for each pollutant based on the slope of the fit in the CO2 range of 420–465 ppm, representing 99.2 % of the non-episodic data. The lowest CO2 concentration of the dataset was 420.7 ppm. When CO2 concentrations exceeded approximately 465 ppm, the average pollutant concentrations for some studied pollutants began to deviate from the linear fit, which was attributed to the limited number of data points. To avoid confusion with the correlations, the R2 value obtained from linear fit after averaging is called R2 of the averaged linear fit, as a distinction from the raw data correlation. In addition, 95 % confidence intervals (CI) were calculated for the averaged linear fits. Figure 1 presents an example of how the PN emission factor was calculated.
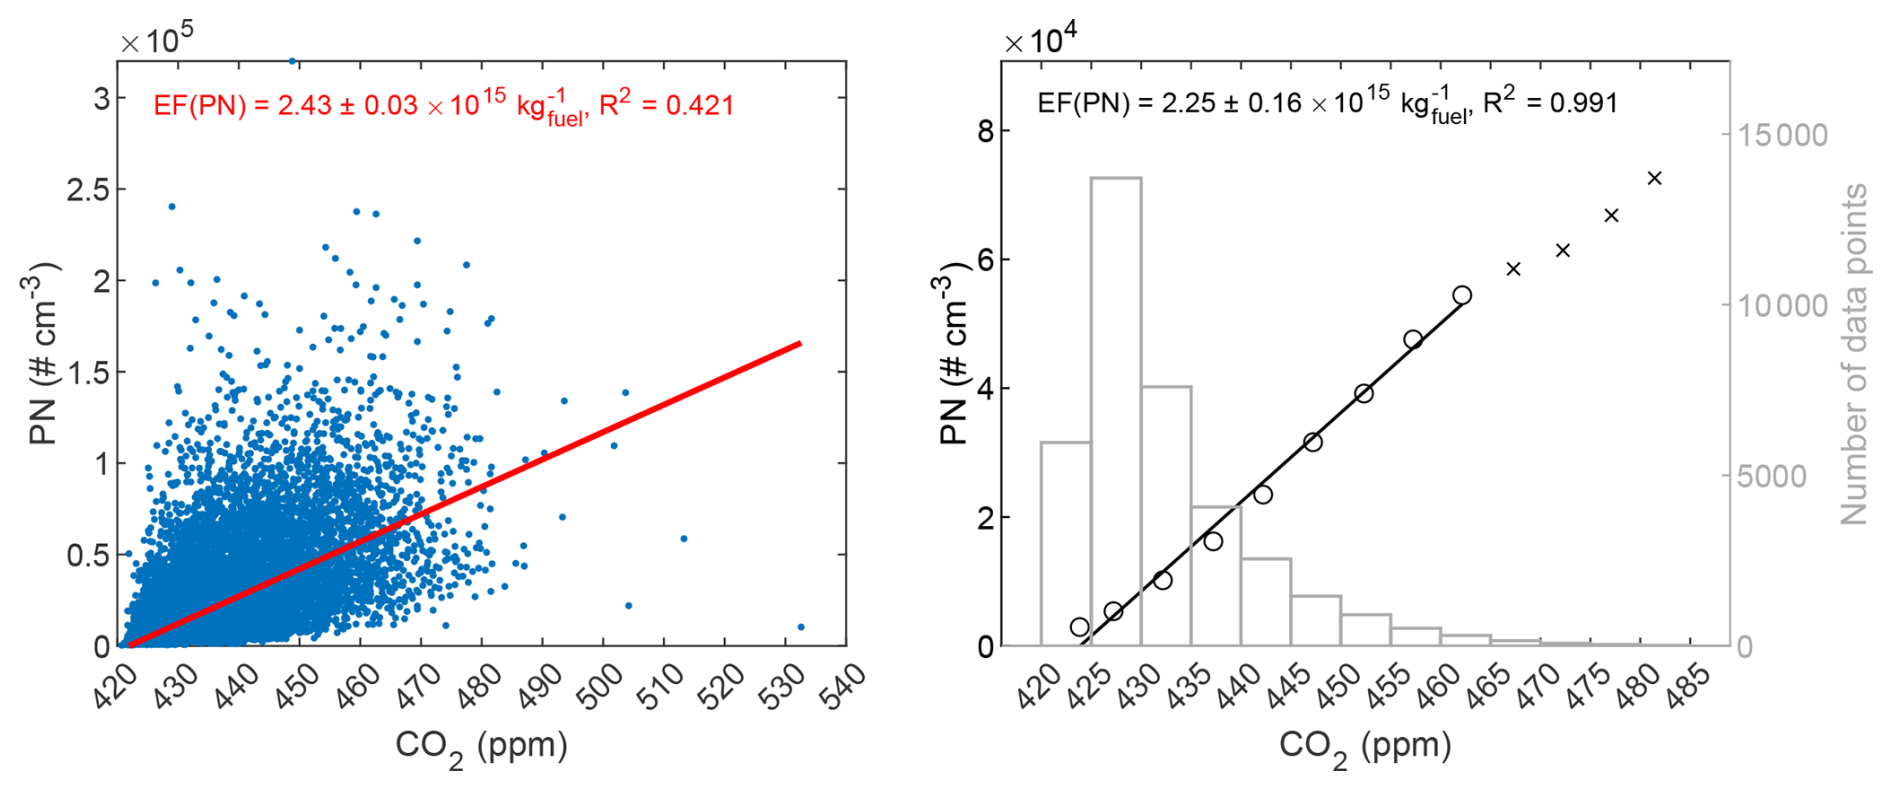
Figure 1Left: Scatter plot of all individual non-episodic 1 min-average PN and CO2 concentrations, together with a linear fit. Right: Average (geometric mean) PN and CO2 concentrations over 5 ppm CO2 concentration bins, together with a linear fit, which was calculated in the range of 420–465 ppm of CO2 (circular markers). Also, the number of data points (1 min) in each CO2 concentration bin shown is shown in the histogram.
In case of the DMPS, NAIS, SP-AMS, and VOC sampling, the measurement intervals were longer than 1 min. Because of the scanning-type of measurement, single datapoint results with the DMPS and NAIS can be uncertain due to the rapidly varying concentrations caused by the road traffic. Hence, with both NAIS and DMPS, 1 h-resolution was used in the EF calculation. With the SP-AMS, a 10 min-resolution was utilized. The VOC EFs were calculated either with 30 or 45 min resolution, depending on the sampling time. The utilized time resolutions in the EF calculation are collected in Table S3. Due to the longer time resolution with these instruments, some of the bins with the highest CO2 concentration had limited number of data points. Bins having at least 10 data points were included in the fit; as a result, the upper limits of the fit calculation with these instruments were 450 (for NAIS), 455 (DMPS and VOCs), and 465 (SP-AMS) ppm of CO2. The longer measurement intervals should be noted when comparing the measurements between different instruments as the instruments may not detect the rapidly varying concentrations caused by the road traffic (e.g., Lamprecht et al., 2025).
In general, the EF calculation method assumes that the measured pollutant and CO2 dilute at the same rate, and the dilution is faster than other atmospheric processes affecting the measured concentrations (Rönkkö et al., 2023). However, it should be noted that the method is susceptible to altering weather conditions and non-vehicle influences (Wang et al., 2018a), such as regional wood combustion and long-range transported pollution. On the other hand, road traffic should clearly be the most significant local contributor to the measured concentrations at the supersite (e.g., Saarikoski et al., 2021). To focus on the effects of road traffic, the data measured during the mentioned pollution episodes (Sect. 2.1) was not considered in Sect. 3.1–3.3. The similar diurnal patterns (Fig. S2) of measured CO2 concentration and traffic rate (towards south) support the assumption that the effect of other sources than road traffic on CO2 during the non-episodic periods was minimal. For example, weather conditions (temperature and wind speed), did not follow similar diurnal pattern (Fig. S3). Also, the diurnal patterns of PN, BC and PM2.5 were similar to the CO2's one (Fig. S4), and BC and PM2.5 concentrations were low (3.1 and 0.41 µg m−3) during the non-episodic periods (Table S4), further supporting that the contributions of, e.g., residential wood combustion and long-range transported pollution were low during these periods. In general, it should be noted that the presented results represent only the average weather conditions during the campaign. The effect of the pollution episodes is investigated in Sect. 3.4.
In addition to EFs, some of the studied pollutant concentrations decreased with increasing CO2 concentration, i.e., the road traffic's contribution to the concentrations of these pollutants was negative (Sect. 3.2). In these cases, it is not reasonable to interpret the results as EFs as, in principle, EFs describe the amount of emitted pollutants per certain activity (e.g., kg of fuel burnt). Therefore, we use a term impact factor (IF) when reporting the results of pollutant metrics that had an inverse trend as a function of increasing CO2 concentration, i.e., negative EF. Also, the term IF is used with parameters that are not necessarily considered to be emitted from vehicles itself, but the increased road traffic activity still contributes to their concentrations, like terpenoid VOCs (Sect. 3.3).
2.4 Bottom-up emission inventory EF calculation
The obtained PM2.5 and NOx EFs were compared to bottom-up emission inventory-based EF calculation. The bottom-up emission inventory was based on the emission factor database of the Handbook of Emission Factors for Road Transport (HBEFA version 4.1). The average EF for NOx and PM2.5 on the studied street were calculated using the estimated shares of mileages of different vehicle types and emission classes (Tables S1 and 2) assuming the mean driving speed of 37 km h−1 (i.e., close to the speed limit 40 km h−1 on the street). The estimated mileage shares of different vehicle types and emission classes on the studied street were based on the statistics from the City of Helsinki and VTT's Lipasto Aliisa model 2021. The bottom-up EFs were calculated as a yearly average in 2022.
3.1 Emission factors of regulated and non-regulated emerging pollutants
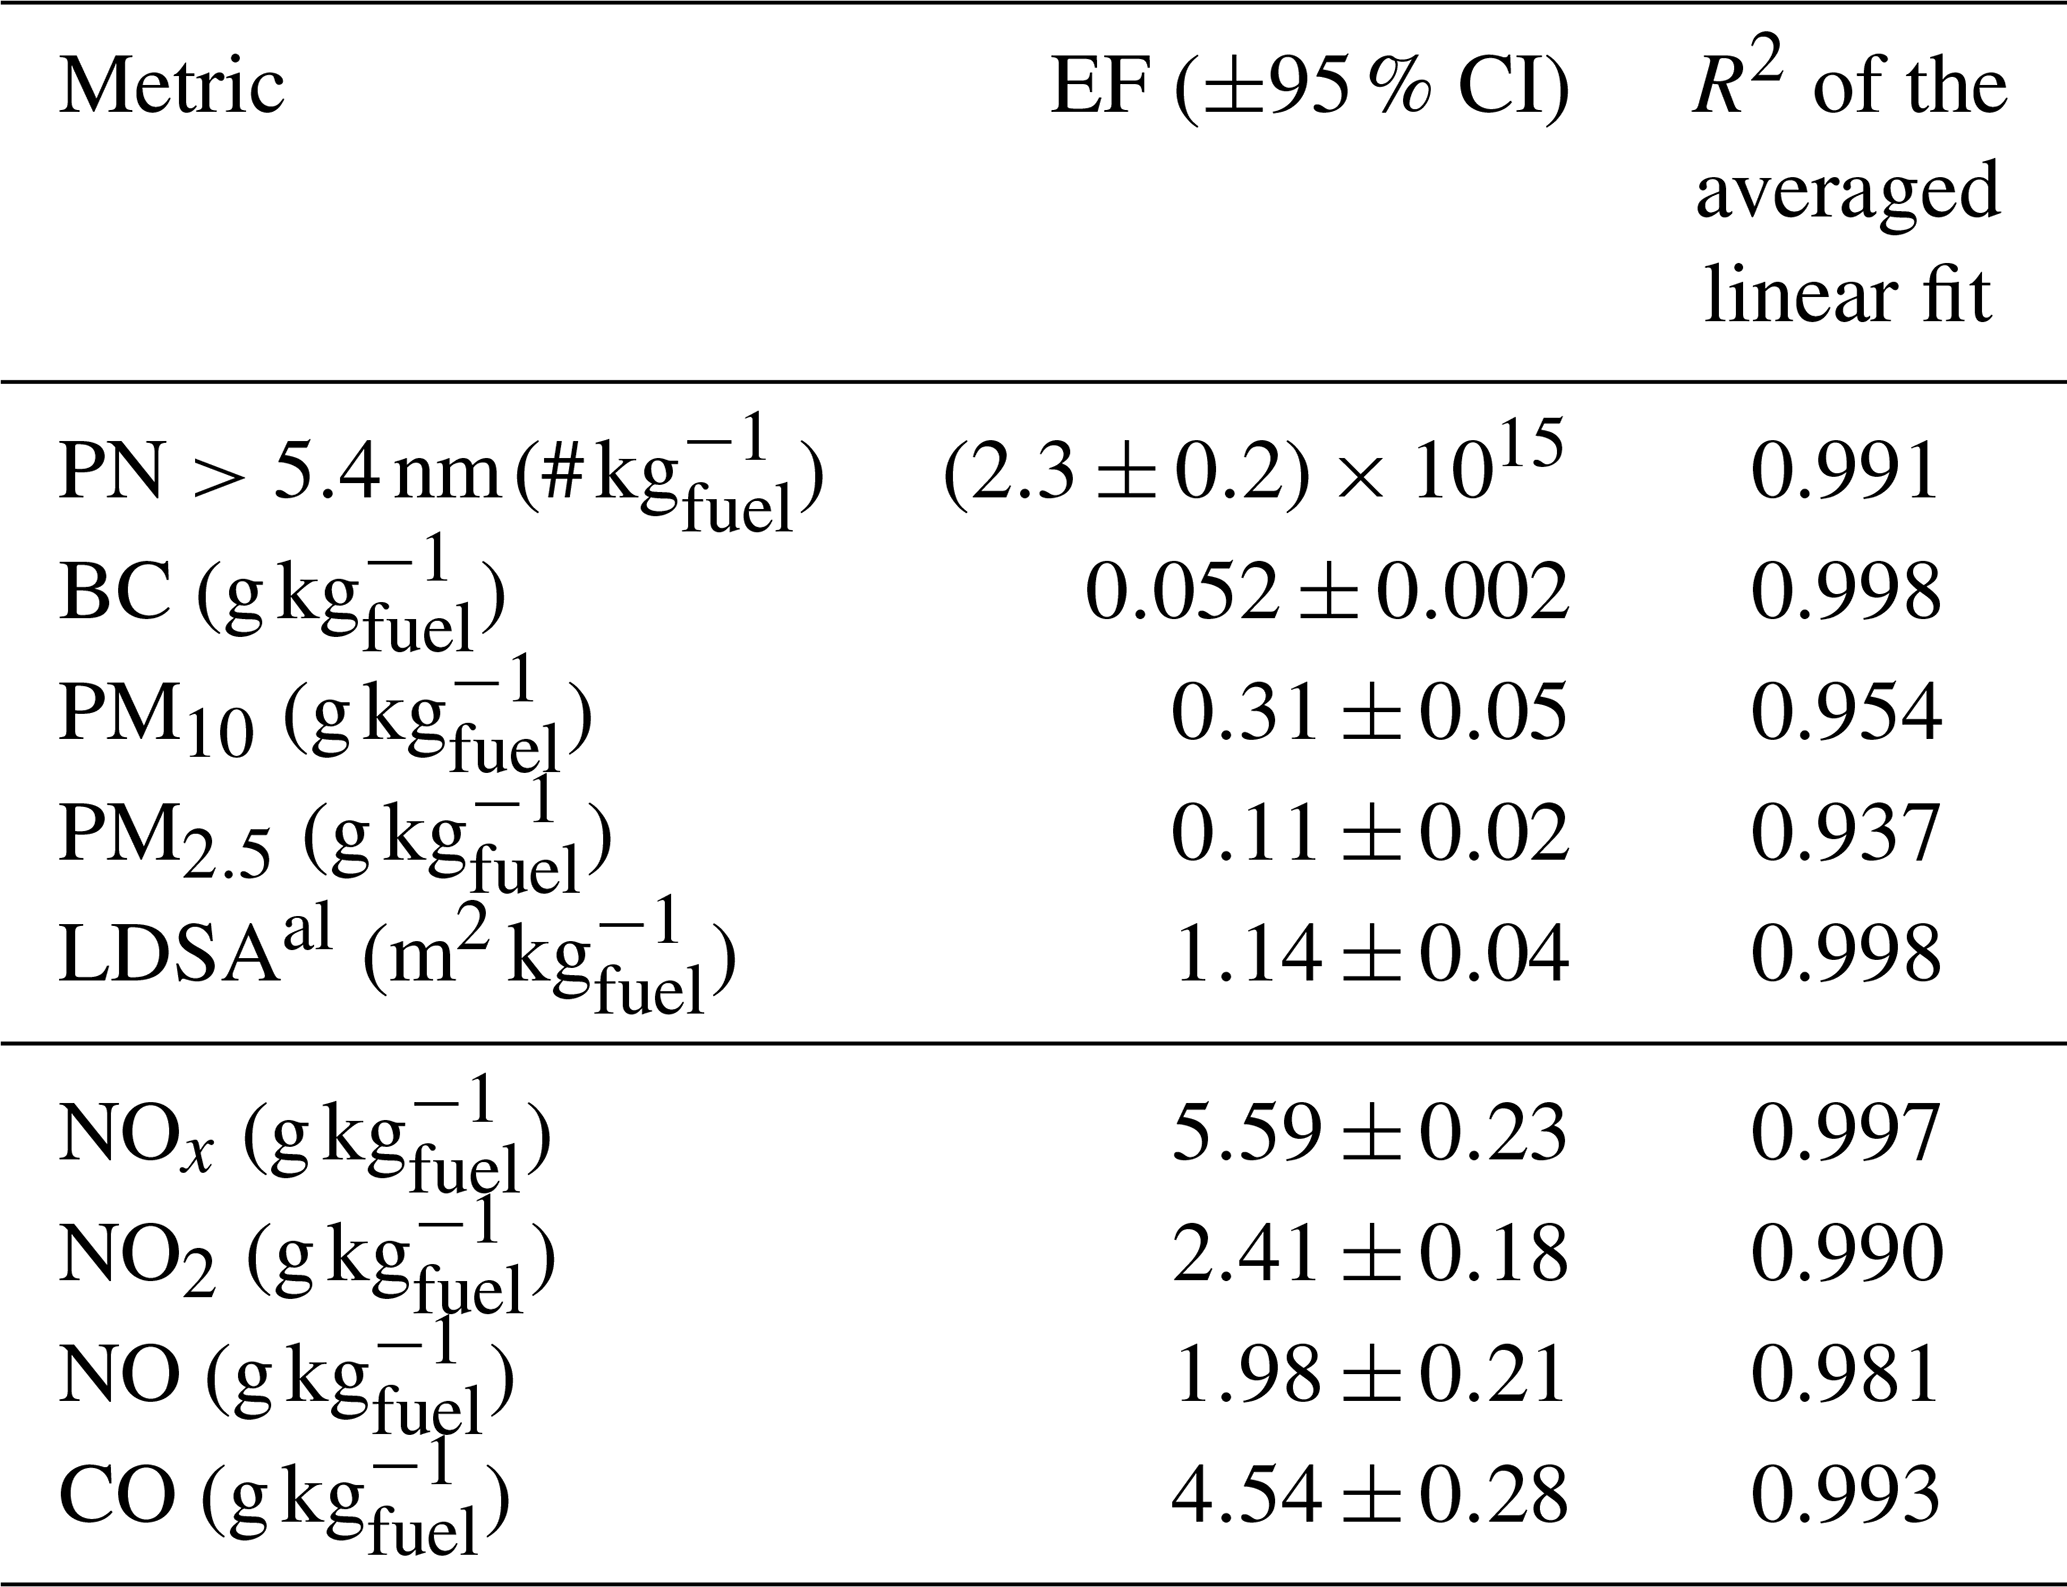
In this chapter EFs of different variables are presented. The EFs of PN, BC, PM10, PM2.5, LDSAal, NOx, NO2, NO, and CO are presented in Table 1 (Fig. S5), whereas EFs for organics, nitrate, sulfate, ammonium, and chloride are presented in Table 2 (Figs. 6 and S14) and for VOCs and PAHs in Table 3 (Figs. S7–S9).
Table 1Emission factors (EF) of PN >5.4 nm, BC, PM10, PM2.5, LDSAal, NOx, NO2, NO and CO, together with 95 % confidence intervals (CI) and R2 values of the averaged linear fits.
3.1.1 Particle number and mass
According to the averaged linear fits, the average concentrations of PN, BC, PM10, PM2.5 and LDSAal were strongly connected with the average CO2 concentration. The R2 values of the averaged fits were above 0.93, indicating that the pollutants were mainly derived from road traffic at the studied site.
The obtained PN EF aligns well with earlier studies conducted at the same site. Hietikko et al. (2018) reported PN EFs of (>3 nm) and (>7 nm) measured in May 2017 whereas Lintusaari et al. (2023) reported (>3 nm) and (>10 nm) in May 2018. During the SARS-CoV-2 pandemic in March 2021, PN EFs of (>2.5 nm) and (>10 nm) were measured by Lepistö et al. (2023). Therefore, it seems that PN EFs have stayed rather constant in central Helsinki during recent years. On the other hand, Enroth et al. (2016) reported fleet PN EFs of for particles larger than 2.5 nm measured on highways in Helsinki in 2012, suggesting reduction in PN emissions from traffic. For an indicative estimation, if fuel consumption of 11.0 L per 100 km was assumed (i.e., 10.7 kg km−1, with estimated fuel density of 0.85 L kg−1), the PN EF would be approx. , representing considerably higher EF than the limit for primary emission particles (>23 nm) utilized by the EU in the EURO standards (). It is important to note that this difference is likely related to the emissions of (semi-)volatile compounds and particles smaller than 23 nm, which are not regulated in the EURO standards. The result suggests that the current emission standards are not probably enough in reducing the emissions of the smallest ultrafine particles from road traffic, which has been reported also by Damayanti et al. (2023) and Garcia-Marlès et al. (2024). It should be noted that the average fuel consumption on the street cannot be accurately determined, but the assumed 11.0 L per 100 km is a reasonable estimation based on the comparison of obtained EFs and the bottom-up emission inventory-based EFs (see Sect. 3.1.2). Also, it's noteworthy that the winter conditions probably increase the reported EFs in this study which may hide the effect of cleaner vehicle technology. For example, at a comparable ambient traffic site in downtown Toronto, the wintertime PN EF (>7 nm, fleet mean) was approx. which was the highest among the four seasons (spring: 0.9×10¹⁵, summer: 0.5×10¹⁵, fall: ) (Wang et al., 2018b). Similarly, Saha et al. (2018) found that PN EF was 300 % higher in winter than in summer at a site near a freeway.
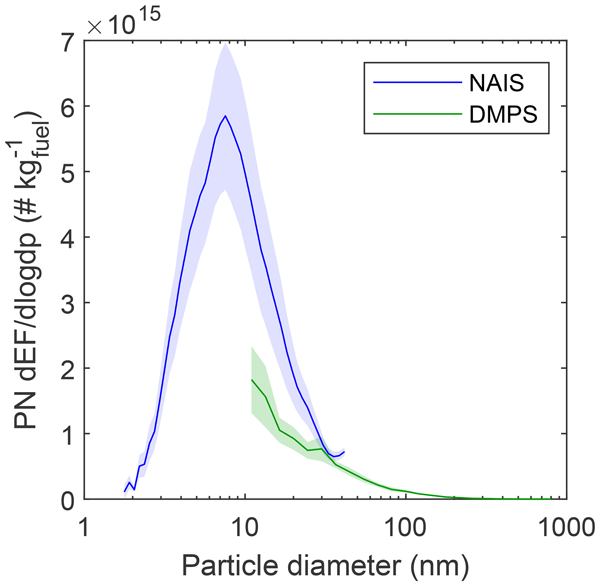
The size-resolved PN EF, based on the data of DMPS and NAIS, is shown in Fig. 2. The EF size distributions determined from the DMPS and NAIS data both show the high contribution of particles smaller than 20 nm, even though the EFs from the NAIS data were higher compared to the DMPS. This difference is likely related to the varying measurement methods as well as the different scanning times of the measurements: The higher time resolution of NAIS measurement likely detects better the rapidly varying concentrations caused by the road traffic. Based on the NAIS data, the highest PN EFs were determined for particles around the size of 7.5 nm. Still, the peak of the EF size distribution could be located even below the obtained 7.5 nm: For example, Lintusaari et al. (2025) found that the PN EFs were highest in the smallest size fraction that they analyzed (2.5–4.0 nm) next to a busy arterial road in Prague, Czech Republic. Also, Rönkkö et al. (2017) have reported traffic to be a significant source of nanocluster aerosol. Hence, it may be possible that the rapid changes in nanocluster aerosol concentration cannot be completely observed from NAIS block data with the utilized measurement cycle. As EURO7 (11/2026) (Regulation (EU) 2024/1257, 2024) and the new EU air quality directive (Directive (EU) 2024/2881, 2024) have introduced 10 nm as the lower size limit of particle number measurements, the observations highlight that road traffic produces also a high number of particles that are not currently (or planned to be) regulated.
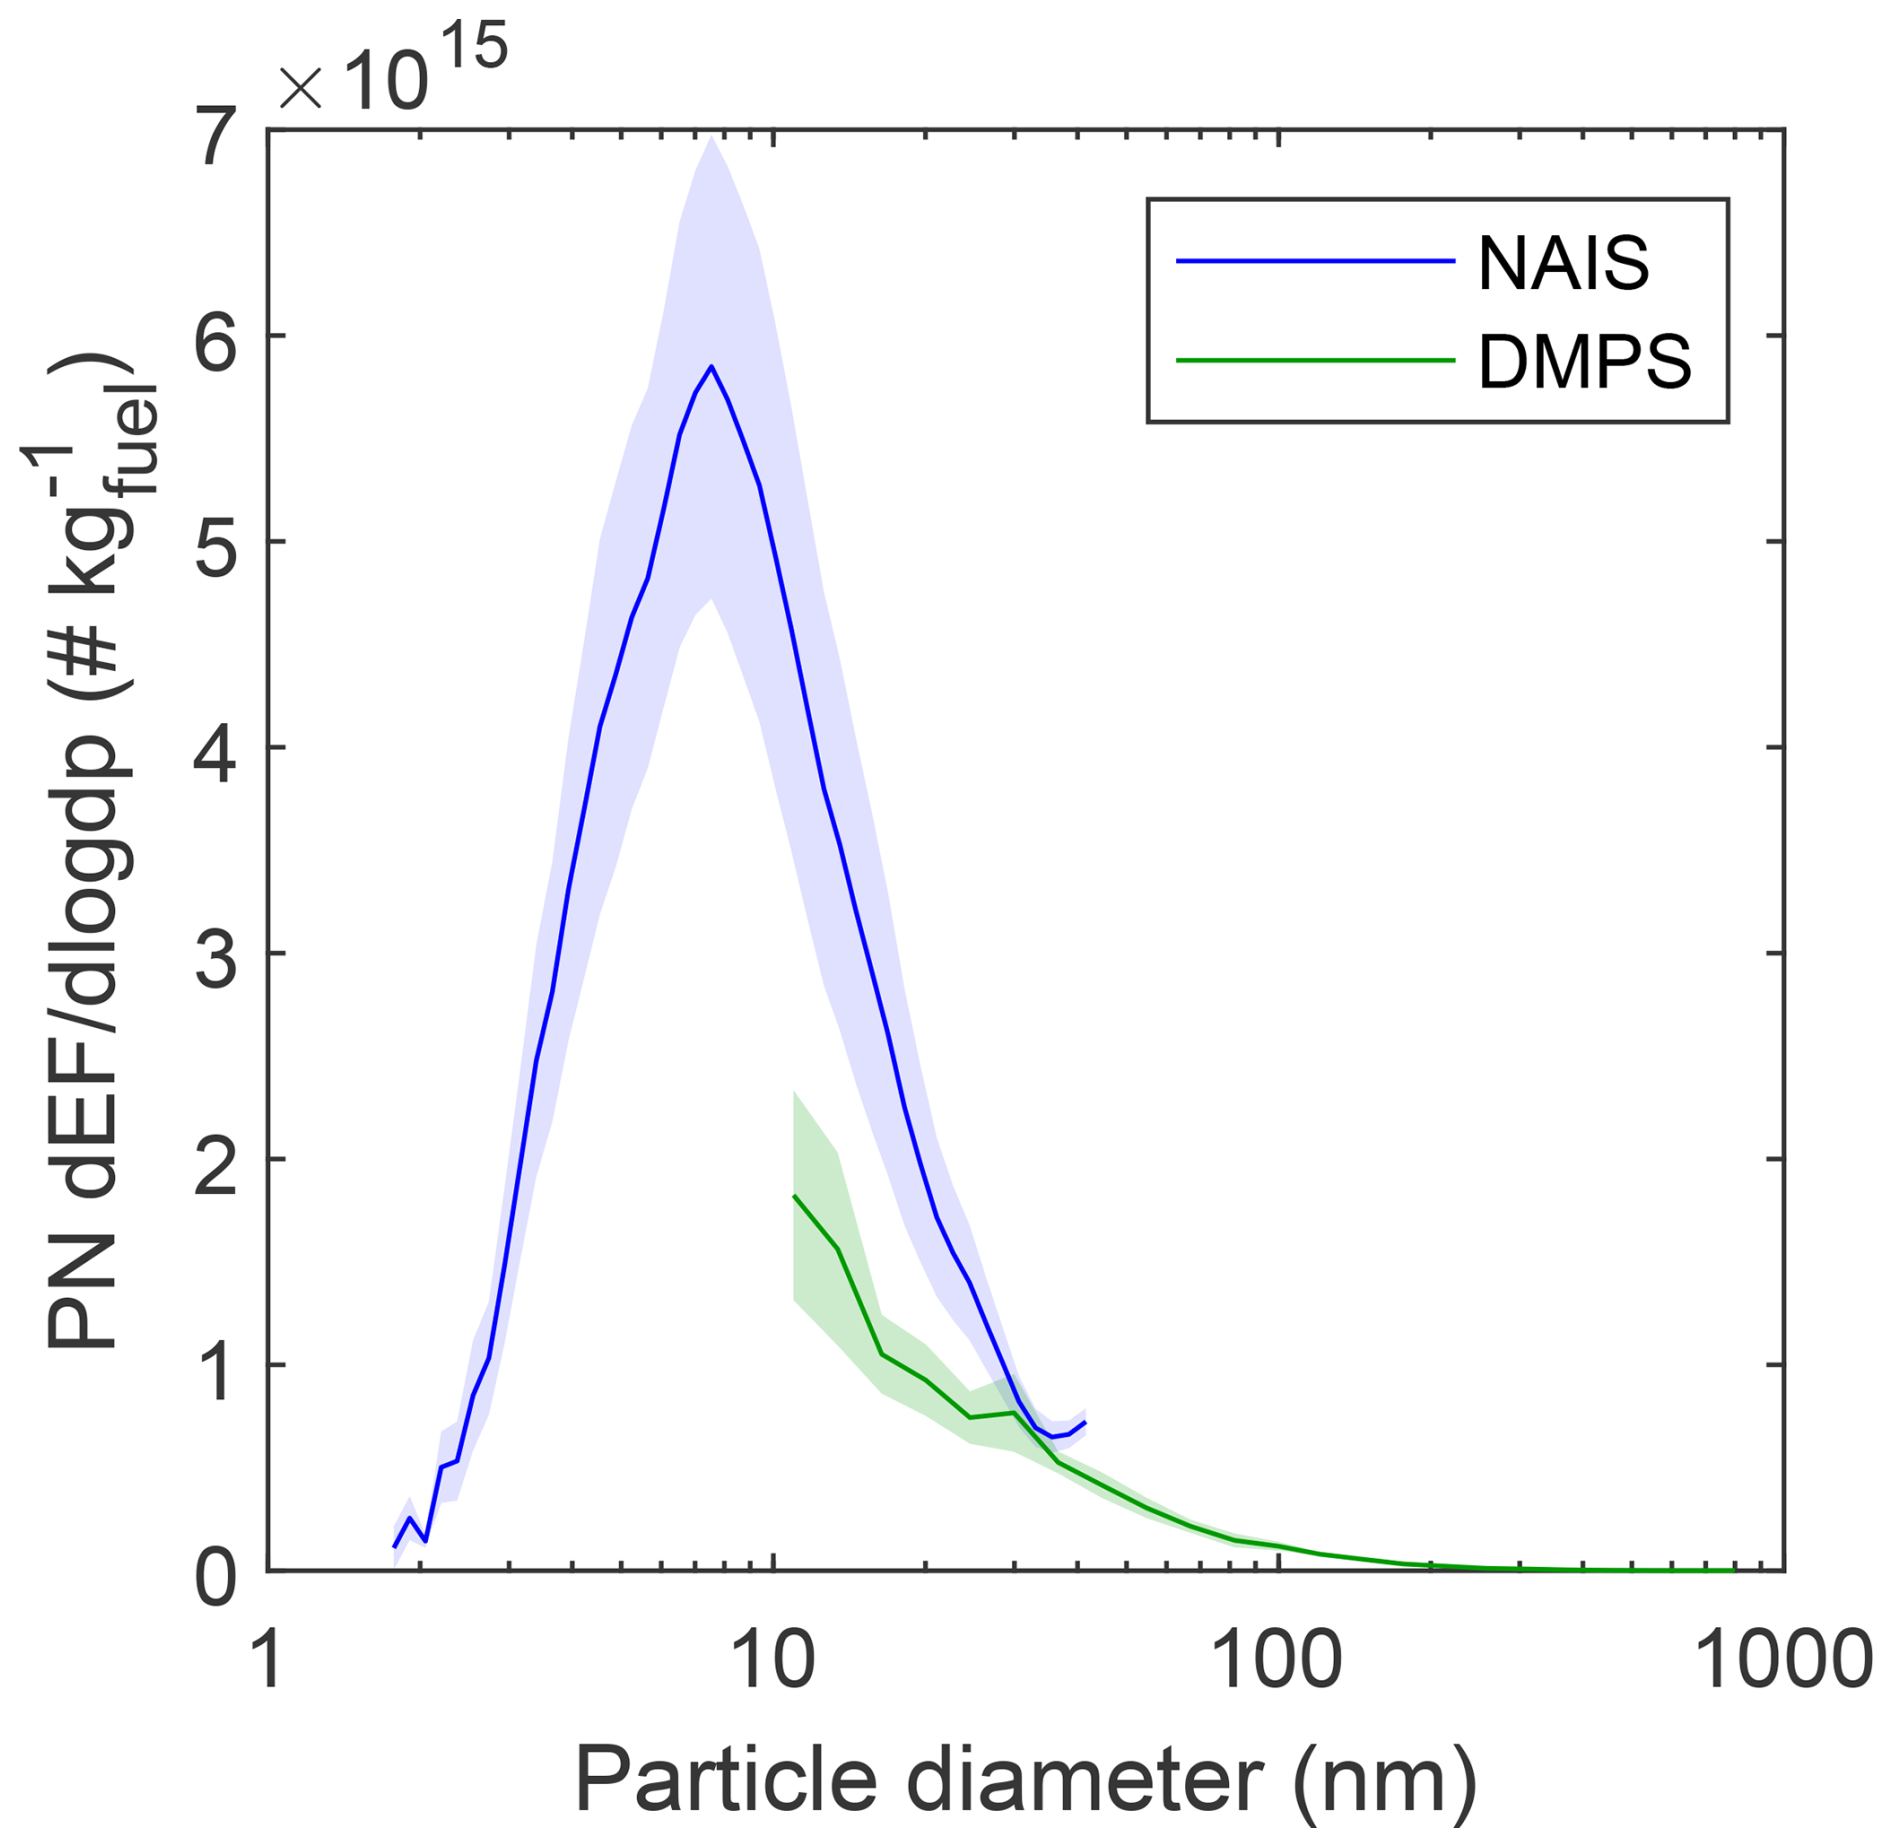
Figure 2PN EF size distributions measured by NAIS and DMPS with 95 % confidence intervals (shaded areas).
The review by Rönkkö et al. (2023) shows a large variation of BC EFs measured at road sites in different studies: 0.015–2.4 , average being and median 0.054 . Our value, 0.052 , is close to the median and the value reported by Lepistö et al. (2023) at the same site during winter 2021 (0.042 ). Our BC EF was 47 % of the determined PM2.5 EF (0.11 ). This result is reasonable as organic compounds contribute considerably to PM emissions of vehicles (see Sect. 3.1.3). With the fuel consumption of 11.0 L per 100 km, the reported BC EF (0.0049 g km−1) would be close to the current EURO PM EF limit (0.0045 g km−1), but the obtained PM2.5 EF (0.0103 g km−1) would clearly exceed this limit. This result could partly be related to heavy-duty traffic as well as to use of older vehicles on the studied street. Also, non-exhaust emissions could increase the PM2.5 EF. In this case, it is, however, not likely that the non-exhaust emissions would significantly affect the PM2.5 EF because of the clear contributions by organics and BC (see Sect. 3.1.3). Still, the measured PM10 concentrations correlated strongly with the CO2, suggesting that EF for non-exhaust emissions, such as road dust, tire-wear, and braking, could be determined indirectly even though they do not originate from combustion processes like CO2 does. As non-exhaust emissions contribute mainly to coarse PM, the obtained PM10 EF, which was 2.81 times higher than the PM2.5 EF, suggests contribution by non-exhaust emissions even though winter conditions typically limit the effects of non-exhaust emissions compared, e.g., to spring (Kupiainen et al., 2016; Stojiljkovic et al., 2019). In addition, the diurnal variation shows that PM10 EF increased during daytime traffic and at other times was close to zero, supporting the idea of potential non-exhaust contribution on the metric (Fig. S6). With the fuel consumption of 11.0 L per 100 km, the PM10 EF would be 0.0290 g km−1, where the coarse fraction (PM10–PM2.5) would be 0.0187 g km−1. Regarding the diurnal variation of EFs (Fig. S6), interestingly, the EF of PN considerably increased during the morning rush hours compared to other hours. This same phenomenon was not observed with PM2.5 or PM10. This result could potentially be related to (semi-)volatile emissions influenced by weather conditions, as in contrast, PM2.5 and PM10 are more likely derived from primary and non-exhaust emissions.
The obtained PM2.5 and NOx (Sect. 3.1.2) EFs were compared to the bottom-up emission inventory EF calculation. The emission inventory-based PM2.5 EF was 0.0123 g km−1 (Table S5), being slightly higher than the obtained CO2 based PM2.5 EF of 0.0103 g km−1 (with estimated fuel consumption of 11.0 L per 100 km). Interestingly, according to the bottom-up calculation, the contribution of gasoline vehicles to the total road traffic originated PM2.5 emissions on the street were only 6 %, even though they had 45 % share of the total mileage. With diesel vehicles, the share of PM2.5 emissions was 38 % with 34 % share in total mileage. This result is related to the relatively high share of diesel vehicles without a diesel particulate filter (25 %, EURO4 or older). Vans, diesel city buses, and trucks had 22 % share in total mileage, but they contributed 56 % of total PM2.5 emissions. These results support the idea that the fleet PM2.5 EFs on the street still clearly exceed the current EURO standard limit especially because of heavy duty traffic and the use of vans and older diesel vehicles.
To highlight the potential health effects contributed by particle emissions from road traffic, an EF for LDSAal was also determined. LDSAal is especially dependent on the ultrafine particles (Lepistö et al., 2025), which deposit efficiently in the lung alveoli, as well as on BC (Järvinen et al., 2019; Lepistö et al., 2022). However, it should be noted that the concept of LDSAal EF is tricky: the unit () describes the surface area of particles that reach the lung alveoli of a single individual per kg of burnt fuel. Hence, the metric assumes that the individual breathes all the exhaust that is emitted as a consequence of burning one kg of fuel, and this breathing occurs at the same exact location where the measurement is conducted. Despite this challenge, strong connection between LDSAal and CO2 shows the clear contribution of road traffic on the metric which is also supported by the road traffic's contribution to PN and BC, Also, by comparing LDSAal EFs in different locations, effects related to changes in the size distribution of emitted particles could be assessed because the relative change in LDSAal is likely not the same as the relative change in PN or in BC (e.g., Lepistö et al., 2025).
3.1.2 Nitrogen oxides and carbon monoxide
According to the NO and NO2 EFs in Table 1, the (mass-based) NO2 EF was higher than the NO EF. However, when considering the volumetric emissions, the shares of NO and NO2 emissions were 56 % and 44 %. Fresh traffic exhaust typically has higher fraction of NO even though ratio has been suggested to be increasing from EURO0 to EURO6 with passenger cars (Carslaw and Rhys-Tyler, 2013; Carslaw et al., 2019). Still, the volumetric fraction of NO2 has typically been below 30 % with passenger vehicles (Carslaw et al., 2019). Therefore, it is likely that at the studied street canyon, atmospheric oxidation increased the fraction of NO2. For example, in a study by Xiang et al. (2025), NO2 NOx ratios measured from a truck plume were 3-4 times higher than in the tailpipe measurements, suggesting that substantial NO2 formation occurs in exhaust plumes after the emission. NO2 formation does not, however, change the total NOx emission, but it is important to note that ratios of NO and NO2 can be considerably different in ambient air compared to tailpipe measurements, even close to road traffic. It should be noted that the NOx EF in Table 1 has been calculated based on the NO2 molecular weight, i.e., NO is converted into NO2 (according to air quality standards), explaining the difference in comparison with the summed EFs of NO and NO2. Regarding the CO EF, it is generally known that road traffic is no longer a significant source of CO, a finding that is also supported by our study. For example, the EURO6 limit for CO emissions of passenger vehicles is 1.0 g km−1, and the obtained EF was clearly below if 11 L per 100 km fuel consumption is assumed (0.42 g km−1).
The bottom-up emission inventory-based NOx EF was 0.545 g km−1 at the studied street canyon. This result is close to the obtained CO2 based EF, which was 0.522 g km−1 with the fuel consumption of 11 L per 100 km. Together with the emission inventory-based PM2.5 EF, the results show that the CO2 based fleet EF determination agreed well with the emission inventory-based calculations. Also, the results suggest that the estimated average fuel consumption of 11 L per 100 km is reasonable at the studied street canyon. In comparison with the bottom-up PM2.5 EFs, the share of NOx contributed by gasoline vehicles was still low (5 %), but the contribution of diesel vehicles to total NOx emissions was clearly higher (52 %) than in the case of PM2.5 (38 %). The contribution of vans, diesel city buses and trucks was 43 % of total NOx emissions.
Overall, both the CO2 and emission inventory-based NOx EFs indicate that the fleet NOx EF is significantly higher than the EURO6 emissions standard limits of 0.06–0.08 g km−1. Similar to PM2.5, this result is most likely related to the heavy duty traffic and the use of vans and older diesel vehicles. In general, it is good to note that NOx emissions have been shown to be temperature and season dependent (Saha et al., 2018; Wang et al., 2018b; Grange et al., 2019; Li et al., 2020). For example, Saha et al. (2018) measured a 20 % higher NOx EF in winter (4.7 ) than in summer (3.8 ). Also, colder temperatures may cause cooler engine temperature and influence the operation of exhaust after treatment systems (Suarez-Bertoa and Astorga, 2018) used in vehicles. Hence, the winter-time conditions could have affected the obtained CO2 based NOx EF. On the other hand, the CO2 based EF agreed well with the emission inventory-based EF, suggesting that the winter-time condition is not likely the most important reason behind the result. Overall, it is important to note that the EURO6 emissions standard has been applied since 2014 and, yet the fleet NOx and PM2.5 emissions still clearly exceed the limit. Exceedances were also observed with particle number, but, in the case of PN, it is easy to understand that the regulations do not include the volatile particle fraction. However, in the case of nitrogen oxides and PM2.5, it is an important question to ask, why the fleet EFs are that much higher compared to the regulations. As mentioned, heavy-duty traffic and older passenger vehicles (i.e. so-called super emitters) could partly explain this result which has been shown, e.g., by Ježek Brecelj et al. (2025). Thus, policies to limit the emissions of individual super emitters would be beneficial when reducing the PM2.5 and NOx of traffic, in addition to emission regulations of new vehicles.
3.1.3 Chemical composition of submicron PM
Organics had clearly the highest EF (74.2 ) of the studied chemical compounds (Table 2). R2 of the averaged linear fit for organics was 0.977, whereas other compounds, i.e., sulfate, ammonium, nitrate and chloride, had R2 values <0.8. Therefore, road traffic may not necessarily have been a direct source of these compounds, especially in the case of chloride and sulfate. The results show that PM mass emissions from road traffic are mainly dominated by organic compounds (74.2 ) and BC (52.5 ), organics to BC-ratio being approx. 1.4. The sum of the EFs of BC and organics (127 ) slightly exceeds the determined EF of PM2.5 (110 ), indicating that there are uncertainties when comparing the results obtained with the different measurement techniques and time-resolutions. For example, the lowest detected particle size with the Fidas 200 measurement is 0.178 µm, which could indicate underestimation of fresh traffic particles (e.g., BC) in PM2.5.
Table 2EFs, including confidence intervals (CI), and R2 values of the averaged linear fits for the chemical components measured by the SP-AMS.
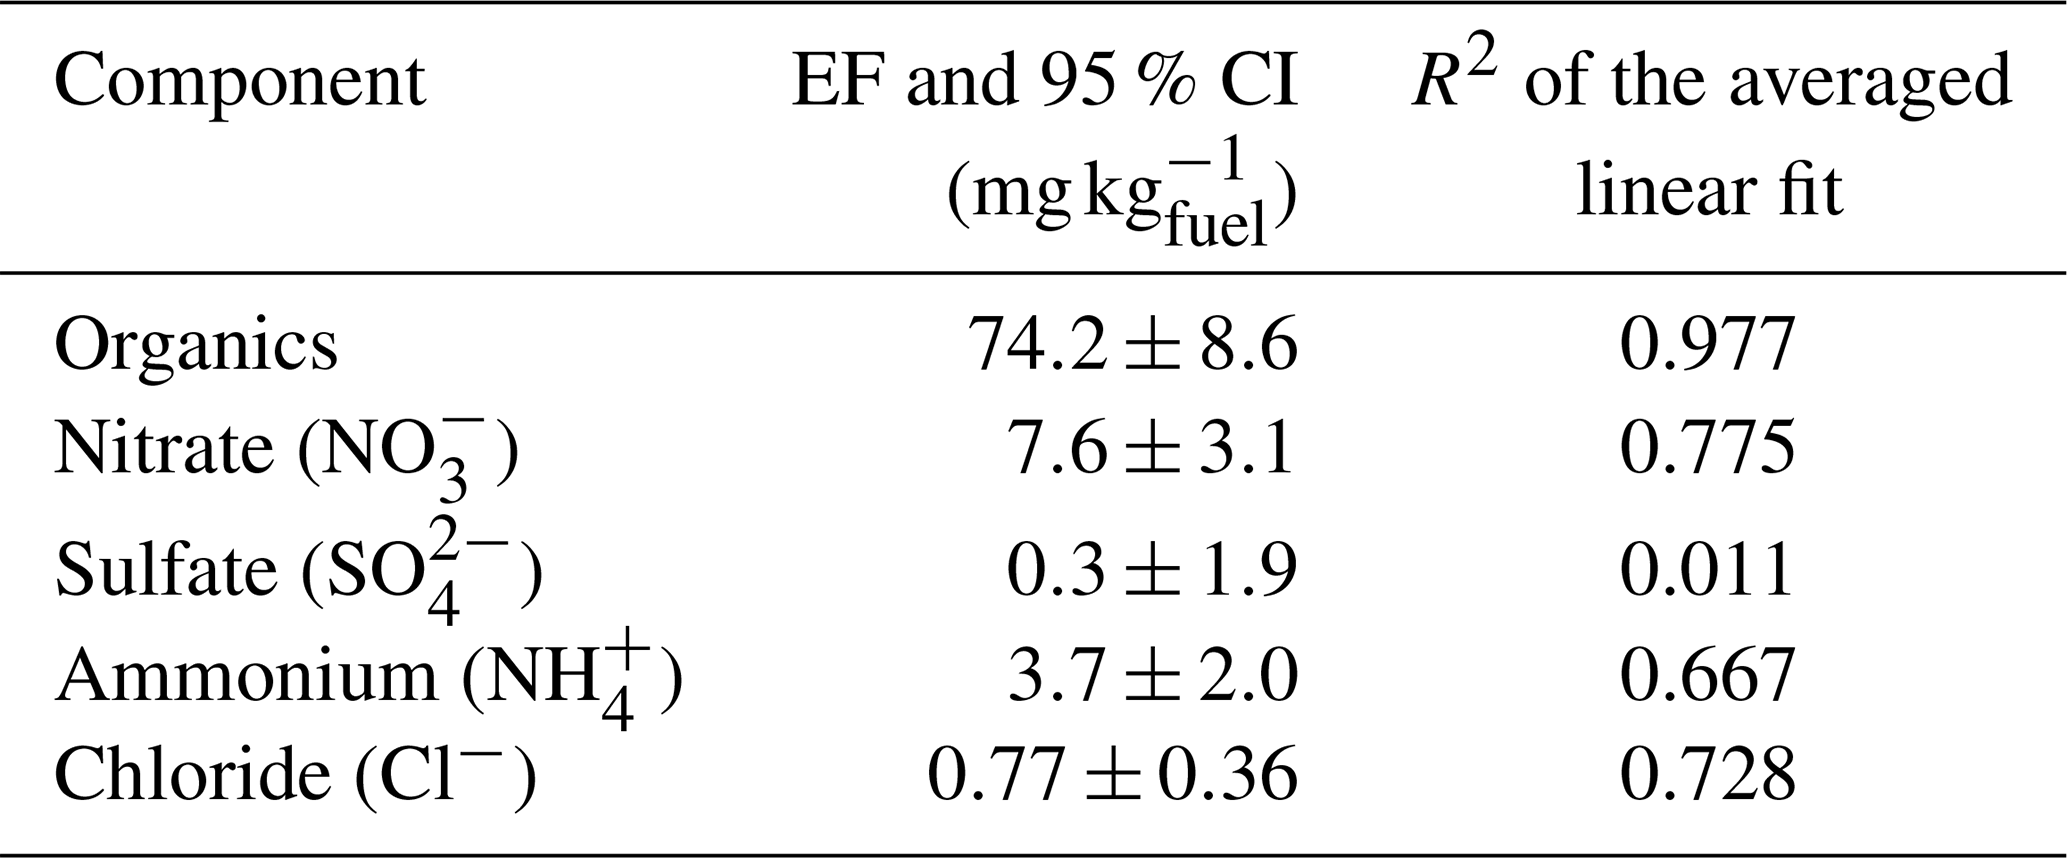
The results of the significant contributions of BC and organics agree well with laboratory studies performed with modern technologies, where the relative fraction of organics has been especially high with cars including gasoline/diesel particulate filters (Karjalainen et al., 2019; Saarikoski et al., 2024). However, according to authors' knowledge, fleet EFs of different chemical components of PM have rarely been reported. In a highway study in Helsinki, fleet EFs for organics have been between 240 and 330 (Enroth et al., 2016), and for heavy-duty diesel trucks in a highway tunnel in San Francisco Bay, 240 (Dallmann et al., 2014). These are significantly higher than our result, 74.2 , which is reasonable when considering the general reduction of PM mass emissions from road traffic during recent years.
Overall, the results in Table 2 show that the CO2-based EF fleet determination is a suitable method to investigate the emissions of different chemical compounds of particles. Typically, the contribution of road traffic to urban air quality and aerosol chemical composition is estimated by using, e.g., matrix-factorization methods. Our results show that CO2-based EF calculation could provide an alternative and supporting approach to estimate the effects of road traffic on certain aerosol compounds. One benefit of the CO2-based method is that it provides a clear link between the measured concentrations of ambient pollutants and the activity producing those pollutants.
3.1.4 Volatile organic compounds
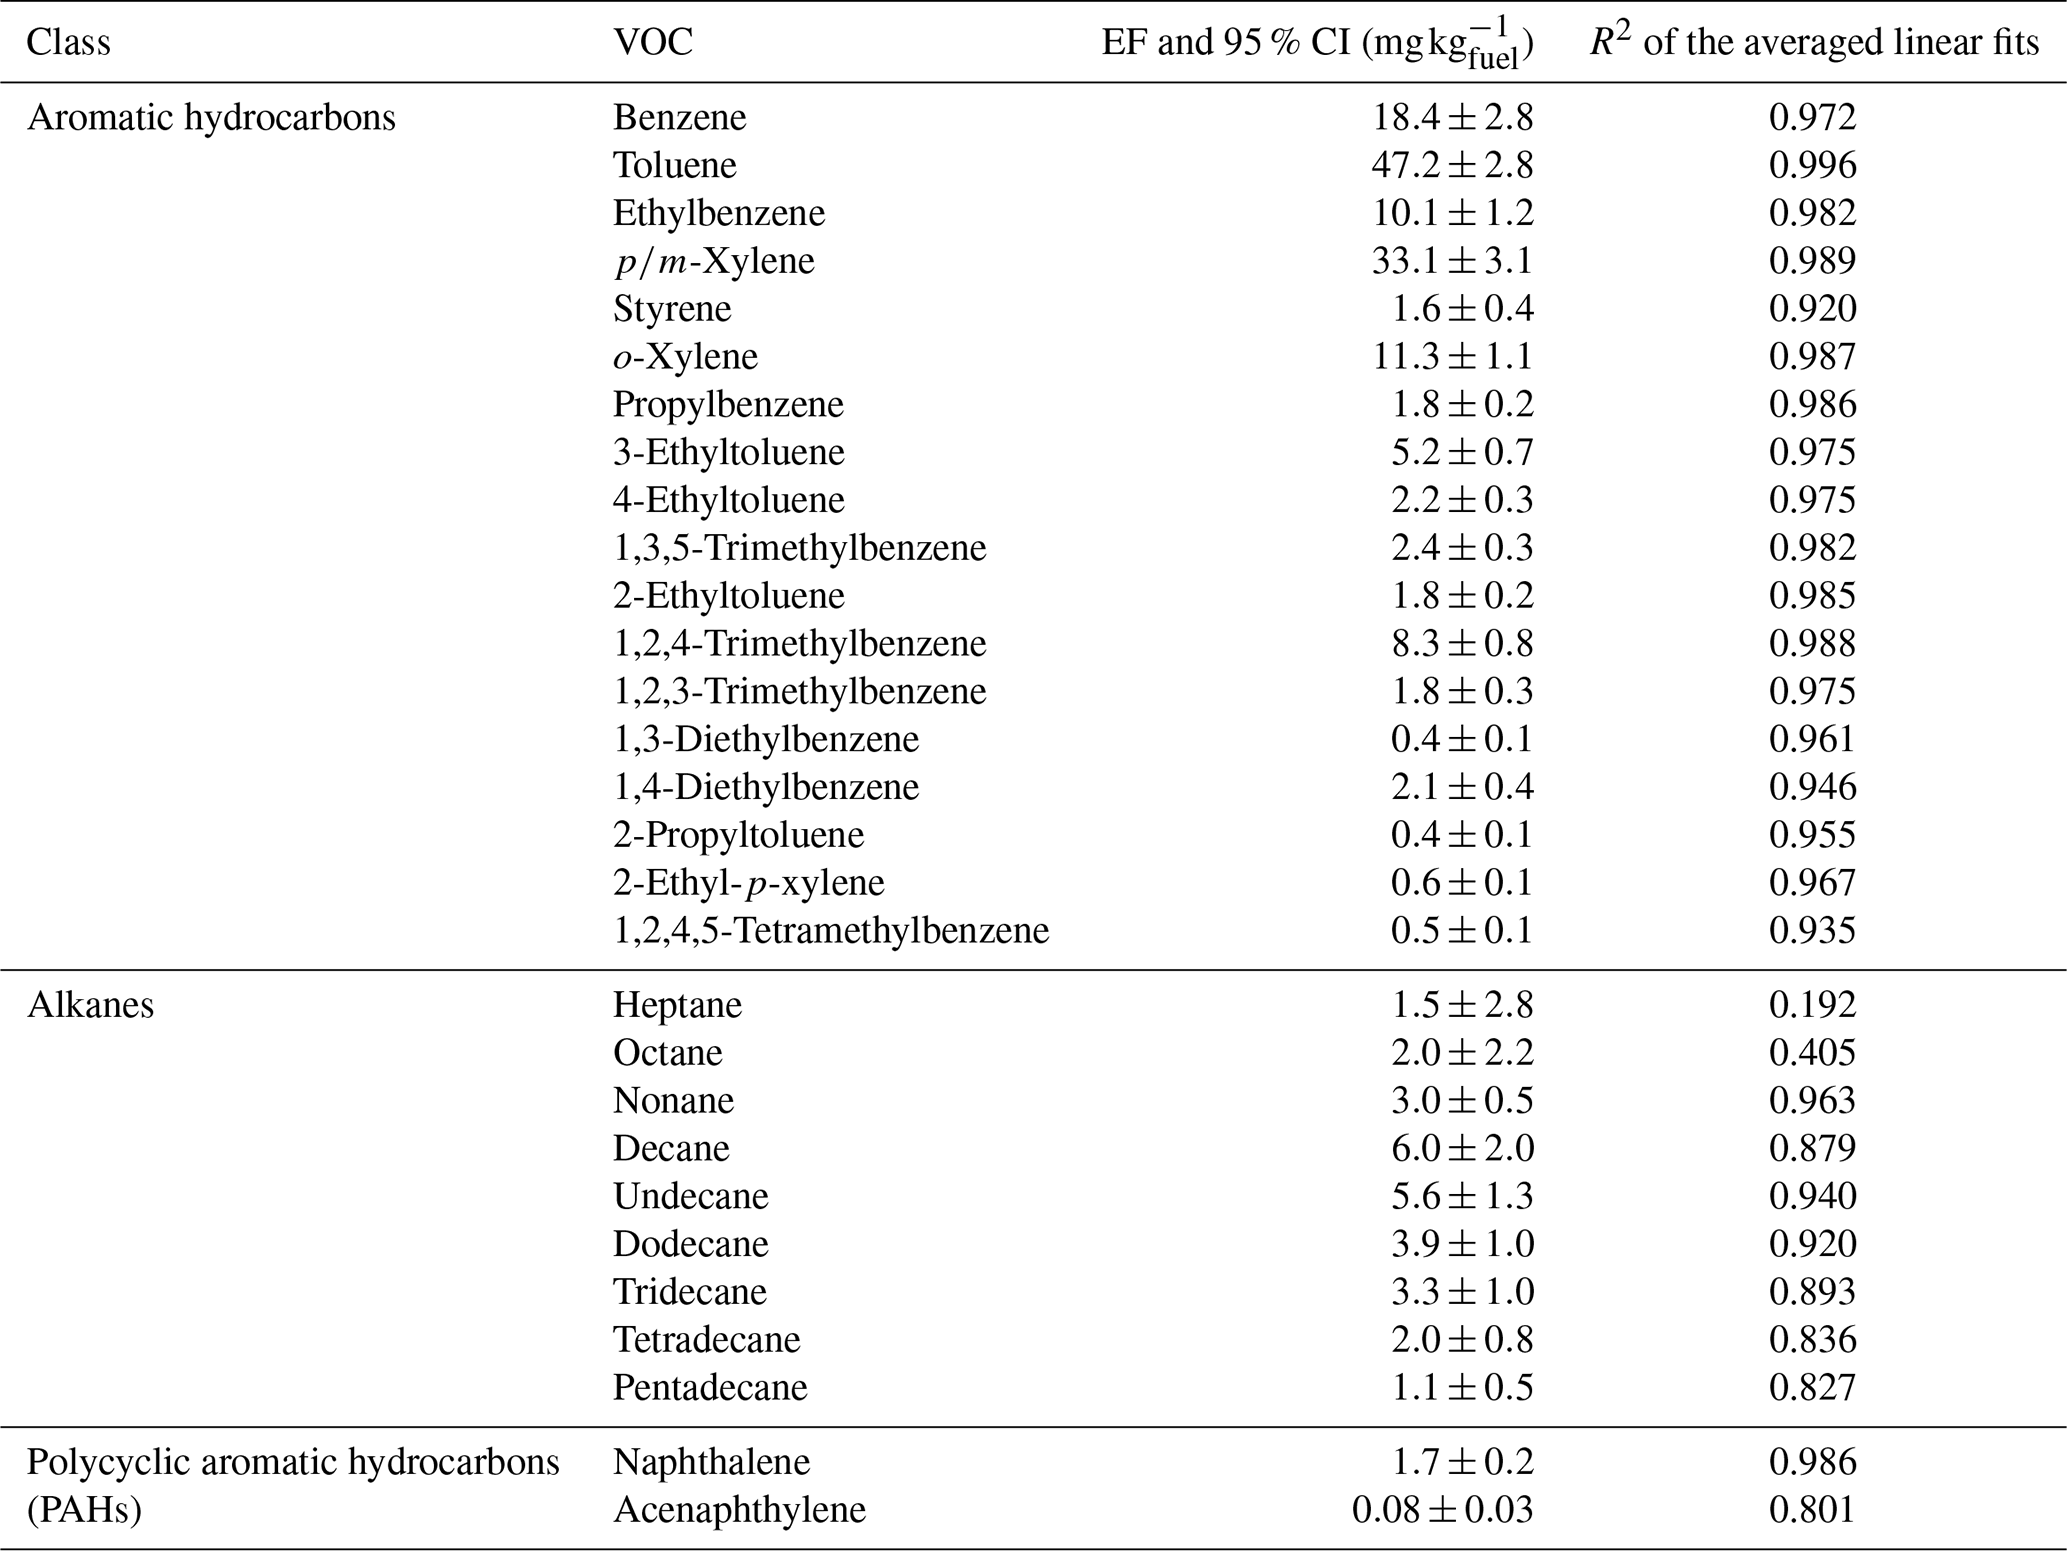
All 18 studied aromatic hydrocarbon compounds as well as naphthalene (Table 3) had a strong correlation with CO2 (R2 of the averaged linear fit>0.92). In addition, most alkane hydrocarbons correlated well with CO2. Clearly, the highest fraction of the studied VOCs were aromatic hydrocarbons, especially toluene and -xylene. Sums of the aromatic hydrocarbon, alkane and gaseous PAH EFs in Table 3 were 149.2, 28.4, and 1.8 , respectively. The high fraction of aromatic hydrocarbons was expected but, interestingly, in comparison, e.g., with studies conducted in China, the relative fraction of alkanes was lower (Qi et al., 2021; Liu et al., 2024). In general, the relative contribution of alkanes has decreased with stricter emission regulations (Liu et al., 2024). Also, total VOC emissions from vehicle exhaust have strongly decreased during the last decades (Harrison et al., 2021). As the emission regulations, fuels and vehicle fleets in general vary in different countries, these findings highlight the importance of understanding VOC emissions at the local level. In addition to these factors, also weather conditions can play a role in the VOC emissions of vehicles. For example, Wang et al. (2018b) studied toluene EFs in downtown Toronto across four seasons from 2013–2015, and found that the EF was the lowest in winter, about 90 , and highest in spring, 220 , potentially explained by the seasonal variation with changes in seasonal fuel composition. The local level understanding is also important since the direct effects as well as the O3 (Carter, 1994) and secondary aerosol (Zhao et al., 2014) formation potentials vary considerably with different VOCs. In general, the information on fleet EFs of VOCs in different locations is currently rather scarce. The utilized CO2 based fleet EF determination enables a potential and relatively simple method to estimate vehicle fleet VOC EFs in different locations and conditions.
Table 3EFs of studied aromatic hydrocarbon, alkane and gaseous PAH VOCs with confidence intervals (CI) and R2 values of the averaged linear fits.
3.2 Traffic-related inverse impact factors
3.2.1 Ozone
In addition to EFs, where concentration of a certain pollutant increases as a function of CO2, road traffic can have negative contributions to some pollutant metrics. For example, O3 was inversely proportional to CO2, i.e., its IF was negative () (Fig. 3). The O3 level was the highest when CO2 concentration was at its lowest level (420–425 ppm) and decreased steadily as CO2 increased. O3 was almost depleted at around 465 ppm of CO2 and was near zero at higher CO2 concentrations. Especially, when considering the data measured during the pollution episodes (Fig. 3), it can be seen that at the same point the increase of NO2 as a function of CO2 almost stopped, whereas the concentration of NO increased at a steeper pace (see also the diurnal variation of NOx, NO2, NO EFs and O3 IF in Fig. S10). This behavior can be explained by the chemical reactions where O3 oxidizes NO into NO2. During the pollution episodes, atmospheric mixing and dispersion were reduced (see increase in CO2), explaining why the behavior was more clearly observed during the pollution episodes. Significant differences in the O3 concentrations during inversion and non-inversion events have been reported before (see, e.g., Janhäll et al., 2006). In Fig. S11, the average diurnal pattern of O3 further supports the idea of inverse contribution of road traffic on O3 as the hours with lowest concentrations match well with the traffic rush hours.
In the context of long-term air quality trends, O3 levels have gradually decreased in urban environments since the 1960s (Wallington et al., 2022) but, unlike many other pollutants, the concentrations have increased near traffic sites in Europe (Garcia-Marlès et al., 2024). At the measurement site of the present study, an increasing trend in O3 concentrations has been identified during 2015–2019, with an annual growth rate of 3.52 % (subject to large uncertainties), while NO and NO2 levels decreased by 12.53 % yr−1 and 8.58 % yr−1, respectively (Garcia-Marles et al., 2024). This pattern is in line with observations from many European air quality monitoring stations. Hence, as NOx emissions from road traffic are expected to continue decreasing, it is possible that exposure to O3 in urban areas will increase. Therefore, controlling tropospheric O3 levels likely remains a significant challenge in terms of urban air quality in the future. The varying decreasing trends of NO and NO2 observed by Garcia-Marlès et al., 2024 are also interesting in relation to the findings shown in Fig. 3. As NOx emissions decrease, it is more likely that O3 is not depleted at traffic sites which would enhance the oxidation of NO to NO2, thereby increasing the NO2 NOx-ratio. Increasing NO2 NOx-ratios have also been found in emissions of newer cars (Carslaw and Rhys-Tyler, 2013; Carslaw et al., 2019). In current air quality recommendations by the WHO and the EU's new air quality directive (Directive (EU) 2024/2881, 2024; WHO, 2021), only the concentration of NO2 is considered. Thus, it is worth discussing whether the NO2 concentration is the most appropriate metric to estimate the air quality impacts of NOx emissions in highly trafficked locations.
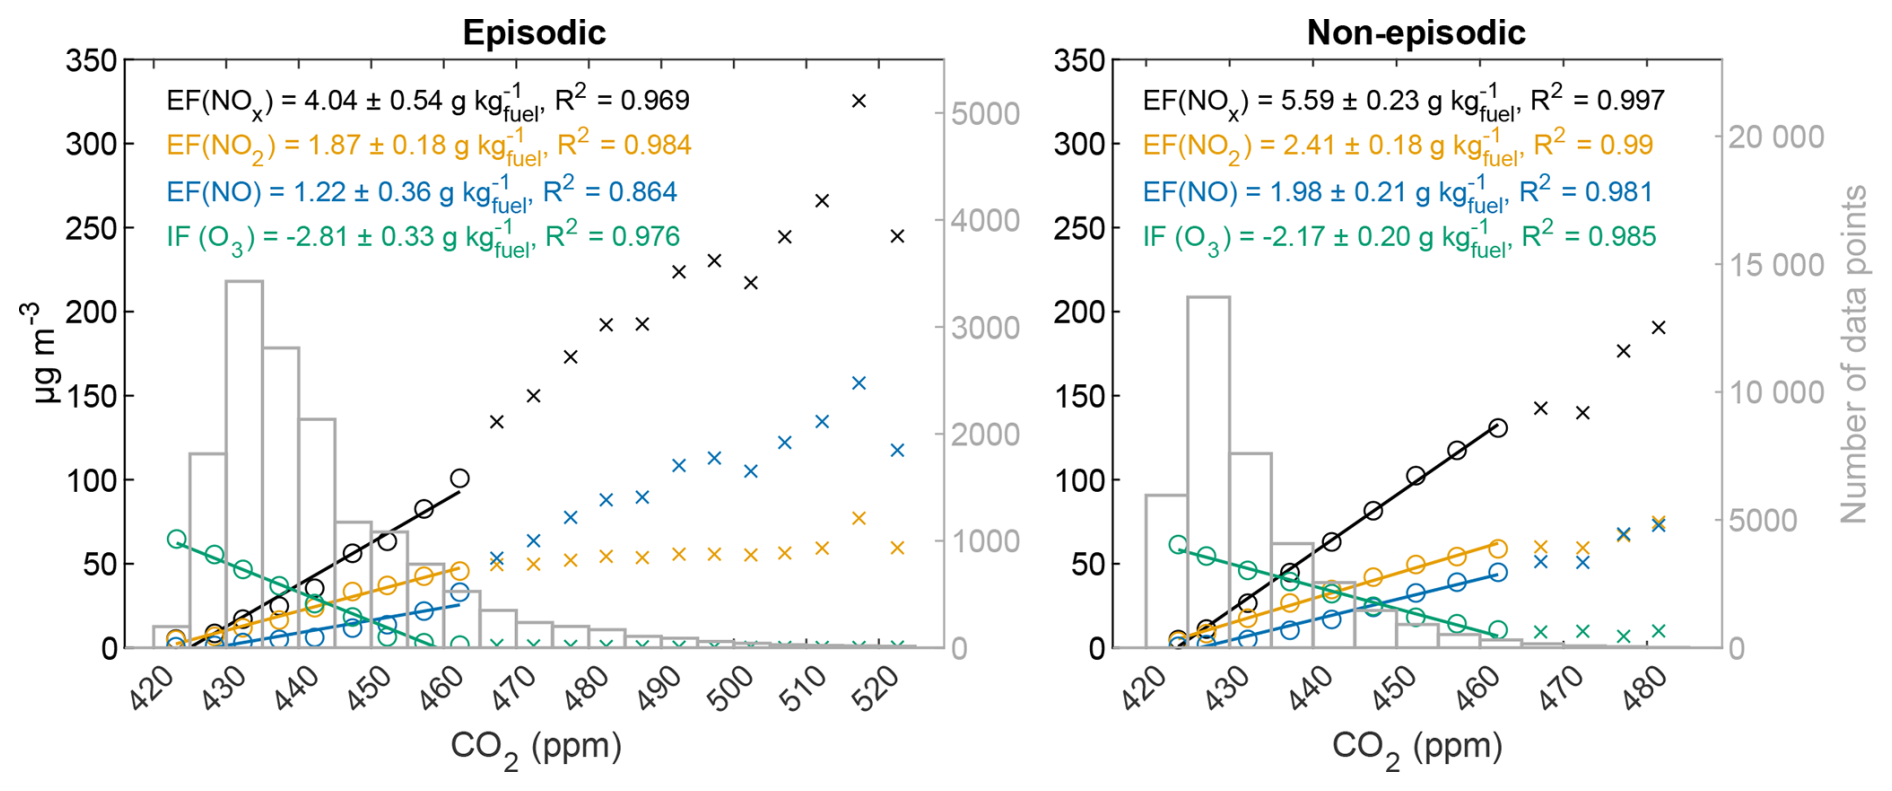
Figure 3NOx, NO, NO2 and O3 concentrations as a function of CO2 concentration and the determined EFs for NOx, NO, NO2 and the inverse IF for O3, including 95 % confidence intervals and R2 of the averaged linear fits. The episodic data on left and non-episodic data on right. Notice the different x-axis. Also, the number of data points in each CO2 concentration bin is shown.
3.2.2 Small ions
Ions, including electrically charged small particles, are constantly present in the atmosphere. Ions are formed, for example, due to ionization of air molecules by cosmic rays, natural gamma radiation and radon decay. Also, traffic is known to produce significant amounts of ions via vehicle exhaust (Yu et al., 2004; Jung and Kittelson, 2005; Maricq, 2006; Hirsikko et al., 2007; Ling et al., 2010) and braking (Thomas et al., 2024). Figure 4 presents the number concentrations of positive ions in the size ranges of 0.8–1.5, 1.5–5.0, and 5.0–38.5 nm as a function of CO2, respectively. Also, the size-resolved IFs of each negative and positive ion size bin are shown.
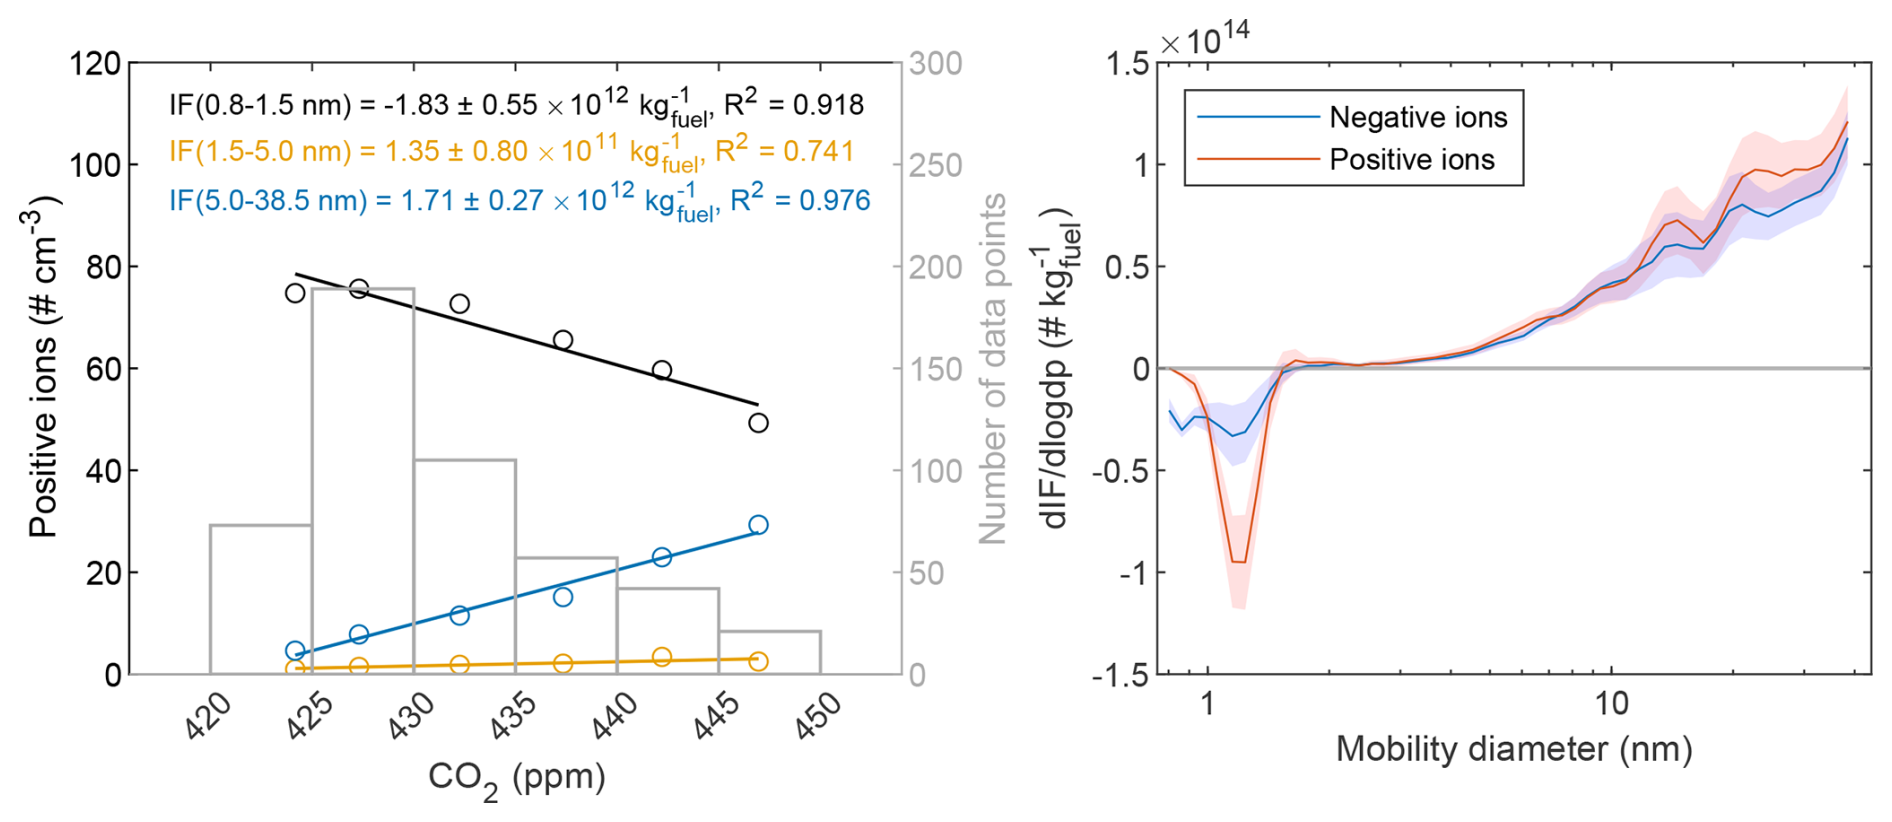
Figure 4Left: Concentrations of selected positive ions in the size ranges of 0.8–1.5, 1.5–5.0 and 5.0–38.5 nm as a function of CO2 concentration and the determined IFs with 95 % confidence intervals and R2 of the averaged linear fits. Also, the number of data points in each CO2 concentration bin is shown. Right: Size-resolved IFs of negative and positive ions with 95 % confidence intervals (shaded areas).
The results show that the small ions (, Tammet, 1995) have inverse IFs, i.e., their concentration decreases as the contribution of traffic increases, whereas the intermediate ions (3–7 nm, Tammet, 1995) and larger ions have positive IFs, i.e., their concentrations increase as a function of increased traffic. The negative IFs for the smallest ions may be a result of increased coagulation sink: As shown in Sect. 3.1, increasing CO2 concentration increased particle concentrations, which, in principle, should increase the rate at which ions collide with other particles. The road traffic's inverse contribution to small ions can also be seen when examining the diurnal ion concentration variation (Fig. S13), where the concentration of small ions is reduced during rush hours compared to less trafficked hours, supporting the observation of negative IFs. The negative effect of traffic on small ion concentrations has been observed before, e.g., by Hirsikko et al. (2007). On the other hand, direct engine exhaust measurements have indicated that road traffic is a source of these smallest ions (Lähde et al., 2009). Thus, the results show a paradox: road traffic emits small sub-2 nm ions but, at the same time, increased road traffic decreases the concentration of these smallest ions in ambient air. Interestingly, the inverse effect of increased CO2 on small ions is more significant with positive ions. Hence, in addition to coagulation, other processes such as recombination could potentially affect the inverse IF of small ions. For example, braking is a more significant source of negatively charged particles compared to positively charged (Thomas et al., 2024). Overall, the concentrations of positive ions were generally higher (Fig. S13), which could affect the result as well.
Road traffic is a source of secondary aerosol precursors, but it is also a sink for small ions, which both have impacts on new particle formation. In general, ion-induced new particle formation is not considered as a dominant mechanism of new particle formation in urban areas even though the process can be important in clean and pristine environments (Lehtipalo et al., 2025). Overall, the analysis of the small ion concentrations as a function of CO2 enables estimation of the effects of road traffic as a sink for small ion concentration. By combining this analysis with size-resolved EF of particle number, the method could be potential for estimating the production and removal processes of ions in urban environments.
3.3 Traffic-related positive impact factors of terpenoids
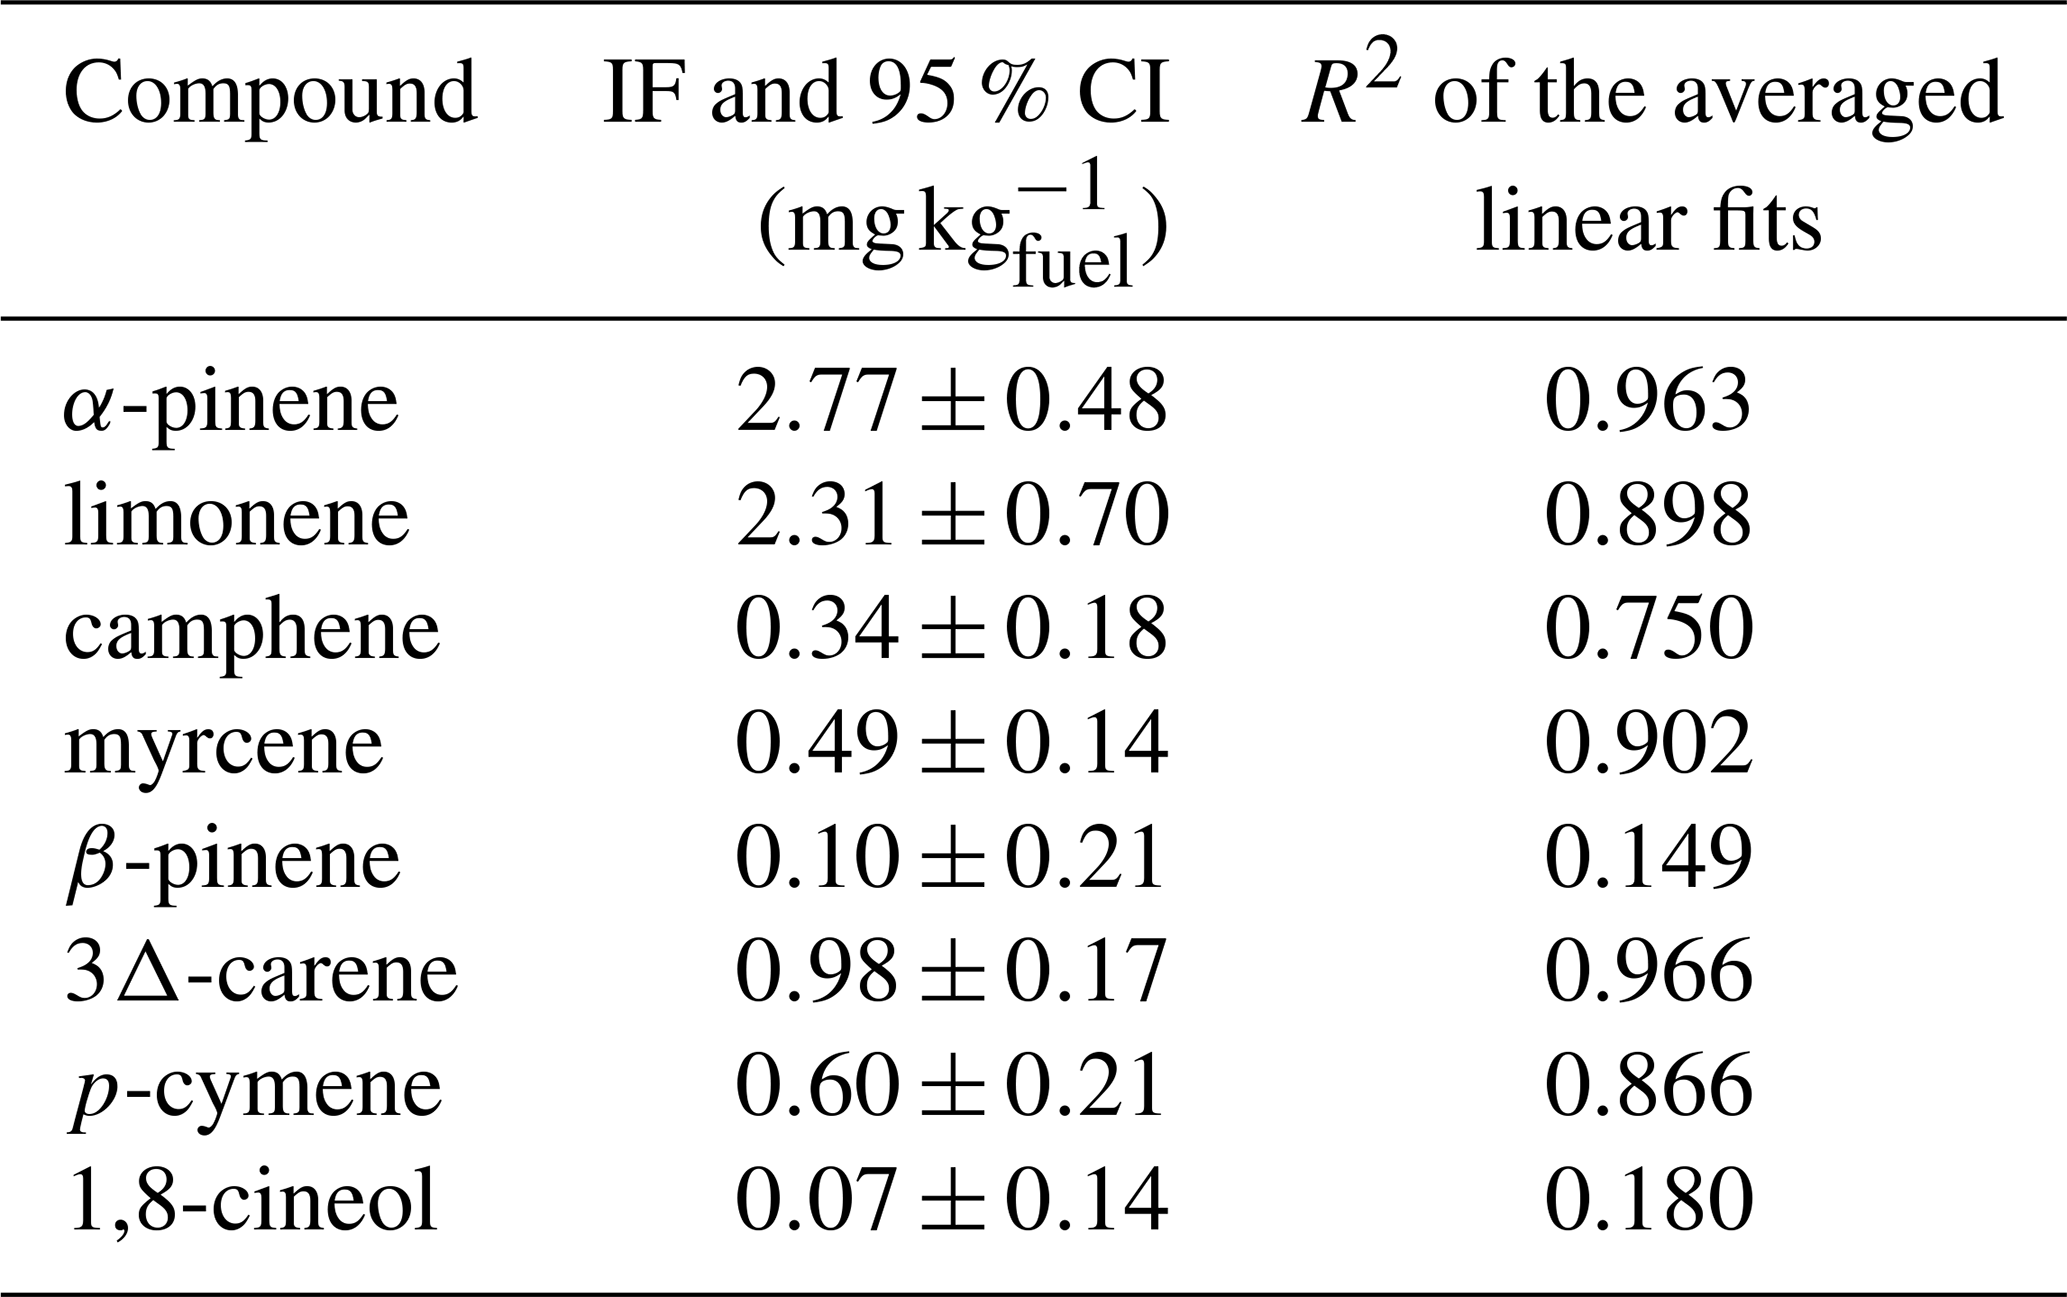
Many terpenoid VOCs, which are typically considered to originate mainly from biogenic sources, had a clear correlation with CO2 at the Supersite (Figs. 5, S12 and Table 4). Out of the studied 8 terpenoids, only β-pinene and 1,8-cineol had poor correlation (Table 4) with CO2 in the averaged linear fits. The connection with CO2 seemed to be especially strong with α-pinene and limonene (). In winter, natural sources should emit negligible amounts of terpenoids (Hellén et al., 2021; Hakola et al., 2023). Elevated terpenoid concentrations have been observed in urban areas, and the elevated concentrations have been linked to population density, indicating human influence. For example, wood combustion, detergents and cosmetics have been suggested as potential sources of terpenoids in urban areas (Gilman et al., 2015; McDonald et al., 2018; Coggon et al., 2021). However, the results suggest that terpenoids could be directly linked to road traffic as well. In previous source apportionment studies, some fractions of terpenoids, especially isoprene and α-pinene, have been included in factors linked to traffic and combustion (Borbon et al., 2001; Hellén et al., 2012; Xiong et al., 2020; Zhang et al., 2020). Also, Borbon et al. (2023) have reported the connection between road traffic and monoterpenes, but, overall, the mechanism linking road traffic to terpenoid emissions remains poorly understood, as, in addition to tailpipe emissions, other contributing factors are likely. For example, as limonene is found in many cleanser products, the correlation with the CO2 and road traffic could potentially be related to the number of recently washed vehicles on the street and the use of windshield washer fluid. As the contribution of natural sources in this study should be minimal, the results indicate that road traffic has direct effects on terpenoid concentrations in urban environments. Further studies on the terpenoid IFs in other environments and conditions could, hence, be beneficial to understand the mechanisms and atmospheric implications of road traffic influenced terpenoids, as they can strongly contribute to the reactivity of anthropogenic VOC emissions in urban areas (Borbon et al., 2023).
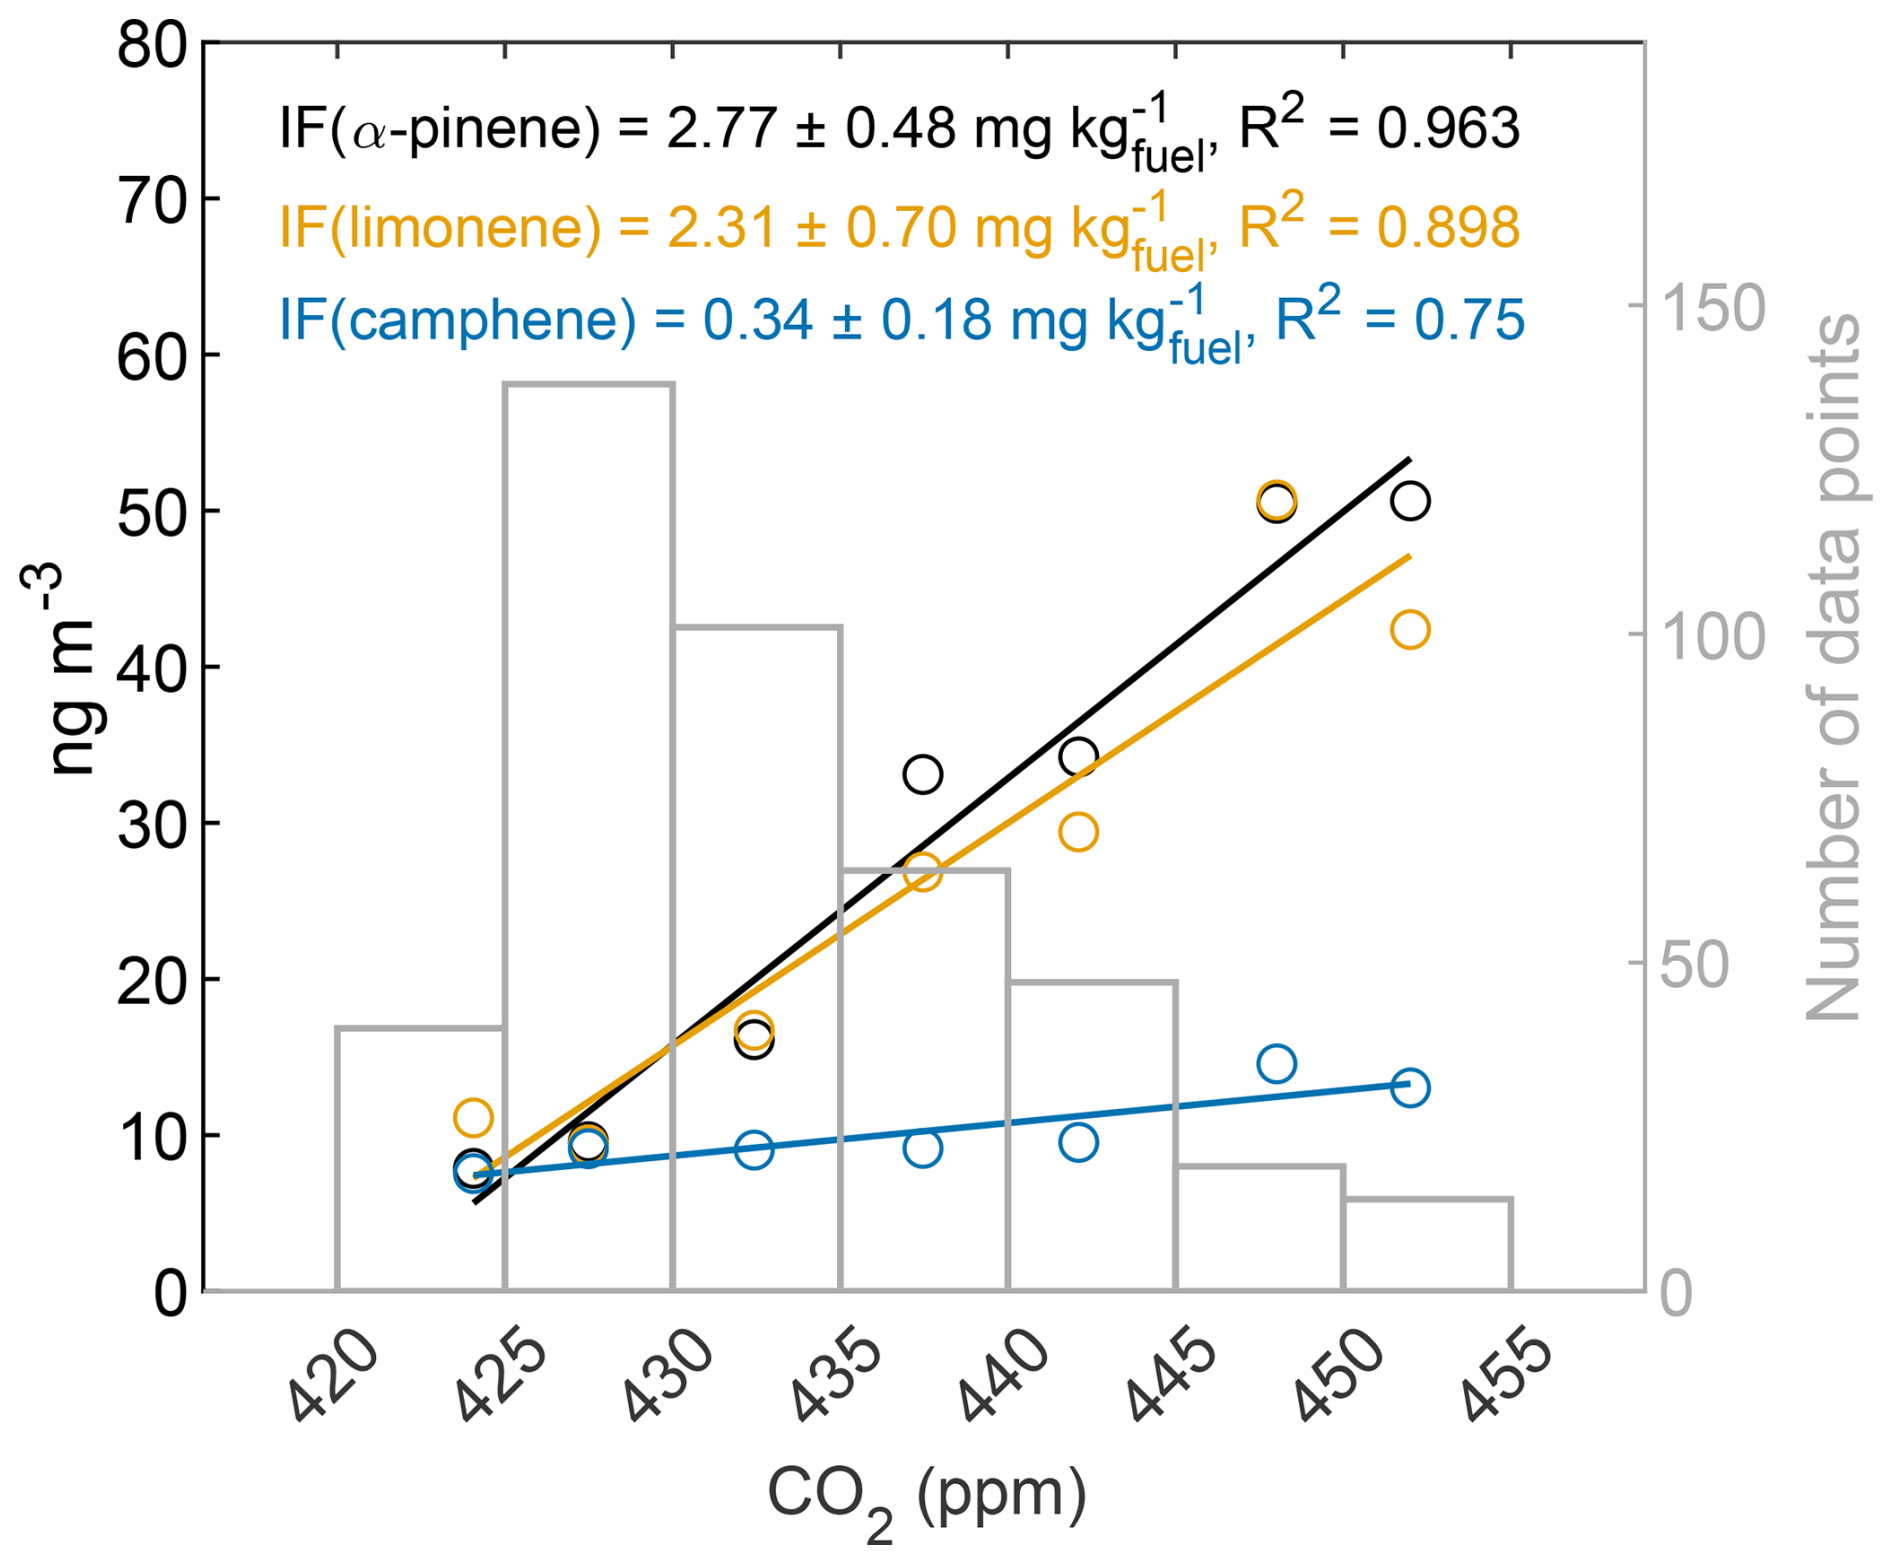
Figure 5Concentrations of selected terpenoids (α-pinene, limonene and camphene) as a function of CO2 concentration and the determined IFs with 95 % confidence intervals and R2 of the averaged linear fits. Also, the number of data points in each CO2 concentration bin is shown.
Table 4Terpenoid IFs with confidence intervals (CI) and R2 values of the averaged linear fits.
3.4 Comparison of episodic and non-episodic data
The three regional and long-range transported pollution episodes that occurred during the campaign had effects on the relationship between the studied metrics and CO2 concentration. For example, the EFs of BC (+31 %), CO (+74 %), PM10 (+65 %), benzene (+137 %), α-pinene (171 %) and especially PM2.5 (+219 %) increased during the episodes compared to the non-episodic periods (Tables S6 and S7). On the contrary, the EFs of PN (−54 %) and nitrogen oxides (−38 % to −22 %) were considerably lower during the episodic periods. This result could be affected by many potential factors. First, during the episodes, temperature inversions likely decreased the dilution and dispersion of emissions at the studied sites. Hence, the measured aerosol could have been relatively more aged, increasing the particle mass and decreasing the number concentration. Second, other meteorological conditions themselves could affect the road traffic emissions: colder temperatures may cause cooler engine temperature and influence the operation of exhaust after-treatment systems (Suarez-Bertoa and Astorga, 2018) used in vehicles. Third, the increased PM, CO, benzene and BC EFs may be related to residential wood combustion, which has been shown to be a significant contributor to absolute pollutant concentrations during the episodes (Teinilä et al., 2025). Thus, even though CO2 is generally a good tracer for road traffic, the CO2-based EF-calculation could be challenging if there are other major sources of the studied pollutants and CO2 nearby. The decreased EFs of PN and nitrogen oxides support this theory as the contribution of residential wood combustion to these metrics is typically lower compared to traffic.
Even though the results of this study show that CO2 EF-calculation is a good method to observe the direct, and indirect, effects of road traffic, the mentioned uncertainty related to other contributing pollution sources should generally be better acknowledged. For example, an EF of 88 for sulfates was determined during the episodes, whereas during the non-episodic periods, the connection between the sulfates and CO2 was poor (Fig. 6). Therefore, according to the non-episodic data, road traffic is not a direct source of sulfates near traffic, but based on the episodic data, one could misinterpret the data to conclude road traffic as a clear source of sulfate. The correlation between CO2 and nitrate was also higher during the episodes, which is reasonable, as it was speculated that during the pollution episodes aerosols were relatively more aged, and NOx emitted from vehicles could have oxidized to nitrate. In addition, changes with the determined VOC EFs (Table S6) were observed during the episodic periods, especially for benzene and terpenoids, which are known to have contributions higher than those from traffic exhausts in wood combustion emissions (Gilman et al., 2015). On the other hand, the correlations were generally weaker during the episodic periods, supporting the idea that the non-episodic results better describe the influence of road traffic. Overall, the results show that without identification of interfering external pollutant sources, the obtained EFs could be misleading. This uncertainty needs to be considered when determining EFs in ambient measurements as well as when comparing EF results between different studies, sites, and environments. In this study, the non-episodic EFs and IFs identified can be considered to accurately represent the effects of wintertime road traffic in Helsinki central area, as CO2 was well connected with the road traffic rate, the regional pollution levels during the non-episodic periods were low and the linkages of studied pollutants were strong with CO2 (Figs. S2–S4, Table S4). Still, it is good to note that other urban pollution sources can have slight effects on the results. Also, weather conditions during the campaign likely influenced especially the parameters that are strongly dependent on the atmospheric chemistry, such as O3. Hence, it should be noted that the results represent the situation at the studied location during the average conditions of the measurement campaign.
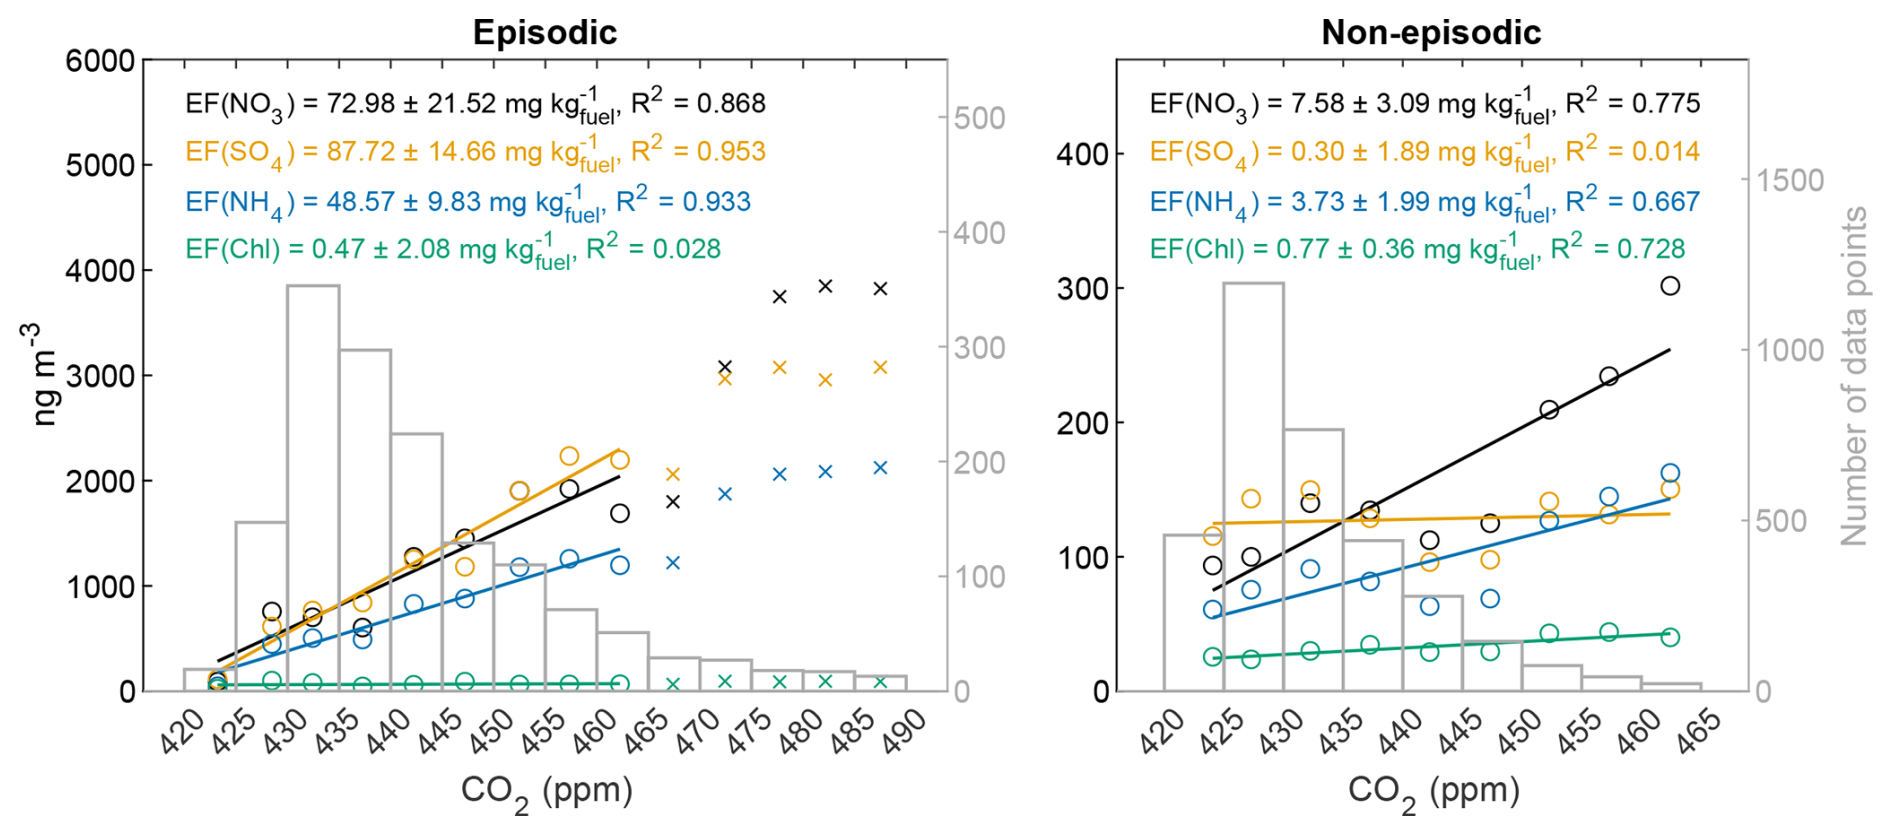
Figure 6Concentrations of nitrates (NO3), sulphates (SO4), ammonium (NH4) and chloride (Chl) as a function of CO2 concentration and the determined EFs, including 95 % confidence intervals and R2 of the averaged linear fits. The episodic data on left and non-episodic data on right. Notice the different x- and y-axes. Also, the number of data points in each CO2 concentration bin is shown. See Fig. S14 for organics.
Wintertime road traffic emission factors for various air pollutants were determined in a street canyon environment in Helsinki city center, Finland. In case of regulated pollutants such as PM2.5, BC, PN and nitrogen oxides, the determined fleet EFs were considerably higher than required for new vehicles in EURO6 standard since 2014, showing that despite tightening regulations, effects of road traffic on urban air quality can remain high. This result is likely related to the slow renewal of vehicle fleet, as well as the presence of super-emitters such as old heavy-duty vehicles, vans and vehicles with malfunctioning exhaust aftertreatment systems. In the case of PN, it is worth considering whether the current or proposed emission regulations are indeed effective in reducing the concentrations of the UFPs that are formed in exhaust during exhaust cooling and dilution after the tailpipe. The EFs of particle chemical components showed that the particle mass emissions from road traffic exhaust are mainly composed of organics and black carbon. The clearly higher PM10 EF compared to PM2.5 EF also suggests an important contribution of non-exhaust emissions to particulate emissions. The VOC emissions of road traffic were the most attributable to aromatic hydrocarbons, especially to toluene and -xylene.
In addition to direct EFs, we showed that the CO2-based EF-calculation can be beneficial when investigating inversely proportional impact factors (IF) related to road traffic. Concentrations of O3 and small ions decreased linearly as a function of increasing CO2. Even though the negative contributions of road traffic to these metrics have been reported before, the utilized approach can be fruitful in terms of air quality modelling and when estimating the magnitude of these effects with respect to traffic rates as well as formation and removal rates of atmospheric gases and ions. For example, it was found that in cases of high CO2 concentration, i.e. high traffic volume, NO2 concentration remained constant regardless of increasing CO2 and the increase of NOx was almost completely contributed by NO. This phenomenon was linked to near-zero O3 concentration which caused that NO was no further oxidized to NO2. The approach could, hence, be useful when estimating and modelling NO NO2 concentrations in urban environments. As the inverse effects of road traffic are likely location and condition dependent, the presented approach to calculate IFs would be a rather simple method to estimate these effects in different circumstances.
Furthermore, the contribution of road traffic to compounds that generally have not been considered to be traffic-influenced was found. Positive IFs of road traffic were found for terpenoid VOCs, especially α-pinene and limonene. Terpenoid VOC concentrations have been earlier connected with human activity and traffic, but the connection is not completely understood. Hence, the results further support the idea that road traffic could have direct effects on these compounds.
Overall, the determined up-to-date fleet EFs of vehicles in winter conditions provide valuable insights into the performance of current emission regulations as well as potential future regulatory actions. Also, the findings related to the terpenoid VOCs, together with the observed inverse IFs on O3 and small ions, show that the CO2-based EF calculation is an effective approach to investigate not only the direct emissions but also the indirect and unconventional effect of road traffic on urban air. Due to these effects, the influence of road traffic should not be considered only as a linear multiplication of direct emissions and traffic rate, as with some pollutants, the influence of traffic may follow a step-function-like behavior. On the other hand, the data measured during the pollution episodes showed that the method is also vulnerable to misinterpretations if background concentrations or effects of other sources cannot be recognized. In all, our results show the benefits of determining and reporting CO2-based EFs in traffic-influenced ambient measurements to observe the impacts of road traffic on urban air with a broad perspective, highlighting the potential to gain insights into the spatial variability of these effects if utilized in further studies in different locations and regions.
The raw data is from the measurement report by Teinilä et al. (2025). Data shown in the figures and tables is available: https://doi.org/10.5281/zenodo.22708187 (Lepistö and Savolainen, 2026).
The supplement related to this article is available online at https://doi.org/10.5194/acp-26-14823-2026-supplement.
LKS: Conceptualization, Methodology, Validation, Formal analysis, Investigation, Data Curation, Visualization, Writing – Original Draft, Writing – Review and Editing. TL: Conceptualization, Methodology, Supervision, Investigation, Writing – Original Draft, Writing – Review and Editing. HH: Methodology, Investigation, Data Curation, Writing – Review and Editing. HL: Methodology, Investigation, Writing – Review and Editing. MJ: Investigation, Writing – Review and Editing. JVN: Methodology, Data Curation, Writing – Review and Editing. KT: Methodology, Investigation, Writing – Review and Editing. MA: Methodology, Investigation, Data Curation, Writing – Review and Editing. ML: Methodology, Investigation, Data Curation, Writing – Review and Editing. AK: Formal analysis, Writing – Review and Editing. JL: Investigation, Data Curation, Writing – Review and Editing. KL: Funding acquisition, Writing – Review and Editing. TP: Methodology, Writing – Review and Editing. MDM: Writing – Review and Editing. HEM: Resources, Project administration, Writing – Review and Editing. HT: Methodology, Project administration, Funding acquisition, Writing – Review and Editing. TR: Conceptualization, Methodology, Supervision, Project administration, Funding acquisition, Writing – Review and Editing.
At least one of the (co-)authors is a member of the editorial board of Atmospheric Chemistry and Physics. The peer-review process was guided by an independent editor, and the authors also have no other competing interests to declare.
Publisher's note: Copernicus Publications remains neutral with regard to jurisdictional claims made in the text, published maps, institutional affiliations, or any other geographical representation in this paper. The authors bear the ultimate responsibility for providing appropriate place names. Views expressed in the text are those of the authors and do not necessarily reflect the views of the publisher.
This work has received funding from BC Footprint (530/31/2019) and GIANT (Global trends in IAQ: Novel technologies, Competence and Business) (5582/31/2023)-projects, funded by Business Finland, participating companies and municipal actors.
We gratefully acknowledge Academy of Finland Flagship funding Atmosphere and Climate Competence Centre, ACCC (grant no. 337552, 337551).
We acknowledge funding from Finnish Research Impact Foundation (grant no. 4708620)
This research has been supported by the Business Finland (grant nos. 530/31/2019 and 5582/31/2023), the Research Council of Finland (grant nos. 337552 and 337551), and the Finnish Research Impact Foundation (grant no. 4708620).
This paper was edited by Thomas Karl and reviewed by two anonymous referees.
Anttila, P., Tuovinen, J.-P., and Niemi, J. V.: Primary NO2 emissions and their role in the development of NO2 concentrations in a traffic environment, Atmos. Environ., 45, 986–992, https://doi.org/10.1016/j.atmosenv.2010.10.050, 2011.
Barreira, L. M. F., Helin, A., Aurela, M., Teinilä, K., Friman, M., Kangas, L., Niemi, J. V., Portin, H., Kousa, A., Pirjola, L., Rönkkö, T., Saarikoski, S., and Timonen, H.: In-depth characterization of submicron particulate matter inter-annual variations at a street canyon site in northern Europe, Atmos. Chem. Phys., 21, 6297–6314, https://doi.org/10.5194/acp-21-6297-2021, 2021.
Borbon, A., Fontaine, H., Veillerot, M., Locoge, N., Galloo, J. C., and Guillermo, R.: An investigation into the traffic-related fraction of isoprene at an urban location, Atmos. Environ., 35, 3749–3760, https://doi.org/10.1016/S1352-2310(01)00170-4, 2001.
Borbon, A., Dominutti, P., Panopoulou, A., Gros, V., Sauvage, S., Farhat, M., Afif, C., Elguindi, N., Fornaro, A., Granier, C., Hopkins, J. R., Liakakou, E., Nogueira, T., Santos, T. C. dos, Salameh, T., Armangaud, A., Piga, D., and Perrussel, O.: Ubiquity of Anthropogenic Terpenoids in Cities Worldwide: Emission Ratios, Emission Quantification and Implications for Urban Atmospheric Chemistry, J. Geophys. Res.-Atmos., 128, e2022JD037566, https://doi.org/10.1029/2022JD037566, 2023.
Bousiotis, D., Pope, F. D., Beddows, D. C. S., Dall'Osto, M., Massling, A., Nøjgaard, J. K., Nordstrøm, C., Niemi, J. V., Portin, H., Petäjä, T., Perez, N., Alastuey, A., Querol, X., Kouvarakis, G., Mihalopoulos, N., Vratolis, S., Eleftheriadis, K., Wiedensohler, A., Weinhold, K., Merkel, M., Tuch, T., and Harrison, R. M.: A phenomenology of new particle formation (NPF) at 13 European sites, Atmos. Chem. Phys., 21, 11905–11925, https://doi.org/10.5194/acp-21-11905-2021, 2021.
Bukowiecki, N., Lienemann, P., Hill, M., Furger, M., Richard, A., Amato, F., Prévôt, A. S. H., Baltensperger, U., Buchmann, B., and Gehrig, R.: PM10 emission factors for non-exhaust particles generated by road traffic in an urban street canyon and along a freeway in Switzerland, Atmos. Environ., 44, 2330–2340, https://doi.org/10.1016/j.atmosenv.2010.03.039, 2010.
Carslaw, D. C. and Rhys-Tyler, G.: New insights from comprehensive on-road measurements of NOx, NO2 and NH3 from vehicle emission remote sensing in London, UK, Atmos. Environ., 81, 339–347, https://doi.org/10.1016/j.atmosenv.2013.09.026, 2013.
Carslaw, D. C., Farren, N. J., Vaughan, A. R., Drysdale, W. S., Young, S., and Lee, J. D.: The diminishing importance of nitrogen dioxide emissions from road vehicle exhaust, Atmos. Environ. X, 1, 100002, https://doi.org/10.1016/j.aeaoa.2018.100002, 2019.
Carter, W. P. L.: Development of Ozone Reactivity Scales for Volatile Organic Compounds, Air and Waste, 44, 881–899, https://doi.org/10.1080/1073161X.1994.10467290, 1994.
Chaturvedi, S., Kumar, A., Singh, V., Chakraborty, B., Kumar, R., and Min, L.: Recent Advancement in Organic Aerosol Understanding: a Review of Their Sources, Formation, and Health Impacts, Water Air Soil Pollut, 234, 750, https://doi.org/10.1007/s11270-023-06772-0, 2023.
Chen, G., Canonaco, F., Tobler, A., Aas, W., Alastuey, A., Allan, J., Atabakhsh, S., Aurela, M., Baltensperger, U., Bougiatioti, A., De Brito, J. F., Ceburnis, D., Chazeau, B., Chebaicheb, H., Daellenbach, K. R., Ehn, M., El Haddad, I., Eleftheriadis, K., Favez, O., Flentje, H., Font, A., Fossum, K., Freney, E., Gini, M., Green, D. C., Heikkinen, L., Herrmann, H., Kalogridis, A.-C., Keernik, H., Lhotka, R., Lin, C., Lunder, C., Maasikmets, M., Manousakas, M. I., Marchand, N., Marin, C., Marmureanu, L., Mihalopoulos, N., Močnik, G., Nęcki, J., O'Dowd, C., Ovadnevaite, J., Peter, T., Petit, J.-E., Pikridas, M., Matthew Platt, S., Pokorná, P., Poulain, L., Priestman, M., Riffault, V., Rinaldi, M., Różański, K., Schwarz, J., Sciare, J., Simon, L., Skiba, A., Slowik, J. G., Sosedova, Y., Stavroulas, I., Styszko, K., Teinemaa, E., Timonen, H., Tremper, A., Vasilescu, J., Via, M., Vodička, P., Wiedensohler, A., Zografou, O., Cruz Minguillón, M., and Prévôt, A. S. H.: European aerosol phenomenology – 8: Harmonised source apportionment of organic aerosol using 22 Year-long ACSM/AMS datasets, Environ. Int., 166, 107325, https://doi.org/10.1016/j.envint.2022.107325, 2022.
Choi, W., Ranasinghe, D., Bunavage, K., DeShazo, J. R., Wu, L., Seguel, R., Winer, A. M., and Paulson, S. E.: The effects of the built environment, traffic patterns, and micrometeorology on street level ultrafine particle concentrations at a block scale: Results from multiple urban sites, Sci. Total Environ., 553, 474–485, https://doi.org/10.1016/j.scitotenv.2016.02.083, 2016.
Coggon, M. M., Gkatzelis, G. I., McDonald, B. C., Gilman, J. B., Schwantes, R. H., Abuhassan, N., Aikin, K. C., Arend, M. F., Berkoff, T. A., Brown, S. S., Campos, T. L., Dickerson, R. R., Gronoff, G., Hurley, J. F., Isaacman-VanWertz, G., Koss, A. R., Li, M., McKeen, S. A., Moshary, F., Peischl, J., Pospisilova, V., Ren, X., Wilson, A., Wu, Y., Trainer, M., and Warneke, C.: Volatile chemical product emissions enhance ozone and modulate urban chemistry, P. Natl. Acad. Sci. USA, 118, e2026653118, https://doi.org/10.1073/pnas.2026653118, 2021.
Daellenbach, K. R., Uzu, G., Jiang, J., Cassagnes, L.-E., Leni, Z., Vlachou, A., Stefenelli, G., Canonaco, F., Weber, S., Segers, A., Kuenen, J. J. P., Schaap, M., Favez, O., Albinet, A., Aksoyoglu, S., Dommen, J., Baltensperger, U., Geiser, M., El Haddad, I., Jaffrezo, J.-L., and Prévôt, A. S. H.: Sources of particulate-matter air pollution and its oxidative potential in Europe, Nature, 587, 414–419, https://doi.org/10.1038/s41586-020-2902-8, 2020.
Dallmann, T. R., Onasch, T. B., Kirchstetter, T. W., Worton, D. R., Fortner, E. C., Herndon, S. C., Wood, E. C., Franklin, J. P., Worsnop, D. R., Goldstein, A. H., and Harley, R. A.: Characterization of particulate matter emissions from on-road gasoline and diesel vehicles using a soot particle aerosol mass spectrometer, Atmos. Chem. Phys., 14, 7585–7599, https://doi.org/10.5194/acp-14-7585-2014, 2014.
Damayanti, S., Harrison, R. M., Pope, F., and Beddows, D. C. S.: Limited impact of diesel particle filters on road traffic emissions of ultrafine particles, Environ. Int., 174, 107888, https://doi.org/10.1016/j.envint.2023.107888, 2023.
Directive (EU) 2024/2881: of the European Parliament and of the Council of 23 October 2024 on ambient air quality and cleaner air for Europe (recast), PE/88/2024/REV/1, http://data.europa.eu/eli/dir/2024/2881/oj (last access: 1 September 2026), 2024.
Drinovec, L., Močnik, G., Zotter, P., Prévôt, A. S. H., Ruckstuhl, C., Coz, E., Rupakheti, M., Sciare, J., Müller, T., Wiedensohler, A., and Hansen, A. D. A.: The “dual-spot” Aethalometer: an improved measurement of aerosol black carbon with real-time loading compensation, Atmos. Meas. Tech., 8, 1965–1979, https://doi.org/10.5194/amt-8-1965-2015, 2015.
Enroth, J., Saarikoski, S., Niemi, J., Kousa, A., Ježek, I., Močnik, G., Carbone, S., Kuuluvainen, H., Rönkkö, T., Hillamo, R., and Pirjola, L.: Chemical and physical characterization of traffic particles in four different highway environments in the Helsinki metropolitan area, Atmos. Chem. Phys., 16, 5497–5512, https://doi.org/10.5194/acp-16-5497-2016, 2016.
Gaga, E. O., Arı, A., Akyol, N., Üzmez, Ö. Ö., Kara, M., Chow, J. C., Watson, J. G., Özel, E., Döğeroğlu, T., and Odabasi, M.: Determination of real-world emission factors of trace metals, EC, OC, BTEX, and semivolatile organic compounds (PAHs, PCBs and PCNs) in a rural tunnel in Bilecik, Turkey, Sci. Total Environ., 643, 1285–1296, https://doi.org/10.1016/j.scitotenv.2018.06.227, 2018.
Garcia-Marlès, M., Lara, R., Reche, C., Pérez, N., Tobías, A., Savadkoohi, M., Beddows, D., Salma, I., Vörösmarty, M., Weidinger, T., Hueglin, C., Mihalopoulos, N., Grivas, G., Kalkavouras, P., Ondráček, J., Zíková, N., Niemi, J. V., Manninen, H. E., Green, D. C., Tremper, A. H., Norman, M., Vratolis, S., Eleftheriadis, K., Gómez-Moreno, F. J., Alonso-Blanco, E., Wiedensohler, A., Weinhold, K., Merkel, M., Bastian, S., Hoffmann, B., Altug, H., Petit, J.-E., Favez, O., Dos Santos, S. M., Putaud, J.-P., Dinoi, A., Contini, D., Timonen, H., Lampilahti, J., Petäjä, T., Pandolfi, M., Hopke, P. K., Harrison, R. M., Alastuey, A., and Querol, X.: Inter-annual trends of ultrafine particles in urban Europe, Environ. Int., 185, 108510, https://doi.org/10.1016/j.envint.2024.108510, 2024.
Gilman, J. B., Lerner, B. M., Kuster, W. C., Goldan, P. D., Warneke, C., Veres, P. R., Roberts, J. M., de Gouw, J. A., Burling, I. R., and Yokelson, R. J.: Biomass burning emissions and potential air quality impacts of volatile organic compounds and other trace gases from fuels common in the US, Atmos. Chem. Phys., 15, 13915–13938, https://doi.org/10.5194/acp-15-13915-2015, 2015.
Grange, S. K., Farren, N. J., Vaughan, A. R., Rose, R. A., and Carslaw, D. C.: Strong Temperature Dependence for Light-Duty Diesel Vehicle NOx Emissions, Environ. Sci. Technol., 53, 6587–6596, https://doi.org/10.1021/acs.est.9b01024, 2019.
Grigoratos, T. and Martini, G.: Brake wear particle emissions: a review, Environ. Sci. Pollut. R., 22, 2491–2504, https://doi.org/10.1007/s11356-014-3696-8, 2015.
Hakola, H., Taipale, D., Praplan, A., Schallhart, S., Thomas, S., Tykkä, T., Helin, A., Bäck, J., and Hellén, H.: Emissions of volatile organic compounds from Norway spruce and potential atmospheric impacts, Front. For. Glob. Change, 6, 1116414, https://doi.org/10.3389/ffgc.2023.1116414, 2023.
Hansen, A. D. A., Rosen, H., and Novakov, T.: The aethalometer – An instrument for the real-time measurement of optical absorption by aerosol particles, Sci. Total Environ., 36, 191–196, https://doi.org/10.1016/0048-9697(84)90265-1, 1984.
Harrison, R. M., Allan, J., Carruthers, D., Heal, M. R., Lewis, A. C., Marner, B., Murrells, T., and Williams, A.: Non-exhaust vehicle emissions of particulate matter and VOC from road traffic: A review, Atmos. Environ., 262, 118592, https://doi.org/10.1016/j.atmosenv.2021.118592, 2021.
Hellén, H., Tykkä, T., and Hakola, H.: Importance of monoterpenes and isoprene in urban air in northern Europe, Atmos. Environ., 59, 59–66, https://doi.org/10.1016/j.atmosenv.2012.04.049, 2012.
Hellén, H., Praplan, A. P., Tykkä, T., Helin, A., Schallhart, S., Schiestl-Aalto, P. P., Bäck, J., and Hakola, H.: Sesquiterpenes and oxygenated sesquiterpenes dominate the VOC emissions of downy birches, Atmos. Chem. Phys., 21, 8045–8066, https://doi.org/10.5194/acp-21-8045-2021, 2021.
Hietikko, R., Kuuluvainen, H., Harrison, R. M., Portin, H., Timonen, H., Niemi, J. V., and Rönkkö, T.: Diurnal variation of nanocluster aerosol concentrations and emission factors in a street canyon, Atmos. Environ., 189, 98–106, https://doi.org/10.1016/j.atmosenv.2018.06.031, 2018.
Hirsikko, A., Yli-Juuti, T., Nieminen, T., Vartiainen, E., Laakso, L., Tareq, T., and Kulmala, M.: Indoor and outdoor air ions and aerosol particles in the urban atmosphere of Helsinki: characteristics, sources and formation, Boreal Environ. Res., 2007, 295–310, 2007.
IARC: Agents Classified by the IARC Monographs, Vol. 1–142, https://monographs.iarc.who.int/agents-classified-by-the-iarc (last access: 14 August 2026), 2026.
Janhäll, S., Olofson, K. F. G., Andersson, P. U., Pettersson, J. B. C., and Hallquist, M.: Evolution of the urban aerosol during winter temperature inversion episodes, Atmos. Environ., 40, 5355–5366, https://doi.org/10.1016/j.atmosenv.2006.04.051, 2006.
Järvinen, A., Timonen, H., Karjalainen, P., Bloss, M., Simonen, P., Saarikoski, S., Kuuluvainen, H., Kalliokoski, J., Dal Maso, M., Niemi, J. V., Keskinen, J., and Rönkkö, T.: Particle emissions of Euro VI, EEV and retrofitted EEV city buses in real traffic, Environ. Pollut., 250, 708–716, https://doi.org/10.1016/j.envpol.2019.04.033, 2019.
Ježek Brecelj, I., Gregorič, A., Zgonik, L., Rutar, T., Ivančič, M., Alföldy, B., Močnik, G., and Rigler, M.: On-road vehicle emissions measurements show a significant reduction in black carbon and nitrogen oxide emissions in Euro 6c and 6d diesel-powered cars, Atmos. Chem. Phys., 25, 9113–9125, https://doi.org/10.5194/acp-25-9113-2025, 2025.
Jung, H. and Kittelson, D. B.: Measurement of Electrical Charge on Diesel Particles, Aerosol Sci. Tech., 39, 1129–1135, https://doi.org/10.1080/02786820500430357, 2005.
Karjalainen, P., Rönkkö, T., Simonen, P., Ntziachristos, L., Juuti, P., Timonen, H., Teinilä, K., Saarikoski, S., Saveljeff, H., Lauren, M., Happonen, M., Matilainen, P., Maunula, T., Nuottimäki, J., and Keskinen, J.: Strategies To Diminish the Emissions of Particles and Secondary Aerosol Formation from Diesel Engines, Environ. Sci. Technol., 53, 10408–10416, https://doi.org/10.1021/acs.est.9b04073, 2019.
Keuken, M., Roemer, M., and Van Den Elshout, S.: Trend analysis of urban NO2 concentrations and the importance of direct NO2 emissions versus ozoneNOx equilibrium, Atmos. Environ., 43, 4780–4783, https://doi.org/10.1016/j.atmosenv.2008.07.043, 2009.
Krecl, P., Johansson, C., Norman, M., Silvergren, S., Burman, L., Mollinedo, E. M., and Targino, A. C.: Long-term trends of black carbon and particle number concentrations and their vehicle emission factors in Stockholm, Environ. Pollut., 347, 123734, https://doi.org/10.1016/j.envpol.2024.123734, 2024.
Kupiainen, K., Ritola, R., Stojiljkovic, A., Pirjola, L., Malinen, A., and Niemi, J.: Contribution of mineral dust sources to street side ambient and suspension PM10 samples, Atmos. Environ., 147, 178–189, https://doi.org/10.1016/j.atmosenv.2016.09.059, 2016.
Kuula, J., Kuuluvainen, H., Niemi, J. V., Saukko, E., Portin, H., Kousa, A., Aurela, M., Rönkkö, T., and Timonen, H.: Long-term sensor measurements of lung deposited surface area of particulate matter emitted from local vehicular and residential wood combustion sources, Aerosol Sci. Tech., 54, 190–202, https://doi.org/10.1080/02786826.2019.1668909, 2020.
Kuuluvainen, H., Poikkimäki, M., Järvinen, A., Kuula, J., Irjala, M., Maso, M. D., Keskinen, J., Timonen, H., Niemi, J. V., and Rönkkö, T.: Vertical profiles of lung deposited surface area concentration of particulate matter measured with a drone in a street canyon, Environ. Pollut., 241, 96–105, https://doi.org/10.1016/j.envpol.2018.04.100, 2018.
Lähde, T., Rönkkö, T., Virtanen, A., Schuck, T. J., Pirjola, L., Hämeri, K., Kulmala, M., Arnold, F., Rothe, D., and Keskinen, J.: Heavy Duty Diesel Engine Exhaust Aerosol Particle and Ion Measurements, Environ. Sci. Technol., 43, 163–168, https://doi.org/10.1021/es801690h, 2009.
Lamprecht, C., Graus, M., Striednig, M., Stichaner, M., Jud, W., Held, A., and Karl, T.: Turbulent enhancement ratios used for characterizing local emission sources in a complex urban environment, Atmos. Meas. Tech., 18, 5003–5016, https://doi.org/10.5194/amt-18-5003-2025, 2025.
Lehtipalo, K., Nieminen, T., Schobesberger, S., Ehn, M., Kulmala, M., and Kerminen, V.-M.: How the understanding of atmospheric new particle formation has evolved along with the development of measurement and analysis methods, J. Aerosol Sci., 184, 106494, https://doi.org/10.1016/j.jaerosci.2024.106494, 2025.
Lepistö, T. and Savolainen, L. K.: Data shown in Figures and Tables: “From direct emission factors to inverse and indirect impact factors of road traffic: Influence of emerging and unregulated pollutants”, Zenodo [data set], https://doi.org/10.5281/zenodo.22708187, 2026.
Lepistö, T., Kuuluvainen, H., Lintusaari, H., Kuittinen, N., Salo, L., Helin, A., Niemi, J. V., Manninen, H. E., Timonen, H., Jalava, P., Saarikoski, S., and Rönkkö, T.: Connection between lung deposited surface area (LDSA) and black carbon (BC) concentrations in road traffic and harbour environments, Atmos. Environ., 272, 118931, https://doi.org/10.1016/j.atmosenv.2021.118931, 2022.
Lepistö, T., Barreira, L. M. F., Helin, A., Niemi, J. V., Kuittinen, N., Lintusaari, H., Silvonen, V., Markkula, L., Manninen, H. E., Timonen, H., Jalava, P., Saarikoski, S., and Rönkkö, T.: Snapshots of wintertime urban aerosol characteristics: Local sources emphasized in ultrafine particle number and lung deposited surface area, Environ. Res., 231, 116068, https://doi.org/10.1016/j.envres.2023.116068, 2023.
Lepistö, T., Aurela, M., Lintusaari, H., Silvonen, V., Markkula, L., Hoivala, J., Schins, R. P. F., Timonen, H., Jalava, P., Saarikoski, S., and Rönkkö, T.: The regional and local sources of particle lung deposited surface area (LDSAal) and aerosol physical and chemical characteristics in a major Central European city, Atmos. Environ., 350, 121181, https://doi.org/10.1016/j.atmosenv.2025.121181, 2025.
Li, A. J., Pal, V. K., and Kannan, K.: A review of environmental occurrence, toxicity, biotransformation and biomonitoring of volatile organic compounds, Environmental Chemistry and Ecotoxicology, 3, 91–116, https://doi.org/10.1016/j.enceco.2021.01.001, 2021.
Li, X., Dallmann, T. R., May, A. A., and Presto, A. A.: Seasonal and Long-Term Trend of on-Road Gasoline and Diesel Vehicle Emission Factors Measured in Traffic Tunnels, Appl. Sci.-Basel, 10, 2458, https://doi.org/10.3390/app10072458, 2020.
Ling, X., Jayaratne, R., and Morawska, L.: Air ion concentrations in various urban outdoor environments, Atmos. Environ., 44, 2186–2193, https://doi.org/10.1016/j.atmosenv.2010.03.026, 2010.
Lintusaari, H., Kuuluvainen, H., Vanhanen, J., Salo, L., Portin, H., Järvinen, A., Juuti, P., Hietikko, R., Teinilä, K., Timonen, H., Niemi, J. V., and Rönkkö, T.: Sub-23 nm Particles Dominate Non-Volatile Particle Number Emissions of Road Traffic, Environ. Sci. Technol., 57, 10763–10772, https://doi.org/10.1021/acs.est.3c03221, 2023.
Lintusaari, H., Lepistö, T., Saarikoski, S., Salo, L., Silvonen, V., Barreira, L. M. F., Aurela, M., Hoivala, J., Markkula, L., Ondracek, J., Wahle, T., Vojtisek-Lom, M., Topinka, J., Schins, R. P. F., Jalava, P., Timonen, H., Kanninen, K. M., and Rönkkö, T.: Importance of sub-23 nm particles in traffic environments: Particle number emission factors and extrathoracic deposition doses, Environ. Pollut., 369, 125835, https://doi.org/10.1016/j.envpol.2025.125835, 2025.
Liu, P., Wu, Y., Li, Z., Lv, Z., Zhang, J., Liu, Y., Song, A., Wang, T., Wu, L., Mao, H., and Peng, J.: Tailpipe volatile organic compounds (VOCs) emissions from Chinese gasoline vehicles under different vehicle standards, fuel types, and driving conditions, Atmos. Environ., 323, 120348, https://doi.org/10.1016/j.atmosenv.2024.120348, 2024.
Lloyd, M., Olaniyan, T., Ganji, A., Xu, J., Venuta, A., Simon, L., Zhang, M., Saeedi, M., Yamanouchi, S., Wang, A., Schmidt, A., Chen, H., Villeneuve, P., Apte, J., Lavigne, E., Burnett, R. T., Tjepkema, M., Hatzopoulou, M., and Weichenthal, S.: Airborne Nanoparticle Concentrations Are Associated with Increased Mortality Risk in Canada's Two Largest Cities, Am. J. Resp. Crit. Care, 210, 1338–1347, https://doi.org/10.1164/rccm.202311-2013OC, 2024.
Majumdar (Née Som), D., Mukherjee, A. K., and Sen, S.: Apportionment of Sources to Determine Vehicular Emission Factors of BTEX in Kolkata, India, Water Air Soil Poll., 201, 379–388, https://doi.org/10.1007/s11270-008-9951-1, 2009.
Manninen, H. E., Mirme, S., Mirme, A., Petäjä, T., and Kulmala, M.: How to reliably detect molecular clusters and nucleation mode particles with Neutral cluster and Air Ion Spectrometer (NAIS), Atmos. Meas. Tech., 9, 3577–3605, https://doi.org/10.5194/amt-9-3577-2016, 2016.
Maricq, M. M.: On the electrical charge of motor vehicle exhaust particles, J. Aerosol Sci., 37, 858–874, https://doi.org/10.1016/j.jaerosci.2005.08.003, 2006.
McDonald, B. C., De Gouw, J. A., Gilman, J. B., Jathar, S. H., Akherati, A., Cappa, C. D., Jimenez, J. L., Lee-Taylor, J., Hayes, P. L., McKeen, S. A., Cui, Y. Y., Kim, S.-W., Gentner, D. R., Isaacman-VanWertz, G., Goldstein, A. H., Harley, R. A., Frost, G. J., Roberts, J. M., Ryerson, T. B., and Trainer, M.: Volatile chemical products emerging as largest petrochemical source of urban organic emissions, Science, 359, 760–764, https://doi.org/10.1126/science.aaq0524, 2018.
Mirme, S. and Mirme, A.: The mathematical principles and design of the NAIS – a spectrometer for the measurement of cluster ion and nanometer aerosol size distributions, Atmos. Meas. Tech., 6, 1061–1071, https://doi.org/10.5194/amt-6-1061-2013, 2013.
Olin, M., Kuuluvainen, H., Aurela, M., Kalliokoski, J., Kuittinen, N., Isotalo, M., Timonen, H. J., Niemi, J. V., Rönkkö, T., and Dal Maso, M.: Traffic-originated nanocluster emission exceeds H2SO4 –driven photochemical new particle formation in an urban area, Atmos. Chem. Phys., 20, 1–13, https://doi.org/10.5194/acp-20-1-2020, 2020.
Onasch, T. B., Trimborn, A., Fortner, E. C., Jayne, J. T., Kok, G. L., Williams, L. R., Davidovits, P., and Worsnop, D. R.: Soot Particle Aerosol Mass Spectrometer: Development, Validation, and Initial Application, Aerosol Sci. Tech., 46, 804–817, https://doi.org/10.1080/02786826.2012.663948, 2012.
Park, M., Joo, H. S., Lee, K., Jang, M., Kim, S. D., Kim, I., Borlaza, L. J. S., Lim, H., Shin, H., Chung, K. H., Choi, Y.-H., Park, S. G., Bae, M.-S., Lee, J., Song, H., and Park, K.: Differential toxicities of fine particulate matters from various sources, Sci. Rep.-UK, 8, 17007, https://doi.org/10.1038/s41598-018-35398-0, 2018.
Pirjola, L., Dittrich, A., Niemi, J. V., Saarikoski, S., Timonen, H., Kuuluvainen, H., Järvinen, A., Kousa, A., Rönkkö, T., and Hillamo, R.: Physical and Chemical Characterization of Real-World Particle Number and Mass Emissions from City Buses in Finland, Environ. Sci. Technol., 50, 294–304, https://doi.org/10.1021/acs.est.5b04105, 2016.
Qi, L., Zhao, J., Li, Q., Su, S., Lai, Y., Deng, F., Man, H., Wang, X., Shen, X., Lin, Y., Ding, Y., and Liu, H.: Primary organic gas emissions from gasoline vehicles in China: Factors, composition and trends, Environ. Pollut., 290, 117984, https://doi.org/10.1016/j.envpol.2021.117984, 2021.
Raaschou-Nielsen, O., Bak, H., Sørensen, M., Jensen, S. S., Ketzel, M., Hvidberg, M., Schnohr, P., Tjønneland, A., Overvad, K., and Loft, S.: Air Pollution from Traffic and Risk for Lung Cancer in Three Danish Cohorts, Cancer Epidemiology, Biomarkers and Prevention, 19, 1284–1291, https://doi.org/10.1158/1055-9965.EPI-10-0036, 2010.
Regulation (EU) 2024/1257: of the European Parliament and of the Council of 24 April 2024 on type-approval of motor vehicles and engines and of systems, components and separate technical units intended for such vehicles, with respect to their emissions and battery durability (Euro 7), amending Regulation (EU) 2018/858 of the European Parliament and of the Council and repealing Regulations (EC) No 715/2007 and (EC) No 595/2009 of the European Parliament and of the Council. Commission Regulation (EU) 2017/1151, Commission Regulation (EU) 2017/2400 and Commission Implementing Regulation (EU) 2022/1362 (Text with EEA Relevance), Commission Regulation (EU) No 582/2011, PE/109/2023/REV/2, http://data.europa.eu/eli/reg/2024/1257/oj (last access: 1 September 2026), 2024.
Rönkkö, T., Kuuluvainen, H., Karjalainen, P., Keskinen, J., Hillamo, R., Niemi, J. V., Pirjola, L., Timonen, H. J., Saarikoski, S., Saukko, E., Järvinen, A., Silvennoinen, H., Rostedt, A., Olin, M., Yli-Ojanperä, J., Nousiainen, P., Kousa, A., and Dal Maso, M.: Traffic is a major source of atmospheric nanocluster aerosol, P. Natl. Acad. Sci. USA, 114, 7549–7554, https://doi.org/10.1073/pnas.1700830114, 2017.
Rönkkö, T., Saarikoski, S., Kuittinen, N., Karjalainen, P., Keskinen, H., Järvinen, A., Mylläri, F., Aakko-Saksa, P., and Timonen, H.: Review of black carbon emission factors from different anthropogenic sources, Environ. Res. Lett., 18, 033004, https://doi.org/10.1088/1748-9326/acbb1b, 2023.
Saarikoski, S., Niemi, J. V., Aurela, M., Pirjola, L., Kousa, A., Rönkkö, T., and Timonen, H.: Sources of black carbon at residential and traffic environments obtained by two source apportionment methods, Atmos. Chem. Phys., 21, 14851–14869, https://doi.org/10.5194/acp-21-14851-2021, 2021.
Saarikoski, S., Järvinen, A., Markkula, L., Aurela, M., Kuittinen, N., Hoivala, J., Barreira, L. M. F., Aakko-Saksa, P., Lepistö, T., Marjanen, P., Timonen, H., Hakkarainen, H., Jalava, P., and Rönkkö, T.: Towards zero pollution vehicles by advanced fuels and exhaust aftertreatment technologies, Environ. Pollut., 347, 123665, https://doi.org/10.1016/j.envpol.2024.123665, 2024.
Saha, P. K., Khlystov, A., Snyder, M. G., and Grieshop, A. P.: Characterization of air pollutant concentrations, fleet emission factors, and dispersion near a North Carolina interstate freeway across two seasons, Atmos. Environ., 177, 143–153, https://doi.org/10.1016/j.atmosenv.2018.01.019, 2018.
Singh, V., Biswal, A., Kesarkar, A. P., Mor, S., and Ravindra, K.: High resolution vehicular PM10 emissions over megacity Delhi: Relative contributions of exhaust and non-exhaust sources, Sci. Total Environ., 699, 134273, https://doi.org/10.1016/j.scitotenv.2019.134273, 2020.
Stojiljkovic, A., Kauhaniemi, M., Kukkonen, J., Kupiainen, K., Karppinen, A., Denby, B. R., Kousa, A., Niemi, J. V., and Ketzel, M.: The impact of measures to reduce ambient air PM10 concentrations originating from road dust, evaluated for a street canyon in Helsinki, Atmos. Chem. Phys., 19, 11199–11212, https://doi.org/10.5194/acp-19-11199-2019, 2019.
Suarez-Bertoa, R. and Astorga, C.: Impact of cold temperature on Euro 6 passenger car emissions, Environ. Pollut., 234, 318–329, https://doi.org/10.1016/j.envpol.2017.10.096, 2018.
Tammet, H.: Size and mobility of nanometer particles, clusters and ions, J. Aerosol Sci., 26, 459–475, https://doi.org/10.1016/0021-8502(94)00121-E, 1995.
Teinilä, K., Saarikoski, S., Lintusaari, H., Lepistö, T., Marjanen, P., Aurela, M., Hellén, H., Tykkä, T., Lampimäki, M., Lampilahti, J., Barreira, L., Mäkelä, T., Kangas, L., Hatakka, J., Harni, S., Kuula, J., V. Niemi, J., Portin, H., Yli-Ojanperä, J., Niemelä, V., Jäppi, M., Lehtipalo, K., Vanhanen, J., Pirjola, L., Manninen, H. E., Petäjä, T., Rönkkö, T., and Timonen, H.: Measurement report: Wintertime aerosol characterization at an urban traffic site in Helsinki, Finland, Atmos. Chem. Phys., 25, 4907–4928, https://doi.org/10.5194/acp-25-4907-2025, 2025.
Thomas, A. E., Bauer, P. S., Dam, M., Perraud, V., Wingen, L. M., and Smith, J. N.: Automotive braking is a source of highly charged aerosol particles, P. Natl. Acad. Sci. USA, 121, e2313897121, https://doi.org/10.1073/pnas.2313897121, 2024.
Vallabani, N. V. S., Gruzieva, O., Elihn, K., Juárez-Facio, A. T., Steimer, S. S., Kuhn, J., Silvergren, S., Portugal, J., Piña, B., Olofsson, U., Johansson, C., and Karlsson, H. L.: Toxicity and health effects of ultrafine particles: Towards an understanding of the relative impacts of different transport modes, Environ. Res., 231, 116186, https://doi.org/10.1016/j.envres.2023.116186, 2023.
Vodonos, A., Awad, Y. A., and Schwartz, J.: The concentration-response between long-term PM2.5 exposure and mortality; A meta-regression approach, Environ. Res., 166, 677–689, https://doi.org/10.1016/j.envres.2018.06.021, 2018.
Wallington, T. J., Anderson, J. E., Dolan, R. H., and Winkler, S. L.: Vehicle Emissions and Urban Air Quality: 60 Years of Progress, Atmosphere, 13, 650, https://doi.org/10.3390/atmos13050650, 2022.
Wang, J. M., Jeong, C.-H., Hilker, N., Shairsingh, K. K., Healy, R. M., Sofowote, U., Debosz, J., Su, Y., McGaughey, M., Doerksen, G., Munoz, T., White, L., Herod, D., and Evans, G. J.: Near-Road Air Pollutant Measurements: Accounting for Inter-Site Variability Using Emission Factors, Environ. Sci. Technol., 52, 9495–9504, https://doi.org/10.1021/acs.est.8b01914, 2018a.
Wang, J. M., Jeong, C.-H., Zimmerman, N., Healy, R. M., and Evans, G. J.: Real world vehicle fleet emission factors: Seasonal and diurnal variations in traffic related air pollutants, Atmos. Environ., 184, 77–86, https://doi.org/10.1016/j.atmosenv.2018.04.015, 2018b.
Wang, J. M., Jeong, C.-H., Hilker, N., Healy, R. M., Sofowote, U., Debosz, J., Su, Y., Munoz, A., and Evans, G. J.: Quantifying metal emissions from vehicular traffic using real world emission factors, Environ. Pollut., 268, 115805, https://doi.org/10.1016/j.envpol.2020.115805, 2021.
WHO: WHO Global Air Quality Guidelines: Particulate Matter (PM2.5 and PM10), Ozone, Nitrogen Dioxide, Sulfur Dioxide and Carbon Monoxide, 1st edn., World Health Organization, Geneva, 1 p., 2021.
Xiang, S., Zhang, S., Yu, Y. T., Wang, H., Hao, K., and Wu, Y.: Significant NO2 Formation in Truck Exhaust Plumes and Its Association with Ambient O3: Evidence from Extensive Plume-Chasing Measurements, Environ. Sci. Technol., 59, 4014–4024, https://doi.org/10.1021/acs.est.4c07804, 2025.
Xiong, Y., Bari, Md. A., Xing, Z., and Du, K.: Ambient volatile organic compounds (VOCs) in two coastal cities in western Canada: Spatiotemporal variation, source apportionment, and health risk assessment, Sci. Total Environ., 706, 135970, https://doi.org/10.1016/j.scitotenv.2019.135970, 2020.
Yli-Tuomi, T., Aarnio, P., Pirjola, L., Mäkelä, T., Hillamo, R., and Jantunen, M.: Emissions of fine particles, NOx, and CO from on-road vehicles in Finland, Atmos. Environ., 39, 6696–6706, https://doi.org/10.1016/j.atmosenv.2005.07.049, 2005.
Yu, F., Lanni, T., and Frank, B. P.: Measurements of ion concentration in gasoline and diesel engine exhaust, Atmos. Environ., 38, 1417–1423, https://doi.org/10.1016/j.atmosenv.2003.12.007, 2004.
Zhang, L., Li, H., Wu, Z., Zhang, W., Liu, K., Cheng, X., Zhang, Y., Li, B., and Chen, Y.: Characteristics of atmospheric volatile organic compounds in urban area of Beijing: Variations, photochemical reactivity and source apportionment, J. Environ. Sci., 95, 190–200, https://doi.org/10.1016/j.jes.2020.03.023, 2020.
Zhao, Y., Hennigan, C. J., May, A. A., Tkacik, D. S., De Gouw, J. A., Gilman, J. B., Kuster, W. C., Borbon, A., and Robinson, A. L.: Intermediate-Volatility Organic Compounds: A Large Source of Secondary Organic Aerosol, Environ. Sci. Technol., 48, 13743–13750, https://doi.org/10.1021/es5035188, 2014.